
Characterization and Use of Char Produced from Pyrolysis of Post-Consumer Mixed Plastic Waste


Chemical Engineering Department, University of Granada, Avda. Fuentenueva, 18071 Granada, Spain
*
Authors to whom correspondence should be addressed.
Water 2021, 13(9), 1188; https://doi.org/10.3390/w13091188
Submission received: 30 March 2021
/
Revised: 16 April 2021
/
Accepted: 22 April 2021
/
Published: 25 April 2021
(This article belongs to the Special Issue Application of Biochar for Effective Removal of Hazardous Chemicals from Wastewater)
Abstract
:In this work, the pyrolysis of post-consumer mixed plastic waste (polypropylene (PP), polystyrene (PS) and polyethylene film (PE)) is carried out. The solid product of the pyrolysis is characterized and tested for its use as adsorbent of lead present in aqueous media. The pyrolysis temperature has a great influence on the solid product yield, decreasing when the temperature increases. The highest yield to solid product obtained is from the pyrolysis of film at lower temperature (450 °C), reaching almost 14%. The results of product solid characterization reveal that the carbon, hydrogen and nitrogen content decreases with increasing pyrolysis temperature. Furthermore, both the ash and the volatile content are related to the pyrolysis temperature. The ash content is higher when the pyrolysis temperature is higher, while when the temperature increases, a solid product with lower volatile content is obtained. In respect to specific surface area, a higher pyrolysis temperature improves the properties of the solid product as an adsorbent. The adsorption capacity increases as the pyrolysis temperature increases, with the highest value of 7.91 mg/g for the solid obtained in the pyrolysis at 550 °C. In addition, adsorption capacity increases as the initial concentration of lead rises, reaching a maximum value close to 26 mg/g for an initial concentration of 40 mg/L. The Sips model is the one that best reproduces the experimental results of the adsorption process equilibrium study.
1. Introduction
As a possible response over the problems generated by the management of plastic waste from solid municipal waste treatment and sorting plants, and in view of the imminent need to be able to good use of this waste, the pyrolysis of plastic waste is a very promising valorization technique, as it permits the use of this waste, without previous processing, to obtain products with high added value. This pyrolysis process produces a liquid that can be assimilated to a fuel or raw material for obtaining chemical products of interest, a gas with a low calorific value that is usually used to feed the pyrolysis’ own process and a solid product (char) that can be used as a solid fuel, as an adsorbent or even as a soil amendment. This research will focus on the characterization and use of the solid product as an adsorbent for heavy metals.
It is widely known that the type of material used to carry out pyrolysis has a direct influence the products generated [1], as the composition of the materials will lead to different yields and products. Different examples of materials to be pyrolyzed can be found in the bibliography, but this research will focus on plastic waste, specifically on the fraction rejected from municipal solid waste treatment plants.
Many studies on the pyrolysis of plastic waste have been found in the literature [2,3,4,5,6,7,8,9,10]. Research has also been found where plastic waste is mixed with other types of waste such as lignocellulosic biomass or tires [1,11], or with plastic waste from different sources such as those used by Esposito et al. [12] from a metal recovery plant from technological and telecommunication equipment waste, or those used by Kantarelis et al. [13] from electrical cables. In addition, some researchers have also used catalysts in the pyrolysis process of plastic materials and show that the amount of char obtained can remain constant or increase slightly [3,4,6].
The use or application of the solid product obtained (char) by pyrolysis of plastic waste depends in high extent on the composition of the material to be pyrolyzed, since the characteristics and properties of the char will depend on this, as indicated above. The most common use encountered for this product is as an adsorbent material based on its properties such as surface area or porosity. Nevertheless, the list of char potential applications is extended also to less traditional materials, e.g., char-based sensors [14,15] and supercapacitors [16,17]. In some cases, this char is treated to improve these surface properties and increase its adsorbent capacity. Bernardo et al. [18] investigated with a mixture of pine forest biomass, used tires and a mixture of plastics composed of 56% of PE, 27% of PP and 17% of PS to simulate the composition of the plastic fraction from municipal solid waste in Portugal. The char produced from the pyrolysis of this material is subjected to a sequential Soxhlet extraction process with hexane and acetone to recovery various organic compounds of different groups that are retained in the solid. The solid resulting is dried at 80 °C for 24 h in a vacuum oven. At the end of the process, a solid composed of macropores enriched in oxygen functional groups is obtained. This solid is used to measure its efficiency based on its adsorption of lead present in an aqueous medium. The results achieve by these authors showed that the pyrolysis of mixtures with a higher content of biomass waste and used tires gives rise to solid products with better adsorption yields. Singh et al. [10] also studied the efficiency of char from pyrolysis of polyvinyl chloride (PVC), polyethylene terephthalate (PET) and PE waste in the adsorption of arsenic. These researchers showed that the mixture of plastic waste is a decisive factor in the properties of the resulting carbonaceous residue, with the PVC and PE mixtures obtaining the best results because they have the most surface areas, reaching adsorption percentages of 99.4%. They also found that the char prepared at higher temperatures (550 °C) showed greater adsorption capacity than those prepared at lower temperatures. Singh et al. [10] concluded that the use of carbonaceous waste from pyrolysis of plastic waste can be considered as a novel and sustainable solution based on the application as a large-scale arsenic adsorbent and treatment for plastic waste. Jamradloedluk et al. [19] performed a fast pyrolysis of high-density polyethylene (HDPE) plastic waste and the solid product obtained is crushed and extruded to form briquettes. These briquettes are used based on fuel. On the other hand, the char obtained from pyrolysis was thermally activated at 900 °C for 3 h at atmospheric pressure to improve the contact area and pore volume of the char. Another application of interest is the one proposed by Sogancioglu et al. [7], in which previously washed PET plastic waste is pyrolyzed in a temperature range from 300 to 700 °C. The char obtained from this process is used based on (as an) an additive to replace 10–50% of epoxy resin in the manufacture of epoxy composites. The char with the best properties for this application was the one obtained at 300 °C.
On the other hand, lead (II) pollution is a global problem that has different life-threatening effects. It is ubiquitously present in the environment as a result of some anthropogenic activities, mainly, combustion of fossil fuels, mining and industrial activities [20]. For the remediation of lead (II)-contaminated wastewaters, some technologies have been used. Between them, adsorption onto low-cost and available adsorbents is a promising method [21]. Some studies have applied chars produced by pyrolysis as low-cost adsorbents of lead from aqueous solutions and have reported good adsorption properties that in general varied with pyrolysis temperature [22,23,24,25,26,27,28].
For example, Chan et al. [22] investigated tire char as adsorbent to remove lead from aqueous solution and found a maximum lead adsorption capacity of 135 mg/g at pH of 5. Park et al. [26] pyrolyzed waste chicken bones from restaurants and also reported a high lead adsorption capacity (263 mg/g at pH 5). Mohan et al. [24] investigated biochars produced from pyrolysis of wood and bark as adsorbents in the removal of arsenic, cadmium and lead from water. These authors revealed that the ability of oak bark char to remove Pb (II) was extraordinary when it was compared to that of commercial activated carbon in terms of the amount of metal adsorbed per unit surface area (0.5157 mg/m2 for Pb (II)). Recently, Nzediewu et al. [25] studied the lead (II) adsorption from synthetic wastewater by biochars produced by microwave-assisted pyrolysis. Particularly, lead (II) adsorption was especially high (165 mg/g) for canola straw biochar produced at 500 °C. Crisler II et al. [29] also analyzed the ability of pecan shell biochar to adsorb lead from aqueous solutions. The authors reported that pecan shell biochar showed an adsorption capacity of 36.5 mg/g.
Although much is known about lead (II) adsorption on biochars derived from agricultural and forestry adsorbents using conventional pyrolysis methods, studies on biochars produced from plastics waste are lacking. Only the works of Singh et al. [10,30] or Bernardo et al. [18] have analyzed the effects of char obtained from pyrolysis of plastics for removing heavy metals from aqueous solutions. Particularly, Singh et al. [10] studied chars from the pyrolysis of PVC, PET and PE, and Singh et al. [30] and Bernardo et al. [18] studied chars from the pyrolysis of mixtures composed by biomass, plastics and scrap tires.
In this research, the pyrolysis of plastic waste from the reject fraction of municipal solid waste treatment plants (non-recyclable mixed plastic) was carried out. This post-consumer plastic waste consists of a mixture of polypropylene, polystyrene and polyethylene film. As a product of pyrolysis, a solid was obtained which was characterized and tested for its use as adsorbent of lead present in aqueous media.
2. Materials and Methods
2.1. Materials
The material used in this research is plastic waste from the reject fraction of a solid municipal waste treatment plant located in the province of Granada (Spain). In this plant, bales of mixed plastic are formed. These bales have been characterized to quantify the percentage corresponding to each type of polymer. After classification, a sample of each of the polymers to be pyrolyzed was dried and crushed to obtain a particle size suitable for pyrolysis tests.
The following techniques were used for the identification, characterization and quantification of the constituent materials of the bale:
- Visual inspection.
- Identification codes indicated by the manufacturers.
- Near Infrared Spectroscopy (NIR), using a portable analyzer, model Thermo Scientific, microPHAZIR AG (Perkin-Elmer, Waltham, MA, USA).
- In some cases, Fourier Transform Infrared Spectroscopy (FTIR) using a Perkin–Elmer spectrophotometer, model Spectrum 65 and Differential Scanning Calorimetry (DSC) using a Perkin–Elmer TG-DSC simultaneous analyzer, model STA6000 (Perkin-Elmer, Waltham, MA, USA), were used.
In conformity with the instructions of the municipal solid waste treatment plant, the following fractions were sorted and quantified: polypropylene (PP), glass polystyrene (GPS), high impact polystyrene (HIPS), expanded polystyrene (EPS), extruded polystyrene (XPS), other polystyrene objects not included in the previous groups, polyethylene terephthalate (PET), polyethylene (PE), film, paper and cardboard, organic matter, fines (small pieces of materials difficult to identify), others (all material that is not plastic or is plastic not included in any of the previous fractions).
Elemental and immediate analyses were first performed to the main plastic polymers found in the bales. The elemental analysis was determined by using a Thermo Scientific Flash 2000 model elemental analyzer (Thermo Thermo Fisher Scientific, Waltham, MA USA), according to Section 2.3.1. For the determination of the immediate analysis, the sequence detailed in Section 2.3.2 was performed, by using a Perkin–Elmer thermobalance model STA 6000 (Perkin-Elmer, Waltham, MA, USA).
2.2. Pyrolysis Tests
The pyrolysis tests carried out were intended to determine the influence of temperature and composition of the sample to be pyrolyzed on the yield to solid and its properties. Therefore, firstly, tests were performed with the different plastic materials separately (PP, PS-HIPS, PS-GPPS, PS-EPS and film) at three pyrolysis temperatures (450 °C, 500 °C and 550 °C), in order to study mainly the yields of the different products obtained and the behavior of each material. Subsequently, the study of the mixture of the different plastic wastes was carried out, maintaining the proportion in which they are found in the mixed plastic bales obtained in the municipal solid waste treatment plant and using the same temperatures as before. All pyrolysis experiments were performed by duplicate and average values are provided in the results and discussion section.
For pyrolysis tests, a Nabertherm model R50/250/12 (Nabertherm GmbH, Lilienthal, Germany) horizontal furnace was used, which allows the required operating conditions to be programmed (heating rate, temperature and residence time). To achieve an inert atmosphere inside the furnace, a flow of nitrogen of 100 L/h is supplied, regulated by a flow meter. A glass bottle immersed in an ice bath is installed at the exit of the furnace to facilitate the condensation of the exit gases and to be able to collect and quantify the quantity of liquid product obtained. The procedure applied was the following: (1) A sample of 25 g of the plastic material was placed in a stainless-steel mesh with a cylinder-shaped geometry; (2) the reactor was heated from room temperature until the operating temperature under a continuous flow of nitrogen of 100 L/h, at a heating rate of 10 °C/min; (3) when the desired temperature was reached the reactor was left at this temperature during a residence time of 90 min. The fixed-bed reactor is a semi-batch reactor, the gases continuously flowed through the reactor while, the solid was introduced at the initial time and it got out when the reaction time finished.
2.3. Physical–Chemical Characterisation of Chars Obtained by Pyrolysis
2.3.1. Elemental Analysis
In order to carry out the elemental analysis of char the Thermo Scientific Flash 2000 model elemental analyzer (Thermo Thermo Fisher Scientific, Waltham, MA USA) was used, which allows knowing the percentage by weight of carbon, hydrogen, nitrogen and sulfur. The oxygen content was determined by difference according to the following equation:
where ash content was obtained from immediate analysis, as detailed in Section 2.3.2.
Oxygen (%) = 100 − Carbon (% Dry Basis) − Hydrogen(% Dry Basis) − Nitrogen(% Dry Basis) − Sulphur(% Dry Basis) − Ash(% Dry Basis)
2.3.2. Thermal Decomposition and Immediate Analysis
The immediate analysis provides the values of moisture, contents volatiles, contents ash and fixed carbon contents of the solids based on weight percentages. For the analysis of thermal decomposition of the samples and determination of the immediate analysis, a thermogravimetric analysis (TGA) was carried out on the solid product samples (char) obtained from the pyrolysis of the plastic waste mixtures to study the weight loss of the carbonaceous residue as the temperature increased, in a temperature range and at a specific heating rate and in a controlled atmosphere.
The tests were performed on a Perkin–Elmer thermobalance model STA 6000 (Perkin-Elmer, Waltham, MA, USA). First, for the study of thermal decomposition, approximately 20 mg of char was used, which was first heated in a temperature range of 30 to 850 °C, with a heating rate of 20 °C/min and in an inert nitrogen atmosphere, selecting a gas flow (nitrogen) of 20 mL/min. Once the temperature of 850 °C was reached, the gas flow was changed to oxygen at a flow rate of 20 mL/min and maintaining for a residence time of 30 min. Secondly, for the determination of immediate analysis, the following sequence was performed: (i) isothermal step during 30 min at 25 °C in an inert environment of nitrogen (20 mL/min); (ii) heating at 20 °C/min from 25 to 110 °C in an inert environment of nitrogen (20 mL/min); (iii) isothermal step during 30 min at 110 °C in an inert environment of nitrogen (20 mL/min); (iv) heating at 20 °C/min from 110 to 850 °C in an inert environment of nitrogen (20 mL/min); (v) isothermal step during 30 min at 850 °C in an inert environment of nitrogen (20 mL/min); (vi) isothermal step during 30 min at 850 °C in an oxidant environment of oxygen (20 mL/min).
2.3.3. Higher Heating Value (HHV)
For the calculation of the HHV (dry basis) of the char, the following equation has been used:
where C, H, O, N and S are the mass fractions, on a dry basis, of carbon, hydrogen, oxygen, nitrogen and sulfur, respectively, in the fuel and Z the ash fraction on a dry basis.
HHV (MJ/kg) = 0.314 × C + 1.322 × H − 0.12·O − 0.12 × N + 0.0686 × S − 0.0153 × Z
2.3.4. Surface Analysis of Solids
This analysis was carried out using MICROMERITICS ASAP 2020C automatic equipment. Adsorption-desorption isotherms of N2 and Ar at 77 K were developed by varying the relative pressure (P/P0) of the gas at a constant temperature and recording the volume of gas adsorbed on the surface of the solid. Through this analysis, the Brunauer, Emmett and Teller (BET) surface area, total pore volume, average pore size and pore distribution could be determined.
2.3.5. Chemical Composition Analysis
To perform the analysis of the chemical composition of the solids, a compact high performance wavelength dispersive X-ray fluorescence (XRF) spectrometer was used, with analytical capacity for the analysis of solid samples of different sizes and matrices in the elemental range from F to Uranium, PANalytical model Zetium.
2.3.6. Fourier Transform Infrared Spectroscopy Analysis (FTIR)
By applying this technique, the infrared spectrum is obtained in a few seconds from the vibrations of the compounds of the solid product, which provides information on the compounds that remain in the solid after pyrolysis. A Perkin–Elmer spectrophotometer, model Spectrum–65 (Perkin-Elmer, Waltham, MA, USA), in the 4000–400 cm−1 range was used for this purpose.
2.4. Adsorption Tests
2.4.1. Experimental Procedure
For adsorption tests, the lead stock solution was first prepared by diluting appropriate quantity of lead nitrate salt in deionized water until the concentration of 500 mg/L was obtained. Afterwards, dilution was made to prepare 50 mL of a 10 mg/L lead solution. Then, the diluted solution was added to the reactor, which was connected to a pH meter, stirred at 300 rpm and maintained at room temperature. The pH was adjusted to 5 by using a 0.1 M HCl solution. Then, 0.05 g of char was added to the lead solution and pH was controlled to avoid it increases over 6–6.5 (above this value the chemical precipitation of the metal in the form of hydroxide occur). Preliminarily tests (here not included) were performed at different operation times (5, 15, 30, 60, 120 and 240 min) to choose the time at which equilibrium was reached. According to the results of these experimental experiments no differences between samples collected at 120 and 240 min was observed. Therefore, a time of 120 min was left to elapsed, which is sufficient to reach equilibrium. After the contact time, the solid was separated by filtration and the concentration of lead in solution was analyzed by atomic absorption spectrophotometry using a Perkin–Elmer AAnalyst 200 spectrophotometer (Perkin-Elmer, Waltham, MA, USA).
The adsorption capacity of the solid and the percentage of metal removal were determined by the following equations,
where qe is the adsorption capacity, mg/g; Ci is the initial lead concentration, mg/L; Cf is the final lead concentration, mg/L; m is the mass of adsorbent solid, g.
Since the best result in terms of adsorption capacity was obtained with the solid resulting from pyrolysis at 550 °C, the equilibrium of the adsorption process was studied, performing tests with different initial concentrations of lead (2.5, 5, 10, 20 and 40 mg/L) maintaining the rest of the operating conditions at the same values indicated above. All experiments were done by duplicate and, as for pyrolysis, average values are provided in the results and discussion section.
The equilibrium results obtained for the solid resulting from pyrolysis at 550 °C were adjusted to different adsorption isotherm models, which are described below.
2.4.2. Langmuir Isotherm
In this model, the attraction between the metal ions and the surface of the sorbent material is mainly based on physical forces (electrostatic or Van der Waals forces) and its application assumes, on the one hand, that sorption occurs at specific locations on the sorbent surface and, on the other hand, that once the ion occupies a location, no further sorption can occur at the same location [31,32].
It describes the surface as homogeneous based on the assumption that all adsorption sites have equal affinity for sorbate and that adsorption at one site does not affect adsorption at an adjacent site. This model provides information on the adsorption capacity and reflects the behavior of the equilibrium process. The Langmuir isotherm can be represented by the following expression:
where qe = amount of metal ion retained per unit mass of sorbent, mg/g; Ce = equilibrium concentration of metal ion in the liquid phase, mg/L; qm and b = Langmuir model constants related to the maximum adsorption capacity for a complete monolayer (mg/g) and with the affinity between sorbent and sorbate (L/mg), respectively.
2.4.3. Freundlich Isotherm
This model describes the equilibrium on heterogeneous surfaces and does not consider the adsorption capacity of the monolayer; it assumes that the sorbent surface is heterogeneous and that the sorption sites have different affinities [33]. The positions with the highest affinity are occupied first and then the rest are occupied. It is also assumed that the binding is physical. The expression of the model is as follows:
where qe = amount of metal ion retained per unit mass of sorbent, mg/g; Ce = equilibrium (balance) concentration of metal ion in the liquid phase, mg/L; KF = equilibrium (balance) constant, mg/g-(L/mg)1/n; n = constant related (linked) to the affinity between sorbent and sorbate.
2.4.4. Redlich–Peterson Isotherm
This is a three-parameter model and incorporates the characteristics of the two previous models. The isotherm has a linear dependence with concentration in the numerator and an exponential function in the denominator, and can be expressed as follows [34]:
where A and B = model constants, (L/g) and ((L/mg)g), respectively; g = parameter varying between 0 and 1, so that g = 1 results in the Langmuir isotherm and g = 0 results in Henry’s Law.
2.4.5. Sips Isotherm
This is a model combining the Langmuir and Freundlich models, mainly used to describe heterogeneous surfaces. When the sorbate concentration is low it reduces to the Freundlich isotherm, while at high sorbate concentrations it resembles the Langmuir isotherm [32,35]. The Sips model can be expressed by the following equation [36]:
Based on the equation, it is a very flexible isotherm since for: Ce low it reduces to the Freundlich isotherm; n = 1 reduces to the Langmuir isotherm; low Ce and n = 1 results in Henry’s Law.
3. Results and Discussion
3.1. Identification and Characterization of the Main Polymers Existing in the Non-Recyclable Mixed Plastics Bales from Municipal Solid Waste
3.1.1. Identification of the Main Polymers Existing in the Non-Recyclable Mixed Plastics Bales from Municipal Solid Waste
The results obtained from the evaluation of the composition and characteristics of the non-recyclable plastics (the feedstock of the work) containing in the municipal solid waste (fraction non-recovery selectively) are shown in Table 1.
The most abundant material in mixed plastic bales is PP, followed by PET, film, PS (where EPS and HIPS are fractions predominate) and finally PE. These five fractions represent approximately 75–80% of the bale, which means that only 20% of the bale would be wasted. There are also other fractions based on “Others” which, although they have a significant percentage, are made up of materials of a different nature and are difficult to classify and separate.
Few references have been found in the literature on the specific characterization of mixed plastic bales from the reject fraction of a municipal solid waste treatment plant, although there are some references that study the composition of municipal solid waste in general. In Spain, a study was carried out by López et al. [5,6], specifically in Amorebieta (Bilbao), which shows the composition of the reject fraction of a waste sorting plant, which represents 27% of the input material of the plant and is sent for incineration. These researchers found that polypropylene (PP) and high-density polyethylene (HDPE) are the most abundant polymers with 31.25% each, followed by EPS with 13.5% and PET with 11.46%. Bernardo et al. [1] studying the co-pyrolysis of pine forest biomass, used tire rubber and plastic waste, found that the composition of the plastics fraction from municipal solid waste in a region of Portugal consists of 56% PE, 27% PP and 17% PS. The research by Ates et al. [37] using municipal waste plastics from a region in Hungary, reported a composition of 59.1% PE, 25% PP, 7.2% PS and 8.7% others (PET, PVC, PA, ABS). Kremer et al. [38] used plastic waste from a recycling company which collects, separates and recycles post-consumer plastics and tested two different mixtures, both consisting of HDPE, LDPE, PP and PS, but in different proportions. Mix 1 simulated the composition of the percentages of each type of plastic found in waste in Europe, being HDPE (22%), LDPE (31%), PP (35%) and PS (12%) and mix 2 simulated a real mixture of waste plastics found in the world, being HDPE (28%), LDPE (37%), PP (35%) and PS (0%). In addition, Fekhar et al. [4] found that the proportion of plastic waste present in municipal solid waste in one region of Hungary was 35% LDPE, 32% HDPE, 24% PP, 4% PVC, 5% others. Das and Tiwari [2] obtain similar results, since the majority of the fractions they find in municipal solid waste in India are LDPE, HDPE and PP, although they do not specify percentages of each type of material. Ippolito et al. [39] study to valorize the plastic film fraction from a recycling plant located in Italy. This fraction was characterized, obtaining a composition of 92–95% PE film, 5% PP, >1% PS, >1% PET and traces of other materials.
It should be noted that the differences observed between the results of the different researchers are mainly due to the fact that not all studies refer to the same rejection fraction and nor all municipal solid waste treatment plants use the same sorting system. In furthermore, the studies belong to different countries, where customs and lifestyles are different. In addition, samples may vary depending on the time of year, so it is difficult to make comparative studies in this case.
Considering the results obtained in the characterization of the mixed plastic bales obtained in this work (Table 1), only PP, HIPS, EPS and film fractions were considered to be used in the pyrolysis tests. The PET fraction, although it is presented in high proportion, is of interest to recycling companies and can therefore be sold on the market, so its use by pyrolysis would not be of interest. Therefore, the following composition has been selected for the mixture to be used in the pyrolysis tests: 55.7% PP, 8.6% PS-HIPS, 10.1% PS-EPS and 25.7% film.
3.1.2. Elemental and Immediate Analysis of the Main Polymers Existing in the Non-Recyclable Mixed Plastics Bales from Municipal Solid Waste
Table 2 presents the results of the immediate and elemental analysis of each of the polymers contained in the non-recyclable mixed plastics bales from municipal solid waste.
The main polymers existing in the bales are composed almost totally of volatile matter, with a very low fixed carbon and ashes content. It should be observed that PS-HIPS is the material that shows the greatest differences, especially in ash content. This may be due to the fact that this material is accompanied by additives such as flame retardants that would remain in the ashes [40]. Almost all of the plastic wastes have high carbon content, the lowest being that of PS–HIPS with 66.47%, while its oxygen content is the highest, which may be related to the above.
The results are in agreement with those obtained by Moorthy Rajendran et al. [41]. In the case of PP, almost identical results are obtained in both immediate and elemental analysis, with a fixed carbon content of 0%, volatile matter content of 99.4% and ash content of 0.67%. Elemental analysis shows a carbon content between 77.5–86.1%, hydrogen content between 14.2–13.7%, oxygen content between 7.4–0.2% and nitrogen content of 0.1%. However, the results obtained for PS differ from those obtained in the present study, although it should be noted that the type of PS used by the researchers is not specified. The research performed by Chhabra et al. [42] also shows similar results to those of this work. Again, results for PP are the most similar, with 0% moisture, fixed carbon and ashes content, and C of 85.1%, H of 13.38% and O of 1.52%. Finally, Gala et al. [43] performed immediate and elemental analysis of post-consumer plastic film waste samples, obtaining similar results, 69.3–81.8% C, 11.1–13.2% H, 0.1–2.4% H and 0.1–6.1% O.
3.2. Pyrolysis of the Main Polymers Existing in the Non-Recyclable Mixed Plastics Bales from Municipal Solid Waste
The yields to products (solid, liquid and gas) have been calculated by means of the following equations,
where m0 = initial mass of the sample to be pyrolyzed; ms = mass of the solid obtained in the pyrolysis process; ml = mass of liquid obtained in the pyrolysis process.
Table 3 presents the yields to products at different temperatures and using different types of polymers in the pyrolysis process.
Table 3 shows that operating temperature has a great influence on the product yields. Solid product yield has clear tendency to decrease as the pyrolysis temperature increases, except in the case of PP where the yield decreases a lot when temperature increase from 450 to 500 °C and increase slightly when temperature change from 500 to 550 °C. The highest yield to solid product obtained is from the pyrolysis of film at lower temperature (450 °C), reaching almost 14%, followed by the value obtained with high impact polystyrene (PS–HIPS), which exceeds 10% at a temperature of 450 °C. This is due to the composition of the material, as the PS–HIPS were pyrolyzed together with the wrapping paper and the cellulose in the paper improves the yield of the solid product. With the mixture simulating the real proportions, a maximum solid yield of 4% is achieved at 450 °C, so it is clear that the solid product would be the minority product of pyrolysis, which could be considered as a by-product based on an industrial application. Regarding liquid fraction, in general, the liquid yield increased with temperature, for example, the liquid yield increased from 27.53% at 450 °C to 44.25% at 550 °C for the plastic waste mixture. The main reason for the increase in liquid yield and decrease in solid yield with temperature is that the volatilization reactions are favors by increasing temperature [44]. Finally, a maximum gaseous product yield of 67.91% was obtained at a pyrolysis temperature of 450 °C in the pyrolysis of plastic waste mixture, which decreased with rising temperature. When temperature increases, the pyrolysis vapor was converted to lower molecular weight organic products with lower molecular weight or other non-condensable gases. However, our results showed significant decrease in the gas yield as the temperature was increased. Perhaps a deficient recuperation of liquid product can occur and poor estimations of gas product are provided since gas yield was calculated by difference as it was indicated in Equation (11).
Comparing these results with those found in the literature, there is a great similarity with the study carried out by Buah et al. [45] using a fixed-bed reactor with a heating rate of 10 K/min in a temperature range between 400 and 700 °C. These authors determined that the yield of the different products depends directly on the temperature. Thus, they observe a decrease in the yield of solid product from 49.8–32.3% as temperature increases, while the yield of liquid product increases from 30–50%, and the yield of gaseous product is practically not affected by temperature. Along the same lines is the study by Ates et al. [37]. Paradela et al. [11] studied the pyrolysis of a mixture of waste consisting of PS, PP, PE and pine biomass, at different temperatures (between 350 and 450 °C) observing that an increase in temperature decreases the yield of the liquid product in favor of the gaseous product, due to the fact that at higher temperatures the cracking reactions of the material are favored, transforming the long-chain and heavy molecules into shorter and lighter molecules. Therefore, the authors established a temperature of 400 °C as the most optimal to maximize the production of liquid. The yield of the solid product was not greatly affected by the temperature, remaining at around 15% in all the tests. Fekhar et al. [4] in their study about pyrolysis of mixtures of high-density polyethylene, low-density polyethylene, polypropylene and polyvinyl chloride reported that the predominant product is liquid with yields between 53.7% and 36.8%. The yield of the solid was not higher than 10%, being 4.9% in the case of thermal pyrolysis in the absence of catalyst. It is worth noting the research of Sogancioglu et al. [7,46] on the pyrolysis of HDPE, LDPE and PP plastic waste separately. These researchers reported that an increase in temperature favors the degradation of the plastic material so that more gaseous compounds are produced. This was more reflected in the case of HDPE because it has shorter chains than LDPE and is easier to break down and form gaseous compounds. The yield of the solid product was also affected by temperature in the same way as the liquid, so the highest yield was 2.34% (HDPE) and 10.12% (LDPE) at 300 °C and 2.14% (HDPE) and 6.14% (LDPE) at 700 °C. For pyrolysis of PP under the same conditions, comparing the results with those obtained in the present work, a notable difference was observed in terms of yield values, especially in the liquid (79.62–75.05%) and solid (17.71–22.78%) products. In addition, these yields followed an inverse trend, as the research by Sogancioglu et al. [46] showed a decrease in the yield of the liquid product in favor of the gaseous product as the temperature increases. For the solid product, the same decreasing trend with temperature was observed, with similar values (2.67–2.17%).
3.3. Effect of the Operating Temperature on the Properties of the Produced Solids
3.3.1. Elemental Analysis, Thermal Decomposition, Immediate Analysis, HHV and Surface Properties
Table 4 presents the results of the characterization of the three solid samples obtained from the pyrolysis of the non-recyclable mixed plastics from municipal solid waste at different temperatures.
The sum of C, H, N and O is relatively low, since the samples present a high content of inorganic compounds (ash content) as evidenced in the immediate analysis. In addition, the carbon, hydrogen and nitrogen content decreases with increasing pyrolysis temperature. The decrease in carbon can be attributed to the transformation of carbonaceous materials into CH4, CO2, CO and other aromatic gases or compounds, favored by the increase in temperature. Similarly, the increased release of volatile matter with increasing pyrolysis temperature causes the loss of functional group, which explains the decrease in hydrogen and nitrogen content [27].
The research performed by Buah et al. [45] revealed a similar trend. The C content decreased with increasing pyrolysis temperature from 400 °C (55.13%) to 700 °C (49.91%), as the H content (4.33–0.78%) and the N content (1.02–0.93%). The same tendency was presented by the study of Cafiero et al. [40] since both the C and the H content of the solid product obtained from pyrolysis at 450 °C and 650 °C decreased with increasing temperature (from 87.6 to 84.3% and from 6.3 to 1.6% respectively), while the O content increased from 0.6 to 2% in the same temperature range. Jamradloedluk et al. [19] provided an elemental analysis very similar to the present work, with a C content of 42.65%, H content of 3.06% and N content of 0.43%. Similar results were also reported by López et al. [5], where the film-rich sample pyrolyzed at 500 °C yields carbonaceous solids with a carbon, hydrogen and nitrogen content of 48%, 1.9% and 0.9%, respectively. In addition, Singh et al. [30] found that the carbon content of solid products obtained from pyrolysis of PVC, PE and PET plastic waste decreased with increasing temperature. However, Singh et al. [10] provided different results, as the solids resulting from the pyrolysis of different mixtures of PVC, PET and PE at different temperatures had a higher carbon content (ranging from 41.3–84.7%), while the nitrogen (0.1–2.78%) and hydrogen content (1.83–5.17%) were similar. Finally, Bernardo et al. [18] using different mixtures of biomass waste, used tires and plastic waste in different proportions, obtained a solid product from pyrolysis at 420 °C with a high carbon content (around 80%), while the hydrogen (5–7%) and nitrogen (0.5–1%) contents were similar.
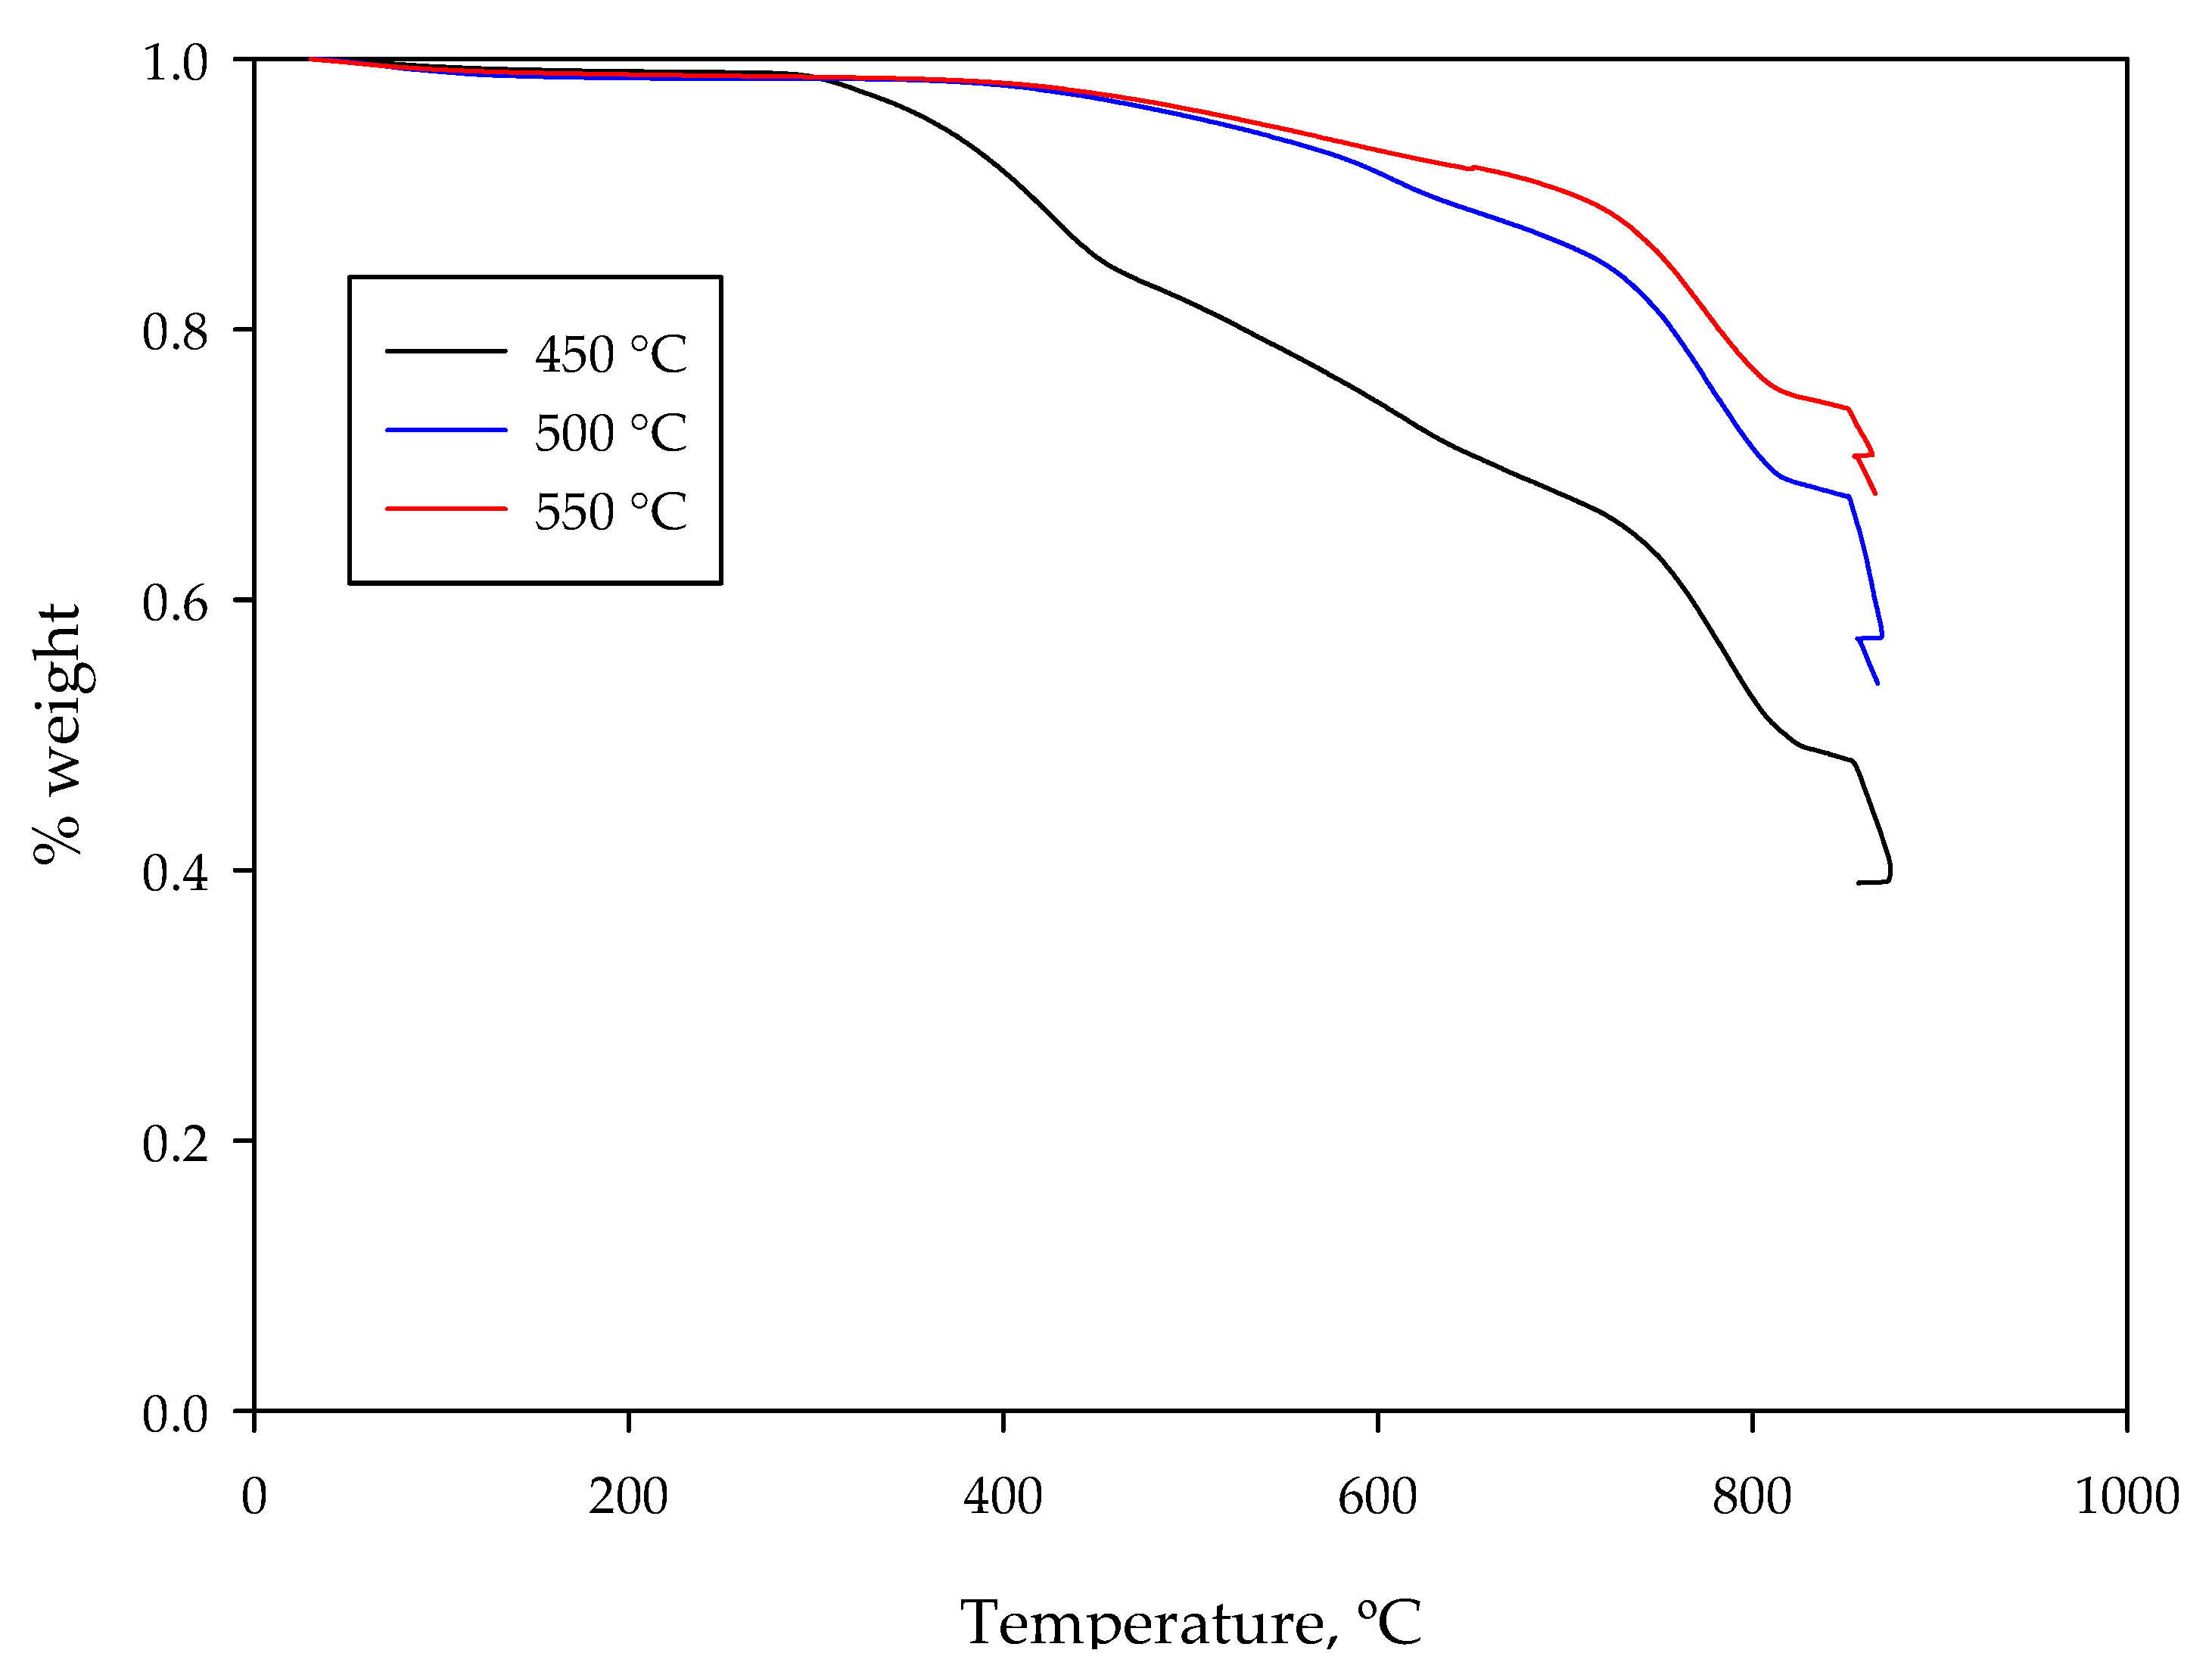
Figure 1 shows the thermogravimetric curve for the different solid materials.
There are evident differences between the curves of the solids subjected to different temperatures, especially for the solid obtained at 450 °C. This solid starts to degrade significantly at a lower temperature than the rest, around 350 °C, losing practically 20% of its weight in a temperature range of approximately 100 °C; from 460 °C to 730 °C the degradation phase is slightly slower. In this phase, the solid loses 20% of its weight, and again enters a more pronounced degradation phase until it reaches 807 °C where it loses 15% of its weight. The last section of the curve corresponds to the amount of fixed carbon present in the sample, since at 850 °C thermal degradation occurs in the presence of oxygen. The solid obtained at 450 °C is the one that loses the most mass during the thermogravimetric test, reaching a final mass fraction of 0.3, which indicates that it is the one with the lowest amount of ash and the most volatile matter. The pyrolyzed sample at 500 °C presents a more constant degradation from 400 °C to 730 °C, losing only 10% of its weight. From 730 °C to 820 °C a more pronounced degradation occurs, with a weight loss of 16%. Finally, the curve corresponding to fixed carbon is the longest of all, which reveals that it is the sample with the highest fixed carbon content, reducing from 71% to 50%. With respect to the sample pyrolyzed at 550 °C, it shows a similar trend to the sample pyrolyzed at 500 °C, although the degradation between 400 and 730 °C is higher, losing 15% of weight. A more pronounced degradation occurs until 820 °C, with a weight loss of 16%. Fixed carbon curve clearly differs from the two previous samples, being the shortest indicating the lowest fixed carbon content. In addition, this sample is the one that has the highest ash content (around 60%).
Table 4 also presents the results of the average immediate analysis obtained on the basis of the thermogravimetric curves. The results reveal that both the ash content and the volatile content are related to the pyrolysis temperature. This relationship is direct for the ashes content, since at higher the temperature the ash content is higher, due to the higher thermal degradation suffered by the samples. For the volatile matter content, as expected, it presents an inverse relationship with the temperature since, as the temperature increases, solid residues with a lower volatile content are obtained. This is due to the fact that the higher the temperature, the more volatile compounds contained in the solid waste are released. However, the fixed carbon content remains practically constant at temperatures of 450 and 500 °C, decreasing significantly when the temperature rises up to 550°C, which is again related to the higher decomposition of the solid at this temperature. The results are similar to those reported by Buah et al. [45], who performed pyrolysis on municipal waste, varying the temperature between 400 and 700 °C. The immediate analysis of the solid products revealed a very similar moisture content (between 0.25 and 2.25%), ash content (between 26.73 and 42.19%) and volatile material (between 13.73 and 42%), with the fixed carbon content being slightly higher (between 26.17 and 41.57%). The trend for carbon content was also similar, with a large increase from 400 to 500 ºC and then remaining more or less constant up to 700 °C. López et al. [6] showed similar results for the immediate analysis of the solid residue resulting from the pyrolysis of different waste mixtures at a temperature of 440 °C. Specifically, for the film-rich mixture, a low percentage of moisture (5%) and high ash content (57.7%) were obtained, although it should be noted that these results are on a wet basis and were also carried out together with the catalyst, as it was impossible to separate it from the resulting solid. Syamsiro et al. [3], working with HDPE waste and PE bags, also obtained quite low values for fixed carbon content (between 8.59% and 25.88%) and a high content of volatile matter (35.29–58.56%) and ash (27.33–49.47%). They also obtained similar values for moisture content, around 1%. Bernardo et al. [18], who used different mixtures of biomass waste, tires and plastic waste in different proportions, carry out pyrolysis at 420 °C obtaining solid products with a fixed carbon content varying between 41.4% and 55%, a volatile material content between 28.5% and 53.3%, a low ash content (2.02–7.77%) and a low moisture content (1.03–3.94%). These results revealed that the introduction of biomass waste and used tires improves the properties of the carbonaceous solid obtained by pyrolysis. In another research by the same authors [1], the carbonaceous solids reached fixed carbon content values of 94.7%, and very low volatile matter and ashes contents (2.18% and 3.16%, respectively). The investigation of the pyrolysis of HDPE plastic waste by Jamradloedluk et al. [19] revealed that the solid product presented an immediate analysis similar in terms of volatile material (51.4%) and moisture (2.41%), but presented a higher amount in fixed carbon (46.03%), and lower ash content (0.16%).
Regarding the results of the HHV (also reported in Table 4), the three solid samples analyzed showed a low HHV that decreased significantly with increasing pyrolysis temperature. This is mainly due to the decarbonization of the sample as the pyrolysis temperature increases and the increase in oxygen content, which results in a lower heating value of the material. Buah et al. [45] indicate the same decreasing in HHV value with increasing pyrolysis temperature, with very similar results ranging from 20.4 to 11.2 MJ/kg from 400 to 700 °C.
Finally, Table 4 includes the results obtained from the surface analysis of the solid products (char) obtained at the different pyrolysis temperatures. It can be concluded that the pyrolysis temperature directly affects the properties of the solid product, in this case pyrolysis at a higher temperature being favorable in order to obtain a solid with a higher specific surface area. An increase of 100 °C in the pyrolysis temperature results in a solid product with approximately 250 times more specific surface area. The same conclusion was reached by Singh et al. [10] whose specific surface area values are very similar (between 0.1 m2/g and 58.9 m2/g). This increase in specific surface area may be due to the fact that the higher the temperature, the greater the breakage of the polymer chains, favoring the production of volatile compounds and increasing the specific surface area. However, an increase in temperature above 650 °C could destroy adjacent pore walls, leading to a decrease in the specific surface area. On the other hand, Singh et al. [10] also point out the influence of the composition of the mixture to be pyrolyzed on the specific surface area due to the variation in the chemical and physical properties of the different plastics. Similar results were obtained by Tian et al. [27] studying sludge pyrolysis with a gradual increase in the specific surface area of the solids from 10.8 m2/g at 300 °C to 23.8 m2/g at 700 °C. As it happens with the specific surface area, the pore volume increases with increasing pyrolysis temperature, which determines that a higher pyrolysis temperature improves the properties of the solid product as an adsorbent. Regarding the pore size, it decreases as the pyrolysis temperature increases, with the highest value being 166.76 Ǻ for 450 °C (approximately 3 times smaller for 550 °C).
3.3.2. Chemical Composition
Table 5 reports the chemical composition of the solid obtained from the pyrolysis of the plastic waste mixtures at the different temperatures tested.
The chemical analysis reveals that more than calcium oxide (CaO) is the major compound, followed by titanium dioxide (TiO2). Both CaO and TiO2 are additives used in the manufacture of different types of plastics. In the case of CaO, it is used as a desiccant agent in the pellet and to improve the mechanical properties and appearance of the plastic, while TiO2 is an additive widely used based on its use as a white pigment [47].
3.3.3. FTIR Analysis
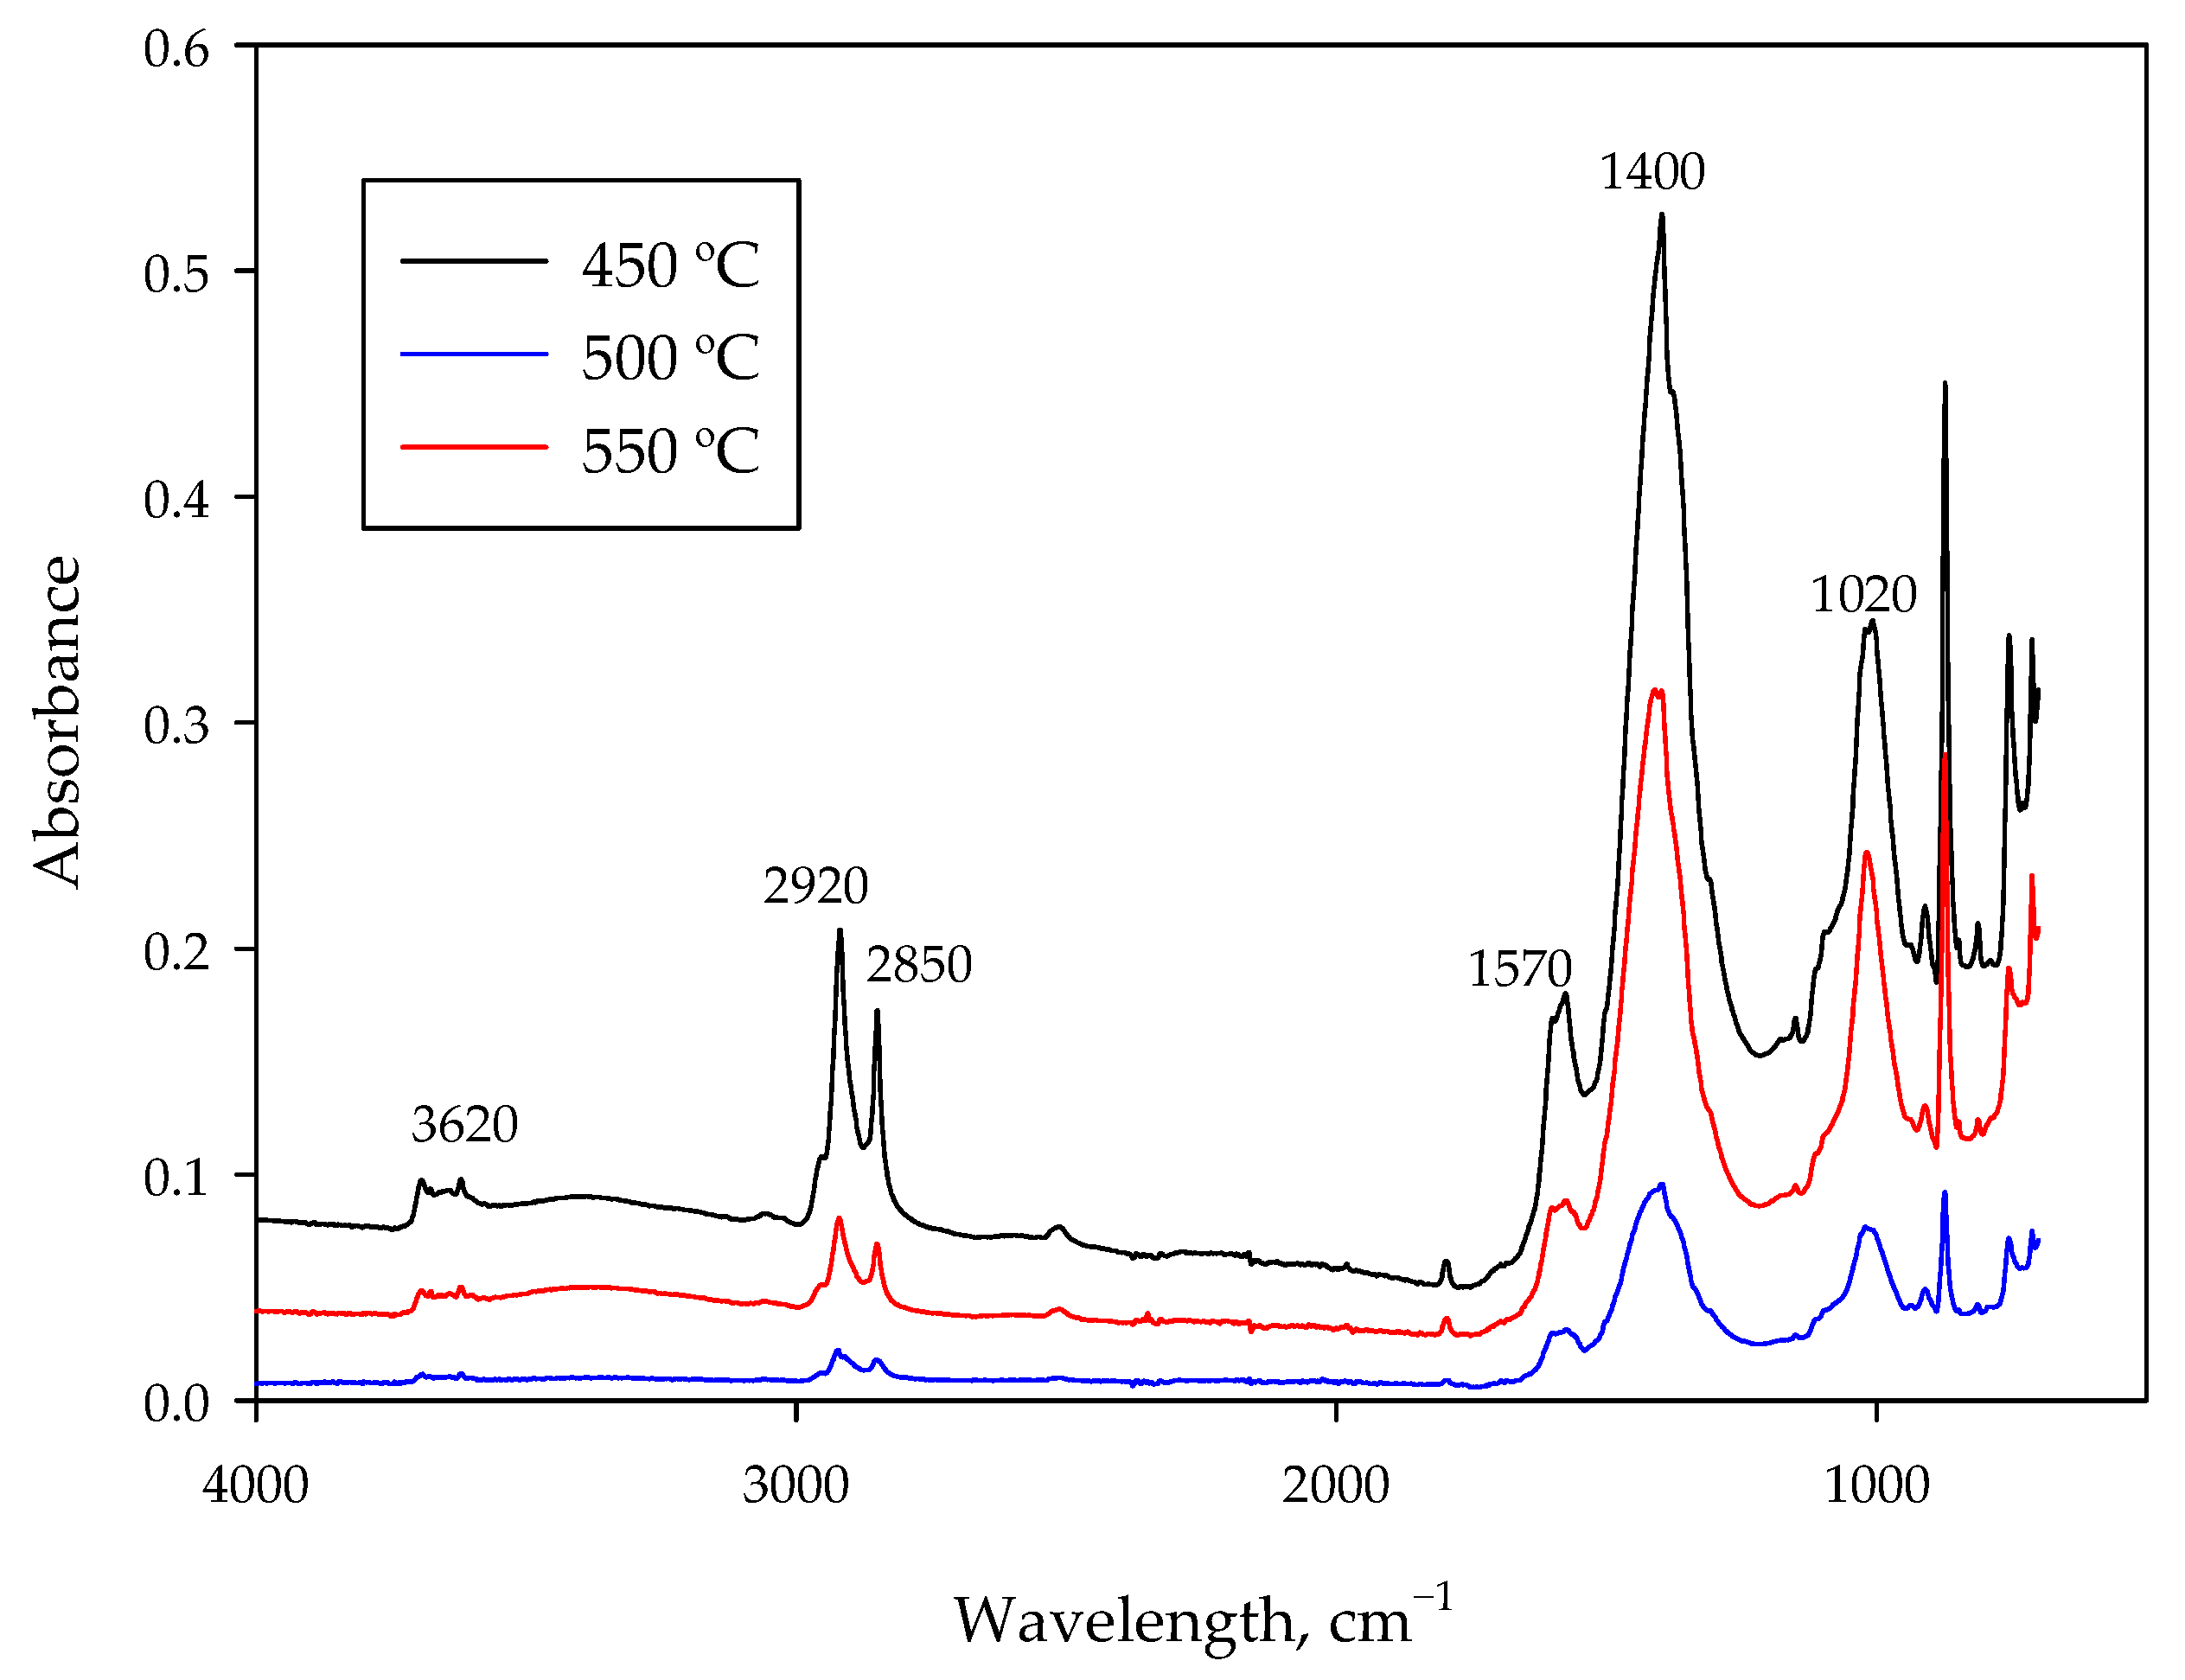
Figure 2 present the infrared spectra of the solid products obtained from the pyrolysis of the plastic waste mixture at different temperatures.
Firstly, it is observed that the infrared spectra of the solid carbonaceous residues obtained at different temperatures are very similar. It is also observed that the solid carbonaceous residue obtained at lower pyrolysis temperatures shows sharper bands than those obtained at higher temperatures, due to the fact that the degradation of the different compounds that form the material takes place as the temperature increases.
The peak located at 3620 cm−1 could correspond to a primary amine present in the plastic film fraction, which degrades with increasing pyrolysis temperature. The peaks located at 2920 and 2850 cm−1 correspond to the -CH3 and -CH2 groups, suggesting the presence of long aliphatic chains. These peaks become less intense with increasing temperature, as this increase favors polymer chain breakage, almost disappearing in the pyrolyzed sample at 550 °C [2].
The highest peak presented by the carbonaceous solid residues is the one located at 1400 cm−1, which corresponds to the carboxylic -OH group. This peak also attenuates as the pyrolysis temperature increases, suggesting the elimination of polar groups and resulting in solid with lower polarity and higher aromaticity [24].
The other peaks of higher intensity observed around 1020 cm-1 and 870 cm-1 correspond to the vibrations of the C-H bonds of aromatic rings, which also decrease in intensity with increasing pyrolysis temperature [7].
3.4. Application of Solids on the Adsorption of Lead from Aqueous Effluents
In this section, the application of the solids resulting from the pyrolysis of the non-recyclable mixed plastics from municipal solid waste for the removal of lead from aqueous solutions was studied.
The results obtained for lead adsorption capacity and percentage removal of lead for each of the solid samples used are present in Table 6.
The results indicate that the adsorption capacity increases as the pyrolysis temperature increase, with the highest value of 7.91 mg/g for the solid obtained in the pyrolysis at 550 °C. The lower adsorption capacity of the solid obtained at 450 °C is directly related to the lower specific surface area compared to the solids obtained at higher temperatures, based on the results shown in Section 3.3.1. These results are also in agreement with those obtained in Section 3.3.3, where the elimination of polar groups is observed as the temperature increases, achieving solid residues with lower polarity and higher aromaticity, which can be an advantage in their application based on their use as adsorbent solids. Finally, as the values included in Table 5 showed an important content of lead of the solid samples and to avoid errors in the adsorption results, the possible release of lead from the solid sample was taken into account carrying out blank tests with solid in deionized water. The results showed that, although lead contents were not insignificant for solid samples obtained at 450 and 500 °C, they were relatively immobile under adsorption tests conditions because practically null concentration was observed in the solution in the blank tests.
Singh et al. [10], investigated the efficiency of the carbonaceous solid from pyrolysis of different mixtures of PVC, PET and PE waste in the adsorption of arsenic, using an arsenic initial concentration of 1000 ppm, varying pH values between 4 and 8 and char doses of 0.5 and 1.5 g. The highest percentage of retention was for the PVC/PE mixture, in the same proportions pyrolyzed at 550 °C. The maximum percentage of retention was between 71.6% and 99.4%. The authors observed that the solids prepared at higher temperature (550 °C) showed a higher arsenic adsorption capacity. Similarly, Fang et al. [48] performed adsorption tests of different metals, including lead, with solid products obtained at different temperatures from walnut and peanut shells pyrolysis test. In this study, an activation treatment is carried out on the solid and the results shows that a higher pyrolysis temperature and a longer activation time increase the adsorption capacity of the solid. On the other hand, Bernardo et al. [18] carried out lead adsorption tests in aqueous solution with a concentration of 1000 mg/L, at a temperature of 25 °C and varying the pH, the amount of adsorbent solid and the contact time. In this investigation, three different solids are used from the pyrolysis of different mixtures of materials (biomass, used tires and plastic waste) at a temperature of 420 °C. The results reveal that the highest adsorption efficiency was presented by the solid obtained from the mixture formed by 50% used tires and 50% plastic waste, reaching a retained percentage of 100%, due to its high mineral content, especially zinc, calcium and potassium, which indicates that its adsorption capacity lies in the formation of complexes with these minerals.
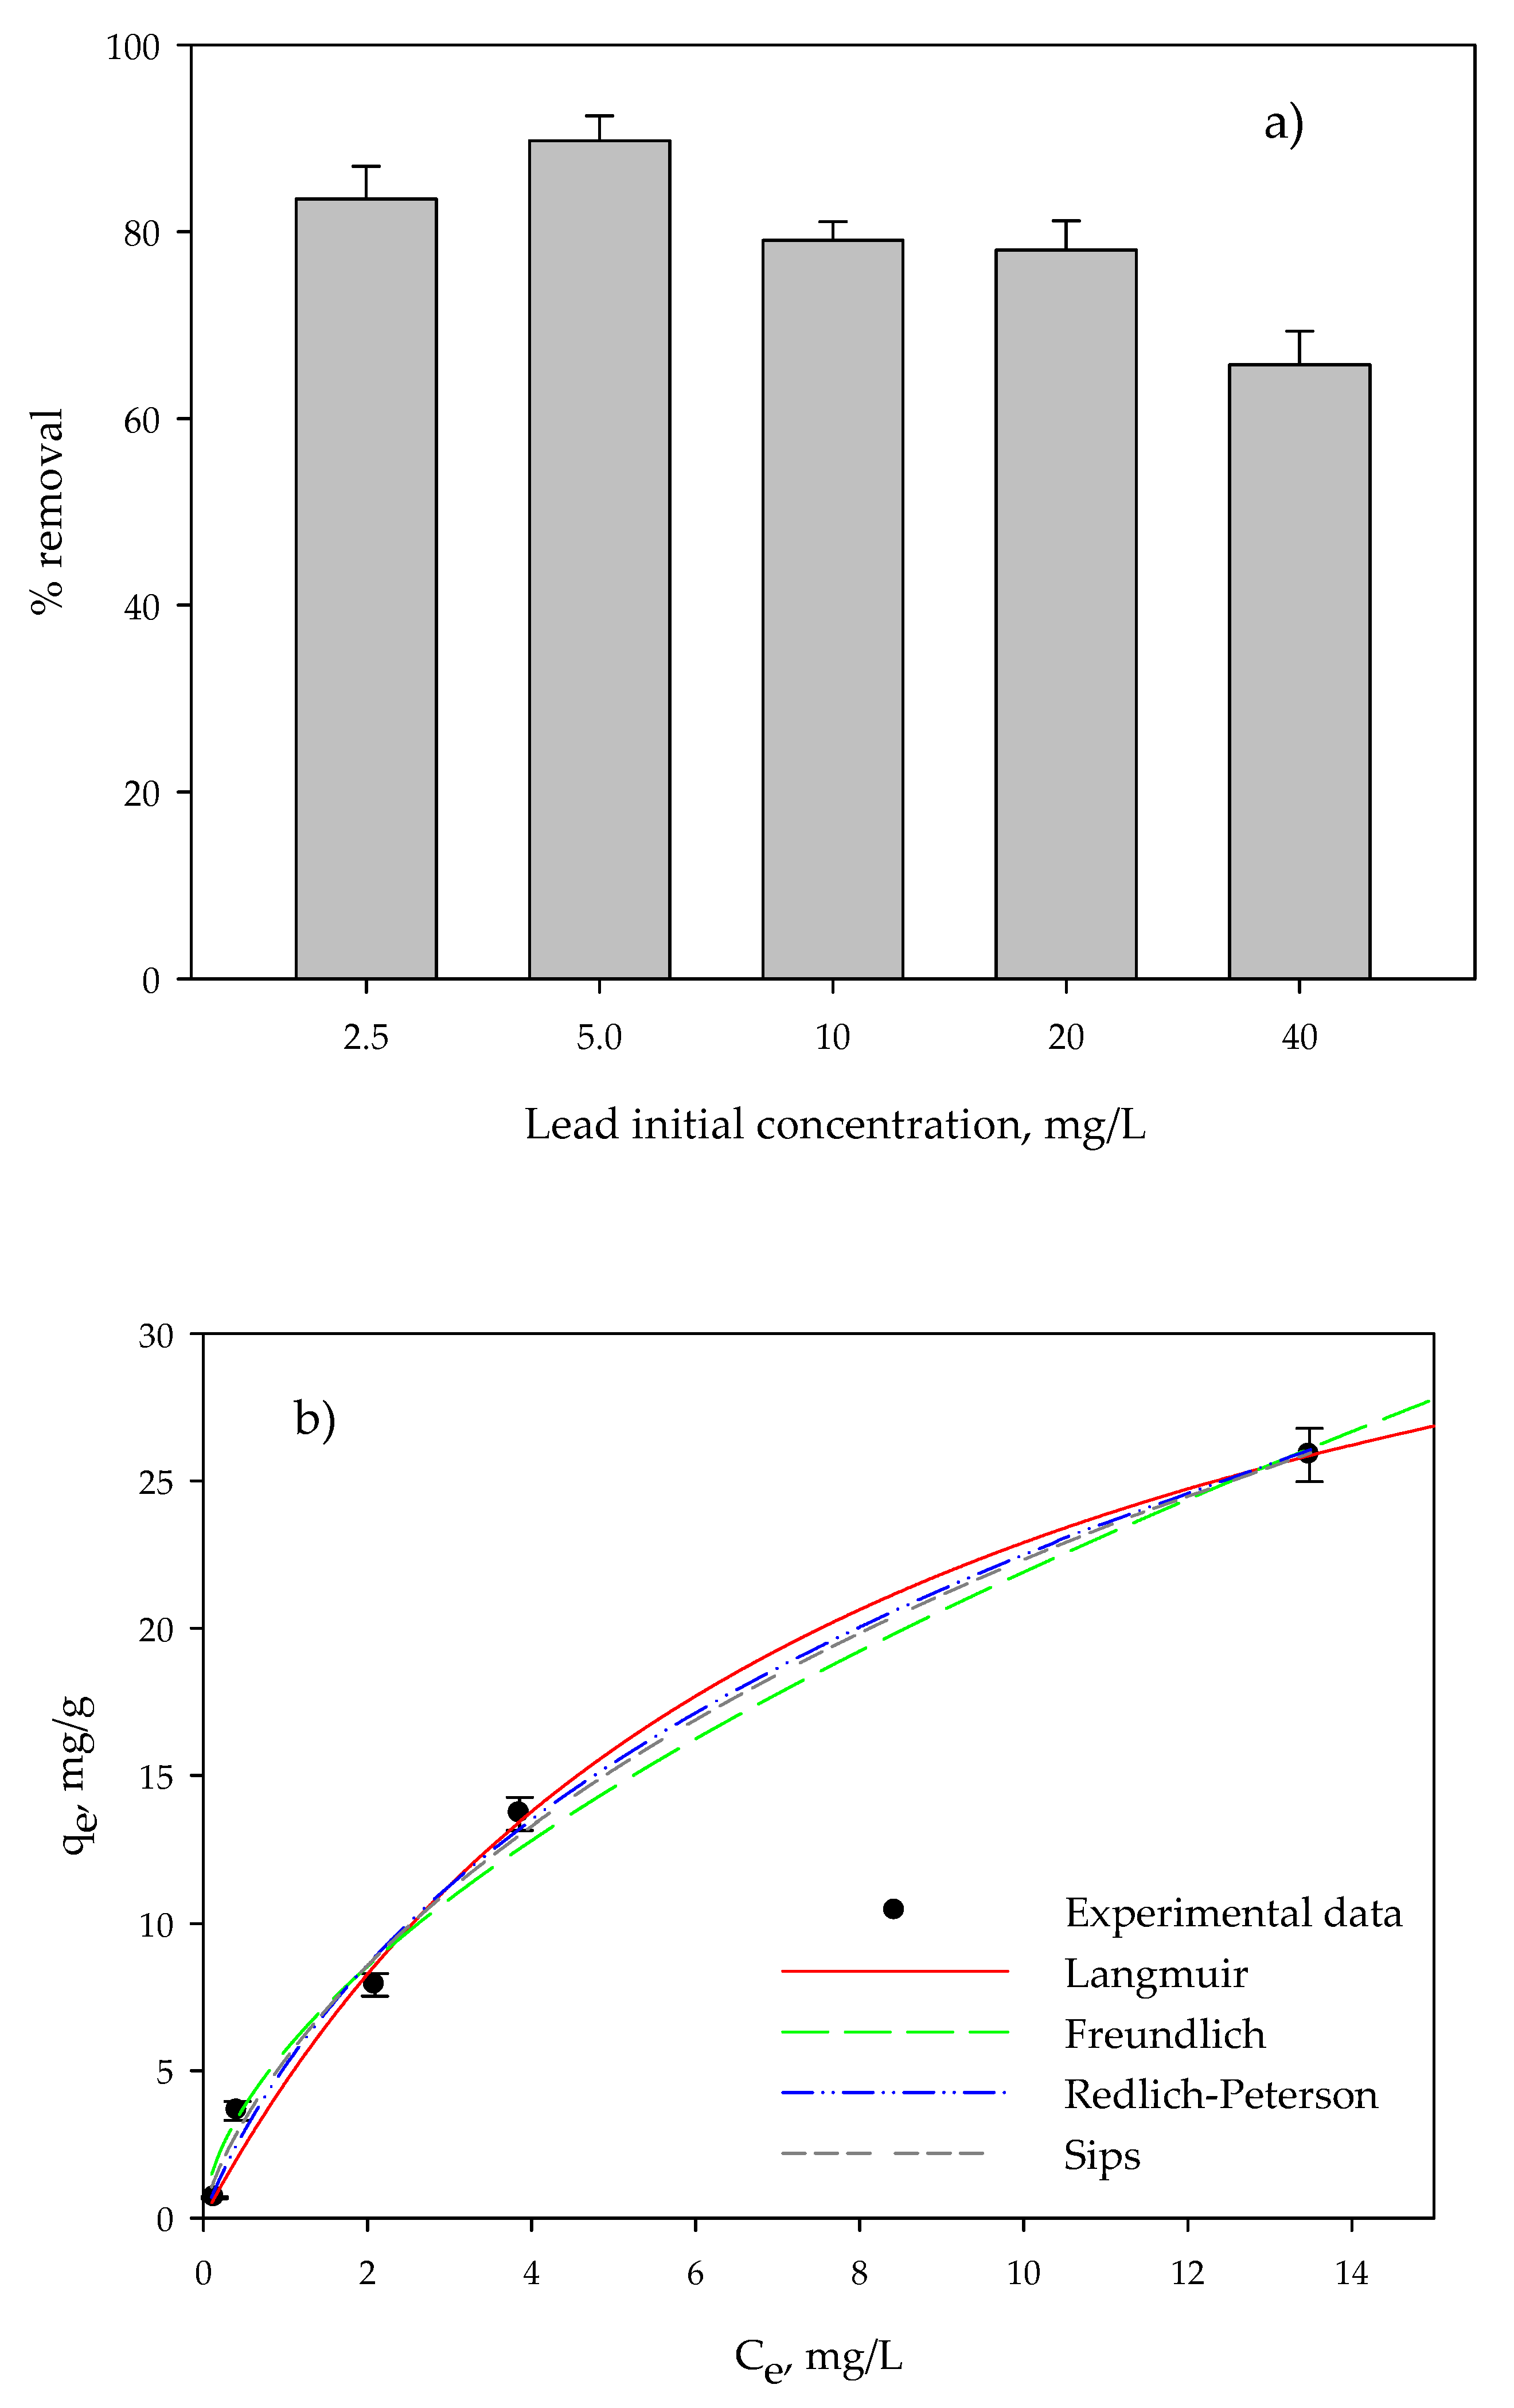
Following, considering that the best result in terms of adsorption capacity was obtained with the solid resulting from pyrolysis at 550 °C (Table 6), a study of the equilibrium of the process was performed. Figure 3a,b show the results of the removal percentage and the adsorption capacity at equilibrium, qe, for each of the concentrations used.
The removal percentage decreases with increasing concentration (Figure 3a), varying from a value close to 90% for the lowest concentrations to a value of 65.7% for the highest concentration. This is due to the fact that, as the solid becomes saturated, the amount of metal retained with respect to the initial amount decreases. With respect to the adsorption capacity (Figure 3b), this increases as the initial concentration of lead rises, reaching a maximum value close to 26 mg/g.
These results are in agreement with those reported by Bernardo et al. [14]. The authors investigated the influence of the initial concentration of lead, varying it between 5–100 mg/L and observed a decreasing trend in lead adsorption efficiency as the initial concentration of lead increases, with 5 mg/L being the initial concentration of lead that provides the highest removal percentage. These researchers also related these results to the fact that lead at pH = 6 exists mostly as a free ion at low concentrations, but at high concentrations it has a tendency to form species based on Pb2OH3+ or Pb3OH4+, among others, which hinder the adsorption process due to their larger size.
Finally, the equilibrium results present in Figure 3b have been adjusted to the different models described in Section 2.4. By means of non-linear regression, the fit parameters for each model have been obtained and are present in Table 7.
As can be appreciated, all the models present a good fit to the data (r2 > 0.99), with the Sips model being the best fit (r2 = 0.995) due to the flexibility of this model, based on the previous comments. However, although the model represents the experimental results well, the value of qm obtained is much higher than the experimental one, which may be due to the fact that, based on Figure 3b, equilibrium has not been reached experimentally, so it is to be expected that the solid adsorption capacity will continue to increase.
The results are similar to those of Mohan et al. [24] where the qm values of different biochars for lead adsorption vary between 2.62 to 13 mg/g. These researchers studied the arsenic, cadmium and lead adsorption capacity of biochars produced from different biomass wood wastes through pyrolysis at 400 and 450 °C. The researchers concluded that the biochar with the highest lead adsorption capacity is the one obtained from oak bark, being very promising for its possible industrial application, when compared to a commercial activated carbon. In addition, Treviño-Cordeo et al. [49] used two types of charcoal obtained from the carbonization at 800 °C of fruit seeds, which are activated by impregnation with a 25% calcium solution and their efficiency in lead and methylene blue removal from aqueous solutions is measured. They found qm values of 2.058 and 47.571 mg/g.
4. Conclusions
The effectiveness of chars from the pyrolysis of non-recyclable mixed plastics from municipal solid waste for the removal of lead from aqueous medium was investigated. Several characterization analyses were performed including elemental analysis, thermal decomposition and immediate analysis, HHV determination, BET surface area, total pore volume, average pore size and pore distribution analysis, FTIR and XRF analysis. The properties and sorption capacity of chars varied with pyrolysis temperature. The highest lead adsorption capacity was attained by the char resulting from the pyrolysis at 550 °C. The maximum lead adsorption capacity (Sips isotherm) was 61.3 mg/g at pH of 5.
Author Contributions
Conceptualization, M.A.M.-L. and M.C.; methodology, G.B.; software, M.A.M.-L. and A.P.; formal analysis, M.A.M.-L., A.P. and M.C.; investigation, A.P. and G.B.; resources, G.B.; data curation, M.A.M.-L., A.P. and M.C.; writing—original draft preparation, A.L.; writing—review and editing, M.A.M.-L. and M.C.; supervision, M.A.M.-L. and M.C.; project administration, M.A.M.-L. and M.C.; funding acquisition, M.A.M.-L. and M.C. All authors have read and agreed to the published version of the manuscript.
Funding
This work has received funds from the project PID2019-108826RB-I00/SRA (State Research Agency)/10.13039/501100011033.
Institutional Review Board Statement
Not applicable.
Informed Consent Statement
Not applicable.
Data Availability Statement
Not applicable.
Conflicts of Interest
The authors declare no conflict of interest.
References
- Bernardo, M.; Lapa, N.; Gonçalves, M.; Mendes, B.; Pinto, F.; Fonseca, I.; Lopes, H. Physico-chemical properties of chars obtained in the co-pyrolysis of waste mixtures. J. Hazard. Mater. 2012, 219–220, 196–202. [Google Scholar] [CrossRef] [PubMed]
- Das, P.; Tiwari, P. Valorization of packaging plastic waste by slow pyrolysis. Resour. Conserv. Rrecycl. 2018, 128, 69–77. [Google Scholar] [CrossRef]
- Syamsiro, M.; Saptoadi, H.; Norsujianto, T.; Noviasri, P.; Cheng, S.; Alimuddin, Z.; Yoshikawa, K. Fuel Oil Production from Municipal Plastic Wastes in Sequential Pyrolysis and Catalytic Reforming Reactors. Energy Procedia 2014, 47, 180–188. [Google Scholar] [CrossRef] [Green Version]
- Fekhar, B.; Zsinka, V.; Miskolczi, N. Value added hydrocarbons obtained by pyrolysis of contaminated waste plastics in horizontal tubular reactor: In situ upgrading of the products by chlorine capture. J. Clean. Prod. 2019, 241, 118166. [Google Scholar] [CrossRef]
- López, A.; De Marco, I.; Caballero, B.M.; Laresgoiti, M.F.; Adrados, A. Pyrolysis of municipal plastic wastes: Influence of raw material composition. Waste Manag. 2010, 30, 620–627. [Google Scholar] [CrossRef]
- López, A.; De Marco, I.; Caballero, B.M.; Laresgoiti, M.F.; Adrados, A.; Torres, A. Pyrolysis of municipal plastic wastes II: Influence of raw material composition under catalytic conditions. Waste Manag. 2011, 31, 1973–1983. [Google Scholar] [CrossRef] [PubMed]
- Sogancioglu, M.; Yel, E.; Ahmetli, G. Pyrolysis of waste high density polyethylene (HDPE) and low density polyethylene (LDPE) plastics and production of epoxy composites with their pyrolysis chars. J. Clean. Prod. 2017, 165, 369–381. [Google Scholar] [CrossRef]
- Williams, E.A.; Williams, P.T. Analysis of products derived from the fast pyrolysis of plastic waste. J. Anal. Appl. Pyrolysis 1997, 40, 347–363. [Google Scholar] [CrossRef]
- Mancheno, M.; Astudillo, S.; Arévalo, P.; Malo, I.; Naranjo, T.; Espinoza, J. Aprovechamiento energético de residuos plásticos obteniendo combustibles líquidos, por medio del proceso de pirólisis. La Granja 2016, 23, 60–67. [Google Scholar] [CrossRef] [Green Version]
- Singh, E.; Kumar, A.; Khapre, A.; Saikia, P.; Shukla, S.K.; Kumar, S. Efficient removal of arsenic using plastic waste char: Prevailing mechanism and sorption performance. J. Water Process. Eng. 2020, 33, 101095. [Google Scholar] [CrossRef]
- Paradela, F.; Paradela, F.; Pinto, F.; Pinto, F.; Gulyurtlu, I.; Gulyurtlu, I.; Cabrita, I.; Cabrita, I.; Lapa, N.; Lapa, N. Study of the co-pyrolysis of biomass and plastic wastes. Clean Technol. Environ. Policy 2009, 11, 115–122. [Google Scholar] [CrossRef]
- Esposito, L.; Cafiero, L.; De Angelis, D.; Tuffi, R.; Vecchio Ciprioti, S. Valorization of the plastic residue from a WEEE treatment plant by pyrolysis. Waste Manag. 2020, 112, 1–10. [Google Scholar] [CrossRef]
- Kantarelis, E.; Donaj, P.; Yang, W.; Zabaniotou, A. Sustainable valorization of plastic wastes for energy with environmental safety via High-Temperature Pyrolysis (HTP) and High-Temperature Steam Gasification (HTSG). J. Hazard. Mater. 2009, 167, 675–684. [Google Scholar] [CrossRef] [PubMed]
- Spanu, D.; Binda, G.; Dossi, C.; Monticelli, D. Biochar as an alternative sustainable platform for sensing applications: A review. Microchem. J. 2020, 105506. [Google Scholar] [CrossRef]
- Chaudhary, S.; Kumari, M.; Chauhan, P.; Chaudhary, G.R. Upcycling of plastic waste into fluorescent carbon dots: An environmentally viable transformation to biocompatible C-dots with potential prospective in analytical applications. Waste Manag. 2021, 120, 675–686. [Google Scholar] [CrossRef]
- Pandey, S.; Karakoti, M.; Surana, K.; Dhapola, P.S.; SanthiBhushan, B.; Ganguly, S.; Singh, P.K.; Abbas, A.; Srivastava, A.; Sahoo, N.G. Graphene nanosheets derived from plastic waste for the application of DSSCs and supercapacitors. Sci. Rep. 2021, 11, 3916. [Google Scholar] [CrossRef]
- Vivekanandhan, S. Biochar Supercapacitors: Recent Developments in the Materials and Methods. Green Sustain. Adv. Mater. Appl. 2018, 223. [Google Scholar] [CrossRef]
- Bernardo, M.; Mendes, S.; Lapa, N.; Gonçalves, M.; Mendes, B.; Pinto, F.; Lopes, H.; Fonseca, I. Removal of lead (Pb2+) from aqueous medium by using chars from co-pyrolysis. J. Colloid Interface Sci. 2013, 409, 158–165. [Google Scholar] [CrossRef]
- Jamradloedluk, J.; Lertsatitthanakorn, C. Characterization and Utilization of Char Derived from Fast Pyrolysis of Plastic Wastes. Procedia Eng. 2014, 69, 1437–1442. [Google Scholar] [CrossRef] [Green Version]
- Tiwari, S.; Thipathi, L.P.; Tiwari, H.I. Effects of lead on environment. Int. J. Emerg. Res. Manag. Technol. 2013, 2, 1–5. [Google Scholar]
- Saka, C.; Sahin, Ö.; Küçük, M. Applications on agricultural and forest waste adsorbents for the removal of lead (II) from contaminated waters. Int. J. Environ. Sci. Technol. 2012, 9, 379–394. [Google Scholar] [CrossRef] [Green Version]
- Chan, O.S.; Cheung, W.H.; Ckay, G.M. Equilibrium and Kinetics of Lead Adsorption onto Tyre Char. HKIE Trans. 2012, 19, 20–28. [Google Scholar] [CrossRef]
- Lian, W.; Yang, L.; Joseph, S.; Shi, W.; Bian, R.; Zheng, J. Utilization of biochar produced from invasive plant species to efficiently adsorb Cd (II) and Pb (II). Bioresour. Technol. 2020, 317, 124011. [Google Scholar] [CrossRef]
- Mohan, D.; Pittman, C.U.; Bricka, M.; Smith, F.; Yancey, B.; Mohammad, J.; Steele, P.H.; Alexandre-Franco, M.F.; Gómez-Serrano, V.; Gong, H. Sorption of arsenic, cadmium, and lead by chars produced from fast pyrolysis of wood and bark during bio-oil production. J. Colloid Interface Sci. 2007, 310, 57–73. [Google Scholar] [CrossRef]
- Nzediegwu, C.; Naeth, M.A.; Chang, S.X. Lead(II) adsorption on microwave-pyrolyzed biochars and hydrochars depends on feedstock type and production temperature. J. Hazard. Mater. 2021, 412, 125255. [Google Scholar] [CrossRef] [PubMed]
- Park, J.H.; Wang, J.J.; Kim, S.H.; Kang, S.W.; Cho, J.S.; Delaune, R.D.; Ok, Y.S.; Seo, D.C. Lead sorption characteristics of various chicken bone part-derived chars. Environ. Geochem. Health 2019, 41, 1675–1685. [Google Scholar] [CrossRef]
- Tian, Y.; Li, J.; Mcgill, W.B.; Whitcombe, T.W. Impact of pyrolysis temperature and activation on oily sludge-derived char for Pb(II) and Cd(II) removal from aqueous solution. Environ. Sci. Pollut. Res. Int. 2021, 28, 5532–5547. [Google Scholar] [CrossRef] [PubMed]
- Wu, J.; Wang, T.; Wang, J.; Zhang, Y.; Pan, W.P. A novel modified method for the efficient removal of Pb and Cd from wastewater by biochar: Enhanced the ion exchange and precipitation capacity. Sci. Total Environ. 2021, 754, 142150. [Google Scholar] [CrossRef]
- Crisler, G.B., II; Burk, G.A.; Simmons, P.; Quigley, M.; Mlsna, T. Lead removal using biochars obtained from slow pyrolysis of dry and water-soaked pecan shell biomass. Sep. Sci. Technol. 2019, 55, 1947–1956. [Google Scholar] [CrossRef]
- Singh, E.; Kumar, A.; Mishra, R.; You, S.; Singh, L.; Kumar, S.; Kumar, R. Pyrolysis of waste biomass and plastics for production of biochar and its use for removal of heavy metals from aqueous solution. Bioresour. Technol. 2021, 320, 124278. [Google Scholar] [CrossRef]
- Davis, T.; Volesky, B.; Mucci, A. A review of the biochemistry of heavy metal biosorption by brown algae. Water Res. 2003, 37, 4311–4330. [Google Scholar] [CrossRef]
- Deniz, F.; Tezel Ersanli, E. Removal of colorant from simulated wastewater by phycocomposite material: Equilibrium, kinetic and mechanism studies in a lab-scale application. J. Mol. Liq. 2016, 220, 120–128. [Google Scholar] [CrossRef]
- Freundlich, H.M.F. Uber die adsorption in losungen. Z. Phys. Chem. 1906, 57, 385–470. [Google Scholar] [CrossRef]
- Ho, Y.S.; Porter, J.F.; Mckay, G. Equilibrium Isotherm Studies for the Sorption of Divalente metal ions onto peat: Copper, nickel and lead single component systsems. Water Air Soil Pollut. 2002, 141, 1–33. [Google Scholar] [CrossRef]
- Günay, A.; Arslankaya, E.; Tosun, I. Lead removal from aqueous solution by natural and pretreated clinoptilolite: Adsorption equilibrium and kinetics. J. Hazard. Mater. 2007, 146, 362–371. [Google Scholar] [CrossRef] [PubMed]
- Sips, R. On the structure of a catalyst surface. J. Chem. Phys. 1948, 16, 490–495. [Google Scholar] [CrossRef]
- Ateş, F.; Miskolczi, N.; Borsodi, N. Comparision of real waste (MSW and MPW) pyrolysis in batch reactor over different catalysts. Part I: Product yields, gas and pyrolysis oil properties. Bioresour. Technol. 2013, 133, 443–454. [Google Scholar] [CrossRef]
- Kremer, I.; Tomić, T.T.; Katančić, Z.; Hrnjak-Murgić, Z.; Erceg, M.; Schneider, D.R. Catalytic decomposition and kinetic study of mixed plastic waste. Clean Technol. Environ. Policy 2020, 1–17. [Google Scholar] [CrossRef]
- Ippolito, N.M.; Cafiero, L.; Tuffi, R.; Vecchio Ciprioti, S. Characterization of the residue of a commingled post-consumer plastic waste treatment plant: A thermal, spectroscopic and pyrolysis kinetic study. J. Therm. Anal. Calorim. 2019, 138, 3323–3333. [Google Scholar] [CrossRef]
- Cafiero, L.; Fabbri, D.; Trinca, E.; Tuffi, R.; Vecchio Ciprioti, S. Thermal and spectroscopic (TG/DSC–FTIR) characterization of mixed plastics for materials and energy recovery under pyrolytic conditions. J. Therm. Anal. Calorim. 2015, 121, 1111–1119. [Google Scholar] [CrossRef]
- Moorthy Rajendran, K.; Chintala, V.; Sharma, A.; Pal, S.; Pandey, J.K.; Ghodke, P. Review of catalyst materials in achieving the liquid hydrocarbon fuels from municipal mixed plastic waste (MMPW). Mater. Today Commun. 2020, 24, 100982. [Google Scholar] [CrossRef]
- Chhabra, V.; Bhattacharya, S.; Shastri, Y. Pyrolysis of mixed municipal solid waste: Characterisation, interaction effect and kinetic modelling using the thermogravimetric approach. Waste Manag. 2019, 90, 152–167. [Google Scholar] [CrossRef]
- Gala, A.; Guerrero, M.; Serra, J.M. Characterization of post-consumer plastic film waste from mixed MSW in Spain: A key point for the successful implementation of sustainable plastic waste management strategies. Waste Manag. 2020, 111, 22–33. [Google Scholar] [CrossRef] [PubMed]
- Liu, S.; Xie, Q.; Zhang, B.; Cheng, Y.; Liu, T.Y.; Chen, P.; Ruan, R. Fast microwave-assisted catalytic co-pyrolysis of corn stover and scum for bio-oil production with Ca and HZSM-5 as the catalyst. Bioresour. Technol. 2016, 204, 164–170. [Google Scholar] [CrossRef] [Green Version]
- Buah, W.K.; Cunliffe, A.M.; Williams, P.T. Characterization of Products from the Pyrolysis of Municipal Solid Waste. Process Saf. Environ. Protect. 2007, 85, 450–457. [Google Scholar] [CrossRef]
- Sogancioglu, M.; Yel, E.; Ahmetli, G. Behaviour of waste polypropylene pyrolysis char-based epoxy composite materials. Environ. Sci. Pollut. Res. Int. 2020, 27, 3871–3884. [Google Scholar] [CrossRef]
- Murphy, J. Additives for Plastics Handbook, 2nd ed.; Elsevier Advanced Technology, Elsevier Sciences: Amsterdam, The Netherlands, 2001. [Google Scholar]
- Fang, J.; Gao, B.; Zimmerman, A.R.; Ro, K.S.; Chen, J. Physically (CO2) activated hydrochars from hickory and peanut hull: Preparation, characterization, and sorption of methylene blue, lead, copper, and cadmium. RSC Adv. 2016, 6, 24906–24911. [Google Scholar] [CrossRef]
- Treviño-Cordero, H.; Juárez-Aguilar, L.G.; Mendoza-Castillo, D.I.; Hernández-Montoya, V.; Bonilla-Petriciolet, A.; Montes-Morán, M.A. Synthesis and adsorption properties of activated carbons from biomass of Prunus domestica and Jacaranda mimosifolia for the removal of heavy metals and dyes from water. Ind. Crops Prod. 2013, 42, 315–323. [Google Scholar] [CrossRef]
Figure 1.
Thermogravimetric curves of the solids obtained by pyrolysis of the non-recyclable mixed plastics from municipal solid waste at different temperatures.
Figure 1.
Thermogravimetric curves of the solids obtained by pyrolysis of the non-recyclable mixed plastics from municipal solid waste at different temperatures.

Figure 2.
Infrared spectra of the solid pyrolysis products.

Figure 3.
(a) Removal percentages of lead at different initial lead concentrations; (b) Adsorption isotherms of lead. Experimental data and fit to the different models.
Figure 3.
(a) Removal percentages of lead at different initial lead concentrations; (b) Adsorption isotherms of lead. Experimental data and fit to the different models.


Table 1.
Results of the identification of the polymers presented in the bales of non-recyclable mixed plastics from municipal solid waste.
Table 1.
Results of the identification of the polymers presented in the bales of non-recyclable mixed plastics from municipal solid waste.
| Fraction | Content, % | |
|---|---|---|
| PP | 28.9 ± 3.6 | |
| PS | GPPS | 1.6 ± 0.4 |
| HIPS | 2.9 ± 1.2 | |
| EPS | 3.4 ± 0.9 | |
| XPS | 1.2 ± 0.0 | |
| Others | 0.6 ± 0.4 | |
| Total PS | 9.7 ± 1.4 | |
| PET | 22.0 ± 0.8 | |
| PE | 4.7 ± 1.6 | |
| Film | 13.4 ± 2.3 | |
| Paper and cardboard | 5.2 ± 2.5 | |
| Organic matter | 0.9 ± 0.2 | |
| Fines | 4.2 ± 1.3 | |
| Others | 11.1 ± 2.4 | |
Table 2.
Results of immediate and elemental analysis contained in the non-recyclable mixed plastics bales from municipal solid waste.
Table 2.
Results of immediate and elemental analysis contained in the non-recyclable mixed plastics bales from municipal solid waste.
| Analysis | PP | PS-HIPS | PS-EPS | Film | |
|---|---|---|---|---|---|
| Elemental Analysis | % C | 82.92 | 66.47 | 91.69 | 77.61 |
| % H | 14.47 | 7.63 | 8.28 | 11.91 | |
| % N | 0.16 | 0.14 | 0.11 | 0.10 | |
| % S | 0.00 | 0.00 | 0.00 | 0.00 | |
| % O (by difference) | 1.75 | 17.84 | 0.00 | 10.38 | |
| Immediate or Proximate Analysis | Moisture, % | 0.00 | 1.80 | 0.00 | 1.00 |
| Volatile, % | 99.3 | 88.9 | 99.8 | 95.5 | |
| Fixed carbon, % | 0.00 | 1.70 | 0.10 | 2.40 | |
| Ash, % | 0.70 | 7.60 | 0.10 | 1.00 | |
Table 3.
Yields to products obtained in the pyrolysis tests with the different plastic materials.
| Temperature, °C | Yield (%) | |||
|---|---|---|---|---|
| Solid | Liquid | Gas | ||
| PP | 450 °C | 3.97 | 31.67 | 64.36 |
| 500 °C | 0.69 | 47.63 | 51.69 | |
| 550 °C | 1.29 | 49.18 | 49.54 | |
| PS-HIPS | 450 °C | 10.61 | 27.17 | 62.22 |
| 500 °C | 9.02 | 31.69 | 59.29 | |
| 550 °C | 3.53 | 42.31 | 54.16 | |
| PS-ESP | 450 °C | 1.55 | 52.35 | 46.10 |
| 500 °C | 1.46 | 57.37 | 41.17 | |
| 550 °C | 1.00 | 58.09 | 40.91 | |
| Film | 450 °C | 13.40 | 25.06 | 61.54 |
| 500 °C | 6.26 | 52.63 | 41.11 | |
| 550 °C | 4.39 | 42.94 | 52.67 | |
| Plastic waste mixture | 450 °C | 4.56 | 27.53 | 67.91 |
| 500 ºC | 3.19 | 42.82 | 53.99 | |
| 550 °C | 2.38 | 44.25 | 53.37 | |
Table 4.
Elemental analysis, immediate analysis, HHV and surface properties of the solids obtained by pyrolysis of the non-recyclable mixed plastics from municipal solid waste at different temperatures.
Table 4.
Elemental analysis, immediate analysis, HHV and surface properties of the solids obtained by pyrolysis of the non-recyclable mixed plastics from municipal solid waste at different temperatures.
| Temperature | 450 °C | 500 °C | 550 °C | |
|---|---|---|---|---|
| Elemental Analysis | % C | 55.24 | 34.33 | 17.82 |
| % H | 5.74 | 1.46 | 0.55 | |
| % N | 0.46 | 0.40 | 0.24 | |
| % S | 0.00 | 0.00 | 0.00 | |
| % O (by difference) | 3.31 | 9.45 | 12.95 | |
| Immediate or Proximate Analysis | Moisture, % | 0.61 | 1.02 | 0.84 |
| Volatile, % | 51.00 | 31.22 | 24.90 | |
| Fixed carbon, % | 13.35 | 13.95 | 6.40 | |
| Ash, % | 35.04 | 53.81 | 67.87 | |
| HHV, MJ/kg | 23.94 | 10.70 | 3.69 | |
| Surface Properties | Specific area, m2/g | 0.26 | 7.61 | 67.11 |
| Pore volume, cm3/g | 0.0011 | 0.0165 | 0.0403 | |
| Pore size, Å | 166.76 | 87.04 | 60.09 | |
Table 5.
Results of chemical composition of the solids obtained by pyrolysis of the non-recyclable mixed plastics from municipal solid waste at different temperatures.
Table 5.
Results of chemical composition of the solids obtained by pyrolysis of the non-recyclable mixed plastics from municipal solid waste at different temperatures.
| Composition (%) | |||||||||||||
|---|---|---|---|---|---|---|---|---|---|---|---|---|---|
| SiO2 | Al2O3 | Fe2O3 | MnO | MgO | CaO | Na2O | K2O | TiO2 | P2O5 | SO3 | |||
| 450 °C | 2.08 | 1.48 | 0.28 | 0.01 | 0.75 | 12.20 | 0.21 | 0.08 | 3.69 | 0.14 | 0.48 | ||
| 500 °C | 2.97 | 2.11 | 0.40 | 0.01 | 1.07 | 17.44 | 0.30 | 0.11 | 5.27 | 0.19 | 0.69 | ||
| 550 °C | 3.98 | 2.83 | 0.54 | 0.01 | 1.43 | 23.37 | 0.40 | 0.15 | 7.07 | 0.26 | 0.92 | ||
| Composition (ppm) | |||||||||||||
| Sr | Ba | Sb | Zn | Ni | Br | Cu | Cr | Cl | Nb | Zr | Mo | Pb | |
| 450 °C | 145 | 4556 | 57 | 1367 | 121 | 2328 | 76 | 377 | 6039 | 18 | 64 | 7 | 145 |
| 500 °C | 207 | 6513 | 82 | 1955 | 173 | 3328 | 108 | 539 | 8632 | 26 | 92 | 10 | 207 |
| 550 °C | 277 | 8730 | 110 | 2620 | 232 | 4460 | 145 | 723 | 11570 | 35 | 123 | 14 | 20 |
Table 6.
Results of the lead adsorption tests in aqueous solution. Initial lead concentration = 10 mg/L; volume of solution = 50 mL; amount of solid = 0.05 g; contact time = 120 min; room temperature.
Table 6.
Results of the lead adsorption tests in aqueous solution. Initial lead concentration = 10 mg/L; volume of solution = 50 mL; amount of solid = 0.05 g; contact time = 120 min; room temperature.
| Temperature | qe, mg/g | Removal % |
|---|---|---|
| 450 °C | 5.26 | 37.79 |
| 500 °C | 5.88 | 44.41 |
| 550 °C | 7.91 | 73.48 |
Table 7.
Fit parameters of the experimental results to the different equilibrium models.
| Langmuir | qm, mg/g | b, L/mg | r2 | ∑(y−ycal)2 | |
| 40.767 | 0.129 | 0.992 | 3.011 | ||
| Freundlich | KF, mg/g·(L/mg)1/n | n | r2 | ∑(y−ycal)2 | |
| 5.653 | 1.699 | 0.992 | 3.356 | ||
| Redlich–Peterson | A, L/g | B, ((L/mg)g) | g | r2 | ∑(y−ycal)2 |
| 8.550 | 0.617 | 0.66 | 0.994 | 2.395 | |
| Sips | qm, mg/g | b, L/mg | n | r2 | ∑(y−ycal)2 |
| 61.301 | 0.094 | 1.266 | 0.995 | 2.175 | |
Publisher’s Note: MDPI stays neutral with regard to jurisdictional claims in published maps and institutional affiliations. |
© 2021 by the authors. Licensee MDPI, Basel, Switzerland. This article is an open access article distributed under the terms and conditions of the Creative Commons Attribution (CC BY) license (https://creativecommons.org/licenses/by/4.0/).
Share and Cite
MDPI and ACS Style
Martín-Lara, M.A.; Piñar, A.; Ligero, A.; Blázquez, G.; Calero, M. Characterization and Use of Char Produced from Pyrolysis of Post-Consumer Mixed Plastic Waste. Water 2021, 13, 1188. https://doi.org/10.3390/w13091188
AMA Style
Martín-Lara MA, Piñar A, Ligero A, Blázquez G, Calero M. Characterization and Use of Char Produced from Pyrolysis of Post-Consumer Mixed Plastic Waste. Water. 2021; 13(9):1188. https://doi.org/10.3390/w13091188
Chicago/Turabian StyleMartín-Lara, M. A., A. Piñar, A. Ligero, G. Blázquez, and M. Calero. 2021. "Characterization and Use of Char Produced from Pyrolysis of Post-Consumer Mixed Plastic Waste" Water 13, no. 9: 1188. https://doi.org/10.3390/w13091188
Note that from the first issue of 2016, this journal uses article numbers instead of page numbers. See further details here.