
Scenario-Based Real-Time Flood Prediction with Logistic Regression

1
Korea Institute of Civil Engineering and Building Technology Goyangdaero 283, Ilsanseo-Gu, Goyang-Si 10223, Korea
2
Department of Civil Engineering, Kyungpook National University, 80 Daehak-ro, Buk-gu, Daegu 41566, Korea
*
Author to whom correspondence should be addressed.
Water 2021, 13(9), 1191; https://doi.org/10.3390/w13091191
Submission received: 6 April 2021
/
Revised: 19 April 2021
/
Accepted: 21 April 2021
/
Published: 25 April 2021
(This article belongs to the Special Issue The Application of Artificial Intelligence in Hydrology)
Abstract
:This study proposed a real-time flood extent prediction method to shorten the time it takes from the flood occurrence to an alert issuance. This method uses logistic regression to generate a flood probability discriminant for each grid constituting the study area, and then predicts the flood extent with the amount of runoff caused by rainfall. In order to generate the flood probability discriminant for each grid, a two-dimensional (2D) flood inundation model was verified by applying the Typhoon Chaba, which caused great damage to the study area in 2016. Then, 100 probability rainfall scenarios were created by combining the return period, duration, and time distribution using past observation rainfall data, and rainfall-runoff–inundation relation databases were built for each scenario by applying hydrodynamic and hydrological models. A flood probability discriminant based on logistic regression was generated for each grid by using whether the grid was flooded (1 or 0) for the runoff amount in the database. When the runoff amount is input to the generated discriminant, the flood probability on the target grid is calculated by the coefficients, so that the flood extent is quickly predicted. The proposed method predicted the flood extent in a few seconds in both cases and showed high accuracy with 83.6~98.4% and 74.4~99.1%, respectively, in the application of scenario rainfall and actual rainfall.
1. Introduction
Recently, floods have been frequently occurring not only in Korea but also around the world due to climate change. In Korea, hydraulic structures are designed with 80 to 200 years of floods depending on the size of the rivers to prevent floods. In urban areas, storm sewers and drainage pumping stations are designed against rainfall of 5 to 30 years, respectively, and are redesigned every 5 or 10 years to cope with climate and environmental changes.
However, the recent rainfall of 132 mm/h in Ulsan in 2016, 98 mm/h in Busan in 2017, and 93 mm/h in Gangneung in 2018 have caused flooding by exceeding the design rainfall for hydraulic structures in each region. In particular, 132 mm/h in 2016 was much higher than the 200-year frequency rainfall of 86.8 mm/h in the Taehwa River basin, which is the study area. As such, the goals for disaster prevention capability of rivers and hydraulic structures set to reduce flood damage are designed to be lower. Moreover, since rainfalls of strong intensity are occurring locally and suddenly, it is necessary to establish a comprehensive disaster response system for reducing and predicting flood damages.
Structural and non-structural measures may be proposed for reducing flood damage, but structural measures such as embankment raising and river dredging are limited due to difficulties in securing budgets and constructing processes, and even harm to the river environment. Therefore, in order to reduce flood damage efficiently, it is necessary to combine with non-structural measures such as establishing flood forecasts and warnings and evacuation plans.
For flood forecasting and warning, observations including rainfall, water level, and pipeline depth are important. However, in small and medium-sized watersheds where the arrival time of a flood wave is short, it is difficult to quickly deliver necessary information to decision-makers about evacuation plans only by observing data. Thus, hydraulic and hydrologic numerical models are often required to predict flood behavior. In order to establish an evacuation plan using a numerical model in areas where flood damage is expected, it is important to secure a lead time through rapid simulation. However, it takes a long time to perform detailed and accurate simulations with a numerical model. Thus, to shorten the simulation time of the numerical model, the performance of the equipment is improved, the numerical schemes are developed, and data-based analysis using various scenarios is carried out.
In Korea, 1D or 2D numerical models are mainly used for flood forecasting and warning in rivers. For 2D models, the higher the resolution of the grid, the more detailed topography is reflected. However, the higher the resolution, the longer the computational time, making it difficult to perform real-time predictions and warnings in areas where detailed topography is required, such as in urban areas. Continuous research is ongoing to overcome the weaknesses of these 2D flood models [1,2,3,4]. Horrit and Bate [5] emphasized the usability of the DEM-based inundation model that uses uniform grids in efficiency of calculation time and parameter adjustment. Liang et al. [6] enabled efficient calculation for fine grids through quad-tree grid-based shallow water. Kim et al. [7] developed a model capable of selecting favorable grids for different situations via various comparisons on types of grids in a 2D flood model, and improved the calculation efficiency by considering Local Time Stepping (LTS).
Recently, many studies have been conducted on real-time flood forecasts and warnings using machine learning models including Artificial Neural Networks (ANN) and data-based analyses [8,9,10,11]. Nayak et al. [12] predicted the flow rate using neuro-fuzzy, artificial neural network, and fuzzy inference system with rainfall data for the past three years, Oh et al. [13] proposed an automatic calibration system for estimating missing hydrological data and correcting real-time data using a neural network model. Toth [14] clustered rainfall data using Self-Organizing Maps (SOM) and predicted the flow rate through artificial neural networks suitable for the characteristics of the clustered rainfall. Chang et al. [15] showed the superiority of Nonlinear Auto-Regressive eXogenous (NARX) ANN by comparing Back-Propagation NN (BPNN), Elman NN, and NARX ANN for the prediction of reservoir water level. To calculate 1–6 h of preceding time during a storm, Jhong et al. [16] suggested a two-step inundation prediction approach method that predicts accumulated rainfall, expected inundation depth, terrain information and standard point of inundated grid based on Support Vector Machine (SVM). Kim et al. [17] identified that the prediction of one-dimensional (1D) flooding through the NARX artificial neural network is excellent by comparing several dynamic neural networks with respect to the runoff quantity of manholes that cause urban flooding. Further, Jung et al. [18] proposed a method for estimating the probability of inundation through multiple logistic regression analysis using terrain information as an input variable.
In Korea, the flood forecasting and warning system for large rivers, including the Nakdong River, is designed so that the water level of the river can be calculated in a short time by a 1D numerical model that applies observation data (rainfall and water level) as boundary conditions. However, the flood extent has not been forecasted yet due to various difficulties. For example, a 1D model may lead to inaccurate results in spatial flood prediction, and a 2D model is difficult to simulate rapidly for real-time forecasting.
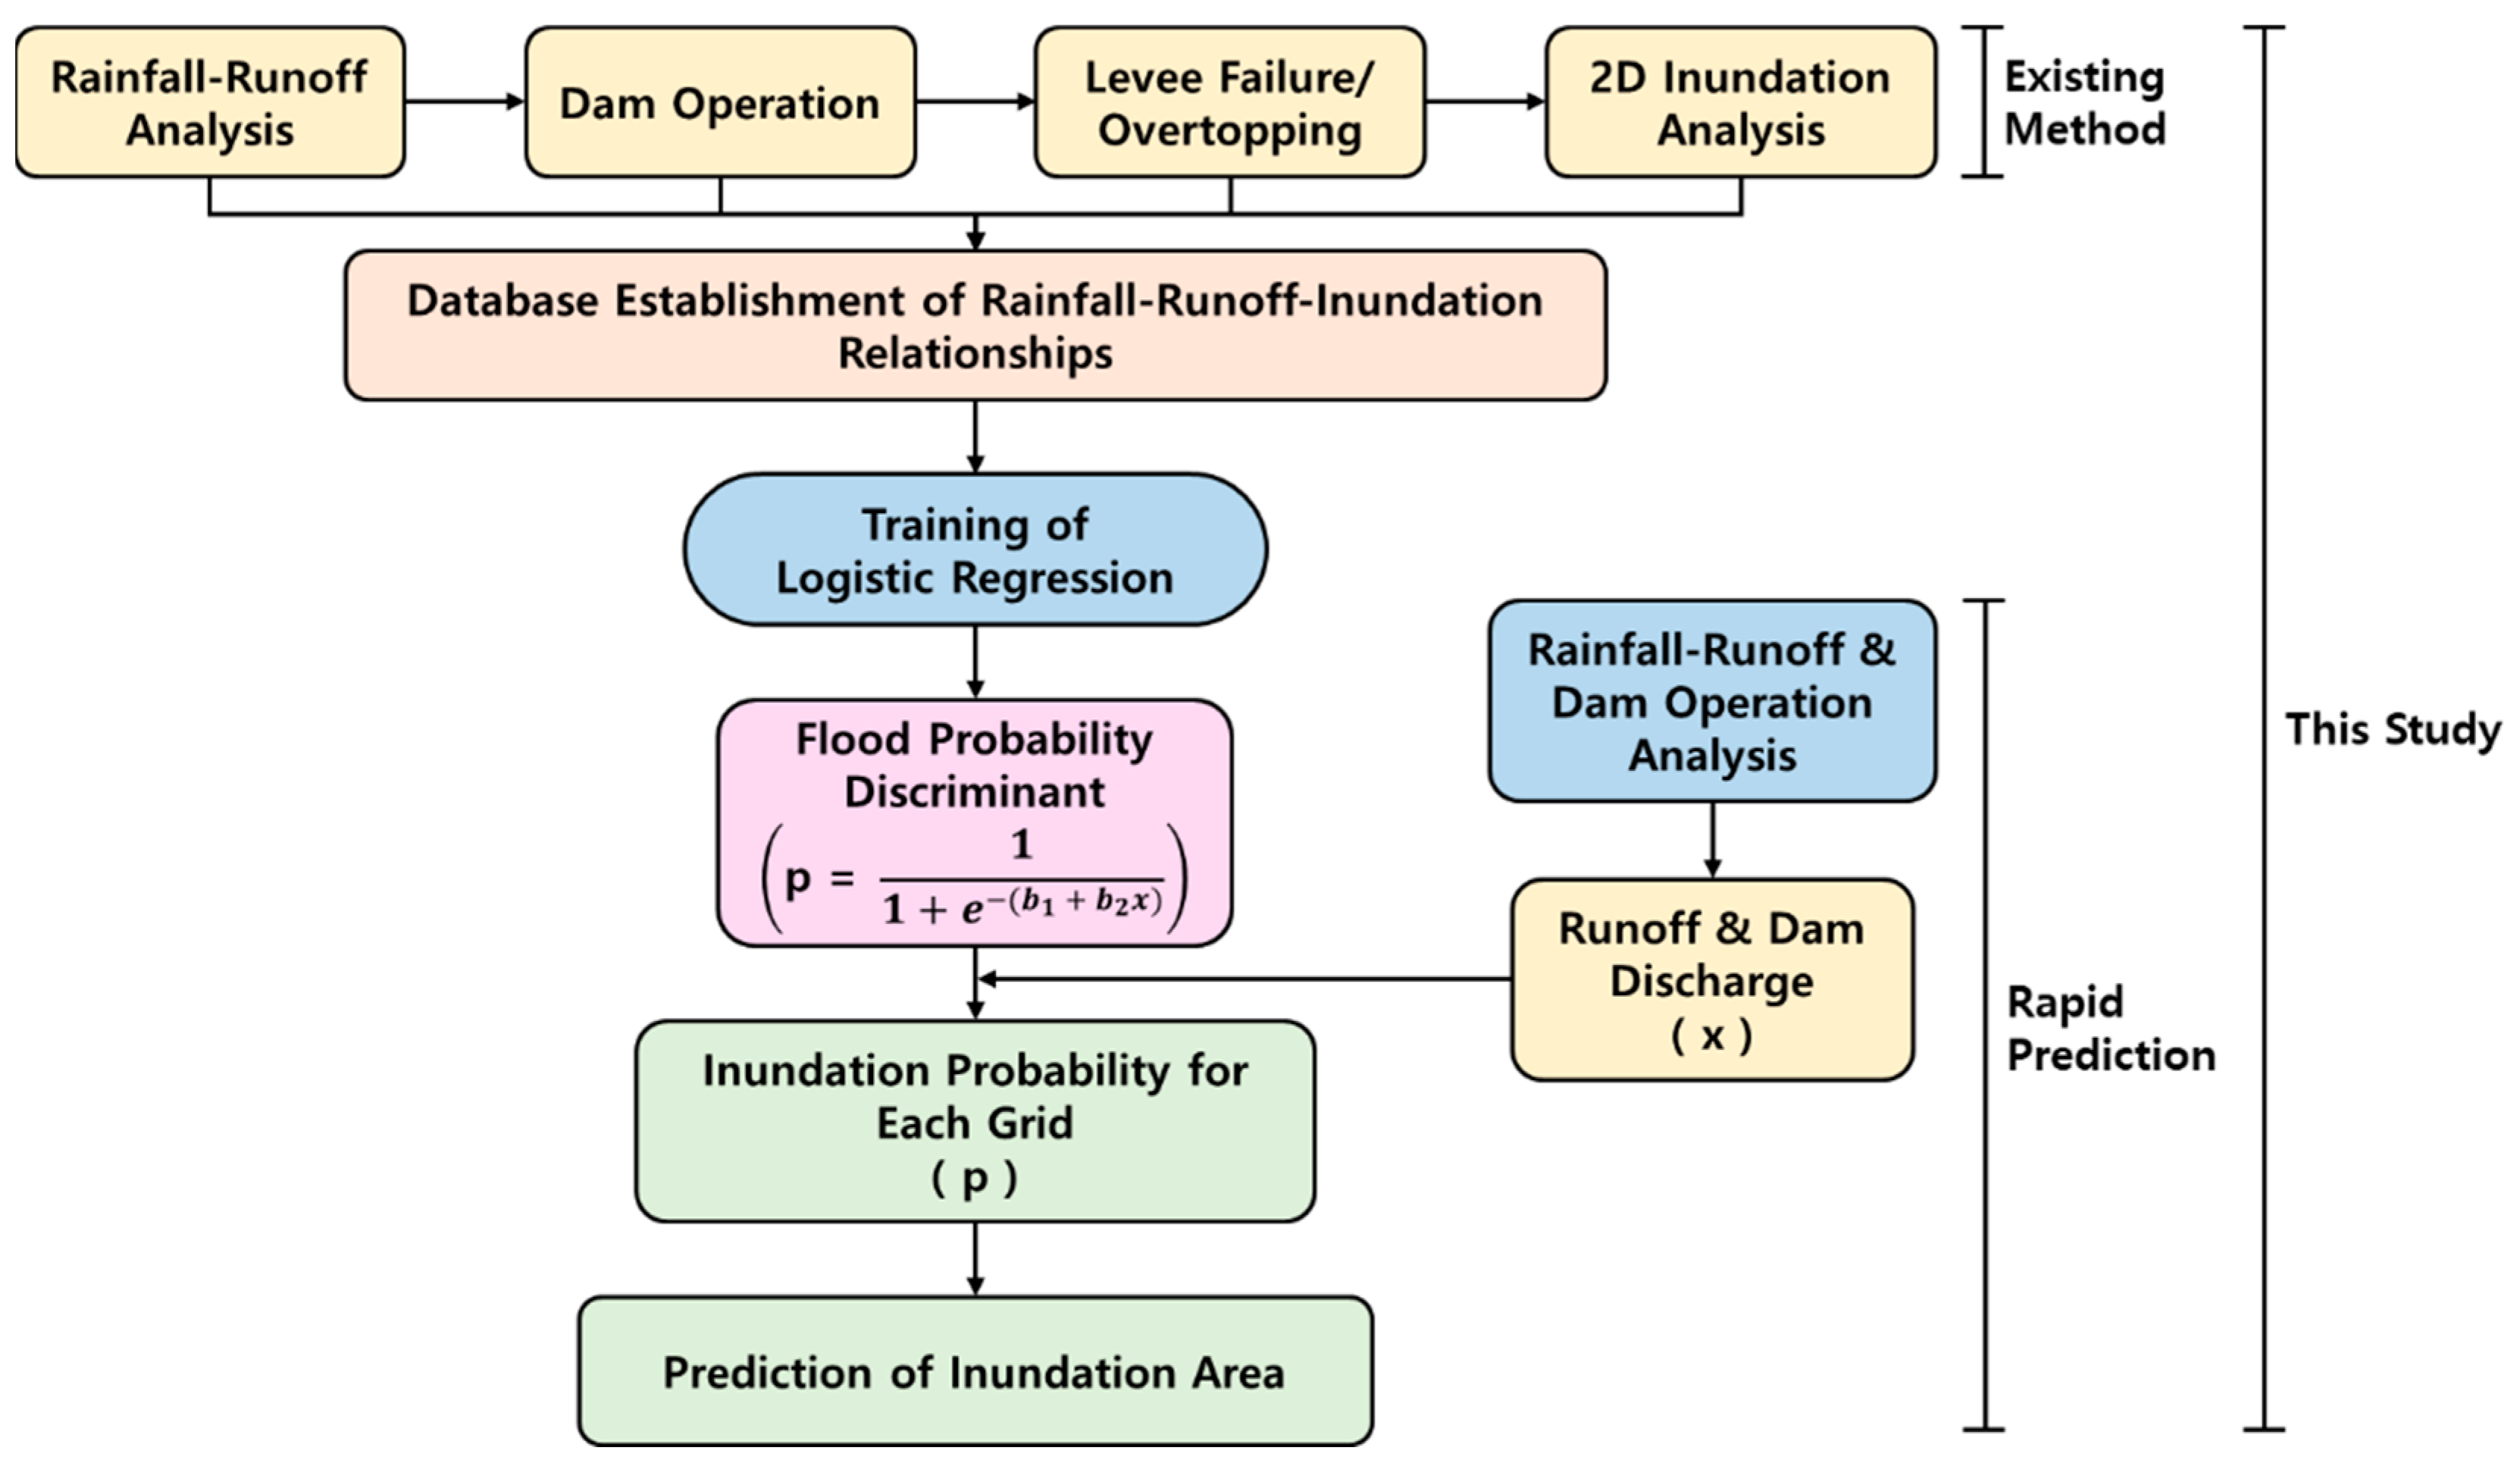
Therefore, in order to overcome these difficulties, this study developed a real-time flood prediction method using a database built in a rainfall-runoff–inundation relationship and logistic regression. As shown in Figure 1, a rainfall scenario using probability rainfall was set up, and a rainfall-runoff–inundation database was constructed by calculating basin runoff and river flooding with 1D and 2D models. Based on this, the flood probability discriminant for each grid on the floodplain is generated by using logistic regression, and when the runoff amount according to rainfall is determined, the flood probability for each grid is quickly calculated. Figure 1 shows the difference between the existing method used for flood forecasting and warning in Korea and the proposed method of this study.
The flood probability discrimination using logistic regression proposed in this study is expected to help establish an evacuation plan for a flood-prone area by predicting the inundation grid in a short time.
2. Methodology
2.1. Logistic Regression
The general purpose of regression analysis is to study the relationship between dependent and independent variables, from linear and nonlinear regression, parameter estimation to non-parametric models. This is one of the most widely used techniques for analyzing a set of well-known data because of its convenience in application, and especially in the field of water resources and environmental engineering [19,20]. Regression analysis is widely used for prediction using data interpolation and extrapolation, and for estimation of missing data. In this study, logistic regression was used among several techniques of regression analysis to predict the inundated grids.
As shown in Equation (1), in logistics regression, represents an independent variable, represents a dependent variable, represents a constant of a regression expression, and represents a constant for an independent variable.
The pre-existing regression expressions assume that the values calculated from both the left and right terms are continuous. However, the condition of the data applied to logistic regressions is that the right side is a continuous number, but the left side terms have discrete numbers, which becomes a problem of predicting 0 or 1. As such, logistic regressions can be viewed as sorting techniques because the result of input data can be divided into specific categories when they are given.
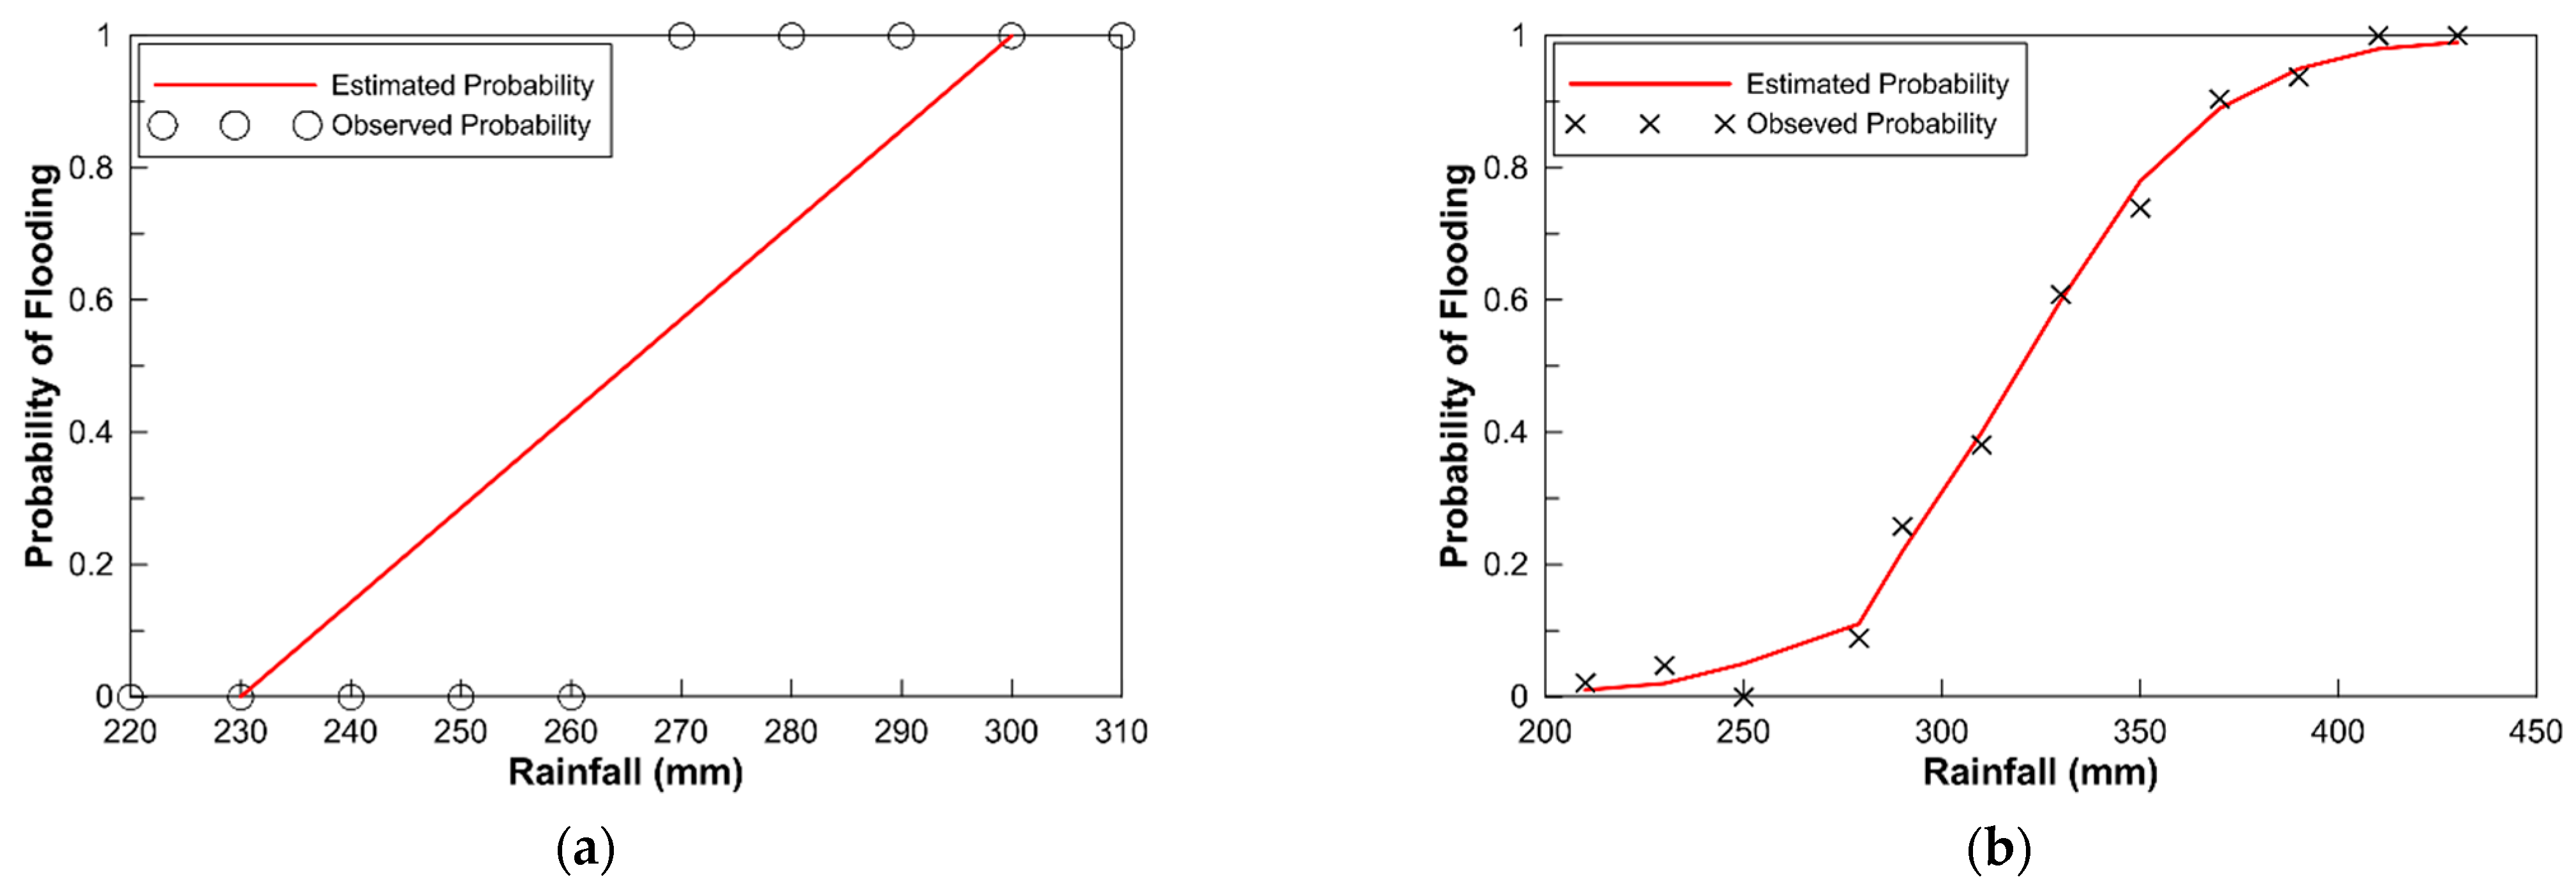
Araghinejad [21] described the reason for using logistic regression rather than linear regression in flood probability prediction as shown in Figure 2. Figure 2 shows an example of applying linear regression and logistic regression to predict flooding due to rainfall. If the rainfall exceeds the threshold (260 mm) and floods occur, applying the Generalized Linear Model (GLM) produces a linear classification as shown in Figure 2a. According to this classification, no flooding occurs on the left side of the line, and flooding occurs on the right side. However, under this classification, the flood probability for rainfall of 240 to 290 mm is incorrectly predicted (Figure 2a). The flood probabilities are not linear (Figure 2a), but S-shaped distribution (Figure 2b) since there is no distinct threshold for real floods [21]. That is, if the classification in flood prediction is generated by logistic regression rather than linear regression, the flood probability fits well with the S-shaped distribution as shown in Figure 2b.
The logistic regression can be expressed as Equation (3) by logarithmically converting Equation (2) that represents the Odds Ratio (OR) for a specific event, and the resulting expression is called a logit function.
where represents the probability of the goal event. represents the constant term of the logistic regression, and represents the parameter for an independent variable. Equation (4) that represents the relationship of the logit function to a continuous variable is called the logistic regression. The logistic function shows the result of the continuous variable converted into variables between 0 and 1 as an inverse of the logit function (Equation (5)).
The logistic regression parameter is normally estimated by using the maximum likelihood method, and when the logistic regression parameter has a large value, it greatly influences the probability of inundation, and the closer the value is to 0, the less it influences the probability of inundation. Ultimately, the calculation is performed using binary data, where 1 is provided when the inundation probability of the target grid is greater than the cutoff value, and 0 is provided otherwise.
2.2. Inundated Grid Prediction
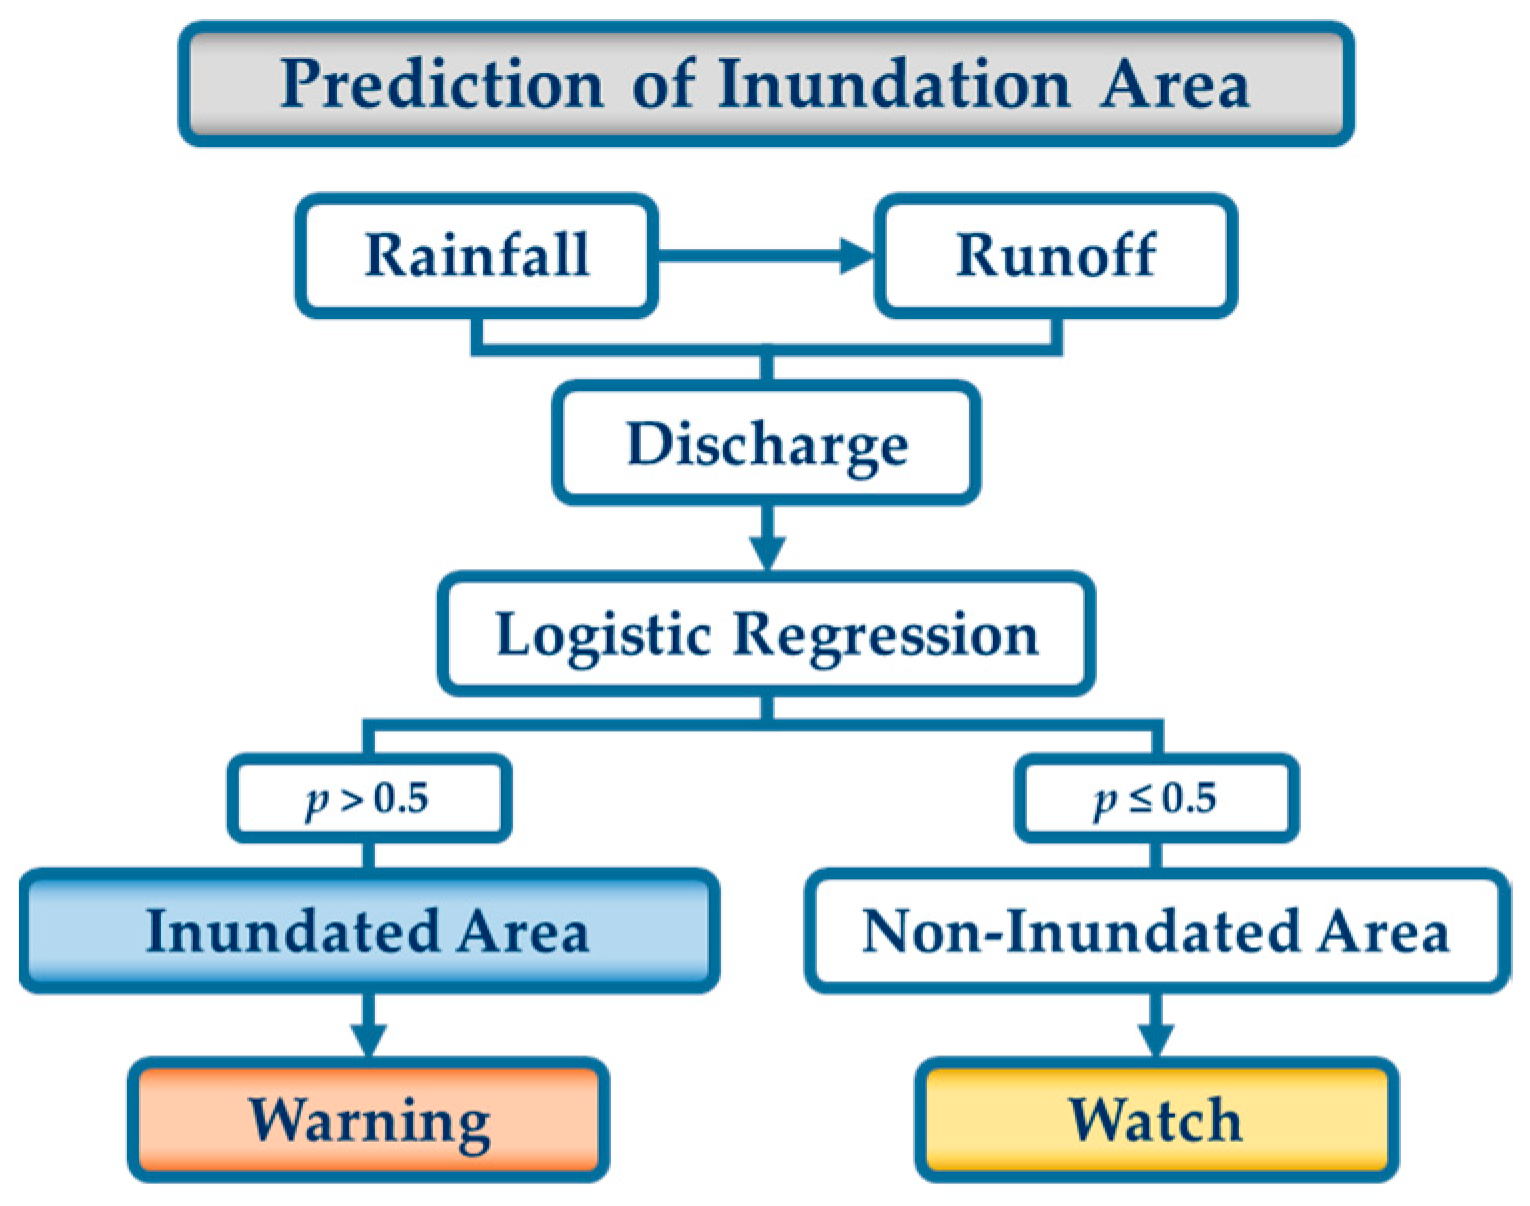
The prediction process of the inundated grid using logistic regression utilizes the runoff calculated from hydrological analysis of rainfall as shown in Figure 3. If the calculated probability of inundation is 0.5 or higher, the grid is determined as an inundated grid, and if it is 0.5 or lower, it is determined as a non-inundated grid. This allows the expected extent of flooding at floodplains to be predicted quickly and accurately without a 2D flood simulation, enabling for rapid issuance of evacuation alerts for hazardous areas. The flood threshold in this study means the amount of runoff that causes a flood probability of 0.5 or higher for each grid. This threshold has a different value for each grid, such as inundation may occur in the lowlands even with a small runoff and no inundation occurs in the highlands even with a high runoff.
There are insufficient data on actual floods required to predict flooding by applying logistic regression in Korea. Therefore, this study constructed a database for floodplain inundation using hydrodynamic and hydrological numerical models by creating rainfall scenarios. The average annual rainfall in Korea is 1000~1800 mm, of which 50~60% is concentrated in the summer season, so the coefficient of flow fluctuation is high, and the probability of rainfall varies greatly depending on the return period. In this study, scenario rainfall was generated by using this probability rainfall. In particular, the Taehwa River, a river in the study area, is designed with the rainfall of 100-year return period, so a rainfall of a higher return period (e.g., 200 years) was considered in the scenario generation (Table 1).
The rainfall scenarios were created according to the calculating procedure of the probability rainfall of the MLTM [22]. In this guideline, considering the meteorological and geographic characteristics of Korea when calculating the probability rainfall, it is recommended to use the Gumbel distribution for rainfall intensity formula and the Probability Weight Moment (PWM) method for parameter estimation.
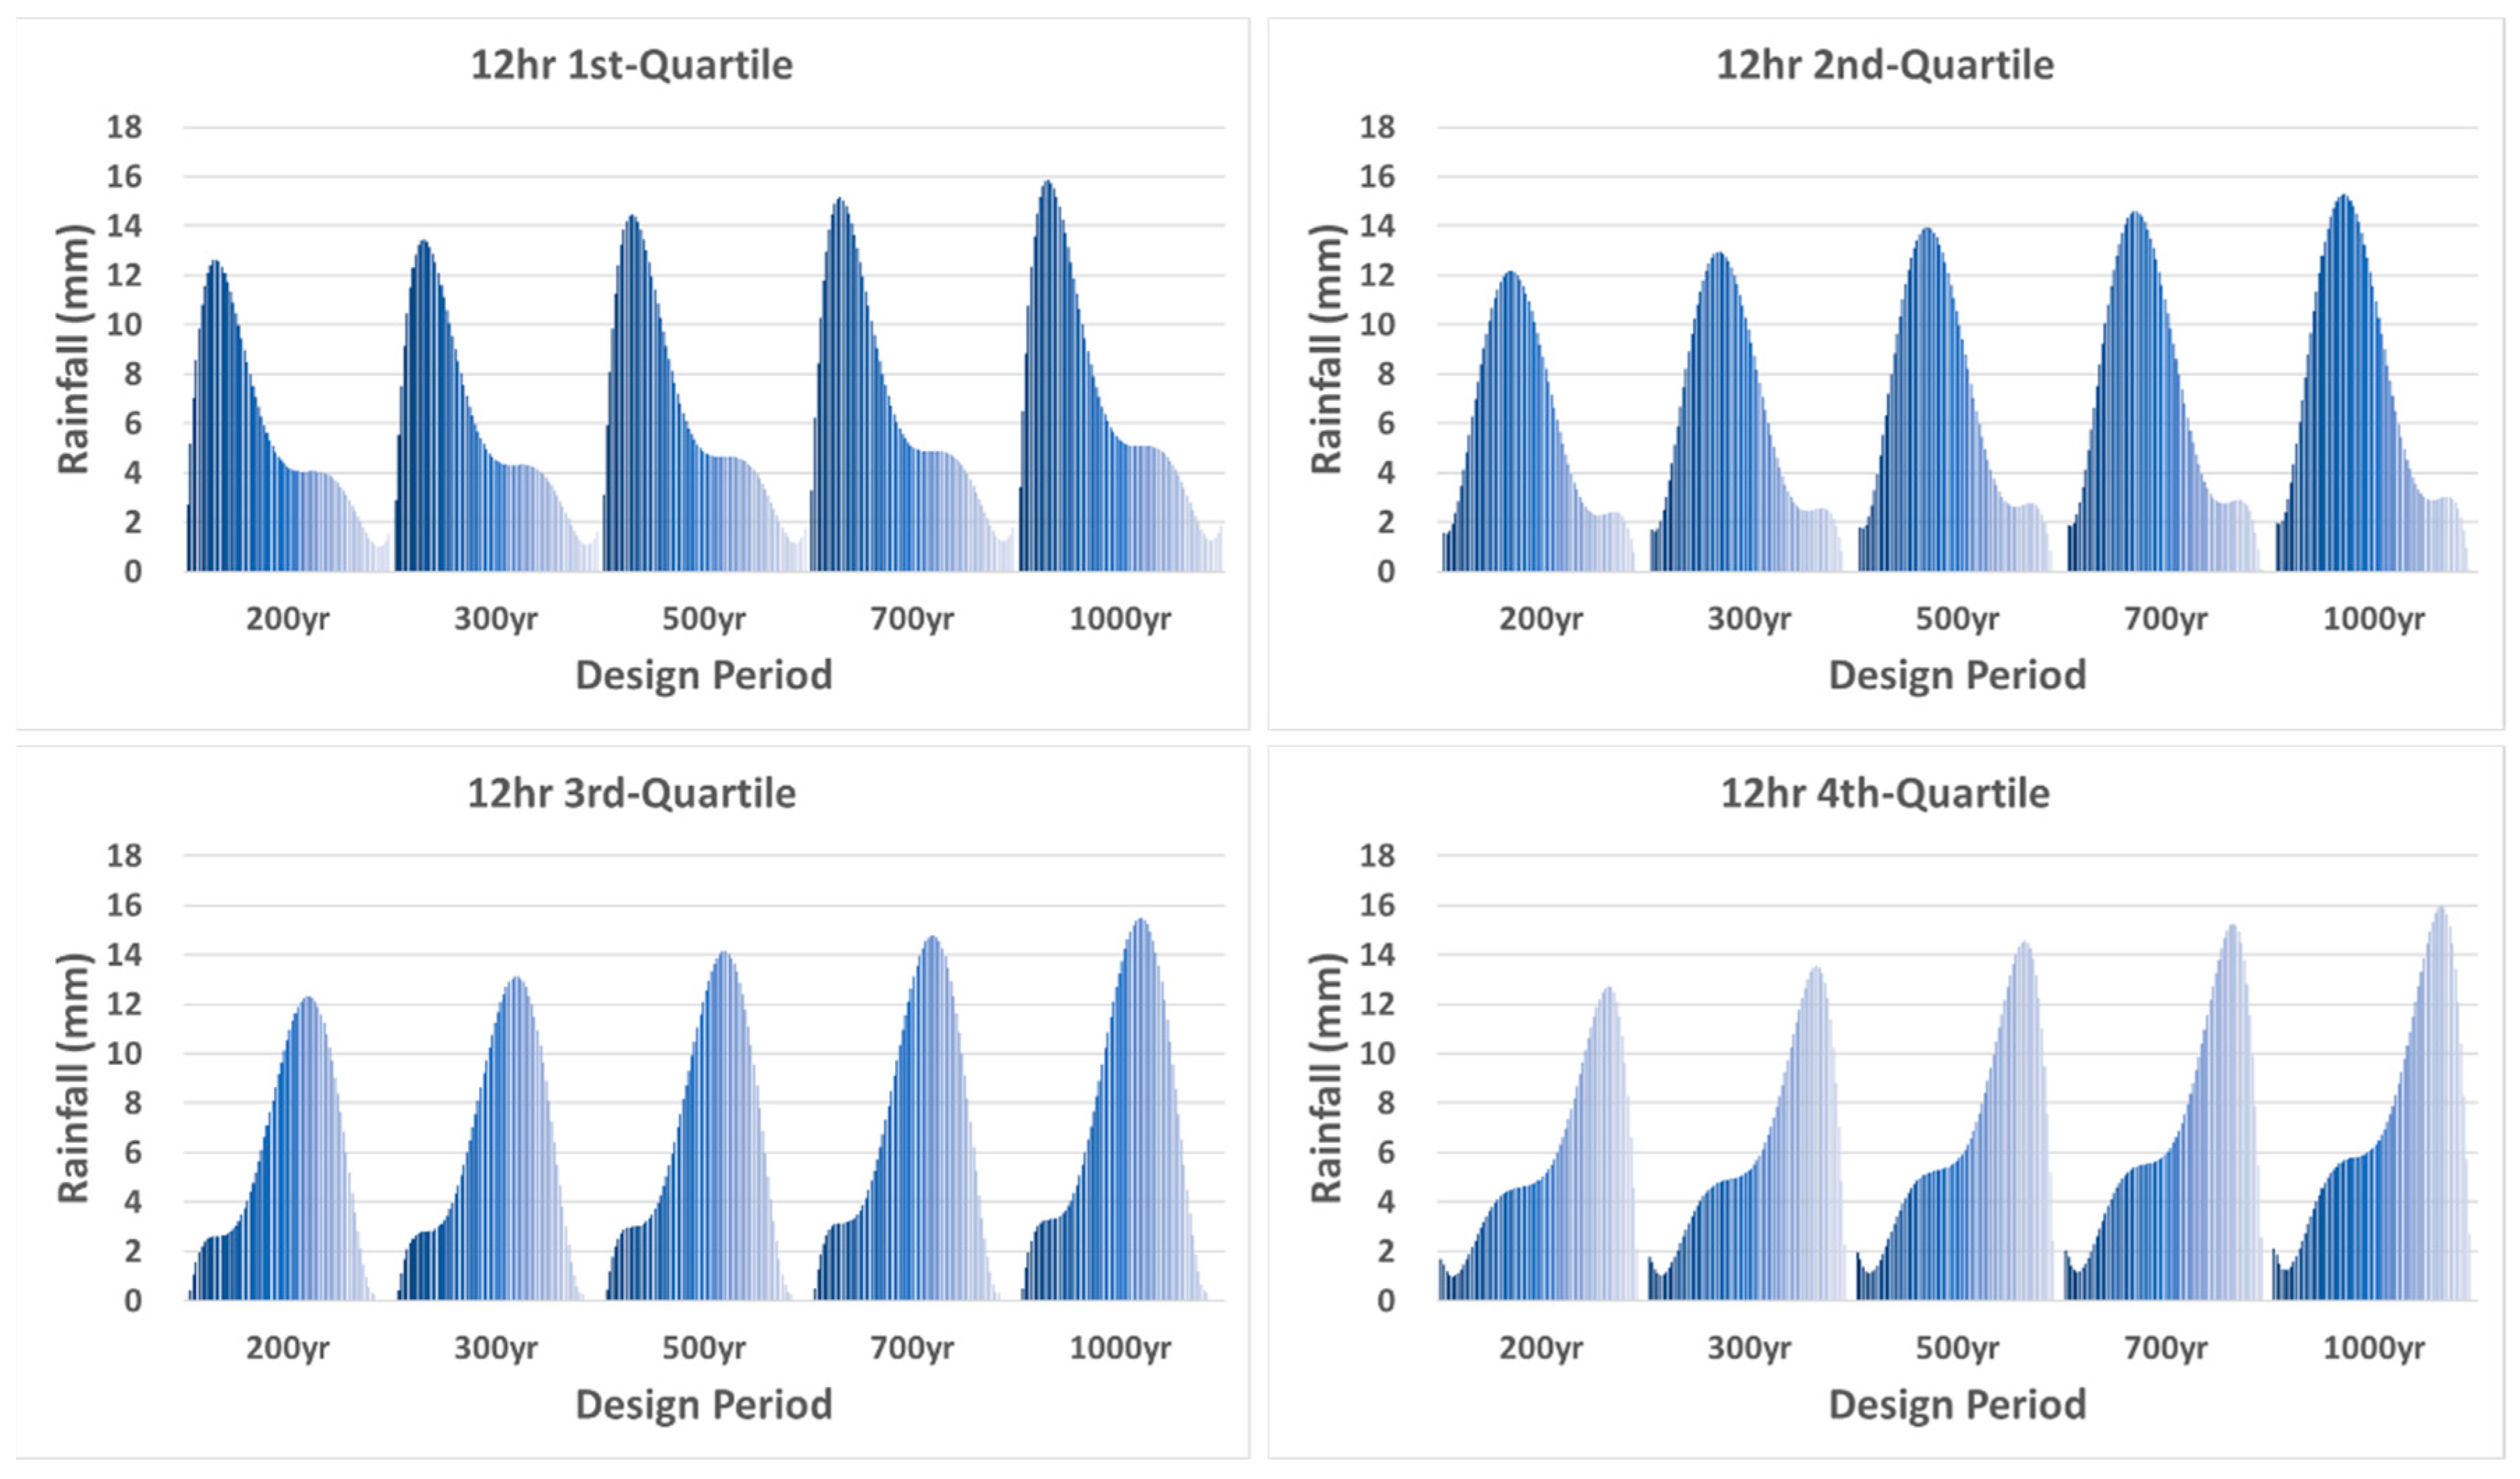
In this study, a total of 100 rainfall scenarios were applied by combining return period (200, 300, 500, 700, and 1000 years), duration (3, 6, 9, 12, 18, and 24 h), and time distribution (1, 2, 3, 4 quartile) of rainfall as shown in Table 1. As an example, Figure 4 shows rainfall distribution by return period and time distribution for 12 h duration among the created rainfall scenarios.
3. Model Application
3.1. Study Area
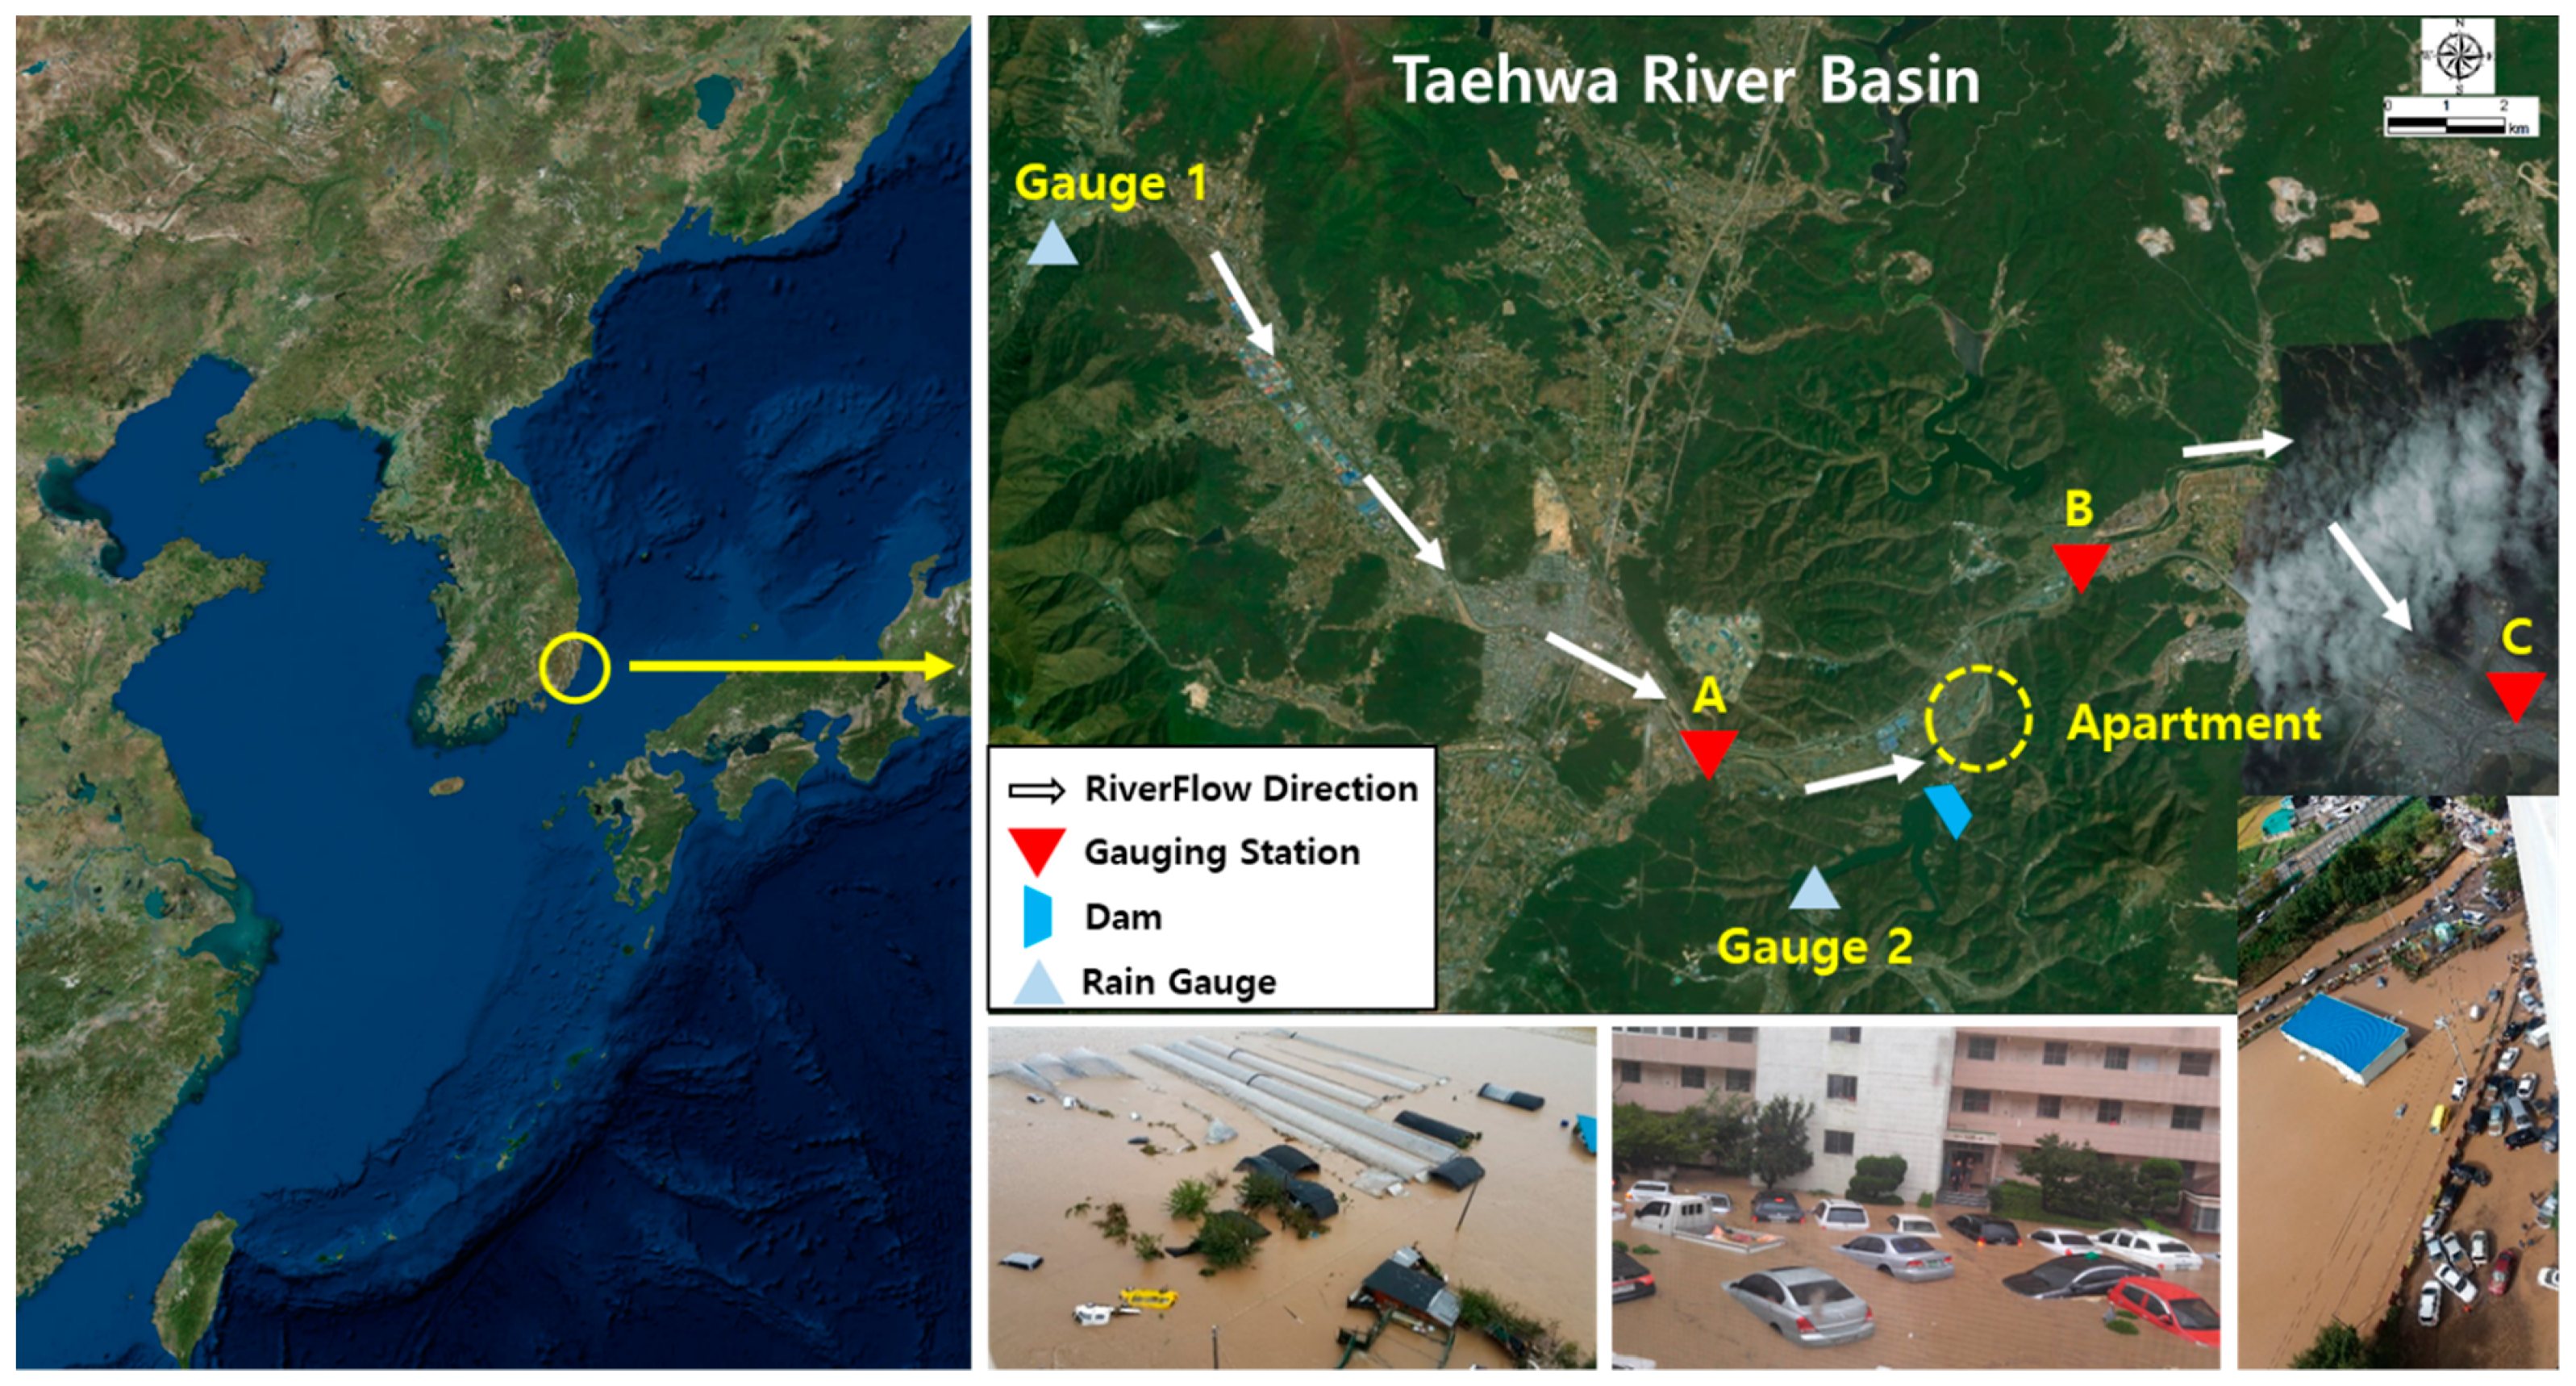
The study area is the Taehwa River basin located in the southeastern part of the Korean Peninsula, as shown in Figure 5. Typhoon Chaba caused damage to human life and properties in the study area on 5 October 2016. The gauge station A, located upstream of the study area, began observing on 1 January 2016, so there are not enough observations to create a rating curve. However, since this observatory is an important position that should be used as an upstream boundary for building a database on floods, accurate flooding estimates are required at this point.
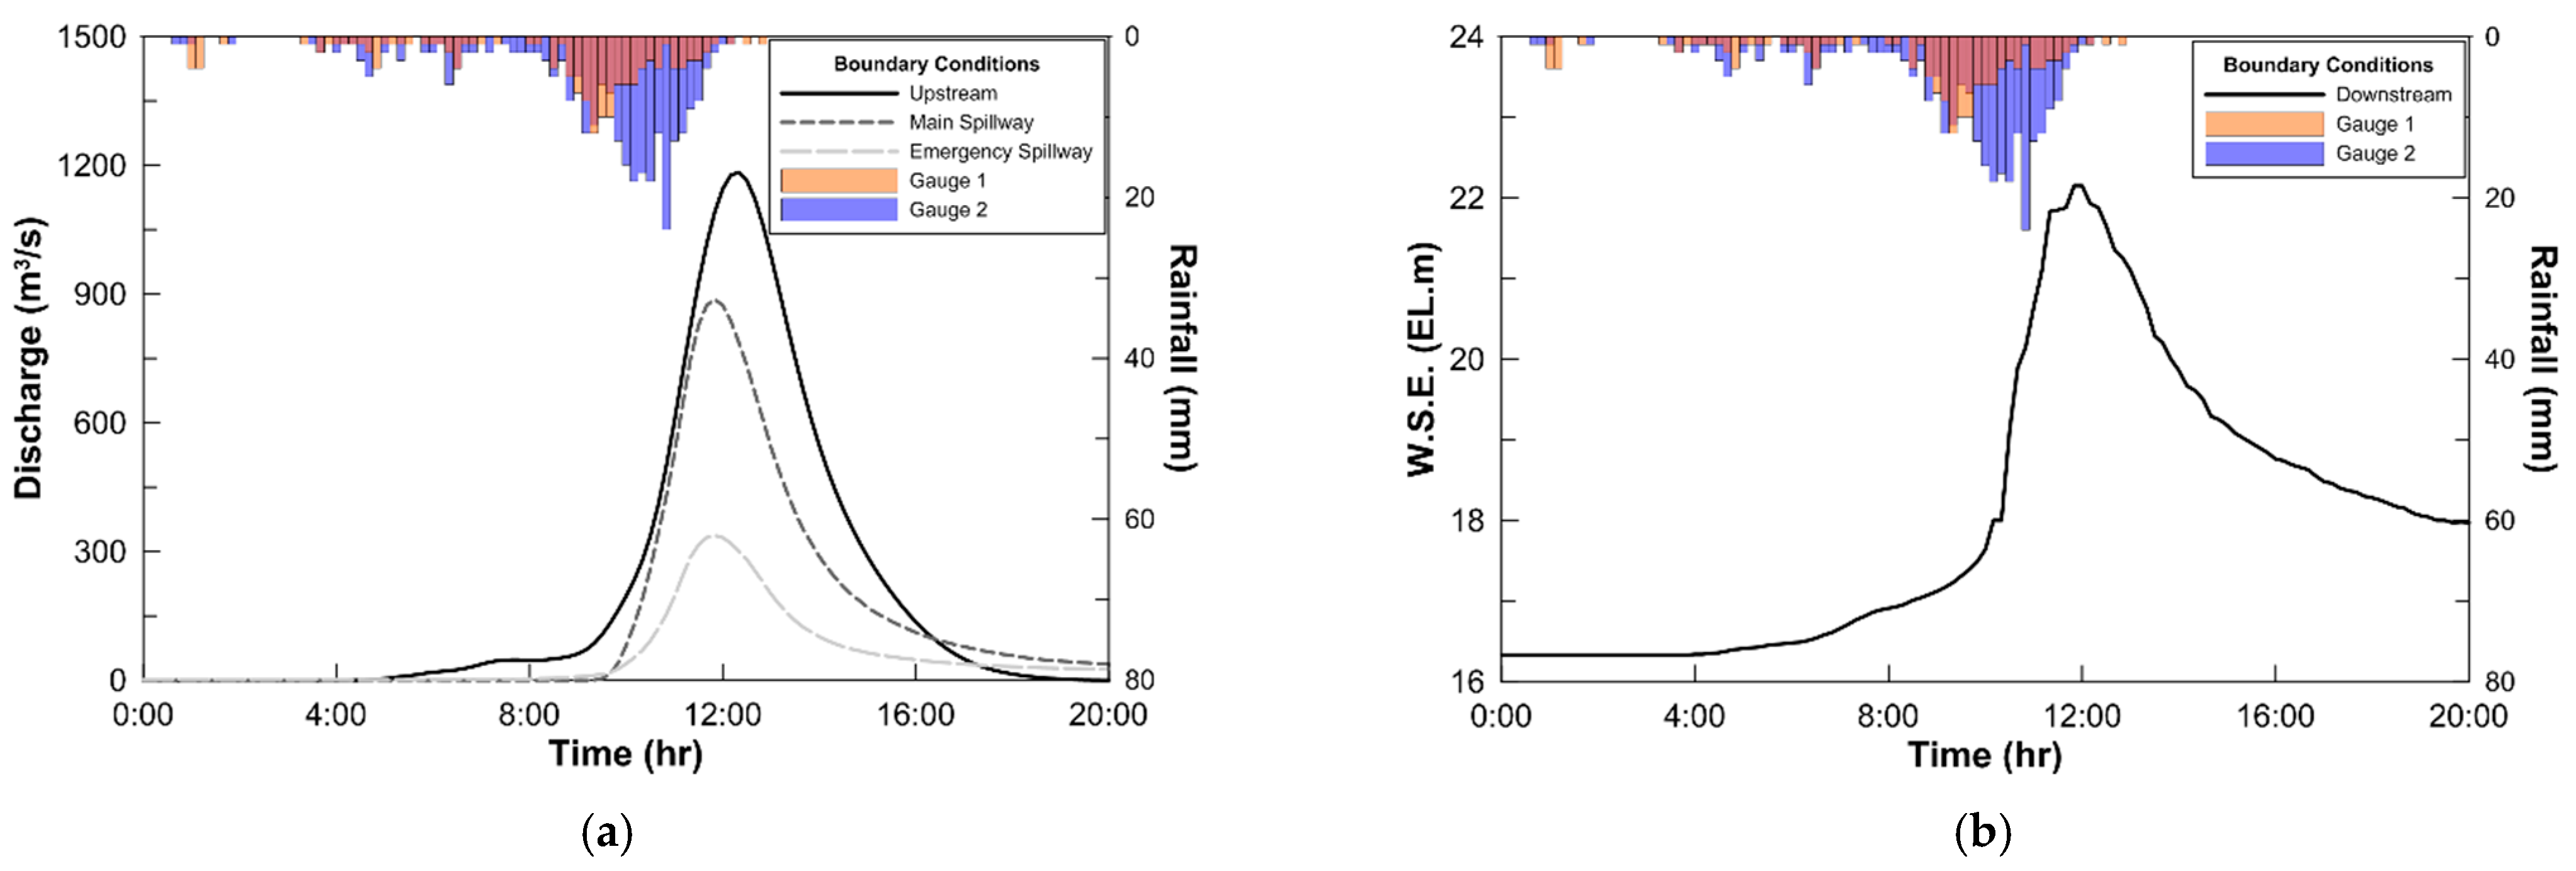
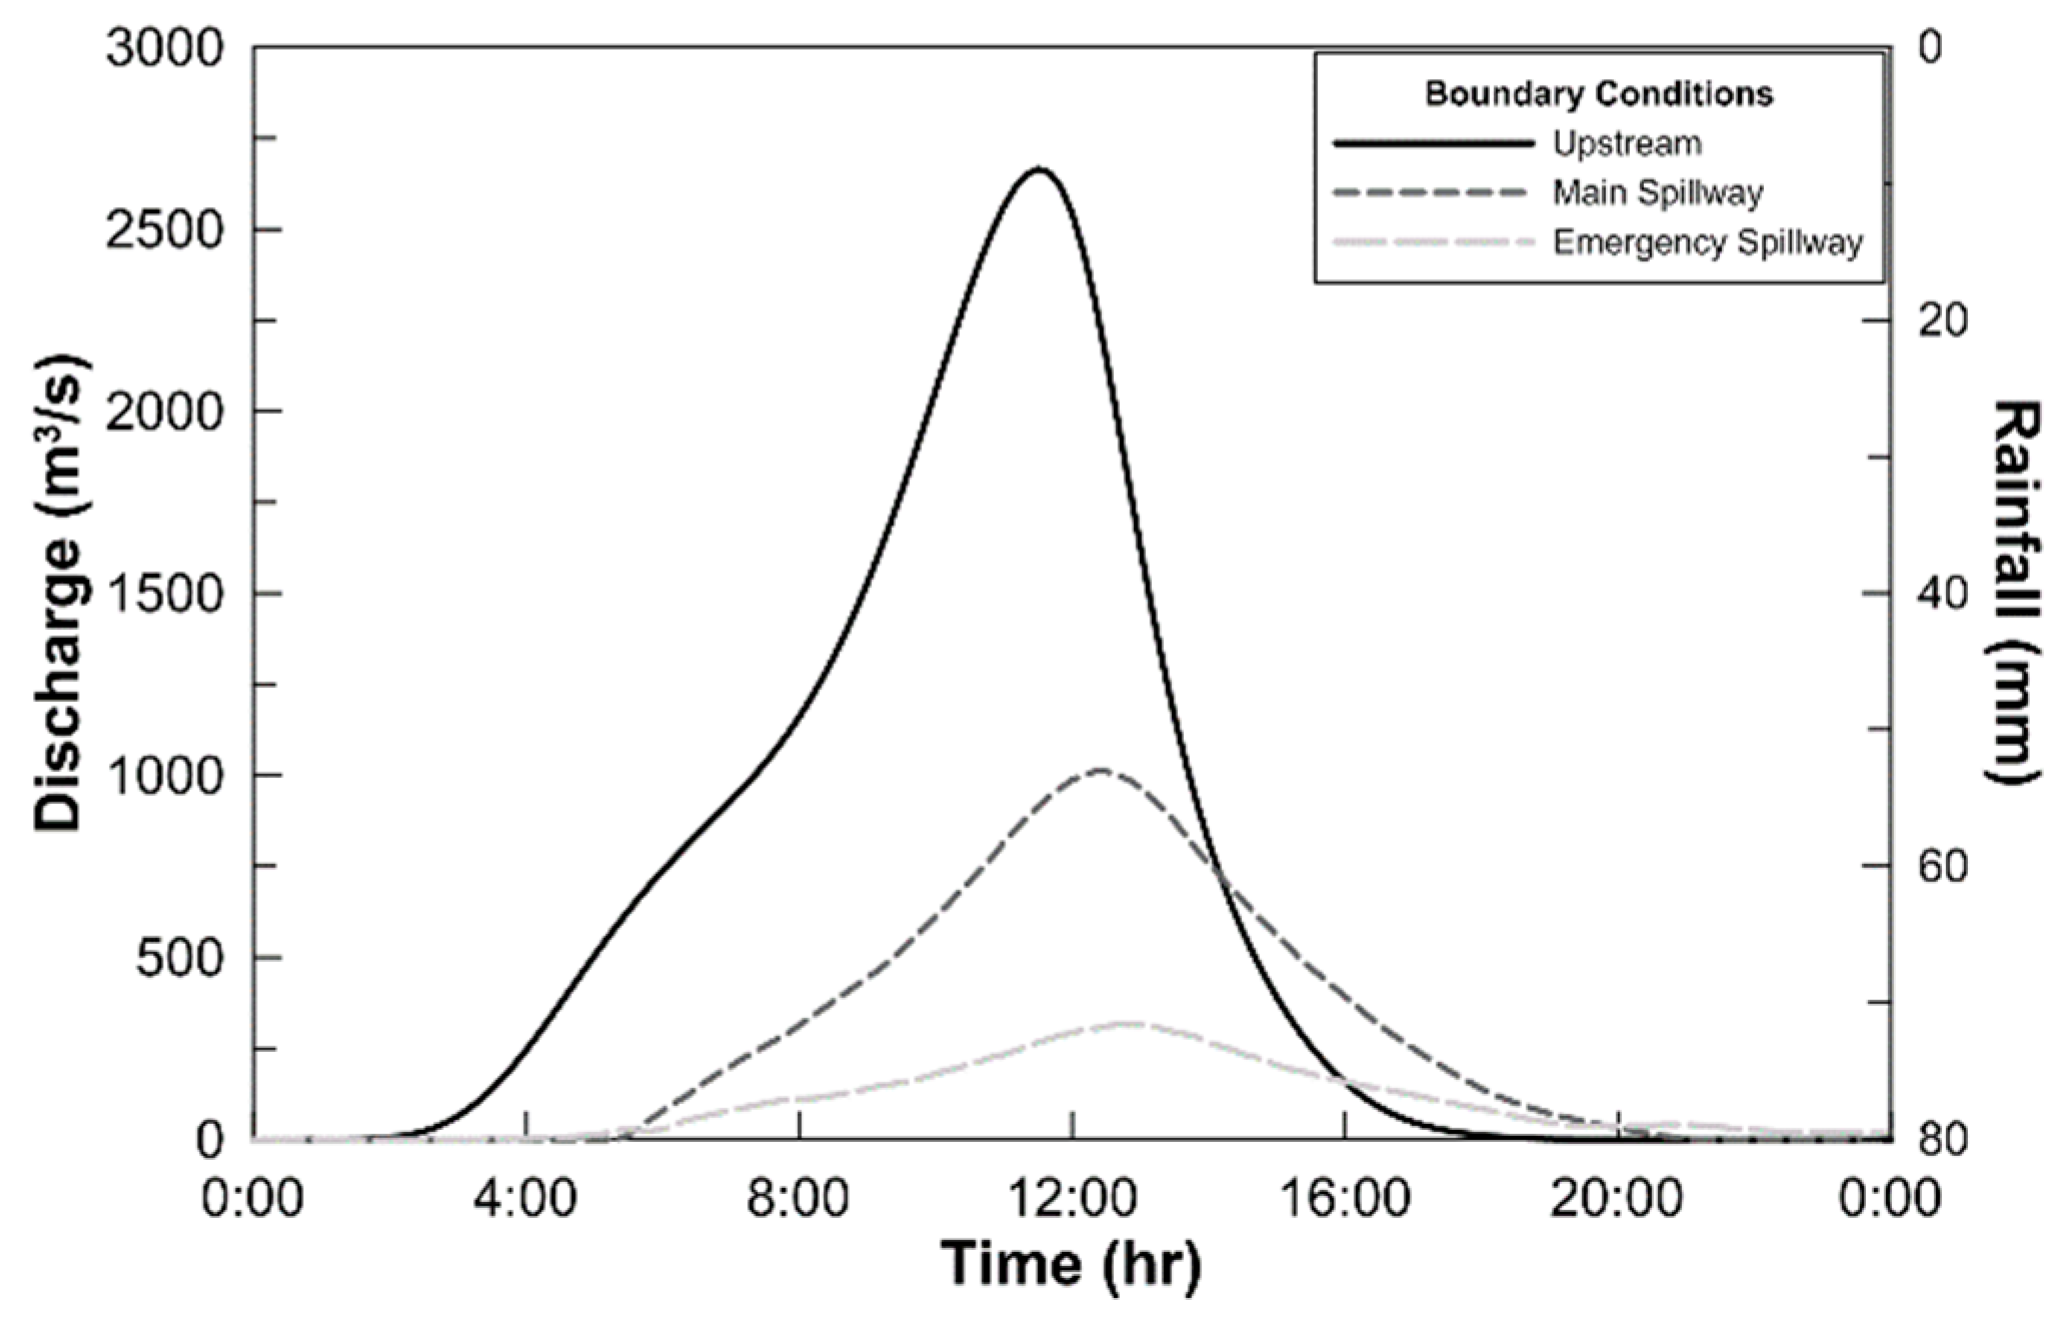
Therefore, in this study, a hydrological model was constructed to accurately reproduce the damage situation at the time of Typhoon Chaba. The parameters of the hydrological model utilized the basin characteristics of the Taehwa River Basic Plan [23]. A 2D flood model was constructed by using the data involving digital topographic maps produced in 2016 [24], river surveyed cross-sectional data [23] and rainfall data [25]. Meanwhile, since there is a water supply dam [26] in the study area, the reservoir outflow during the same period was used as the inflow of the 2D flood model as shown in Figure 6a [27].
The FLO-2D model [28] was used for the 2D inundation analysis of the study area. FLO-2D is a 2-Dimensional flood analysis model approved by Federal Emergency Management Agency (FEMA) [29], and is widely used for flood prediction such as river-overland flow analysis and flood risk management [30,31,32,33]. To consider the floodplain terrain in detail, the Triangular Irregular Network (TIN), including elevation of buildings and roads, was created from 1/1000 scale digital topographic maps. Additionally, the specifications of underground parking lots and culverts obtained from field investigation were considered. The roughness coefficients suggested by UMC [23] and Mattocks and Forbes [34] were applied in the river and floodplain, respectively. For 2D flood modeling in the study area, structured grids with 5 m resolution were generated, and the elevation of the terrain was placed at the center of each grid. The 2D flood model was verified with field surveyed flood extent and flood depth. Figure 6 shows the boundary conditions of the upstream and downstream applied for model verification. The discharge at gauge A and the outflow from the dam were applied as the upstream boundary condition, and the water level at gauge B was applied as the downstream boundary condition (Figure 5 and Figure 6) [25].
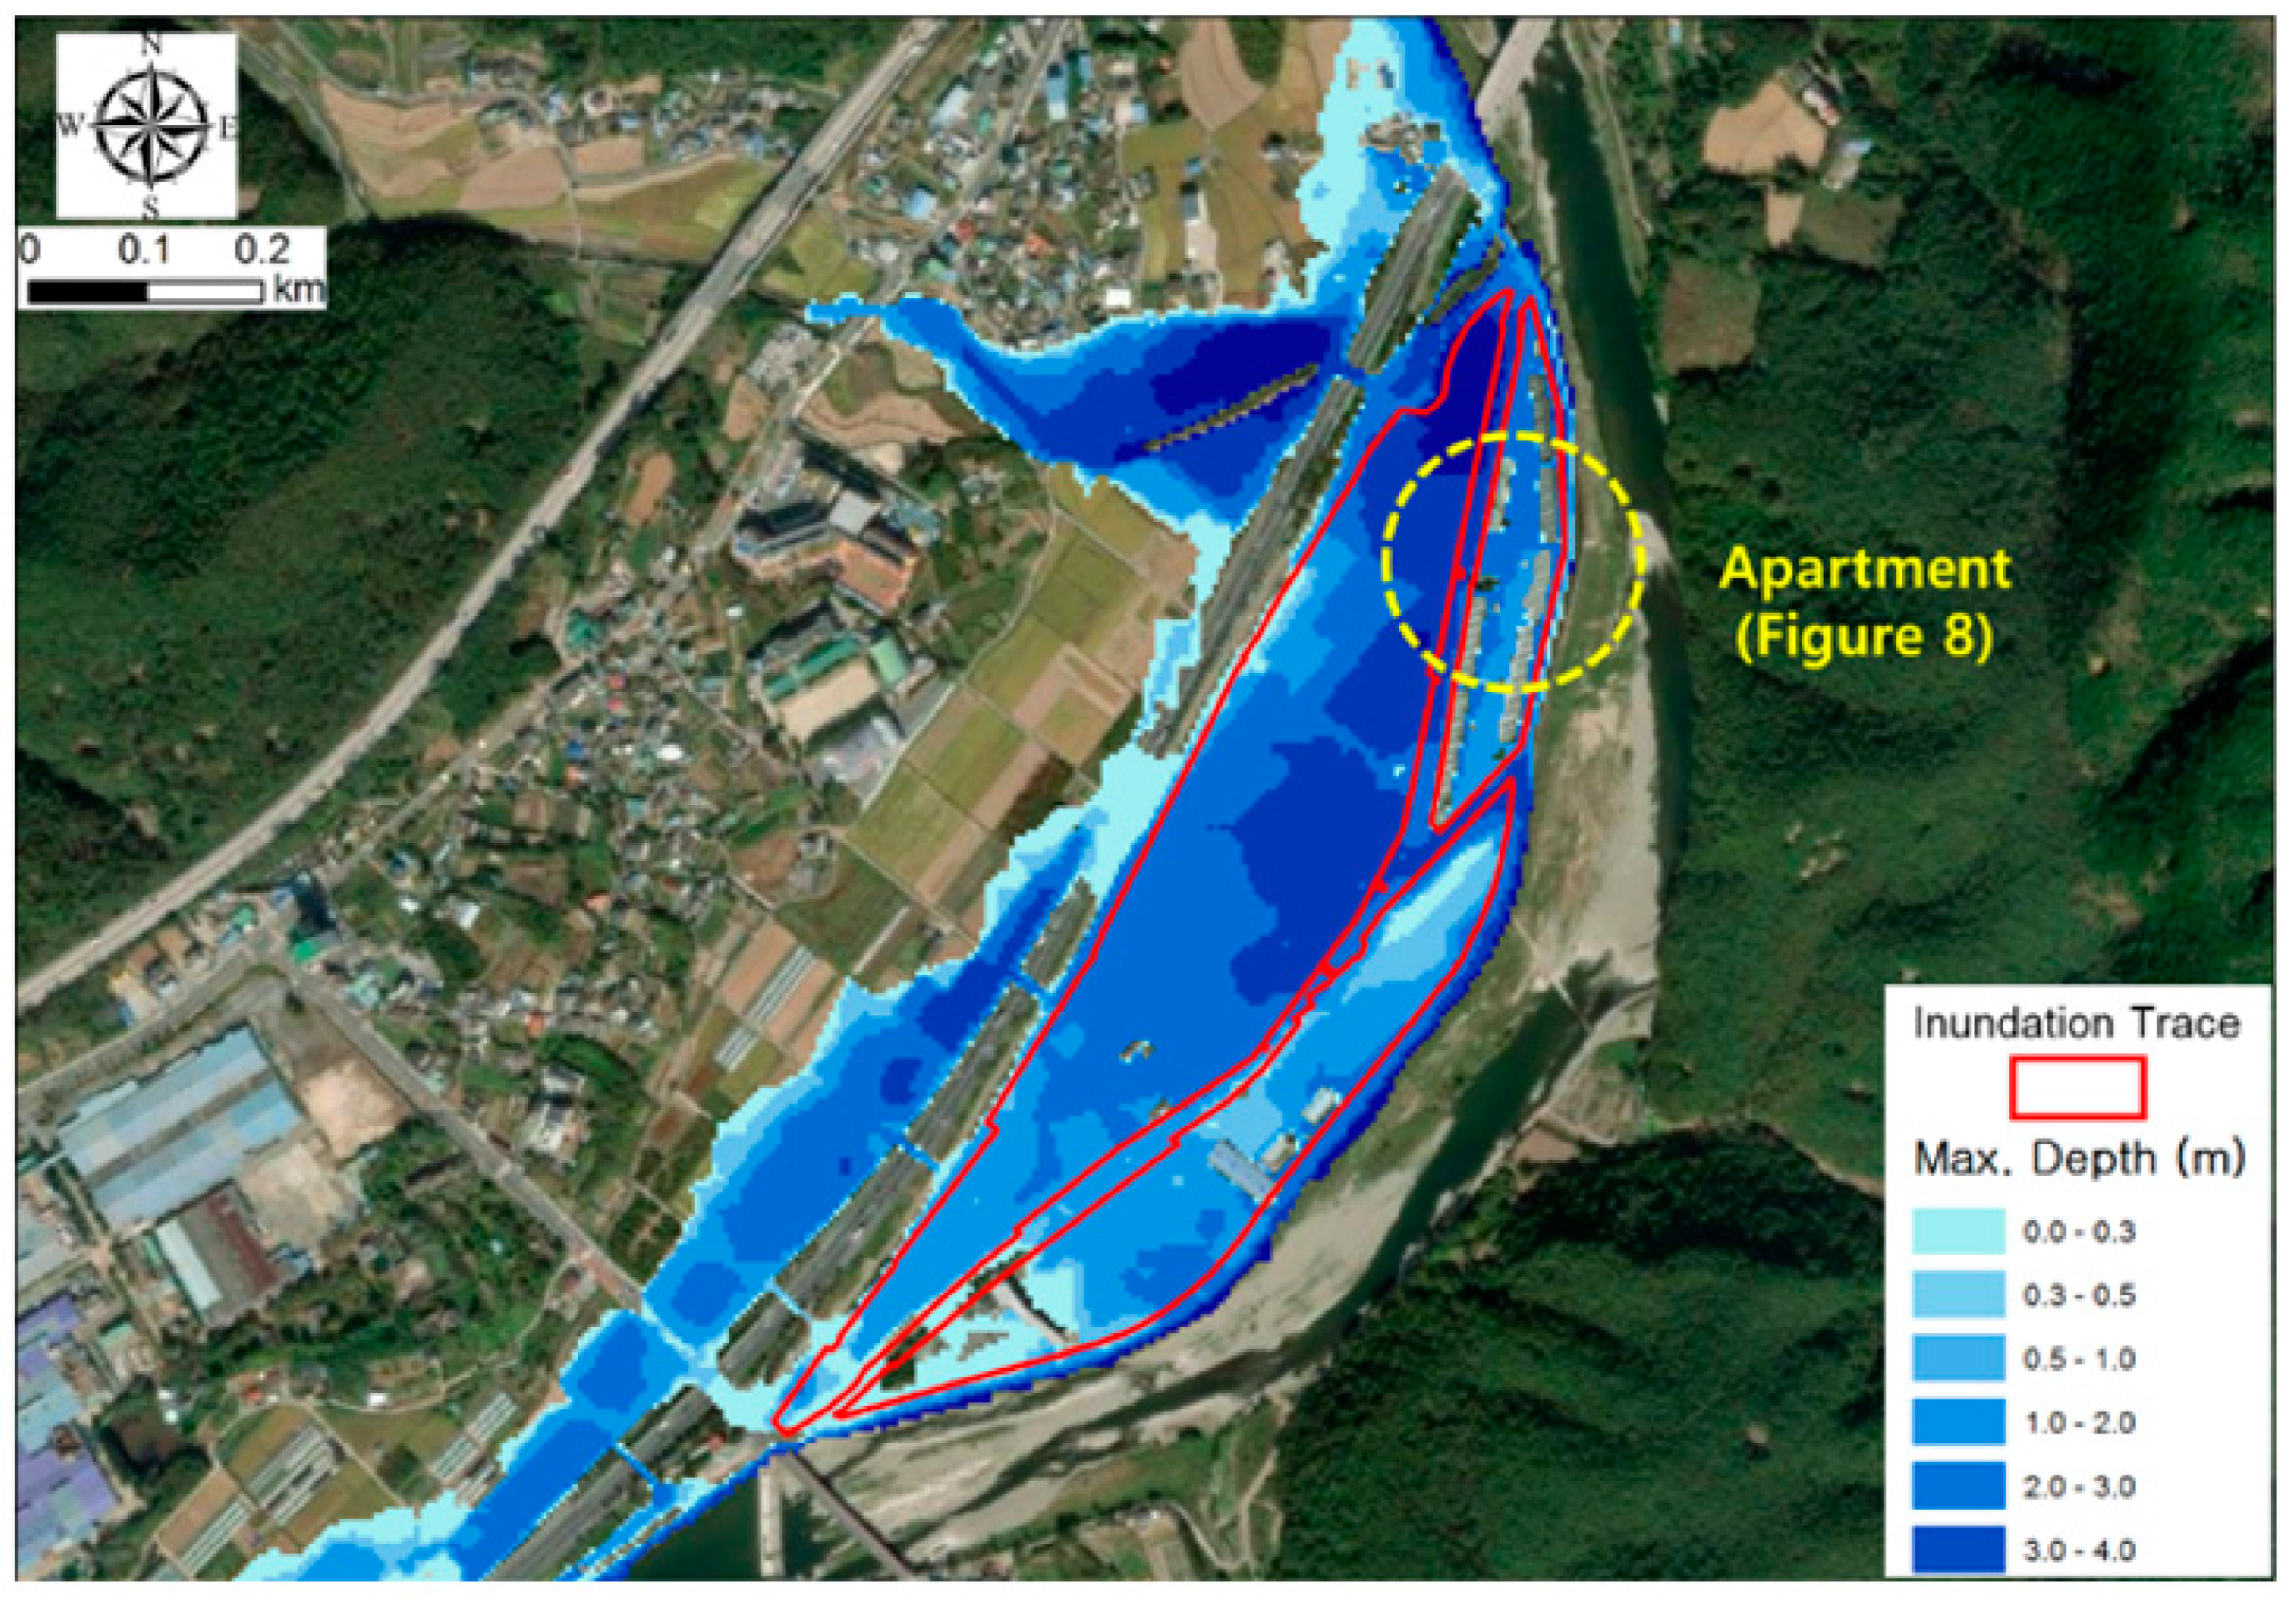
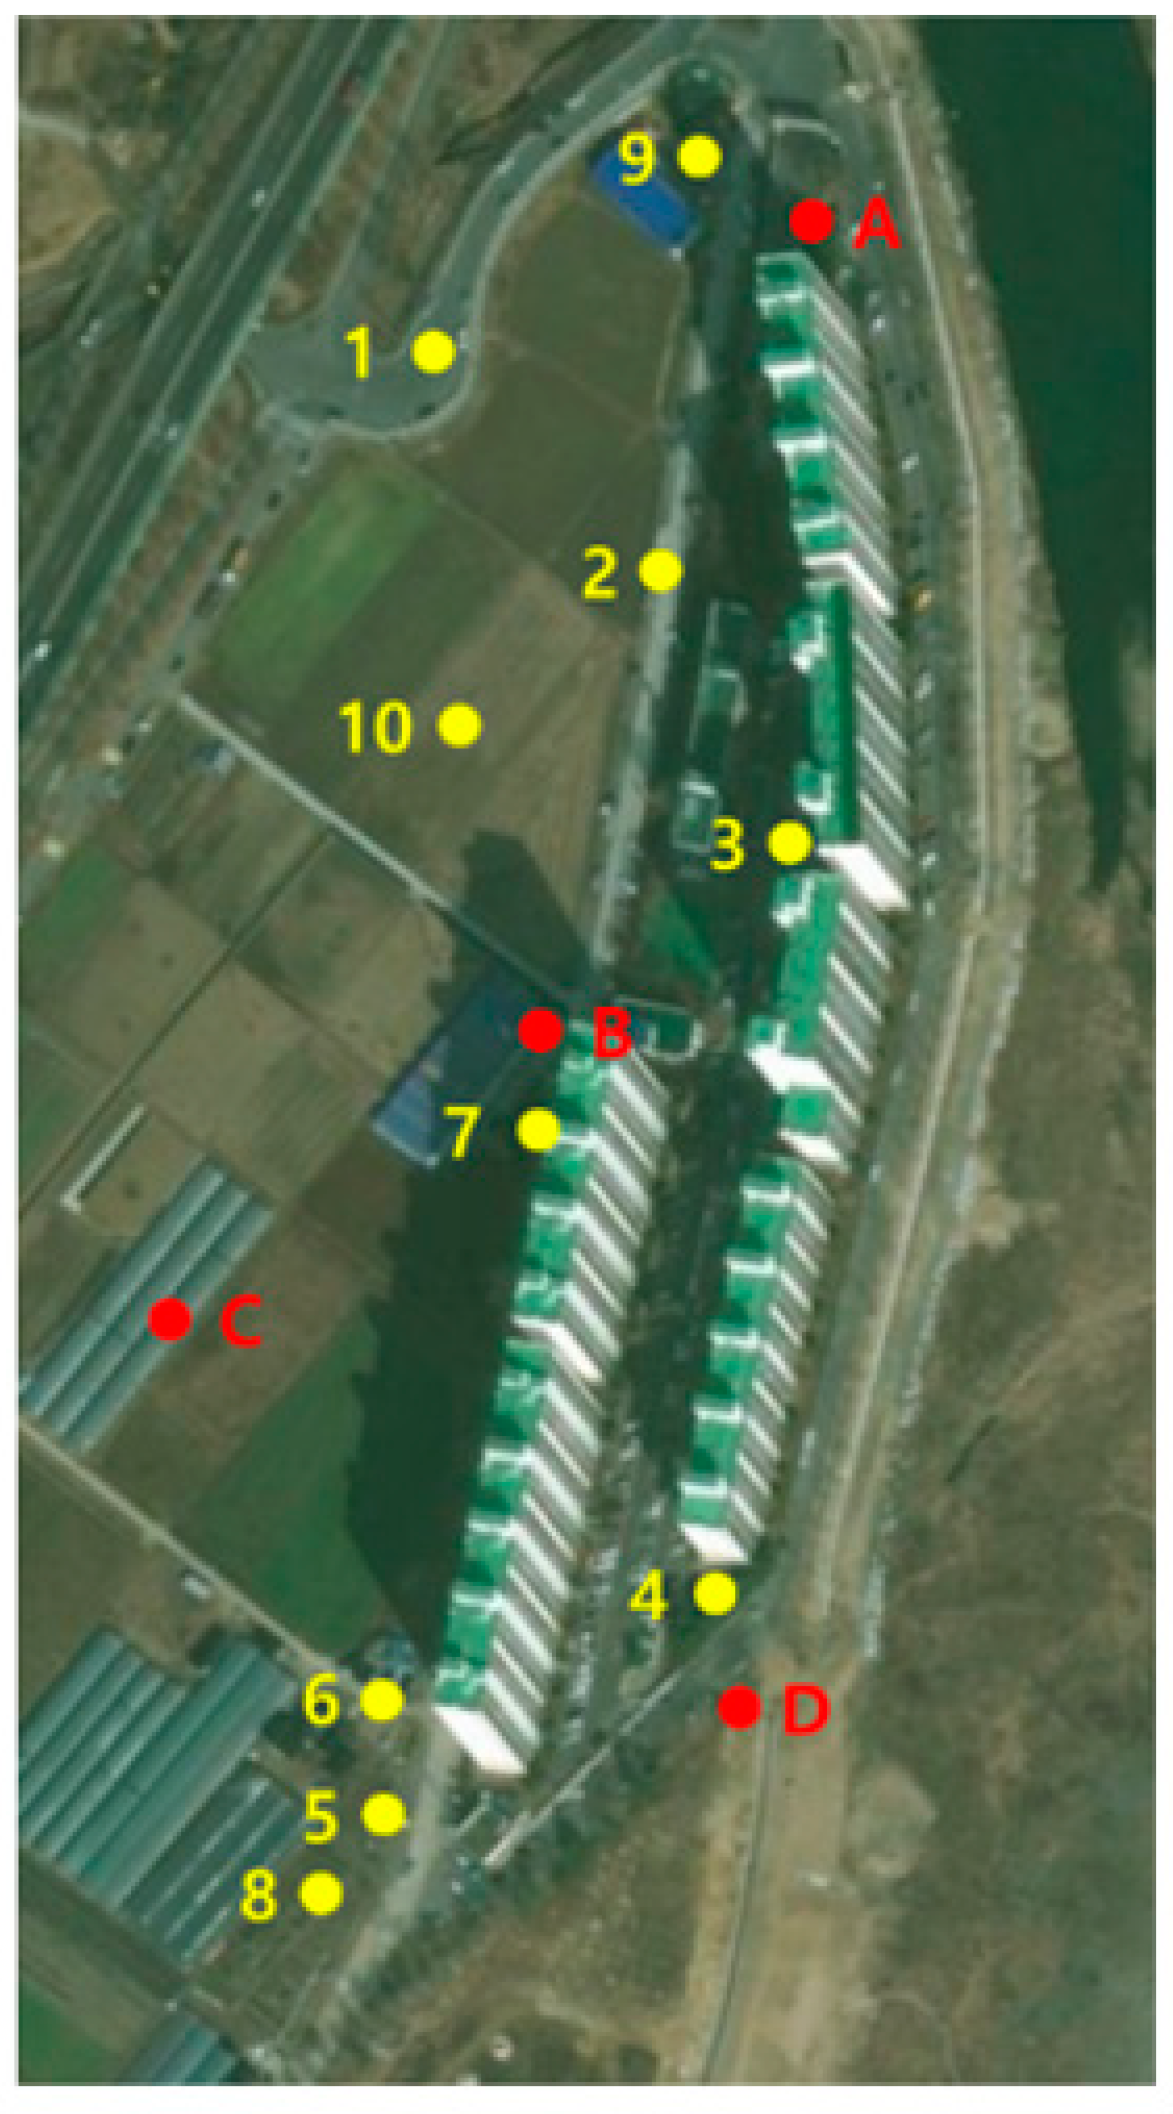
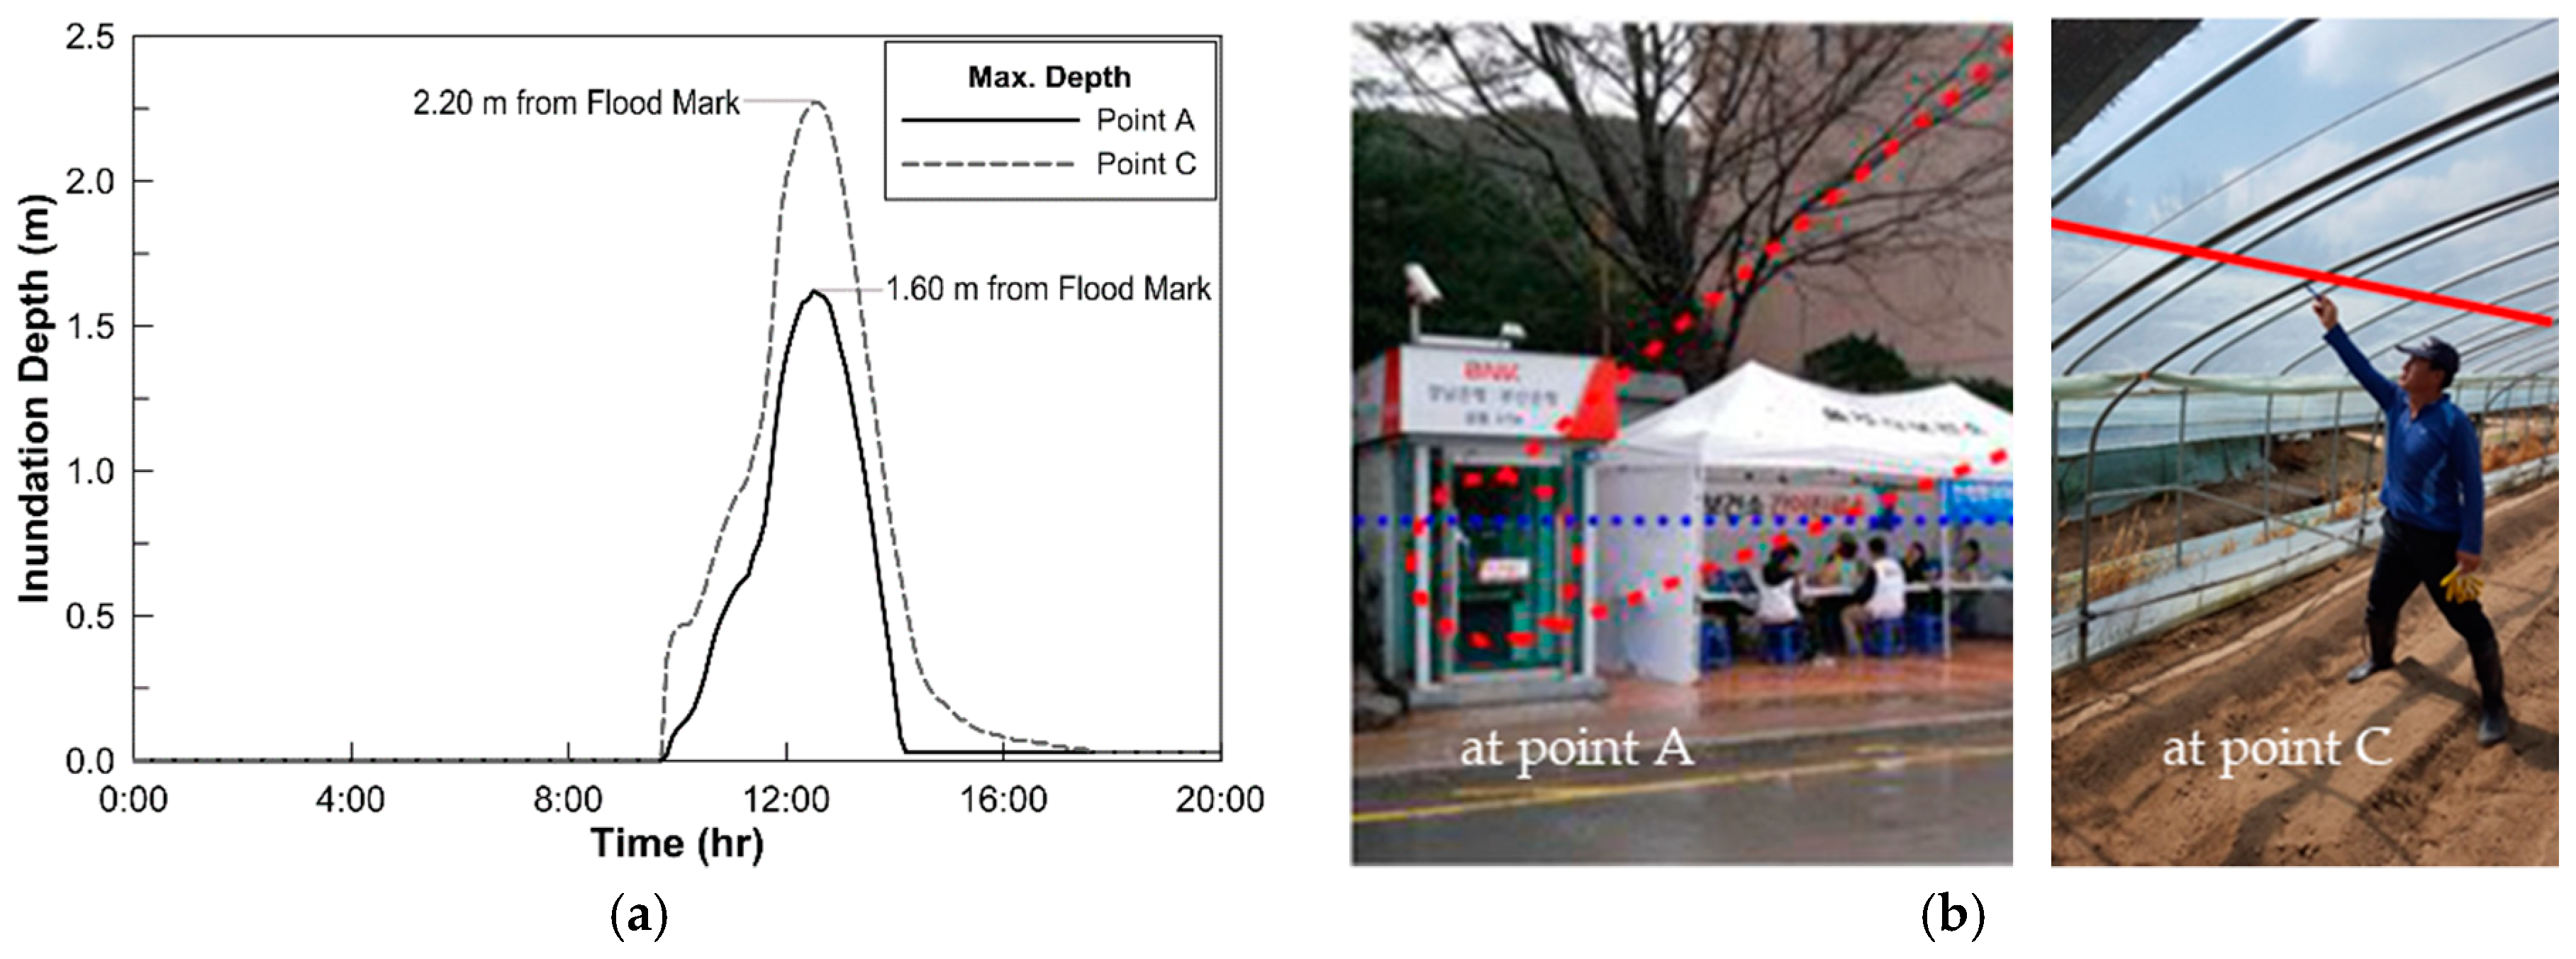
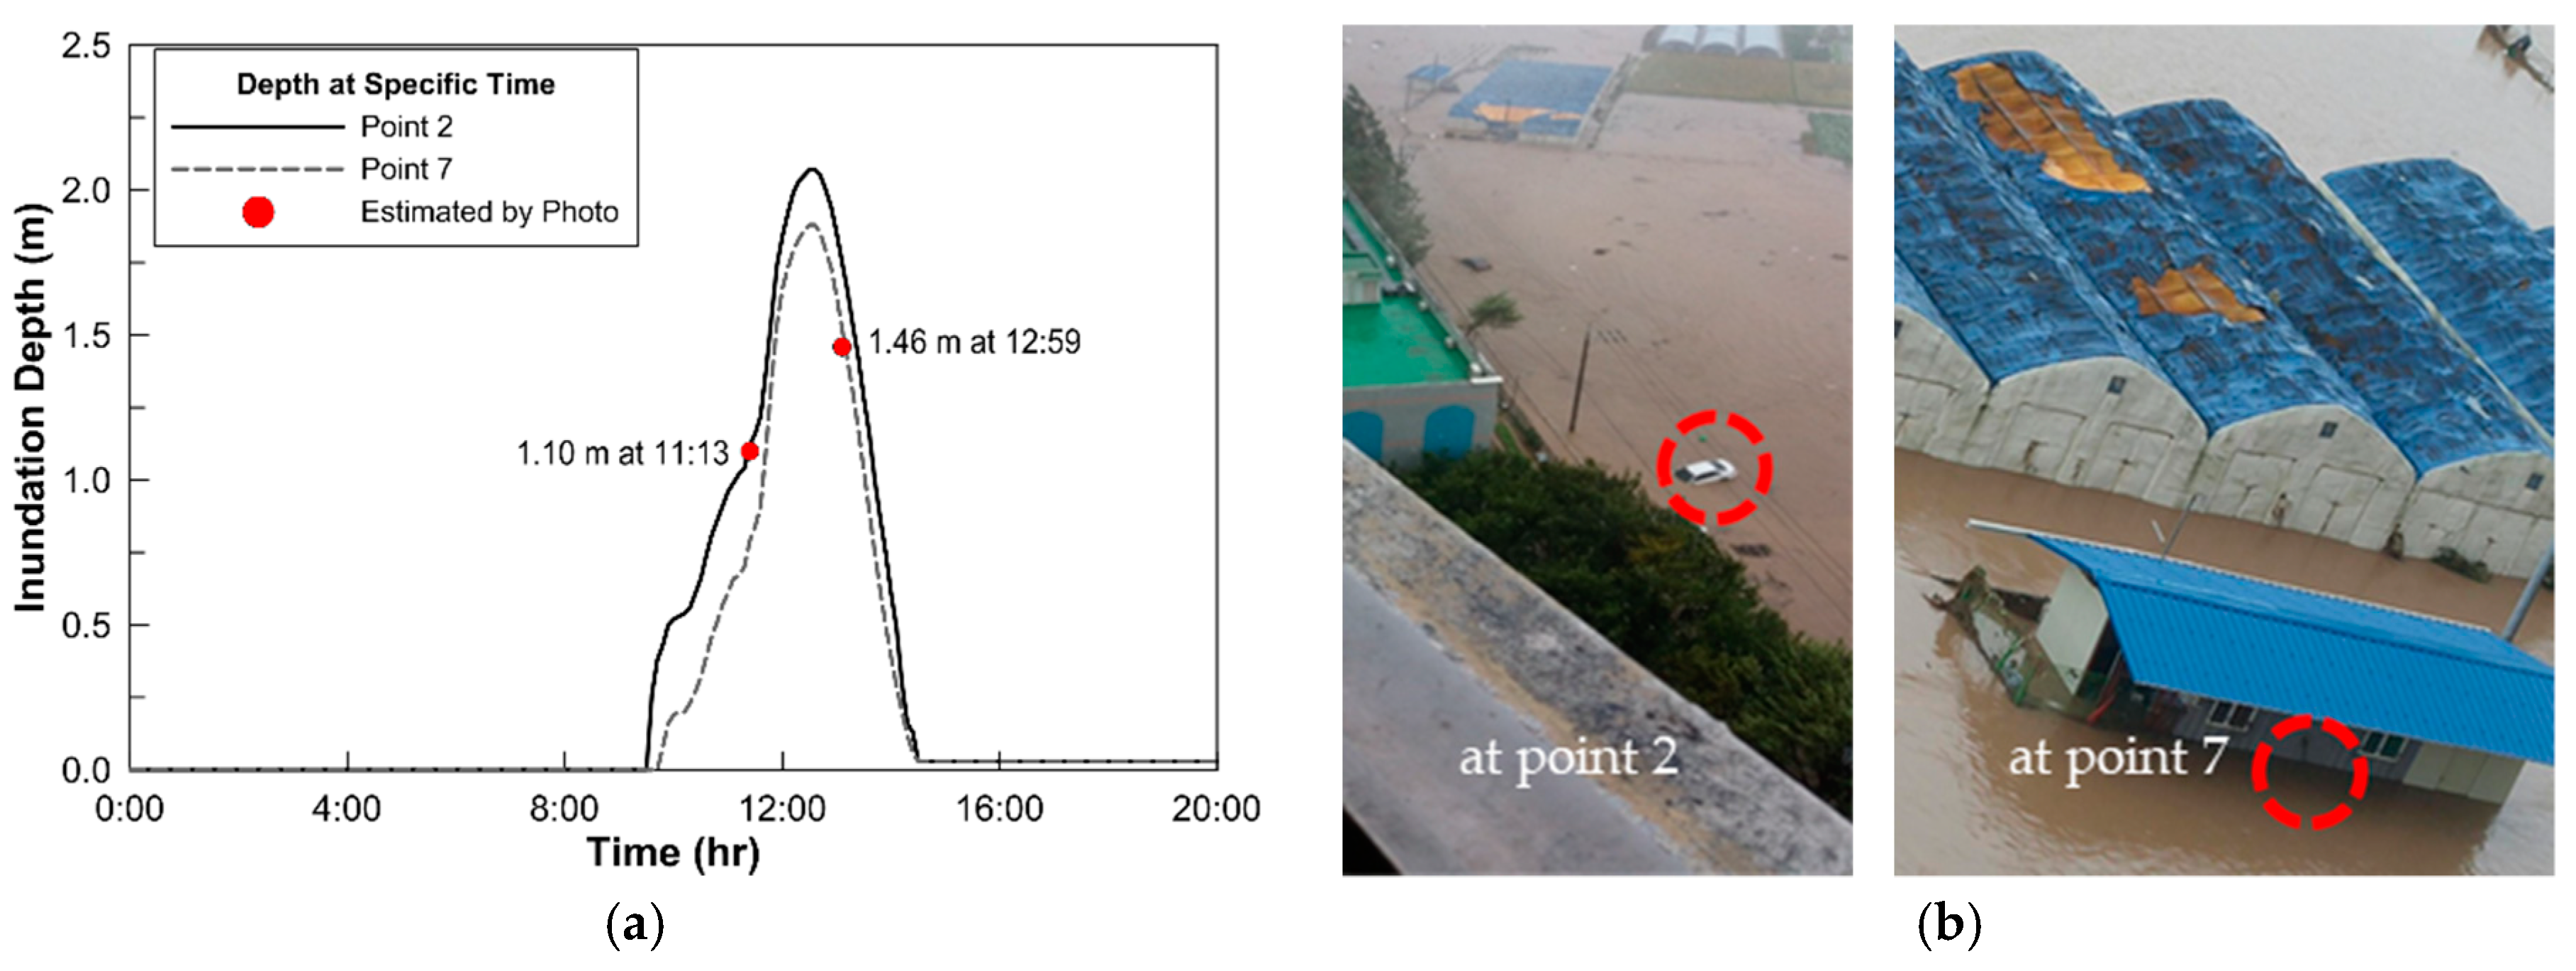
The result of 2D flood model verification presents that the maximum flood depth and flood extent around the apartment (Figure 5) are in good agreement with field surveyed ones as shown in Figure 7. For more accurate verification, the maximum flood depth at 4 (A to D) points and flood depth for a specific time at 10 (1 to 10) points were compared as shown in Figure 8. Figure 9 and Figure 10 present a comparison of the observed maximum depth and flood depth at a specific time with the simulation at 4 representative points among 14 points. Figure 9 shows the maximum depth in points A and C, respectively, while Figure 10 show the flood depth in points 2 and 7 at 11:13 and 12:59 respectively. Table 2 describes the comparison between simulated flood depths and field surveyed ones at 14 points shown in Figure 8. As shown in Table 2, the RMSE for the maximum flood depth was only 0.11 m, and the RMSE for the specific time flood depth was 0.23 m, which was slightly higher than the RMSE for maximum flood depth. However, the RMSE of the 9 points except for point 8 with a large error was 0.15 m, similar to the RMSE of the maximum flood depth. The verification result showed that the applied hydrodynamic and hydrological models well reproduced the flooding situation at the time of Typhoon Chaba, and thus the models were utilized to the database generation of rainfall-runoff–inundation relation.
3.2. Construction of Scenario-Based Database (DB)
For the application of the real-time flood extent prediction method proposed in this study, it is necessary to establish a database on the rainfall-runoff–inundation relationship. To this end, first, 100 rainfall scenarios were created through probability rainfall analysis based on rainfall events in the study area. Flood inundation analysis was performed using HEC-HMS [37], a rainfall-runoff analysis model, HEC-5 [38], a reservoir routing model, and FLO-2D [28], a 2D flood analysis model, based on the 100 rainfall scenarios. The 2D flood analysis considering 100 scenarios yielded a flood depth every 10 min (1/6 h) for a 36-h simulation time, and as a result, 21,600 (100 scenarios × 36 h × 6/h) database records were created for the relationship between rainfall-runoff and flood. Figure 11 presents 6 flood extents and depths out of 216 calculated in the No. 92 scenario with the highest runoff.
3.3. Real-Time Flood Extent Prediction
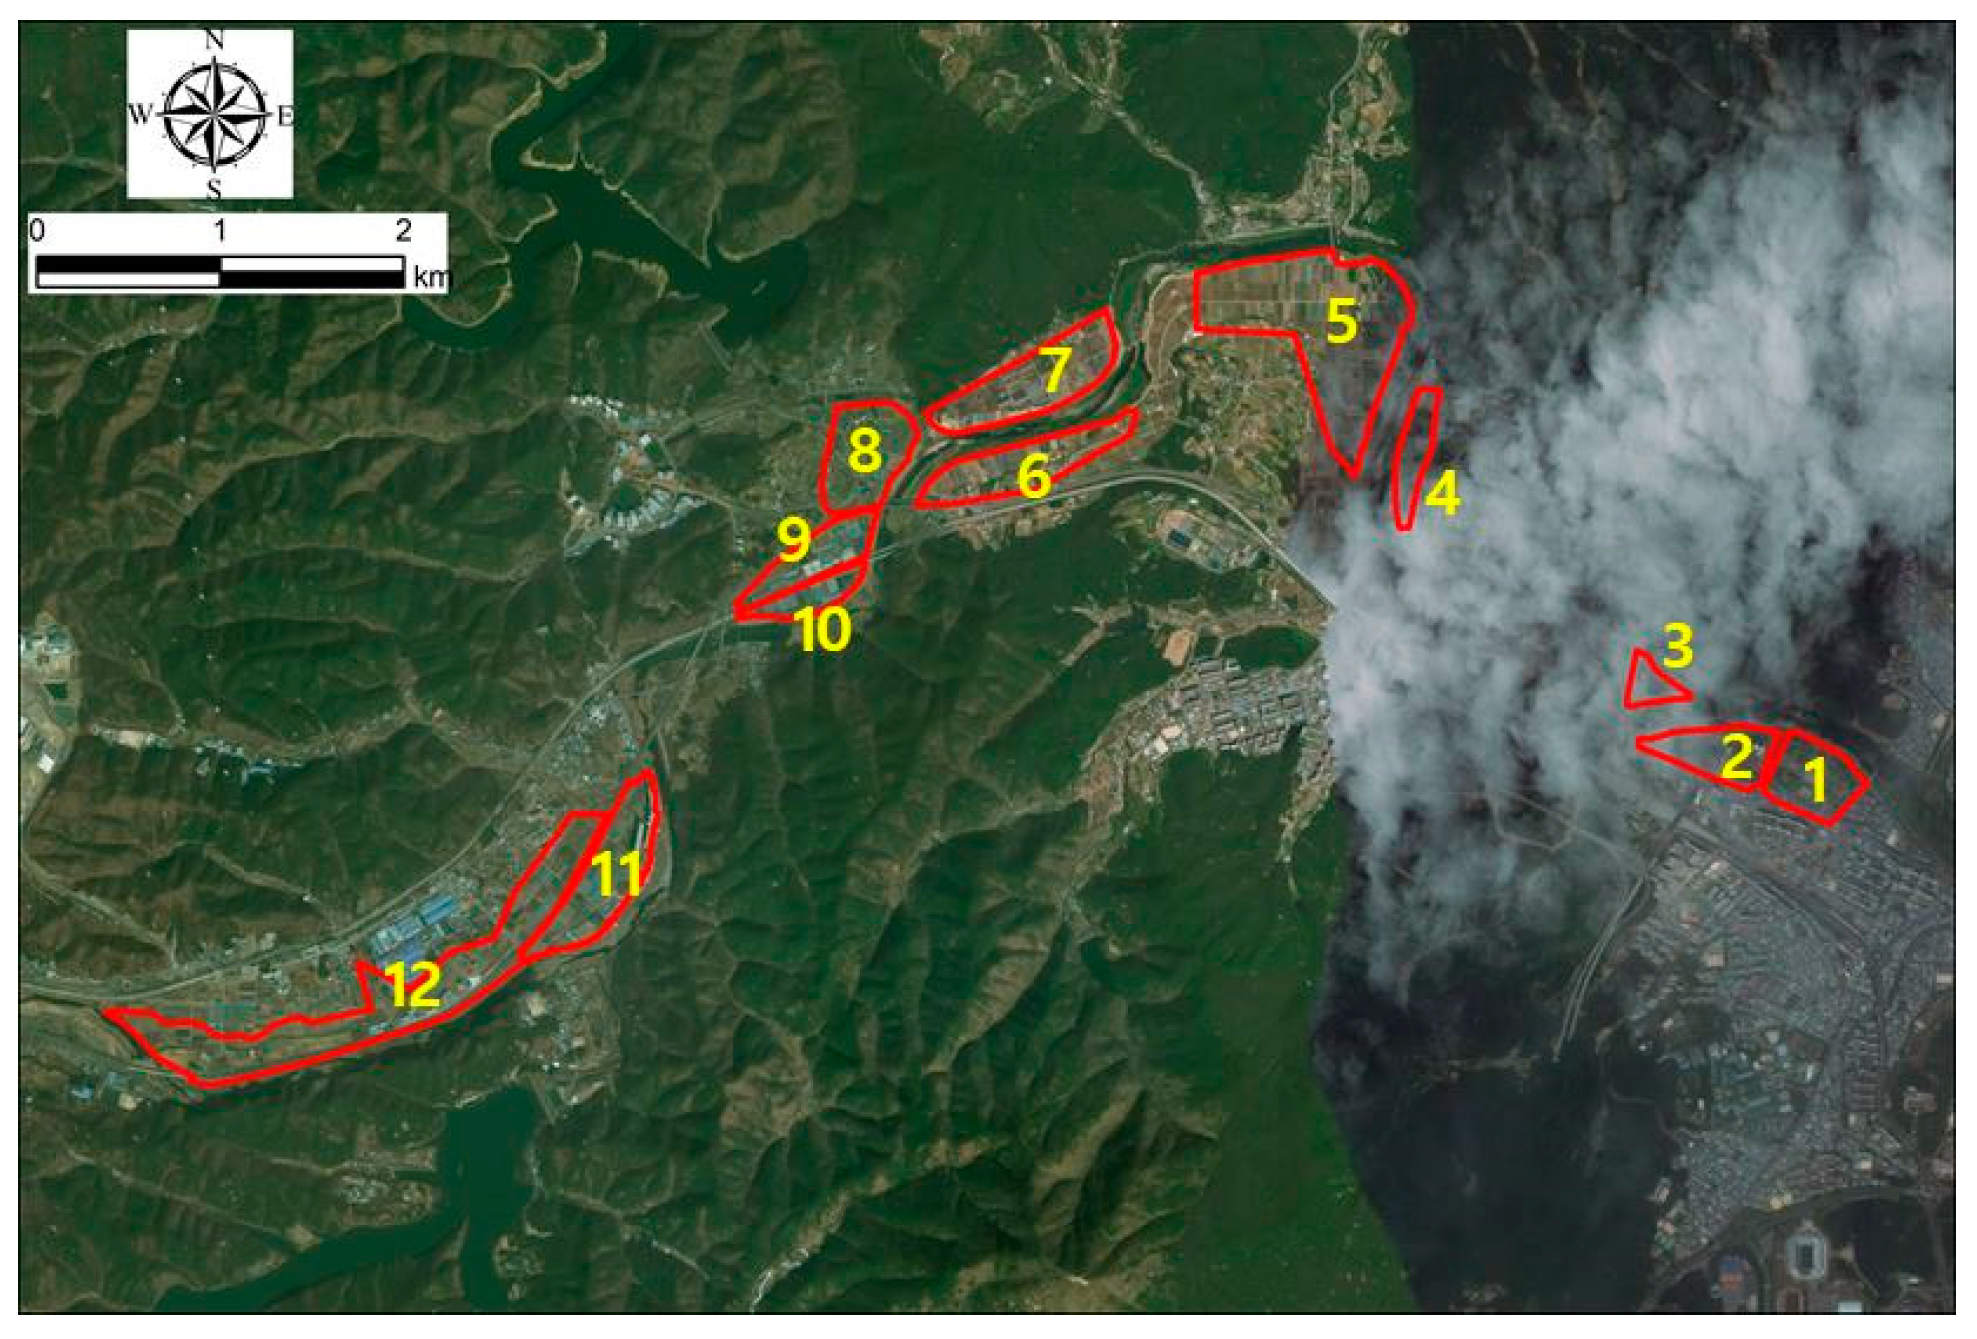
For real-time flood extent prediction, the parameters of the flood probability discriminant (Equation (5)) for the 2D grid were calculated through logistic regression using the previously constructed database (Section 3.2). However, it is inefficient to calculate the parameters of the flood discriminant for the 1,006,216 grids generated in the entire study area. Therefore, the flood-prone areas were selected in the study area using the levee risk analysis proposed by Park et al. [39] to build efficient training data with logistic regression. Figure 12 shows the selected flood-prone areas, and training and prediction were conducted for these areas. The flood probability discriminant of each grid for the selected flood-prone areas was determined as an inundated grid when the flood probability was 0.5 or greater by applying the runoff amount according to the rainfall.
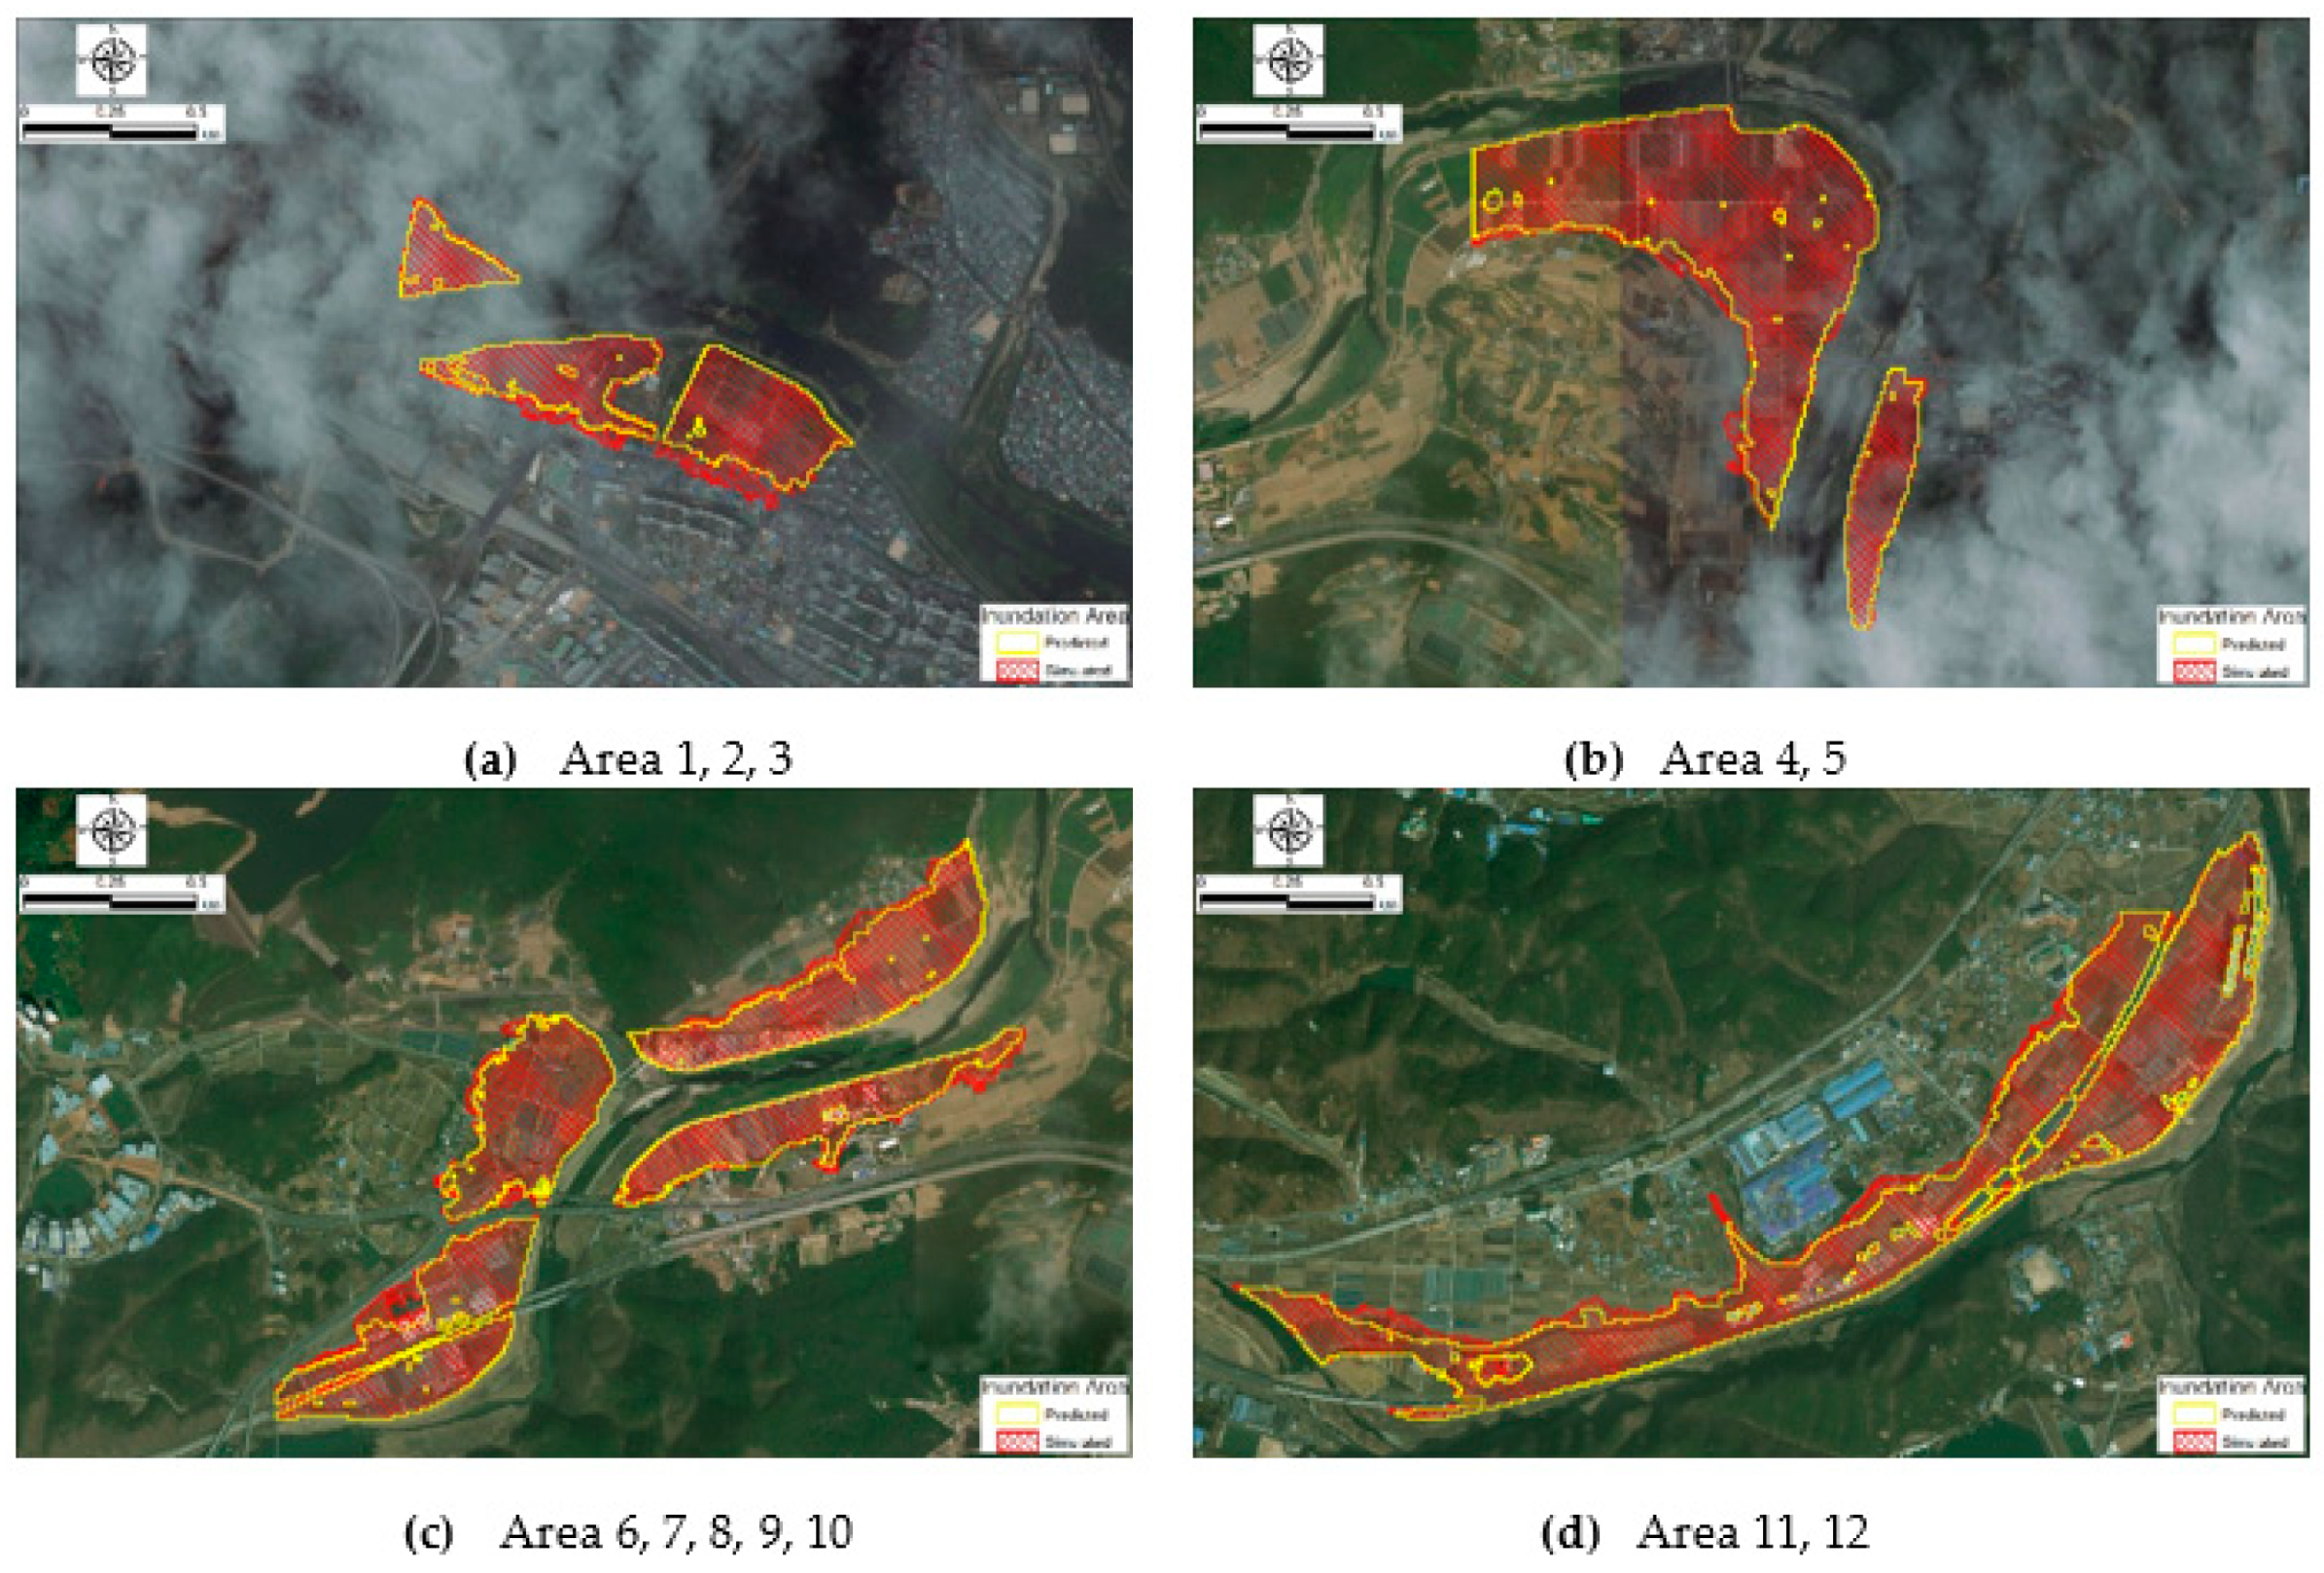
The performance of the real-time flood prediction method proposed in this study was tested by applying scenario rainfall and actual typhoon event. The flood extent from FLO-2D, a physical numerical model, and the one from flood probability discriminant was expressed as simulation and prediction, respectively. The upstream boundary condition of the FLO-2D for the scenario rainfall of No. 92 (Table 1) is shown in Figure 13, and the open condition was applied as the downstream boundary condition. The maximum flood extents of simulation and prediction for scenario No. 92 were represented by red checkered areas and hollow yellow solid lines, respectively, as shown in Figure 14. For quantitative comparison between simulation and prediction, the goodness of fit (G) was calculated by Equation (6). The goodness of fit of the flood extent between the two by scenario rainfall was relatively well-matched with 83.6~98.4%, as shown in Table 3.
where, = FLO-2D simulation, = prediction.
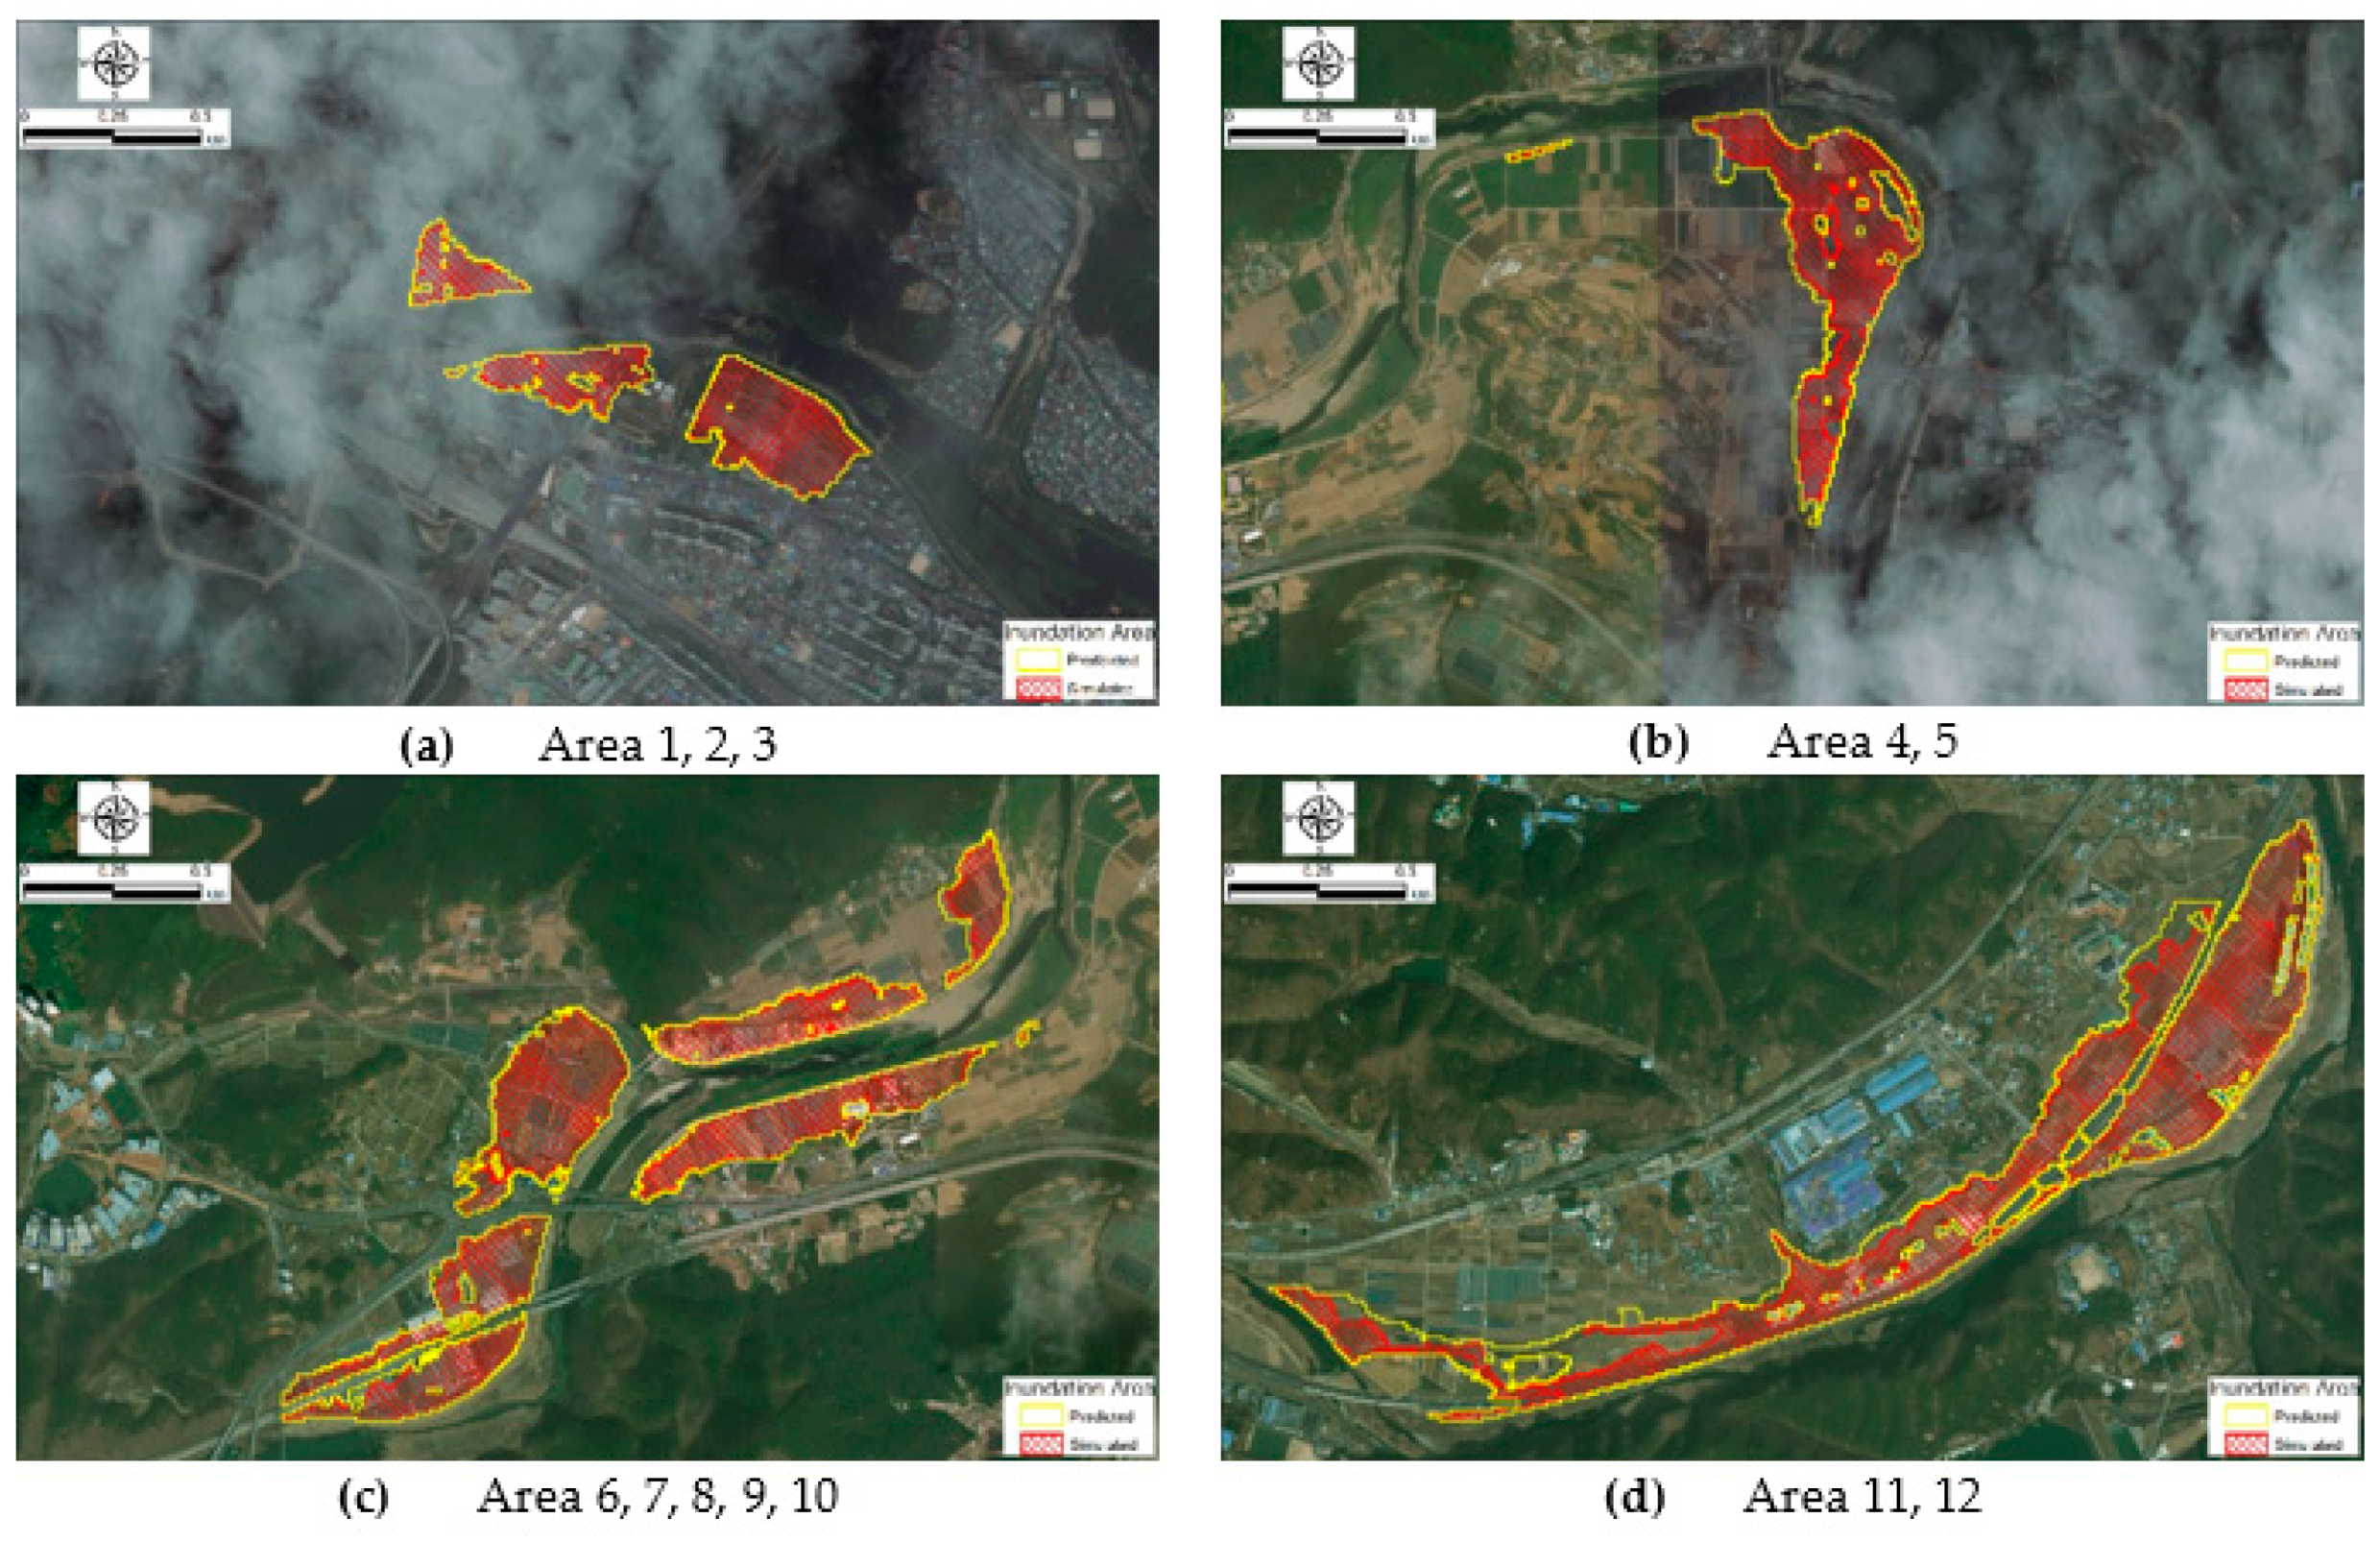
Next, simulation from FLO-2D and prediction from flood discriminant were compared for Typhoon Chaba, which is an actual event. The flood extent and goodness of fit between simulation and prediction were compared and shown in Figure 15 and Table 3, respectively. The fit of flood extent between simulation and prediction was 74.4~99.1%, which was relatively well-matched as in the case of rainfall scenario, and area 4 (Figure 12) did not cause flooding in both cases.
4. Discussion
The real-time flood extent prediction method proposed in this study has the strength of reducing the time required for 2D flood analysis while maintaining accuracy by utilizing the database built in advance. In other words, the flood extent prediction, which took more than 100 min for the hydrological–hydrodynamic model, was able to predict accurately and quickly within 30 s by the proposed method. Therefore, this method is expected to make a significant contribution to securing sufficient lead time when establishing an evacuation plan for reducing flood damage.
The proposed method creates a unique regression equation that considers regional characteristics using a database built with scenario rainfall and hydraulic and hydrological models. Unfortunately, this regression cannot be applied to other areas. In order to predict flooding in other areas, it is necessary to create a regression equation suitable for the area through the process of constructing the database shown in this study. This process includes verifying the numerical model and constructing a database on the rainfall-runoff–inundation relationship for the scenario rainfall using the numerical model. Real-time flooding range prediction is possible by calculating the coefficients of the logistic regression equation for each grid using this database.
In areas with a climate where rainfall has concentrated in summer, such as in Korea, a database using probability rainfall as a scenario rainfall was useful, but further studies are needed to determine whether it is effective in areas with other climate characteristics.
Since the proposed method does not consider tributary inflow in the flood probability discriminant, its accuracy may be limited in application to large river basins with a lot of inflow from a tributary. However, after the Four Rivers Project, most floods in Korea have occurred in small and medium-sized rivers such as the study area, not in the large rivers, so this method is expected to be effectively applied to flood defense in Korea. In addition, to solve the limitation of the application of this study to the large river, the future study is to add multiple variables such as Jung et al. [18] instead of single variables (Equation (1)) to the logistic regression equation to enable efficient and accurate flood prediction in the large river.
In addition, in this study, the inundation cutoff value of the grid was applied as 0.5, but if this value is varied depending on the importance of the region, another result may be obtained. For example, if a criterion lower than 0.5 is applied for areas with large populations or major SOC facilities, the flood extent can be predicted earlier, which can increase lead time for evacuation.
5. Conclusions
This study proposes a real-time flood extent prediction method using logistic regression. This method pre-establishes a database of rainfall-runoff–inundation relationships in the study area based on 100 rainfall scenarios, and quickly and accurately predicts the flood extent according to the rainfall size by determining the flood probability for each grid. The results of this study were summarized as follows.
- (1)
- The hydrological and hydrodynamic models used in this study were verified using Typhoon Chaba, which caused great damage to the study area in 2016. For the 2D flood inundation analysis in the study area, the grids of FLO-2D were created considering detailed topography including buildings, roads, and culverts, and the runoff calculated by HEC-HMS was applied as the boundary condition of FLO-2D. The mean RMSE of maximum flood depth between simulation and measurement was 0.11 m and the RMSE of flood depth over time evolution was 0.23 m, which presented good overall agreement.
- (2)
- The more past flooding records, including the flood extent, the more reliable and accurate the flood probability discriminant using logistic regression. However, structural flood defense measures are well established in areas that are vulnerable to flooding or areas that have suffered flood damage in the past, which makes it difficult to obtain flood data for various rainfall events. The study area is also a place with few historical flood data described above. Therefore, in this study, the relationship of rainfall-runoff–inundation based on the probability rainfall scenarios was used instead of the actual flood extent. That is, this study constructed a rainfall-runoff–inundation relationship database based on 100 rainfall scenarios consisting of a combination according to the return period, duration, and time distribution of rainfall for the hydrological and hydrodynamic model verified for the study area.
- (3)
- In the flood probability discriminant for each grid using rainfall-runoff as input data, p = 0.5 was used to distinguish between flooding and non-flooding. As a result of predicting the flood extent for rainfall scenario and actual rainfall event, the goodness of fit between the proposed method and the 2D physical flood inundation model was high at 83.6~98.4 and 74.4~99.1%, respectively. In addition, the proposed method was able to predict quickly in less than 30 s to derive the expected flood extent by using only the rainfall versus relationship database of rainfall-runoff–inundation instead of flooding analysis using a 2D physical model.
- (4)
- Therefore, the real-time flood extent prediction method proposed in this study is able to help to provide fast and reliable flood information to decision-makers, and it is expected that residents in the flooded area can secure sufficient lead time for flood preparation and evacuation planning.
Author Contributions
Conceptualization and Methodology, J.L. and B.K.; validation, J.L.; writing—original draft preparation, J.L.; writing—review and editing, B.K. All authors have read and agreed to the published version of the manuscript.
Funding
This work was supported by the National Research Foundation of Korea (NRF) grant funded by the Korea government (MOE) (NRF-2020R1I1A3074459).
Institutional Review Board Statement
Not applicable.
Informed Consent Statement
Not applicable.
Acknowledgments
This work was supported by NRF (2020R1I1A3074459). The authors wish to thank H.I. Kim and K.Y. Han for their technical support and valuable comments.
Conflicts of Interest
The authors declare no conflict of interest.
References
- Huang, Y. Rapid flood risk assessment using GIS technology. Int. J. River Basin Manag. 2009, 7, 3–14. [Google Scholar] [CrossRef]
- Leedal, D.; Neal, J.; Beven, K.; Young, P.; Bates, P. Visualization approaches for communicating real-time flood forecasting level and inundation information. J. Flood Risk Manag. 2010, 3, 140–150. [Google Scholar] [CrossRef]
- Kalyanapu, A.J.; Shankar, S.; Pardyjak, E.R.; Judi, D.R.; Burian, S.J. Assessment of GPU computational enhancement to a 2D flood model. Environ. Model. Softw. 2011, 26, 1009–1016. [Google Scholar] [CrossRef]
- Kim, Y.S.; Tachikawa, Y.; Kim, S.M.; Shiiba, M.; Yorozu, K.; Noh, S.J. Short term prediction of water level and discharge using a 2d dynamic wave model with particle filters. J. Jpn. Soc. Civ. Eng. 2012, 68, 25–30. [Google Scholar] [CrossRef] [Green Version]
- Horritt, M.S.; Bates, P.D. Evaluation of 1D and 2D numerical models for predicting river flood inundation. J. Hydrol. 2002, 268, 87–99. [Google Scholar] [CrossRef]
- Liang, Q.; Du, G.; Hall, J.W.; Borthwick, A.G.L. Flood inundation modeling with an adaptive quadtree grid shallow water equation solver. J. Hydraul. Eng. 2008, 134, 1603–1610. [Google Scholar] [CrossRef]
- Kim, B.H.; Sanders, B.F.; Schubert, J.E.; Famiglietti, J.S. Mesh type tradeoffs in 2D hydrodynamic modeling of flooding with a godunov-based flow solver. Adv. Water Resour. 2014, 68, 42–61. [Google Scholar] [CrossRef] [Green Version]
- Chang, L.C.; Shen, H.Y.; Wang, Y.F.; Huang, J.Y.; Lin, Y.T. Clustering-based hybrid inundation model for forecasting flood inundation depth. J. Hydrol. 2010, 385, 257–268. [Google Scholar] [CrossRef]
- Chung, C.H.; Chiang, Y.M.; Chang, F.J. A Spatial neural fuzzy network for estimating pan evaporation at ungauged sites. Hydrol. Earth Syst. Sci. 2012, 255, 255–266. [Google Scholar] [CrossRef] [Green Version]
- Pan, T.Y.; Lai, J.S.; Chang, T.J.; Chang, H.K.; Chang, K.C.; Tan, T.C. Hybrid neural networks in rainfall-inundation forecasting based on a synthetic potential inundation database. Nat. Hazard. Earth Syst. Sci. 2011, 11, 771–787. [Google Scholar] [CrossRef]
- Chang, L.C.; Shen, H.Y.; Chang, F.J. Regional flood inundation nowcast using hybrid SOM and dynamic neural networks. J. Hydrol. 2014, 519, 476–489. [Google Scholar] [CrossRef]
- Nayak, P.C.; Sudheer, K.P.; Rangan, D.M.; Ramasastri, K.S. Short-term flood forecasting with a neuro-fuzzy model. Water Resour. Res. 2005, 41, W04004. [Google Scholar] [CrossRef] [Green Version]
- Oh, J.W.; Park, J.H.; Kim, Y.K. Missing hydrological data estimation using neural network and real time data reconciliation. J. Korea Water Resour. Assoc. 2008, 41, 1059–1065. [Google Scholar] [CrossRef] [Green Version]
- Toth, E. Classification of hydro-meteorological conditions and multiple artificial neural networks for stream forecasting. Hydrol. Earth Syst. 2009, 13, 1555–1566. [Google Scholar] [CrossRef] [Green Version]
- Chang, F.J.; Chen, P.A.; Lu, Y.R.; Huang, E.; Chang, K.Y. Real-time multi-step-ahead water level forecasting by recurrent neural networks for urban flood control. J. Hydrol. 2014, 517, 836–846. [Google Scholar] [CrossRef]
- Jhong, B.C.; Wang, J.H.; Lin, G.F. An integrated two-stage support vector machine approach to forecast inundation maps during typhoons. J. Hydrol. 2017, 547, 236–252. [Google Scholar] [CrossRef]
- Kim, H.I.; Keum, H.J.; Han, K.Y. Application and comparison of dynamic artificial neural networks for urban inundation analysis. J. Korean Soc. Civ. Eng. 2018, 38, 671–683. [Google Scholar]
- Jung, M.K.; Kim, J.G.; Kwon, H.H. The probabilistic estimation of inundation region using multiple logistic regression analysis. In Proceedings of the KSCE 2019 Conference, Pyeongchang, Korea, 16–18 October 2019. [Google Scholar]
- Radkov, M.; Yordanova, A. Application of the regression analysis in the water supply forecast. In Proceedings of the BALWOIS 2008, Ohrid, Macedonia, 27–31 May 2008. [Google Scholar]
- Song, J.H.; Her, Y.; Suh, K.; Kang, M.S.; Kim, H.K. Regionalization of a rainfall-runoff model: Limitations and potentials. Water 2019, 11, 2257. [Google Scholar] [CrossRef] [Green Version]
- Araghinejad, S. Data-Driven Modeling: Using MATLAB in Water Resources and Environmental Engineering; Springer: Dordrecht, The Netherlands, 2014; pp. 73–78. [Google Scholar]
- Ministry of Land, Transport and Maritime (MLTM). Guideline of Design Flood Estimation; MLTM: Sejong, Korea, 2012. [Google Scholar]
- Ulsan Metropolitan City (UMC). Taehwa River Basic Plan; UMC: Ulsan, Korea, 2009. [Google Scholar]
- National Spatial Data Infrastructure Portal. Available online: http://www.nsdi.go.kr (accessed on 16 January 2018).
- Nakdong River Flood Control Office. Available online: http://www.nakdongriver.go.kr (accessed on 16 January 2018).
- Ministry of Construction & Transportation (MOCT). Dae-am Flood Control. Capability Improvement Project; MOCT: Seoul, Korea, 2005. [Google Scholar]
- My Water. Available online: http://www.water.or.kr (accessed on 16 January 2018).
- O’Brien, J.S. FLO-2D Reference Manual; FLO-2D Software: Nutrioso, AZ, USA, 2016. [Google Scholar]
- Sole, A.; Giosa, L.; Medina, V.; Bateman, A. Flood Risk Modelling with LiDAR Technology. WIT Trans. Ecol. Enviriron. 2008, 118, 27–36. [Google Scholar]
- Annis, A.; Nardi, F.; Petroselli, A.; Apollonio, C.; Arcangeletti, E.; Tauro, F.; Belli, C.; Bianconi, R.; Grimaldi, S. UAV-DEM for small-scale flood hazard mapping. Water 2020, 12, 1717. [Google Scholar] [CrossRef]
- Lee, J.Y.; Han, K.Y.; Keum, H.J.; Ko, H.S. Application of flood prevention measures using detailed topographic data of river and lowland. J. Korean Assoc. G Inf. Stud. 2020, 23, 15–29. [Google Scholar] [CrossRef]
- Petroselli, A.; Vojtek, M.; Vojteková, J. Flood mapping in small ungauged basin: A comparison of different approaches for two case studies in Slovakia. Hydrol. Res. 2019, 50, 379–392. [Google Scholar] [CrossRef] [Green Version]
- Erena, S.H.; Worku, H.; De Paola, F. Flood hazard mapping using FLO-2D and local management strategies of Dire Dawa City, Ethiopia. J. Hyrol. Region. Stud. 2018, 19, 224–239. [Google Scholar] [CrossRef]
- Mattocks, C.; Forbes, C. A real-time, event-triggered storm surge forecasting system for the state of North Carolina. Ocean. Model. 2008, 25, 95–119. [Google Scholar] [CrossRef]
- Floodong Management System. Available online: http://fms.lx.or.kr (accessed on 16 January 2018).
- Ulsan Metropolitan City (UMC). Analysis of Flood Damage in Bancheon Hyundai Apartment in Ulju-Gun; UMC: Ulsan, Korea, 2017. [Google Scholar]
- Scharffenberg, W. HEC-HMS User’s Manual; Hydrology Engineering Center: Davis, CA, USA, 2016. [Google Scholar]
- Hydrology Engineering Center. HEC-5 User’s Manual; HEC: Davis, CA, USA, 1998. [Google Scholar]
- Park, J.H.; Lee, J.Y.; Choi, H.G.; Han, K.Y. Selection of river disaster hazard area for levee risk analysis. J. Korean Soc. Haz. Mitig. 2018, 18, 133–146. [Google Scholar] [CrossRef] [Green Version]
Figure 1.
Flow chart of this study.

Figure 2.
Relationship between rainfall and probability of flooding [21]. (a) Linear regression; (b) Logistic regression.
Figure 2.
Relationship between rainfall and probability of flooding [21]. (a) Linear regression; (b) Logistic regression.

Figure 3.
Prediction process of inundation grid.

Figure 4.
Twelve-hour scenario rainfall per each design period.

Figure 5.
Study area and damage photos.

Figure 6.
Boundary conditions for verification. (a) Upstream discharge and dam outflow; (b) Downstream water level.
Figure 6.
Boundary conditions for verification. (a) Upstream discharge and dam outflow; (b) Downstream water level.

Figure 7.
Comparison of inundation area near apartments [35].
Figure 7.
Comparison of inundation area near apartments [35].

Figure 8.
Verification points.

Figure 9.
Maximum flood depth: (a) comparison of observations and simulations and (b) photos at the point [36].
Figure 9.
Maximum flood depth: (a) comparison of observations and simulations and (b) photos at the point [36].

Figure 10.
Flood depth at specific time: (a) comparison of observations and simulations (b) photos at the time [36].
Figure 10.
Flood depth at specific time: (a) comparison of observations and simulations (b) photos at the time [36].

Figure 11.
Flood extent and depth over time evolution for the No. 92h scenario (see Table 1).
Figure 11.
Flood extent and depth over time evolution for the No. 92h scenario (see Table 1).

Figure 12.
Location of selected flood-prone areas.

Figure 13.
Discharge based on scenario rainfall.

Figure 14.
Comparison of inundation area (scenario).

Figure 15.
Comparison of inundation area (Typhoon Chaba).


Table 1.
One-hundred created rainfall scenarios.
| Scenario No. | Return Period (years) | Duration (h) | Time Distribution |
|---|---|---|---|
| 1 | 200 | 3 | Huff 1st quartile |
| 2 | 200 | 3 | Huff 2nd quartile |
| 3 | 200 | 3 | Huff 3rd quartile |
| 4 | 200 | 3 | Huff 4th quartile |
| ⋮ | ⋮ | ⋮ | ⋮ |
| 92 | 1000 | 12 | Huff 4th quartile |
| ⋮ | ⋮ | ⋮ | ⋮ |
| 100 | 1000 | 24 | Huff 4th quartile |
Table 2.
Comparison of observations and simulations at the points shown in Figure 8.
Table 2.
Comparison of observations and simulations at the points shown in Figure 8.
| Max. Flood Depth (m) | Flood Depth at Specific Time (m) | |||||||||
|---|---|---|---|---|---|---|---|---|---|---|
| Pts. | Meas. | Sim. | Pts. | Time | Meas. | Sim. | Pts. | Time | Meas. | Sim. |
| A | 1.60 | 1.62 | 1 | 11:13 | 0.50 | 0.72 | 6 | 12:31 | 1.14 | 1.21 |
| B | 2.23 | 2.36 | 2 | 11:13 | 1.10 | 1.10 | 7 | 12:59 | 1.46 | 1.52 |
| C | 2.20 | 2.27 | 3 | 11:51 | 0.98 | 0.98 | 8 | 12:59 | 0.58 | 1.13 |
| D | 2.00 | 2.17 | 4 | 12:02 | 0.67 | 0.67 | 9 | 14:11 | 0.50 | 0.30 |
| 5 | 12:31 | 1.40 | 1.75 | 10 | 14:44 | 0.70 | 0.70 | |||
| RMSE = 0.11 m | RMSE = 0.23 m | |||||||||
Table 3.
Goodness of fit (G) of flood extent.
| Area | G (%) | Area | G (%) | ||
|---|---|---|---|---|---|
| Scenario | Chaba | Scenario | Chaba | ||
| 1 | 87.1 | 99.1 | 7 | 91.8 | 90.6 |
| 2 | 83.9 | 89.8 | 8 | 93.0 | 97.0 |
| 3 | 93.3 | 93.7 | 9 | 83.6 | 92.0 |
| 4 | 96.7 | - | 10 | 95.5 | 90.6 |
| 5 | 94.5 | 82.3 | 11 | 98.4 | 98.7 |
| 6 | 89.5 | 94.8 | 12 | 85.3 | 74.4 |
Publisher’s Note: MDPI stays neutral with regard to jurisdictional claims in published maps and institutional affiliations. |
© 2021 by the authors. Licensee MDPI, Basel, Switzerland. This article is an open access article distributed under the terms and conditions of the Creative Commons Attribution (CC BY) license (https://creativecommons.org/licenses/by/4.0/).
Share and Cite
MDPI and ACS Style
Lee, J.; Kim, B. Scenario-Based Real-Time Flood Prediction with Logistic Regression. Water 2021, 13, 1191. https://doi.org/10.3390/w13091191
AMA Style
Lee J, Kim B. Scenario-Based Real-Time Flood Prediction with Logistic Regression. Water. 2021; 13(9):1191. https://doi.org/10.3390/w13091191
Chicago/Turabian StyleLee, Jaeyeong, and Byunghyun Kim. 2021. "Scenario-Based Real-Time Flood Prediction with Logistic Regression" Water 13, no. 9: 1191. https://doi.org/10.3390/w13091191
Note that from the first issue of 2016, this journal uses article numbers instead of page numbers. See further details here.