
Multiple-Stressor Interactions in Tributaries Alter Downstream Ecosystems in Stream Mesocosm Networks


1
Centro para la Investigación en Sistemas Sostenibles de Producción Agropecuaria (CIPAV), Carrera 25 No. 6-62, Cali 760043, Colombia
2
Department of Forest and Conservation Sciences, University of British Columbia, Vancouver, BC V6T 1Z4, Canada
*
Author to whom correspondence should be addressed.
Water 2021, 13(9), 1194; https://doi.org/10.3390/w13091194
Submission received: 28 February 2021
/
Revised: 5 April 2021
/
Accepted: 9 April 2021
/
Published: 25 April 2021
(This article belongs to the Special Issue Impacts of Multiple Stressors from Alpine to Prairie Lakes and Streams)
Abstract
:We studied how multiple-stresssors in tributaries affect function, diversity, and physical habitat of recipient downstream ecosystems. Using a mesocosm model of a stream network, we manipulated sediment and nutrients individually and in combination in tributaries of second-order channels, to test the effect of complex stressor interactions within tributaries on recipient channels. Sedimentation in second-order channels increased with the level of disturbance of the tributaries. Moreover, Ephemeroptera, Plecoptera, and Trichoptera (EPT) density and EPT richness were higher in second-order channels fed by tributaries where the stressors were applied separately, compared to those fed by tributaries where the stressors were applied simultaneously. Our observations suggest this result was due to the combination of the two stressors within the same tributary reducing EPT drift from the tributaries further than the addition of the stressors in separate tributaries. These results support the hypothesis that cumulative upstream disturbance can influence downstream recipient ecosystems in stream networks. However, contrary to our expectations, most observed effects were due to impacts on dispersal patterns of EPT taxa, rather than downstream accumulation of disturbances throughout the network. Our results underscore the importance of metacommunity frameworks to understand how tributary disturbance may influence population dynamics in downstream ecosystems.
1. Introduction
River systems are dendritic networks in which contributing streams merge along the fluvial system. This pattern follows a hierarchical configuration, increasing in size and decreasing in number in the downstream direction [1,2]. Thus, every large river basin is composed of nested subcatchments that have a longitudinal connection through the unidirectional flow of water [2,3,4]. The connectivity imposed by the unidirectional flow and the spatial arrangement of river networks greatly influences ecological dynamics, as subsidies of energy, nutrients, and organic materials are transported across interconnected stream reaches [2,5,6]. This interconnected set of habitats are the reason why river networks are considered meta-ecosystems [6,7]. In river meta-ecosystems, local community composition, habitat condition, and ecosystem services cannot be understood by focusing solely on local-scale processes, because they are also influenced by processes operating in upstream reaches at the catchment scale [2,6,8]. Land-use practices can dramatically alter the input of materials into headwater streams, subsequently affecting subsidies to downstream ecosystems [5,9]. For instance, agricultural practices often increase inputs of fine sediment and nutrients into stream ecosystems [10,11]. Numerous studies have demonstrated that nutrient enrichment generally increases standing stocks and processing rates of basal resources in aquatic ecosystems at moderate levels of enrichment, and negative effects at higher levels [10,12,13,14]. On the other hand, fine sediment inputs are reported to have strong negative effects on stream communities, reducing primary production due to increased turbidity, smothering, and abrasion, filling interstitial spaces for benthic invertebrates, and slowing down organic matter processing [15,16,17,18]. Furthermore, recent experimental investigations have demonstrated that sedimentation and nutrient enrichment often interact synergistically, causing cumulative effects that are more detrimental than predicted on the basis of the stressors’ individual effects [19,20,21,22,23].
The degradation of headwater watersheds with sedimentation, nutrient enrichment, and other ecological stressors may cause alterations to downstream hydrology, water quality, geomorphic processes, and biota, as food resource subsidies coming from headwater ecosystems are disrupted [24]. The transmission of disturbances (e.g., fine sediment, nutrients, and other contaminants) from headwaters to downstream ecosystems is governed by a complex array of routing processes taking place at the scale of headwater systems (storage, transformation, and disturbance mechanism), and network systems (synchronized or desynchronized outflows from headwater basins, basin size, basin shape, drainage density, and network geometry) [5,9]. Empirical evidence regarding the interaction of processes happening at multiple scales is necessary to develop predictive understanding about the consequences of cumulative headwater degradation. However, studies addressing cumulative effects on river systems often focus on specific sections of the river network, either evaluating responses at the headwater scale or at the network scale [25,26]. To date few studies explicitly integrate both scales to measure how processes in individual headwater systems interact to affect inputs of material and function on downstream ecosystems (but see [27]).
Here we present the results of a mesocosm experiment designed to study how interactions among multiple stressors within tributaries may affect downstream ecosystem function, diversity, and physical habitat. Using a mesocosm model of a stream network, we manipulated sediment and nutrient levels in the tributaries of second-order channels, to determine individual and combined effects of disturbances on tributaries and recipient ecosystems. We chose this stressor combination as they offered a good model to study cumulative effects of headwater degradation at the network scale. First, as mentioned earlier, there is already empirical knowledge about their potential non-additive interactions on stream ecosystems (e.g., [19,20,21]). Second, they may have different rates of delivery from headwaters to downstream ecosystems, due to different storage and transformation mechanisms within headwaters [9,28].
Our treatments were designed to test: (i) individual and combined effects of nutrient enrichment and sedimentation on ecological structure and function of tributary streams; (ii) the potential effect of complex stressor interactions within the tributaries on recipient second-order channels; and (iii) how the level of disturbance within the tributaries affects ecological function and structure of recipient downstream ecosystems. Our overarching hypothesis was that stressor additions in tributary streams would have detectable effects on the structure and function of downstream recipient ecosystems. Specifically, for tributary channels we hypothesized that: (1) nutrient additions would have positive effects on most biological responses; (2) sediment additions would have negative effects on most biological responses; and (3) there would be complex non-additive interactions between nutrient enrichment and sedimentation. For second-order channels we hypothesized that: (4) complex multiple-stressor interactions within the tributaries would influence responses of recipient downstream ecosystems; and that (5) increasing levels of disturbance in the tributaries would cause proportional increases of disturbance on downstream ecosystems.
2. Materials and Methods
2.1. Experimental Design
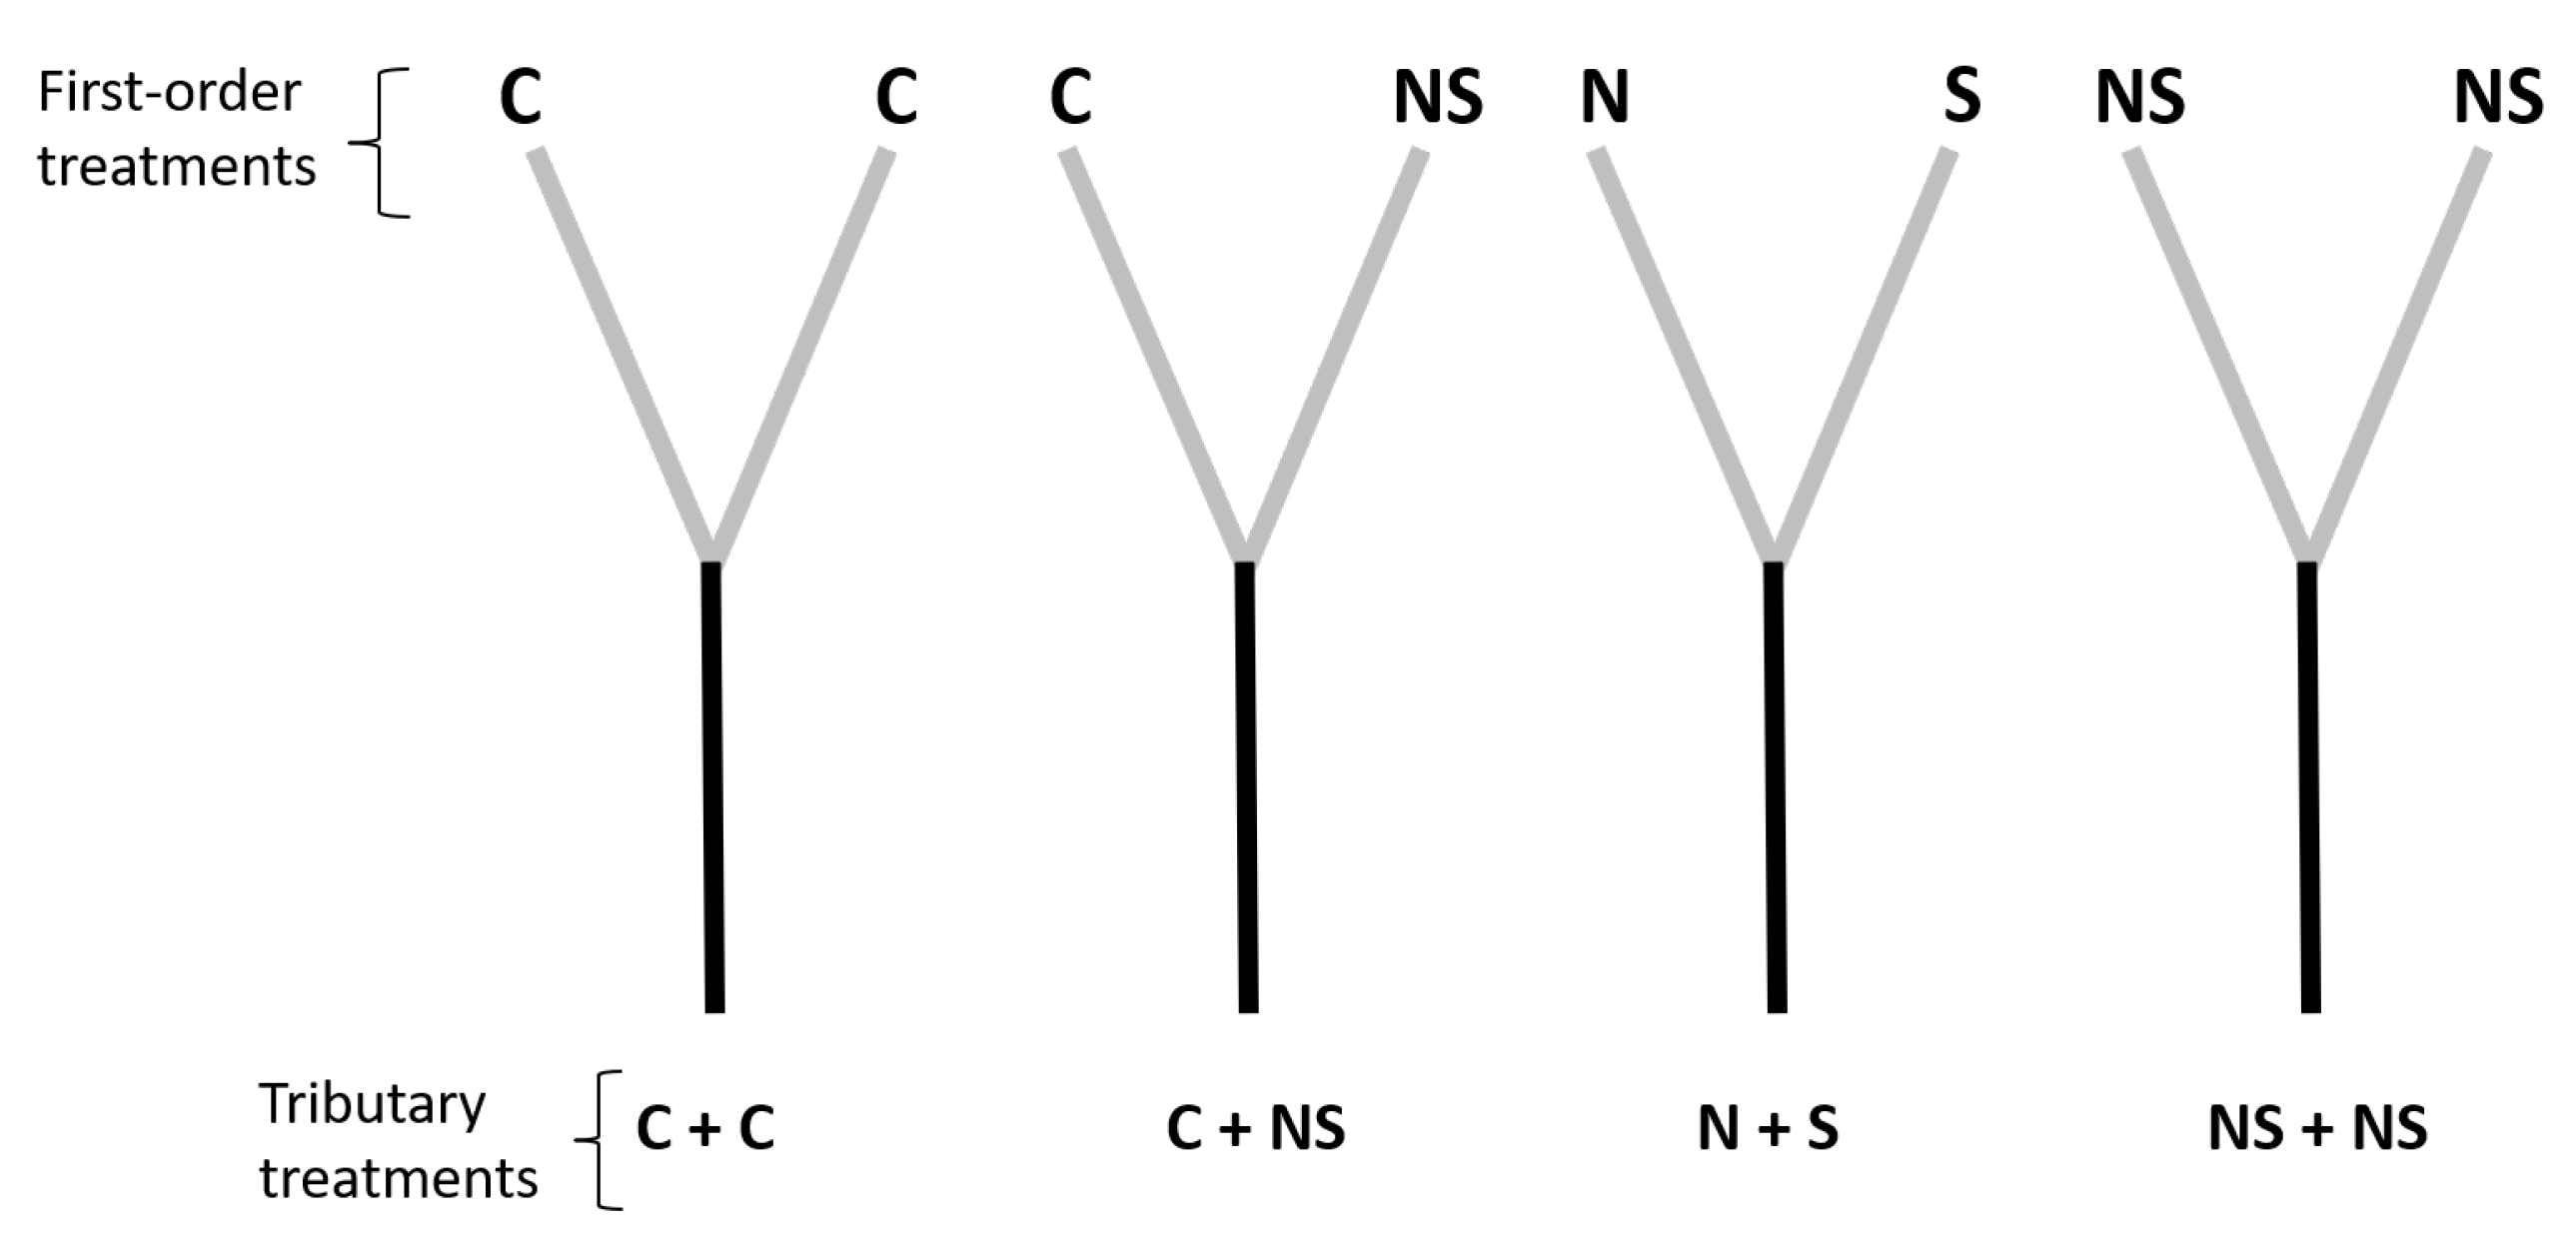
We built a network of 36 stream mesocosm channels in the Malcolm Knapp Research Forest of the University of British Columbia, near Maple Ridge, British Columbia, Canada (49°16′ N, 122°34′ W; Figure A1). In the design, 24 mesocosms, which will be referred to as “first-order” channels, converged downstream in pairs to form 12 “second-order” channels (channel dimensions: 6.8 m × 0.15 m, Figure 1). All channels were stocked with a 4 cm layer of washed gravel purchased in a landscaping store (0.5–3.0 cm grain size range) and were continuously gravity-fed with water from Mayfly Creek, an adjacent oligotrophic stream which is described in detail in [29].
Water intake was located above the range of distribution of trout in Mayfly Creek. Water was collected in two header boxes and distributed with outflow valves that controlled water flow, set to about 0.4 L s−1 to each channel throughout the experiment. Average slope was 0.06 m m−1 for the first-order channels and 0.03 m m−1 for the second-order channels. Four weeks prior the beginning of the experiment, we allowed immigration of invertebrates from Mayfly Creek to colonize the channels via drift. As this method has proven appropriate to obtain consistent invertebrate densities in previous experiments at the same location [29,30], we did not collect premanipulation samples for this study.
Our 22-day experimental manipulation was conducted in the fall season, from November 7 to November 28 of 2013. We manipulated fine sediment and nutrients in the 24 first-order channels on day 1 of the experiment. We evaluated two levels of each stressor (added, ambient) in the following combinations (Figure 1): (i) ambient levels of sediment and nutrients (control treatment, ); (ii) added nutrients and ambient levels of sediment (N treatment, ); (iii) added sediment and ambient levels of nutrients (S treatment, ); and (iv) added nutrients and added sediment (NS treatment, ). High levels of deposited sediment (approximately 60% stream bed coverage) were achieved by adding 3 L of sand (<0.5 mm, “medium sand” on the Wentworth scale) as evenly as possible to each sediment-addition first-order channel. These sedimentation levels are equivalent to values reported in rivers affected by agricultural practices [21,31], and are similar to those used in several experiments evaluating the effects of sedimentation on stream ecosystems (e.g., [18,19]). We used 4-month, slow-release fertilizer pellets (Florikote, NPK: 15-5-15), to achieve continuous nutrient enrichment throughout the experiment in nutrient addition channels. We added 14 g of Florikote to each treated channel for a target phosphorus concentration of 3 g L−1 above background nutrient levels (approximate background concentrations: 3.7 g P-PO4 L−1, 123.4 g dissolved inorganic nitrogen L−1, and 74.5 N:P ratio [14]). This enrichment level is equivalent to nutrient additions that have been previously reported to cause significant increases in periphyton biomass, insect grazer abundance, and Ascaphus truei tadpole growth rates in experimental channels fed by Mayfly Creek [32].
In order to test our hypotheses for second-order channels, treatments on first-order channels were assigned so each second-order channel was exposed to one of the following four tributary treatments (Figure 1): (i) two control tributaries (C + C); () one control tributary and one tributary with both stressors (C + NS); () nutrients added in one tributary and sediment in the other (N + S); and () nutrients and sediment simultaneously added in both tributaries (NS + NS). Each tributary treatment had three replicates for a total of 12 second-order channels.
2.2. Response Variables
We measured variables reflecting the effect of the treatments on habitat condition (sedimentation rates, water nutrient concentrations), benthic invertebrate communities (density, functional feeding groups, drift rates), and ecosystem function (leaf decomposition) in first- and second-order channels. Water samples were collected on day 22 to determine nutrient concentrations (PO4-P, NH4-N, and NO3-N) in the second-order channels, and were analyzed by Maxxam Analytics, Burnaby, British Columbia, using standard methods [33]. To quantify sedimentation rates in the channels, we collected all the substrate present in three random quadrants (0.1 m × 0.8 m) of each first- and second-order channel. Substrate collection was carried out using a small D-net built to fit in the channels. We placed the d-net downstream from the sample quadrant, and disturbed the area within the quadrant until all the substrate was collected in the d-net (64 m mesh size). The collected substrate was filtered through a 2 mm sieve stacked on top of a 0.5 mm sieve to separate the gravel. The filtered sand was stored in sealed plastic buckets and transported to the laboratory. In the laboratory the contents of each bucket were oven-dried at 40 °C for 10 days, weighed, ashed at 500 °C for three hours, and reweighed to quantify ash-free dry mass (AFDM).
We collected invertebrate drift from all the experimental channels twice, once near the beginning of the experiment (day 2) and once at the end of the experiment (day 22). Drift samples were collected by placing 250 m mesh nets at the end of each channel. Second-order channels were sampled for 24 h periods, whereas first-order channels were sampled for 2 h periods (10 a.m. to 12 p.m.) to avoid disrupting the transport of materials to second-order channels. All drift samples were preserved in 80% ethanol and transported to the laboratory. We sampled benthic invertebrate communities in all the experimental channels once, at the end of the experiment (day 22). One composite invertebrate sample was collected in each channel using a small Surber sampler (0.017 m2, 250 m mesh size) in four random locations (total sampled area in each channel: 0.068 m2). Composite Surber samples were stored in 80% ethanol and sorted later under the dissecting microscope for invertebrates. All benthic invertebrates were enumerated, identified to the lowest practical taxonomic level (usually genus), and classified into functional feeding groups according to [34]. We computed 11 invertebrate variables for each first- and second-order channel: (1) total invertebrate density; (2) total taxa richness; (3) Shannon-Wiener diversity; (4) density of Ephemeroptera, Plecoptera, and Trichoptera (EPT) taxa; (5) richness of EPT taxa; (6) density of scrapers; (7) shredders; (8) predators; and (9) collectors; (10) drift rate (total number of individuals drifting per hour); and (11) EPT drift flux (number of EPT drifting per sampling period).
To measure leaf decomposition, we introduced one leaf pack of red alder leaves in coarse-mesh bags (3 g air-dry weight; 10 mm mesh) into each channel one day before treatment application (day 0). On day 22, leaf packs were removed from the channels and stored at −18 °C until processed in the laboratory to estimate remaining AFDM, according to standard methods [35]. Posterior processing involved defrosting, rinsing, and drying at 60 °C for 5 days. Remaining leaf material was then weighed, ashed at 500 °C, and reweighed to calculate AFDM.
2.3. Data Analysis
In order to test our first three hypotheses, we used linear fixed-effects models to quantify individual and combined effects of the stressors on response variables recorded in the first-order channels. For each response variable the model tested was: , where N is the nutrient treatment and S the sediment treatment. Significance levels for all our tests was and was evaluated with ANOVAs.
Following the recommendation of Nakagawa and Cuthill [36] we present standardized effect size estimates for all findings with , so readers can judge the biological importance of the results. Hedge’s d estimates of effect size [37] were calculated from the t values of our linear models using the formulas provided by Nakagawa and Cuthill [36]. In order to improve the graphical representation of our results, we coded significant main effects to represent the direction of the response of manipulated versus control mesocosms (i.e., positive effect sizes indicate increases in the response variable, while negative effect sizes indicate decreases). Further, we coded 2-way interaction effect sizes to represent the classification of the interaction according to the framework proposed by Jackson et al. [38]. Thus, positive interaction effect sizes represent synergistic interactions (i.e., the combined effect of the stressors is greater than the sum of their individual effects), whereas negative effect sizes represent either antagonistic interactions (i.e., the combined effect of the stressors is less than the sum of their individual effects) or reversal interactions (i.e., the combined effect of the stressors is in the opposite direction than the sum of the individual effects).
Given that the counts of EPT taxa drifting out of the first-order channels were low and contained many zeros, we could not apply a linear model to this variable. Instead, we used a zero-inflated Poisson (ZIP) regression. The ZIP model has two components: a Poisson model with log link (count model) that evaluates the effect of the explanatory variables on the counts; and a negative binomial with logit link model (zero model) that evaluates the effect of the explanatory variables on the probability of zero counts in the data.
Data recorded in the second-order channels were divided into two subsets to test our fourth and fifth hypotheses. For our fourth hypothesis, we used data corresponding to tributary treatments C + NS and N + S (Figure 1) and compared the two treatments using independent t-tests. Thus, we compared whether applying both nutrients and sediment in the same tributary (cumulative effect; tributary treatment C + NS) had the same effect downstream as applying nutrients in one tributary and sediment in the other tributary (single effect: tributary treatment N + S).
For our fifth hypothesis, we used data corresponding to tributary treatments C + C, C + NS, and NS + NS to evaluate the effect of tributary disturbance level on recipient second-order channels (Figure 1). We excluded tributary treatment N + S from this particular comparison in order to avoid potential confounding effects of multiple-stressor interactions within the tributaries. This way we ensured we were able to test a linear increase in tributary disturbance. We used single linear regressions of the form: , where was a 3-level factor representing the degree of disturbance in the first-order tributaries (i.e., the number of tributaries treated with the two stressors). The three levels included: (0) a control with no stressors in the tributaries (treatment C + C); (1) only one tributary with both stressors (treatment C + NS); and (2) two tributaries with both stressors (treatment NS + NS).
3. Results
3.1. Stressor Effects on First-Order Channels
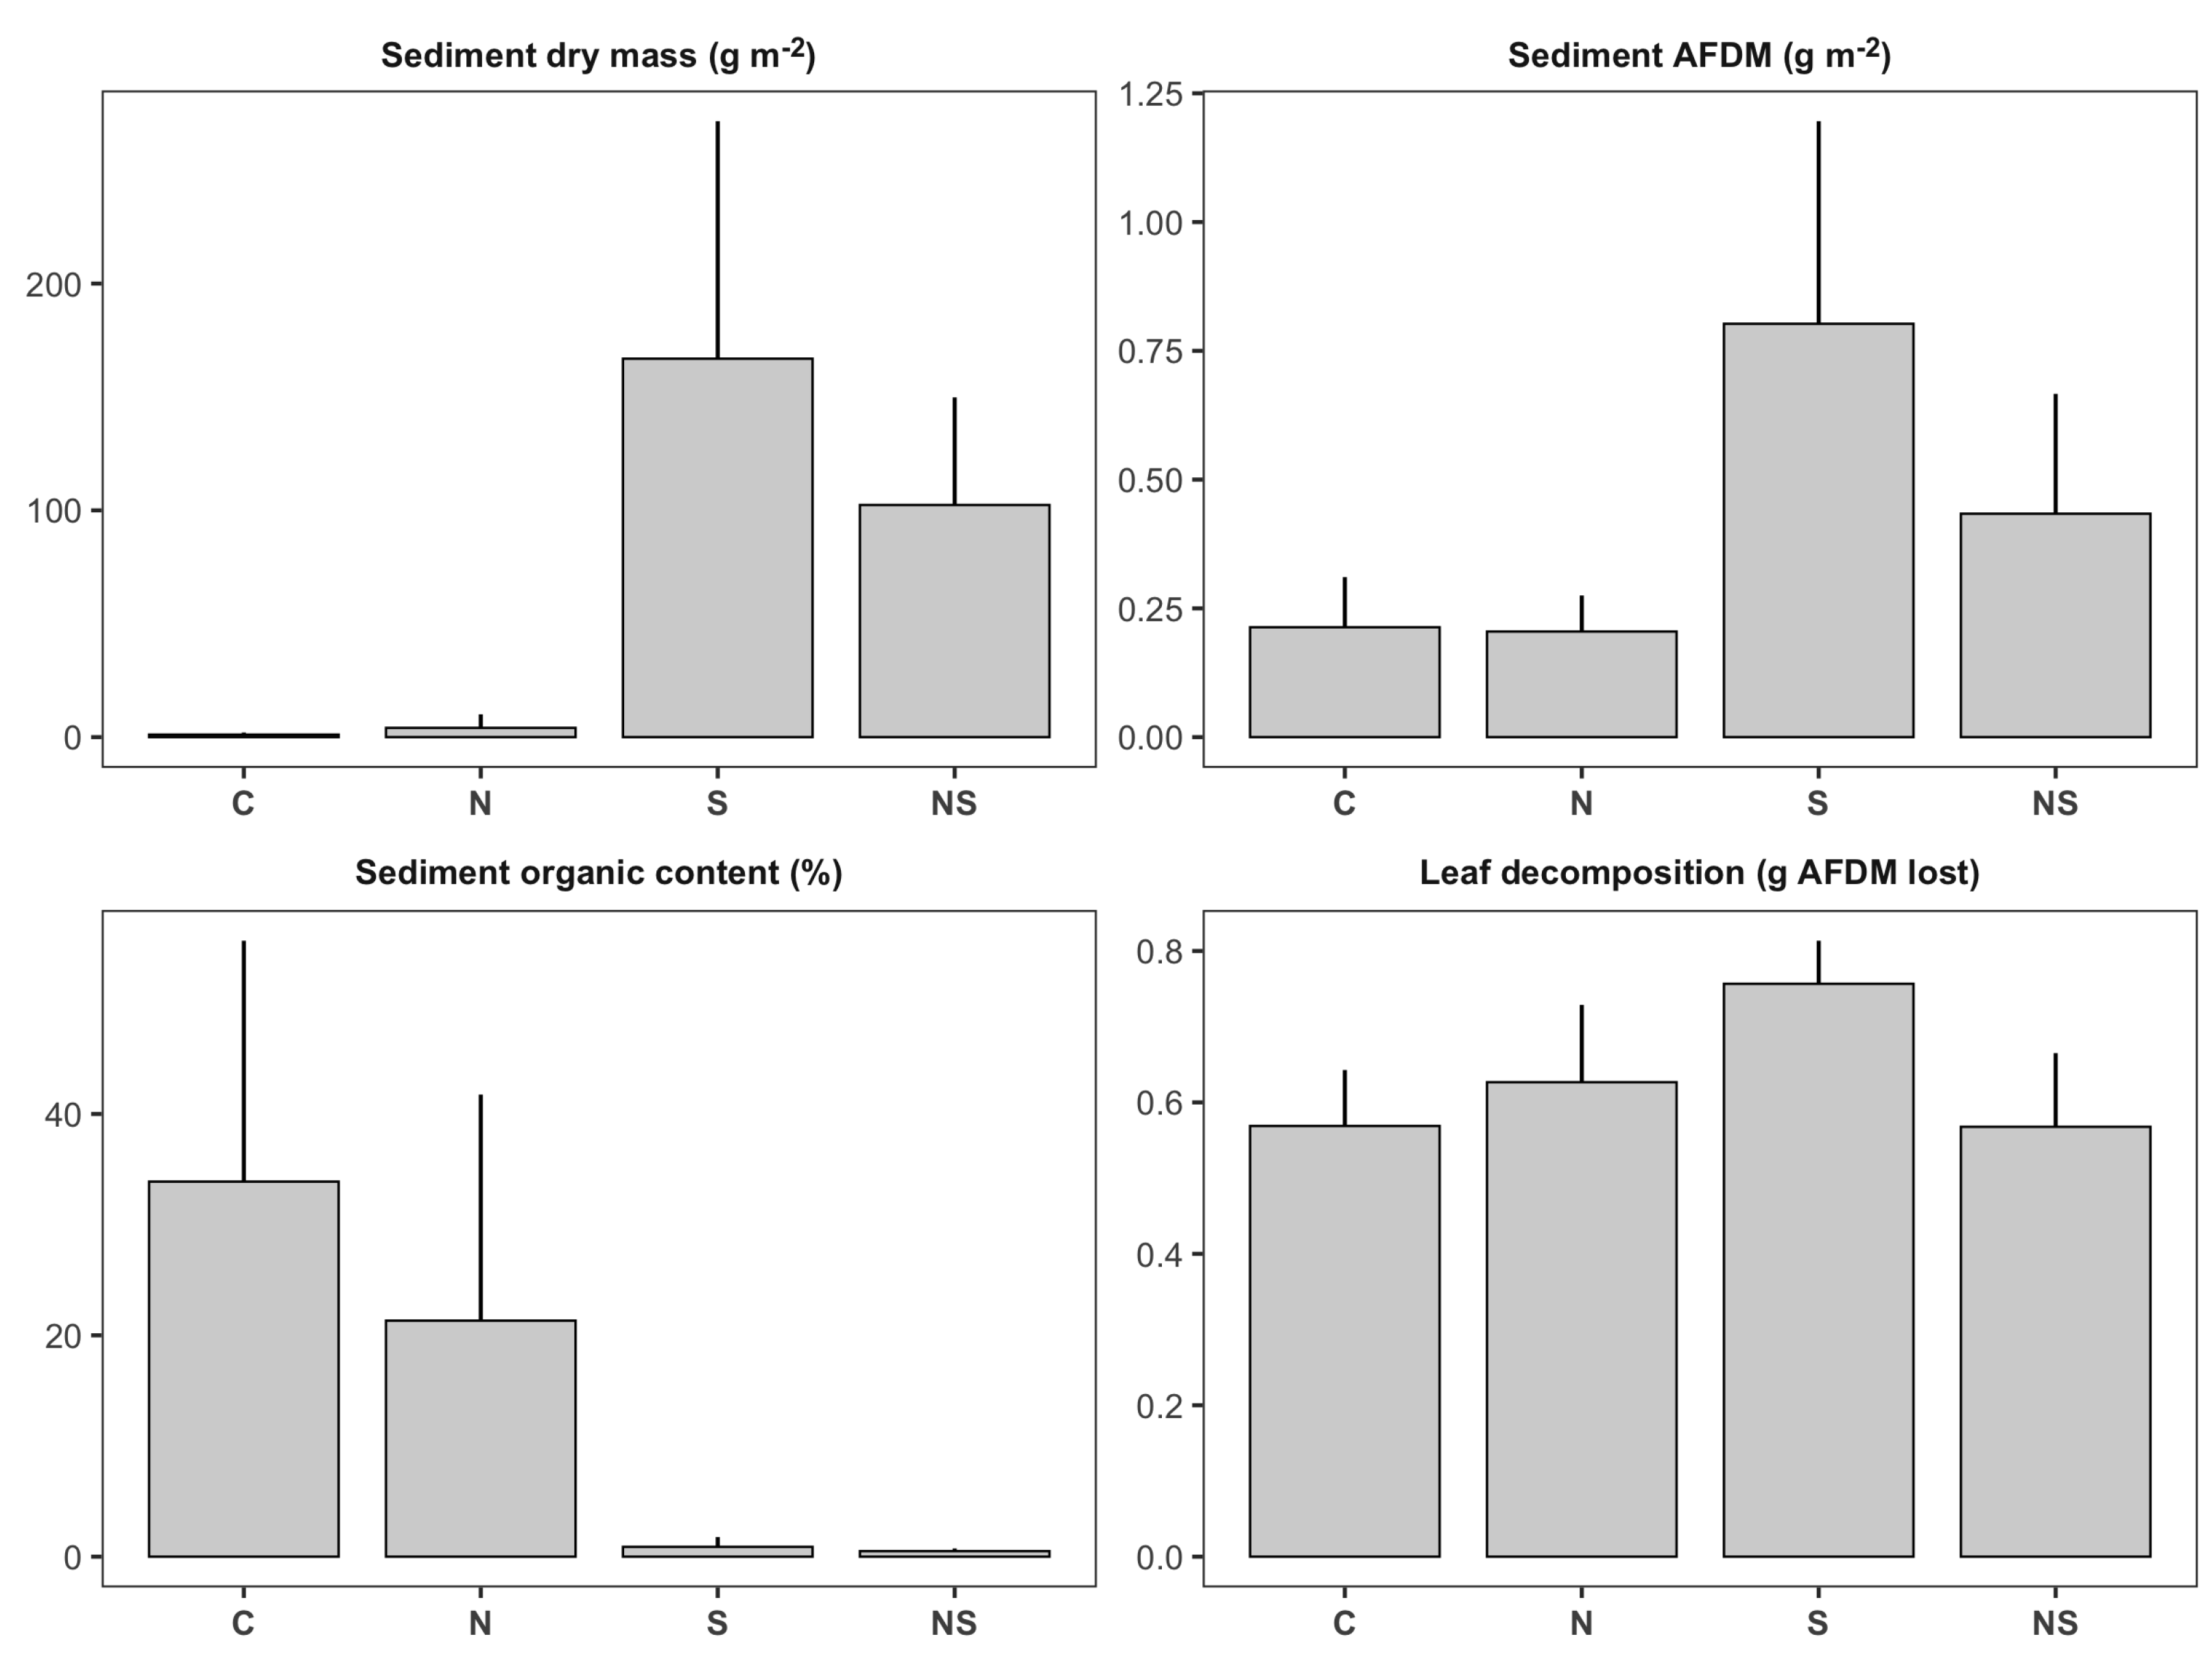
The sediment treatment caused significantly higher sedimentation rates in the first-order channels (Table 1; Figure 2). By the end of the experiment, first-order channels treated with sediment had on average 61 times more sediment accumulated in the substrate (1821.7 ± 312.8 g m−2) than untreated channels (29.8 ± 13.8 g m−2; Figure 2). Sediment additions also increased the absolute amount of deposited organic material (sediment AFDM) by 2.6 times (Table 1, Figure 2). However, on average, sediment deposited in these channels had significantly lower organic content (organic content sediment treatment: 0.6% ± 0.15%, mean ± SE) than sediment in the remaining first-order channels (organic content: 30% ± 6%, Table 1; Figure 2).
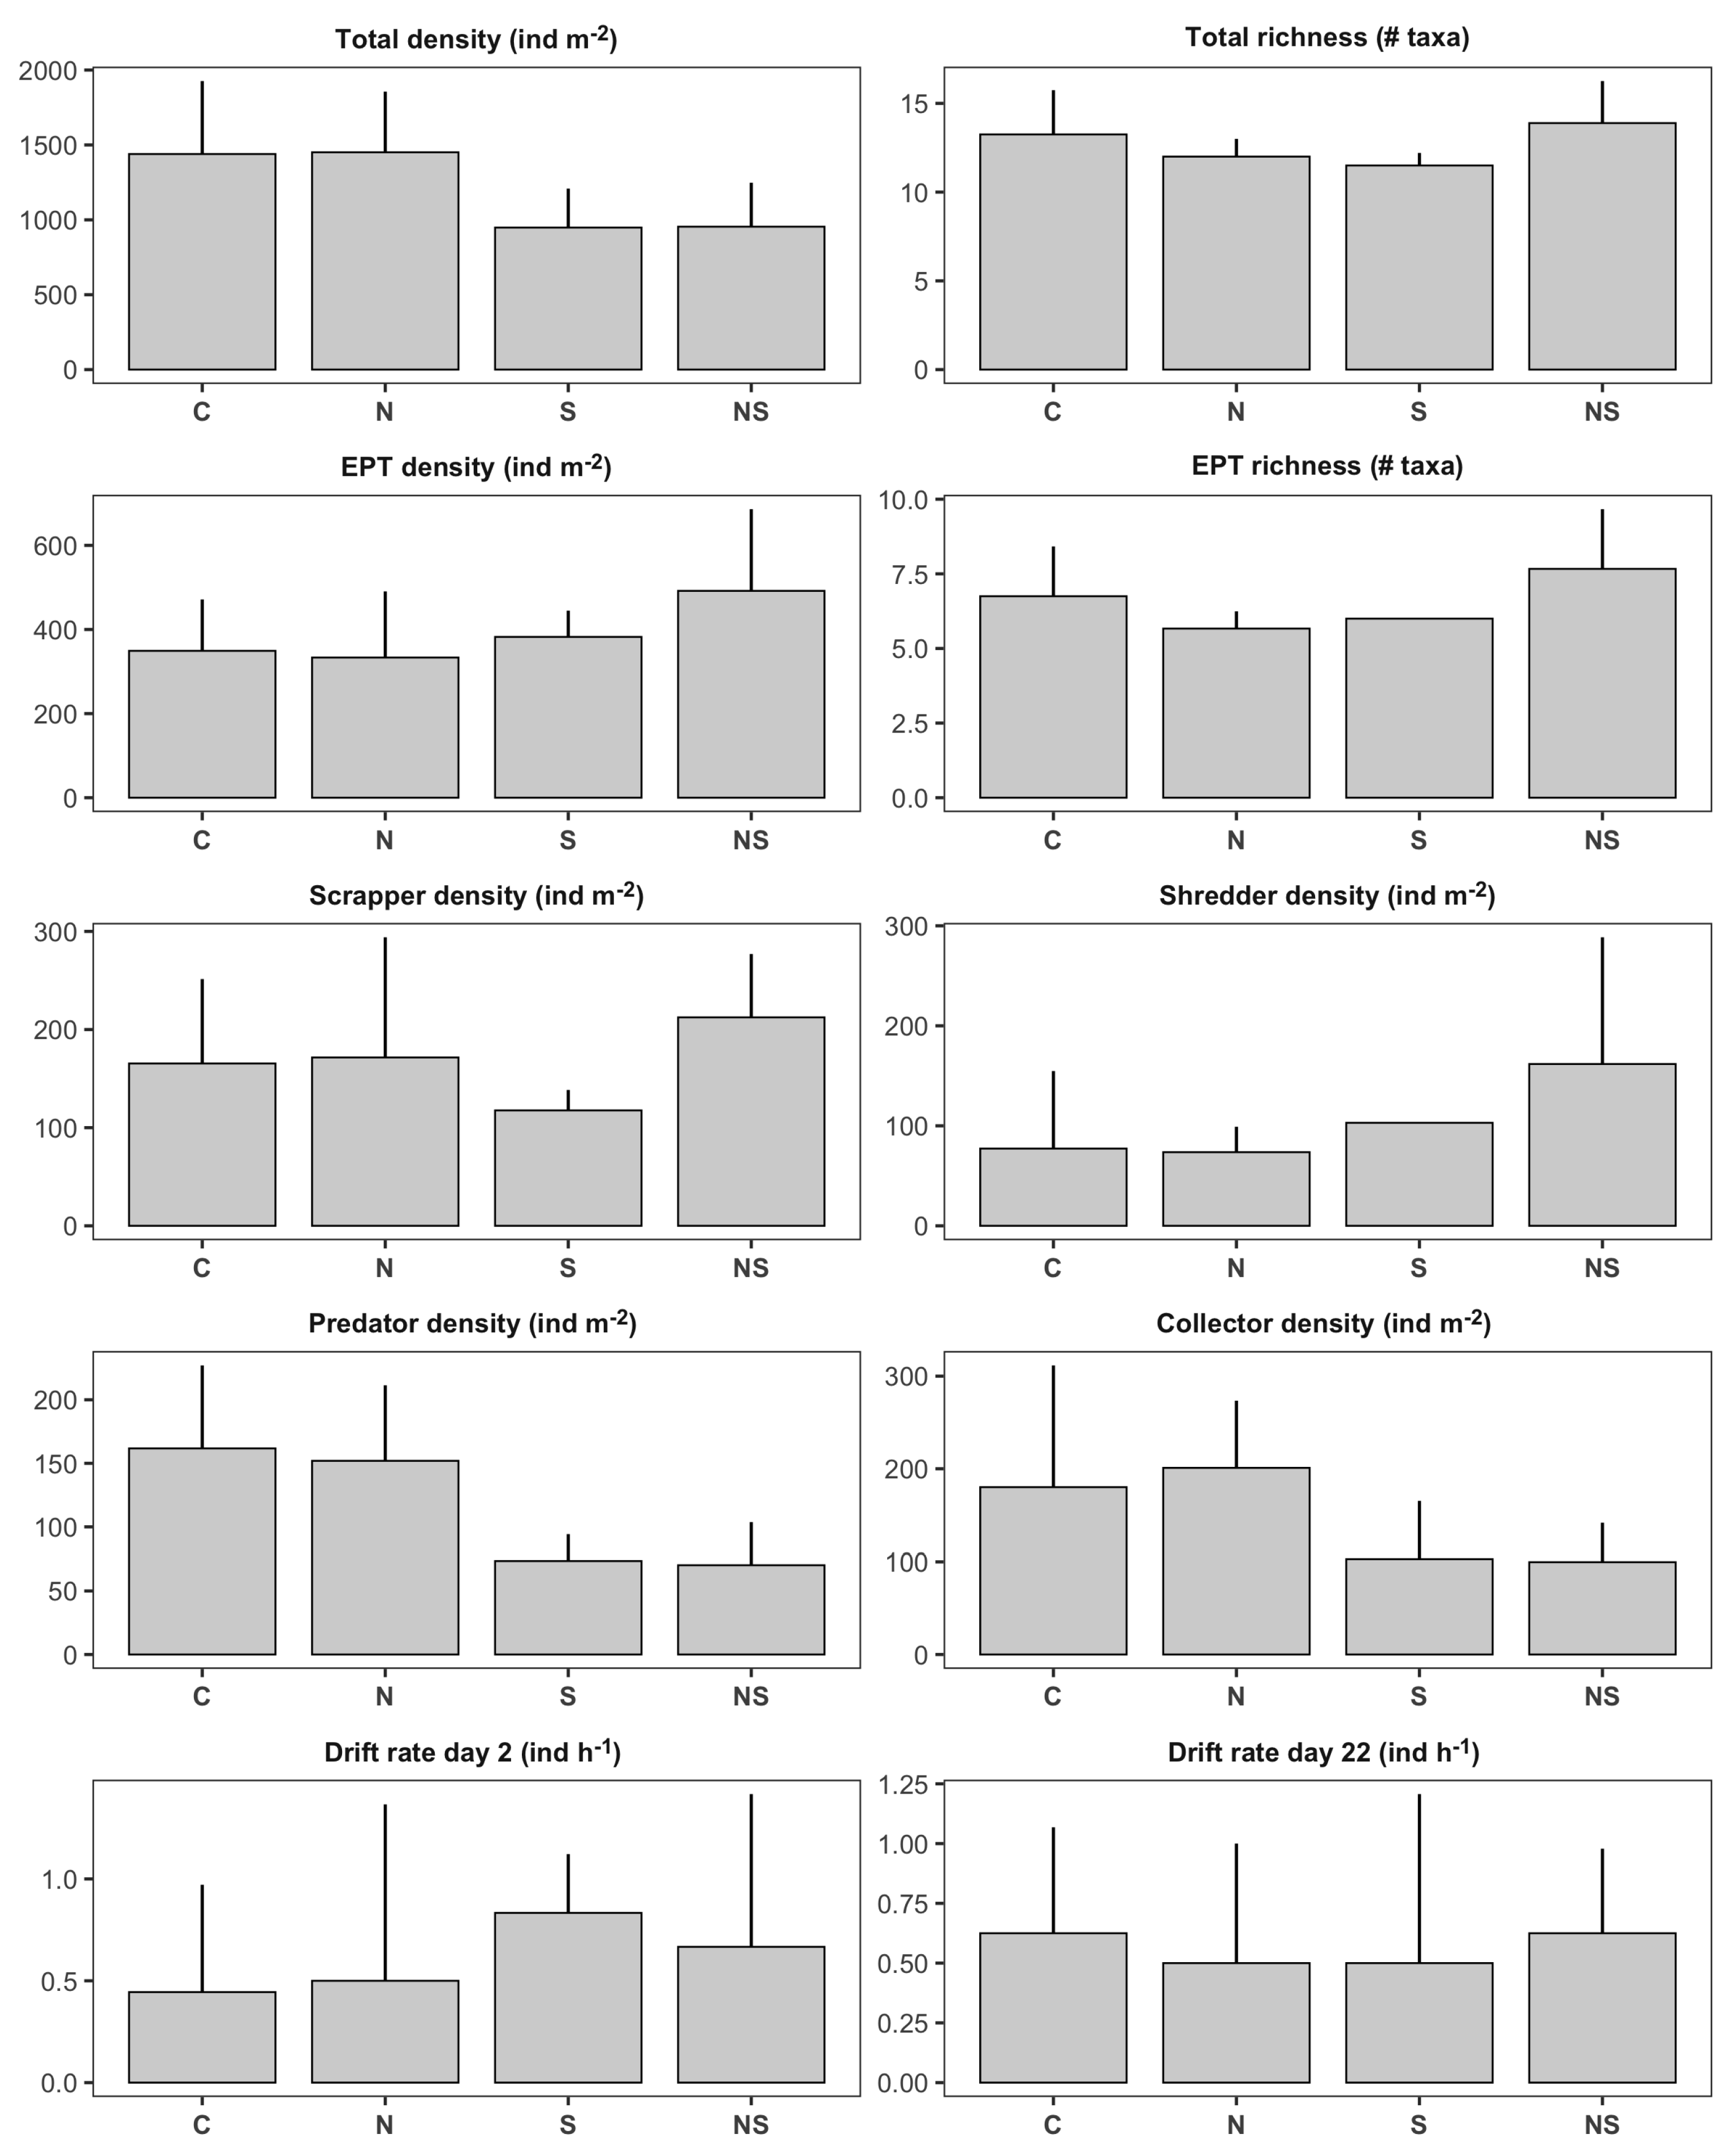
Treatment means for benthic invertebrate variables in first-order channels are presented in Figure 3. We detected significant negative effects of the sediment treatment on total invertebrate density (Table 1; Figure 4a). First-order channels treated with sediment had on average 34% fewer individuals than channels without sediment (Figure 3). According to our findings, this reduction was associated with negative impacts on invertebrate predators (, 55% reduction; Figure 4b) and, to a lesser extent, collectors (, 46% reduction; Figure 4b). In terms of ecosystem functioning, we observed a significant nutrient × sediment interaction affecting leaf decomposition in the first-order channels (Figure 4d). This interaction was classified as an antagonism; while both stressors tended to have positive effects on leaf decomposition independently (the individual effect of sediment was significant, while the individual effect of nutrients was not), nutrient × sediment channels had similar decomposition rates as the control treatments (Figure 2). In other words, leaf packs in nutrient x sediment channels lost on average 25% less ash free dry mass than expected if the effect of the two stressors was additive.
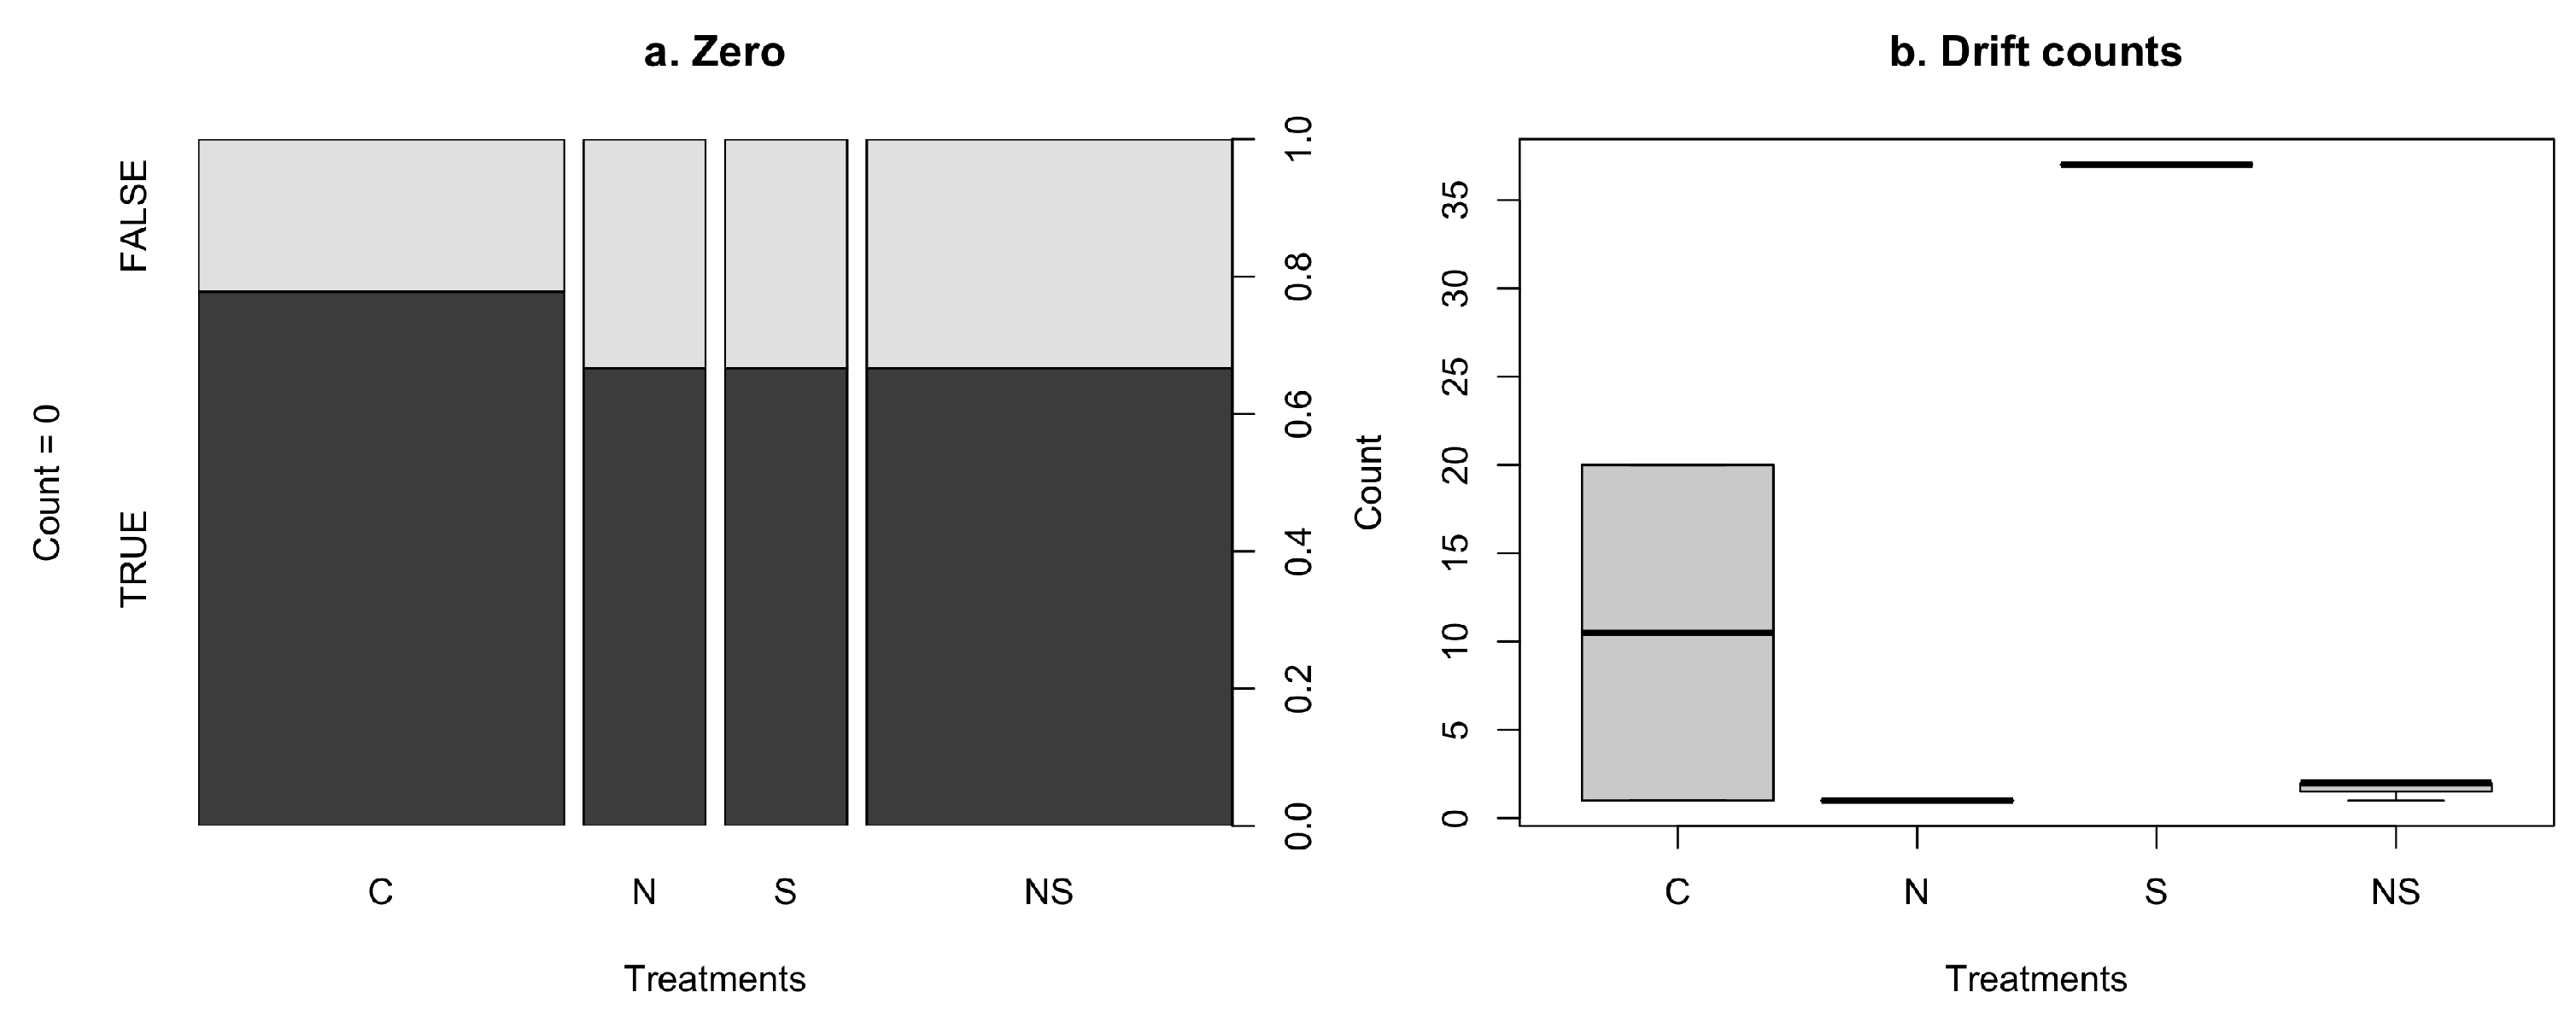
Nutrient and sediment additions did not significantly impact the total number of invertebrates drifting per hour on days 2 and 22 after treatment application (Table 1; Figure 3). However, we observed significant effects of both treatments on drift flux of individuals from the orders Ephemeroptera, Plecoptera, and Trichoptera (EPT) on day 22 (Table 2). According to the zero-inflated Poisson regression, nutrient and sediment additions did not influence the probability of excess zeros on the 2-hour drift samples (Figure 5a), but had strong effects on the counts of EPT drifting from the channels (Figure 5b). Nutrient additions had a negative effect on EPT drift flux, as there were 90% fewer individuals from these orders drifting from channels treated with nutrients. On the other hand, sediment had the opposite effect; sediment-channels had 91% higher EPT drift flux as the other first-order channels.
3.2. Stressor Effects on Second-Order Channels
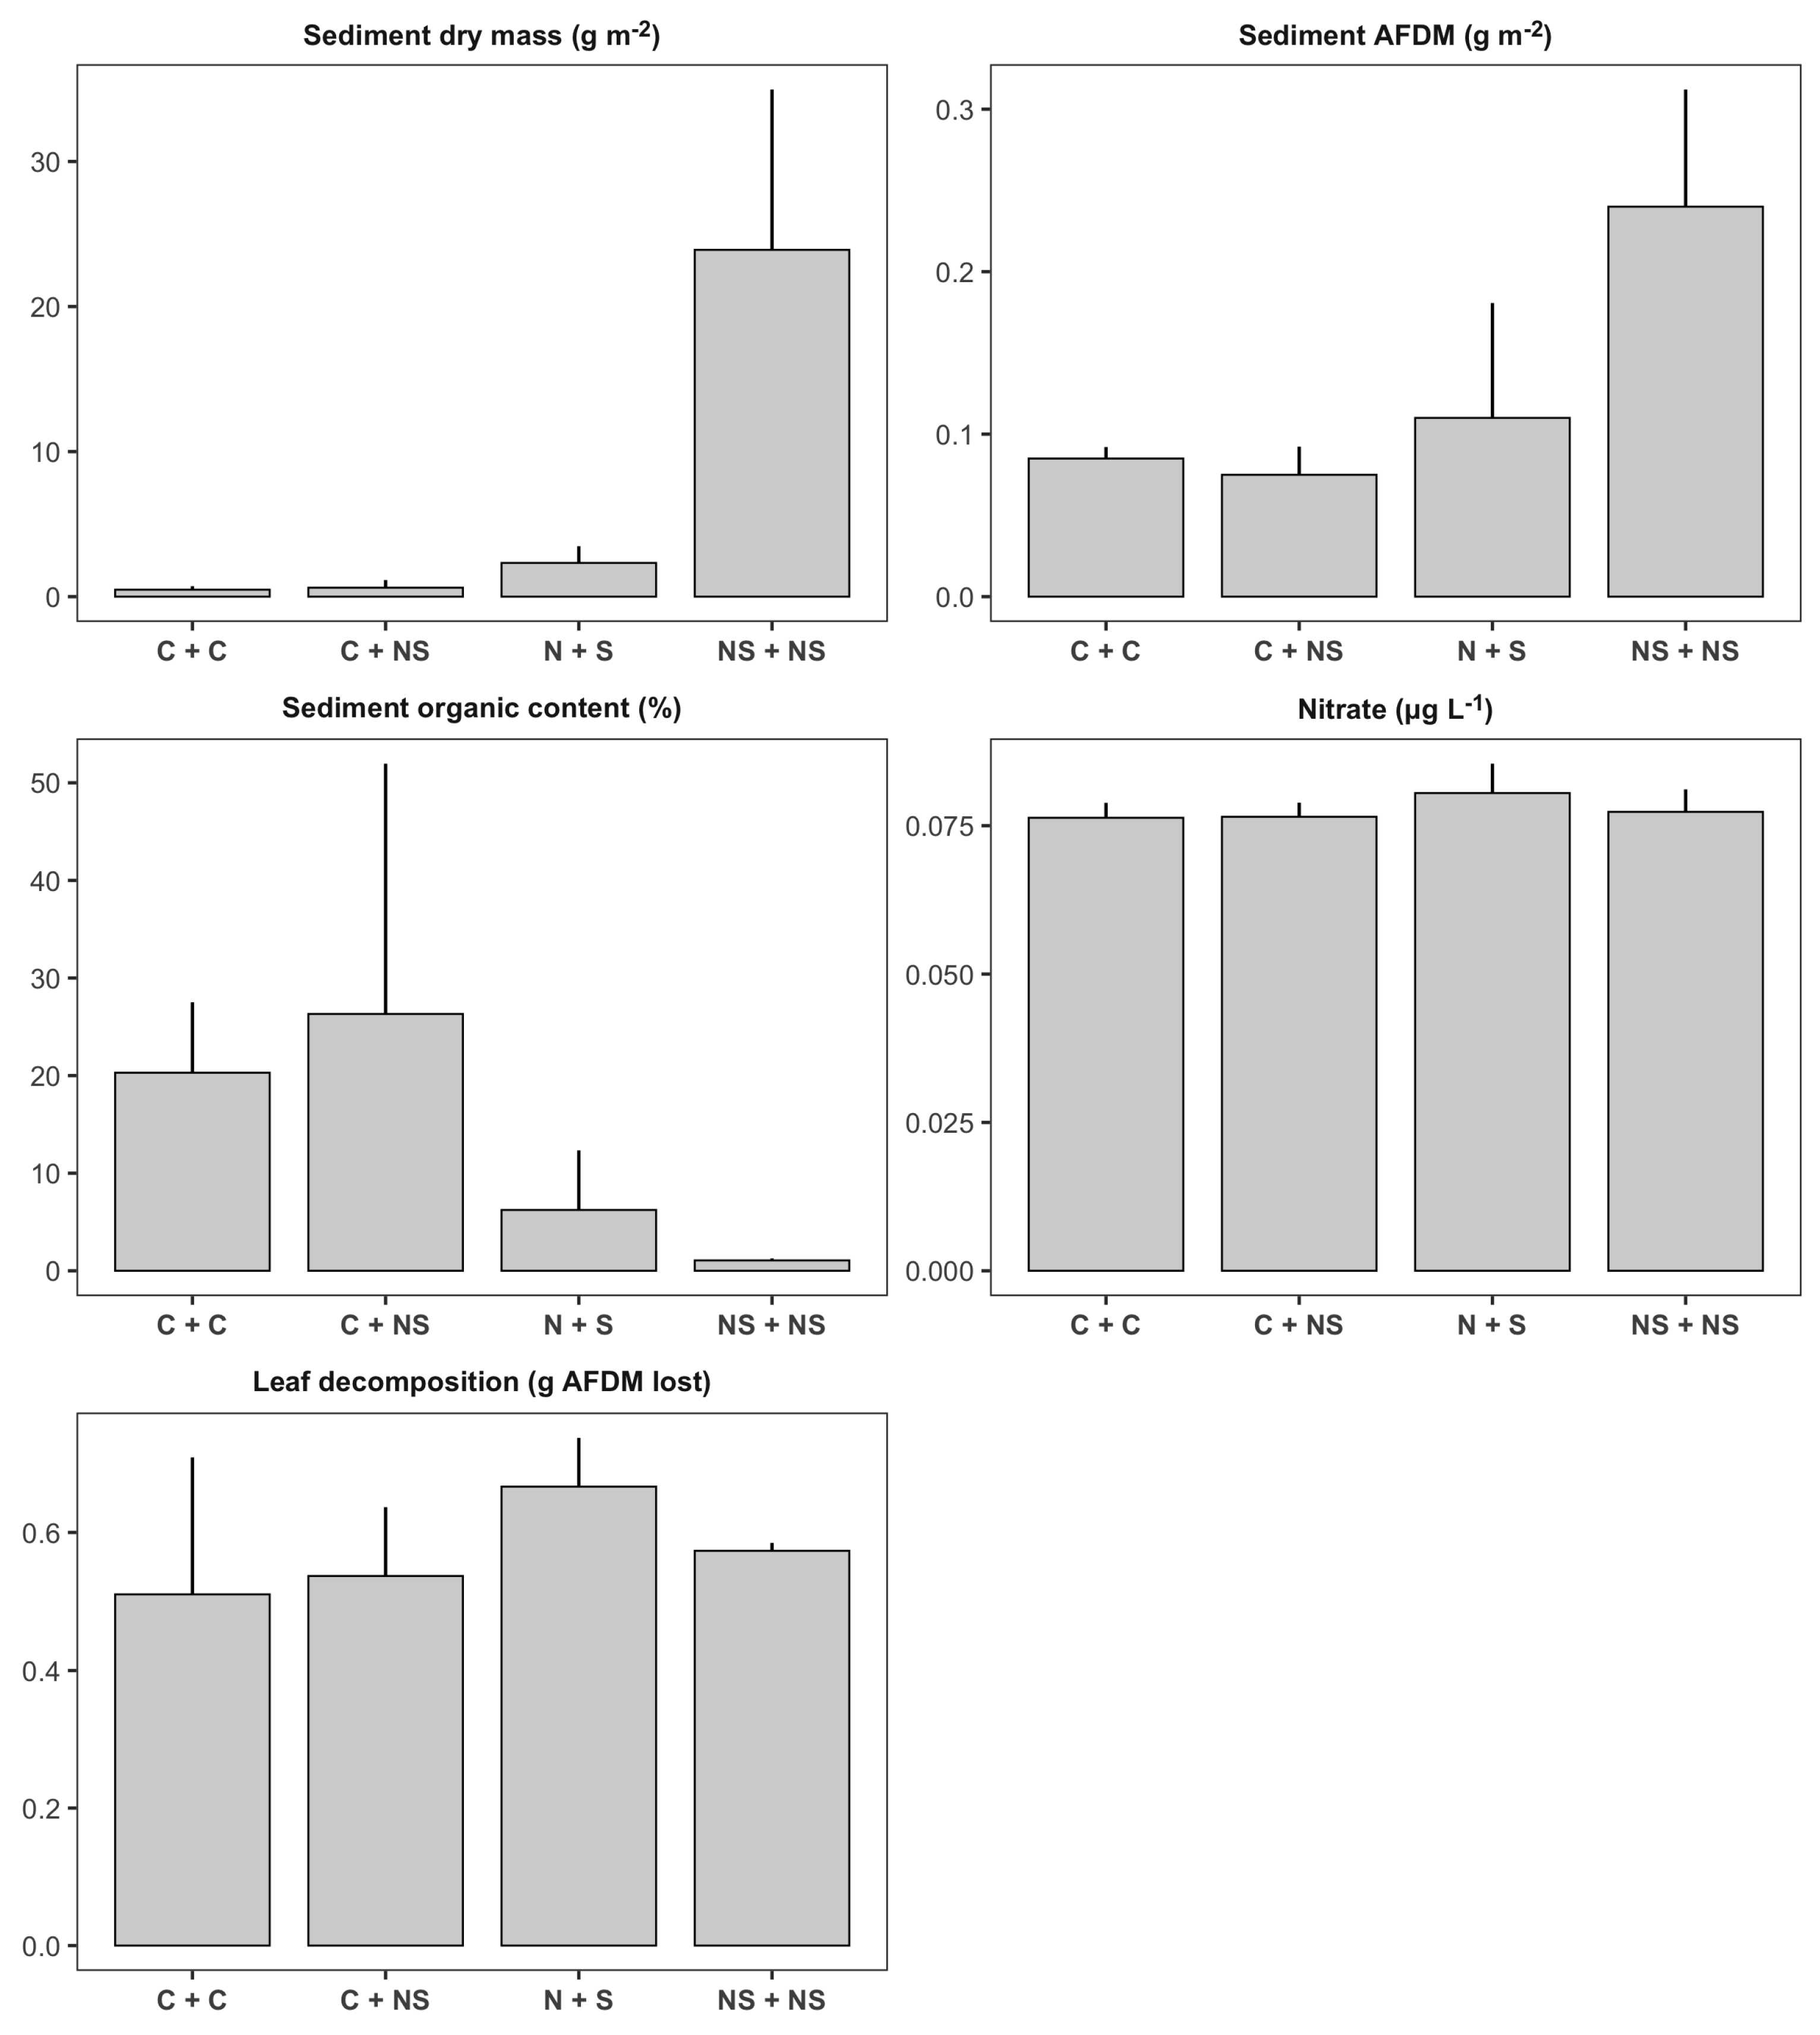
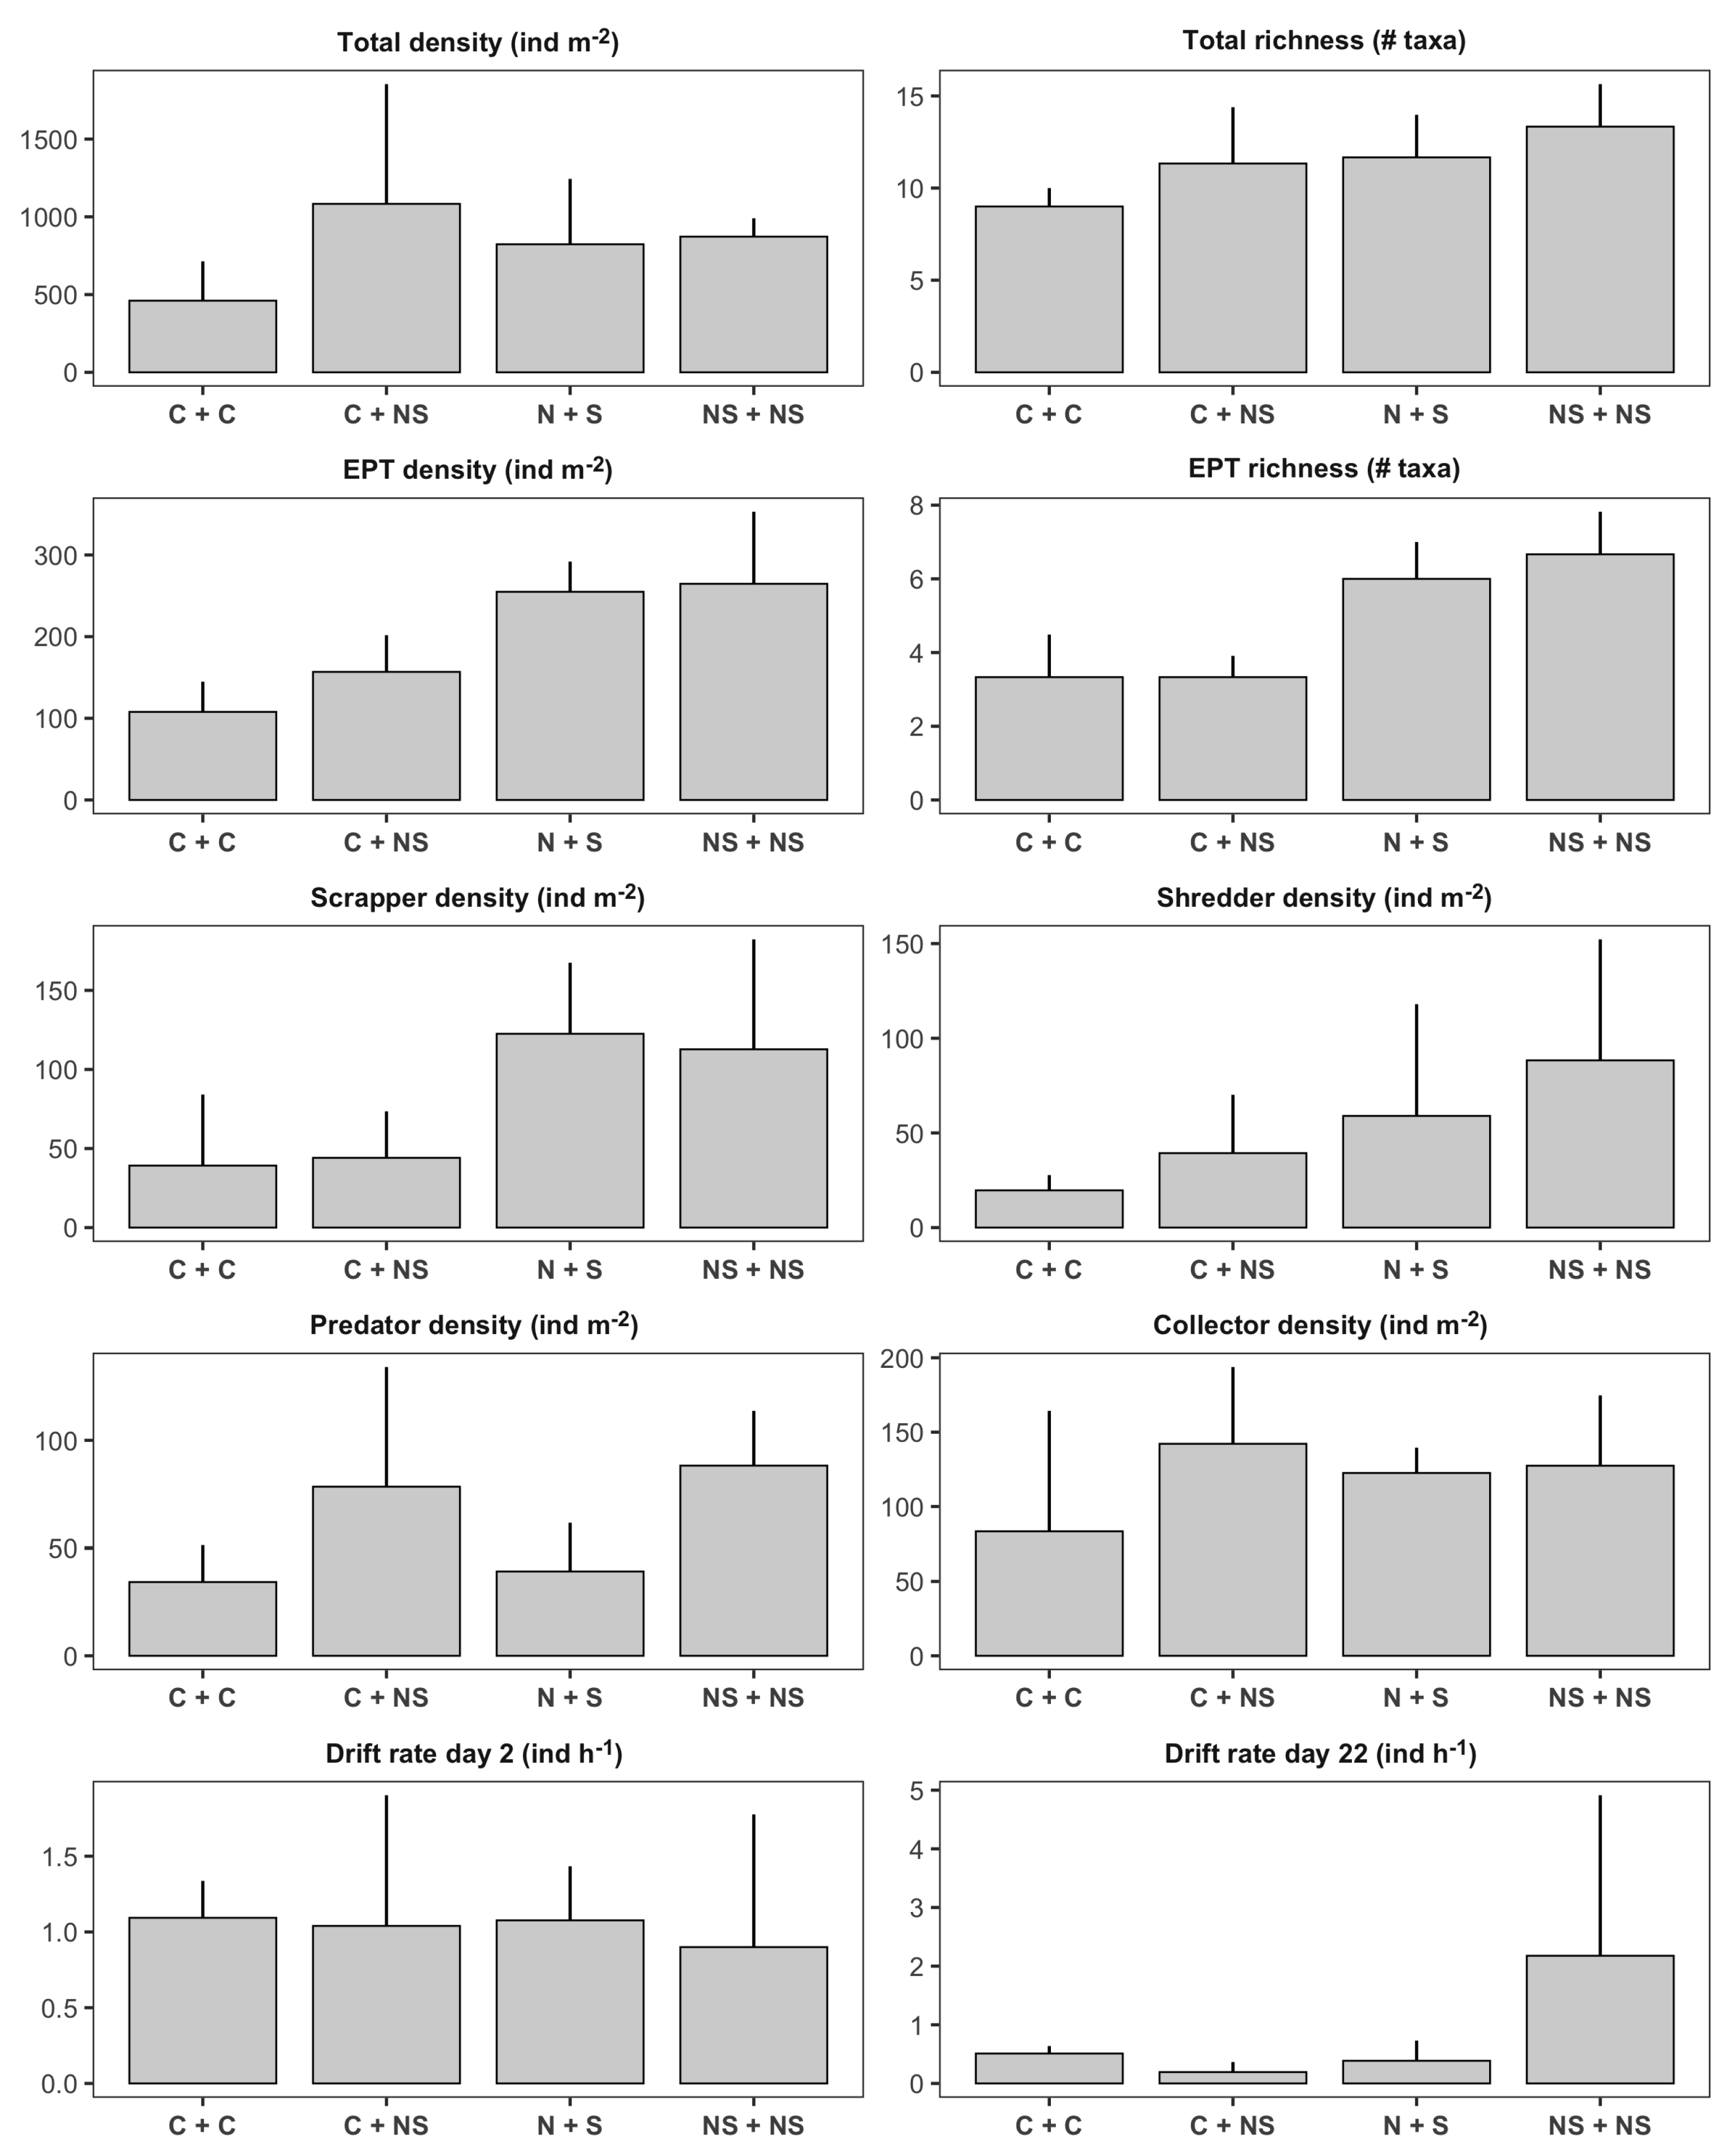
The t-tests used to compare the impact of applying both stressors in the same tributary (cumulative treatment, C + NS in Figure 6) versus the impact of applying a nutrients to one tributary and sediment to the other tributary (single treatment, N + S in Figure 6), indicated there were no significant differences between sediment deposition rates and nitrate concentration between the single and cumulative tributary treatments (Table 3; Figure 6). Unfortunately, phosphorous concentrations were under detection levels (5 g L−1) in all water samples, so we could not determine whether there were significant differences for this element. We observed that EPT density and EPT richness were significantly different between the cumulative and single tributary treatments (Table 3; Figure 7). There was on average 38% higher density and 45% higher richness of EPT taxa in second-order channels fed by tributaries where the stressors were applied separately (single treatment), when compared to channels fed by tributaries where the stressors were applied simultaneously (cumulative treatment).
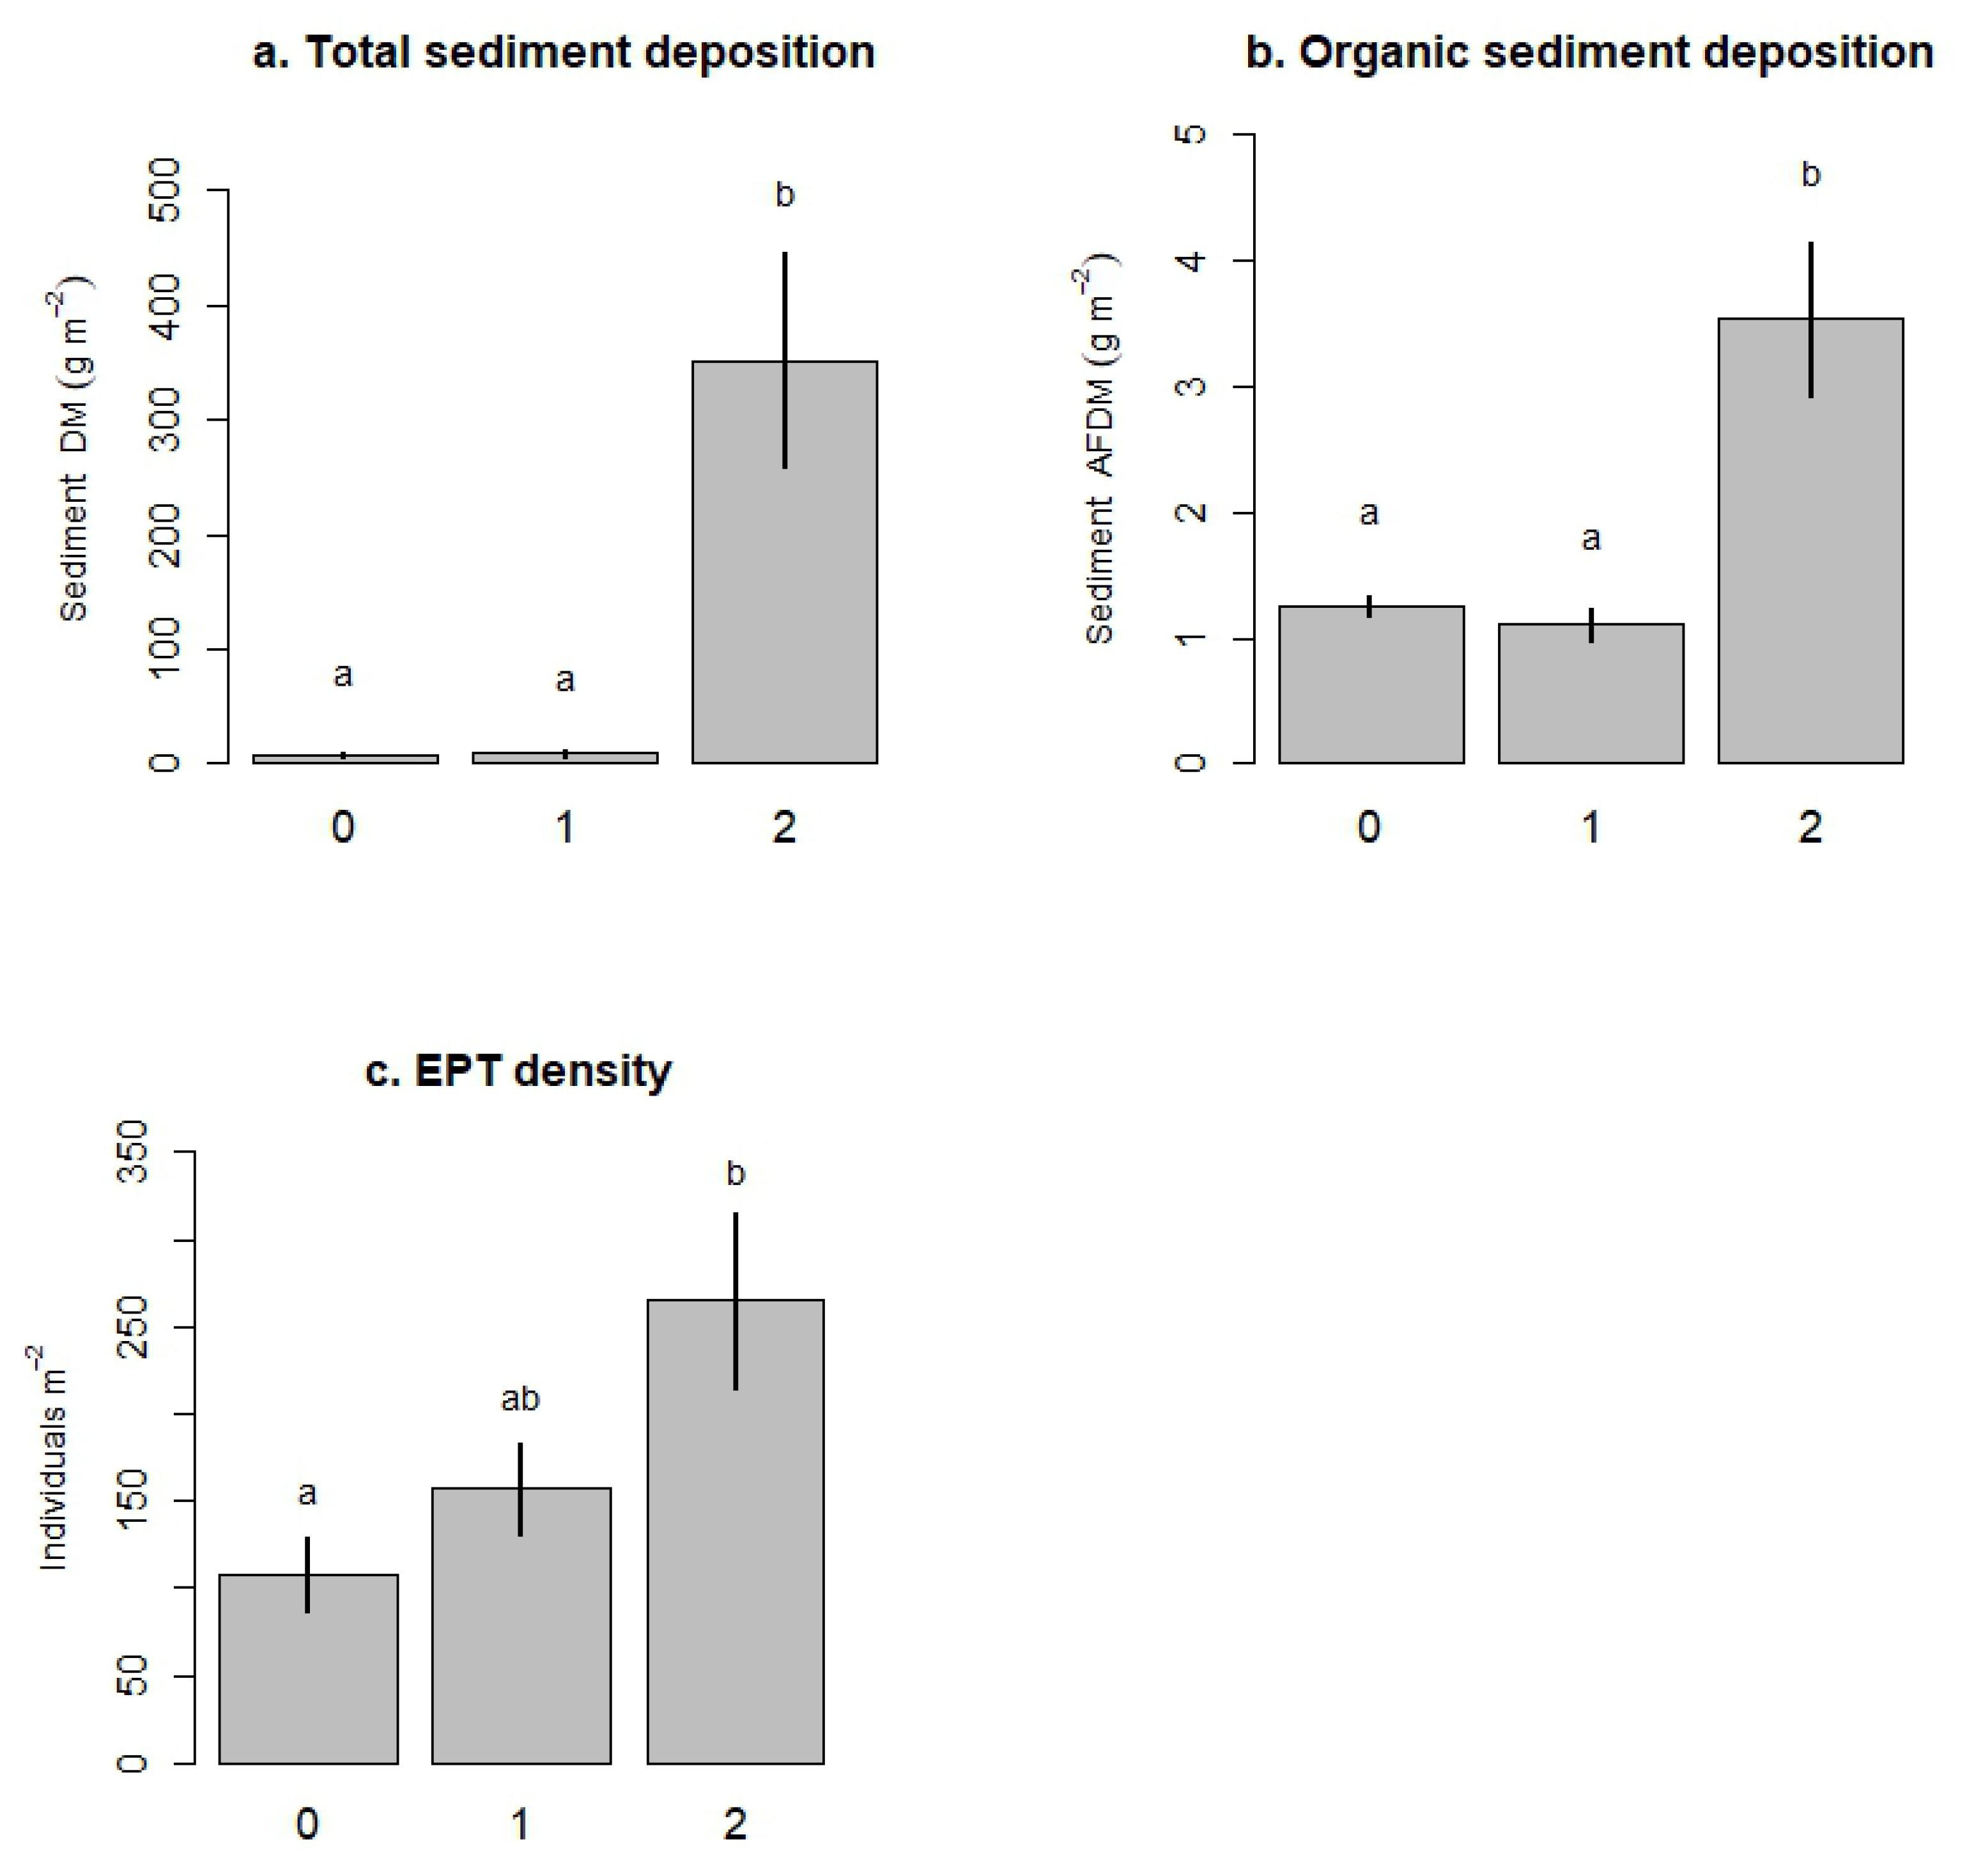
Linear models evaluating response variables in the second-order channels as a function of disturbance level in the tributaries (hypothesis 5, Table 4), indicated that sediment dry mass (total sediment; Figure 8a) and sediment ash-free dry mass (organic sediment; Figure 8b) significantly increased with the level of disturbance to the tributaries. According to Tukey’s HSD post hoc test, total and organic sediment deposition in the maximum level of disturbance (level 2) were significantly higher than sediment deposition in the control and the first level of disturbance (Figure 8a,b). However, even at the highest level of tributary disturbance, average sediment deposition in second-order channels (351.6 ± 93.84 g m−2, mean ± SD) was much lower than deposition in first-order tributaries treated with sediment (1821.7 ± 1083.8 g m−2). On the other hand, we did not detect a significant relationship between tributary level of disturbance and the concentration of nitrate in second-order channels (Table 4; Figure 6). In terms of biological responses, the only variable that significantly responded to the tributary disturbance was EPT density (Table 4; Figure 7). According to our observations, EPT density tended to increase with increasing level of disturbance (Figure 8c). Tukey’s HSD tests indicated that EPT density in the highest level of tributary disturbance (both tributaries treated with both stressors) was significantly higher than EPT density in the control second-order channels (both tributaries with natural levels of nutrients and sediment).
4. Discussion
Our results generally supported the hypothesis that upstream disturbance can influence ecological function and structure of downstream recipient ecosystems in a stream network. However, most of the downstream effects we observed in our study did not support our initial predictions. Due to the small scale of our experimental stream network, our hypotheses were based on the assumption that tributary treatments would affect downstream ecosystems mostly through the transmission of disturbances, or the movement of sediment and nutrients from tributaries to second-order channels. Counter to this assumption, most downstream impacts in our study were the result of within network dispersal of EPT taxa, as a response to stressor additions in the tributaries.
4.1. Stressors Altered Invertebrate Communities and Ecosystem Function in First-Order Channels
In our first hypothesis, we predicted nutrient additions would enhance primary production and organic matter decomposition in our experimental systems, exerting positive bottom-up effects on invertebrate communities [12,39]. However, we did not detect significant individual effects of the nutrient additions on invertebrate density or leaf decomposition rates (Table 1). This may be attributed to the relatively modest increase nutrient concentrations achieved in our experimental setting with fertilizer additions. However, EPT drift flux from first-order channels was strongly depressed by the nutrient treatment (Figure 5), which may indicate there was some increase in food availability in nutrient-enriched channels, which resulted in lower drift of EPT taxa relative to control channels. Active drift is a known mechanism for patch selection of some EPT taxa with high behavioural drift tendency [40]. For example, previous experimental manipulations of resource availability have found inverse relationships between food availability and active drift [41]. Furthermore, O’Callaghan et al. [42] also observed strong nutrient effects on drift patterns, even in the absence of strong effects on invertebrate densities within the experimental units. They attributed this discrepancy to the duration of their experimental manipulations (28 days), arguing their experiment may have been too short to detect long-term changes in community abundance, or shifts in competitive interactions due to changes in food availability [42], a consideration that likely applies to our 22-day manipulation. While our observations are consistent with documented drift responses of EPT taxa, drift results from the first-order channels should be considered with caution throughout this discussion, given the timing and duration of our first-order drift samples. In an attempt to not disrupt subsidies from tributaries to downstream channels, we collected only two-hour samples during daytime. Previous research suggests that this limited sampling window may not have reliably captured the complex effects of the treatments on drift behaviour. For example, in an experimental manipulation of flow carried out at the same experimental facility, ref. [43] found that drift responses to their treatments were stronger at night-time, indicating that time of the day may impact the likelihood of reliably capturing drift responses to stressors in this particular system.
Partially in support of our second hypothesis, sediment additions reduced benthic invertebrate densities, while also increasing EPT drift flux from our first-order channels (Figure 4 and Figure 5). These findings support most published literature reporting deleterious effects of sediment on benthic invertebrate communities (e.g., [16,18,23,42,44]). Increased inputs of fine sediment have been reported to fill interstitial spaces in stream ecosystems, reducing habitat availability for benthic invertebrates, and causing direct negative effects on sensitive species due to coating of gills and respiratory surfaces [10,15,21]. Moreover, sediment additions often induce behavioural drift as a response to impaired habitat quality [21,42,44,45]. The EPT orders in particular, contain several taxa known to respond to sedimentation by drifting short distances to find better habitat patches [40,42,45]. On the other hand, our second hypothesis was not supported regarding the effects of sedimentation on leaf decomposition in our first-order channels. Instead of reducing leaf processing in the streams, as has been generally reported in the literature [18,46,47,48], sediment additions in isolation actually increased leaf decomposition in first-order channels (Figure 4). This unexpected positive response has been previously reported in a few experimental manipulations of sediment in stream ecosystems (e.g., [19,20,49]). Possible mechanisms for this positive effect include increased anaerobic respiration of leaf material buried in sediment [49] and increased physical breakdown by flow carrying abrasive sediment [50].
Leaf decomposition was the only response that supported our third hypothesis predicting non-additive interactions among nutrients and sediment in first-order channels (Figure 4). Leaf decomposition showed clear antagonistic effects of the two stressors; while in isolation both stressors tended to increase decomposition, in combination their effect was completely inhibited, resulting in values similar to those of the control treatments. Similar antagonistic nutrient x sediment interactions were reported for measures associated with leaf processing by Piggott et al. [49]. They observed sediment additions dampened the positive effect of the nutrient enrichment on leaf respiration and cotton tensile strength loss in experimental stream mesocosms. Piggott et al. [49] suggested microbial communities responsible for increased decomposition rates under high nutrient concentrations, had less access to nutrients and oxygen in the water column when sediment was applied [49]. However, in our case the presence of nutrients also dampened the positive effects of sediment, which suggests that nutrient additions inhibited anaerobic microbial respiration in buried leaf packs, a puzzling result that deserves further study.
4.2. Tributaries Influenced Downstream Ecosystems through Dispersal of Sensitive Taxa
Partially in agreement with our fourth hypothesis, we detected significant differences between cumulative- and single-stressor tributary treatments on our second-order channels (Table 3). However, contrary to our predictions these differences were observed for variables without significant nutrient x sediment interactions within the tributaries: EPT density and EPT richness. Both EPT metrics were higher in downstream ecosystems with single-stressor tributaries. Because the treatments did not affect EPT density or richness within tributaries, we attribute this result to their opposing effects on EPT drift from tributaries to second-order channels. Sediment additions augmented the number of EPT drifting out of first-order channels, nutrient additions decreased it, and the combination of both treatments resulted in additive effects on EPT flux (Figure 5). However, higher EPT density recorded in second-order channels with individual-stressor tributaries seems to suggest that the combination of the two stressors within the same tributary reduced EPT drift further than the addition of the stressors in separate tributaries. The fact that this complex multiple-stressor interaction was not detected in drift responses, may be an artifact of the relatively short duration and the timing of our first-order drift samples. As discussed earlier, two-hour daytime samples may not provide a precise measure of the number of invertebrates drifting from first- to second-order channels in our experiment.
Our fifth hypothesis, predicting that disturbance in second-order channels would increase proportionally with disturbance in their tributaries, was partially supported for sedimentation rates in second-order channels (Figure 8). Sediment deposition was significantly higher in second-order channels fed by tributaries with the maximum level of disturbance (level 2: both tributaries treated with sediment and nutrients), relative to second-order channels fed by tributaries in levels 0 (undisturbed tributaries) and 1 (only one tributary with both sediment and nutrients) of disturbance. Interestingly, there was no difference in sediment deposition between tributary disturbance level 0 and level 1, which suggests that adding both nutrients and sediment to a single tributary did not raise sedimentation above background levels in downstream channels. This observation may suggest that significant sediment accumulation in second-order channels was only taking place after a threshold of sediment inputs. Relatively small sediment inputs (i.e., only one tributary treated with sediment) could have been washed through the system or bioturbated, resulting in little sediment accumulation in the substrate of second-order channels. However, our experimental results are not sufficient to test this potential mechanism.
In contrast to our expectations, most biological responses in second-order channels did not show increasing negative impacts with increasing sediment deposition. On the contrary, the density of EPT taxa, a group generally considered sensitive to organic contamination and habitat degradation, increased proportionally with tributary disturbance (Figure 8). We again attribute this paradoxical result to the impacts of the stressors on the flux of organisms from tributaries to downstream channels. Higher disturbance within the tributaries caused higher EPT drift, likely increasing immigration rates in downstream ecosystems. Even though downstream sedimentation increased with tributary disturbance, there was less sediment deposited per unit area in downstream ecosystems than their first-order tributaries. Thus, individuals emigrating from the tributaries may have found more suitable habitat patches in downstream channels than in their source patch. These findings generally fit the mass effects model of the metacommunity framework. According to this model, even though local habitat conditions and species interactions are important in shaping community composition, high rates of dispersal may override local effects and allow species to persist in unfavourable conditions [6]. This mass effect has been recognized as a particularly important force in stream networks, where downstream movement of material and individuals from the tributaries may have a disproportionate effect on downstream ecosystems [2].
4.3. Implications
We used a simplified model of a stream network to link upstream disturbance with effects on downstream ecosystems. However, we do not contend that a short-term experiment in a small channel network can encompass all processes occurring in real river networks. Our experiment was not realistic in terms of spatial and temporal scales, network complexity, and material inputs from colluvial processes into downstream ecosystems. In spite of these limitations, we argue that some interesting patterns and small-scale processes, such as short-distance dispersal of organisms, dilution, and transfer of materials, could be reliably measured in our experimental channel network. Thus, with some caveats in mind, our study offers interesting insights about the potential impacts of multiple stressor interactions on meta-ecosystem dynamics of river networks.
To our knowledge, this is the first experiment explicitly linking multiple stressor effects in tributaries to effects in downstream recipient ecosystems in a river network. Thus, we had little empirical information to compare our results with. However, our observations generally support previous research highlighting the potential role of spatial species interactions within tributaries on downstream ecosystem function. For instance, Patrick et al. [27] observed that the spatial distribution of shredder species among tributaries could regulate particulate organic matter exports from headwaters to downstream ecosystems, due to competitive interactions. Our results showed that stressor additions in tributaries can strongly influence ecological function and structure of downstream ecosystems. In our experimental system, most of these effects were due to impacts on dispersal patterns of sensitive organisms, underscoring the importance of metacommunity frameworks to understand how disturbances at the scale of the tributaries may influence population dynamics in downstream ecosystems [2,6]. In particular, our findings highlight the importance of considering processes occurring at the basin scale to better understand stressor impacts in high-order streams and rivers. Local communities in high-order basins may be strongly influenced by disturbances in their headwater ecosystems, not only through the transmission of those disturbances, but also through their cumulative effects on dispersal behaviour of organisms. This has important implications in terms of conservation and restoration strategies, as management actions should incorporate headwater streams to adequately protect larger-order ecosystems downstream.
Author Contributions
Conceptualization, A.M.C.-S. and J.S.R.; Formal analysis, A.M.C.-S.; Funding acquisition, J.S.R.; Investigation, A.M.C.-S.; Methodology, A.M.C.-S. and J.S.R.; Supervision, J.S.R.; Writing—original draft, A.M.C.-S.; Writing—review and editing, J.S.R. All authors have read and agreed to the published version of the manuscript.
Funding
This research was funded by a grant of the Departamento Administrativo de Ciencia, Tecnología e Innovación de Colombia—COLCIENCIAS (Fondo Francisco José de Caldas, convocatoria 497 de 2009), a fellowship from the Izaak Walton Killam Memorial Fund for Advanced Studies, and a Discovery Grant from the Natural Sciences and Engineering Research Council (Canada).
Acknowledgments
We are grateful to S. Naman, Leslie Yen, A. Yeung, M. Wilson, and L. Perkin, for their valuable field and laboratory assistance. We thank C. Matthaei and two anonymous reviewers for their valuable comments on this manuscript.
Conflicts of Interest
The authors declare no conflict of interest.
Appendix A
Figure A1.
Photo of the experimental channel-network set-up consisting in 24 first-order channels converging in pairs to feed 12 second-order channels (a). Detail of a pair of first-order channels and their second-order recipient (b).
Figure A1.
Photo of the experimental channel-network set-up consisting in 24 first-order channels converging in pairs to feed 12 second-order channels (a). Detail of a pair of first-order channels and their second-order recipient (b).

References
- Benda, L.; Poff, N.L.; Miller, D.; Dunne, T.; Reeves, G.; Pess, G.; Pollock, M. The network dynamics hypothesis: How channel networks structure riverine habitats. BioScience 2004, 54, 413–427. [Google Scholar] [CrossRef] [Green Version]
- Campbell Grant, E.H.; Lowe, W.H.; Fagan, W.F. Living in the branches: Population dynamics and ecological processes in dendritic networks. Ecol. Lett. 2007, 10, 165–175. [Google Scholar] [CrossRef]
- Fisher, S.G. Creativity, idea generation, and the functional morphology of streams. J. N. Am. Benthol. Soc. 1997, 16, 305–318. [Google Scholar] [CrossRef]
- Allan, J.D.; Castillo, M.M. Stream Ecology, Structure and Function of Running Waters; Springer: Dordrecht, The Netherlands, 2007; p. 436. [Google Scholar]
- Gomi, T.; Sidle, R.C.; Richardson, J.S. Understanding processes and downstream linkages of headwater systems. BioScience 2002, 52, 905–915. [Google Scholar] [CrossRef] [Green Version]
- Brown, B.L.; Swan, C.M.; Auerbach, D.A.; Campbell Grant, E.H.; Hitt, N.P.; Maloney, K.O.; Patrick, C. Metacommunity theory as a multispecies, multiscale framework for studying the influence of river network structure on riverine communities and ecosystems. J. N. Am. Benthol. Soc. 2011, 30, 310–327. [Google Scholar] [CrossRef]
- Loreau, M.; Mouquet, N.; Holt, R.D. Meta-ecosystems: A theoretical framework for a spatial ecosystem ecology. Ecol. Lett. 2003, 6, 673–679. [Google Scholar] [CrossRef] [Green Version]
- Tomscha, S.A.; Gergel, S.E.; Tomlinson, M.J. The spatial organization of ecosystem services in river-floodplains. Ecosphere 2017, 8. [Google Scholar] [CrossRef]
- Wipfli, M.S.; Richardson, J.S.; Naiman, R.J. Ecological linkages between headwaters and downstream ecosystems: Transport of organic matter, invertebrates, and wood down headwaters channels. J. Am. Water Resour. Assoc. 2007, 43, 72–85. [Google Scholar] [CrossRef]
- Allan, J.D. Landscapes and riverscapes: The influence of land use on stream ecosystems. Annu. Rev. Ecol. Evol. Syst. 2004, 35, 257–284. [Google Scholar] [CrossRef] [Green Version]
- Riseng, C.M.; Wiley, M.J.; Black, R.W.; Munn, M.D. Impacts of agricultural land use on biological integrity: A causal analysis. Ecol. Appl. 2011, 21, 3128–3146. [Google Scholar] [CrossRef] [Green Version]
- Woodward, G.; Gessner, M.O.; Giller, P.S.; Gulis, V.; Hladyz, S.; Lecerf, A.; Malmqvist, B.; McKie, B.G.; Tiegs, S.D.; Cariss, H.; et al. Continental-scale effects of nutrient pollution on stream ecosystem functioning. Science 2012, 336, 1438–1440. [Google Scholar] [CrossRef] [PubMed] [Green Version]
- Wagenhoff, A.; Lange, K.; Townsend, C.R.; Matthaei, C.D. Patterns of benthic algae and cyanobacteria along twin-stressor gradients of nutrients and fine sediment: A stream mesocosm experiment. Freshw. Biol. 2013, 58, 1849–1863. [Google Scholar] [CrossRef]
- García, L.; Pardo, I.; Cross, W.F.; Richardson, J.S. Moderate nutrient enrichment affects algal and detritus pathways differently in a temperate rainforest stream. Aquat. Sci. 2017, 79, 941–952. [Google Scholar] [CrossRef]
- Wood, P.J.; Armitage, P.D. Biological effects of fine sediment in the lotic environment. Environ. Manag. 1997, 21, 203–217. [Google Scholar]
- Matthaei, C.D.; Weller, F.; Kelly, D.W.; Townsend, C.R. Impacts of fine sediment addition to tussock, pasture, dairy and deer farming streams in New Zealand. Freshw. Biol. 2006, 51, 2154–2172. [Google Scholar] [CrossRef]
- Wagenhoff, A.; Townsend, C.R.; Phillips, N.; Matthaei, C.D. Subsidy-stress and multiple-stressor effects along gradients of deposited fine sediment and dissolved nutrients in a regional set of streams and rivers. Freshw. Biol. 2011, 56, 1916–1936. [Google Scholar] [CrossRef]
- Louhi, P.; Richardson, J.S.; Muotka, T. Sediment addition reduces the importance of predation on ecosystem functions in experimental stream channels. Can. J. Fish. Aquat. Sci. 2017, 74, 32–40. [Google Scholar] [CrossRef]
- Matthaei, C.D.; Piggott, J.J.; Townsend, C.R. Multiple stressors in agricultural streams: Interactions among sediment addition, nutrient enrichment and water abstraction. J. Appl. Ecol. 2010, 47, 639–649. [Google Scholar] [CrossRef]
- Piggott, J.J.; Lange, K.; Townsend, C.R.; Matthaei, C.D. Multiple stressors in agricultural streams: A mesocosm study of interactions among raised water temperature, sediment addition and nutrient enrichment. PLoS ONE 2012, 7, 1–14. [Google Scholar] [CrossRef] [Green Version]
- Wagenhoff, A.; Townsend, C.R.; Matthaei, C.D. Macroinvertebrate responses along broad stressor gradients of deposited fine sediment and dissolved nutrients: A stream mesocosm experiment. J. Appl. Ecol. 2012, 49, 892–902. [Google Scholar] [CrossRef]
- Chará-Serna, A.M.; Richardson, J.S. Chlorpyrifos interacts with other agricultural stressors to alter stream communities in laboratory microcosms. Ecol. Appl. 2018, 28, 162–176. [Google Scholar] [CrossRef] [PubMed] [Green Version]
- Chará-Serna, A.; Epele, L.; Morrissey, C.; Richardson, J. Nutrients and sediment modify the impacts of a neonicotinoid insecticide on freshwater community structure and ecosystem functioning. Sci. Total Environ. 2019, 692, 1291–1303. [Google Scholar] [CrossRef] [PubMed]
- Freeman, M.C.; Pringle, C.M.; Jackson, C.R. Hydrologic connectivity and the contribution of stream headwaters to ecological integrity at regional scales. J. Am. Water Resour. Assoc. 2007, 43, 5–14. [Google Scholar] [CrossRef]
- Rasmussen, J.J.; Wiberg-Larsen, P.; Baattrup-Pedersen, A.; Monberg, R.J.; Kronvang, B. Impacts of pesticides and natural stressors on leaf litter decomposition in agricultural streams. Sci. Total Environ. 2012, 416, 148–155. [Google Scholar] [CrossRef] [Green Version]
- Schneider, S.C.; Kahlert, M.; Kelly, M.G. Interactions between pH and nutrients on benthic algae in streams and consequences for ecological status assessment and species richness patterns. Sci. Total Environ. 2013, 444, 73–84. [Google Scholar] [CrossRef] [Green Version]
- Patrick, C.J.; Fernandez, D.H. The β-richness of two detritivore caddisflies affects fine organic matter export. Oecologia 2013, 172, 1105–1115. [Google Scholar] [CrossRef]
- Bernhardt, E.S.; Likens, G.E.; Hall, R.O.; Buso, D.C.; Fisher, S.G.; Burton, T.M.; Meyer, J.L.; Mcdowell, W.H.; Mayer, M.S.; Bowden, W.B.; et al. Ca not see the forest for the stream? In-stream processing and terrestrial nitrogen exports. BioScience 2005, 55, 219–230. [Google Scholar] [CrossRef]
- Richardson, J.S. Seasonal food limitation of detritivores in a montane stream: An experimental test. Ecology 1991, 72, 873–887. [Google Scholar] [CrossRef]
- Lecerf, A.; Richardson, J.S. Assessing the functional importance of large-bodied invertebrates in experimental headwater streams. Oikos 2011, 120, 950–960. [Google Scholar] [CrossRef]
- Townsend, C.R.; Uhlmann, S.S.; Matthaei, C.D. Individual and combined responses of stream ecosystems to multiple stressors. J. Appl. Ecol. 2008, 45, 1810–1819. [Google Scholar] [CrossRef]
- Kiffney, P.M.; Richardson, J.S. Interactions among nutrients, periphyton, and invertebrate and vertebrate (Ascaphus truei) grazers in experimental channels. Copeia 2001, 2, 422–429. [Google Scholar] [CrossRef]
- APHA. Standard Methods for the Examination of Water and Wastewaters, 21th ed.; American Public Health Association: Washington, DC, USA, 2005. [Google Scholar]
- Merritt, R.W.; Cummins, K.W. An Introduction to the Aquatic Insects of North America, 3rd ed.; Kendall/Hunt Pub. Co.: Dubuque, IA, USA, 1996; p. 862. [Google Scholar]
- Hauer, F.R.; Lamberti, G.A. Methods in Stream Ecology; Academic Press: Burlington, MA, USA, 2007; p. 894. [Google Scholar]
- Nakagawa, S.; Cuthill, I.C. Effect size, confidence interval and statistical significance: A practical guide for biologists. Biol. Rev. 2007, 82, 591–605. [Google Scholar] [CrossRef]
- Gurevitch, J.; Hedges, L.V. Meta-analysis: Combining the results of independent experiments. In Design and Analysis of Ecological Experiments; Scheiner, S., Gurevitch, J., Eds.; Oxford University Press: Cary, NC, USA, 2006; pp. 347–369. [Google Scholar]
- Jackson, M.C.; Loewen, C.J.G.; Vinebrooke, R.D.; Chimimba, C.T. Net effects of multiple stressors in freshwater ecosystems: A meta-analysis. Glob. Chang. Biol. 2016, 22, 180–189. [Google Scholar] [CrossRef] [PubMed]
- Rosemond, A.D.; Benstead, J.P.; Bumpers, P.M.; Gulis, V.; Kominoski, J.S.; Manning, D.W.P.; Suberkropp, K.; Wallace, J.B. Experimental nutrient additions accelerate terrestrial carbon loss from stream ecosystems. Science 2015, 347, 318–321. [Google Scholar] [CrossRef]
- Naman, S.M.; Rosenfeld, J.S.; Richardson, J.S. Causes and consequences of invertebrate drift in running waters: From individuals to populations and trophic fluxes. Can. J. Fish. Aquat. Sci. 2016, 73, 1292–1305. [Google Scholar] [CrossRef] [Green Version]
- Hammock, B.G.; Wetzel, W.C. The relative importance of drift causes for stream insect herbivores across a canopy gradient. Oikos 2013, 122, 1586–1593. [Google Scholar] [CrossRef]
- O’Callaghan, P.; Jocqué, M.; Kelly-Quinn, M. Nutrient- and sediment-induced macroinvertebrate drift in Honduran cloud forest streams. Hydrobiologia 2015, 758, 75–86. [Google Scholar] [CrossRef]
- Naman, S.M.; Rosenfeld, J.S.; Richardson, J.S.; Way, J.L. Species traits and channel architecture mediate flow disturbance impacts on invertebrate drift. Freshw. Biol. 2017, 62, 340–355. [Google Scholar] [CrossRef]
- Piggott, J.J.; Salis, R.K.; Lear, G.; Townsend, C.R.; Matthaei, C.D. Climate warming and agricultural stressors interact to determine stream macroinvertebrate community dynamics. Glob. Chang. Biol. 2015, 21, 1887–1906. [Google Scholar] [CrossRef]
- Connolly, N.M.; Pearson, R.G. The effect of fine sedimentation on tropical stream macroinvertebrate assemblages: A comparison using flow-through artificial stream channels and recirculating mesocosms. Hydrobiologia 2007, 592, 423–438. [Google Scholar] [CrossRef]
- Young, R.G.; Matthaei, C.D.; Townsend, C.R. Organic matter breakdown and ecosystem metabolism: Functional indicators for assessing river ecosystem health. J. N. Am. Benthol. Soc. 2008, 27, 605–625. [Google Scholar] [CrossRef]
- Tank, J.L.; Rosi-Marshall, E.J.; Griffiths, N.A.; Entrekin, S.A.; Stephen, M.L. A review of allochthonous organic matter dynamics and metabolism in streams. J. N. Am. Benthol. Soc. 2010, 29, 118–146. [Google Scholar] [CrossRef] [Green Version]
- Danger, M.; Cornut, J.; Elger, A.; Chauvet, E. Effects of burial on leaf litter quality, microbial conditioning and palatability to three shredder taxa. Freshw. Biol. 2012, 57, 1017–1030. [Google Scholar] [CrossRef] [Green Version]
- Piggott, J.J.; Niyogi, D.K.; Townsend, C.R.; Matthaei, C.D. Multiple stressors and stream ecosystem functioning: Climate warming and agricultural stressors interact to affect processing of organic matter. J. Appl. Ecol. 2015, 52, 1126–1134. [Google Scholar] [CrossRef]
- Yule, C.M.; Gan, J.Y.; Jinggut, T.; Lee, K.V. Urbanization affects food webs and leaf-litter decomposition in a tropical stream in Malaysia. Freshw. Sci. 2015, 34, 702–715. [Google Scholar] [CrossRef] [Green Version]
Figure 1.
Schematic representation of our experimental channel-network set up. Each pair of first-order channels (represented as gray bars) is a treatment for its second-order receptor (black bars). Initials are used to represent stressor additions in first-order treatments (C, control; N, nutrients; S, sediment; NS, nutrient and sediment). Combinations of tributaries represent treatments to second-order channels (C + C, two control tributaries; C + NS, one control tributary and one tributary with both stressors; N + S, nutrients added in one tributary and sediment in the other; and NS + NS, nutrients and sediment added in both tributaries). There were three replicates of each tributary treatment for a total of 12 second-order channels and 24 first-order channels.

Figure 2.
Bar plots illustrating treatment means (± SD) of habitat and ecosystem function variables in first-order channels: control (), sediment (S, ), nutrients (N, ), nutrients + sediment (NS, ). Y-axis units for each panel are indicated in the panel’s title.
Figure 2.
Bar plots illustrating treatment means (± SD) of habitat and ecosystem function variables in first-order channels: control (), sediment (S, ), nutrients (N, ), nutrients + sediment (NS, ). Y-axis units for each panel are indicated in the panel’s title.

Figure 3.
Bar plots illustrating treatment means (± SD) of benthic invertebrate metrics in first-order channels: control (), sediment (S, ), nutrients (N, ), nutrients + sediment (NS, ). Y-axis units for each panel are indicated in the panel’s title.
Figure 3.
Bar plots illustrating treatment means (± SD) of benthic invertebrate metrics in first-order channels: control (), sediment (S, ), nutrients (N, ), nutrients + sediment (NS, ). Y-axis units for each panel are indicated in the panel’s title.

Figure 4.
Standardized effect size (Hedge’s d ± 95% CI) for significant main and interactive effects of the stressors on first-order channels. Letters are used to represent main effects (N, nutrients; S, sediment) and interactions (N*S, nutrients × sediment). For main effects positive values indicate increases in the response variable, whereas negative values indicate the opposite. For interactions confidence intervals overlapping zero indicate additive interactions, positive values denote synergies, and negative values indicate antagonisms. Symbols are used to represent significance according to the linear models presented in Table 1: ** , * , .

Figure 5.
Plots representing the impact of the stressor treatments on the frequency of zeros (a) and log-transformed counts (b) of individuals from the orders Ephemeroptera, Plecoptera, and Trichoptera drifting out of the first-order channels on day 22. Letter notation for the treatments is consistent with Figure 1.

Figure 6.
Bar plots illustrating treatment means (± SD) of habitat and ecosystem function variables in second-order channels: two control tributaries (C + C, ), one control tributary and one tributary with both stressors (C + NS, ), nutrients added in one tributary and sediment in the other (N + S, ), nutrients and sediment added in both tributaries (NS + NS, ). Y-axis units for each panel are indicated in the panel’s title.

Figure 7.
Bar plots illustrating treatment means (± SD) of benthic invertebrate metrics in second-order channels: two control tributaries (C + C, ), one control tributary and one tributary with both stressors (C + NS, ), nutrients added in one tributary and sediment in the other (N + S, ), nutrients and sediment added in both tributaries (NS + NS, ). Y-axis units for each panel are indicated in the panel’s title.

Figure 8.
Bar plots illustrating the effect of tributary level of disturbance on total sediment deposition (a), organic sediment deposition (b), and EPT density (c) in recipient second-order channels. Treatments in the x-axis represent: no disturbance in the tributaries (0, tributary treatment C + C in Figure 1), one tributary disturbed (1, tributary treatment C + NS in Figure 1), two tributaries disturbed (2, tributary treatment NS + NS in Figure 1). Bars represent the mean of each tributary treatment (±SE, ). Letters indicate significant differences among the treatments according to Tukey’s Honestly Significant Difference tests.


Table 1.
ANOVA summary of linear models evaluating impacts of the stressor treatments on response variables of the first-order channels. Significant effects () are indicated in bold.
Table 1.
ANOVA summary of linear models evaluating impacts of the stressor treatments on response variables of the first-order channels. Significant effects () are indicated in bold.
| N | S | N*S | |||||
|---|---|---|---|---|---|---|---|
| Response Variables | df | F | P | F | P | F | P |
| Habitat variables | |||||||
| Sediment dry mass | 1, 21 | 0.592 | 0.450 | 114.206 | <0.0001 | 1.061 | 0.315 |
| Sediment AFDM | 1, 21 | 2.218 | 0.151 | 11.349 | 0.003 | 2.284 | 0.146 |
| Sediment % organic | 1, 21 | 0.984 | 0.333 | 19.115 | <0.0001 | 0.823 | 0.375 |
| Benthic invertebrates | |||||||
| Total density | 1, 18 | 0.002 | 0.966 | 5.975 | 0.025 | 0.000 | 0.988 |
| Total richness | 1, 18 | 0.240 | 0.630 | 0.004 | 0.953 | 2.452 | 0.135 |
| EPT density | 1, 18 | 0.320 | 0.578 | 1.343 | 0.262 | 0.576 | 0.458 |
| EPT richness | 1, 18 | 0.110 | 0.744 | 0.504 | 0.487 | 2.440 | 0.136 |
| Scraper density | 1, 18 | 1.483 | 0.239 | 0.007 | 0.934 | 1.144 | 0.299 |
| Shredder density | 1, 18 | 0.298 | 0.592 | 1.270 | 0.275 | 0.381 | 0.545 |
| Predator density | 1, 18 | 0.062 | 0.806 | 10.492 | 0.005 | 0.016 | 0.902 |
| Collector density | 1, 18 | 0.035 | 0.854 | 3.585 | 0.074 | 0.065 | 0.801 |
| drift rate day 2 | 1, 18 | 0.033 | 0.857 | 0.828 | 0.374 | 0.132 | 0.720 |
| drift rate day 22 | 1, 18 | 1.769 | 0.205 | 0.087 | 0.773 | 0.023 | 0.881 |
| Ecosystem function | |||||||
| Leaf decomposition | 1, 18 | 2.351 | 0.141 | 2.185 | 0.155 | 8.520 | 0.008 |
Table 2.
Parameter estimates of the zero-inflated Poisson regression explaining EPT drift flux from first-order channels on day 22. The model includes two components: a count model (Poisson with log link), and a zero-inflation model (binomial with logit link). Significant effects () are indicated in bold.
| Count Model | Zero-Inflation Model | |||||||
|---|---|---|---|---|---|---|---|---|
| Factor | Estimate | SE | z | P | Estimate | SE | z | P |
| N | 1.735 | 0.307 | 5.650 | <0.0001 | 3.302 | 154.596 | 0.021 | 0.983 |
| S | −0.619 | 0.307 | −2.060 | 0.044 | −2.689 | 154.596 | −0.017 | 0.986 |
| N*S | −0.015 | 0.307 | −0.034 | 0.973 | 2.969 | 154.596 | 0.019 | 0.985 |
Table 3.
Summary of independent t-tests to compare response variables in second-order channels fed by tributaries where the nutrients and sediment were applied in combination (cumulative; tributary treatment b in Figure 1) and second-order channels fed by tributaries where the stressors were applied separately (single; tributary treatment c in Figure 1). Significant effects () are indicated in bold.
| Cumulative | Single | t-Test | ||||
|---|---|---|---|---|---|---|
| Response Variable | Mean | SD | Mean | SD | t | P |
| Habitat variables | ||||||
| Sediment dry mass (g m−2) | 133.53 | 113.53 | 502.79 | 249.26 | −2.4 | 0.076 |
| Sediment AFDM (g m−2) | 16.18 | 3.68 | 23.82 | 15.29 | −0.6 | 0.659 |
| Nitrate (μg L−1) | 76.5 | 0.5 | 80.5 | 0.5 | −1.1 | 0.446 |
| Benthic invertebrates | ||||||
| Total density (ind m−2) | 1083.3 | 770.1 | 823.6 | 420.3 | 0.5 | 0.642 |
| Total richness (taxa per mesocosm) | 11.3 | 3.1 | 11.7 | 2.3 | −0.2 | 0.888 |
| EPT density (ind m−2) | 156.9 | 44.9 | 254.9 | 37.0 | −2.9 | 0.045 |
| EPT richness (taxa per mesocosm) | 3.3 | 0.6 | 6.0 | 1.0 | −4.0 | 0.025 |
| Response Variable | Mean | SD | Mean | SD | t | P |
| Scraper density (ind m−2) | 44.1 | 29.4 | 122.5 | 44.9 | −2.5 | 0.074 |
| Shredder density (ind m−2) | 39.2 | 30.6 | 58.8 | 58.8 | −0.5 | 0.644 |
| Predator density (ind m−2) | 78.4 | 55.7 | 39.2 | 22.5 | 1.1 | 0.350 |
| Collector density (ind m−2) | 142.1 | 51.6 | 122.5 | 17.0 | 0.6 | 0.586 |
| Drift rate day 2 (ind h−1) | 1.3 | 1.2 | 1.3 | 0.3 | 0.0 | 0.976 |
| Drift rate day 22 (ind h−1) | 0.3 | 0.1 | 0.6 | 0.1 | −3.2 | 0.123 |
| Ecosystem function | ||||||
| Leaf decomposition (g AFDM lost) | 0.5 | 0.1 | 0.7 | 0.1 | −1.8 | 0.140 |
Table 4.
ANOVA summary of linear models evaluating the impact of disturbance level within the tributaries on response variables of second-order channels. Significant effects (P < 0.05) are indicated in bold.
Table 4.
ANOVA summary of linear models evaluating the impact of disturbance level within the tributaries on response variables of second-order channels. Significant effects (P < 0.05) are indicated in bold.
| Stress Level | |||
|---|---|---|---|
| Response Variables | df | F | P |
| Habitat variables | |||
| Sediment dry mass | 2, 6 | 19.024 | 0.003 |
| Sediment AFDM | 2, 6 | 13.852 | 0.006 |
| Sediment % organic | 2, 6 | 2.113 | 0.202 |
| Nitrate | 2, 6 | 0.106 | 0.901 |
| Benthic invertebrates | |||
| Total density | 2, 6 | 1.344 | 0.329 |
| Total richness | 2, 6 | 4.167 | 0.081 |
| EPT density | 2, 6 | 5.187 | 0.049 |
| EPT richness | 2, 6 | 1.716 | 0.232 |
| Scraper density | 2, 6 | 1.972 | 0.220 |
| Shredder density | 2, 6 | 2.197 | 0.192 |
| Predator density | 2, 6 | 1.839 | 0.238 |
| Collector density | 2, 6 | 0.736 | 0.518 |
| Drift rate day 2 | 2, 5 | 0.299 | 0.754 |
| Drift rate day 22 | 2, 6 | 1.760 | 0.264 |
| Ecosystem function | |||
| Leaf decomposition | 2, 6 | 0.300 | 0.751 |
Publisher’s Note: MDPI stays neutral with regard to jurisdictional claims in published maps and institutional affiliations. |
© 2021 by the authors. Licensee MDPI, Basel, Switzerland. This article is an open access article distributed under the terms and conditions of the Creative Commons Attribution (CC BY) license (https://creativecommons.org/licenses/by/4.0/).
Share and Cite
MDPI and ACS Style
Chará-Serna, A.M.; Richardson, J.S. Multiple-Stressor Interactions in Tributaries Alter Downstream Ecosystems in Stream Mesocosm Networks. Water 2021, 13, 1194. https://doi.org/10.3390/w13091194
AMA Style
Chará-Serna AM, Richardson JS. Multiple-Stressor Interactions in Tributaries Alter Downstream Ecosystems in Stream Mesocosm Networks. Water. 2021; 13(9):1194. https://doi.org/10.3390/w13091194
Chicago/Turabian StyleChará-Serna, Ana M., and John S. Richardson. 2021. "Multiple-Stressor Interactions in Tributaries Alter Downstream Ecosystems in Stream Mesocosm Networks" Water 13, no. 9: 1194. https://doi.org/10.3390/w13091194
Note that from the first issue of 2016, this journal uses article numbers instead of page numbers. See further details here.