Article

Fate and Occurrence of Polycyclic Aromatic Hydrocarbons and Their Derivatives in Water and Sediment from Songhua River, Northeast China

1
International Joint Research Center for Persistent Toxic Substances (IJRC-PTS), State Key Laboratory of Urban Water Resource and Environment, Harbin Institute of Technology (HIT), Harbin 150090, China
2
International Joint Research Center for Arctic Environment and Ecosystem (IJRC-AEE), Polar Academy/School of Environment, Harbin Institute of Technology (HIT), Harbin 150090, China
3
Heilongjiang Provincial Key Laboratory of Polar Environment and Ecosystem (HPKL-PEE), Harbin Institute of Technology (HIT), Harbin 150090, China
4
Heilongjiang Institute of Labor Hygiene and Occupational Diseases, Harbin 150028, China
5
Institute of Natural Sciences, North-Eastern Federal University, 677000 Yakutsk, Russia
6
IJRC-PTS-NA, Toronto, ON M2N 6X9, Canada
*
Authors to whom correspondence should be addressed.
Water 2021, 13(9), 1196; https://doi.org/10.3390/w13091196
Submission received: 13 March 2021 / Revised: 19 April 2021 / Accepted: 21 April 2021 / Published: 26 April 2021
(This article belongs to the Section Water Quality and Contamination)

Abstract

:
The Songhua River is one of the most populated and oldest industrial areas in Northeast China. To understand the sources and distribution of polycyclic aromatic hydrocarbons and their derivatives, such as 16 priority (PAHs), 33 methylated (Me-PAHs), and 12 nitrated (NPAHs) in river water and sediment, were noticed. The concentrations of ∑PAHs, ∑Me-PAHs, and ∑NPAHs in river water scaled from 135 to 563, 9.36 to 711, and 1.26 to 64.7 ng L−1, with mean values of 286, 310, and 17.9 ng L−1, and those in sediments were from 35.8 to 2000 ng g−1, 0.62 to 394 ng g−1, and 0.28 to 176 ng g−1 (dry weight) with mean values of 283, 103, and 21.7 ng g−1. The compositions proved that two-ring and three-ring compounds of PAHs, NPAHs, and four-ring, six-ring of Me-PAHs were prevalent in water samples; in contrast, four-ring dominated in sediments. Principal components analysis (PCA) and diagnostic ratios confirmed that pollutant source was mixed petrogenic and pyrogenic origin. The fugacity fraction (ƒƒ) was also calculated to explain the trend of sediment–water exchange, high ƒƒ values found in summer, for most HMW PAHs and Me-PAHs that these substances acted as a secondary source of emissions from sediment to water. The risk assessment for water was categorized as high.

1. Introduction

Rivers are important channels through which anthropogenic contaminants, land-based and natural materials, enter the oceans; via river runoff, about 85% of the materials from land are transported into the sea [1]. One of these materials, (PAHs) polycyclic aromatic hydrocarbons are a group of widespread organic compounds that represent semivolatile, lipophilic, toxic, and persistent pollutants regarding urban and industrial sources and environmental behavior [2]. Among the contaminants, PAHs because of their ubiquity are considered parameters of interest and the present of compounds which represent a health risk such as Benzo(a)pyrene (BaP) [3]. According to their properties and molecular weights, PAHs can be divided into two types: high molecular weight (HMW) compounds with four to six benzenoid rings that dominate in sediments, and low molecular weight (LMW) compounds with two or three benzenoid rings that usually dominate in water [4]. PAHs in the environment come basically from two sources: (i) pyrogenic PAHs produced by asphalt processing, waste incineration, fossil fuel combustion, and biomass burning, (ii) petrogenic PAHs connected with refined oil spills and crude. One to several methyl groups is commonly used to distinguish pyrogenic PAHs. Besides, alkylated PAHs contain one to several methyl groups while two to three rings are commonly observed in petrogenic PAHs. Alkylated PAHs are categorized based on the carbon number of alkylated substituents as well as the parent rings number and they are especially significant in crude oil, where alkylated PAHs account for 90% of the PAHs [5]. PAHs are released by the atmosphere, urban runoff, municipal and industrial effluents in coastal environments [6]. Related to PAHs derivatives, for instance, (NPAHs), which are launched especially from combustion sources [7]. Furthermore, NPAHs, specifically 2-nitro-fluoranthene and 2-nitro-pyrene, are formed in a secondary process that used a gas that is abundant in air pollution [8]. Relevant sources of Me-PAHs and PAHs include vehicle pollution, industries, as well as incomplete combustion [9]. Carbon products (oil, petroleum) are also a source of polycyclic aromatic compounds due to their transportation and processing [10]. In addition, by using topologically simple Hückel theory, researchers attempted to elucidate the carcinogenic activity of Me-PAHs. The authors discovered that a number of these derivatives are very toxic and harmful to human health, more than some polycyclic aromatic hydrocarbons, because of their carcinogenicity [11]. Therefore, Me-PAHs and NPAHs have been of great of interest due to their higher toxicity [12]. Methylbenzaanthracene and Benzo[a]pyrene have strong carcinogenic action, whilst there were moderate and poorly active methyl-benzo[c]phenanthrens substituted in positions (3, 4, and 5) [13]. Besides that, PAHs derivatives had been recognized as direct carcinogens causing inflicting and greater harm [14]. Furthermore, PAHs are transformed into derivatives with the aid of metabolic reactions in the physical and chemical responses in the air [15]. PAHs inputs, especially to the aquatic organisms, pose a very high health risk to wildlife and human health [16]. The targets of the current research are to (1) explore the concentration degrees, and distribution of PAHs, NPAHs, and Me-PAHs in sediment and water from the river, the third-largest river in northeastern China, and diagnose their possible sources, (2) verify the potentially poisonous influences of PAHs, Me-PAHs, and NPAHs bound to bottom sediments and water, and (3) estimate the effects obtained with statistics recorded worldwide. The outcomes of this research will add new data to the international database and produce valuable information for regulatory actions to enhance environmental quality.

2. Materials and Methods
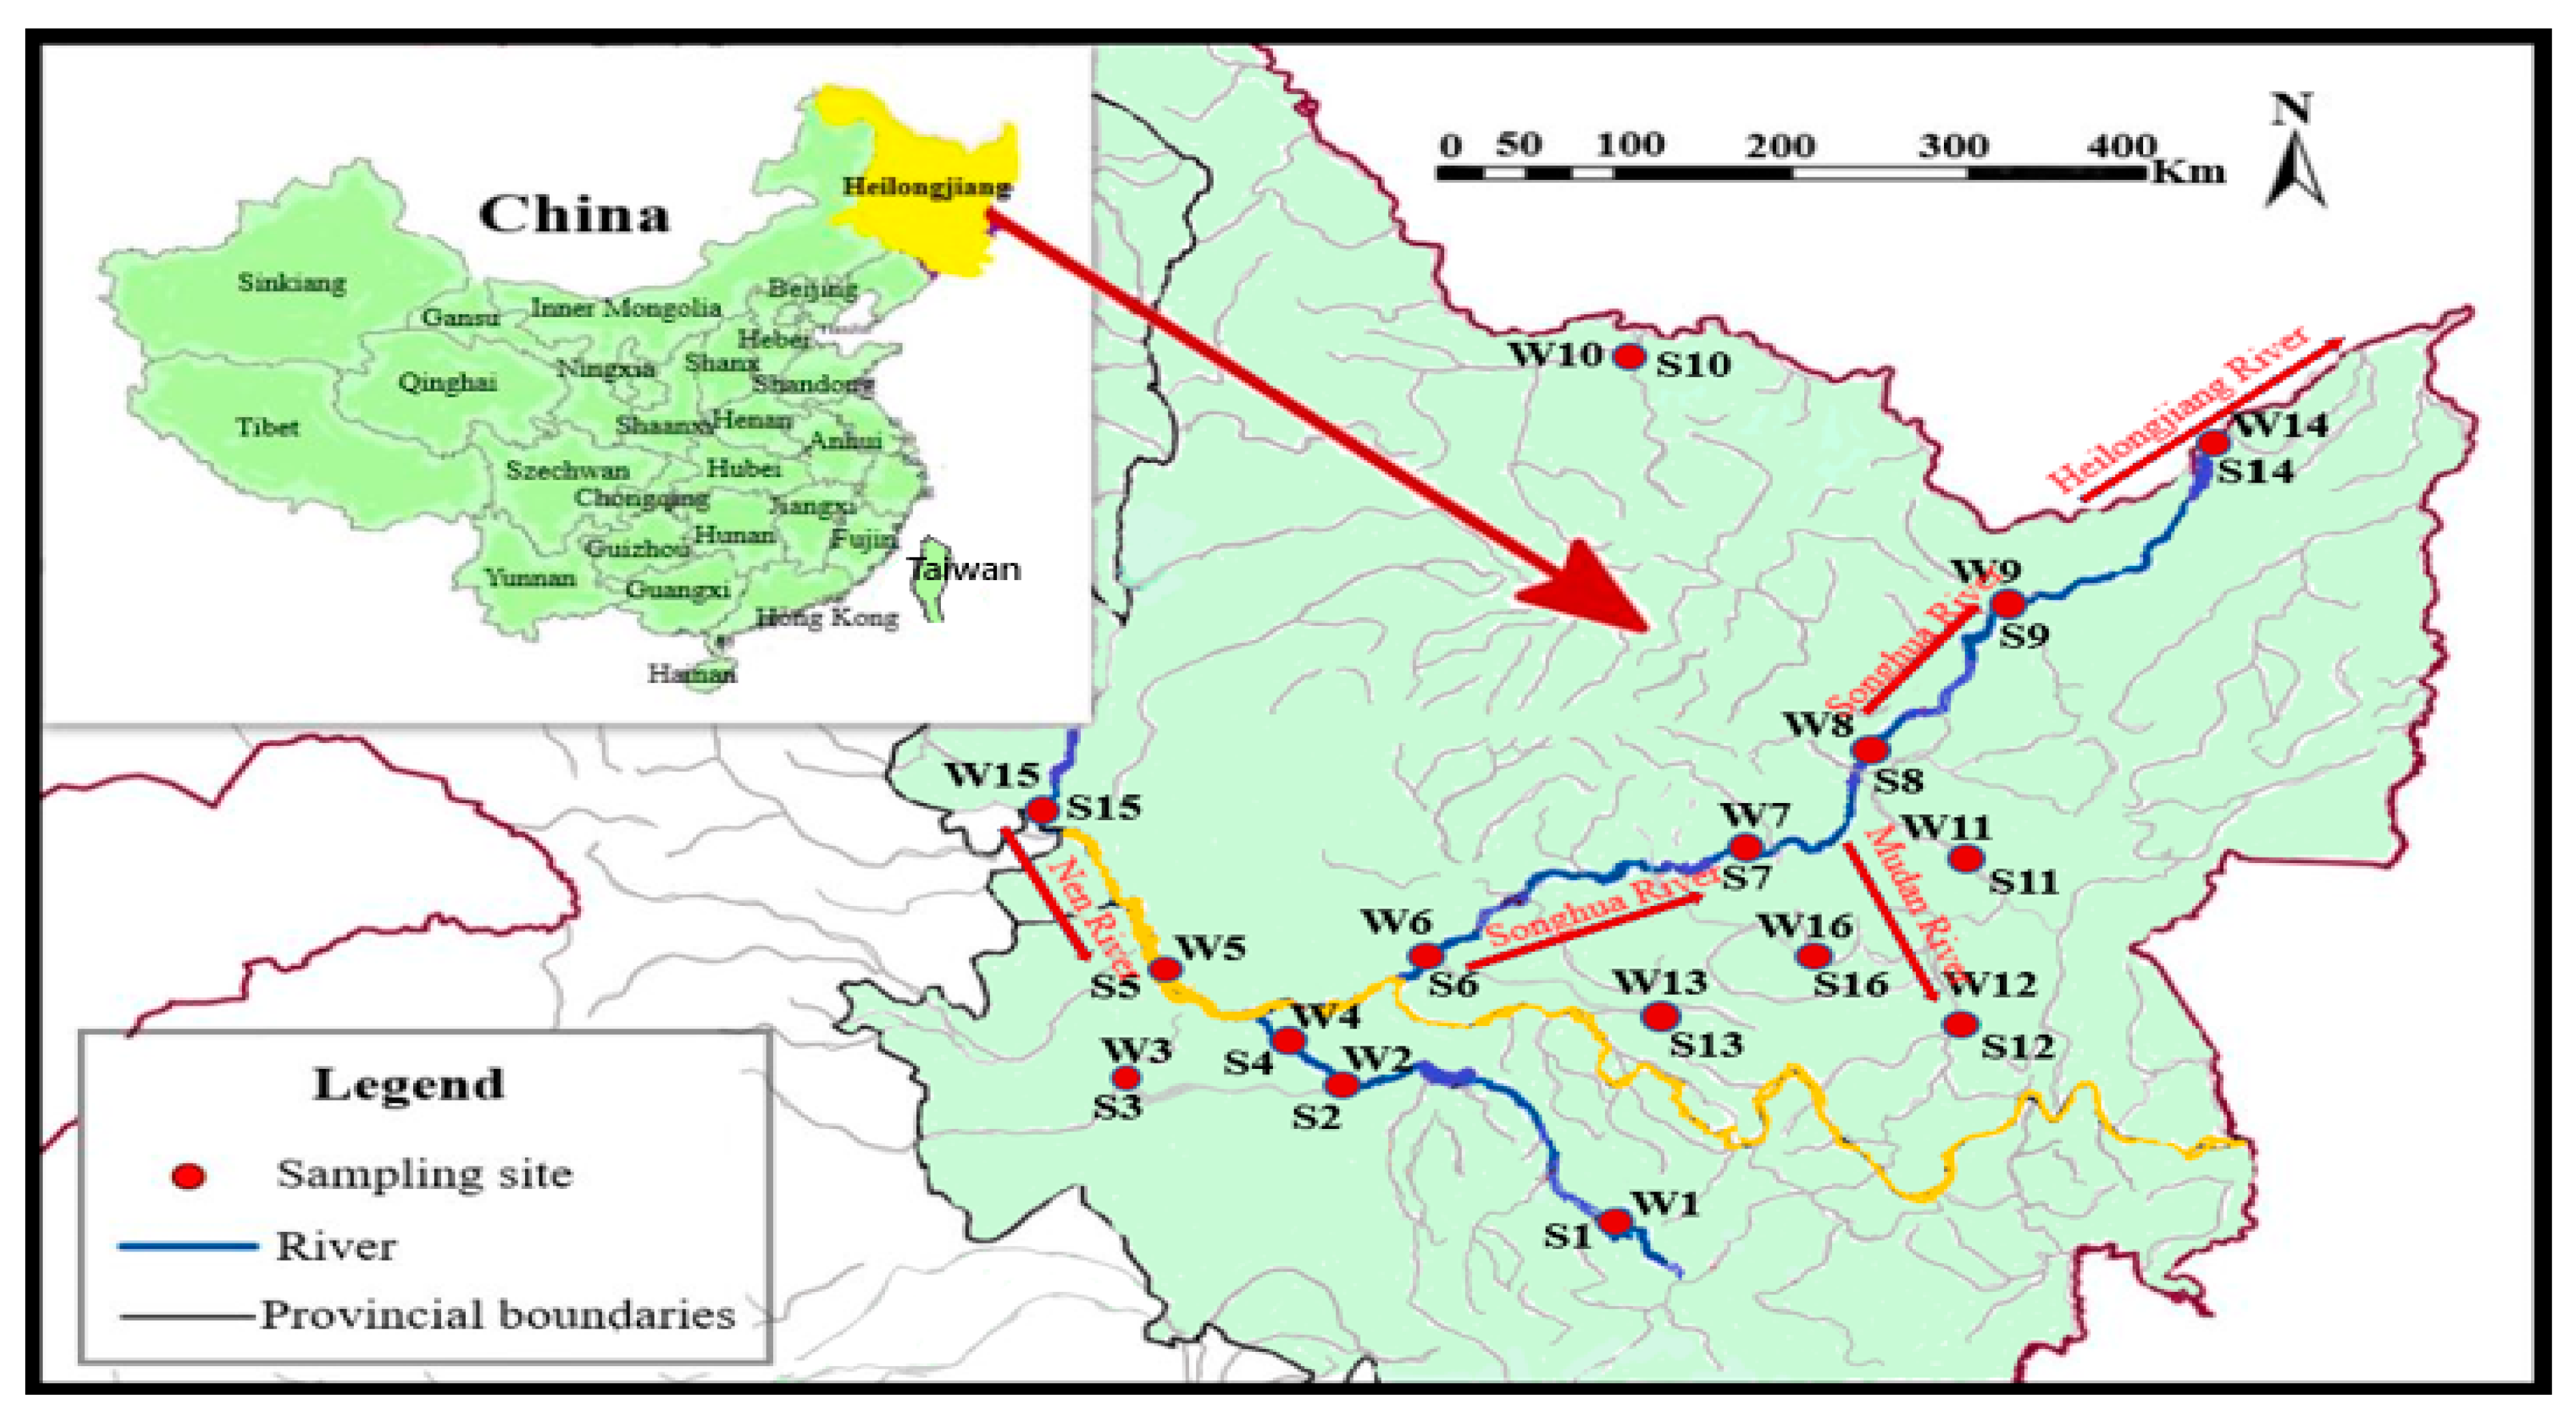
2.1. Sampling Sites

The Songhua River has a catchment area of around 556,800 km2 and is located between 41°42′ N and 51°48′ N, and between 119°52′ E and 132°31′ E [17]. With a length of 1970 km, it is in China the third-largest river, and among the largest sides of the Heilong River, consisting the Second Songhua River, the Nen River. Additionally, Heilongjiang province, which is located in the northeast, the coldest area in China, and the heating season is around 6 months [18]. There are various large urban and populated areas (such as Harbin and Jiamusi) along the river, and all these cities dispose of treated wastewater into the river, which turns into the main source of toxicity.
Thirty-two river water and 54 sediment samples were gathered in 6 months, establishing from June till December 2017, comprising summertime and winter seasons in the year. The 16 water and sediment testing sites (S1–S16 and W1–W16) were chosen involving the form of anthropogenic input (upstream and downstream of specific high, medium, and small cities; Figure 1 and Table S1 in Supplementary Materials). The surface sediment samples were collected from a depth of 0–20 cm. The technique for accumulating sediment and water samples was once mentioned in our earlier research [18]. In summary, 1 L for each water sample gathered at testing sites was put into amber glass bottles and were capped with Teflon-lined caps. Samples were (i) transformed with hydrochloric acid (pH 2–3) and (ii) then stored at 4 °C in darkness. The surface sediment samples ranging from 0 to 10 cm were (i) tacked and saved in aluminum containers, (ii) then freeze-dried, and (iii) finally stored in darkness at −20 °C. All samples were transmitted to the Laboratories of the International Joint Research Center for Persistent Toxic Substances for analyses.

2.2. Analytical Procedure

Solid-phase extraction (SPE) was used to extract the selected compounds from water samples (1 L) filtered through a 0.45 m membrane filter (Millipore, Billerica, MA, USA), as mentioned previously [18]. Tandem linked HLB cartridges (500 mg·6 cc−1), (Water-MILFORD, Massachusetts, USA) were noticed of DCM with 5 and 5 mL of MeOH, accompanied by ultrapure water (5 mL) at a rate of approximately 1 mL min−1. After that, water samples (1 L) were loaded at a rate of about 5 mL min−1. After drying for 60 min with a gentle stream of N2, the SPE cartridges were eluted from the sorbent as follows: (i) the analytes were eluted from the sorbent into 15 mL tubes with 10 mL of methanol in ethyl acetate (15% v/v) at a flow rate of 1 mL/min, (ii) the extracts were concentrated by a gentle stream of N2 to approximately 1 mL, (iii) then transferred to 1.5 mL amber glass vials, and continuously dried under N2 for derivatization. For sediment, ultrasonic extraction was used. Briefly, (i) 5 g of sediment sample (freeze-dried and homogenized), (ii) then added 25 mL mixture solvent of methanol–dichloromethane (1:1 v/v) was ultrasonically extracted for 20 min, and (iii) centrifuged at 3000 rpm for 5 min; the supernatant was collected; extraction was repeated two more times; after that (iv) the extracts were combined into a flask. (v) After that, the extract was concentrated to approximately 1 mL and redissolved into 500 mL Milli-Q water, and finally (vi) the solution was extracted by SPE procedure similar to that described previously.

2.3. Instrumental Analysis

The derivatization for GC–MS analysis, briefly, (i) the extract was concentrated to 1.0 mL and transferred to an amber GC vial, (ii) afterward dried under N2; 100 µL BSTFA with 1% TMCS and 50 µL pyridine was added in the GC vial; reacted at 70 °C for 60, (iii) then after the temperature was brought to ambient conditions, 50 ng of pyrene-d10 was added as an internal standard, and (iv) the sample was diluted to 0.5 mL with isooctane for analysis by GC–MS. The detection of PAHs, Me-PAHs, and NPAHs were performed by use of Agilent 6890 N gas chromatograph interfaced with a 5973 C mass selective detector “MSD” as well as an HP-1 MS GC column (30 m, 0.25 mm, i.d., 0.25-lm film thickness) and equipped with an Agilent 7683B autosampler. Helium was used as the carrier gas with a flow rate of 1.0 mL min−1. Injector temperature was 250 °C. The GC oven temperature was kept at 100 °C for 1 min, followed by a first ramp at 10 °C min−1 to 200 °C, a second ramp at 3 °C min−1 to 280 °C, and held for 2 min. The lists of all transfer variables, including collision energy as well as retention time, are listed in Table S2, as well as Figure S1 (Supplementary Materials).

2.4. Quality Assurance/Quality Control (QA/QC)

All of the data was established, including quality assurance (QA) as well as quality control (QC). A blank procedural and a matrix spike (20 ng/L dry weight) with sediment samples and 100 ng/L for water samples), and to verify the contaminants, a matrix spike extra was accurately checked, peak identification and measurement in each batch of 12 samples analyzed. Two levels of matrix-spiking (100 uL solution with 50 or 500 ng of native standards in acetone) were spiked into the samples for triplicate tests, left for 30 min stabilization, then the SPE procedures were followed as above. The calibration curve of all the target analytes was prepared at concentrations ranging from 1 to 500 ng/mL (1, 5, 10, 20, 50, 100, 200, and 500 ng/mL) for native standards with 100 ng/mL of internal standards. Unchanging level of internal standard (100 ng/mL) with a sequence of injections of objective compounds at different concentrations was attained to determine the system of the linear range. If each of the sample extracts reached the range, they would be diluted appropriately to get the response within the calibration range.

2.5. Determination of Water, Sediment Equilibrium Partitioning, and Risk Assessment

The fugacity fraction (ff), applied to evaluate the chemical exchange manner between water and sediment as well as equilibrium states [19], is defined as
f f = K OC K OC + K OC
where Koc is the organic carbon normalized partition coefficients, and K OC is the in-situ water, sediment partition coefficient, given by:
K OC = C S C aq f OC
In the above equation, Cs (µg kg−1) is the concentration of PAHs in solids, Caq (ng L−1) is the concentration of the aqueous phase, and ƒoc (unitless) is the organic carbon fraction of the sediment [20].
Water-sediment equilibrium shows that the fugacity (ff) values are equal to 0.5; as a result, the net-diffusion flux is close to zero, which is in perfect agreement with the study performed by Wang et al. [21]. For fugacity (ff) values higher than 0.5, it was noticed a migration of PAHs compound from the surface sediment to the water, and in this typical case, the sediment is admitted as a secondary emission source. Conversely, the sediment acts as a sink for fugacity (ff) values less than 0.5 and, in that typical case, migration of PAHs from the water to the sediment.
Furthermore, risk assessment is an essential method for identifying the particular effects of chemicals to find an appropriate risk minimization solution and assessing the adverse effects of PAHs exposure on human health, defining the target organ [22]. Risk Quotients (RQ) were commonly utilized on aquatic biota to evaluate the probable ecological risk of PAHs. These risk quotients (RQ) are given as follows:
RQ NCs = C PAHs NCs
RQ MPCs = C PAHs MPCs
where RQMPCs were risk quotients maximum permissible concentrations, “MPCs” and RQNCs represented risk quotients of negligible concentrations “NCs” of PAHs in water. Moreover, Ecological Risk Assessment below describes the risk state according to both RQNCs and RQMPCs level, where CQV(NCs) represents the NC quality values of PAHs and CQV(MPCs) represents the MPC quality values. The RQ value of each individual PAHs was compared with a reference-quality value. RQNCs < 1.0 indicate negligible risk from individual PAHs, RQNCs > 1.0 and RQMPCs < 1.0 indicate moderate risk and RQMPCs > 1.0 indicate severe contamination of individual PAHs. For the RQs of total PAHs (RQ∑PAHs), RQ∑PAHs(NCs) < 1.0 indicate very low risk, 1 ≤ RQ∑PAHs(NCs) < 800 indicate low to moderate risk and RQ∑PAHs(MPCs) ≥ 1 and RQ∑PAHs(NCs) ≥ 800 indicate high risk [23].
The potential carcinogenic toxicity of the assessed sediments was calculated applying the total BaP toxic equivalence quotient (TEQCCARC), which is formed as:
TEQ CARC = C i × TEFi
where TEFi stands for the corresponding toxicity equivalence factor relative to BaP and Ci represents the concentration (ng·L−1) of carcinogenic (i) potentially contained in PAHs, namely BaA, BaP, BkF, BbF, Chr, DahA, and IndP [24].

2.6. Statistical Analysis

(SPSS 25.0) statistical software packages were used to conduct statistical analyses. The results were given in the form of a range mean and standard deviation. Analysis of variation (ANOVA) tests were used to calculate differences in Me-PAHs, NPAHs, and PAHs values at sampling sites. To recognize the origins of compounds, PCA were used to present relationships and trends within datasets.

3. Results and Discussion

3.1. Concentration Levels of PAHs, Me-PAHs, and NPAHs in Water and Sediment

Analysis of 61 compounds of interest, 16 PAHs, 33 Me-PAHs, and 12 NPAHs, was evaluated in river water and sediment alongside the Songhua River in Northeast China. This can be seen in Table 1. The total concentrations of PAHs, Me-PAHs, and NPAHs ranged from 135 to 562, 9.36 to 711, and 1.26 to 24.5 ng·L−1, and the mean concentrations of 285, 155, and 14.5 ng·L−1 (Table 1). It was found that virtually all mean values of PAHs in this study were greatly higher than the PAHs detected in the waters of the Yangtze River China [25]. Comparatively, the highest average concentration was noticed in PAHs at site W11 (29.0 ± 14.7 ng·L−1) and followed by Me-PAHs at site W10 (8.17 ± 11.9 ng·L−1; Table S3 in Supplementary Materials), emphasizing the occurrence of pollution in the existing area. Site W11 is located in the core of the Mudan River. Site W10 was in the middle of the Tangwang River, as displayed in Figure 1. The lowest concentration in water was discovered in NPAHs at Site W7 (3.42 ± 0.13 ng·L−1), which is positioned downstream of Tonghe County (Figure 1). Pollution levels for PAHs, including their derivatives in water, were characterized into four groups: low polluted, ≤50 ng·L−1, slightly polluted, 50–250 ng·L−1; moderately polluted, 250–1000 ng·L−1; very polluted, ≥1000 ng·L−1 [22]. Relating to this classification, samples at the three sites, W11, PAHs, W10, Me-PAHs, and W7, NPAHs had low polluted levels. The average concentration of individuals compound in the water samples was in the order: Nap > Phe > Flu > 2-MNAP > 9-MANT > 1-MNAP > Fluo > Acy > Pyr > 3,5-MBaA > 9,10-DMA > 1,3-DMNAP > Ace > 2,6-DMNAP > 2,7-DMNAP, Table S4 (Supplementary Materials). The average value of Benzo[a]pyrene was 4.16 ng·L−1; subsequently, derivatives 7,10-MBaP and 7,10-DMBaP were below standard values with a mean of 0.42 and 0.74 ng·L−1, respectively, both lower than 2.8 ng·L−1, Water Quality Criteria of the USEPA [26]. This confirmed that the existence of PAHs in water presents significant health risks as contrasted to their derivatives used as drinking water. The values of Me-PAHs in this research were greater than those conducted in French studies [27]. Additionally, seasonal variation was dissimilar among testing sites in river water over the summertime as well as winter duration Figure S2 (Supplementary Materials). In the hot season, the mean values of ∑PAHs, ∑Me-PAHs, and ∑NPAHs, were greater than in the cold season. It is possibly related to rising overflow in the course of the summer season; contaminants had been swept into the aquatic environment. The same as the product of PAHs pollutants dominated during summer was discovered in previous research [28].
As shown in Table 1, the sediment concentrations of ∑PAHs ranged from 35.8 to 2000 ng·L−1, with a mean of 283 ng·L−1, 0.62–394 ng·L−1, with a mean of 86.0 ng·L−1, for ∑Me-PAHs, and 0.28–176 ng·L−1, with a mean of 20.6 ng·L−1, for ∑NPAHs. The greatest concentration (122 ± 10.5 ng·L−1) was discovered in PAHs detected at Site S10, which is situated in the middle of Tangwang River. A significant intention behind this highest concentration is probably consequently urbanized location. The second-highest concentration was Me-PAHs (10.9 ± 1.5 ng·L−1), found on S3, which is situated downstream of Da’an, and followed by NPAHs (3.12 ± 0.77 ng·L−1), found at S13, which located in the middle of Lalin River, as displayed in Table S3 (Supplementary Materials). The average values of individual chemicals in sediment were in the order: Phe > Fluo > Pyr > Nap > BbF > Chr > BaA > IcdP > BaP > Flu > 9-MANT > 2-MNAP > 9,10-DNAN > BkF > 1-MNAP > Ant (Table S5 in Supplementary Materials). Generally, high molecular weight of PAHs and low molecular weight of Me-PAHs were prevailing in sediments. The average concentrations of LMW and HMW PAHs in sediment were 91.5 and 192 ng·L−1, and those for Me-PAHs were 63.0 and 22.9 ng·L−1 (Table S5). The PAHs stages in sediment ought to be categorized into four classes: low, the stage at 0–100 ng·L−1, moderate, the degree at 100–1000 ng·L−1, high, at 1000–5000 ng·L−1, and very high at >5000 ng·L−1 [29]. As a result, the total value of PAH pollution in this study was estimated as a low stage. Regarding the indifference with limitless researchers around the world, the sediment values of PAHs in this research were higher than these determined in the Yangtze River Delta, with a mean concentration of 144 ng·L−1 [30], in Weihai, with an average of 67.44 ng·L−1 [31], and River estuary, Italy with an average value of 155 ± 134 ng·L−1 [32]. As proven in Figure S5 (Supplementary Materials), average concentrations of ∑PAHs, ∑Me-PAHs, and ∑NPAHs in sediments were determined to be larger in the course of the summertime in contrast to these in wintertime. The excessive temperature possibly leads PAHs to the consequent evaporation and degradation [33]. It was in a settlement with the research posted previously, where the degrees of PAHs were also decreasing over winter [34].
The physicochemical residences of sediment and water samples were evaluated. pH varies from 6.7 to 8.62 based totally on the sites of sediment and water in the Songhua River. TOC in sediment ranged from 4.59% to 19.6%, with a common value of 8.04% and in water ranged from 3.4% to 19.6% to average 8.26% (Table S6 in Supplementary Materials). The insignificant correlation between ∑PAHs and TOC of sediments was observed in this research, which could appear from the very low affinity of PAHs for total organic carbon (TOC), which could erode the exceptional river bed sediment and this resuspends them in the water column, as a consequence diluting the total organic carbon (TOC) that make PAHs sorb in the sediment [35]. Equivalent findings were recorded by other scientific studies [36]. Furthermore, significant positive correlations between PAHs concentrations and their derivatives NPAHs (R2 = 0.026) and Me-PAHs (R2 = 0.32) were observed. Concentrations in multimatrices, besides sediment, show negative correlation in winter between PAHs and NPAHs, Me-PAHs (R2 = 0.004), (R2 = 0.0002; Figure S3a,b in Supplementary Materials). The findings indicate that these chemicals came from a variety of sources, as well as distribution or degradation processes in the Songhua River. PAHs in sediment and water identified the existing levels of contamination, according to earlier studies [17].

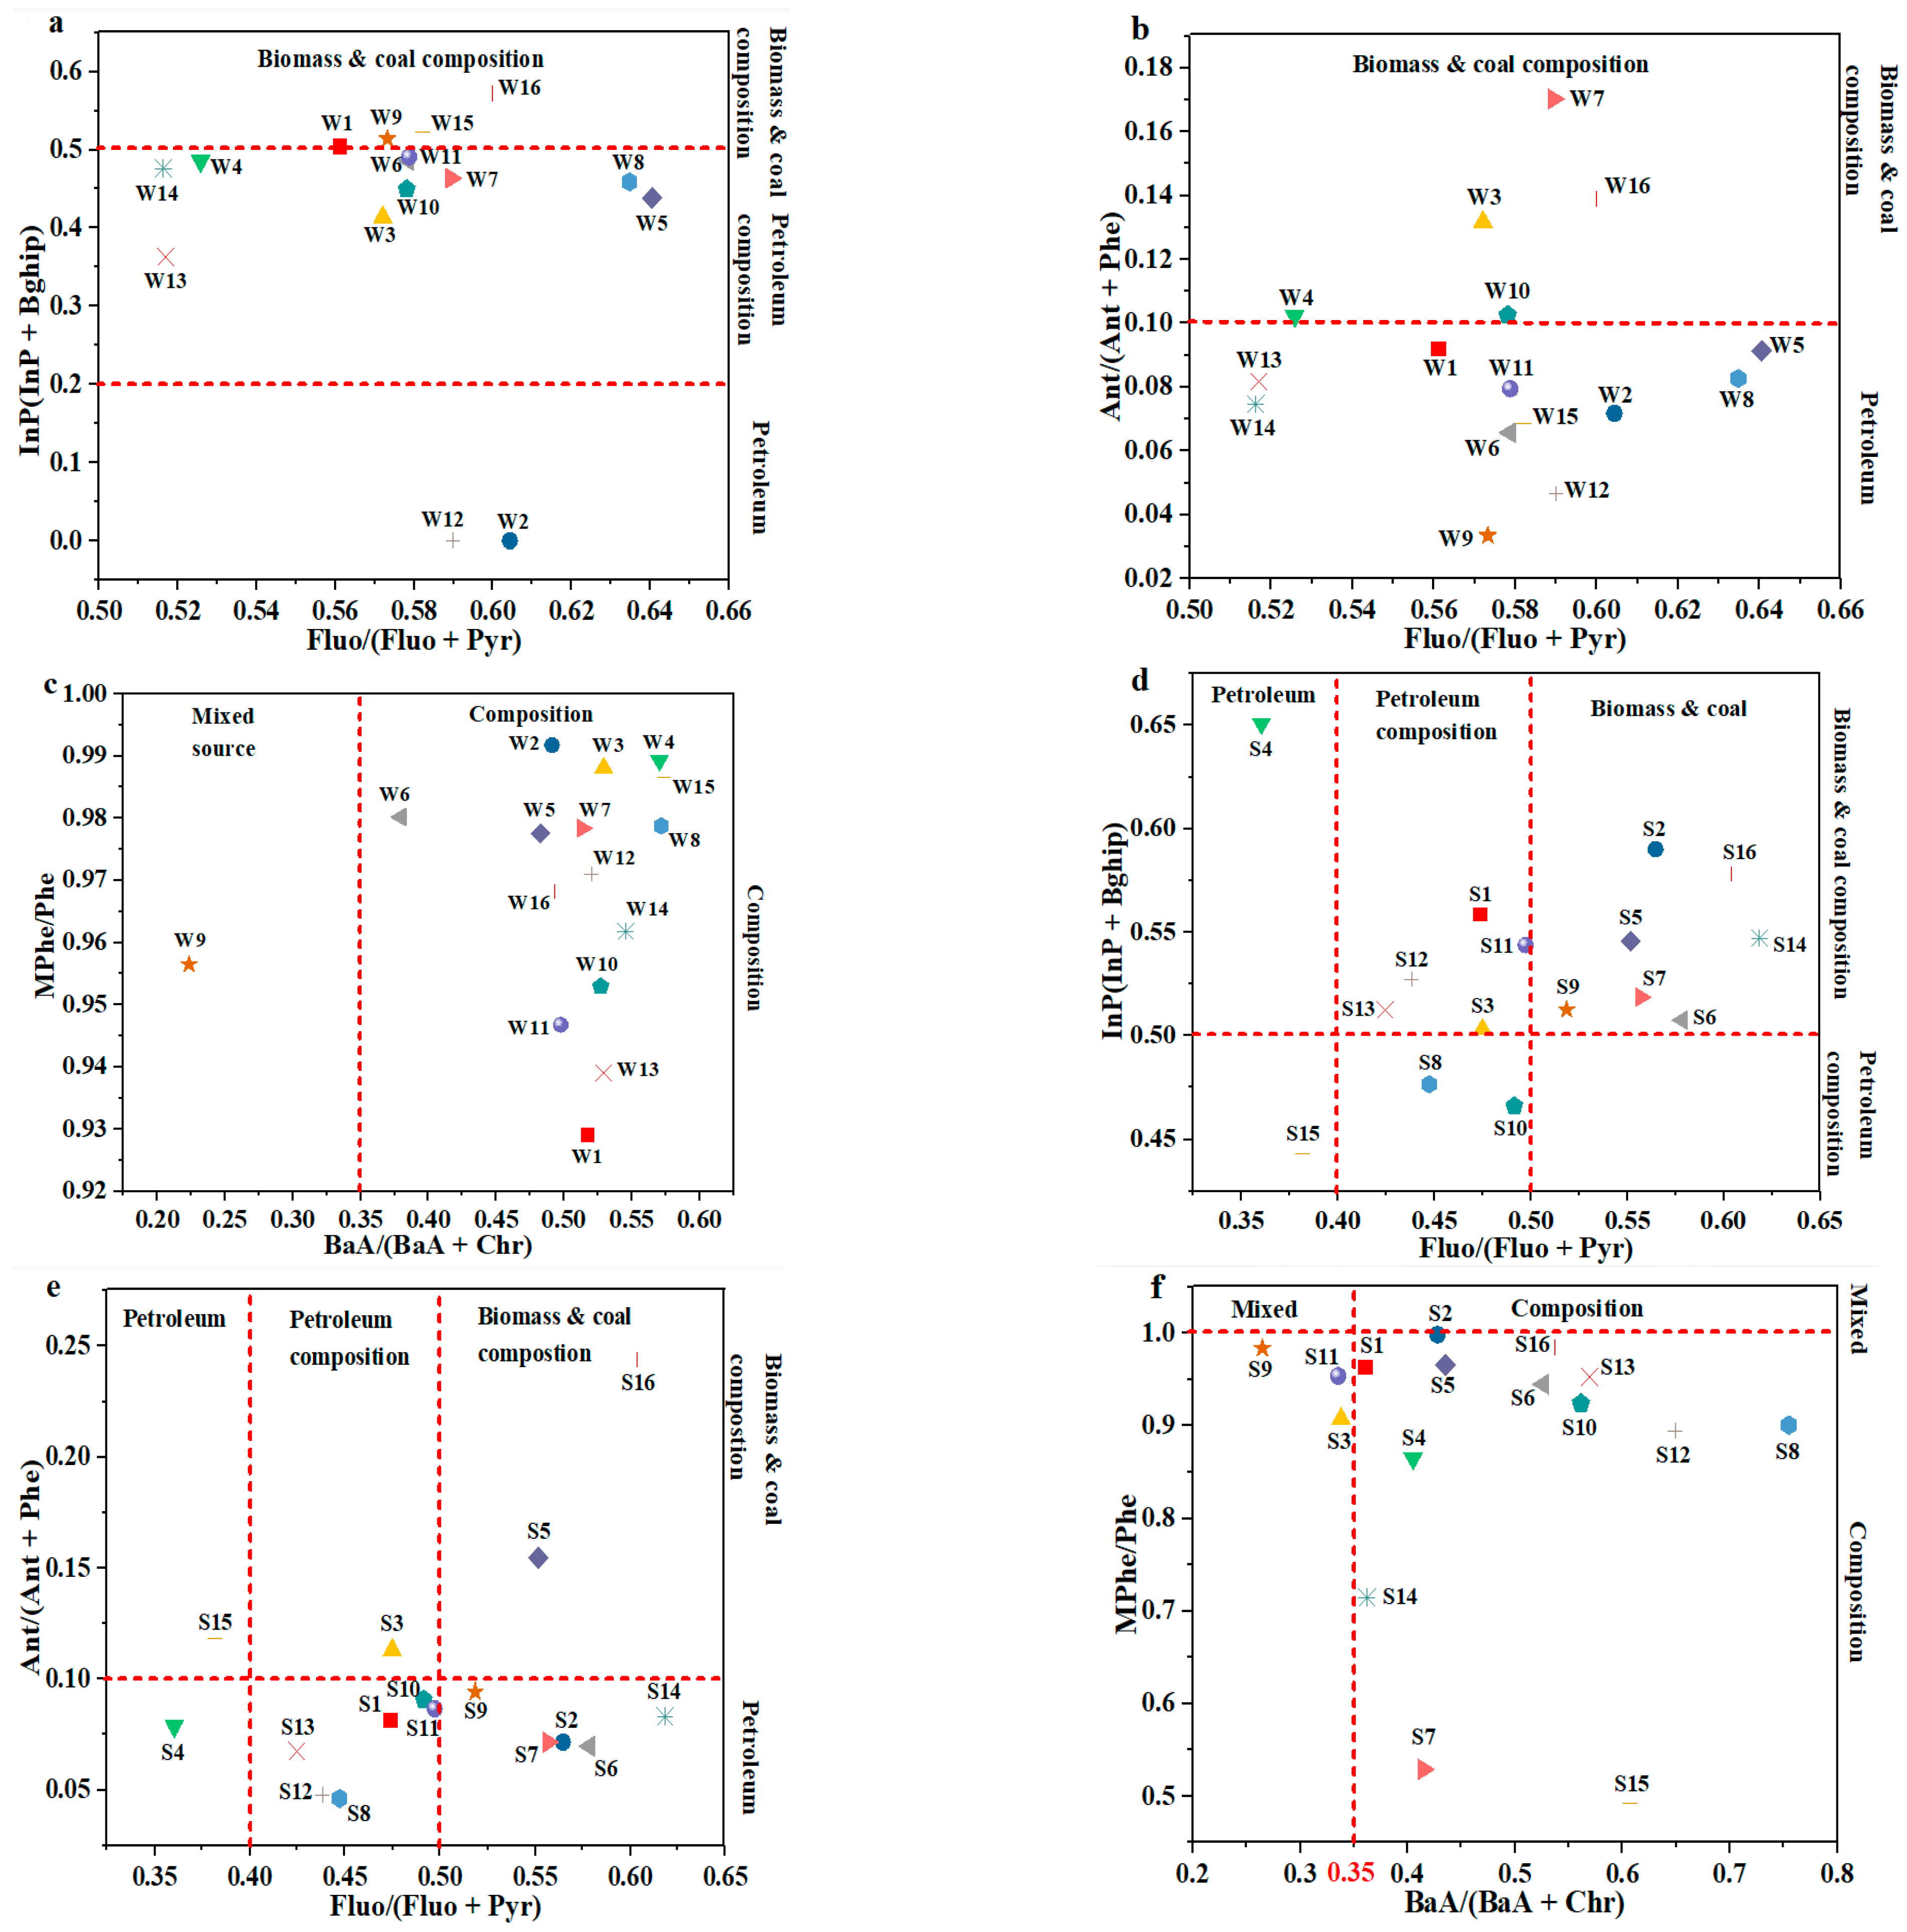
3.2. Source Apportionment

Diagnostic ratios of PAHs were established for demonstrating PAHs composition and the substantial source [37] plot of BaA/(BaA + Chr) > 0.35, Fluo/(Fluo + Pyr) > 0.5, InP/(InP + BghiP) > 0.5, Ant/(Ant + Phe) > 0.1, thus conducted to coal or biomass. Moreover, PAHs defined as petroleum sources are recognized by BaA/(BaA + Chr) < 0.2, InP/(InP + BghiP) < 0.2, Fluo/(Fluo + Pyr) < 0.4, and Ant/(Ant + Phe) < 0.1 [38]. Moreover, MP/P ratio sum of (3-MPHEN +2-MPHEN +1-MPHEN/PHEN + 9-MPHEN) < 1, pyrogenic source and ˃2.0 signifies petrogenic, and 1–2, mixed sources [39]. In river water, the plots of Fluo/(Fluo + Pyr), Ant/(Ant + Phe), and InP/(InP + BghiP) were varied from 0.02 to 0.1, 0.0 to 0.2, and 0.2 to 0.5, observing petroleum origin, among the 16 sampling sites, 10 were suggested to be afected by petroleum sources (Figure 2a–c). Among the sites influenced by petrogenic sources, W6 and W5 were situated in industrial and commercial areas. Additional plots of Fluo/(Fluo + Pyr), InP/(InP + BghiP), Ant/(Ant + Phe), MPhe/Phe, and BaA/(BaA + Chr), ranged from 0.5 to 0.9, 0.5 to 0.6, 0.1 to 0.18, 0.35 to 0.6, and 0.9 to 1, appearing as a source biomass and coal composition; all 16 sampling sites, were suggested to be affected by biomass and coal composition sources, except W9 was affected by mixed source (Figure 2a–c). For sediment, the values of Fluo/(Fluo + Pyr), InP/(InP + BghiP), and Ant/(Ant + Phe) varying from 0 to 0.4, 0.4 to 0.5, and 0.45 to 0.5, suggesting petroleum source composition; among the 16 sampling sites, nine were suggested to be affected by petroleum sources, except (S2, S5, S6, S7, S9, S14, S16) were affected by biomass and coal (Figure 2d–f). Additional ratios of Flu/(Flu + Pyr), InP/(InP + BghiP), Ant/(Ant + Phe), BaA/(BaA + Chr), and MPhe/Phe were varied from 0.5 to 0.6, 0.5 to 0.65, 0.1 to 0.25, 0.35 to 0.8, and 0.5 to 1, verifying biomass and coal composition, as displayed in Figure 2d–f. In this research, we conditionally named PAHs and Me-PAHs sources in isomer ratios. The results from diagnostic ratios indicated that all PAHs and Me-PAHs in the sampling area mainly were relevant to either petrogenic or pyrogenic origin.
The principal component analysis is an effective approach for analyzing the complicated properties of the pollution, highlight the main source and describing its relative contribution [40]. Three factors were extracted in water, with total variances of 82.68% (53.52, 22.82, and 6.33) in Table S7 (Supplementary Materials). The first (PC1) was consorting with a high loading for Fluo, Pyr, Chr, BaA, BaP, BbF, BghiP, Phe, and IcdP, accounting for 53.52% of the variance. Besides, Pyr, BaA, Chr, and BaP stated gasoline, diesel exhaust as well as incompletely burned [16]. Therefore, the PC1 was from producing pollution (incomplete combustion of gasoline source). PC2 explained 22.82% of the variance, with high loading for Flu, Ace, NaP, and Acy, which were recognized to originate from a petrogenic source. Finally, PC3, 6.33% of the variance, determined by LMW PAHs (Phe, Ace, NaP, and Ant) which were considered from petrogenic sources (Table S7 in Supplementary Materials). Since different combinations of PAHs (LMW and HMW) occur, we categorized PAHs sources in three factors as mixed for this research. Individual PAHs for each factor might well be related either to the pyrogenic or petrogenic origin.
For sediment, two factors were extracted. PC1 and PC2 contributed 79.04% and 15.24%, as displayed in (Table S7). Chr, BbF, Pyr, BaP, IcdP, DahA, Acy, BaA, BkF, and BghiP were high loading on PC1, signifying incomplete combustion of petrol and diesel exhaust. PC2 was controlled by low (LMW) NaP, Ace, and Flu, which were concerned with originating from petrogenic sources.

3.3. Sediment–Water Exchange

The fugacity difference in both sediments and water is defined as sediment–water exchange. The calculation of sediment–water exchange was displayed in our previous research [1]. We computed the fugacity fraction (ff) and in situ-carbon-normalized water–sediment partition coefficients ( K OC ) by utilizing Equations (1) and (2). It must be considered that there exist propagated errors in the computed ff of chemicals substances between two environmental media; thus, a margin of error is as a result utilized when evaluating equilibrium stipulation between these adjoining media according to these data. In the current research, the fugacity fraction between 0.3 and 0.7 stated an equilibrium between these two media is nominated [18,41,42]. When the values of ff are between 0.3 and 0.7, PAHs, in equilibrium between sediment and water, anticipated that net diffusion flux is equal to zero. The values of ff higher than 0.7 are directed at the strolling of the net flux that is from the surface sediment to the water. Subsequently, the sediment acts as a secondary emission source for these chemicals. When ff < 0.3, the net flux of chemical is from the water to the sediment, being carried out as a sink for sediment [20].
The calculation showed a different exchange pattern between sediment and water during the winter and summer seasons for these chemicals. The summer values of ff were above 0.7 for much more than 68% HMW PAHs as well as 59% for Me-PAHs, in which benzo[b]fluorantheen, chrysene, benzo[k]fluoranthene, pyrene, and benzo[g,h,i]perylen were the most abundant of PAHs. The previous study reported similar results for HMW PAHs [19]. For Me-PAHs, the ff values of 3,9-Dimethylbenzaanthracene, 7,9-Methylbenzaanthracene, 5,8-Dimethylbenzocphenanthrene, and 7,12-Dimethylbenzaanthracene were all >0.7, this indicating that surface sediment acted as the secondary source to river water [5], as shown in Figure 3. During summer, the ff values were between 0.3 and 0.7 for more than 37% LMW, 2,2′-Dinitrobiphenyl, 9-Nitroanthracene, 9,10-Dinitroanthracene, and 2-Nitrobiphenyl, suggesting that they were in equilibrium between water and sediments. PAHs ff values were higher in the summer than their parent PAHs, probably due to the levels of pollution from HMW PAH as well as the increase in sediment organic carbon content [43]. Other locations discovered the same conclusion [18]. In winter, average ff values of LMW Phenanthrene, Anthracene, and Fluoranthene were larger than 0.7, equivalent for Me-PAHs, such as 2-Methylnaphthalene, 1-Methylphenanthrene, 1-Methylanthracene, and 9-Methylanthracene, which suggests that these LMW PAHs and Me-PAHs acted as the secondary source to river water. Whereas, the chemical compounds with average ff values decrease more than 0.3 in winter, consisting of Indeno[1,2,3-cd]pyrene, Dibenz[a,h]anthracene, Benzo[g,h,i]perylene, 2-Nitrobiphenyl, 4-Nitrobiphenyl, 5-Nitroacenaphthene, 2-Nitronaphthalene, 2,2′-Dinitrobiphenyl, and 9-Nitroanthracene, suggesting the net fluxes of PAHs and NPAHs, from water to sediment. It is shown that PAHs and Me-PAHs values of ff diminished with lowering of PAHs and Me-PAHs rings and growing with their rings in each season (Figure 3). Differences are located in plots of water–sediment equilibrium in the course of winter and summer seasons for PAHs, Me-PAHs, and NPAHs homologs. The net impact after transport of LMW PAHs, Me-PAHs, and NPAHs for the duration of the winter seasons act as principal and secondary sources, and switch of HMW throughout the summer seasons acting as secondary and equilibrium sources was achieved, whereas the secondary sources were dominant in the summer seasons.

3.4. Ecological Risk Assessment

Table 2 displays the mean risk quotients negligible concentrations (RQNCs) and risk quotients maximum permissible concentrations (RQMPCs) of PAHs in river water during the winter and summer. The risk quotient (RQ) was also computed using the following equation: RQ = CPAHs / CQV , where CPAHs signifies the certain PAHs concentration in the medium, as well as CQV defined as the consistency levels of certain PAHs with the medium. The negligible concentrations NCs and maximum permissible concentrations MPCs of individual PAHs in water were used as quality standards in the medium [44]; risk states according to both RQNCs and RQMPCs level were displayed in Table 1. This research confirmed the RQNCs values in winter for Nap, BaA, BaP, Phe, Ant, Flua Pyr, Ace, BbF, BkF, Flu, and BghiP, greater than 1.0, indicating medium risk, barring Chr, and DahA, lower than 1.0 which confirmed a lower risk. For RQMPCs in winter, the 16 PAHs decrease to 1.0 signifying lower risk, but the ∑PAHs greater than 1.0 confirmed excessive risk. In the summertime, the result is comparable to winter in each RQNCs and RQMPCs. The total Benzo[a]pyrene (BaP) toxic equivalence quotient (TEQCARC), which was calculated utilizing according to the Equation (5), evaluated the possible carcinogenic toxicity of the sediment evaluation. The TEQcarc values were different from the summer and winter seasons (Table S8 in Supplementary Materials). The total TEQcarc in the summer season varied from 1.5 to 246 ng·g−1, and in winter varied from 1.92 to 13.5 ng·g−1 in sediment, where the maximum TEQcarc was observed in S16 as well as S4 in the summer and winter seasons, the two sites located in Zhaoyuan County and Ma Yan River. The variability of every carcinogenic PAH on the evaluation of TEQcarc in the summer period was a result of BaP (67%) > DahA (13%) > BbF (9%) > BaA (7%) > BkF (3%) > Chr (1%), and in winter period as follows: BaP (73%) > BaA (10%) > BbF (9%) > BkF (5%)> DahA (2%) and Chr (1%). Sediment with low carcinogenic compound concentrations indicates low toxicity and carcinogenicity in the area under investigation. Moreover, BaP contributed 67% of TEQ values, thus explaining this congener’s predominant role in assessing the cancer risk due to PAH exposure [45]. A safe TEQcarc value should be less than 600 ng·g−1, according to Canadian soil quality guidelines for the protection of ecosystems and human health from the carcinogenic effects of PAHs [17]. There was no sample found above the standard in both seasons in this analysis. Furthermore, TEQcarc in this research was greater than sediments from the Kifissos River [46] and Sediment from Gulf Gemlik [47].

4. Conclusions

The source identification and spatial distribution of Me-PAHs, NPAHs, and PAHs in the water and sediment were investigated. Me-PAHs contamination is most prevalent in water, while PAHs were predominant in sediment. Sediment–water exchange was examined, and high fugacity fraction values were discovered during summertime. The result proved dominated by HMW PAHs, Me-PAHs, which acted as secondary emission sources. The predominant sources are combined petrogenic and pyrogenic, relying on PCA and diagnostic ratio indices. High ecological risk was detected in water, which requires attention to the possible increased risk of chemicals in the Songhua River.

Supplementary Materials

The following are available online at https://www.mdpi.com/article/10.3390/w13091196/s1, Figure S1: The representative chromatograph of (a) PAHs, (b) Me-PAHs and (c) NPAH, Figure S2: Average concentrations of Σ16 PAHs (a) water (ng/L), (b) sediment (ng/g), ∑33 Me-PAHs (c) water (ng/L), (d) sediment (ng/g), and ∑12 NPAHs (e) water (ng/L), (f) sediment (ng/g), at 16 sampling sites during the summer and winter seasons, Figure S3: Scatterplot of Σ16 PAHs VS ∑33 Me-PAHs and ∑14 NPAHs, (a) water and (b) sedimen, Table S1: Sampling sites information selected to collect sediment and water samples, Table S2: GC-MS/MS detection parameters of target PAHs, Me-PAHs and NPAHs including the opti-mized, Table S3: Concentrations of target compounds in water (ng/L) and sediment (ng/g) samples from the Songhua River, North China, Table S4: Concentrations of target compounds in water (ng/L) samples from the Songhua River, North China, Table S5: Concentrations of target compounds in sediment (ng/g dw) samples from the Songhua River, North China, Table S6: Physicochemical characteristics of sediment and water samples, Table S7: Factor pattern of PCA for PAHs in water, sediment, of the Songhua River Basin, China, Table S8: PAHs TEQ concentrations in different sediment sites (ng/g dw).

Author Contributions

R.M.: wrote the manuscript, Z.-F.Z.: reviewed and approved the manuscript, C.J.; validation, Y.-H.H.; visualization, L.-Y.L.; funding acquisition, W.-L.M.; project administration, W.-W.S.; Methodology, A.N.; investigation and Y.-F.L.: supervision. All authors have read and agreed to the published version of the manuscript.

Funding

This study was supported by an open project of State Key Laboratory of Urban Water Resource and Environment, Harbin Institute of Technology (No. ESK202005), and Institute for Environmental Reference Materials of Ministry of Environmental Protection of China (No. KF202002). This study was also partially supported by the National Key Research and Development Programof China (No. 2018YFC1801500).

Institutional Review Board Statement

Not applicable.

Informed Consent Statement

Not applicable.

Data Availability Statement

The data collected are property of our research center but will be made available by the corresponding author when requested.

Acknowledgments

This study was supported by an open project of State Key Laboratory of Urban Water Resource and Environment, Harbin Institute of Technology (No. ESK202005), and Institute for Environmental Reference Materials of Ministry of Environmental Protection of China (No. KF202002). This study was also partially supported by the National Key Research and Development Program of China (No. 2018YFC1801500).

Conflicts of Interest

The authors declare no conflict of interest.

References

  1. Zhao, Z.; Gong, X.; Zhang, L.; Jin, M.; Cai, Y.; Wang, X. Riverine transport and water-sediment exchange of polycyclic aromatic hydrocarbons (PAHs) along the middle-lower Yangtze River, China. J. Hazard. Mater. 2021, 403, 123973. [Google Scholar] [CrossRef]
  2. Zhang, C.; Li, Y.; Wang, C.; Feng, Z.; Hao, Z.; Yu, W.; Wang, T.; Zou, X. Polycyclic aromatic hydrocarbons (PAHs) in marine organisms from two fishing grounds, South Yellow Sea, China: Bioaccumulation and human health risk assessment. Mar. Pollut. Bull. 2020, 153, 110995. [Google Scholar] [CrossRef] [PubMed]
  3. Sosa, B.S.; Porta, A.; Lerner, J.E.C.; Noriega, R.B.; Massolo, L. Human health risk due to variations in PM10-PM2.5 and associated PAHs levels. Atmos. Environ. 2017, 160, 27–35. [Google Scholar] [CrossRef]
  4. Jia, T.; Guo, W.; Liu, W.; Xing, Y.; Lei, R.; Wu, X.; Sun, S. Spatial distribution of polycyclic aromatic hydrocarbons in the water–sediment system near chemical industry parks in the Yangtze River Delta, China. Sci. Total Environ. 2021, 754, 142176. [Google Scholar] [CrossRef] [PubMed]
  5. Hong, W.-J.; Jia, H.; Li, Y.-F.; Sun, Y.; Liu, X.; Wang, L. Polycyclic aromatic hydrocarbons (PAHs) and alkylated PAHs in the coastal seawater, surface sediment and oyster from Dalian, Northeast China. Ecotoxicol. Environ. Saf. 2016, 128, 11–20. [Google Scholar] [CrossRef] [PubMed]
  6. Chen, C.-F.; Ju, Y.-R.; Su, Y.-C.; ChengLim, Y.; Kao, C.-M.; Chen, C.-W.; Dong, C.-D. Distribution, sources, and behavior of PAHs in estuarine water systems exemplified by Salt River, Taiwan. Mar. Pollut. Bull. 2020, 154, 111029. [Google Scholar] [CrossRef]
  7. Xu, F.; Shi, X.; Qiu, X.; Jiang, X.; Fang, Y.; Wang, J.; Hu, D.; Zhu, T. Investigation of the chemical components of ambient fine particulate matter (PM2.5) associated with in vitro cellular responses to oxidative stress and inflammation. Environ. Int. 2020, 136, 105475. [Google Scholar] [CrossRef]
  8. Wilson, J.; Octaviani, M.; Benjamin, A.; Bandowe, M.; Wietzoreck, M.; Zetzsch, C.; Pöschl, U.; Berkemeier, T.; Lammel, G. Modeling the Formation, Degradation, and Spatiotemporal Distribution of 2-Nitrofluoranthene and 2-Nitropyrene in the Global Atmosphere. Environ. Sci. Technol. 2020, 54, 14224–14234. [Google Scholar] [CrossRef] [PubMed]
  9. Net, S.; El-Osmani, R.; Prygiel, E.; Rabodonirina, S.; Dumoulin, D.; Ouddane, B. Overview of persistent organic pollution (PAHs, Me-PAHs and PCBs) in freshwater sediments from Northern France. J. Geochem. Explor. 2015, 148, 181–188. [Google Scholar] [CrossRef]
  10. Bandowe, B.A.M.; Wei, C.; Han, Y.; Cao, J.; Zhan, C.; Wilcke, W. Polycyclic aromatic compounds (PAHs, oxygenated PAHs, nitrated PAHs and azaarenes) in soils from China and their relationship with geographic location, land use and soil carbon fractions. Sci. Total Environ. 2019, 690, 1268–1276. [Google Scholar] [CrossRef]
  11. Alves, C.A.; Vicente, A.M.; Custódio, D.; Cerqueira, M.; Nunes, T.; Pio, C.; Lucarelli, F.; Calzolai, G.; Nava, S.; Diapouli, E.; et al. Polycyclic aromatic hydrocarbons and their derivatives (nitro-PAHs, oxygenated PAHs, and azaarenes) in PM2.5 from Southern European cities. Sci. Total Environ. 2017, 595, 494–504. [Google Scholar] [CrossRef]
  12. Chen, W.; Wu, X.; Zhang, H.; Sun, J.; Liu, W.; Zhu, L.; Li, X.; Tsang, D.C.; Tao, S.; Wang, X. Contamination characteristics and source apportionment of methylated PAHs in agricultural soils from Yangtze River Delta, China. Environ. Pollut. 2017, 230, 927–935. [Google Scholar] [CrossRef]
  13. Mohammed, R.; Zhang, Z.-F.; Jiang, C.; Hu, Y.-H.; Liu, L.-Y.; Ma, W.-L.; Song, W.-W.; Nikolaev, A.; Kallenborn, R.; Li, Y.-F. Occurrence, Removal, and Mass Balance of Polycyclic Aromatic Hydrocarbons and Their Derivatives in Wastewater Treatment Plants in Northeast China. Toxics 2021, 9, 76. [Google Scholar] [CrossRef]
  14. Albinet, A.; Leoz-Garziandia, E.; Budzinski, H.; Villenave, E.; Jaffrezo, J.-L. Nitrated and oxygenated derivatives of polycyclic aromatic hydrocarbons in the ambient air of two French alpine valleys Part 1: Concentrations, sources and gas/particle partitioning. Atmos. Environ. 2008, 42, 43–54. [Google Scholar] [CrossRef] [Green Version]
  15. Bekki, K.; Takigami, H.; Suzuki, G.; Tang, N.; Hayakawa, K. Evaluation of Toxic Activities of Polycyclic Aromatic Hydrocarbon Derivatives Using In Vitro Bioassays. J. Health Sci. 2009, 55, 601–610. [Google Scholar] [CrossRef] [Green Version]
  16. Gbeddy, G.; Egodawatta, P.; Goonetilleke, A.; Akortia, E.; Glover, E.T. Influence of photolysis on source characterization and health risk of polycyclic aromatic hydrocarbons (PAHs), and carbonyl-, nitro-, hydroxy- PAHs in urban road dust. Environ. Pollut. 2021, 269, 116103. [Google Scholar] [CrossRef]
  17. Ma, W.-L.; Liu, L.-Y.; Qi, H.; Zhang, Z.-F.; Song, W.-W.; Shen, J.-M.; Chen, Z.-L.; Ren, N.-Q.; Grabuski, J.; Li, Y.-F. Polycyclic aromatic hydrocarbons in water, sediment and soil of the Songhua River Basin, China. Environ. Monit. Assess. 2013, 185, 8399–8409. [Google Scholar] [CrossRef]
  18. Zhang, Z.; Ren, N.; Kannan, K.; Nan, J.; Liu, L.; Ma, W.; Qi, H.; Li, Y. Occurrence of Endocrine-Disrupting Phenols and Estrogens in Water and Sediment of the Songhua River, Northeastern China. Arch. Environ. Contam. Toxicol. 2014, 66, 361–369. [Google Scholar] [CrossRef]
  19. Cui, S.; Fu, Q.; Li, T.-x.; Ma, W.-l.; Liu, D.; Wang, M. Sediment-Water Exchange, Spatial Variations, and Ecological Risk Assessment of Polycyclic Aromatic Hydrocarbons (PAHs) in the Songhua River, China. Water 2016, 8, 334. [Google Scholar] [CrossRef] [Green Version]
  20. Ashayeri, N.Y.; Keshavarzi, B.; Moore, F.; Kersten, M.; Yazdi, M.; Lahijanzadeh, A.R. Presence of polycyclic aromatic hydrocarbons in sediments and surface water from Shadegan wetland–Iran: A focus on source apportionment, human and ecological risk assessment and Sediment-Water Exchange. Ecotoxicol. Environ. Saf. 2018, 148, 1054–1066. [Google Scholar] [CrossRef]
  21. Wang, D.; Alaee, M.; Byer, J.; Liu, Y.-J.; Tian, C.-G. Fugacity approach to evaluate the sediment–water diffusion of polycyclic aromatic hydrocarbons. J. Environ. Monit. 2011, 13, 1589–1596. [Google Scholar] [CrossRef] [PubMed]
  22. Mirrezaei, M.A.; Orkomi, A.A. Gas flares contribution in total health risk assessment of BTEX in Asalouyeh, Iran. Process. Saf. Environ. Prot. 2020, 137, 223–237. [Google Scholar] [CrossRef]
  23. Akhbarizadeh, R.; Moore, F.; Keshavarzi, B.; Moeinpour, A. Aliphatic and polycyclic aromatic hydrocarbons risk assessment in coastal water and sediments of Khark Island, SW Iran. Mar. Pollut. Bull. 2016, 108, 33–45. [Google Scholar] [CrossRef] [PubMed]
  24. Kapsimalis, V.; Panagiotopoulos, I.; Talagani, P.; Hatzianestis, I.; Kaberi, H.; Rousakis, G.; Kanellopoulos, T.; Hatiris, G.A. Organic contamination of surface sediments in the metropolitan coastal zone of Athens, Greece: Sources, degree, and ecological risk. Mar. Pollut. Bull. 2014, 80, 312–324. [Google Scholar] [CrossRef] [PubMed]
  25. Li, P.; Cao, J.; Diao, X.; Wang, B.; Zhou, H.; Han, Q.; Zheng, P.; Li, Y. Spatial distribution, sources and ecological risk assessment of polycyclic aromatic hydrocarbons in surface seawater from Yangpu Bay, China. Mar. Pollut. Bull. 2015, 93, 53–60. [Google Scholar] [CrossRef] [PubMed]
  26. Yu, H.; Liu, Y.F.; Han, C.X.; Fang, H.; Weng, J.H.; Shu, X.Q.; Pan, Y.W.; Ma, L.M. Polycyclic aromatic hydrocarbons in surface waters from the seven main river basins of China: Spatial distribution, source apportionment, and potential risk assessment. Sci. Total Environ. 2021, 752, 141764. [Google Scholar] [CrossRef]
  27. Rabodonirina, S.; Net, S.; Ouddane, B.; Merhaby, D.; Dumoulin, D.; Popescu, T.; Ravelonandro, P. Distribution of persistent organic pollutants (PAHs, Me-PAHs, PCBs) in dissolved, particulate and sedimentary phases in freshwater systems. Environ. Pollut. 2015, 206, 38–48. [Google Scholar] [CrossRef]
  28. Adeniji, A.O.; Okoh, O.O.; Okoh, A.I. Levels of Polycyclic Aromatic Hydrocarbons in the Water and Sediment of Buffalo River Estuary, South Africa and Their Health Risk Assessment. Arch. Environ. Contam. Toxicol. 2019, 76, 657–669. [Google Scholar] [CrossRef] [Green Version]
  29. He, Y.; Meng, W.; Xu, J.; Zhang, Y.; Guo, C. Spatial distribution and potential toxicity of polycyclic aromatic hydrocarbons in sediments from Liaohe River Basin, China. Environ. Monit. Assess. 2016, 188, 193. [Google Scholar] [CrossRef]
  30. Zhu, Y.; Tao, S.; Sun, J.; Wang, X.; Li, X.; Tsang, D.C.; Zhu, L.; Shen, G.; Huang, H.; Cai, C.; et al. Multimedia modeling of the PAH concentration and distribution in the Yangtze River Delta and human health risk assessment. Sci. Total Environ. 2019, 647, 962–972. [Google Scholar] [CrossRef]
  31. Montuori, P.; Aurino, S.; Garzonio, F.; Sarnacchiaro, P.; Nardone, A.; Triassi, M. Distribution, sources and ecological risk assessment of polycyclic aromatic hydrocarbons in water and sediments from Tiber River and estuary, Italy. Sci. Total Environ. 2016, 566-567, 1254–1267. [Google Scholar] [CrossRef] [Green Version]
  32. Zhang, D.; Liu, J.; Yin, P.; Lin, X.; Liu, N.; Meng, X. Polycyclic aromatic hydrocarbons in surface sediments from the Coast of Weihai, China: Spatial distribution, sources and ecotoxicological risks. Mar. Pollut. Bull. 2016, 109, 643–649. [Google Scholar] [CrossRef]
  33. Zhao, Z.; Qin, Z.; Cao, J.; Xia, L. Source and Ecological Risk Characteristics of PAHs in Sediments from Qinhuai River and Xuanwu Lake, Nanjing, China. J. Chem. 2017, 2017, 1–18. [Google Scholar] [CrossRef] [Green Version]
  34. Adeniji, A.O.; Okoh, O.O.; Okoh, A.I. Distribution pattern and health risk assessment of polycyclic aromatic hydrocarbons in the water and sediment of Algoa Bay, South Africa. Environ. Geochem. Health 2019, 41, 1303–1320. [Google Scholar] [CrossRef] [PubMed] [Green Version]
  35. Duodu, G.O.; Ogogo, K.N.; Mummullage, S.; Harden, F.; Goonetilleke, A.; Ayoko, G.A. Source apportionment and risk assessment of PAHs in Brisbane River sediment, Australia. Ecol. Indic. 2017, 73, 784–799. [Google Scholar] [CrossRef]
  36. Malik, A.; Verma, P.; Singh, A.K.; Singh, K.P. Distribution of polycyclic aromatic hydrocarbons in water and bed sediments of the Gomti River, India. Environ. Monit. Assess. 2010, 172, 529–545. [Google Scholar] [CrossRef] [PubMed]
  37. Bai, Y.; Meng, W.; Xu, J.; Zhang, Y.; Guo, C.; Lv, J.; Wan, J. Occurrence, Distribution, Environmental Risk Assessment and Source Apportionment of Polycyclic Aromatic Hydrocarbons (PAHs) in Water and Sediments of the Liaohe River Basin, China. Bull. Environ. Contam. Toxicol. 2014, 93, 744–751. [Google Scholar] [CrossRef]
  38. Sun, C.Y.; Ma, Q.Y.; Chen, Y.N.; Ju, H.Y. Polycyclic aromatic hydrocarbons (PAHs) in water and sediment from a river basin: Sediment-water partitioning, source identification and environmental health risk assessment. Environ. Geochem. Health 2017, 39, 63–74. [Google Scholar] [CrossRef]
  39. Miki, S.; Uno, S.; Ito, K.; Koyama, J.; Tanaka, H. Distributions of polycyclic aromatic hydrocarbons and alkylated polycyclic aromatic hydrocarbons in Osaka Bay, Japan. Mar. Pollut. Bull. 2014, 85, 558–565. [Google Scholar] [CrossRef]
  40. Zheng, B.; Wang, L.; Lei, K.; Nan, B. Distribution and ecological risk assessment of polycyclic aromatic hydrocarbons in water, suspended particulate matter and sediment from Daliao River estuary and the adjacent area, China. Chemosphere 2016, 149, 91–100. [Google Scholar] [CrossRef]
  41. Bidleman, T.F.; Leone, A.D. Soil–air exchange of organochlorine pesticides in the Southern United States. Environ. Pollut. 2004, 128, 49–57. [Google Scholar] [CrossRef] [PubMed]
  42. Li, Y.-F.; Harner, T.; Liu, L.; Zhang, Z.; Ren, N.-Q.; Jia, H.; Ma, J.; Sverko, E. Polychlorinated Biphenyls in Global Air and Surface Soil: Distributions, Air−Soil Exchange, and Fractionation Effect. Environ. Sci. Technol. 2010, 44, 2784–2790. [Google Scholar] [CrossRef]
  43. Maruya, K.A.; Risebrough, R.W.; Horne, A.J. Partitioning of Polynuclear Aromatic Hydrocarbons between Sediments from San Francisco Bay and Their Porewaters. Environ. Sci. Technol. 1996, 30, 2942–2947. [Google Scholar] [CrossRef]
  44. Li, Y.; Li, P.; Ma, W.; Song, Q.; Zhou, H.; Han, Q.; Diao, X. Spatial and temporal distribution and risk assessment of polycyclic aromatic hydrocarbons in surface seawater from the Haikou Bay, China. Mar. Pollut. Bull. 2015, 92, 244–251. [Google Scholar] [CrossRef] [PubMed]
  45. Sopian, N.A.; Jalaludin, J.; Abu Bakar, S.; Hamedon, T.R.; Latif, M.T. Exposure to Particulate PAHs on Potential Genotoxicity and Cancer Risk among School Children Living Near the Petrochemical Industry. Int. J. Environ. Res. Public Health 2021, 18, 2575. [Google Scholar] [CrossRef]
  46. Panagiotopoulos, I.; Kapsimalis, V.; Hatzianestis, I.; Kanellopoulos, T.D.; Kyriakidou, C. Environmental status of the metropolitan river (Kifissos) of Athens, Greece. Environ. Earth Sci. 2010, 61, 983–993. [Google Scholar] [CrossRef]
  47. Ünlü, S.; Alpar, B. Evolution of Potential Ecological Impacts of the Bottom Sediment from the Gulf of Gemlik; Marmara Sea, Turkey. Bull. Environ. Contam. Toxicol. 2009, 83, 903–906. [Google Scholar] [CrossRef]
Figure 1. Sampling locations in the Songhua River Basin, including sediment and water.
Water 13 01196 g001
Figure 2. Plots showing PAHs and MePAHs isomeric ratios Flu/(Flu + Pyr) versus: InP/(InP + BghiP), Ant/(Ant + Phe), and BaA/(BaA + Chr), versus: MPhe/Phe, for water (ac), and sediments (df) in Songhua River North China.
Water 13 01196 g002
Figure 3. Fugacity of the fraction (ff) between river water and sediment in Songhua River in (a) summer and (b) winter.
Water 13 01196 g003
Table 1. Concentrations (ng/L), (ng/g) of ∑16 PAHs, ∑33 Me-PAHs, and ∑12 NPAHs in water and sediment samples from the Songhua River, Northeast China.
CompoundWater (ng/L)Sediment (ng/g)
RangeMeanMedianRangeMeanMedian
∑PAHs135–56228525235.8–200283129
LMW PAHs117–41323020920.6–24991.576.1
HMW PAHs17.9–14855.843.315.2–175019152.7
LMW/HMW6.53–2.784.124.811.35–0.140.471.44
∑Me-PAHs9.36–7111551260.62–39486.057.2
LMW Me-PAHs4.55–24336.81220.6–25963.043.7
HMW Me-PAHs4.81–46710.23.060.02-13522.913.4
LMW/HMW0.94–0.523.6040.130–1.912.743.25
∑NPAHs1.26–24.514.510.20.28–17020.65.4
LMW NPAHs1.26–24.514.510.20.28–17020.65.4
Table 2. Mean values of RQ (NCs) and RQ (MPCs) of PAHs in the surface river water of the Songhua River.
PAHsTEFsWater (ng/L)WinterSummer
NCsMPCsRQNCsRQMPCsRQNCsRQMPCs
Nap0.0011212007.340.079.230.09
Ace0.00133003.220.023.510.03
Flu0.001330010.30.0911.00.11
Phe0.001330017.20.1723.50.23
Ant0.010.7707.960.078.150.08
Flua0.00133004.080.044.980.04
Pyr0.0010.77013.50.1315.90.15
BaA0.10.11036.80.3644.30.44
Chr0.013.43400.930.001.470.01
BbF0.10.44010.30.1016.20.16
BkF0.10.4409.270.0912.90.12
BaP10.5506.020.069.250.09
DahA10.5500.710.001.070.01
BghiP0.010.3309.680.0913.00.13
∑PAHs---1361.361741.74
Publisher’s Note: MDPI stays neutral with regard to jurisdictional claims in published maps and institutional affiliations.

