
Water Distribution and Silt Clogging in the Strong-Seepage Zone Infiltration Process of Yufuhe River from Yellow River Water Based on the Two-Dimensional Sand Tank Model

Abstract
:1. Introduction
2. Materials and Methods
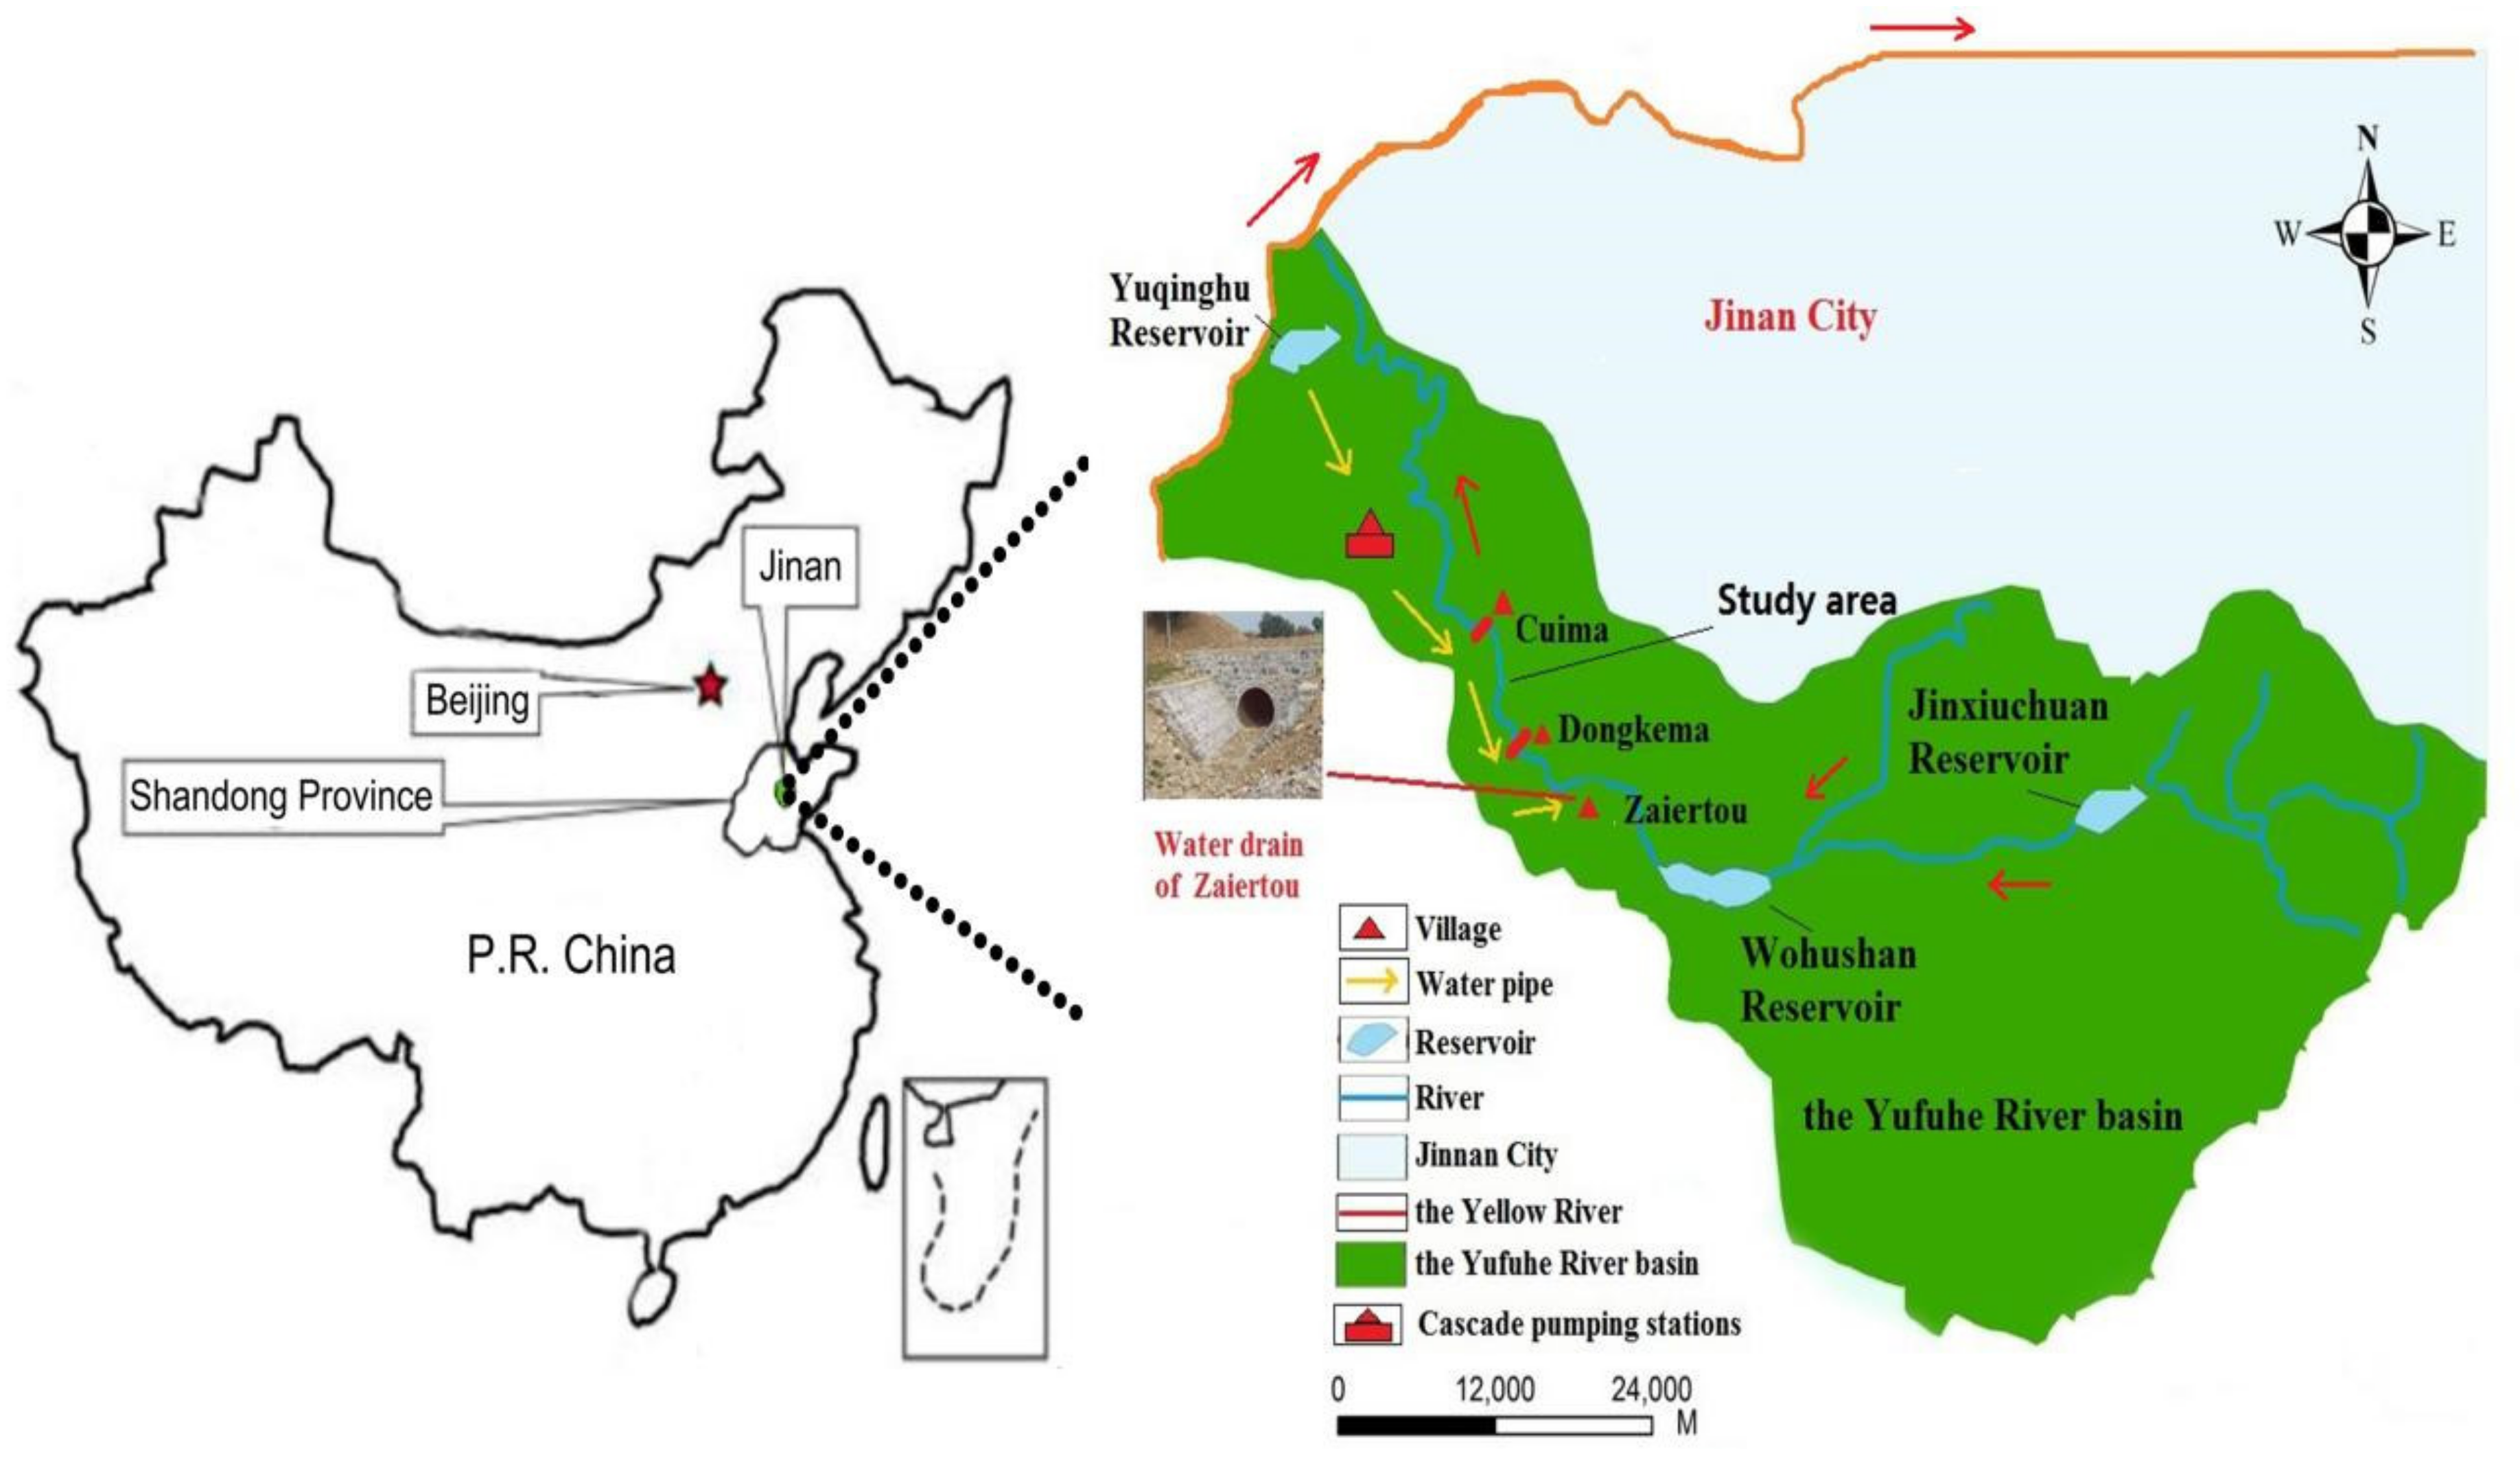
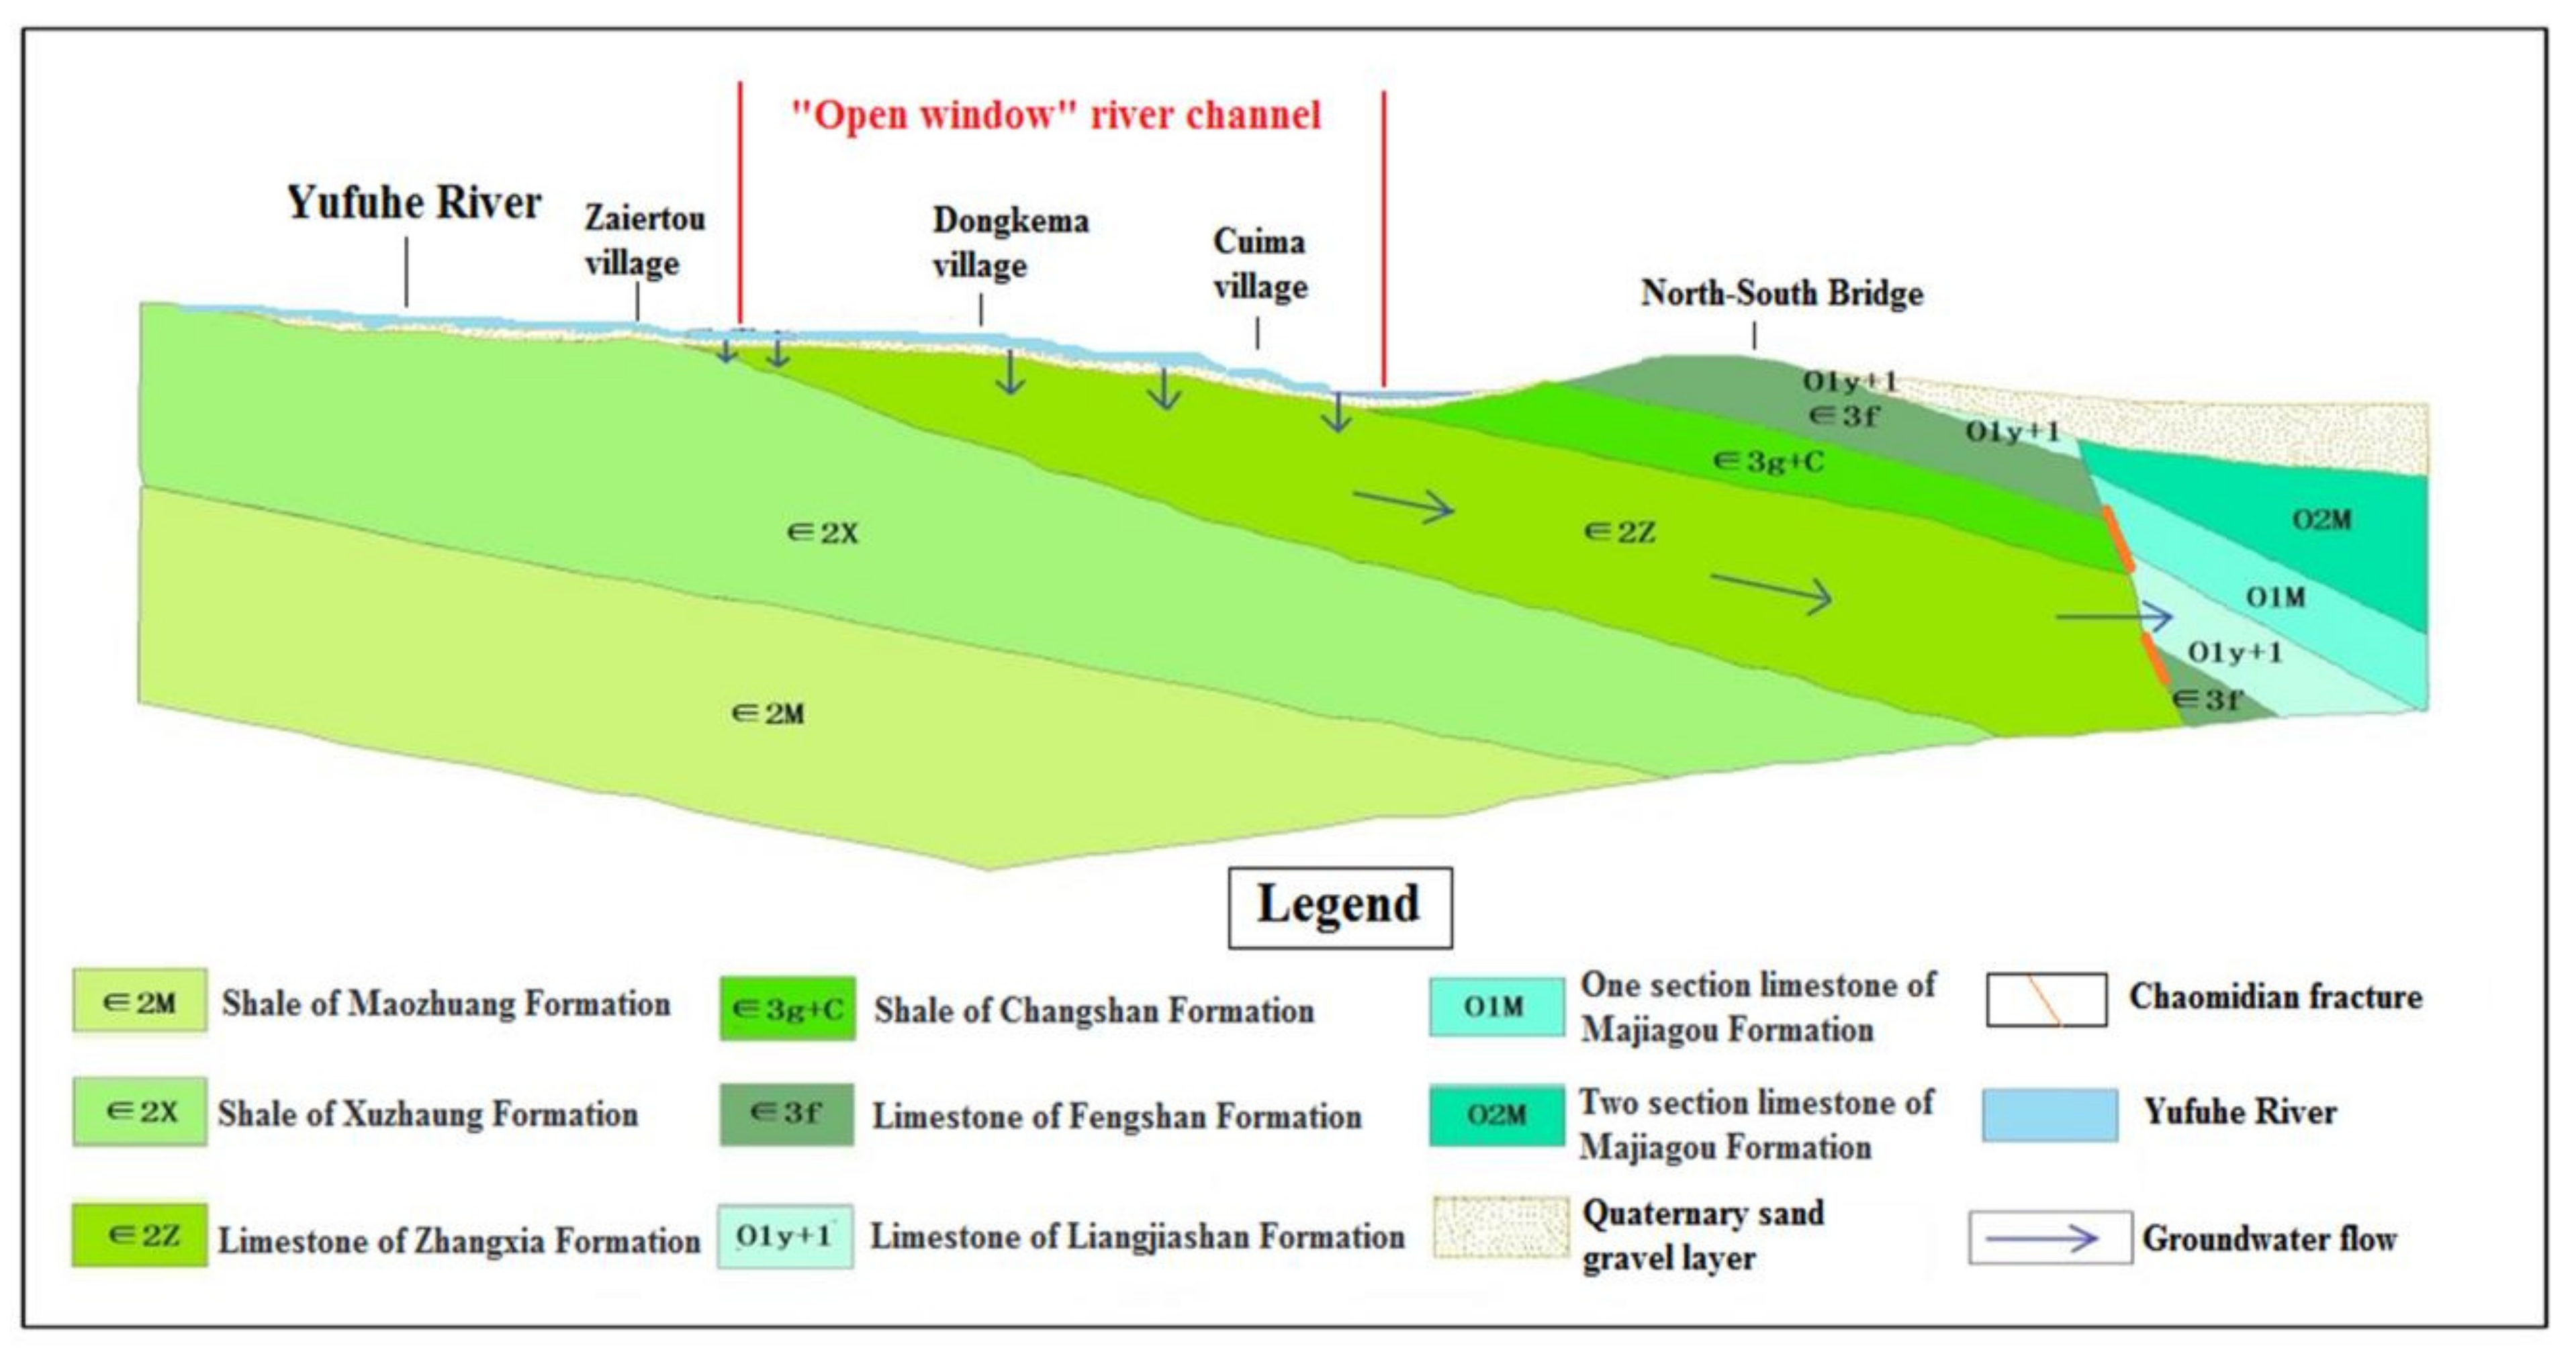
2.1. Study Area and Hydrogeological Conditions
2.2. Materials
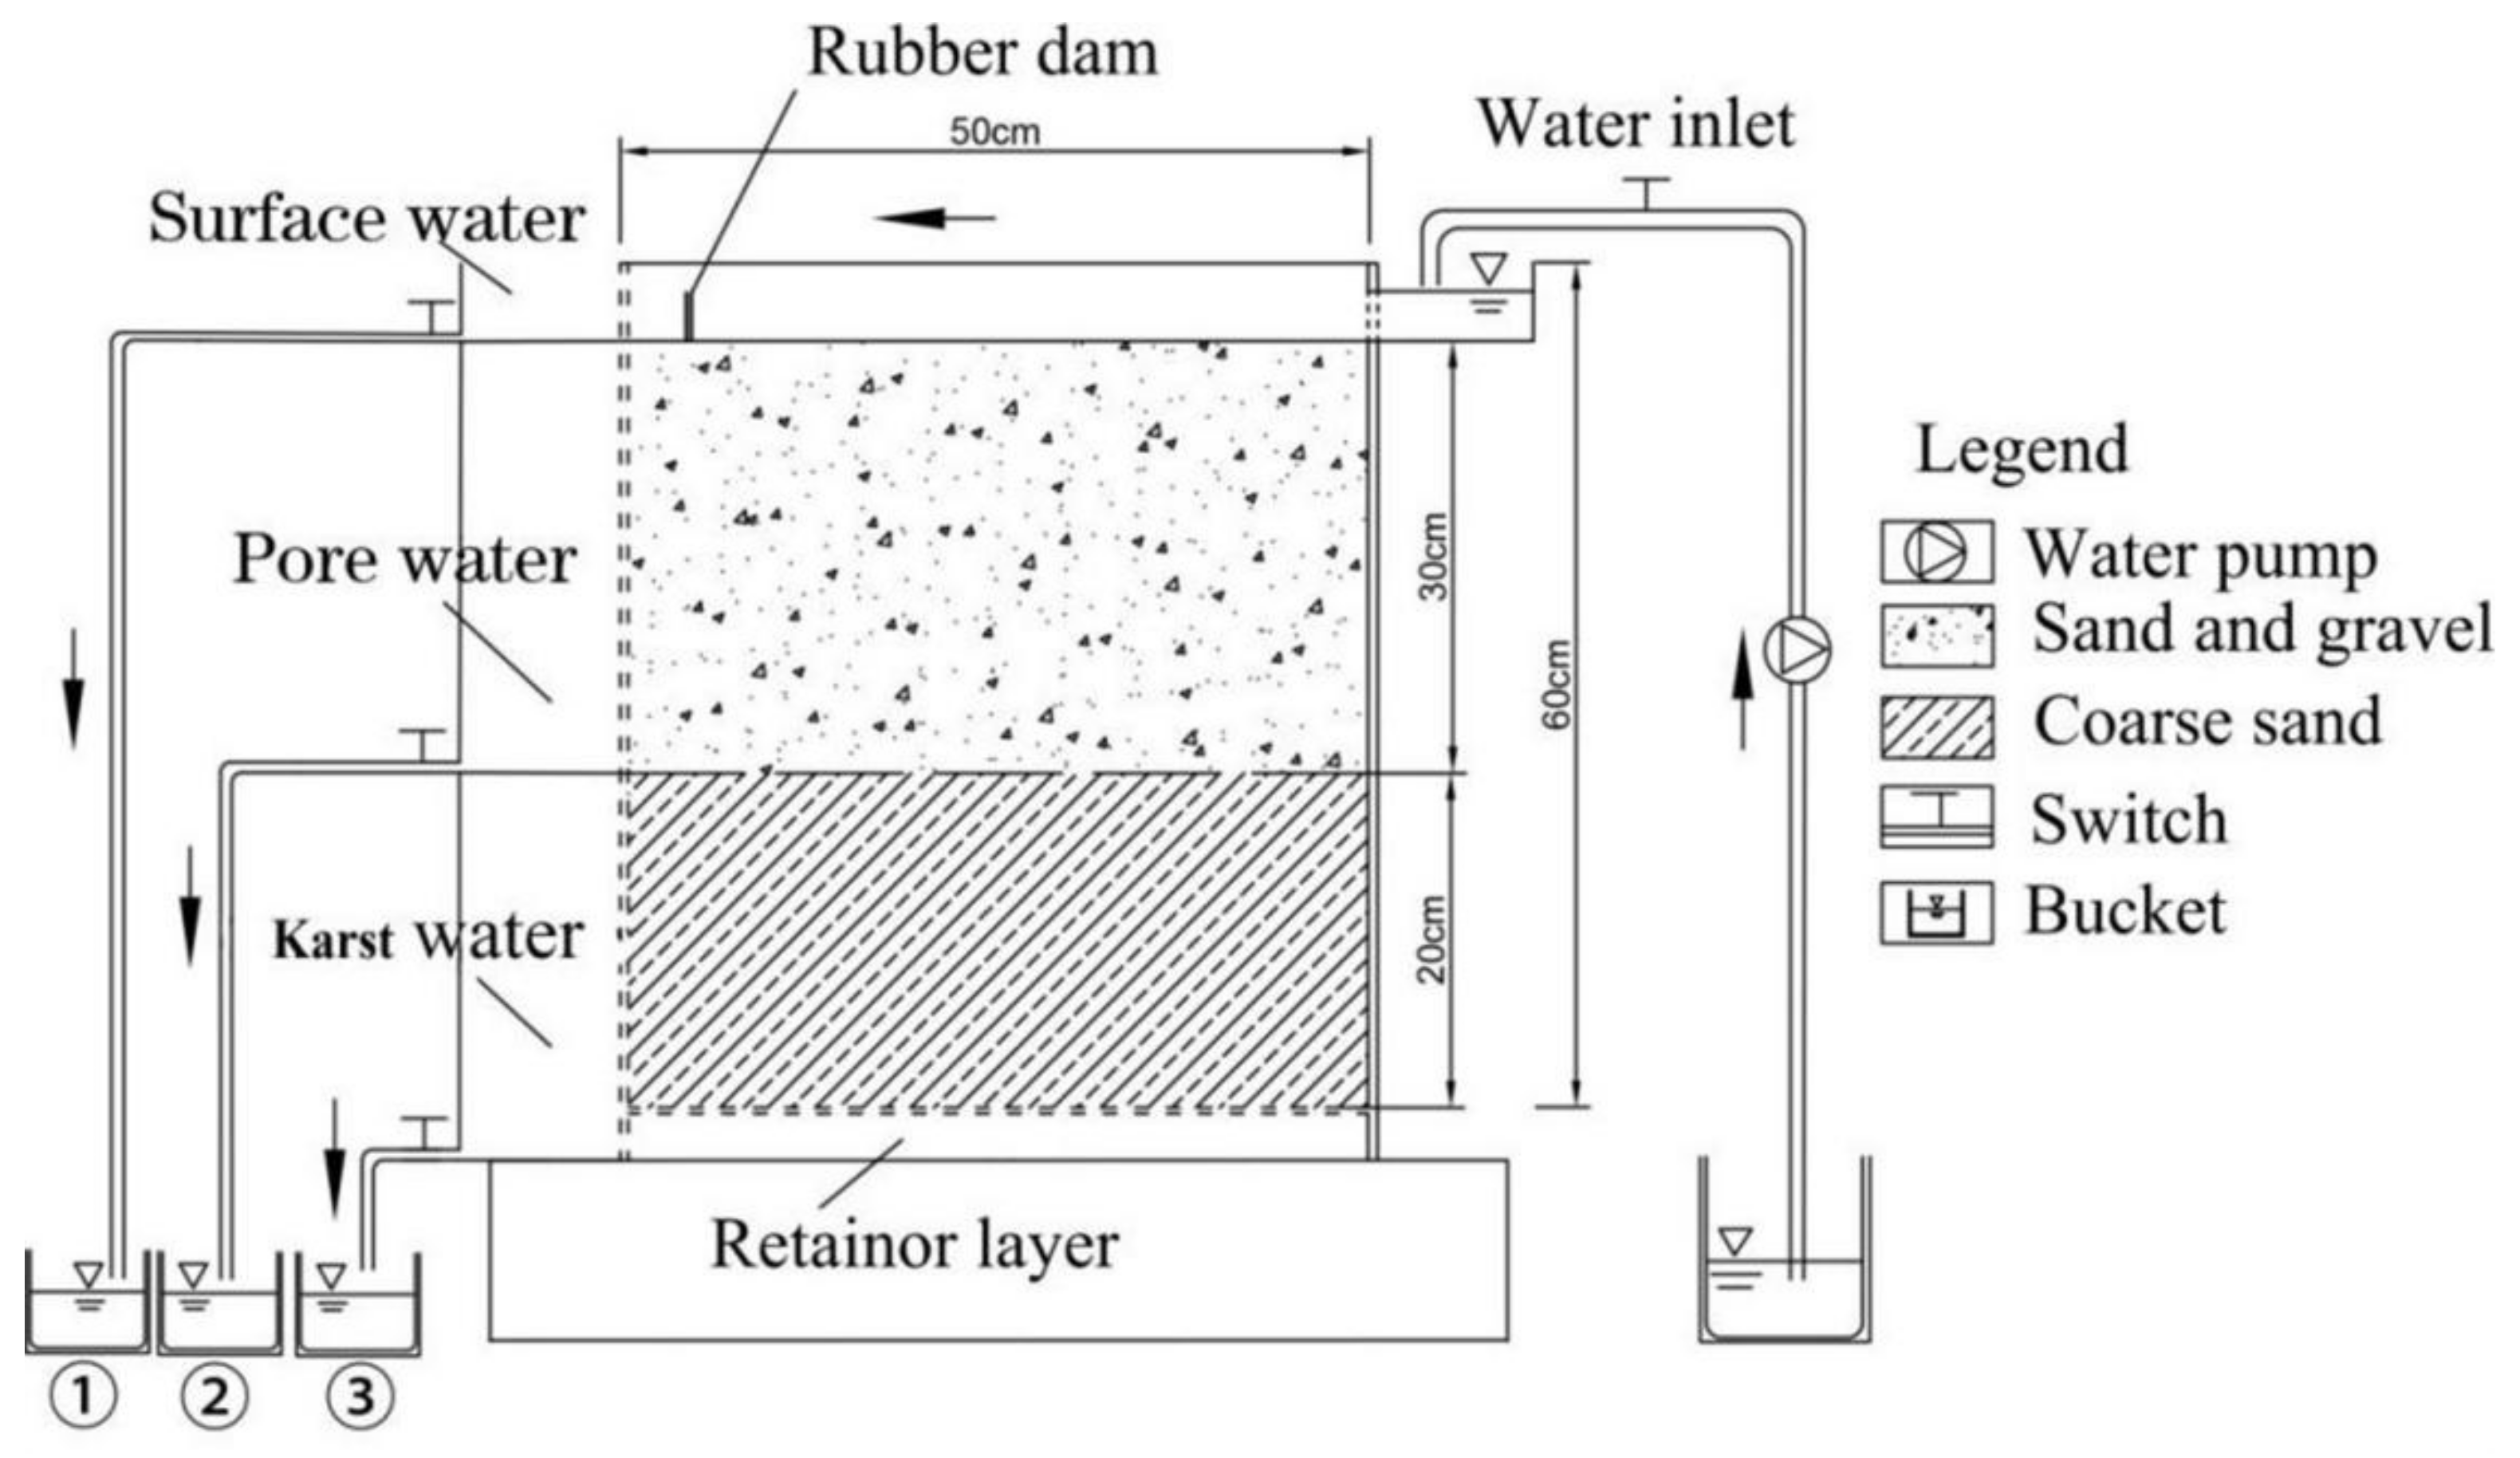
2.3. Methods
2.3.1. Experiment on Water Distribution Mechanism
2.3.2. Experiment on the Silt Clogging Mechanism
3. Results
3.1. Water Distribution Mechanism
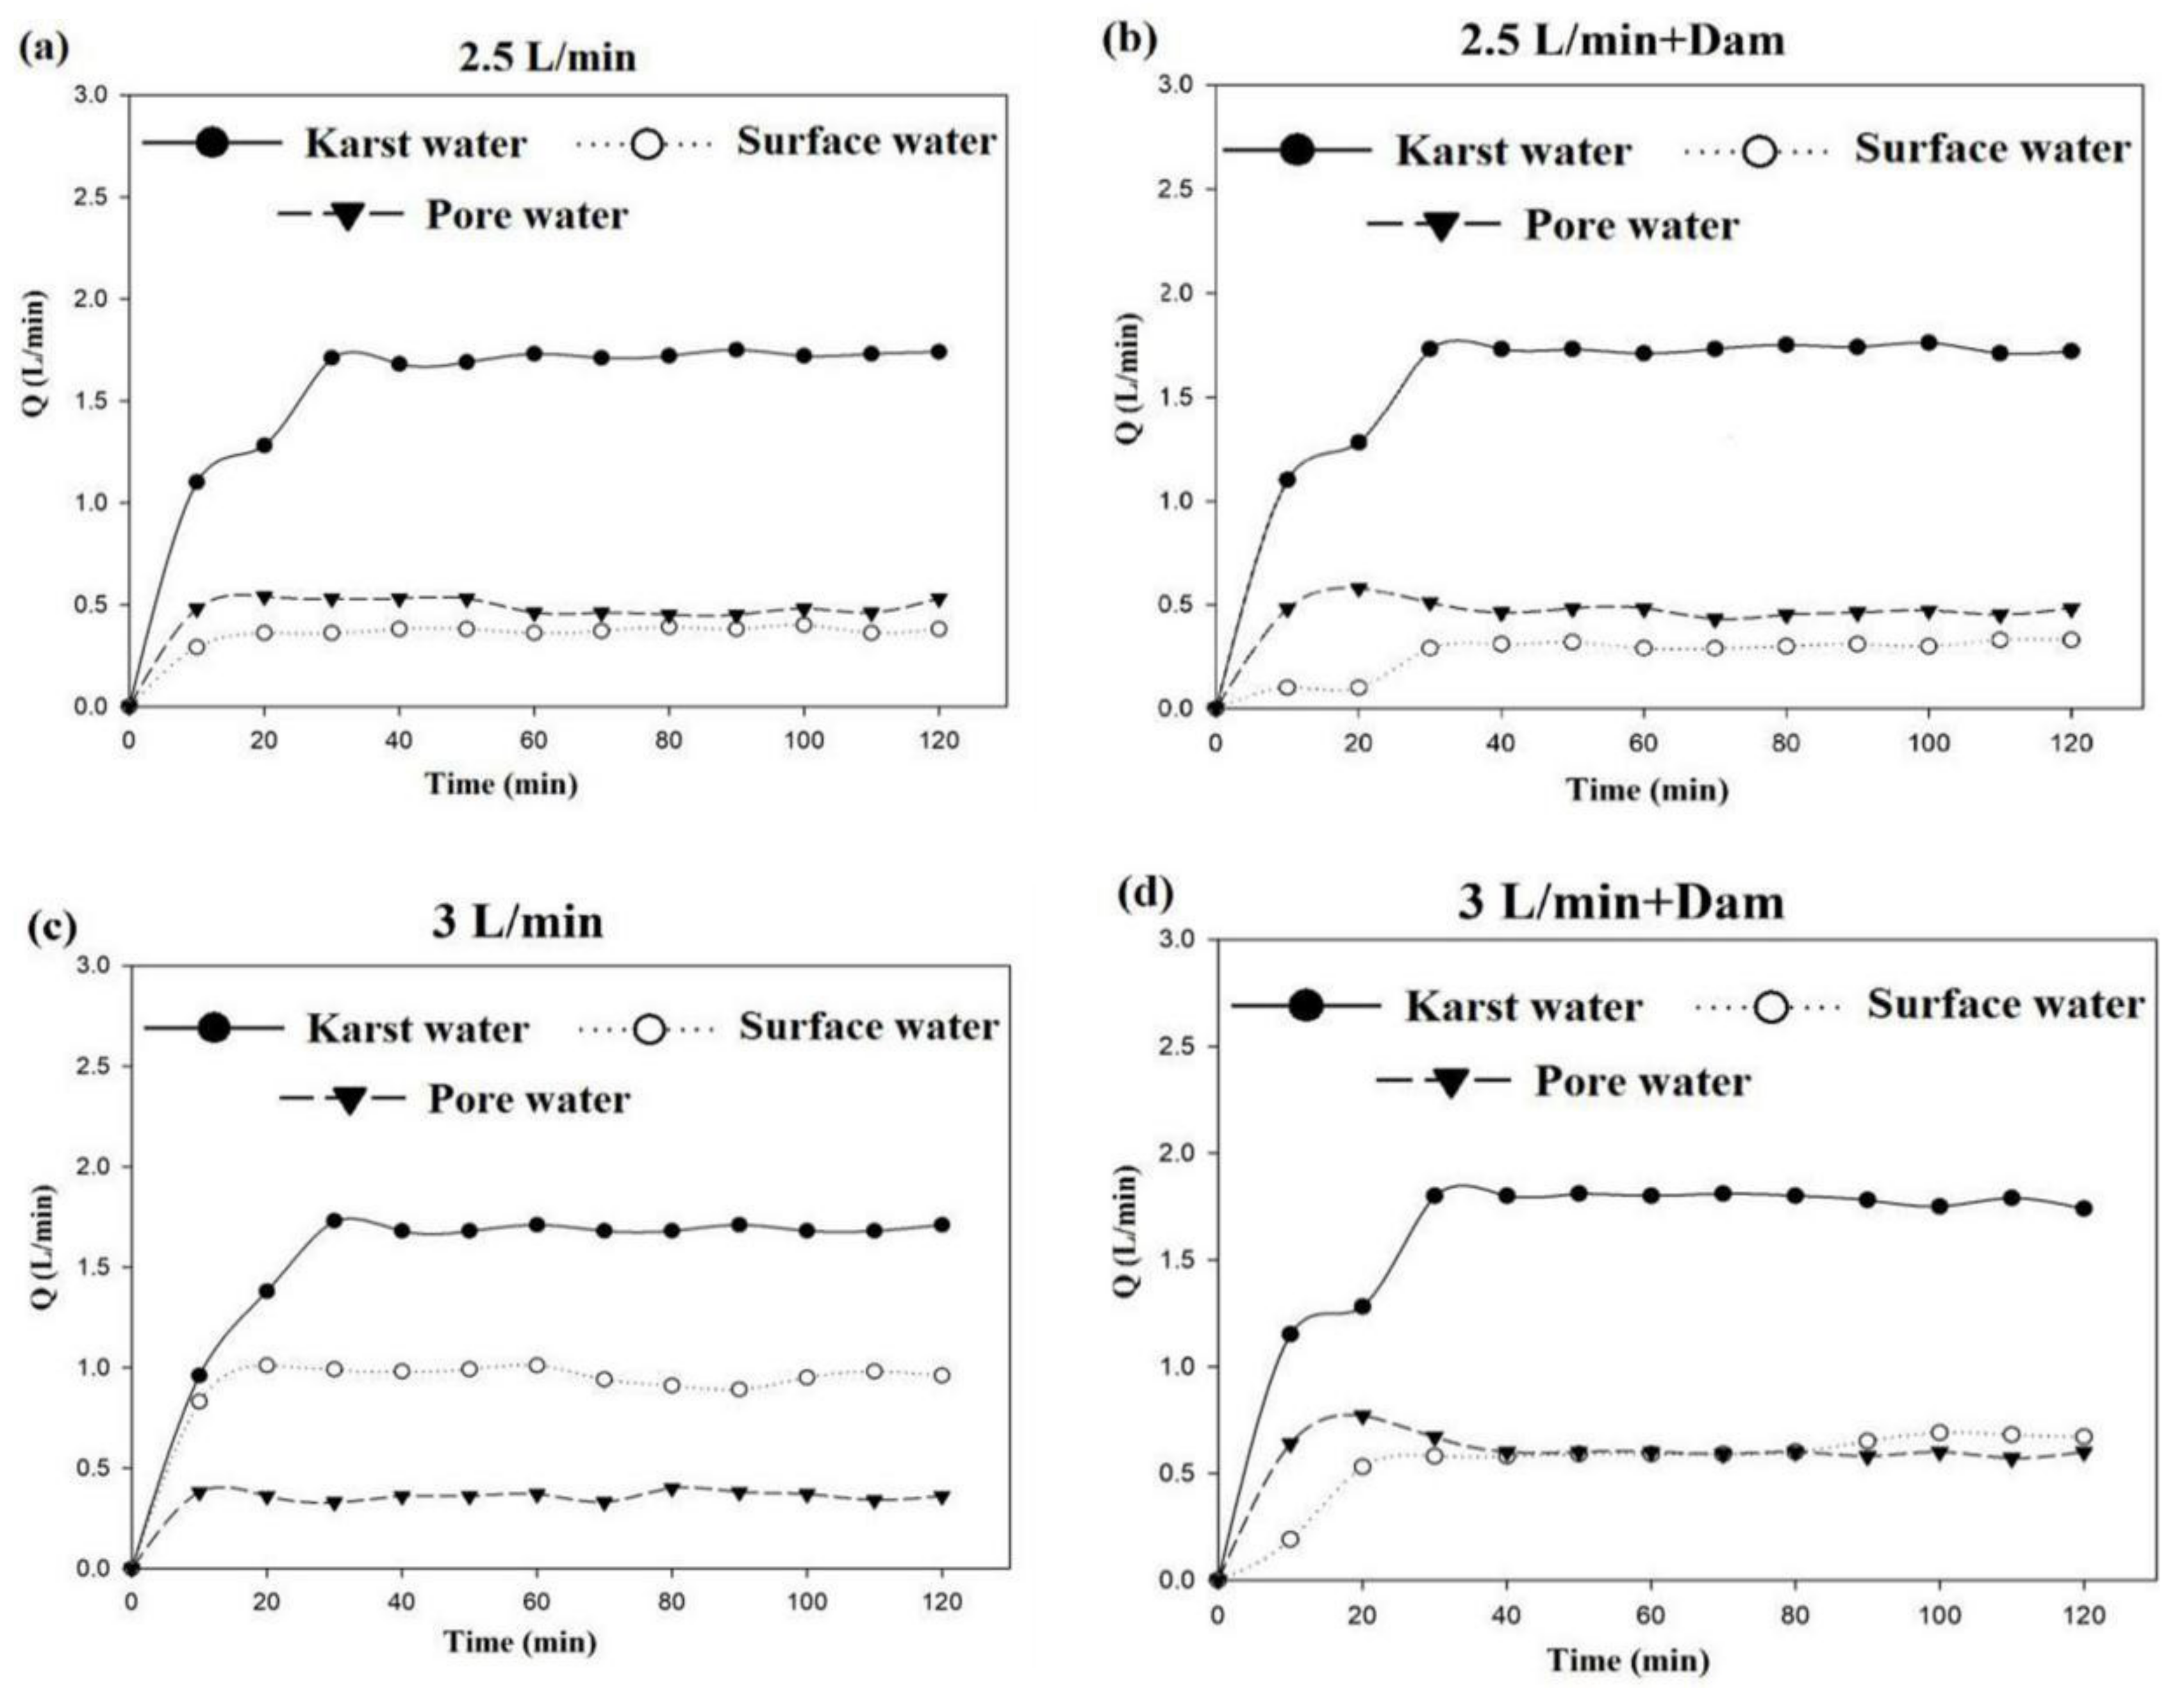
3.1.1. Influence of the Water Release Rate
3.1.2. Influence of the Rubber Dam
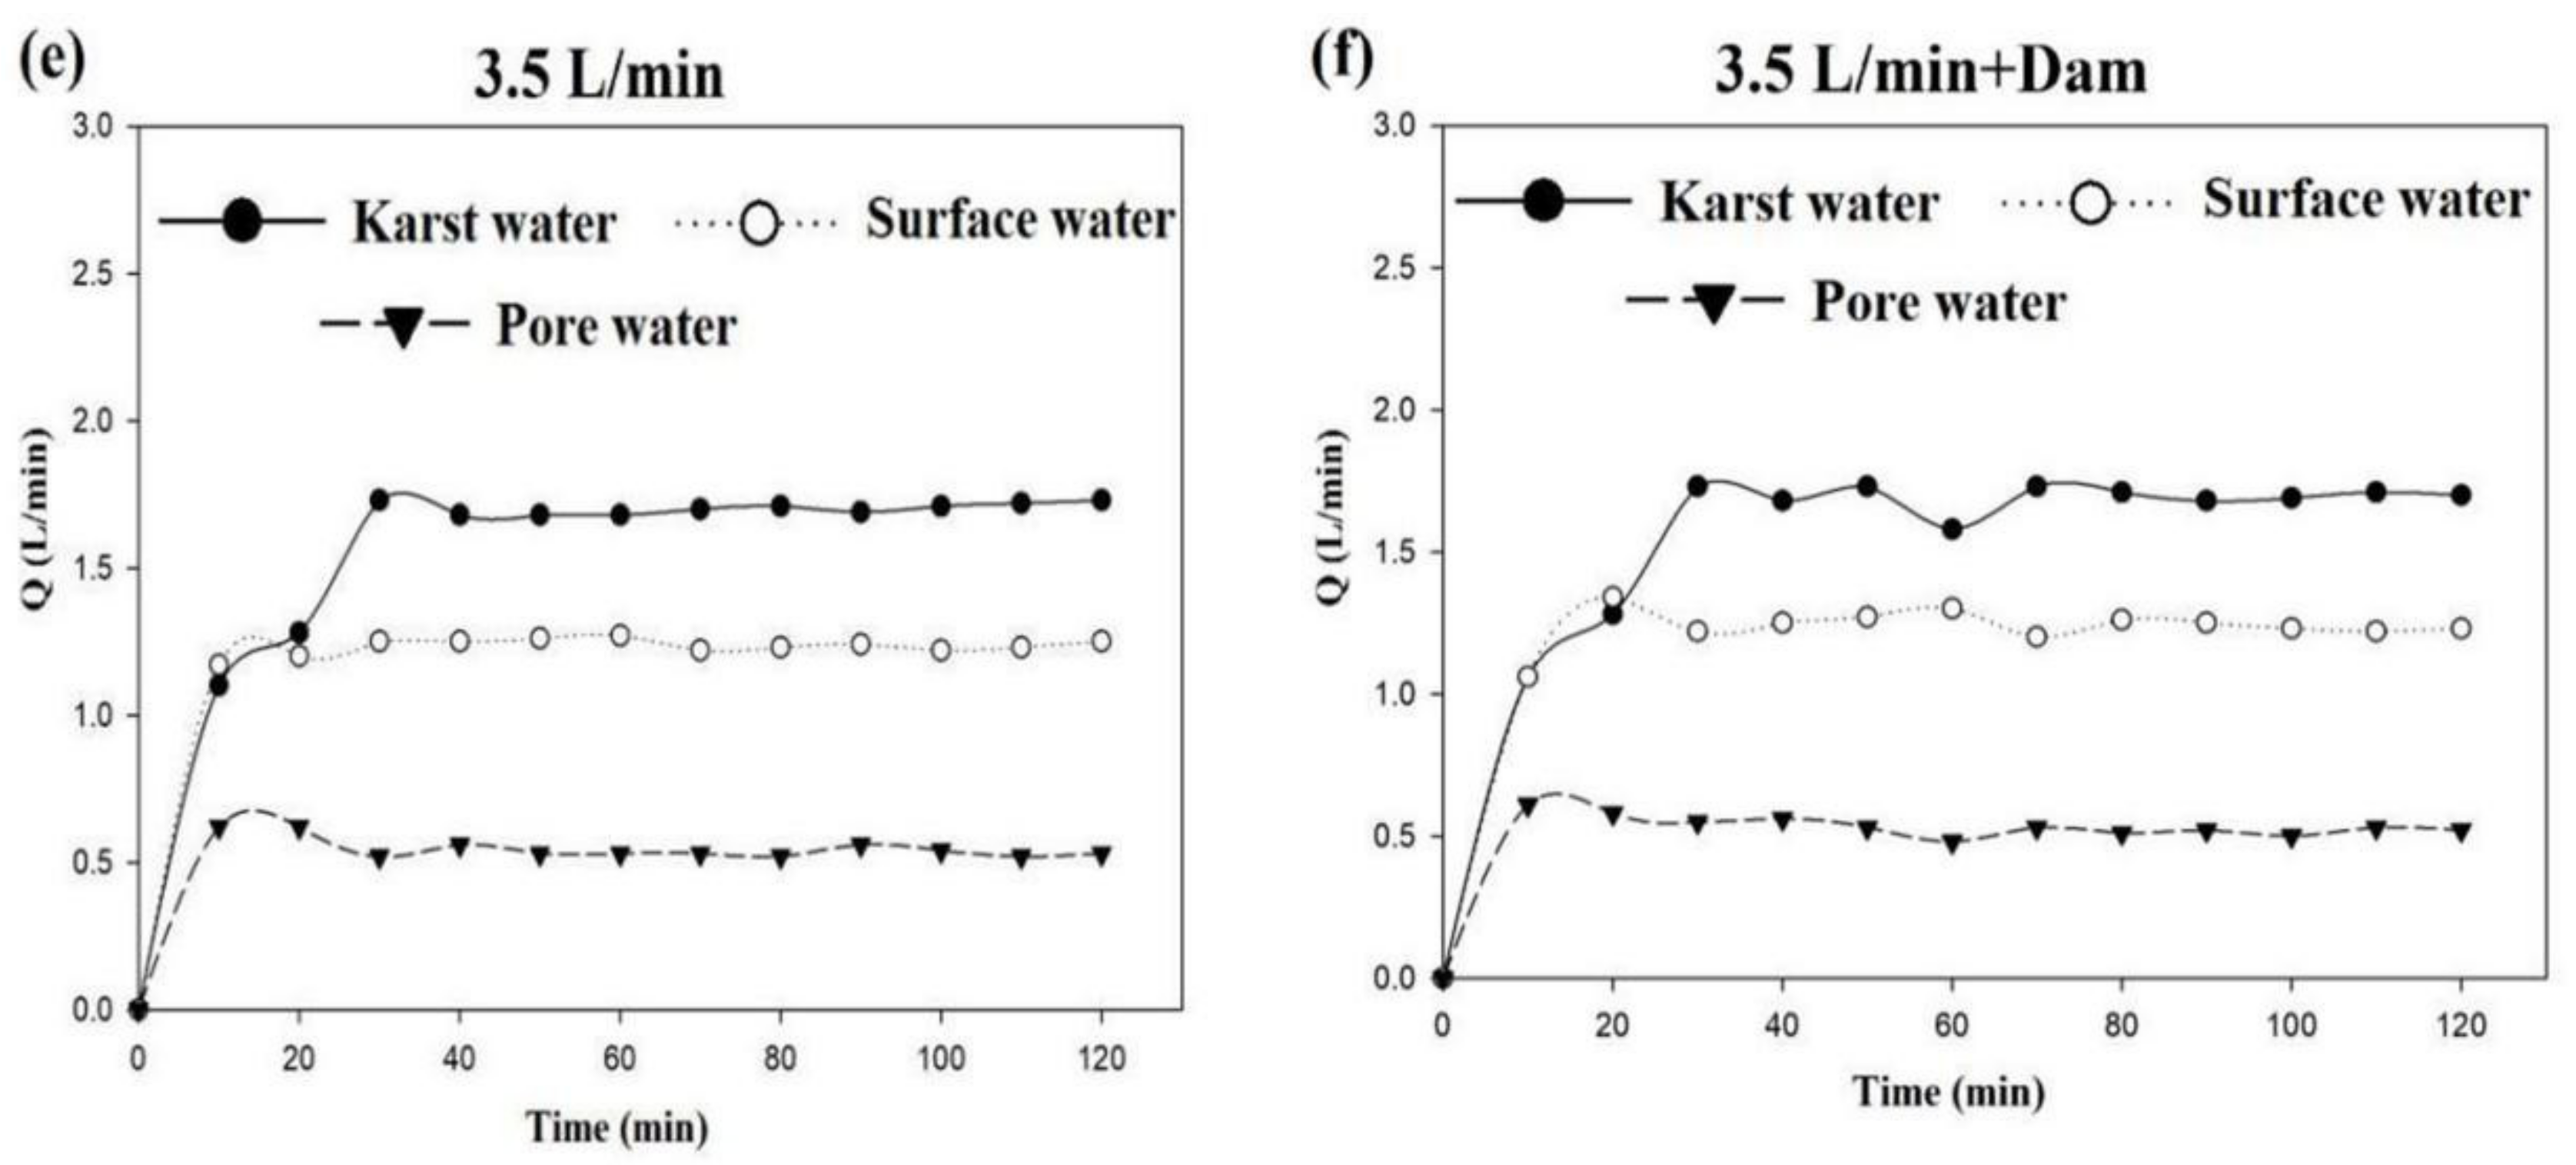
3.1.3. Influence of Suspended Particles
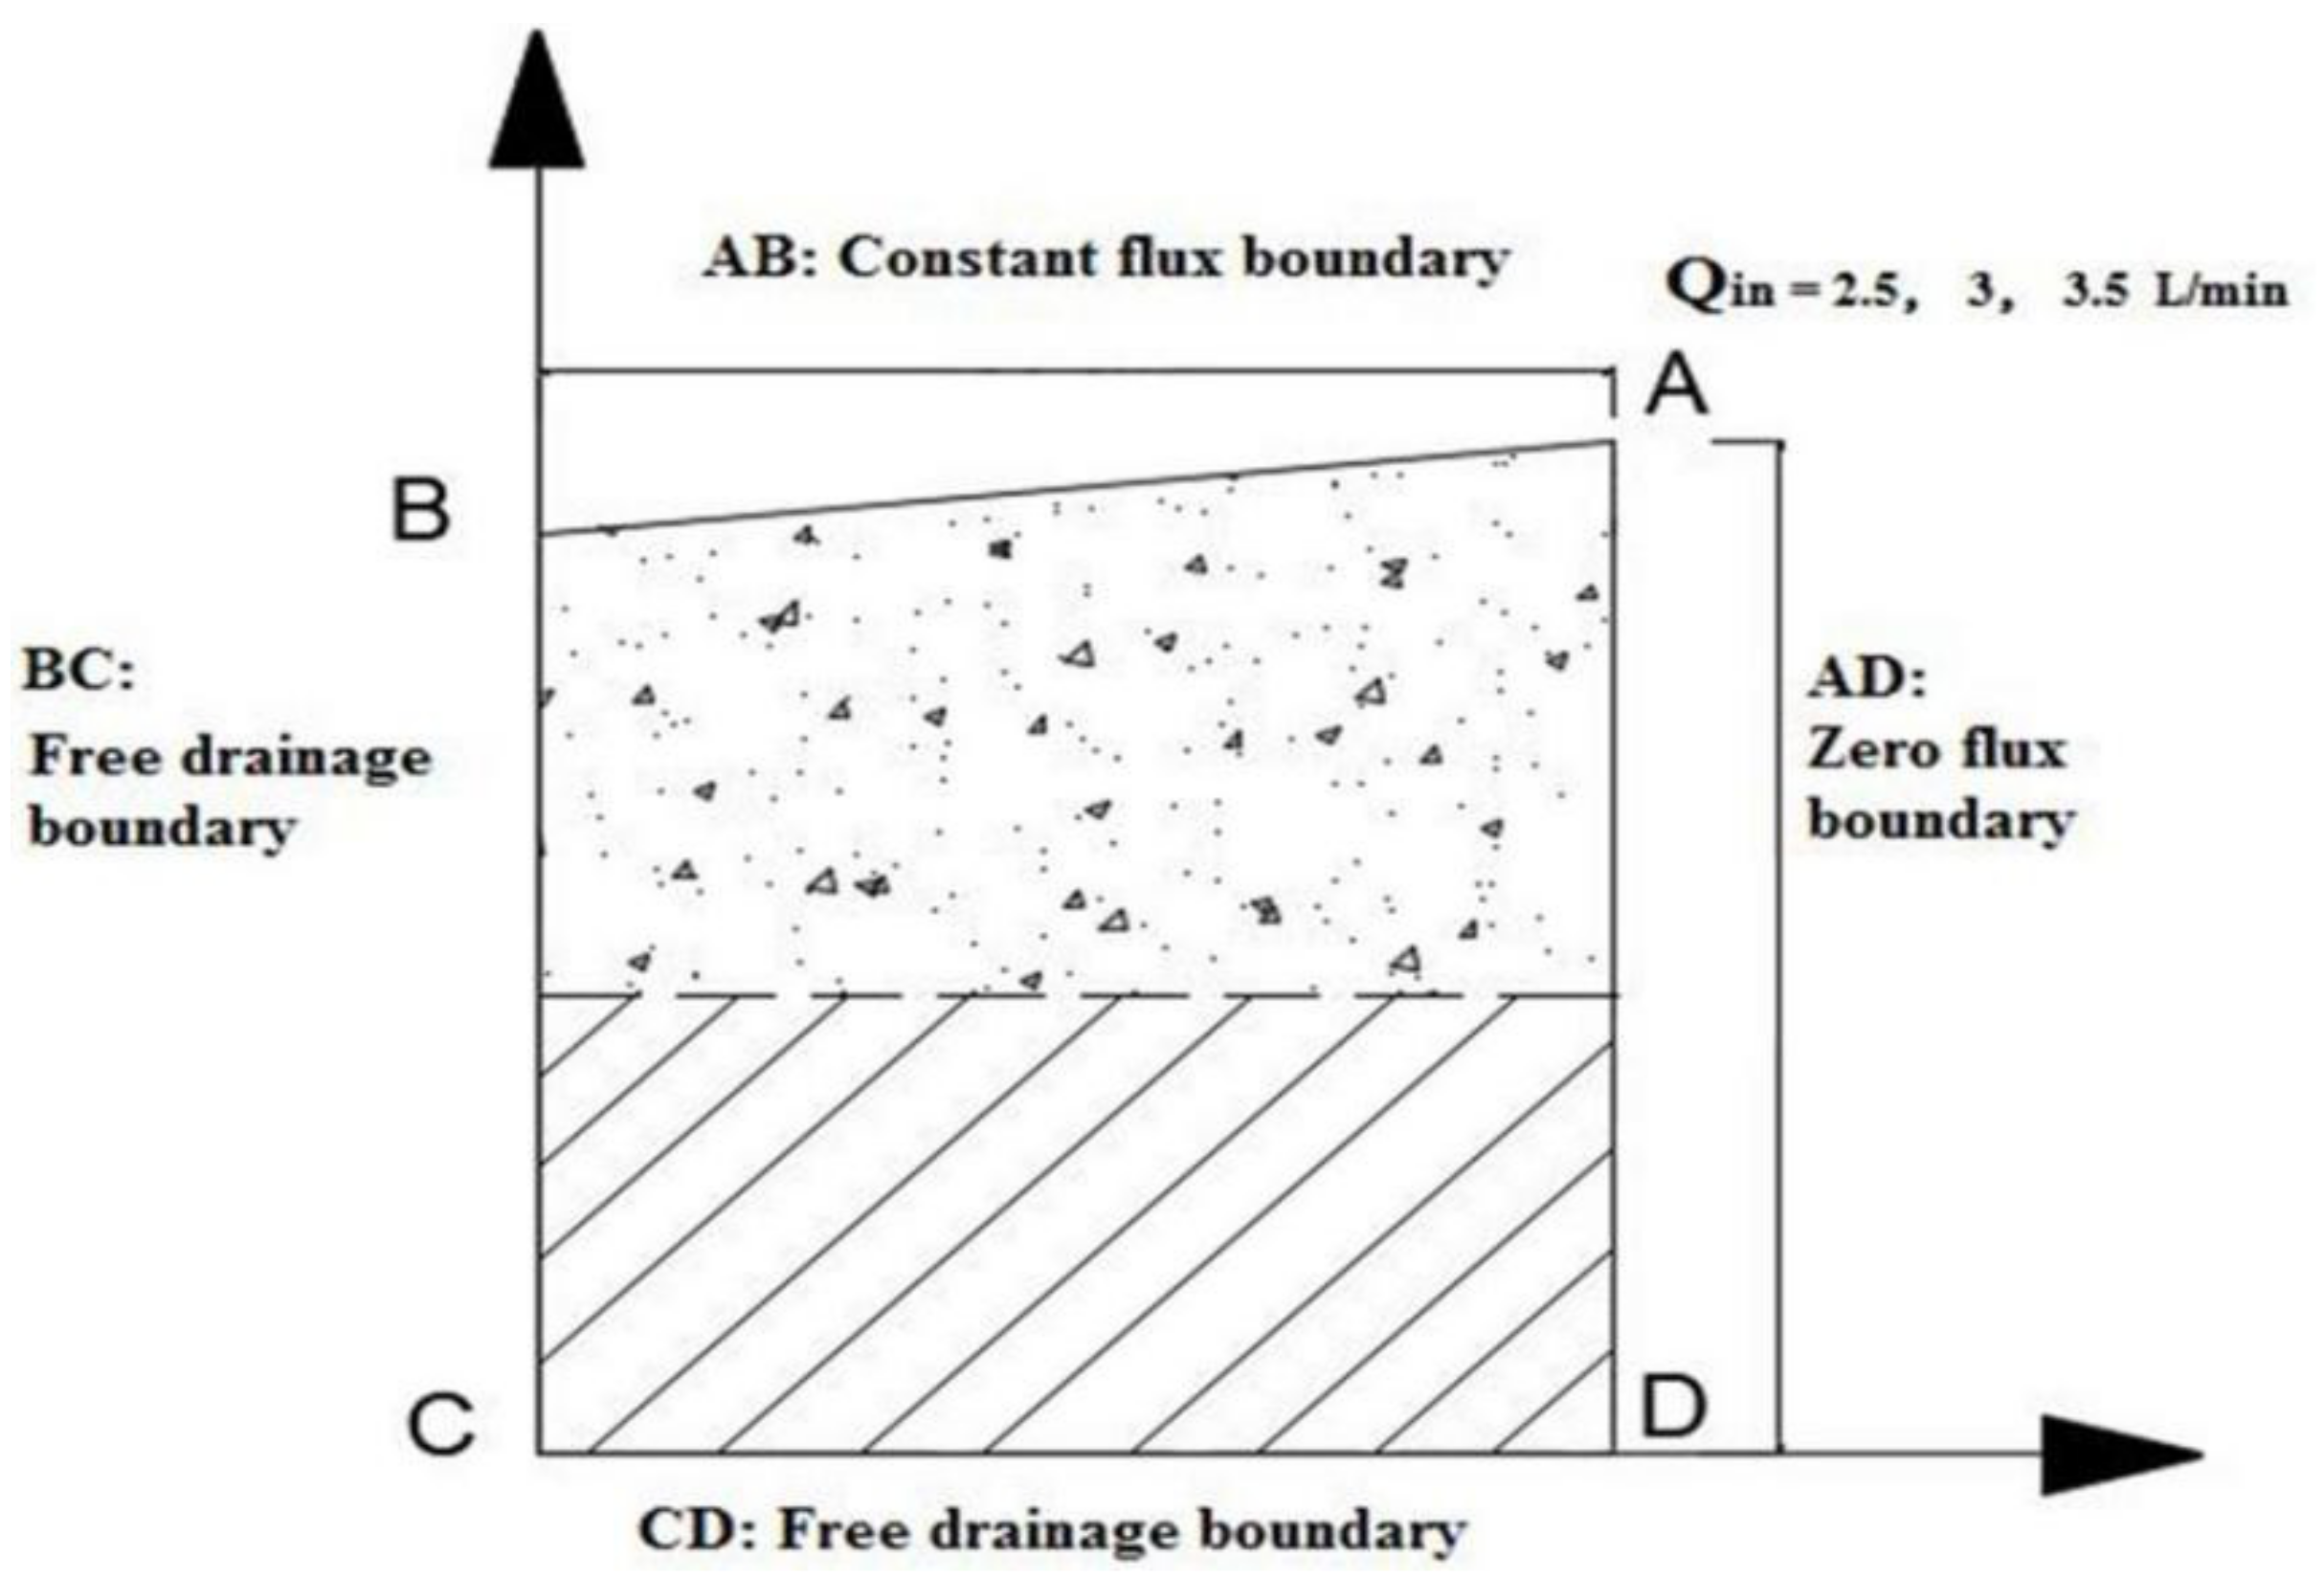
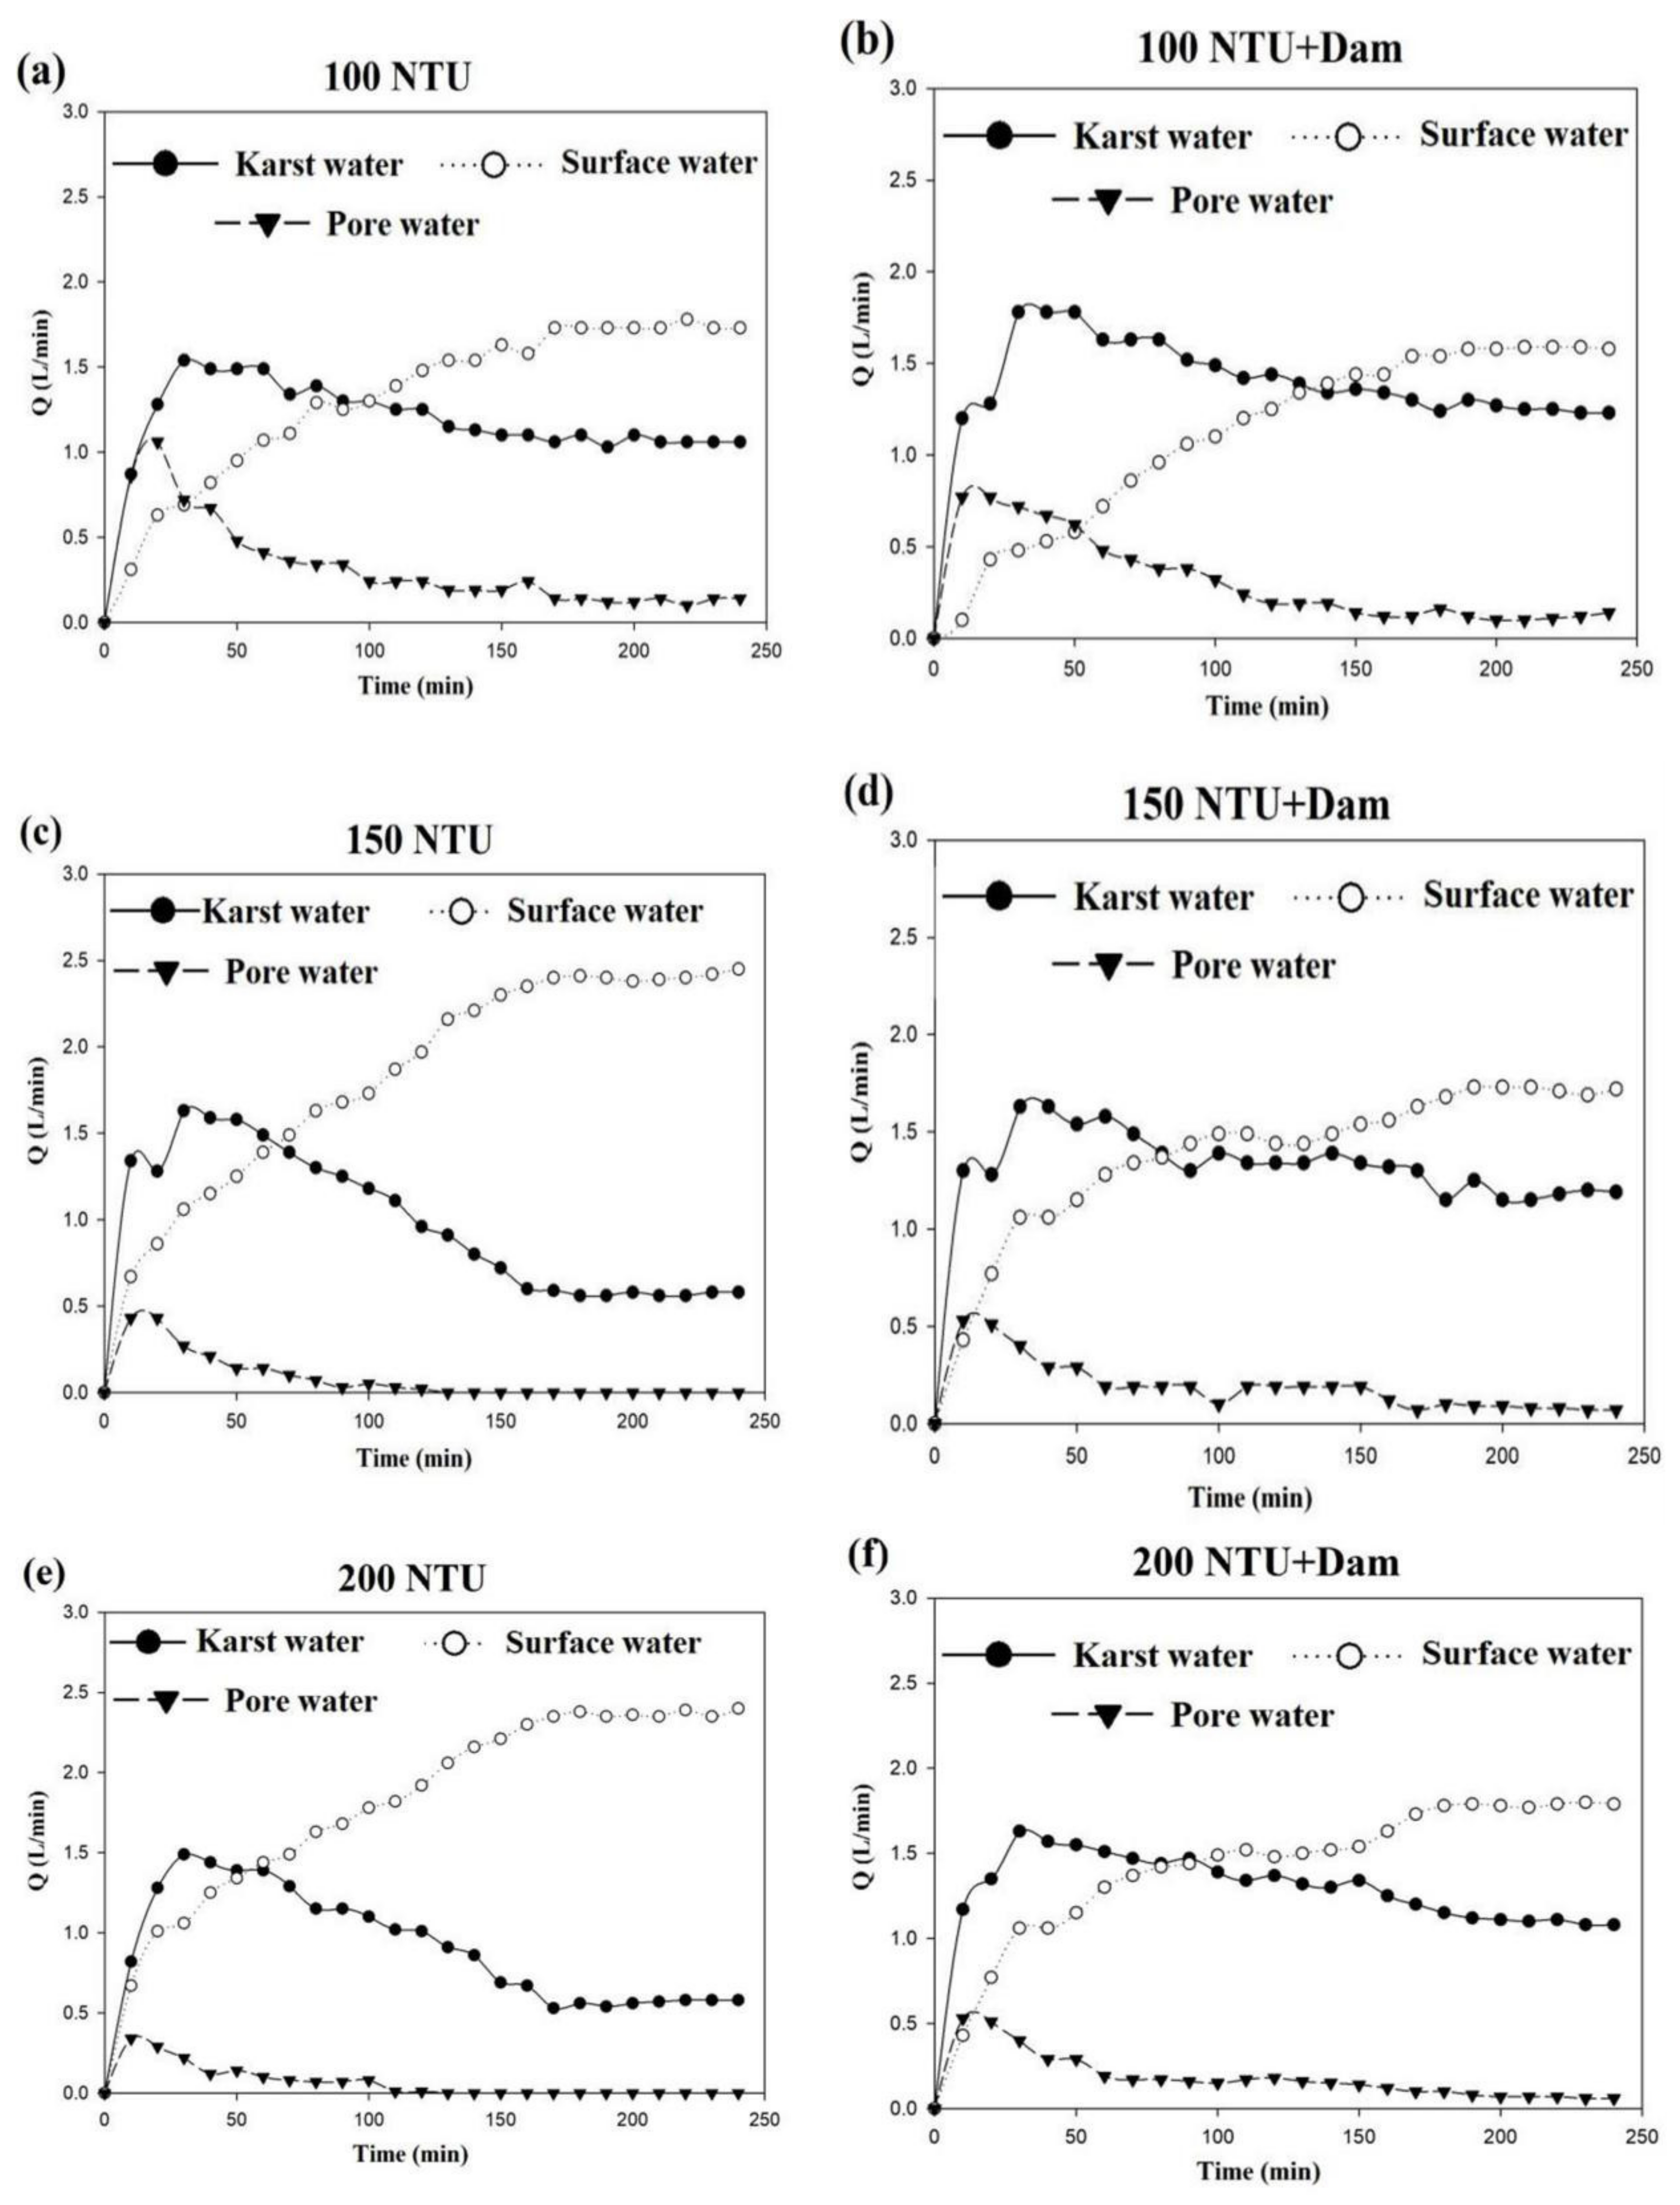
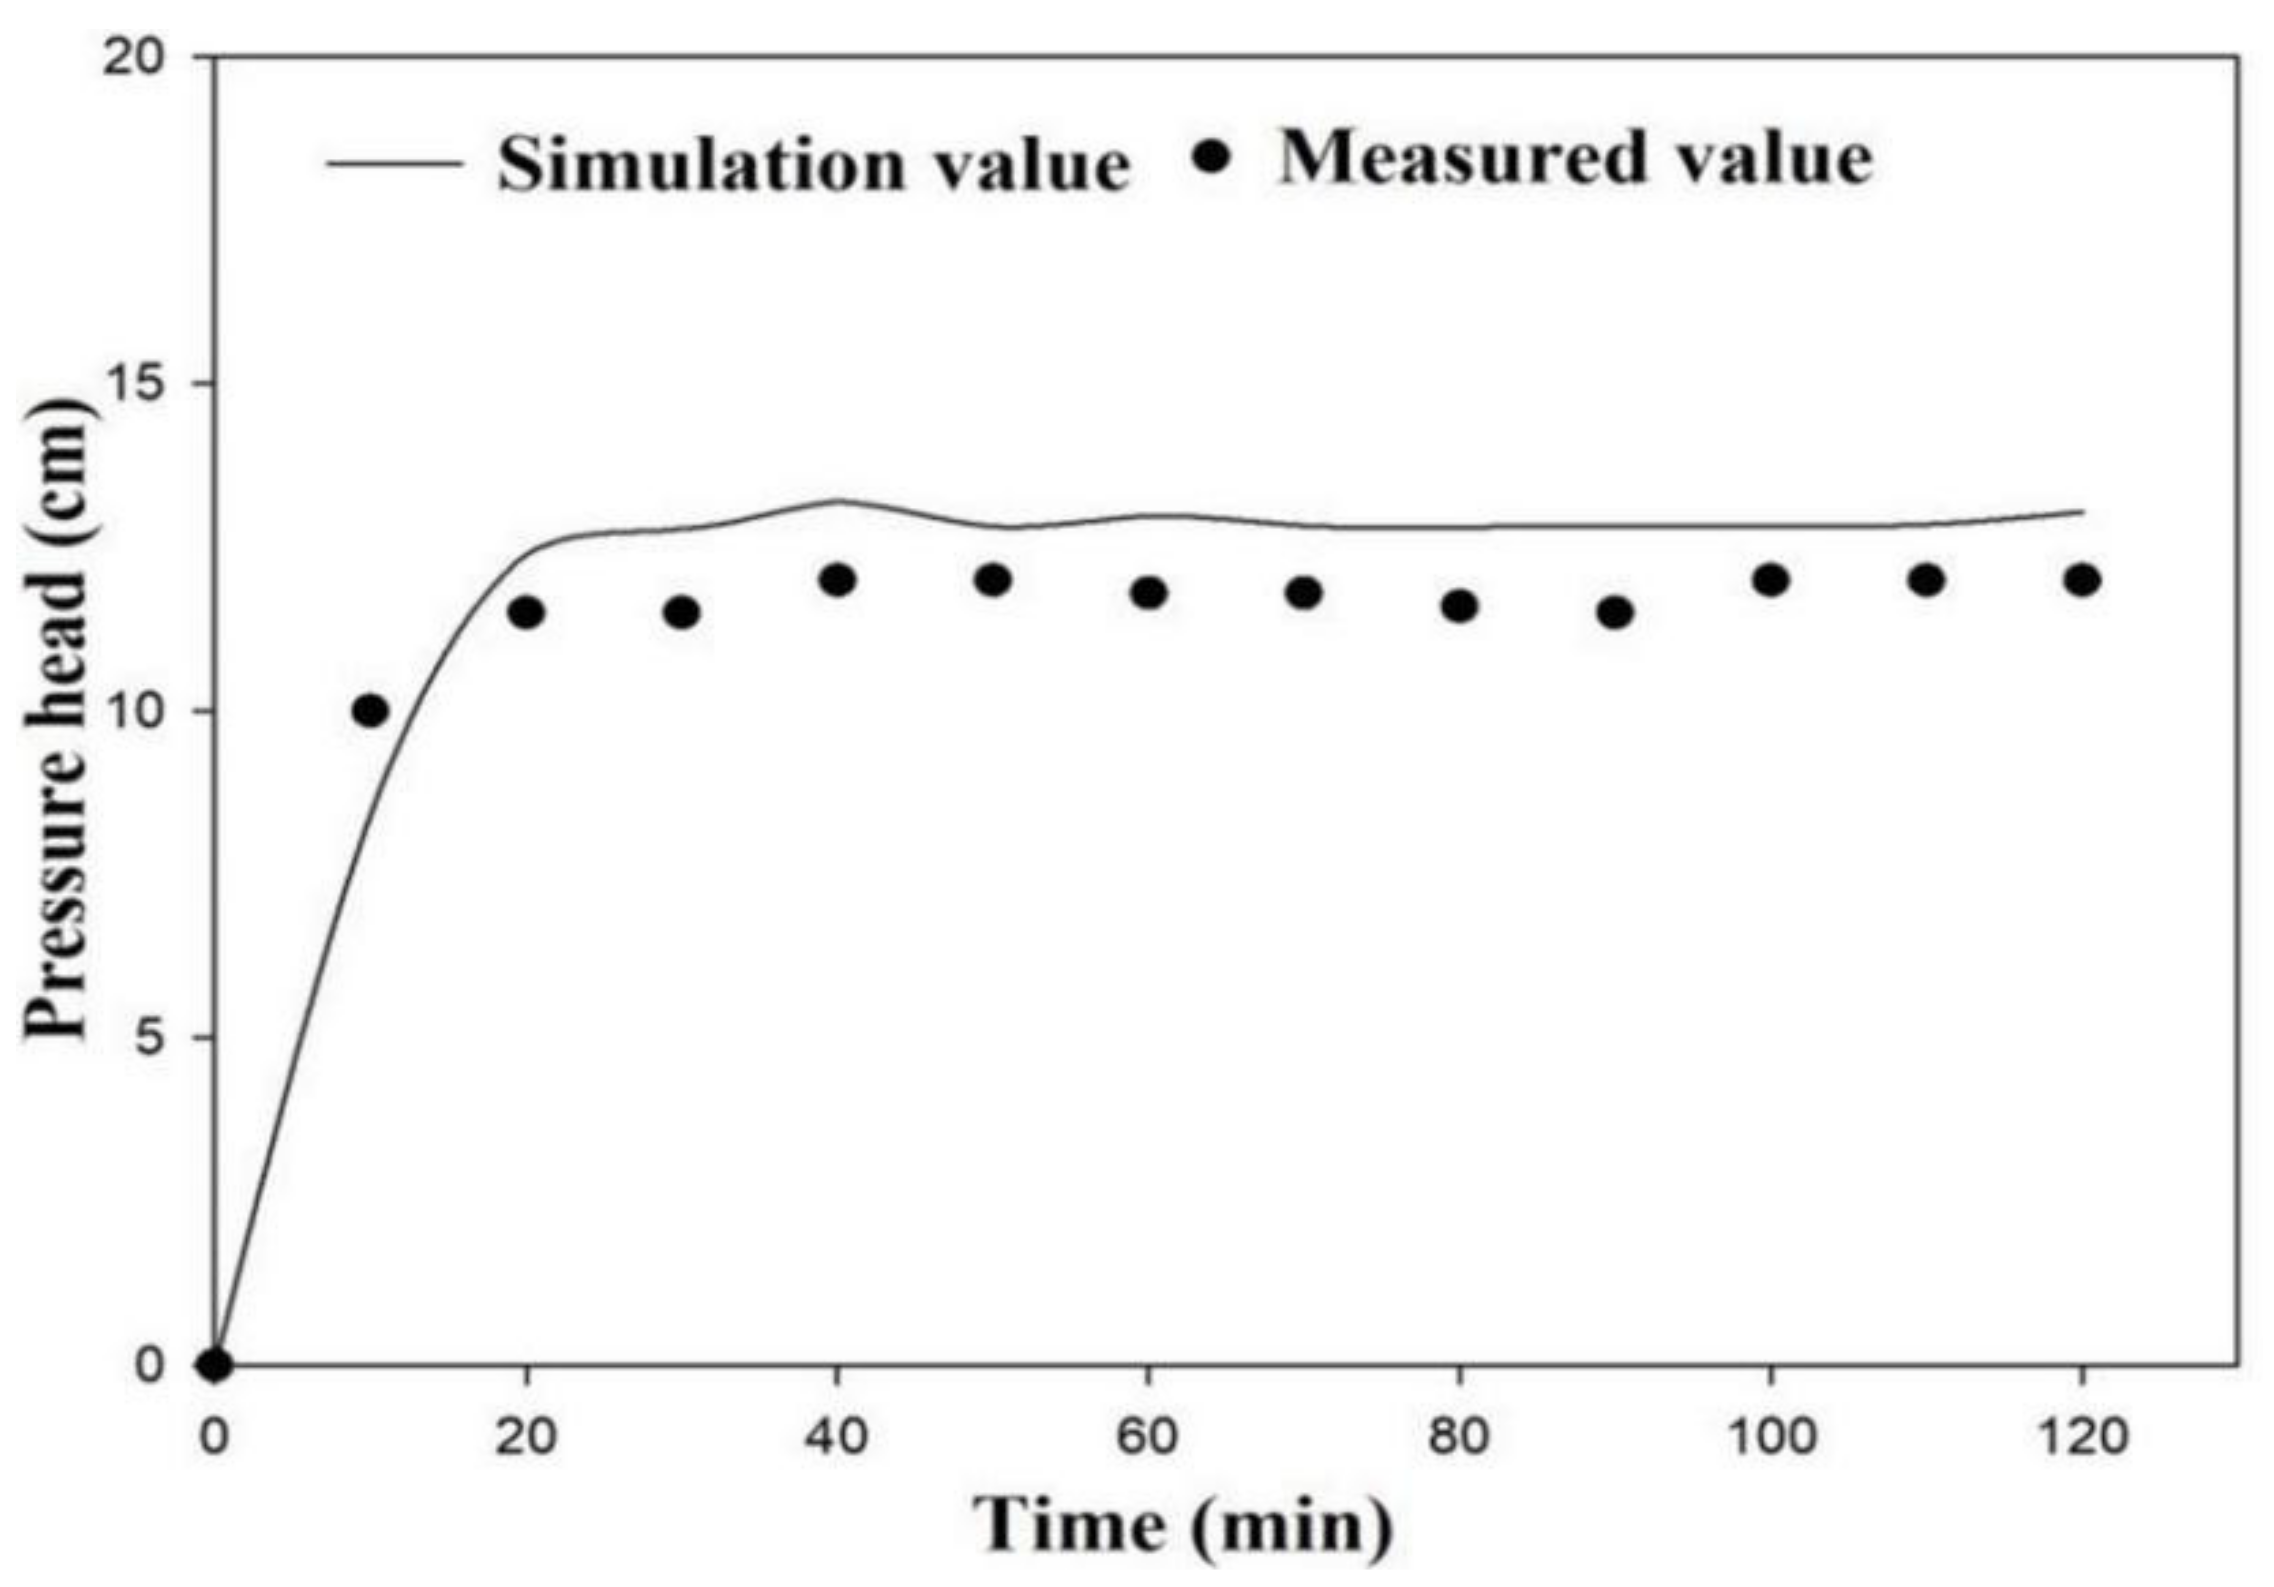
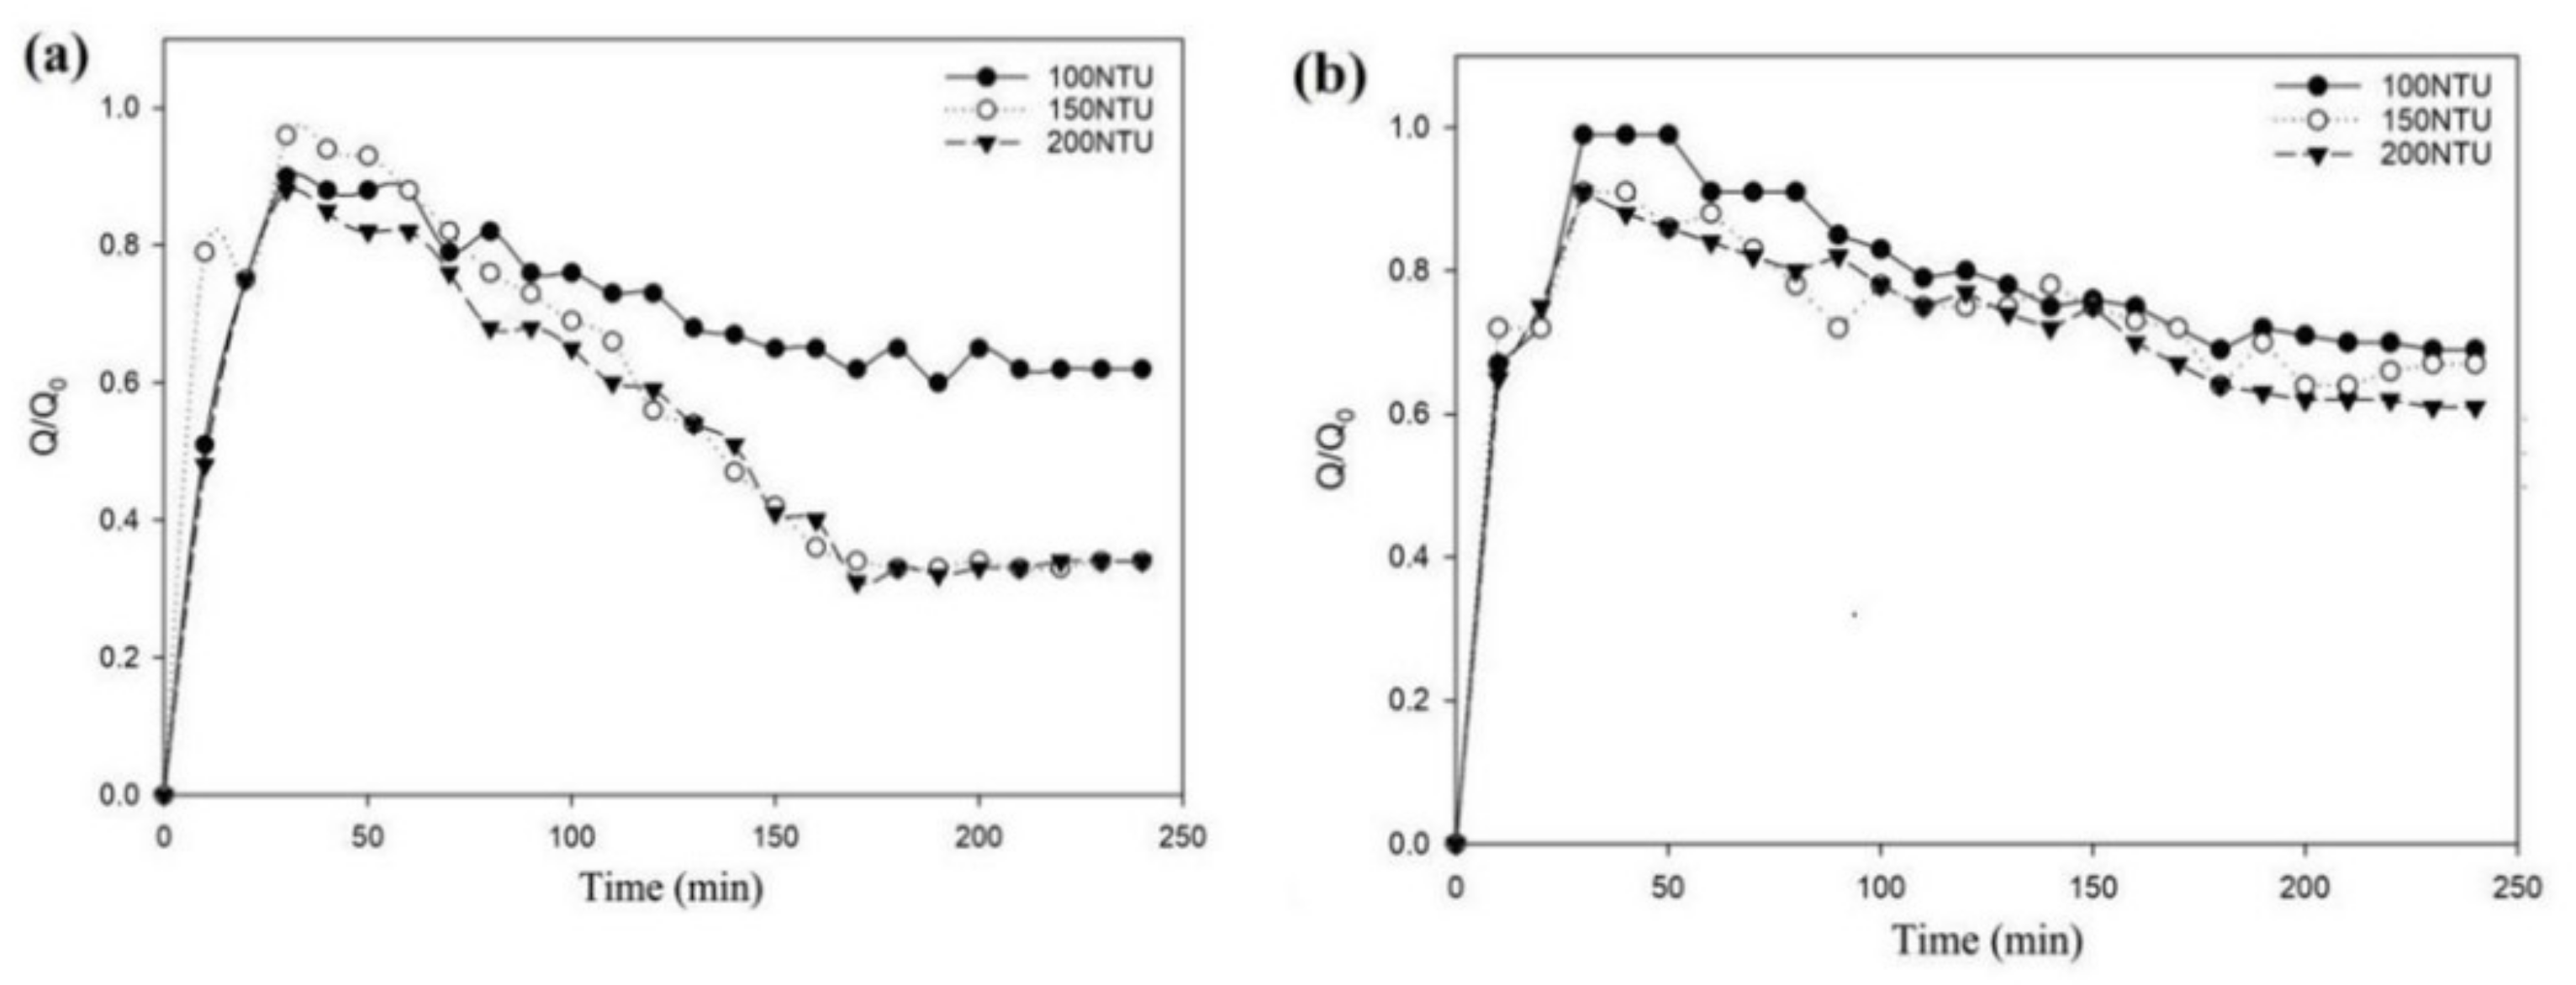
3.2. Numerical Simulation Verification of the Water Quantity Experiment
3.3. Suspended Particle Clogging Mechanism
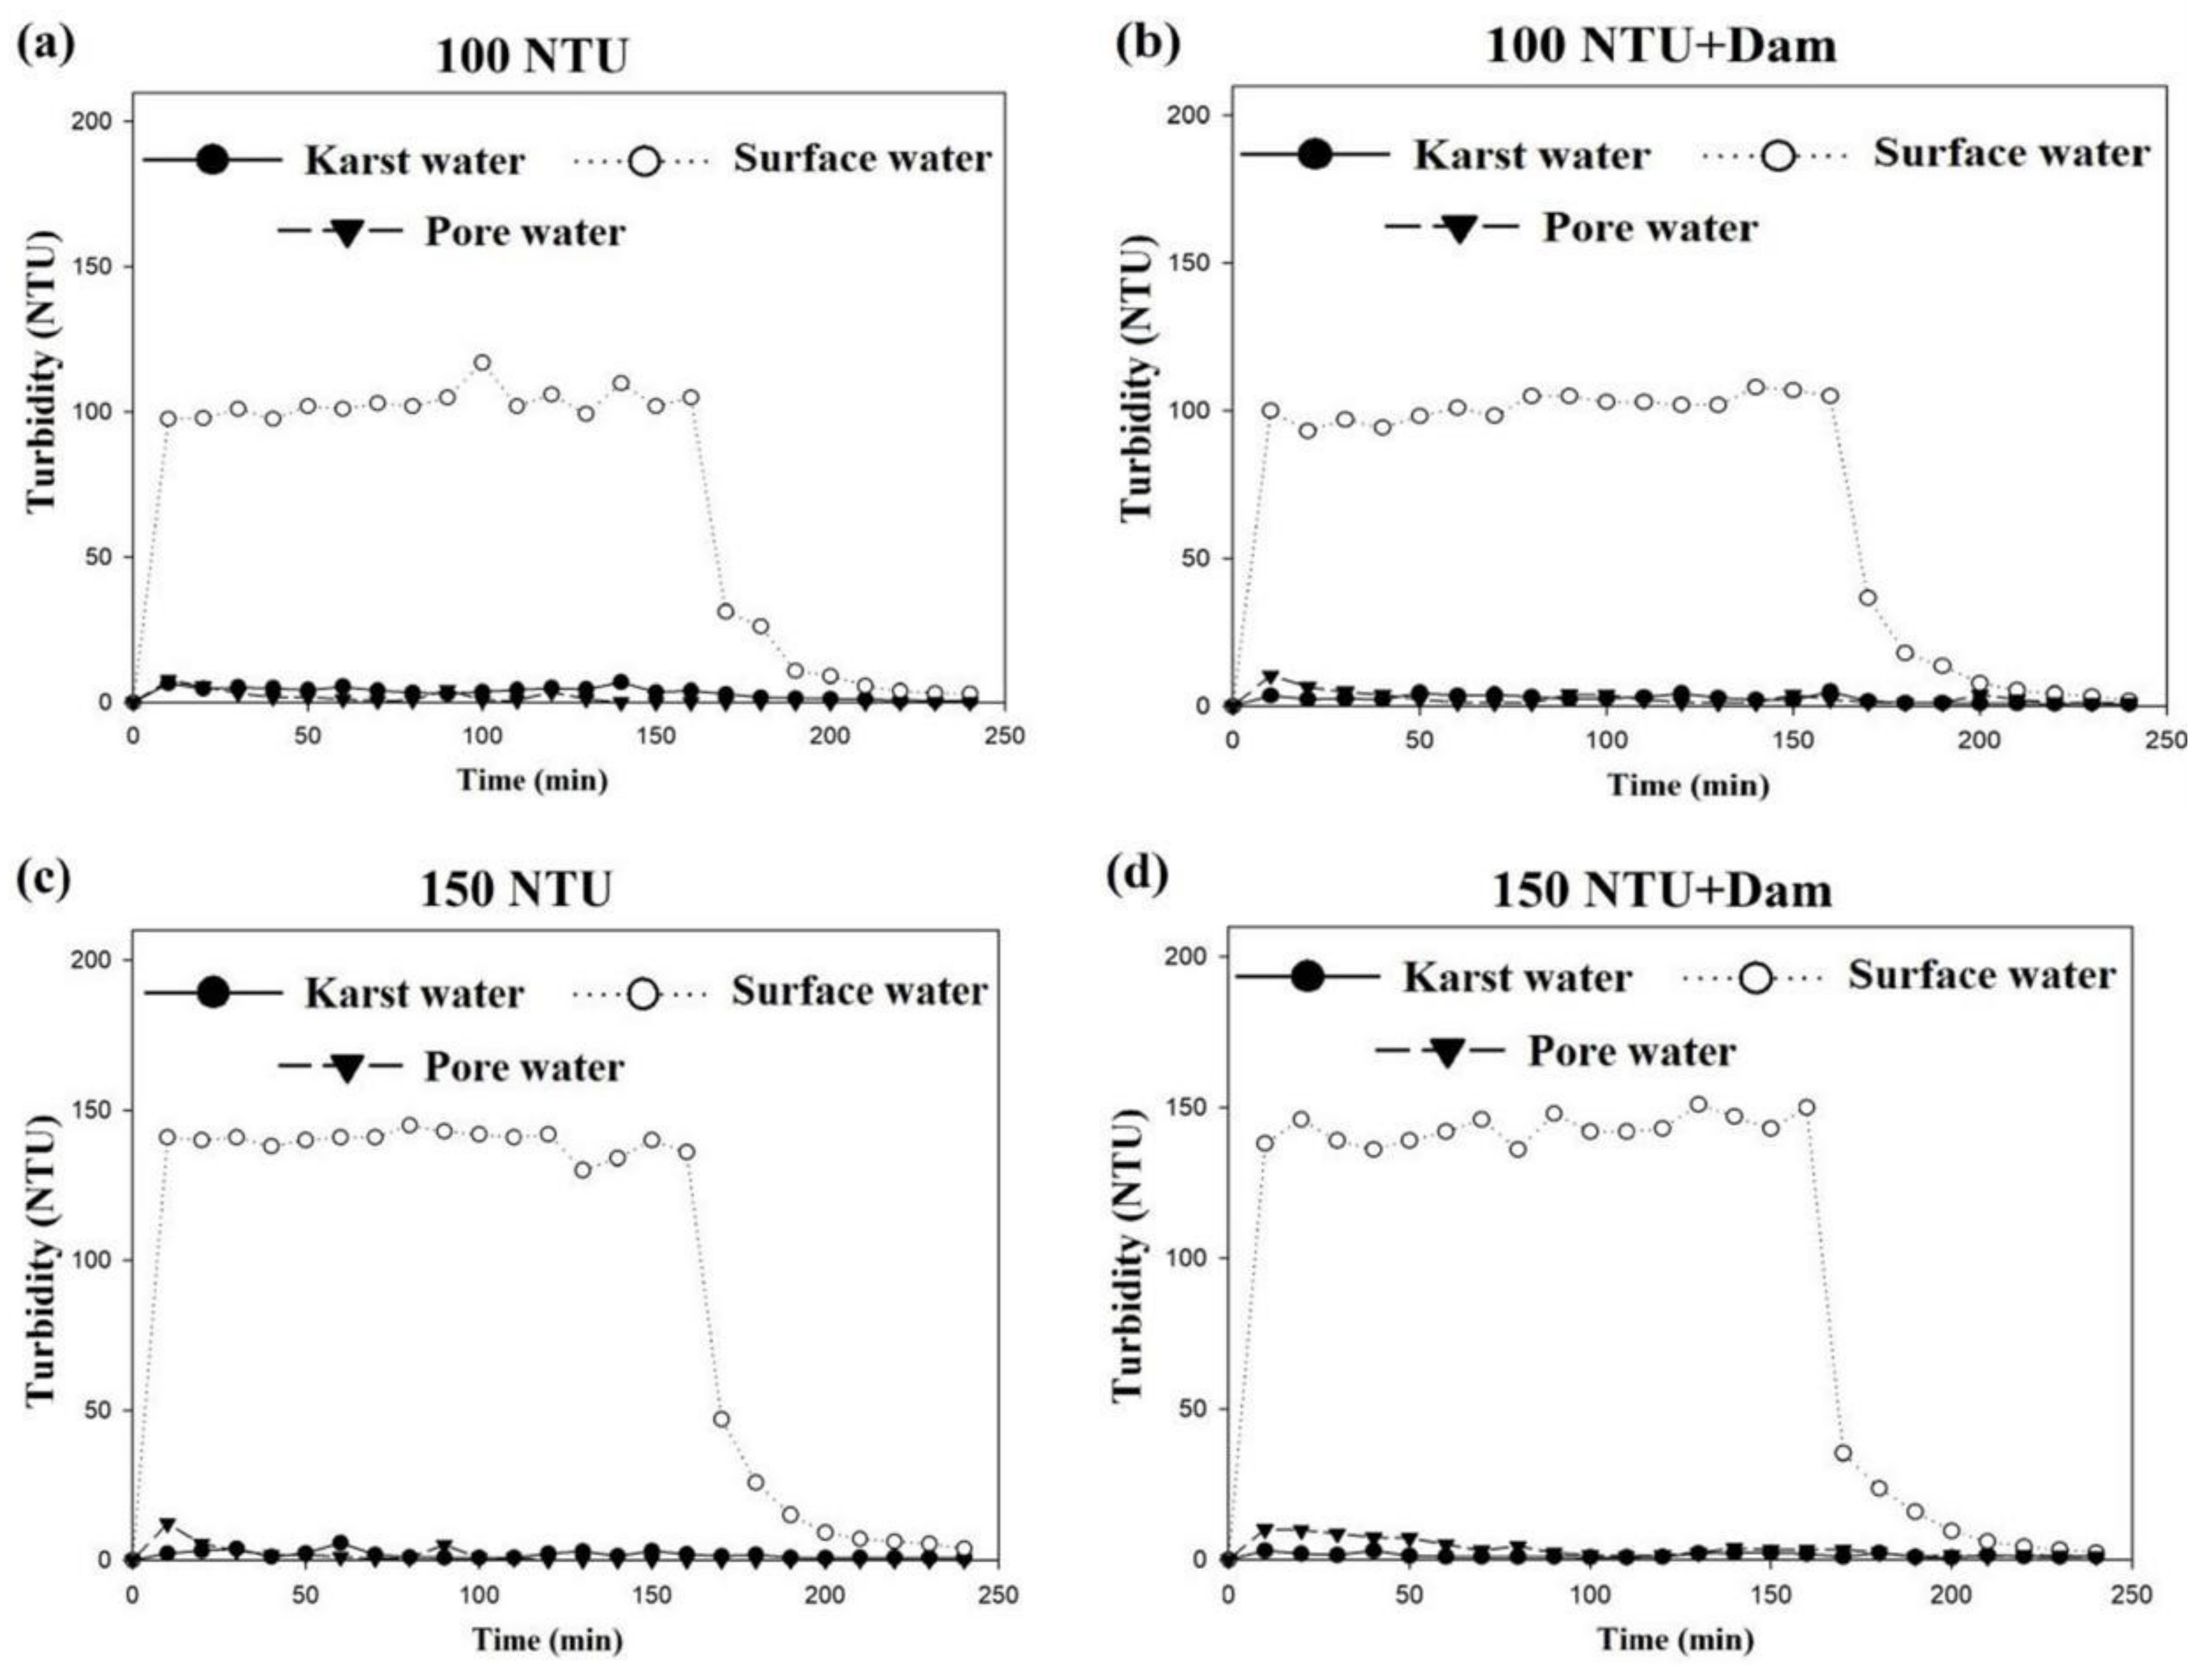
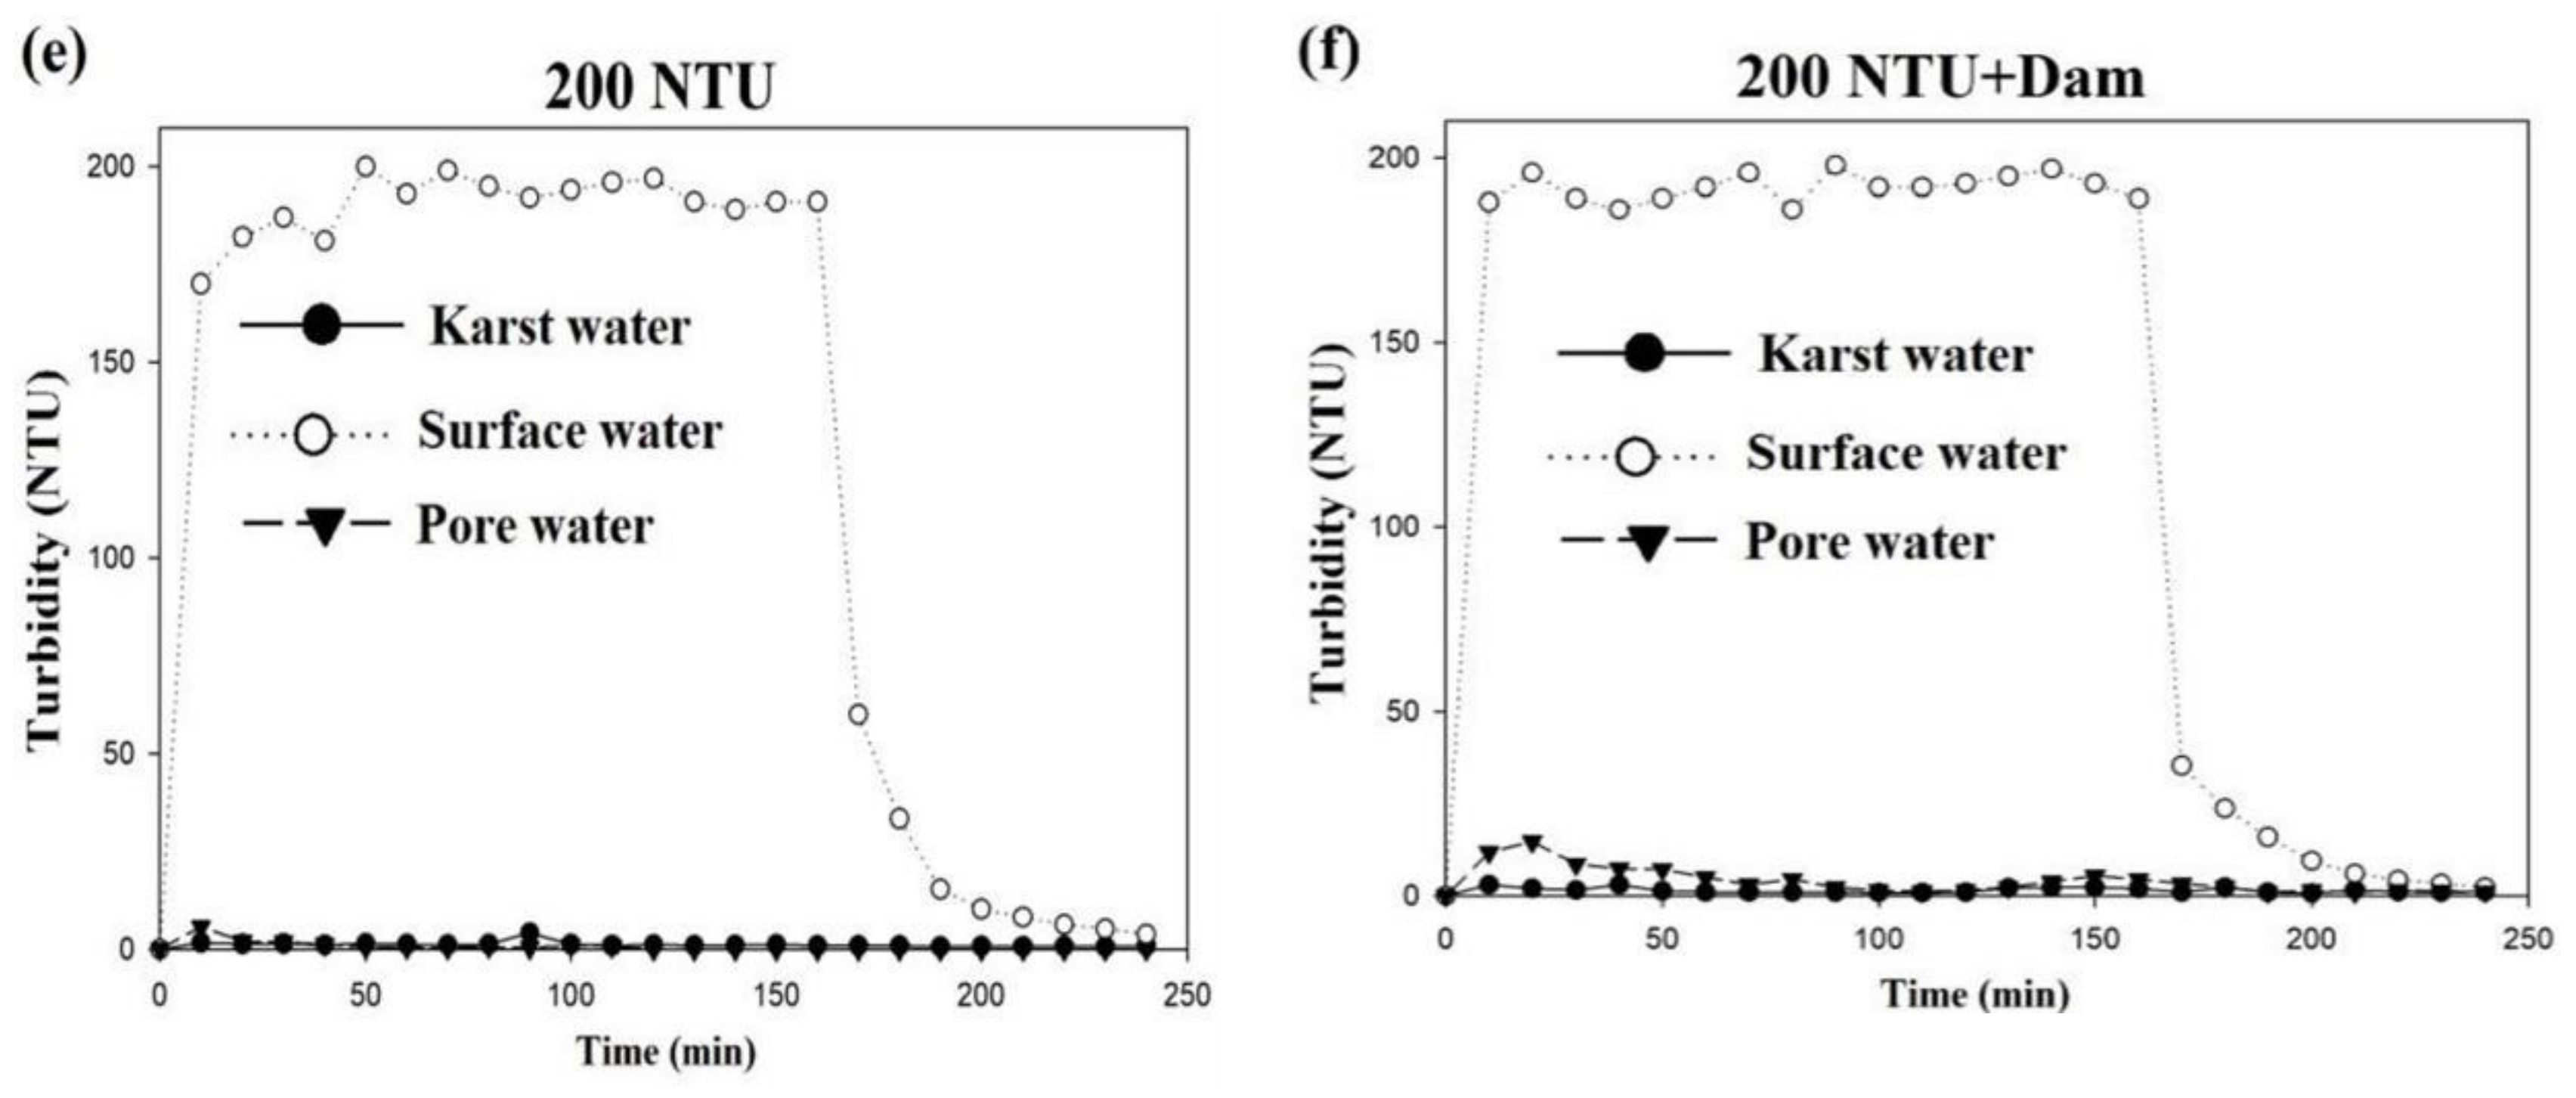
3.3.1. Changes in Turbidity
3.3.2. Influence of the Rubber Dam
3.3.3. Migration of Suspended Particles
4. Discussion
5. Conclusions
Author Contributions
Funding
Institutional Review Board Statement
Informed Consent Statement
Data Availability Statement
Conflicts of Interest
References
- Li, W.; Sun, Q.; Wang, W.; Qu, S.; Zhang, Z.; Xu, Q. Effective water quantity of multi-source water recharging aquifers in Yufuhe River based on groundwater and surface water semi-coupled modeling. Water Supply 2019, 19, 2280–2287. [Google Scholar] [CrossRef]
- Dillon, P. Future management of aquifer recharge. Hydrogeol. J. 2005, l3, 313–316. [Google Scholar] [CrossRef]
- Tielemans, M.W.M. Artificial recharge of groundwater in The Netherlands. Water Pract. Technol. 2007, 2. [Google Scholar] [CrossRef]
- Ross, A. Speeding the transition towards conjunctive water management in Australia. J. Hydrol. 2018, 567, e1–e10. [Google Scholar] [CrossRef]
- Wang, Y.; Huo, M.; Li, Q.; Fan, W.; Yang, J.; Cui, X. Comparison of clogging induced by organic and inorganic suspended particles in a porous medium: Implications for choosing physical clogging indicators. J. Soil Sediment 2018, 18, 2980–2994. [Google Scholar] [CrossRef]
- Wang, Z.; Du, X.; Yang, Y.; Ye, X. Surface clogging process modeling of suspended solids during urban stormwater aquifer recharge. J. Environ. Sci. 2012, 24, 1418–1424. [Google Scholar] [CrossRef]
- Zheng, Q.; Wang, W.; Liu, S.; Qu, S. Physical clogging experiment of sand gravel infiltration with Yellow River water in the Yufuhe River channel of Jinan, China. Front. Earth Sci. 2020, 14, 306–314. [Google Scholar] [CrossRef]
- Xie, Y.; Wang, Y.; Huo, M.; Geng, Z.; Fan, W. Risk of physical clogging induced by low-density suspended particles during managed aquifer recharge with reclaimed water: Evidences from laboratory experiments and numerical modeling. Environ. Res. 2020, 186, 109527. [Google Scholar] [CrossRef] [PubMed]
- Ahfir, N.D.; Wang, H.; Benamar, A.; Alem, A.; Massei, N.; Dupont, J.-P. Transport and deposition of suspended particles in saturated porous media: Hydrodynamic effect. Hydrogeol. J. 2007, 15, 659–668. [Google Scholar] [CrossRef]
- Siriwardene, N.R.; Deletic, A.; Fletcher, T.D. Clogging of stormwater gravel infiltration systems and filters: Insights from a laboratory study. Water Res. 2007, 41, 1433–1440. [Google Scholar] [CrossRef] [PubMed]
- Soni, J.P.; Islam, N.; Basak, P. Experimental evaluation of non-Darcian flow in porous media. J. Hydrol. 1978, 38, 231–241. [Google Scholar] [CrossRef]
- Huang, X.; Tang, P.; Miao, X.; Chen, Z.Q. Testing study on seepage properties of broken sandstone. Rock Soil Mech. 2005, 26, 1385–1388. [Google Scholar] [CrossRef]
- Liu, L.; Shu, L.; Chen, X.; Oromo, T. The Hydrologic Function and Behavior of the Houzhai Underground River Basin, Guizhou Province, Southwester China. Hydrogeol. J. 2010, 18, 509–518. [Google Scholar] [CrossRef]
- Cartwright, I.; Irivine, D. The spatial extent and timescales of bank infiltration and return flows in an upland river system: Implications for water quality and volumes. Sci. Total Environ. 2020, 743, 140748. [Google Scholar] [CrossRef] [PubMed]
- Bertelkamp, C.; Van Der Hoek, J.; Schoutteten, K.; Hulpiau, L.; Vanhaecke, L.; Bussche, J.V.; Cabo, A.; Callewaert, C.; Boon, N.; Löwenberg, J.; et al. The effect of feed water dissolved organic carbon concentration and composition on organic micropollutant removal and microbial diversity in soil columns simulating river bank filtration. Chemosphere 2016, 144, 932–939. [Google Scholar] [CrossRef] [PubMed]


| Clay (%) | Porosity (%) | Sand and Gravel (m/d) | Coarse Sand (m/d) | d10 (mm) | d50 (mm) | d60 (mm) | d60/d10 |
|---|---|---|---|---|---|---|---|
| 13 | 23.9 | 90 | 18 | 0.2 | 8 | 12 | 60 |
| Lithology | Thickness (cm) | Parameter | |||||
|---|---|---|---|---|---|---|---|
| θr | θs | α | n | Ks (cm/s) | l | ||
| Sand–gravel layer | 30 | 0.045 | 0.43 | 0.145 | 2.68 | 0.104 | 0.5 |
| Cambrian Zhangxia formation limestone | 20 | 0.057 | 0.41 | 0.124 | 2.28 | 0.021 | 0.5 |
| Serial Number | Rubber Dam | Released Water (L/min) | Karst Water (L/min) | Surface Water (L/min) | Pore Water (L/min) |
|---|---|---|---|---|---|
| ① | No | 2.5 | 1.67 | 0.36 | 0.47 |
| ② | 3 | 1.68 | 0.96 | 0.36 | |
| ③ | 3.5 | 1.7 | 1.26 | 0.54 | |
| ④ | Yes | 2.5 | 1.72 | 0.3 | 0.48 |
| ⑤ | 3 | 1.78 | 0.62 | 0.6 | |
| ⑥ | 3.5 | 1.75 | 1.22 | 0.53 |
| Serial Number | Rubber Dam | Turbidity (NTU) | Karst Water (L/min) | Surface Water (L/min) | Pore Water (L/min) |
|---|---|---|---|---|---|
| ① | No | 100 | 1.06 | 1.81 | 0.13 |
| ② | 150 | 0.56 | 2.44 | 0 | |
| ③ | 200 | 0.56 | 2.44 | 0 | |
| ④ | Yes | 100 | 1.26 | 1.61 | 0.13 |
| ⑤ | 150 | 1.2 | 1.72 | 0.08 | |
| ⑥ | 200 | 1.14 | 1.79 | 0.07 |
| Serial Number | Rubber Dam | Turbidity (NTU) | Total (g) | Karst Water (g) | Surface Water (g) | Pore Water (g) | Retained (g) |
|---|---|---|---|---|---|---|---|
| ① | N | 100 | 39.8 | 0.8 | 16.3 | 0.2 | 22.5 |
| ② | 150 | 56.4 | 0.3 | 30.4 | 0.1 | 25.6 | |
| ③ | 200 | 75.2 | 0.2 | 41.4 | 0.03 | 33.57 | |
| ④ | Y | 100 | 39.8 | 0.7 | 13 | 0.2 | 25.9 |
| ⑤ | 150 | 56.4 | 0.4 | 24.2 | 0.2 | 31.6 | |
| ⑥ | 200 | 75.2 | 0.4 | 32.5 | 0.2 | 42.1 |
Publisher’s Note: MDPI stays neutral with regard to jurisdictional claims in published maps and institutional affiliations. |
© 2021 by the authors. Licensee MDPI, Basel, Switzerland. This article is an open access article distributed under the terms and conditions of the Creative Commons Attribution (CC BY) license (https://creativecommons.org/licenses/by/4.0/).
Share and Cite
Zhao, W.; Wang, W.; Liu, S.; Qu, S.; Sun, X.; Meng, Y. Water Distribution and Silt Clogging in the Strong-Seepage Zone Infiltration Process of Yufuhe River from Yellow River Water Based on the Two-Dimensional Sand Tank Model. Water 2021, 13, 1200. https://doi.org/10.3390/w13091200
Zhao W, Wang W, Liu S, Qu S, Sun X, Meng Y. Water Distribution and Silt Clogging in the Strong-Seepage Zone Infiltration Process of Yufuhe River from Yellow River Water Based on the Two-Dimensional Sand Tank Model. Water. 2021; 13(9):1200. https://doi.org/10.3390/w13091200
Chicago/Turabian StyleZhao, Weidong, Weiping Wang, Shuai Liu, Shisong Qu, Xiuxiu Sun, and Yujie Meng. 2021. "Water Distribution and Silt Clogging in the Strong-Seepage Zone Infiltration Process of Yufuhe River from Yellow River Water Based on the Two-Dimensional Sand Tank Model" Water 13, no. 9: 1200. https://doi.org/10.3390/w13091200