Article

How Do Ground Litter and Canopy Regulate Surface Runoff?—A Paired-Plot Investigation after 80 Years of Broadleaf Forest Regeneration

1
Faculty of Science and Natural Resources, Universiti Malaysia Sabah, Jalan UMS, Kota Kinabalu 88400, Sabah, Malaysia
2
Ecohydrology Research Institute, Graduate School of Agricultural and Life Sciences, The University of Tokyo, 11-44, Goizuka, Seto 489-0031, Japan
3
Graduate School of Agricultural and Life Sciences, The University of Tokyo Forest, 9-61 Yamabe Higashimachi, Furano 079-1563, Japan
4
Executive Office, Graduate School of Agricultural and Life Sciences, The University of Tokyo Forests, 1-1-1 Yayoi, Bunkyo-ku, Tokyo 113-8657, Japan
*
Authors to whom correspondence should be addressed.
Water 2021, 13(9), 1205; https://doi.org/10.3390/w13091205
Submission received: 19 March 2021 / Revised: 19 April 2021 / Accepted: 23 April 2021 / Published: 27 April 2021

Abstract

:
Relatively minimal attention has been given to the hydrology of natural broadleaf forests compared to conifer plantations in Japan. We investigated the impacts of ground litter removal and forest clearing on surface runoff using the paired runoff plot approach. Plot A (7.4 m2) was maintained as a control while plot B (8.1 m2) was manipulated. Surface runoff was measured by a tipping-bucket recorder, and rainfall by a tipping-bucket rain gauge. From May 2016 to July 2019, 20, 54, and 42 runoff events were recorded in the no-treatment (NT), litter removed before clearcutting (LRBC), and after clearcutting (AC) phases, respectively. Surface runoff increased 4× when moving from the NT to LRBC phase, and 4.4× when moving from the LRBC to AC phase. Antecedent precipitation index (API11) had a significant influence on surface runoff in the LRBC phase but not in the NT and AC phases. Surface runoff in the AC phase was high regardless of API11. The rainfall required for initiating surface runoff is 38% and 56% less when moving from the NT to LRBC, and LRBC to AC phases, respectively. Ground litter and canopy function to reduce surface runoff in regenerated broadleaf forests.

1. Introduction

As of 2017, approximately 25 million ha (67%) of land area in Japan is forested. Plantation forests make up approximately 40% of the forested area while the remaining 60% is natural forests [1,2]. From 1966 to 2017, plantation forests have increased by 29% to 10.2 million ha while natural forests shrunk by 13% to 13.5 million ha [1]. While forested areas remain high (twice the world’s average of 29%), the proportion of forest type (broadleaf, conifer, mixed, natural, and plantation forests) fluctuates according to market forces, situational demands, and governmental policies [1,3]. Conifer plantation forests are expected to expand, but instead, some conifer forests are being reverted to broadleaf forests [4]. At the same time, some broadleaf and mixed-forests are also being cleared to make way for development [5].
Since hydrology is highly influenced by forests, there is a need to understand how these forests (and their modification) affect runoff processes and water resources. In the past, there have been extensive studies carried out on hydrological processes in cypress plantations, including those investigating the hydrological impacts of forest conversion [6], forest litter [7,8], tree physiology [9,10], and various management practices [11,12]. The focus on cypress plantation was a result of its rapid expansion between 1970 and 2000 that was driven by the government’s economic policy. Up to date, temperate broadleaf forests and mixed-forests especially those which had undergone restoration have received relatively little attention, although there are some exemplary studies [13,14]. More specifically, the hydrological role of ground litter and the canopy are not yet well-understood. Such knowledge is needed because more and more forests in suburban areas are being cleared for development. The resulting hydrological changes need to be quantified to better formulate preventive and corrective measures. At the same time, due to the lack of economic incentives, vast forest areas in the interior remain unharvested and untended, causing ground litter to thicken [13,15]. Therefore, knowledge on how ground litter affect runoff is equally important. These two knowledge gaps, (i) hydrological role of ground litter and (ii) hydrological role of canopy in temperate broadleaf forests make up the motivation for the present study.
A number of studies that focuses on the hydrological role of ground litter have been conducted in the past: Li et al. [16] investigated the relationship between ground litter and surface runoff in northern China. Prosdocimi et al. [17] performed a similar experiment in Mediterranean vineyards. Zhou et al. [18] carried out a microplot-scale observation of surface runoff generation in differing ground litter and topsoil depths in Guizhou province, China, and have highlighted challenges in upscaling these findings to the catchment scale. In Japan, Miyata et al. [19] studied surface runoff generation and soil erosion in mature Japanese cypress plantations under varying ground litter coverage conditions. To date, there is little investigation on the role of ground litter on surface runoff dynamics in naturally regenerated broadleaf forest in Japan. One existing example is a study by Gomyo and Kuraji [13], in which they demonstrated the effects of litter removal at the catchment scale. The study found that 3-year runoff increased by 2.7% (80.3 mm) post treatment. In addition, peak runoff was up to 1.5 times greater. This suggests that the effects of litter interception was greater than that of runoff-on-litter [20], and that the increased ground evaporation from litter removal did not offset the increased effective rainfall [11]. Such catchment study is rare due to the required time and labour.
In Japan, studies focussing on the hydrological role of the canopy or on the impacts of clearcutting broadleaf forests are scarcer because most efforts had been focussed on cypress plantation forests. Most studies that were conducted in Japan are related to the effects of thinning of conifer plantations, whereby thinning reduces canopy interception and may increase the likelihood of floods [21]. At the time of writing, the authors found only one study in Tochigi prefecture, eastern Japan, that reported canopy interception in a regenerated multi-layered broadleaf forest to be 21% [14]. The impacts on surface runoff from clearcutting broadleaf forests and mixed-forest remain unexplored.
Results from catchment-scale studies may better represent that of real-world conditions. However, due to the presence of various environmental factors, sources, and sinks, it is difficult to understand the individual underlying mechanisms. In particular, does the presence of litter buffer (due to interception) or enhance (due to runoff-on-litter) surface runoff? With regards clearcutting, will surface runoff increase (from increased throughfall) or decrease (from decreased stemflow)? These uncertainties have been highlighted by past studies [13,20] and can be better elucidated via a plot-scale experiment. Furthermore, Liu et al. [22], in an extensive review, emphasised that it is necessary to isolate the different ways in which vertical vegetation component control runoff. Understanding the role of each of these vertical vegetation structures and their inter-dependency will be useful in determining the efficient architectures and morphologies of vegetation for ecological restoration. Liu et al. [22] also emphasized that more effort should be made in quantifying the roles of these vertical structures of vegetation to be used in improving models.
This study took place in western Aichi prefecture—a region that was historically subjected to heavy forest exploitation up to 1910s. As a result, high sediment yields and landslides were a common phenomenon [23]. Since then, over a century of forest restoration was carried out, resulting in the secondary mixed-forest cover (predominantly broadleaf) today [24,25]. However, due to their proximity to urban areas, more and more of such areas are being cleared to make way for development (i.e., residential, commercial, and industrial buildings) in recent years [4,5]. For this reason, it is also important to understand the impacts of clearcutting secondary broadleaf forests on surface runoff. In this study, we extend previous works [13,26,27] by observing at the plot scale, changes in surface runoff after litter removal and clearcutting. We hypothesise that surface runoff will increase with litter removal and clearcutting in a regenerated temperate broadleaf forest. At a larger scale, this may have implication on floods during storm events.

2. Materials and Methods
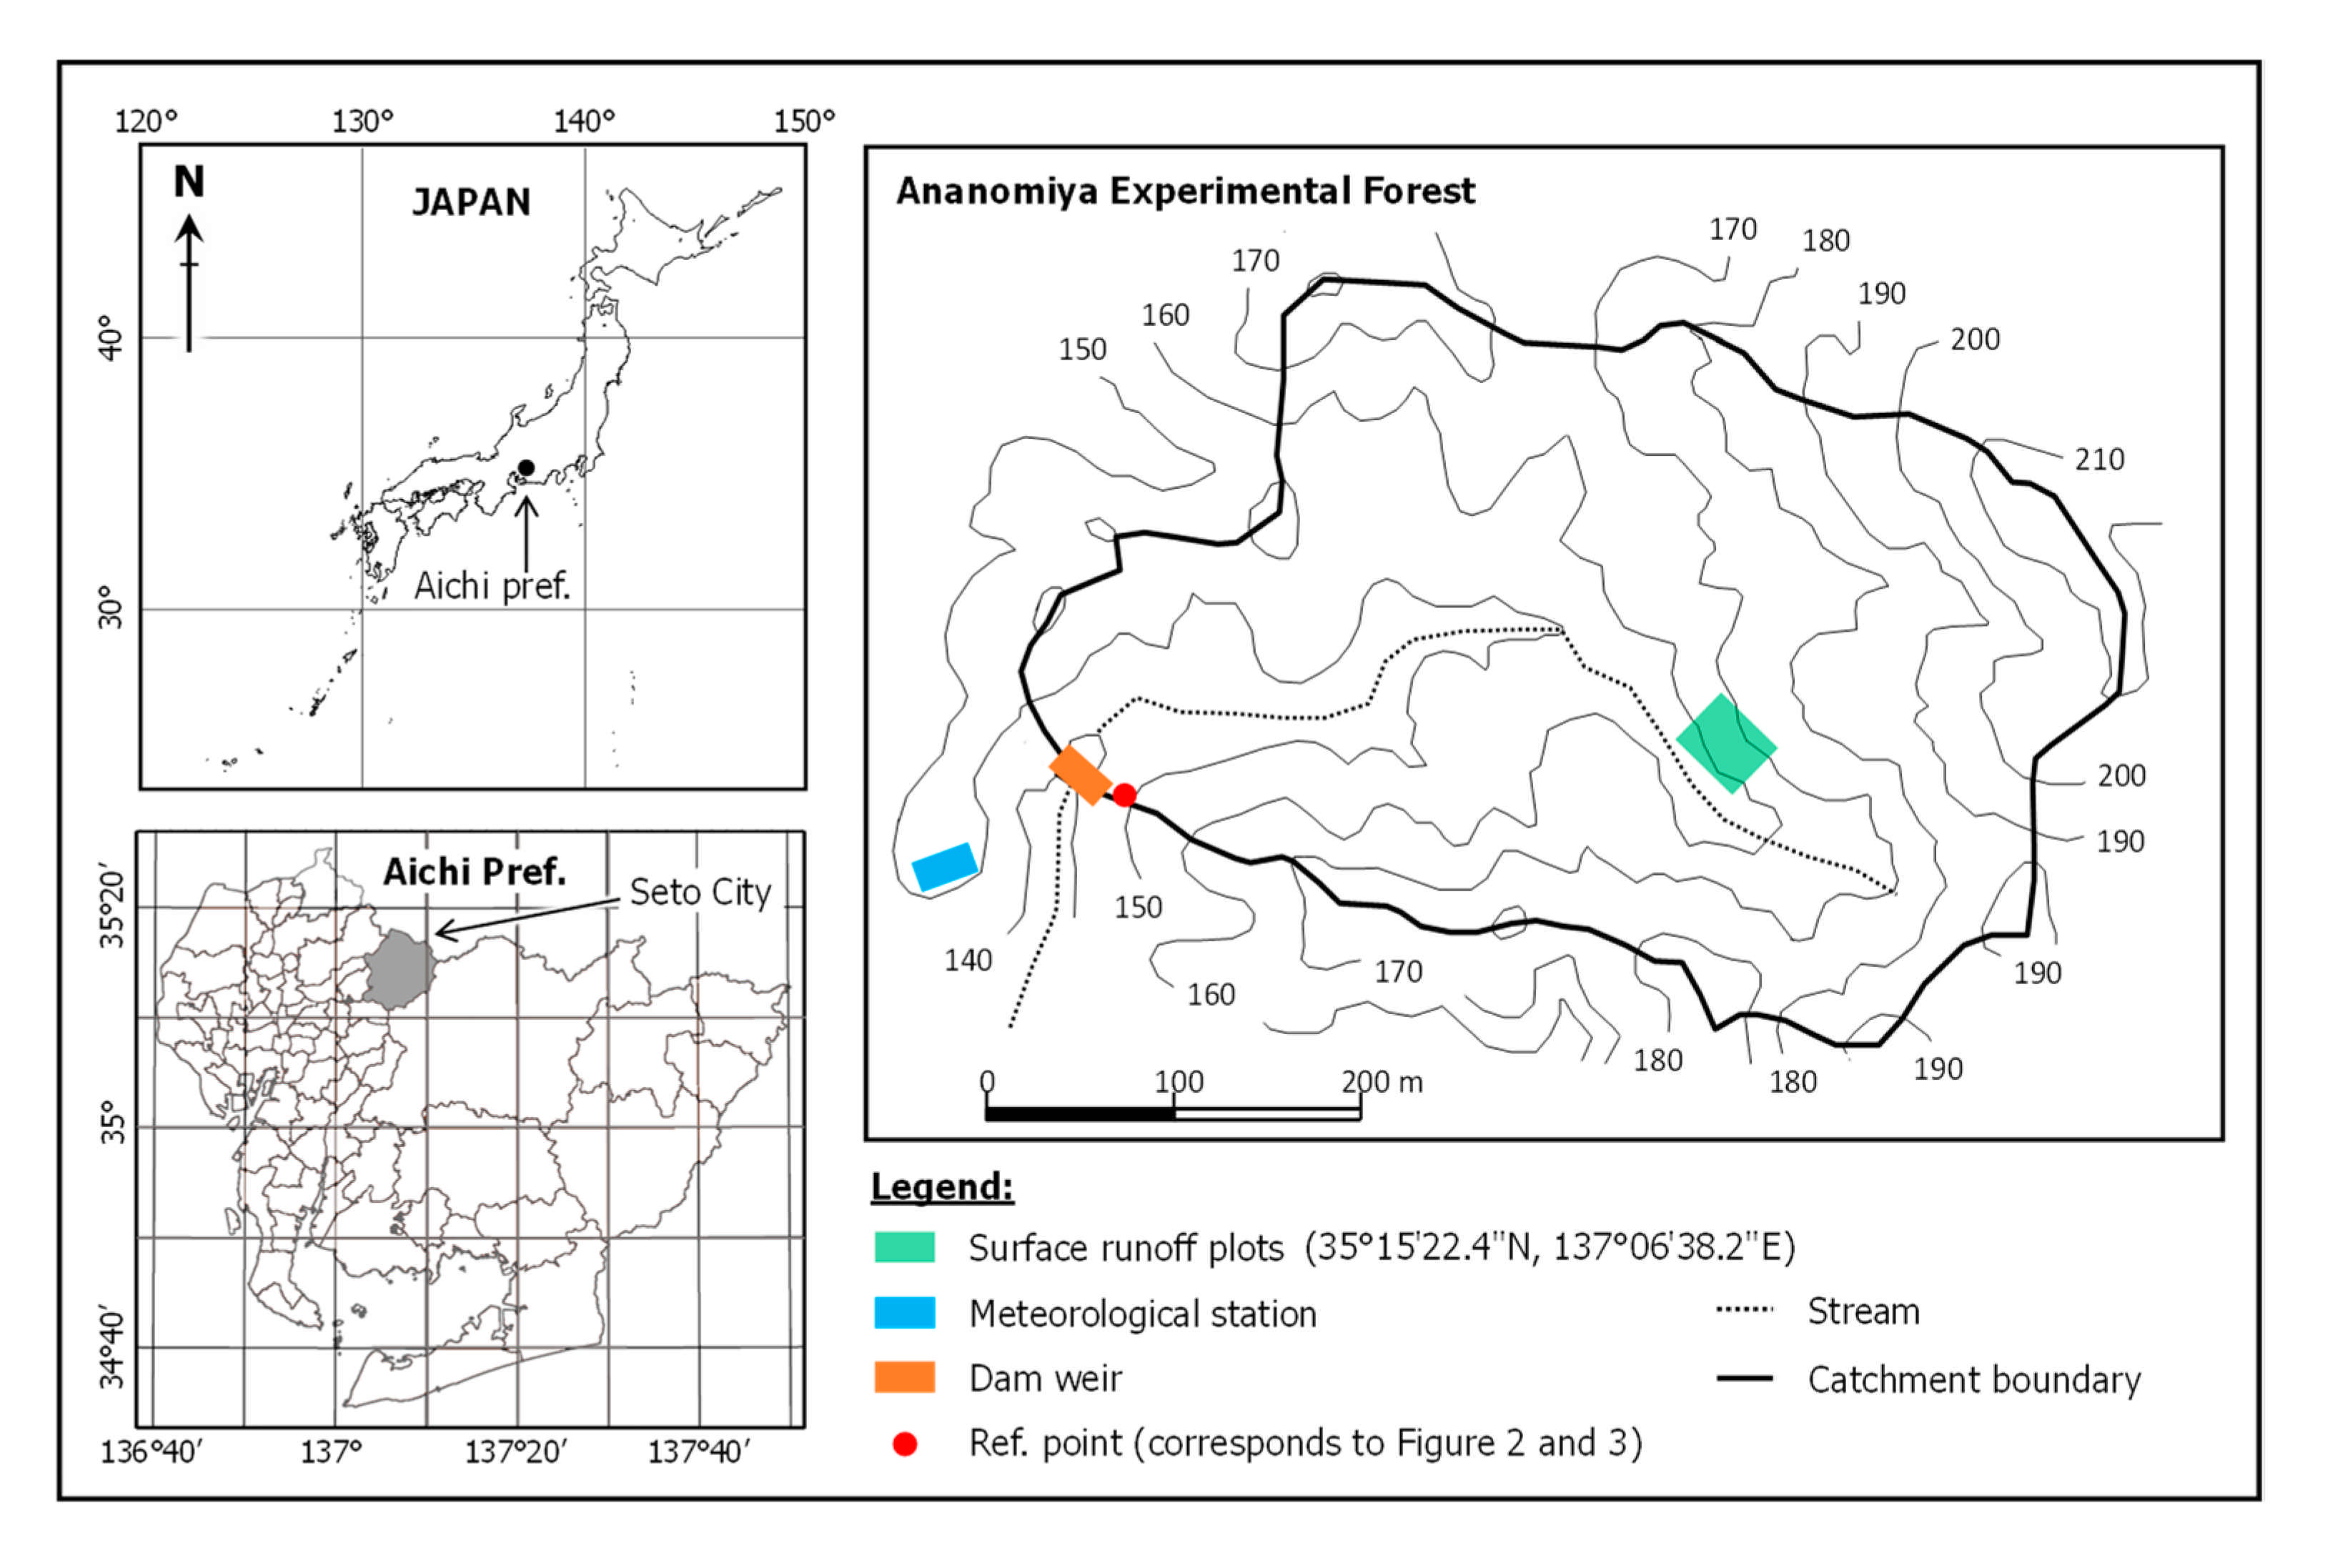
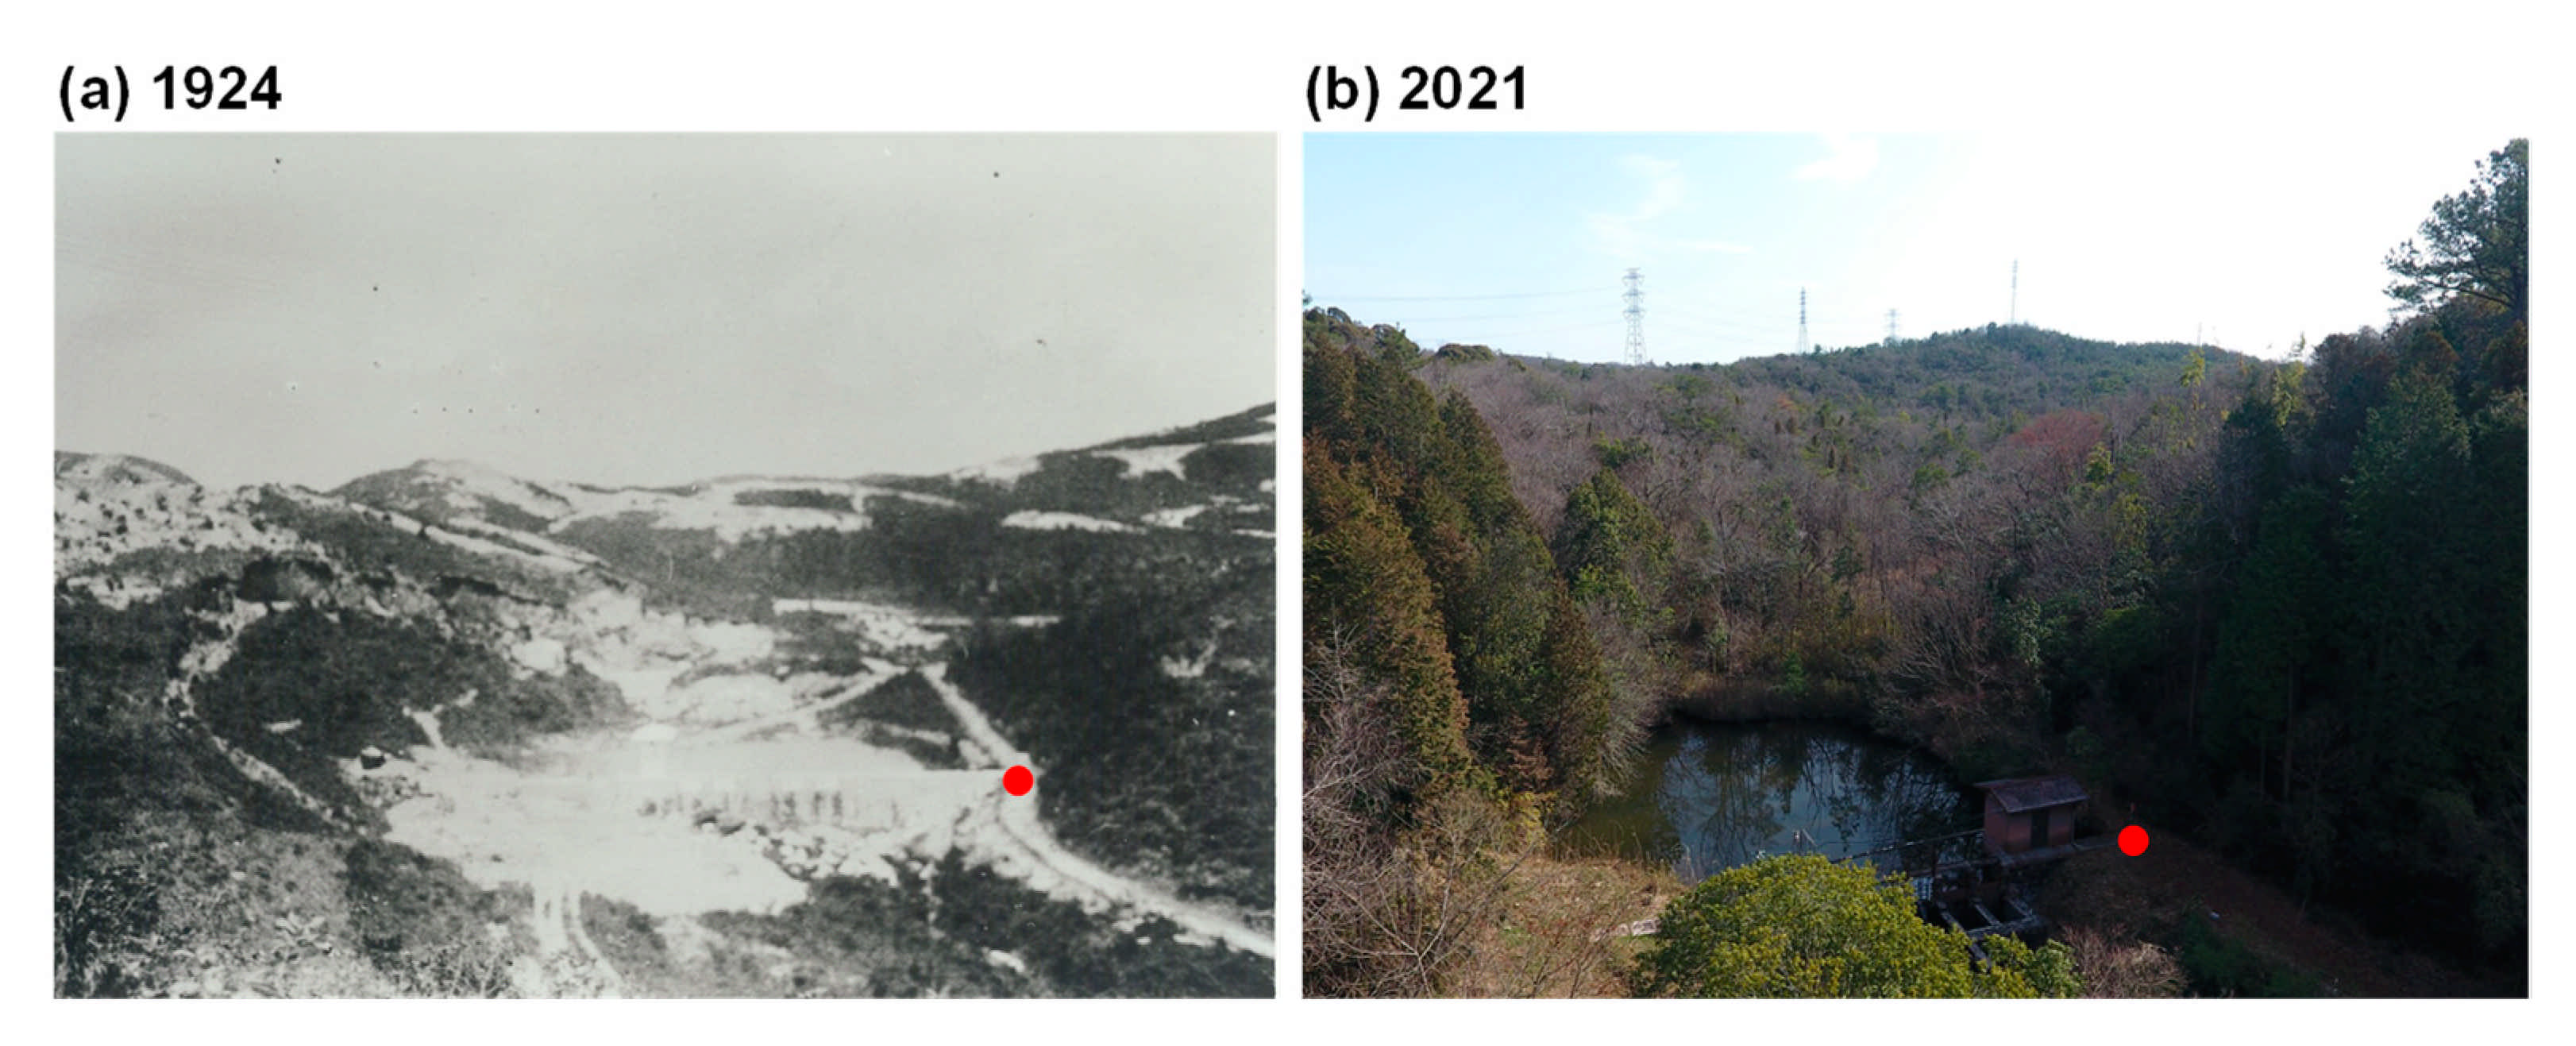
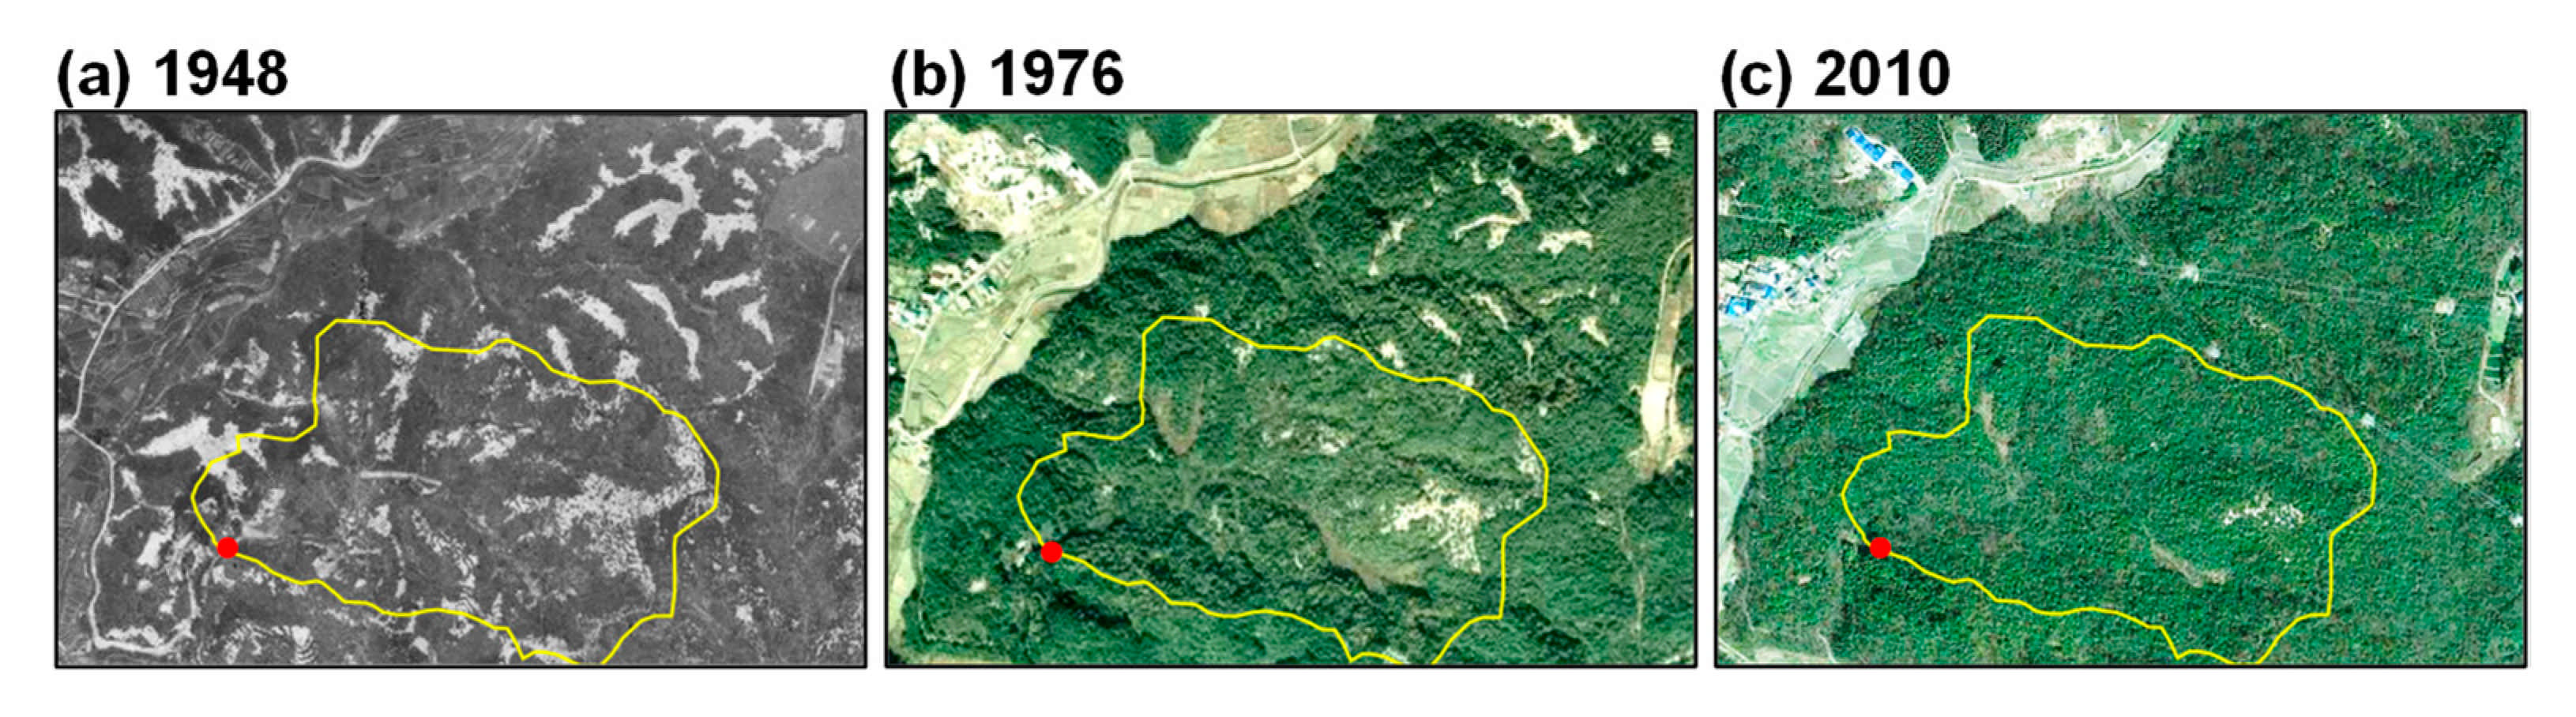
2.1. Study Area

Experimental plots were set up in the 13.9-ha Ananomiya Experimental Forest of the Ecohydrology Research Institute, the University of Tokyo Forests, in Seto city, Aichi prefecture (Figure 1). The general area, traditionally known as the Eastern Owari Hills, is known for a long history of ceramic and pottery production. As a result of intensive timber harvesting to be used as kiln fuel, the area was characterised by denuded hills with bare, exposed subsoil in the past (Figure 2 and Figure 3) [24,25]. Another round of intensive timber exploitation took place during the Meiji era (1868–1912), when industrialisation in Japan was at its peak [25]. High sediment yields and landslides had been a common phenomenon. With auspices from the government, the Ananomiya Experimental Forest (AEF) area was established in 1922 by the Tokyo Imperial University (University of Tokyo, today for the purpose of restoring forests and preventing erosion-related hillslope disasters. Construction of a weir dam was completed in 1924, and hydrological and meteorological observations commenced in 1925 [24]. Although this site was severely denuded in the past, forest cover has now recovered due to restoration-planting efforts (known as “sabo planting”), where Japanese red pine (Pinus densiflora) and Japanese black pine (Pinus thunbergii) were planted as the pioneer species [24,25]. Figure 2 shows photographs of one of the hillslopes in the experimental forest in its denuded state in 1924 and recovered state in 2021. Aerial photographs (Figure 3) show the gradual recovery of forest through the years 1948, 1976, and 2010.
The area has a warm temperate climate characterised by hot summers, moderate winters, and high annual rainfall that occurs mainly in two distinct wet periods—the Baiu season (May–June) with frequent and prolonged rain events; and the typhoon season (September–October) with high-intensity rainfall [27]. Annual rainfall is 1594 mm year−1 (averaged 1 May 2016–30 April 2019). The annual mean temperature is 12–15 °C, but the extremes may reach −12 °C (dawn, in winter) and 39 °C (midday, in summer). Daily averages of relative humidity range between 55 and 99.7% (data from on-site meteorological station). The dominant geology is a deep cretaceous layer overlain by weathered granite. Through soil core sampling around the plots followed by the jar test, percentage sand (15.03–20.61%), silt (26.22–39.05%), and clay (43.21–53.18%), show that the soil texture is of the clay type [29]. Bulk density range is 808.3–1069.2 kg m−3 (mean = 928.7 kg m−3).
At present, the area has a temperate mixed-forest composition with dominant canopy species comprising Quercus serrata and Ilex pedunculosa. The sub-canopy layer is dominated by Eurya japonica, Lyonia ovalifolia and Gamblea innovans; while the ground cover, by Sasa nipponica and Dicranopteris dichotoma. Although this is a secondary mixed-forest, the number of pioneer conifer trees (black pine and red pine) is small owing to species succession. Trees in and around the experimental plots are broadleaved; therefore, effectively making this study a comparison in a broadleaf forest. Stand density is 1925 stems/ha, which comprises canopy trees (>9 m in height; 725 stems/ha) and sub-canopy trees (3–9 m in height; 1200 stems/ha).

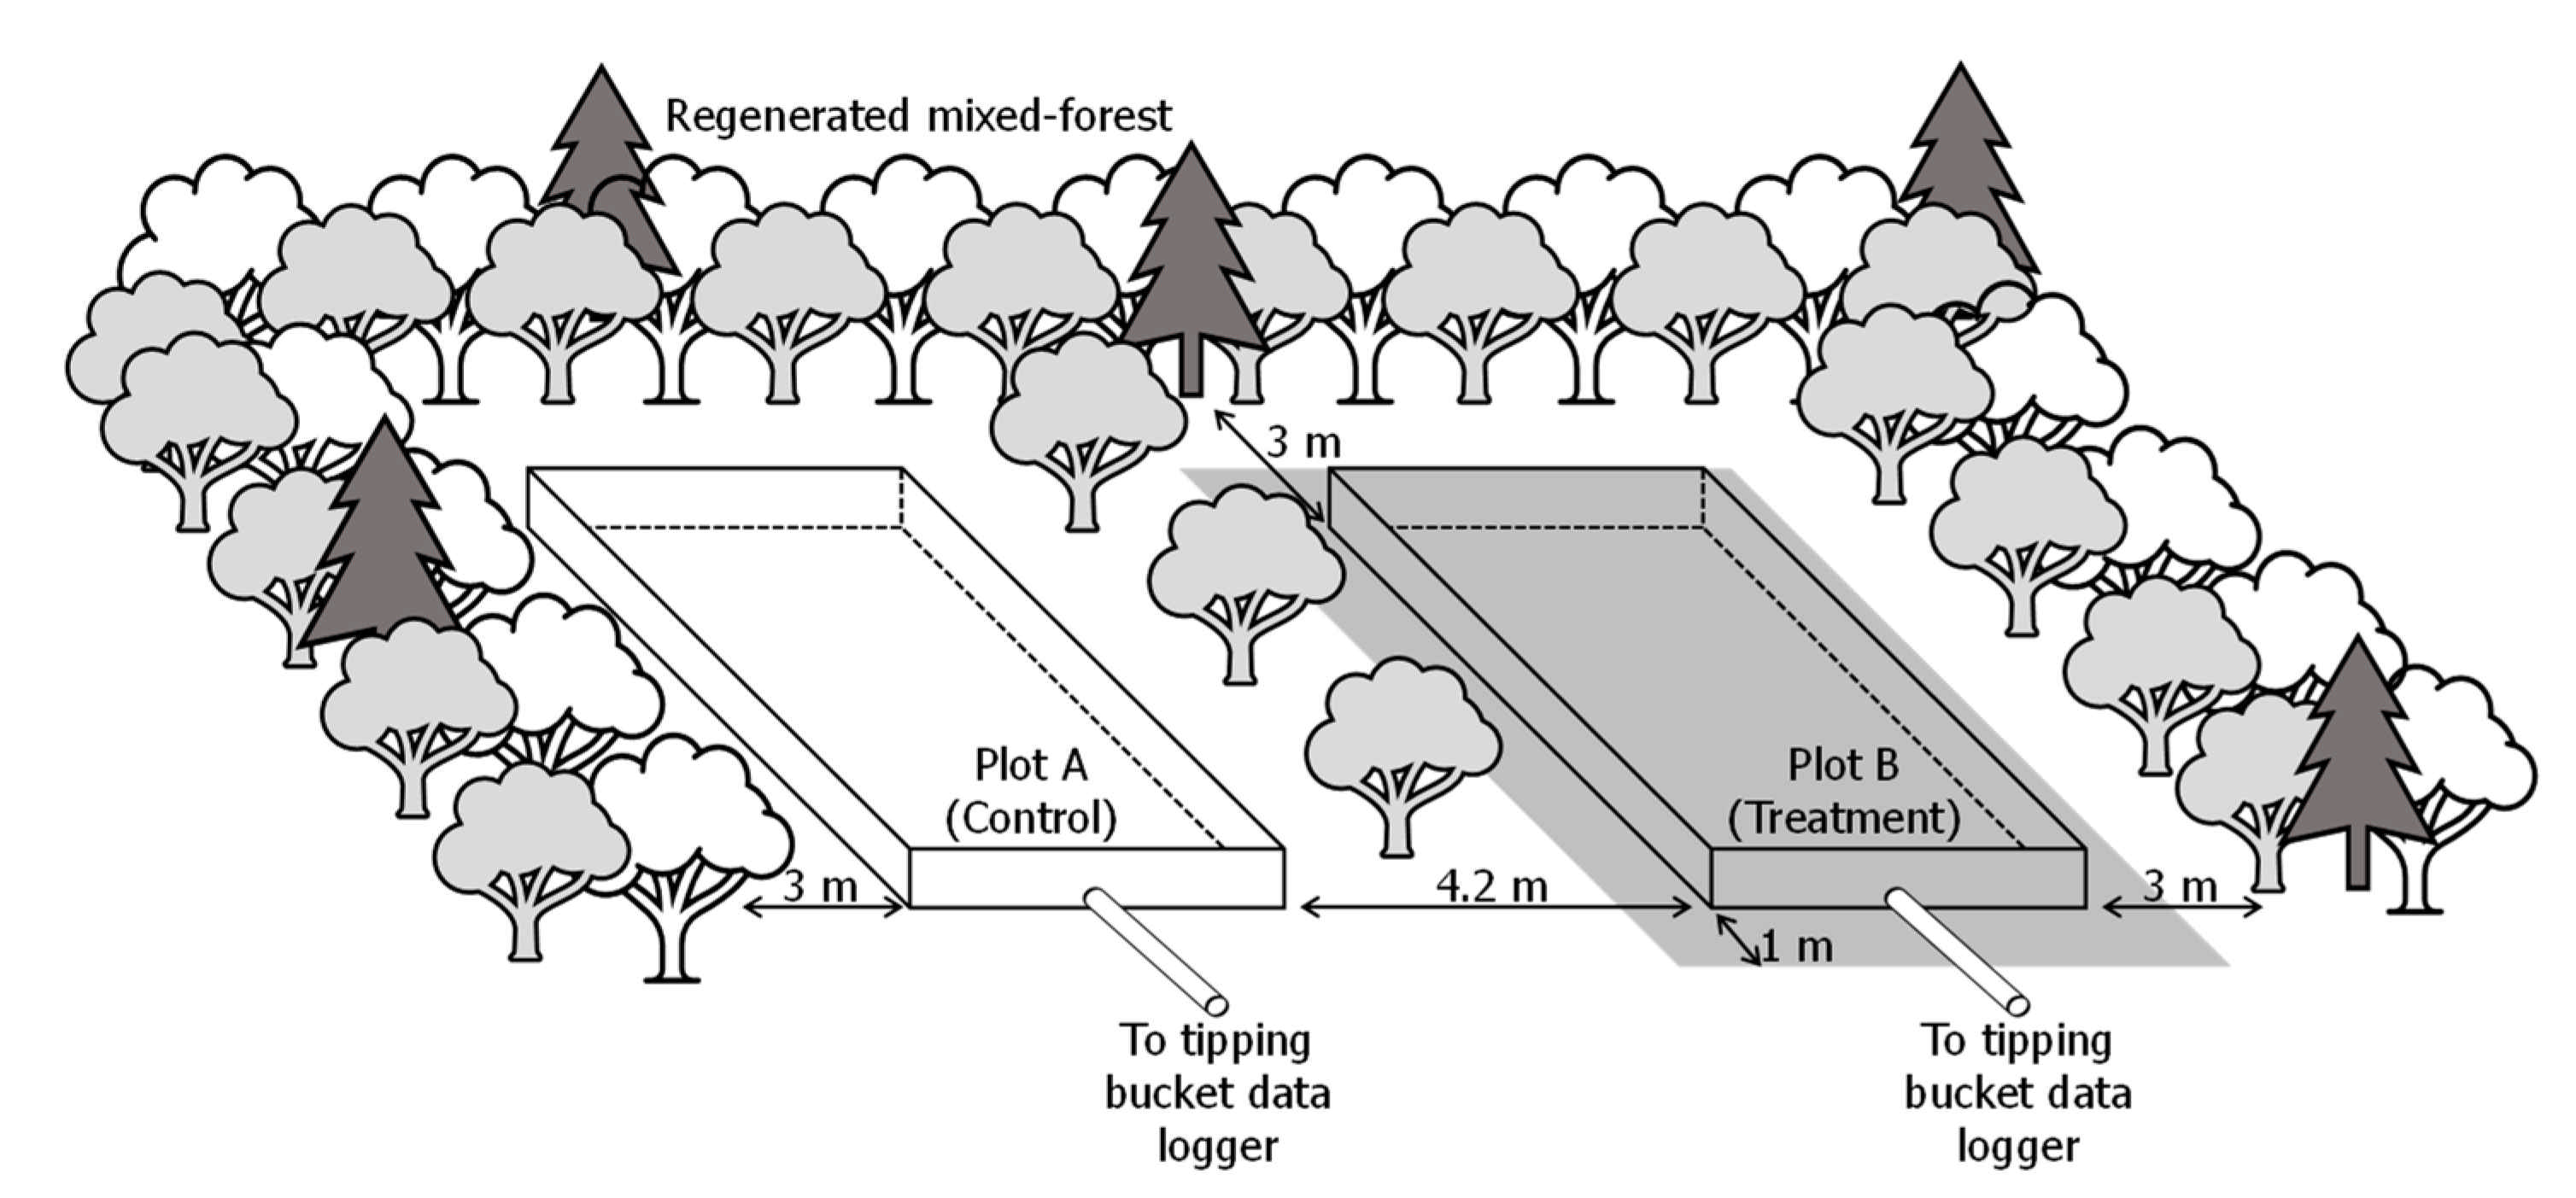
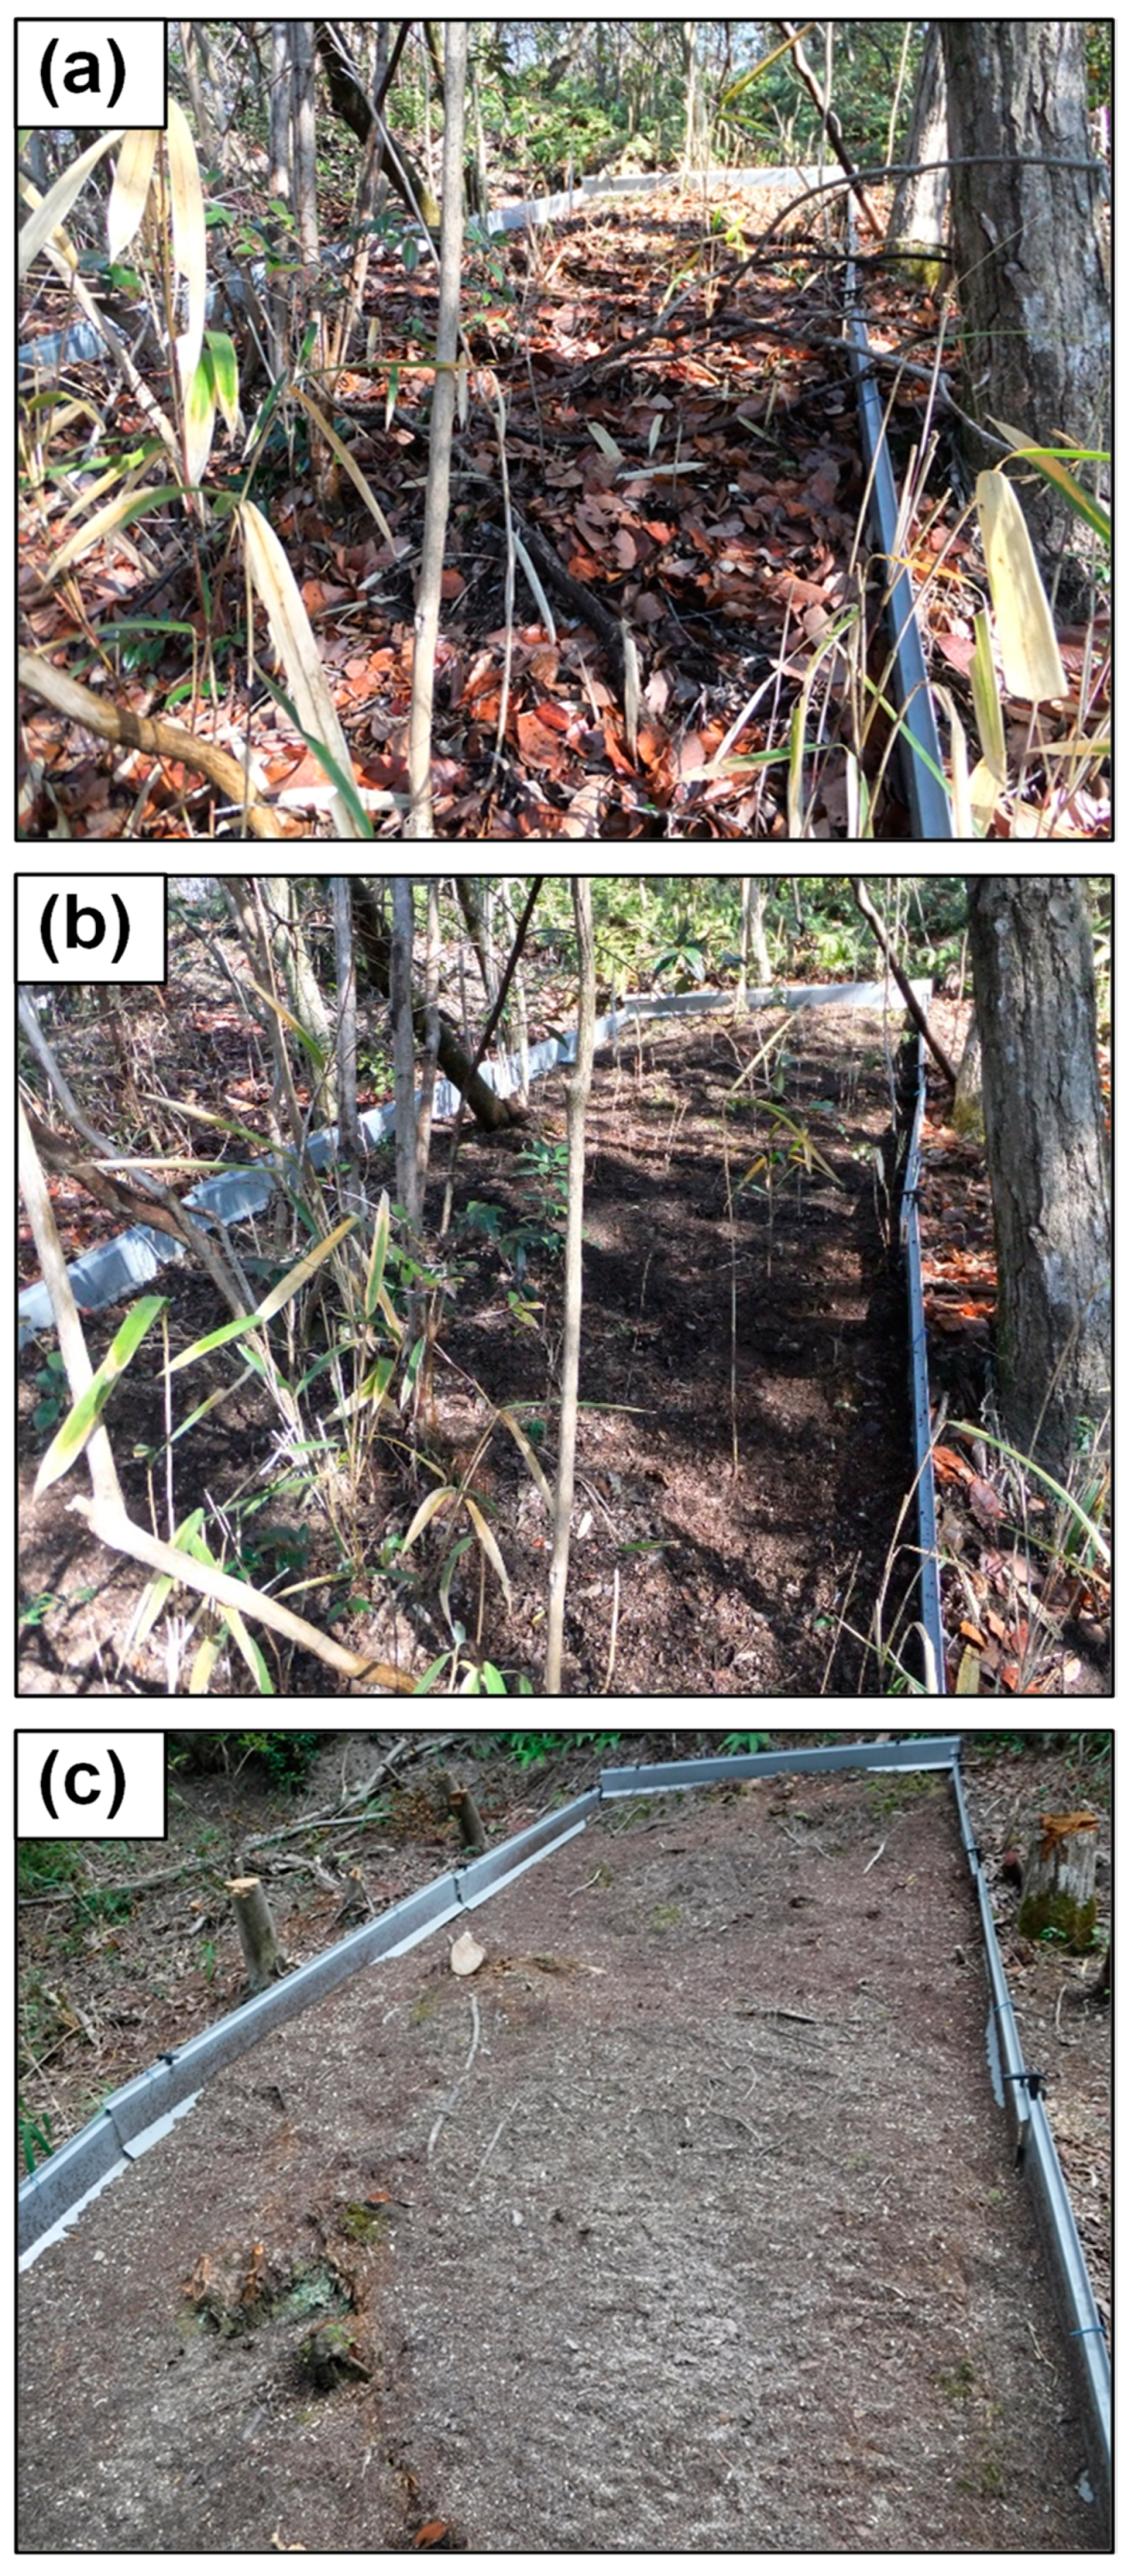
2.2. Treatment and Data Collection

Two sloping experimental plots, A (7.4 m2) and B (8.1 m2), were established with a 4.2-m buffer in-between (Figure 4). Boundaries of each plot were created by inserting hard plastic (roofing) sheets into the ground. The boundary was made contiguous to prevent leakage of surface runoff. The mean slope for plots A and B were 35° and 28°, respectively. At the bottom boundary of each plot, a gutter was installed to collect overland flow which was then channelled via a PVC pipe to an ‘Uizin UIZ-TB200’ tipping-bucket gauge. Throughout the study period, no treatment was applied to plot A (control plot) whereas litter removal followed by clearcutting were carried out in plot B.
To ensure minimal disturbance to the soil surface, litter removal was carried out from outside the plot boundary and precautionary measures were taken to not step into the plot area. The dry weight of litter removed (including leaf, twigs, fruits, and seeds) was 9.48 kg (oven dried at 60 °C for 72 h). In the clearcutting phase, a total of 13 trees (species: Deutzia crenata, Eurya japonica, Gamblea innovans, Ilex pedunculosa, and Lyonia ovalifolia) with DBH ranging 0.8–3.5 cm as well as 10 small shrubs were removed from plot B. In plot A (control plot), six trees (species: E. japonica and L. ovalifolia) and small shrubs were left as they were. Although having fewer trees than in plot B, one of the trees (E. japonica) in plot A was multi-stemmed (nine stems), resulting in a canopy coverage that was more extensive than that of a normal tree. To minimise external environmental influence, areas adjacent to the plots were made to be as similar as possible to that inside the plots. Areas surrounding plot A (3 metres away from the top, left, and bottom boundary) were left forested. For plot B, a 1-metre buffer from the perimeter (plot boundary) was given the same treatment (litter removal and clearcutting) as inside the plot. Photographs of plot B in the NT, LRBC, and AC phases are shown in Figure 5.
At a nearby weather station (approximately 470 m westwards of the runoff plots), rainfall data was recorded at 5-minute intervals by an ‘Ota Keiki OW-34-BP’ tipping-bucket rain gauge (0.5 mm/tip) connected to a ‘Campbell Scientific CR10X’ datalogger. Data collection, site observation, and maintenance were carried out in three phases: no treatment phase (NT) from May to October 2016, litter removed before clearcutting phase (LRBC) from March 2017 to June 2018, and after clearcutting phase (AC) from September 2018 to July 2019.

2.3. Data Processing and Analysis

The main mode of analysis is comparing storm surface runoff between the NT, LRBC, and AC phases. For this, we considered storm events to be separate if there were at least 6 hours of rain-free period in between events—a common rule used in the region. In all analyses, runoff in plot B was normalised by runoff in plot A. Erroneous data and periods of equipment malfunction were excluded from analysis. In total, 116 runoff events were available for analysis—20 in the NT, 54 in the LRBC, and 42 in the AC phases, respectively.
We explored the data in four different aspects: (i) overall runoff amount and duration, (ii) storm event surface runoff, (iii) the effects of antecedent precipitation on surface runoff, and (iv) rainfall threshold required for the initiation of surface runoff (amount of rain from the start of a rain event to the first recorded surface runoff). For comparison between the treatment phases, the variable of interest (surface runoff, rainfall threshold) and their various influencing factors (treatment, average rainfall intensity, antecedent precipitation index) were fitted via the generalised linear model (GLM). The best-fit GLM was chosen via the Akaike Information Criterion (AIC) and Bayes Factor in the software R v.4.0.3 (required packages: glm2, devtools, flexplot). Differences between phases were assessed via the Mann–Whitney U test.

2.3.1. Storm Event Surface Runoff

Before analysis, we ascertained the relationships between surface runoff (Q) and rainfall (P) as well as between surface runoff in plot B (QB) and surface runoff in plot A (QB). Strong positive relationships were found between QB and QA, especially in the NT phase (r2 = 0.98), which signify suitability for a paired-plot study. After establishing a baseline relationship and ensuring that there were no anomalies, the latter regression was carried forward to be used in the paired-plot comparison.
Following this, mean rainfall intensity (Pi) was also tested for influence on runoff generation. However, it was not statistically significant (p > 0.05, r2 ≤ 0.1); thus, not included for further analysis.
Because the data were non-normally distributed (Shapiro–Wilk, p < 0.05) and have unequal population variance (Levene, p < 0.05), QB vs. QA was provisionally test-fitted using the ‘glm2’ command (package: glm2) in R using several ‘family’ (gaussian, poisson, gamma) and ‘link’ (identity, log, inverse) functions. Both original and log-transformed data were tried. The ‘gamma-identity’ fit on original data was found to produce the best fit in the NT, LRBC, and AC phases, and was thus used.
Differences in runoff between NT, LRBC, and AC were assessed via the Mann–Whitney U test using calculated treatment effects (Te). To calculate Te, the first step was to establish a calibration equation (using the earlier gamma-identity GLM) between plot B and plot A in the NT phase:
Q obs   B NT = a × Q obs   A NT + b
where Q obs   B NT and Q obs   A NT are event surface runoff observed in the NT phase in plot B and A, respectively; and a and b are regression coefficients. After treatment, runoff in plot B in the LRBC and AC phases were estimated using Equations (2) and (3), respectively:
Q est   B LRBC = a × Q obs   A LRBC + b
Q est   B AC = a × Q obs   A AC + b
where Q est   B LRBC and Q est   B AC are ‘estimated runoff’ in plot B in the LRBC and AC phases, respectively, and Q obs   A LRBC and Q obs   A AC are ‘observed runoff’ in plot A in the LRBC and AC phases, respectively. Treatment effects (Te) in LRBC ( T e LRBC / NT ) and AC ( T e AC / NT ) with reference to the NT phase were calculated as follows:
T e LRBC / NT = Q obs   B LRBC Q est   B LRBC
T e AC / NT = Q obs   B AC Q est   B AC
In the same way, with reference to the LRBC phase, Te in AC ( T e AC / LRBC ) was calculated by first establishing a calibration equation between plot B and plot A in the LRBC phase (Equation (6)); then, using the equation coefficients (c and d) to estimate surface runoff in AC (Equation (7)), and subtracting the estimated values from observed values (Equation (8)):
Q obs   B LRBC = c × Q obs   A LRBC + d
Q est   B AC = c × Q obs   A AC + d
T e AC / LRBC = Q obs   B AC Q est   B AC

2.3.2. Effects of Antecedent Precipitation on Surface Runoff

The first step was to assess the relationship between surface runoff and antecedent precipitation index (API), as well as to determine antecedent days with the highest influence. Several combinations of GLM family and link function were tried as with the earlier section. All equations were then inspected visually and compared based on AIC and Bayes Factor. Relationships were weak and monotonic instead of linear. API11 were found to produce the highest correlation and best fit (AIC: 450.05 via ‘gamma-log’).
After confirming that API11 has a negative relationship with Q, the GLM, QB/QA against API11, were fitted for each treatment phase (NT, LRBC, and AC):
Q B / Q A = e × API 11 + f
where e and f are equation coefficients.
In the LRBC phase, relationships were statistically significant (p < 0.01) with the ‘gamma-identity’ GLM being parsimonious (AIC: 316.82).

2.3.3. Rainfall Threshold

The rainfall threshold required for the initiation of surface runoff (PT)—defined as the total rainfall from the start of an event to the first tip of the tipping-bucket datalogger—were also compared between the different treatments. Before comparison, the influence of API11 and Pi on PT were assessed. Relationships were tested using data from individual plots and both plots collectively, in individual phases and all phases collectively, as well as every combination of phases and plots. However, no clear relationships were found. Therefore, the comparison of PT was conducted via the Mann–Whitney U Test.

3. Results

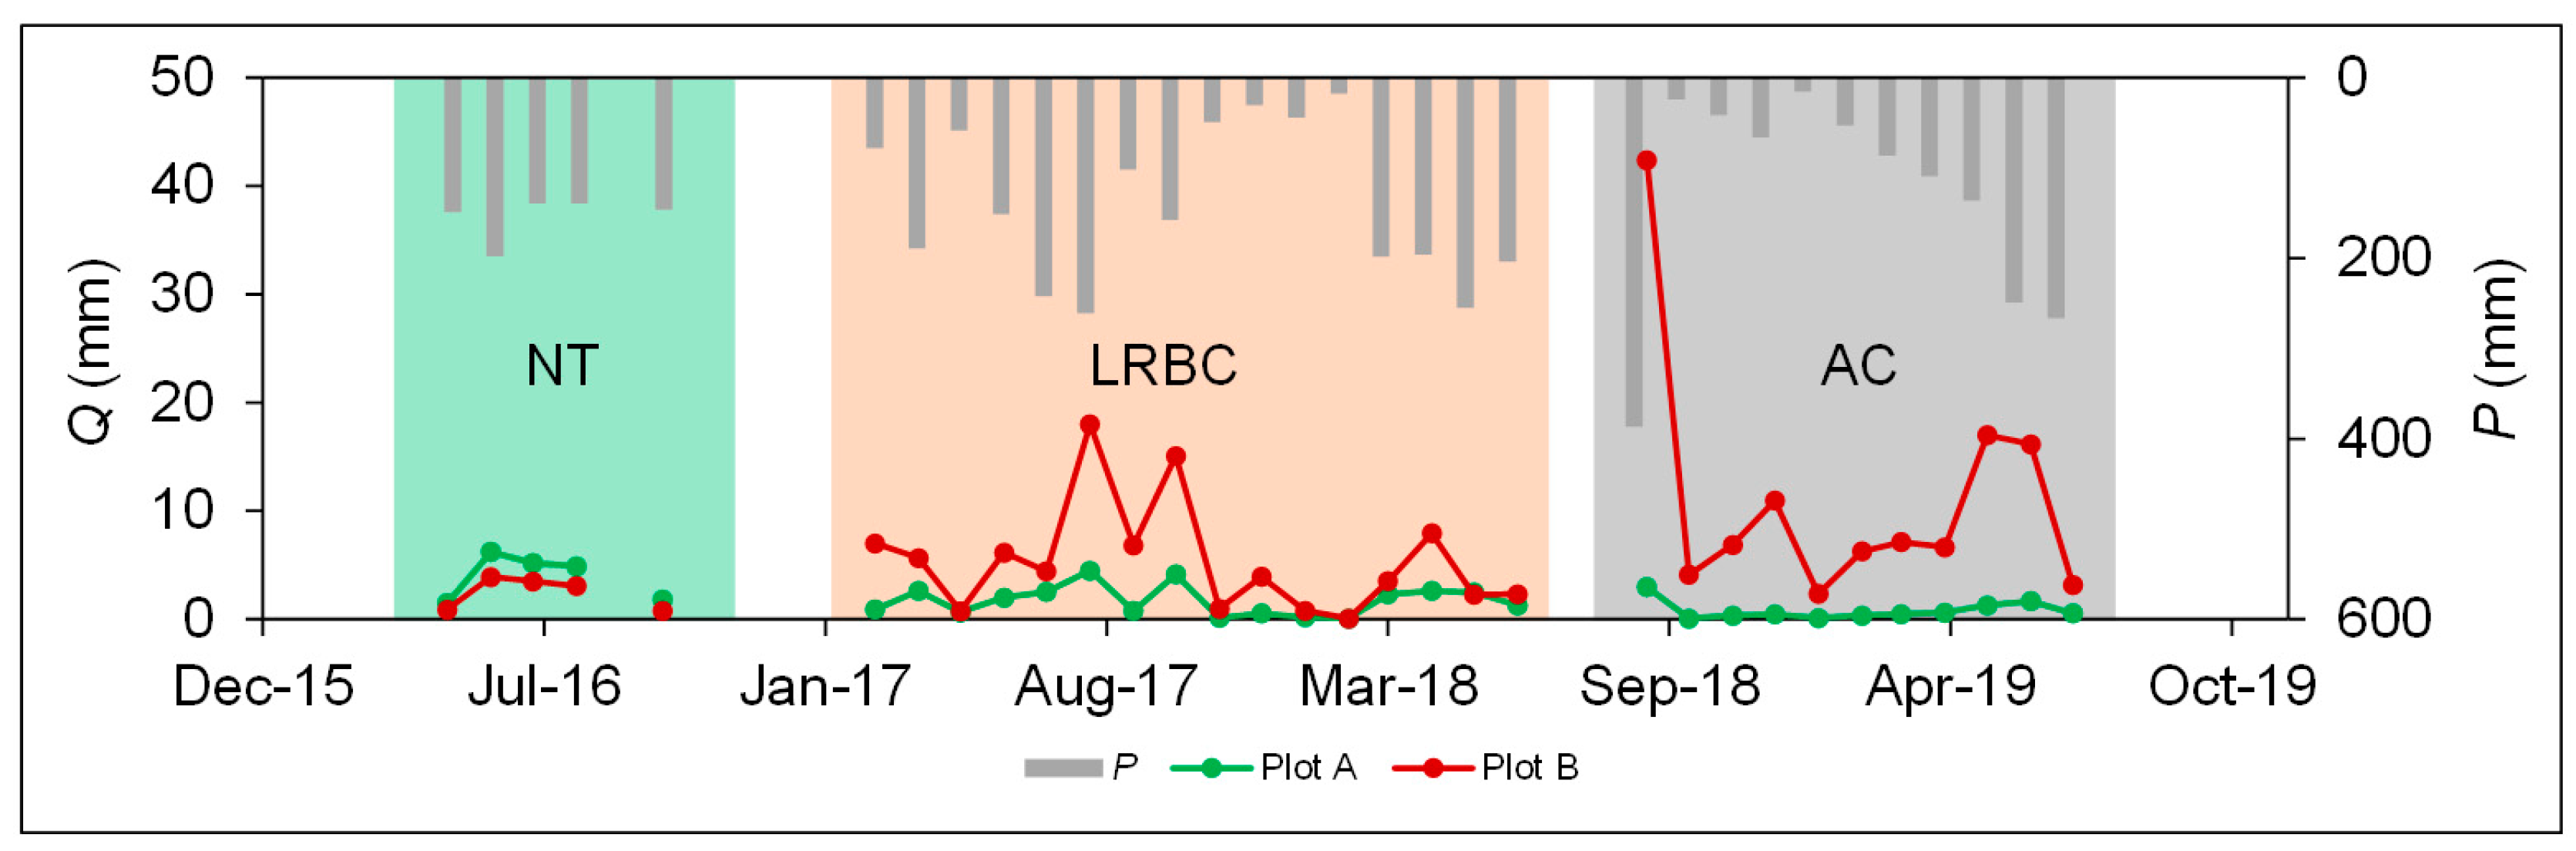
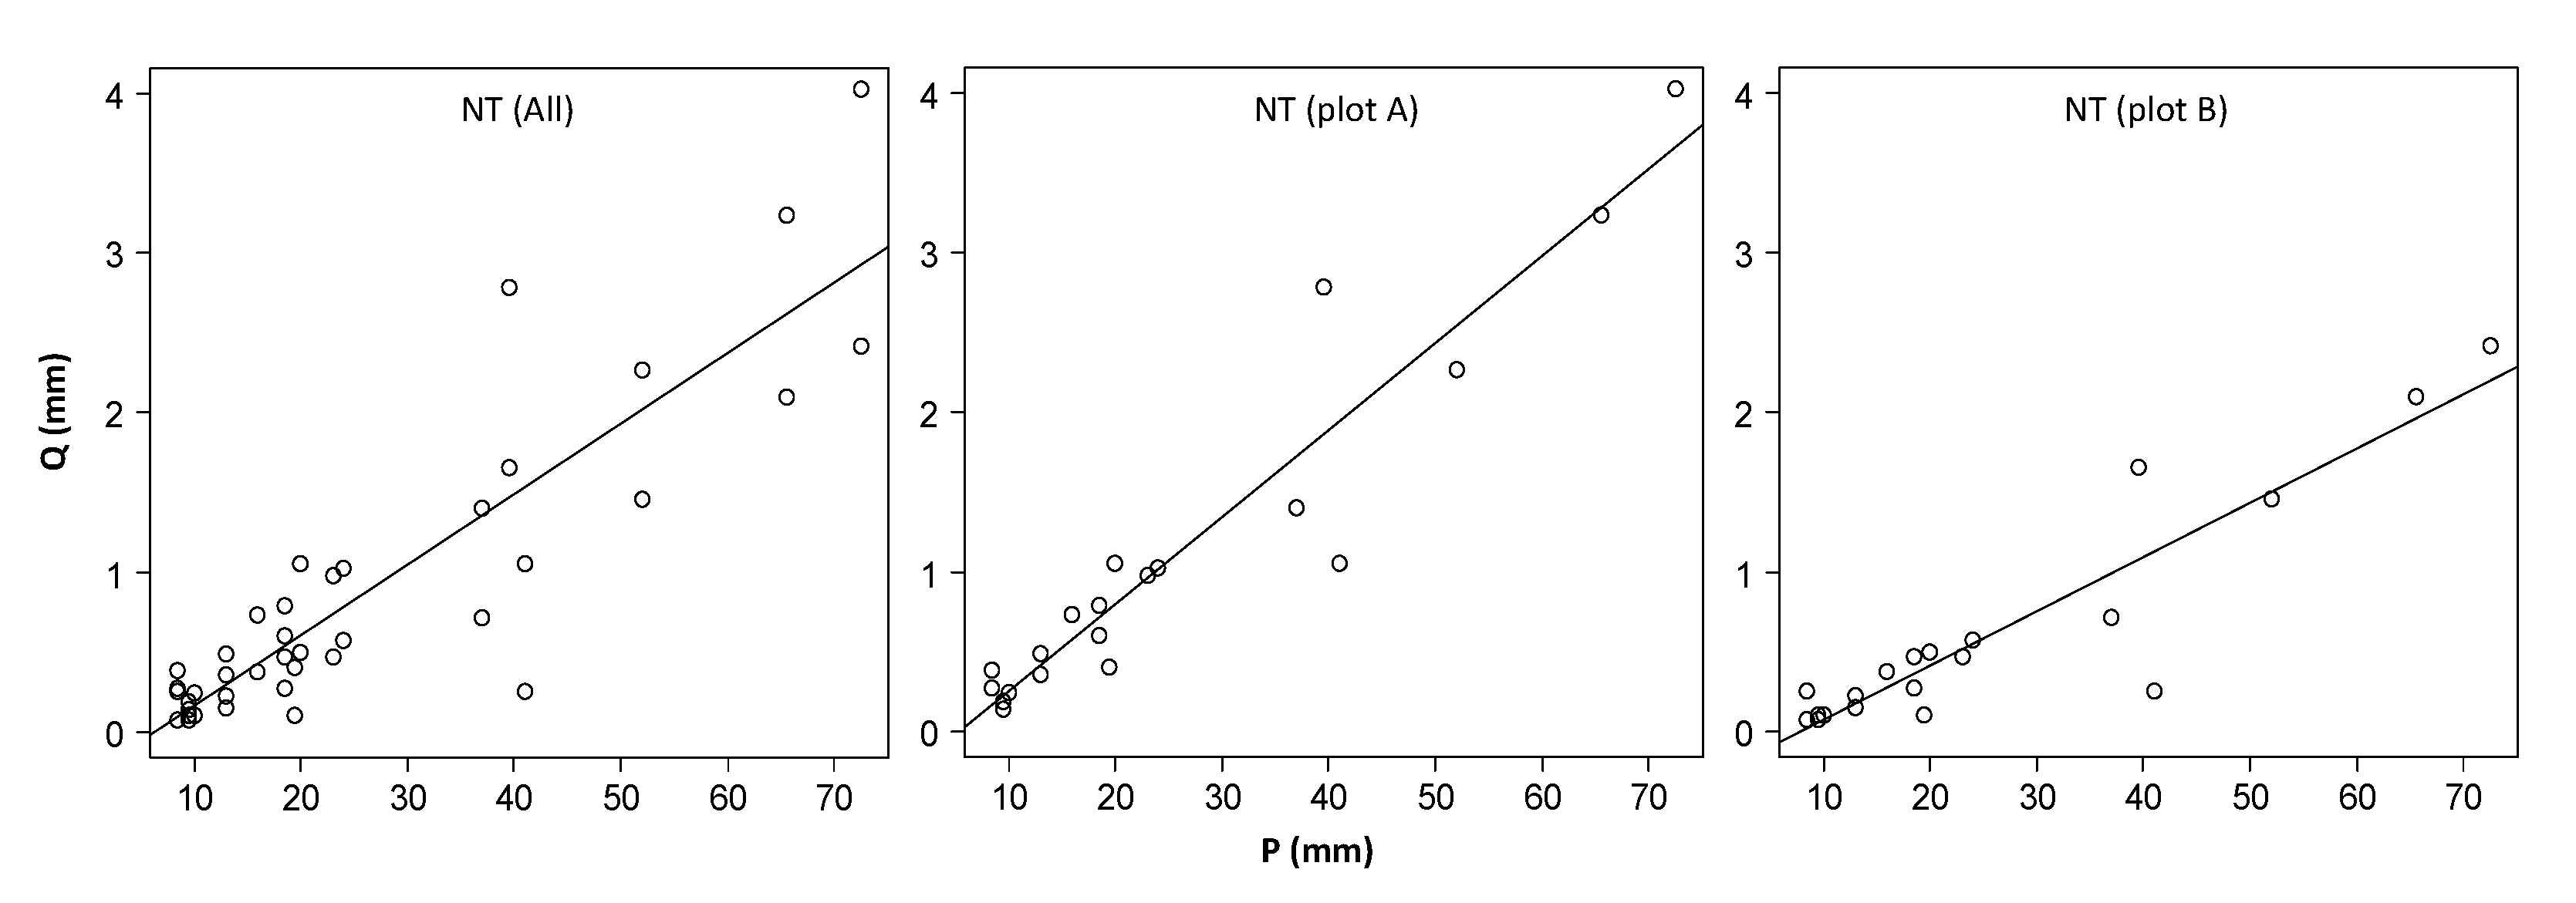
3.1. Overall Surface Runoff and Precipitation

At the monthly timescale, surface runoff in plot B was higher than in plot A after treatment (LRBC and AC phase) (Figure 6). This differed from the pre-treatment period where surface runoff in plot A was slightly higher. The normalised runoff ratio (CN)—defined as the runoff ratio in plot B divided by runoff ratio in plot A—increased from 0.558 in NT to 2.647 and 11.875 in LRBC and AC, respectively (Table 1). The standard deviation (SD) also increased, signifying increased variability (Table 1).
Besides runoff, the runoff frequency represented by the ratio of runoff frequency in plot B to runoff frequency in plot A (TB/A) also increased with disturbance: 0.977, 2.292, and 7.250 in the NT, LRBC, and AC phases, respectively (Table 1). In the NT phase, surface runoff frequency was slightly higher in plot A as visualised in the flow-duration curve (FDC) in Figure 7. In the LRBC and AC phases, despite a decrease in surface runoff frequency in plot A, surface runoff frequency in plot B have increased. The FDC of plot B also became more convex, which is a sign of increased frequency of high-magnitude surface runoff.

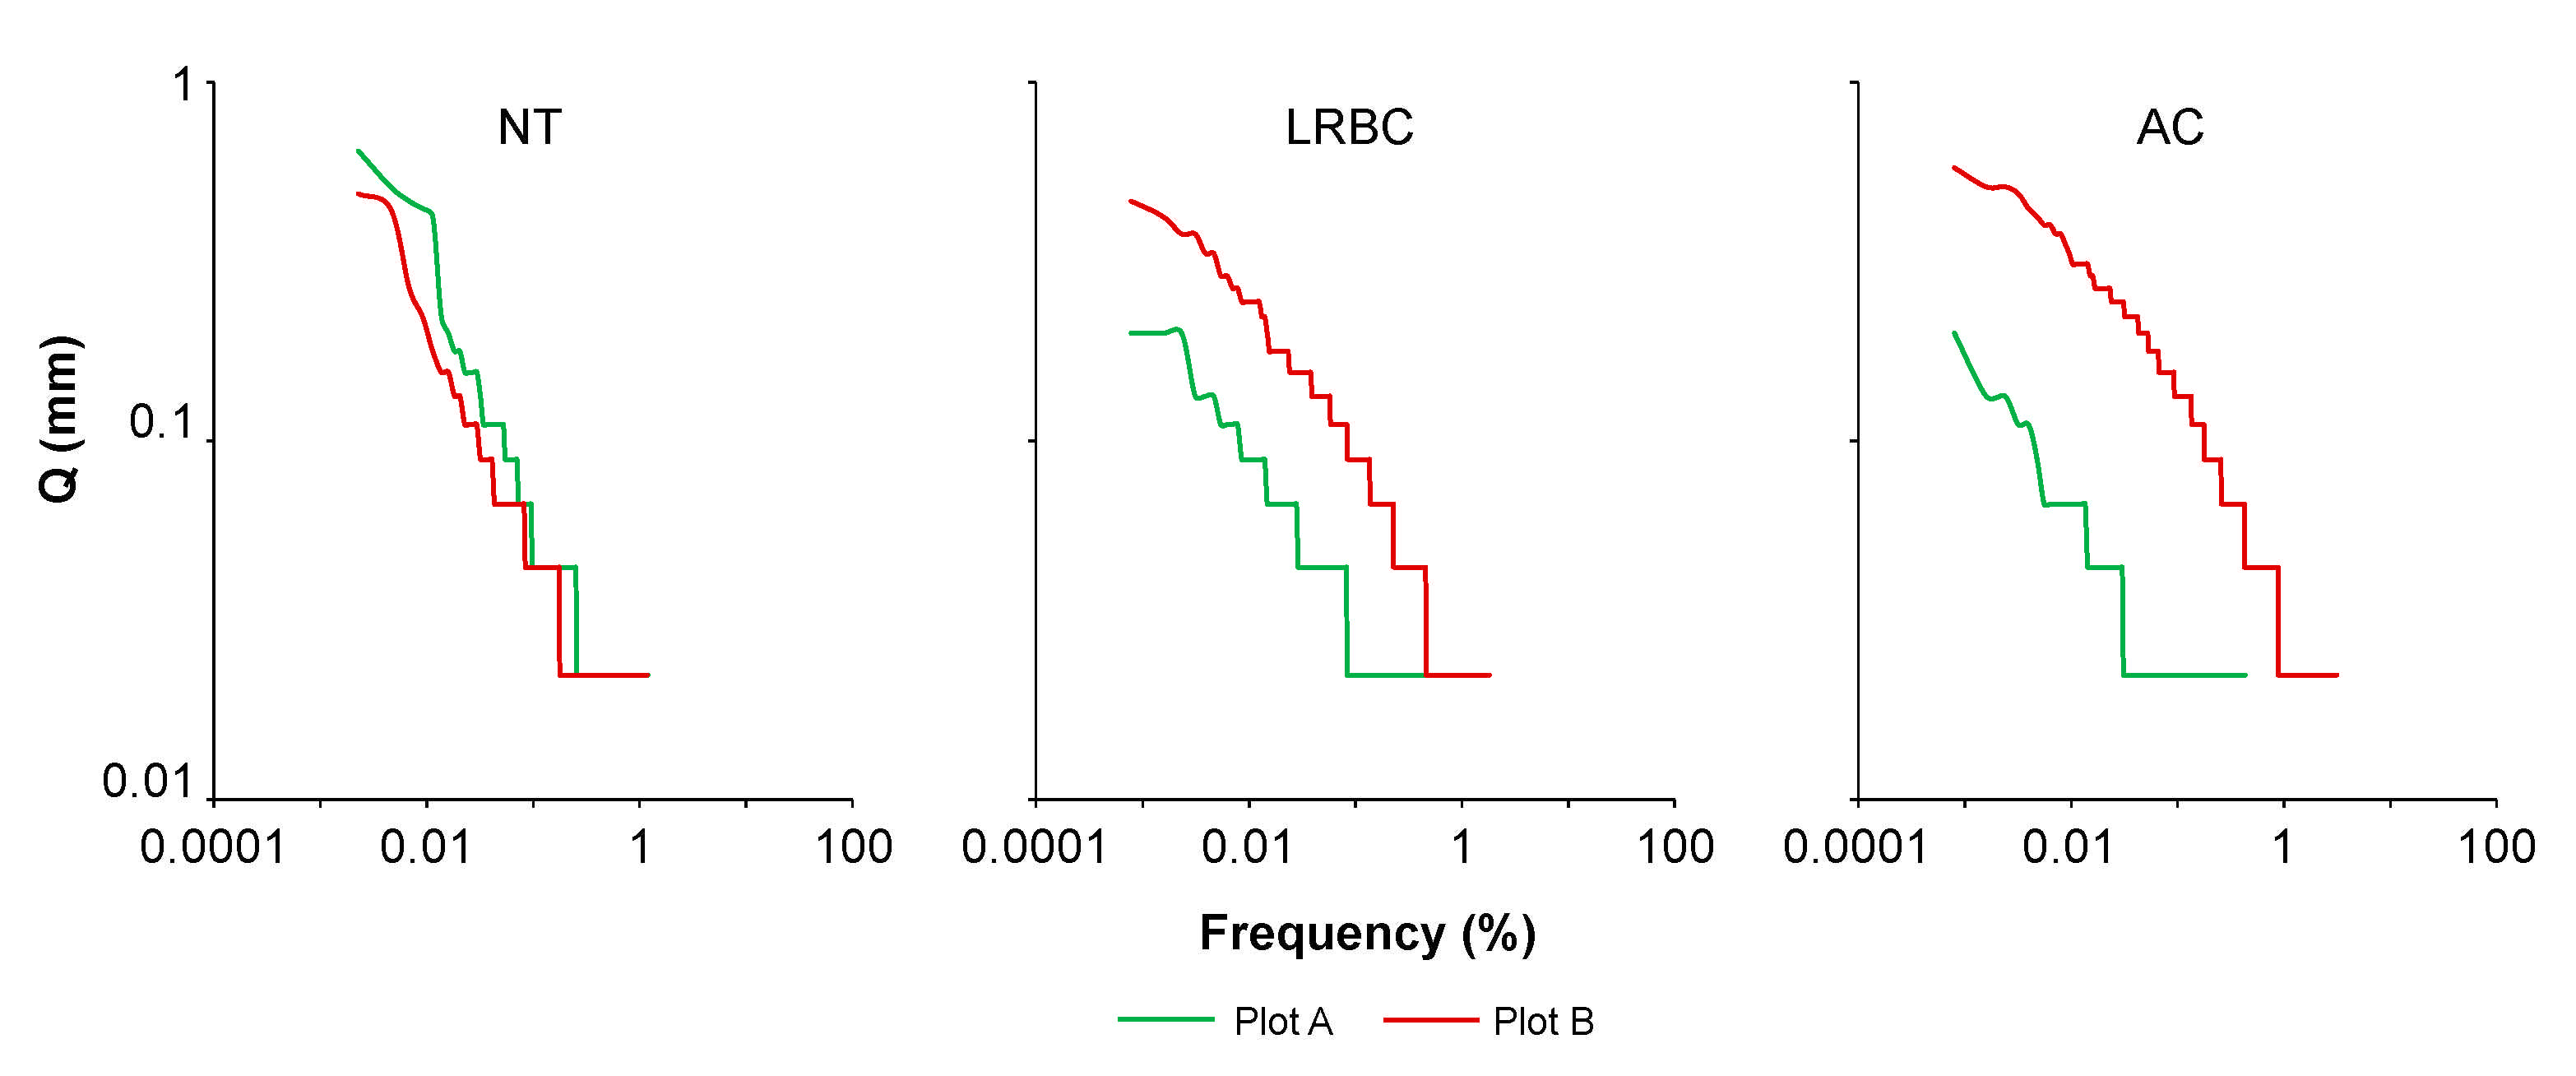
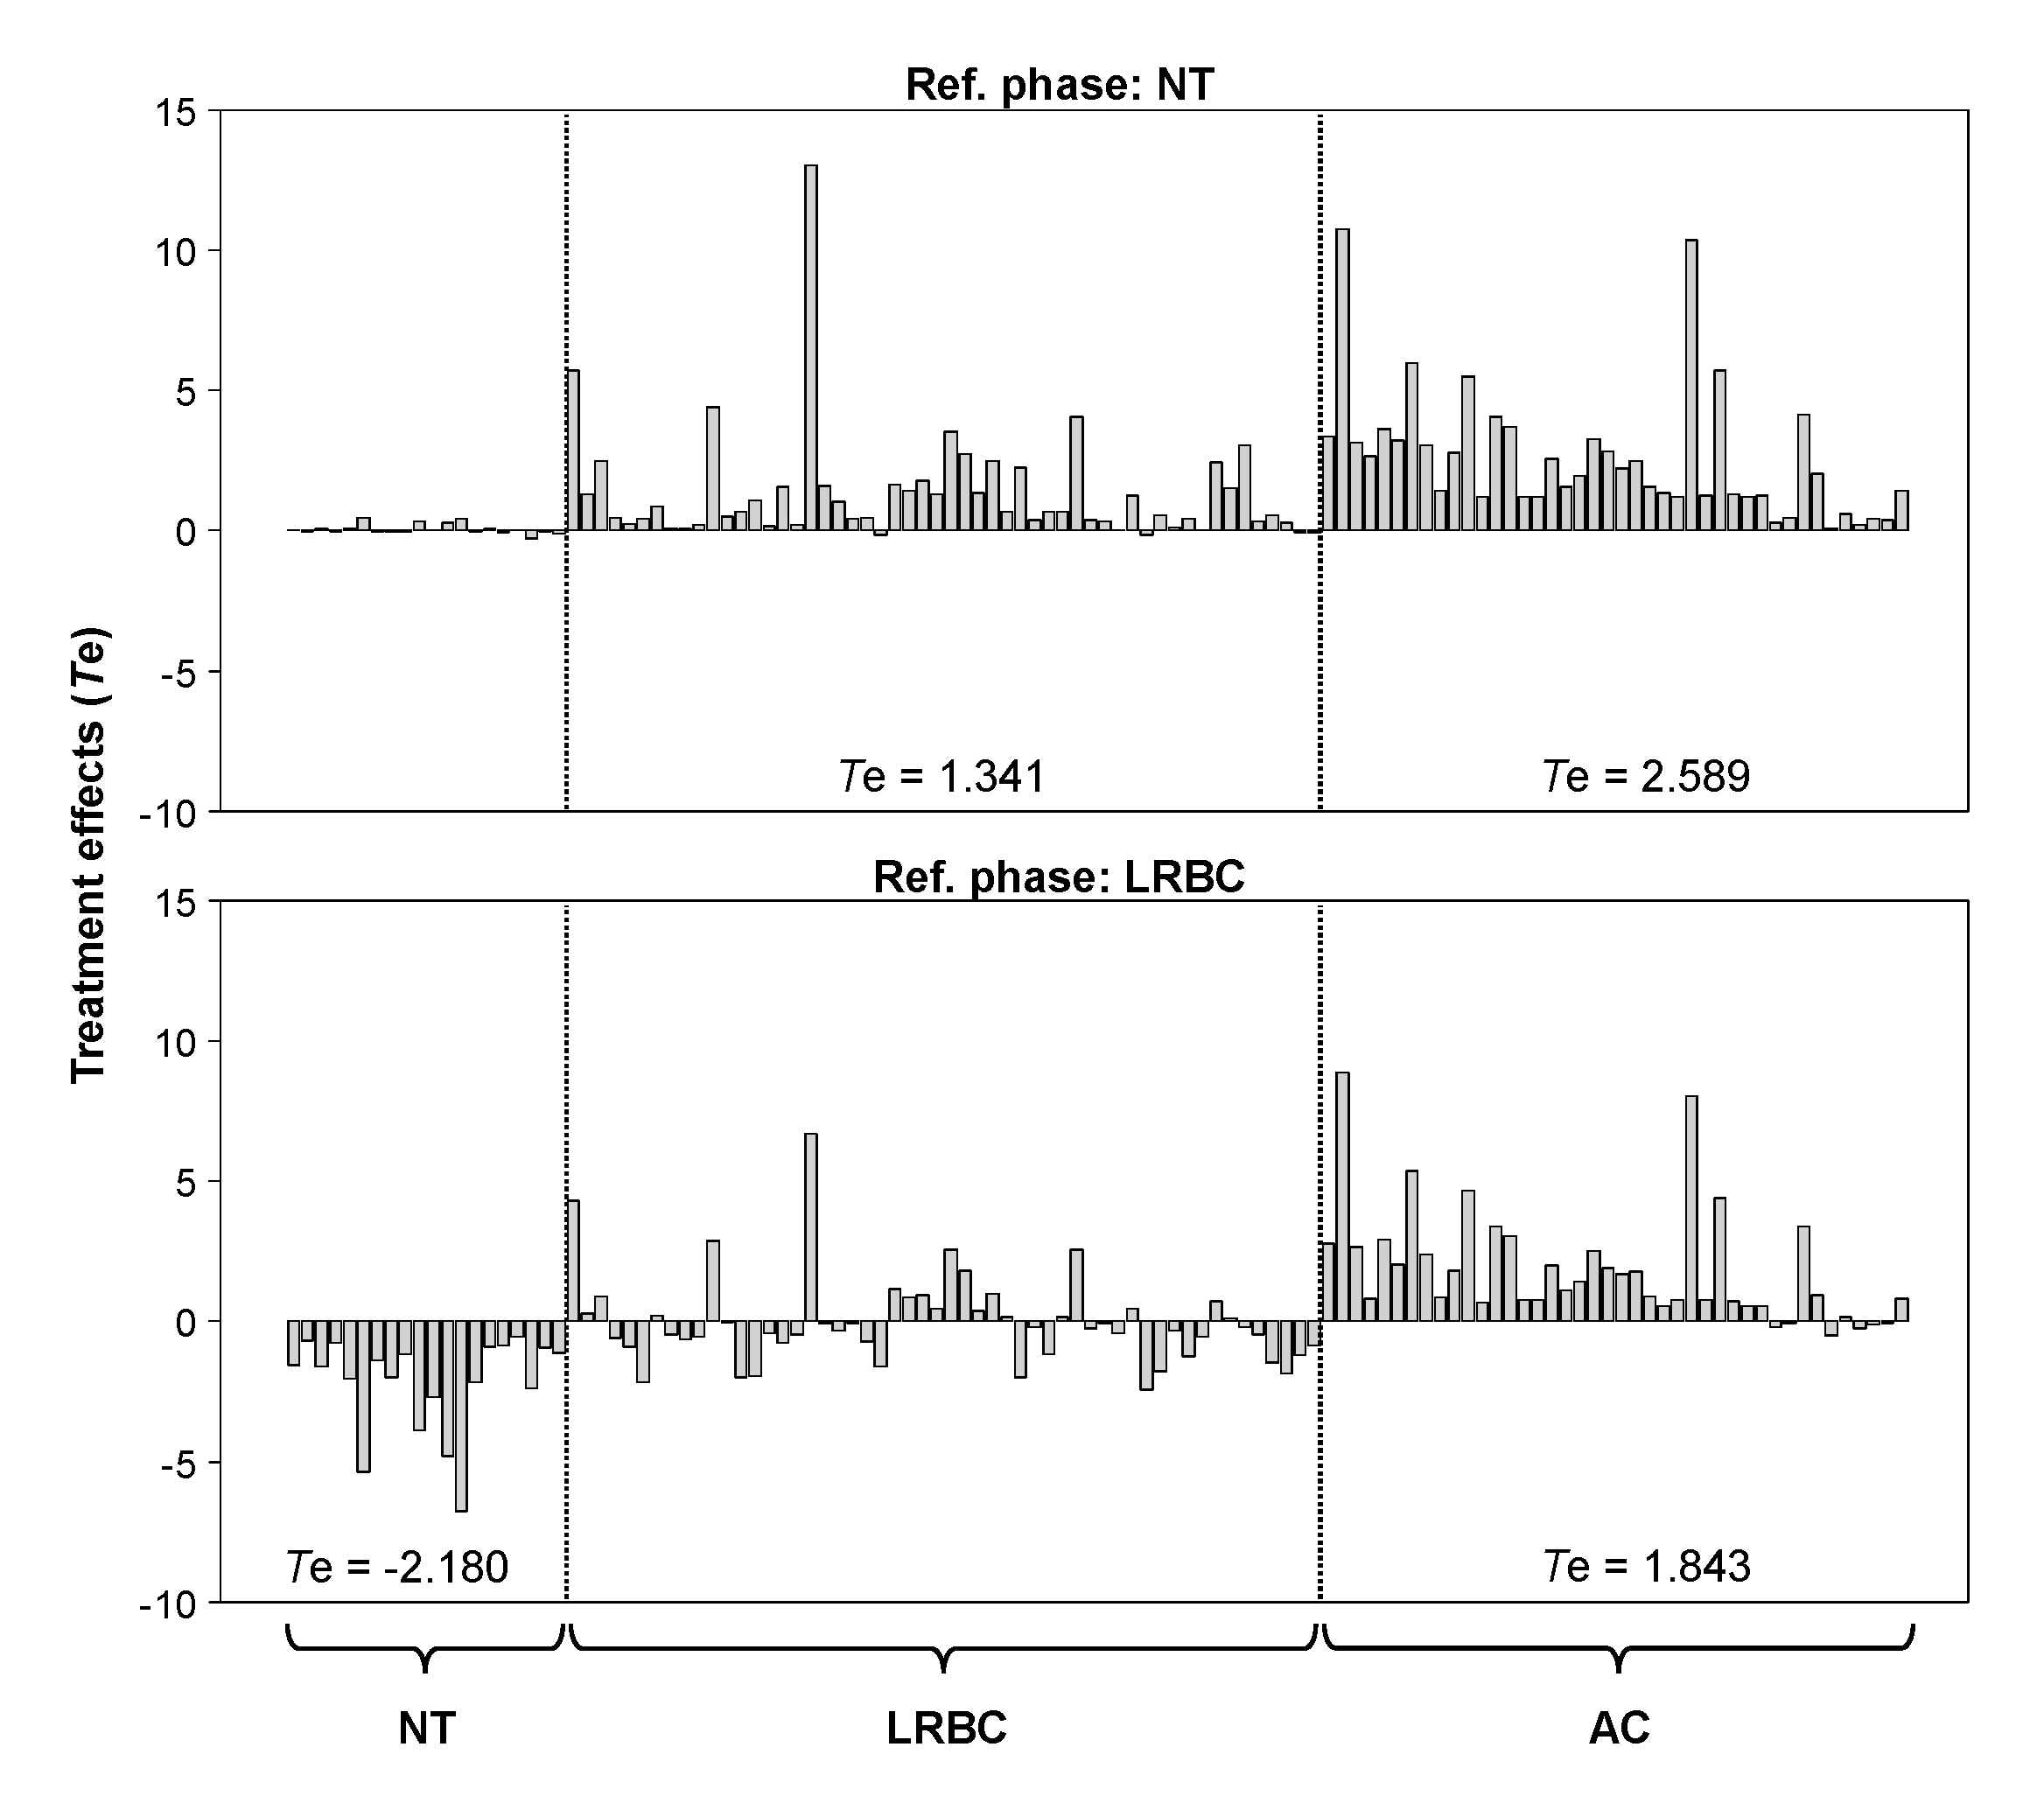
3.2. Event-Scale Surface Runoff in Different Phases

In all phases and in both plots, surface runoff (Q) increased linearly with event rainfall (P) (Figure 8). In the NT phase, strong linear relationships were found (plot A, R2 = 0.9019; plot B, R2 = 0.8488).
Figure 9 shows the relationships between surface runoff in plot B (QB) and surface runoff in plot A (QA) in the NT, LRBC, and AC phase. The resulting GLM equations are:
QB = 0.5015·QA − 0.0038 (NT phase; R2 = 0.9223, p < 0.01)
QB = 2.1971·QA + 0.3336 (LRBC phase; R2 = 0.3630, p < 0.01)
QB = 9.3967·QA + 0.5503 (AC phase; R2 = 0.4388, p < 0.01)
The strong correlation between plot A and B in the NT phase (R2 = 0.9223) indicates suitability for a paired-plot comparison. Based on regression coefficients, surface runoff in the LRBC and AC phase is 4.4 and 18.7 times higher, respectively, than in the NT phase. From the LRBC to AC phase, surface runoff increased 4.3 times. These increases are in the range of that in the monthly timescale. When expressing in terms of treatment effects (Te), the LRBC and AC phases have Te values of 1.341 and 2.589, respectively. From LRBC to AC, Te is 1.843 (Table 1). Te (Figure 10) were statistically significantly different between all phases (Mann–Whitney, p < 0.01). In addition, the y-intercept increased by two orders when moving from NT to LRBC and AC, signifying earlier commencement of surface runoff.

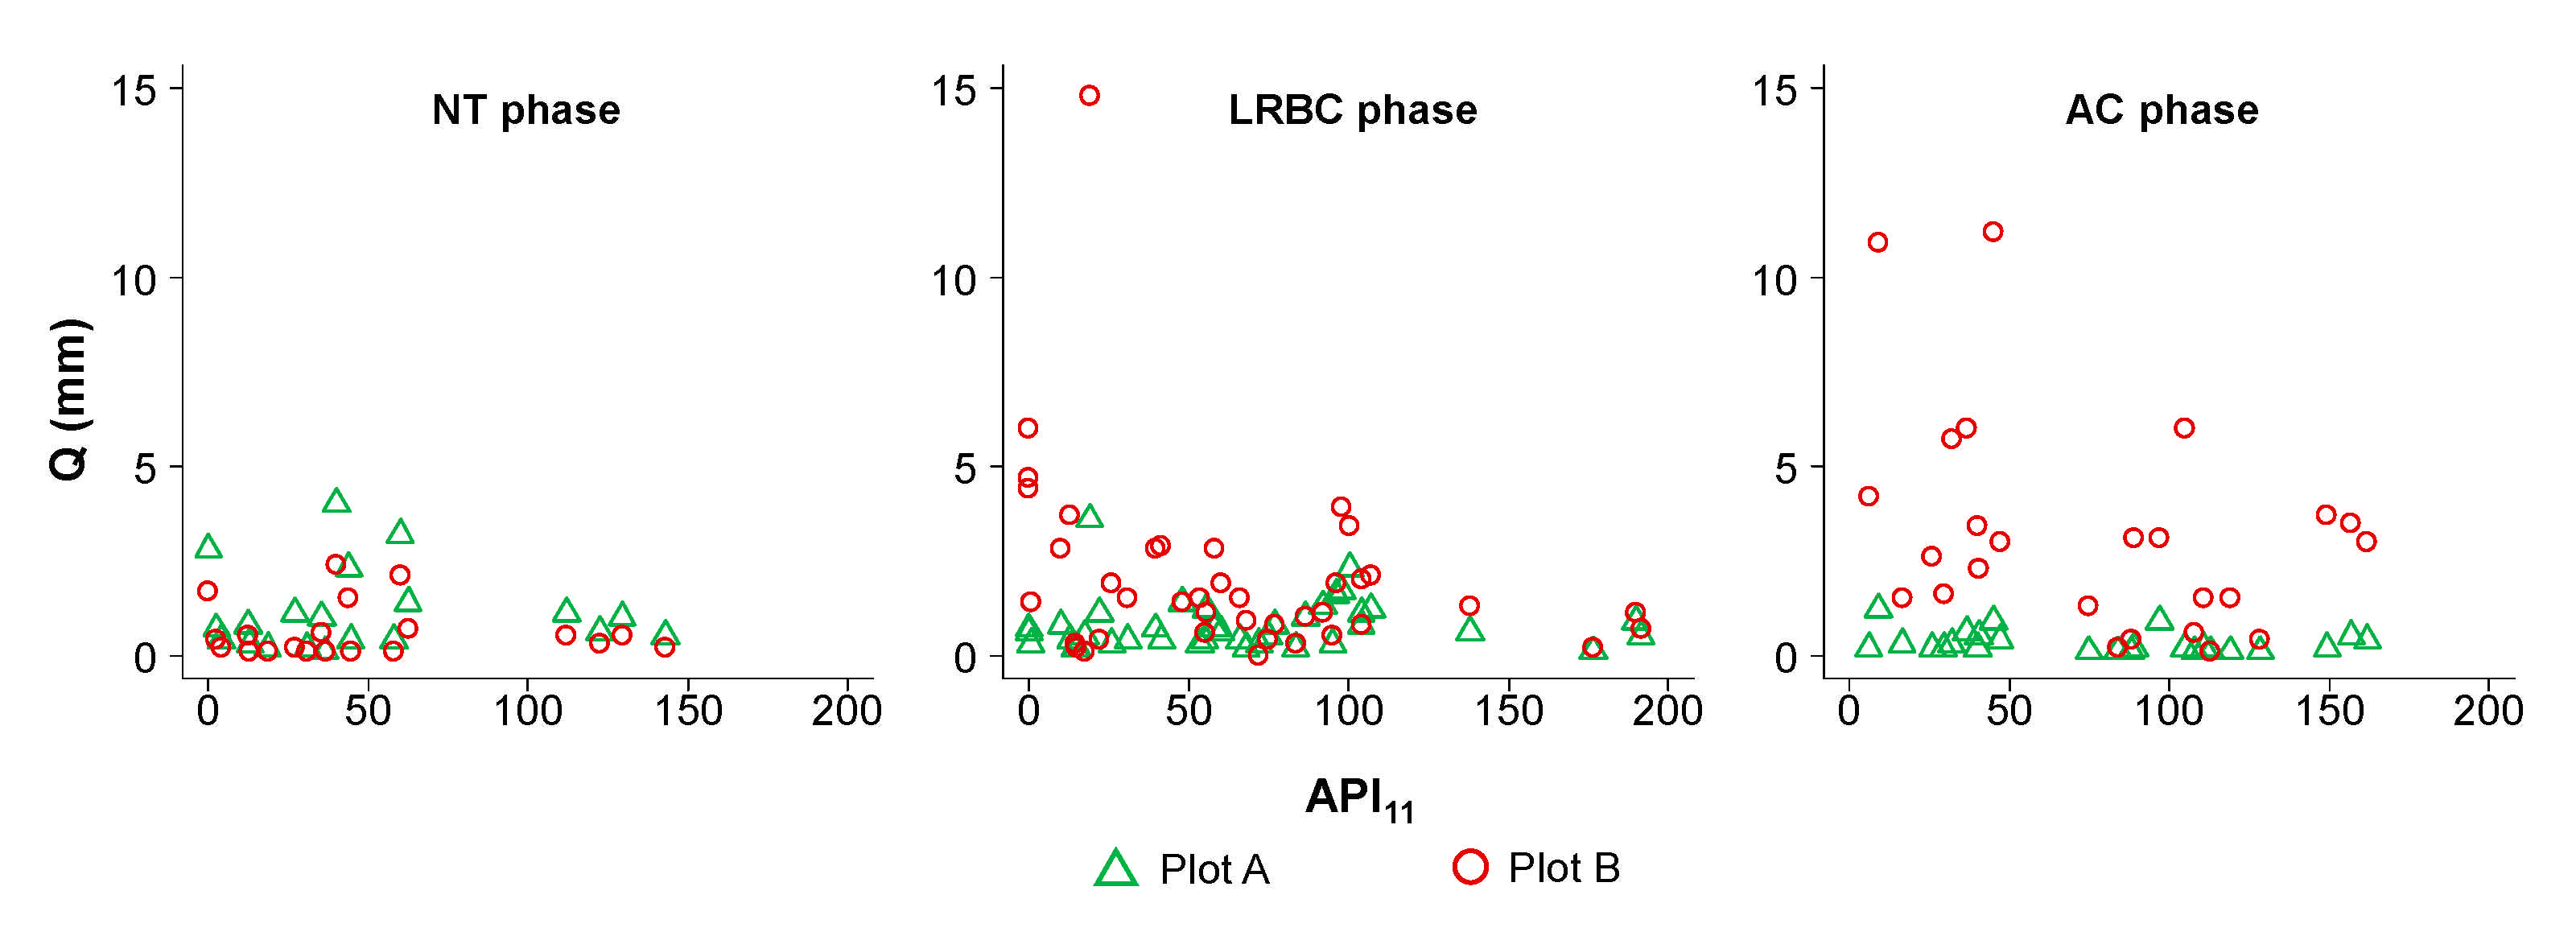
3.3. Surface Runoff and Antecedent Precipitation Index (API)

Figure 11 shows surface runoff against API11 in plots A and B in different treatment phases. In plot A (control), surface runoff varies little with API11 throughout all phases whereas in plot B (treatment), the effects of API11 (negative relationship) increased from NT to LRBC to AC.
Naturally, surface runoff is directly proportional to rainfall and inversely proportional to API. In our study, the relationship QB/QA vs. API11 is only significant in the LRBC phase (QB/QA = −0.014861·API11 + 3.863; p > 0.01).

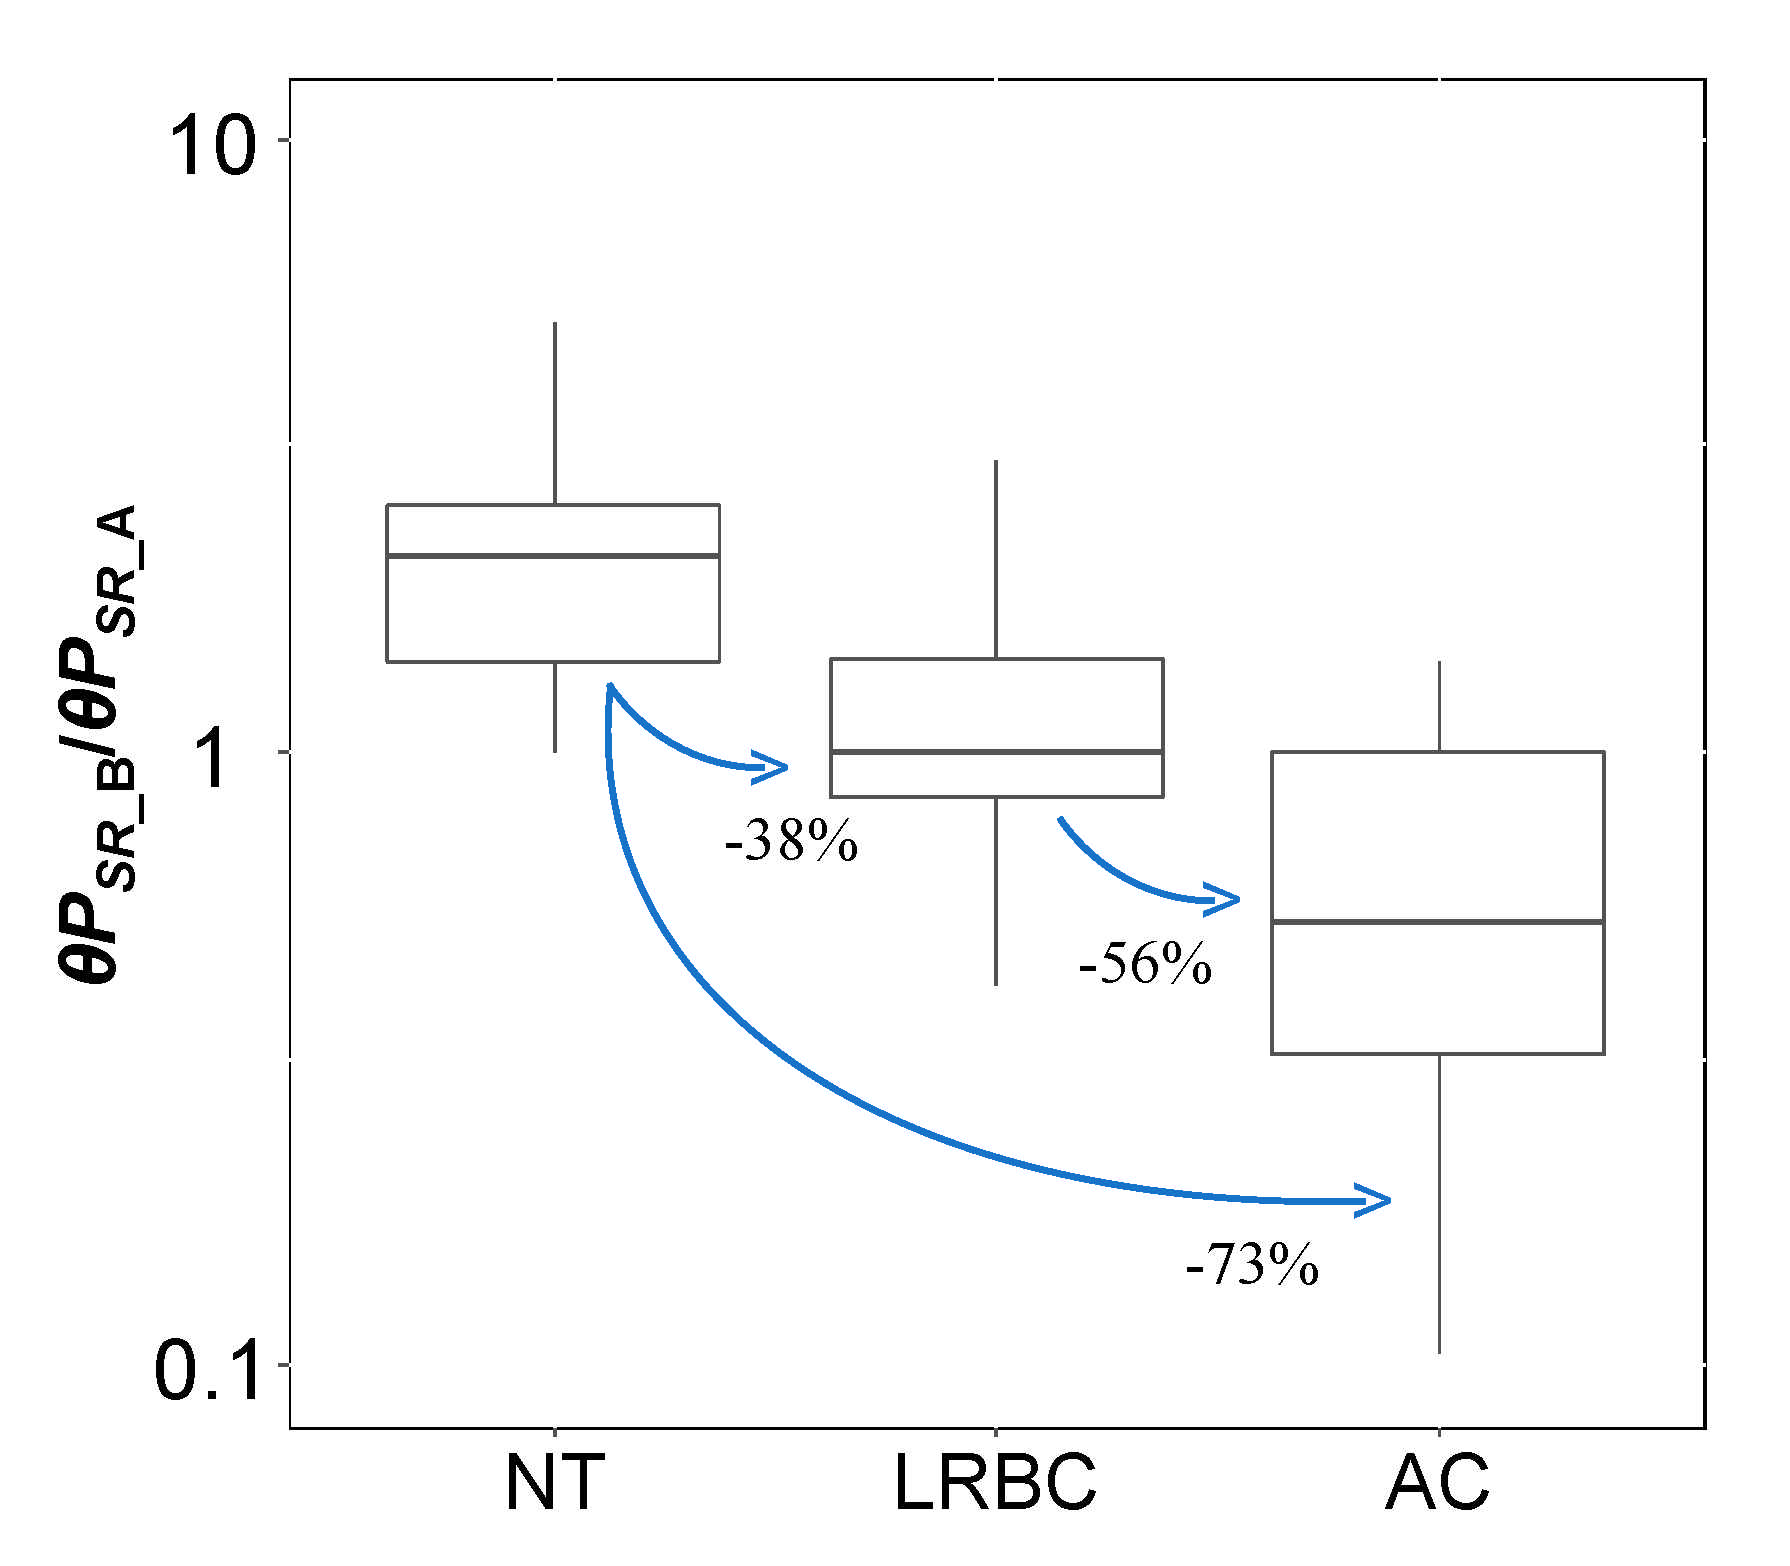
3.4. Rainfall Threshold for Surface Runoff Generation

The amount of rainfall required for surface runoff generation (rainfall threshold, denoted by “θPSR”) was also evaluated (Figure 12). With decreasing interception (NT to LRBC to AC phase), the rainfall threshold decreased accordingly (Figure 12). Pi and API did not have significant influence on rainfall threshold; thus, rainfall threshold between the different phases was assessed via the Mann–Whitney U test. Rainfall threshold in plot B normalised by that in plot A (θPSR_B/θPSR_A) is 38% lower when moving from the NT to LRBC phase. When moving from NT to AC, and LRBC to AC, θPSR_B/θPSR_A is 73% and 56% lower, respectively. Differences in rainfall threshold were statistically significantly different between the NT, LRBC, and AC phases (Mann–Whitney, p < 0.01).

4. Discussion

4.1. No-Treatment Phase

In the NT phase, surface runoff increased linearly with precipitation. This follows findings of existing studies that found similar relationships at the catchment scale in a secondary mixed-forest [13]. Antecedent moisture did not significantly affect surface runoff in the NT period, which may have been due to more important natural factors (rainfall, canopy, ground litter) that govern surface runoff in natural forests. Rainfall threshold for runoff generation was the highest in the NT phase, which reflects good interception properties (by ground litter and canopy) compared to in the treatment phases. These characteristics serve to establish a baseline for post-treatment comparisons.

4.2. Litter Removed, before Clearcutting Phase

In the LRBC phase, surface runoff was higher than in the NT phase (Figure 9), which demonstrated the importance of ground litter in regulating surface runoff [30]. Although the loss in ground litter interception is perceived to be the immediate cause, other mechanisms may have also contributed. In particular, the loss of protective cover may have caused soil compaction and reduced permeability when rainfall and concentrated throughfall directly impacts the soil surface; additionally, the increased floor evaporation may have resulted in drier and hydrophobic conditions. Both of these reduce infiltration and promote rapid direct runoff [20,31,32]. Compared to the straightforward increase in effective rainfall, soil compaction could have played a more important role because canopy in broadleaf forests are known to concentrate rainwater into larger droplets with higher momentum; thus, compacting the soil surface upon impact [19,31]. This increase in surface runoff is consistent with an experiment at the catchment scale [13]. This present study, however, differed in terms of spatial and temporal scales. Therefore, the results are not directly comparable. A more similar plot study was conducted using simulated rainfall in northwest Beijing, China, but with litter from different tree species (Quercus variabilis and Pinus tabulaeformis) [31]. Our results agree with theirs, but the degree of runoff increase is different. Surface runoff in our study increased over four times as opposed to only 43% in Li et al. [31]. This may be attributed to different species, litter morphology, soil type, and rainfall characteristics [22]. Miyata et al. [19] observed that overland flow increases with silt and clay content, and have hypothesised that this is due to silt and clay being key components in the formation of soil crust. This could be a possible mechanism in the present study considering the high clay content in our plots. As for species and litter morphology, broadleaf litter are known to have higher water storage capacity than conifer litter [33]. The increased flow frequency may have resulted from the detection of throughfall of small events that were previously effectively intercepted by ground litter (higher effective rainfall).
Besides an increase in the amount and duration of surface runoff, sensitivity towards API11 also increased (Figure 11). Although dry soils enhance hydrophobicity, resulting in increased surface runoff in forested environments, the effects of this mechanism may have been masked by the presence of ground litter in the NT phase [11,34,35,36]. In addition, the absence of ground litter in the LRBC phase may have accelerated soil drying due to enhanced floor evaporation; thus, creating hydrophobic conditions that promote direct runoff [33]. Therefore, for a given value of API11, actual soil moisture could have been drier in LRBC compared to in the NT phase.
The rainfall threshold required for surface runoff generation was 37.55% lower in LRBC (Figure 12), which reflects the buffering properties of ground litter interception. This is also a sign of increased water repellency usually associated with dry and compacted soils. This indicated that the suggested runoff-on-litter mechanism [20,34], if ever occurred, did not play a significant hydrological role in the NT phase. Li et al. [31] also reported similar results, whereby shorter time was required to initiate surface runoff in bare plots as opposed to litter-covered plots. They also observed that broadleaf litter was marginally more effective in delaying the generation of surface runoff.

4.3. After Clearcutting Phase

Surface runoff was the highest in the AC phase. The increase in surface runoff (4× from LRBC to AC) demonstrated the role of forest canopy in intercepting and evaporating rainwater in secondary broadleaf forests (Figure 9) [14,37,38]. Compared to other hydrological losses, canopy interception (12–24% throughout Japan) may have a distinctively large influence as it directly controls effective rainfall [14,21,39]. Studies from other regions also recorded similar values: 21.3% of rainfall in a tropical broadleaf forest in Kalimantan [40]; 10% and 20% in a primary and regenerated tropical rainforest, respectively, in Sabah, Malaysia [41]; and 22.4% in a conifer forest in California [42]. Our findings differed from what Nanko et al. [43] have suggested, whereby throughfall in forests have larger droplets and higher momentum that compacts the soil and promotessurface runoff (corresponding to LRBC in this study). The increase in flow frequency compared to in the AC phase (Figure 7) could have been caused by similar mechanisms as when transitioning from the NT to LRBC phase, which are increased amount and duration of effective rainfall. Besides a shift in the position of the FDC, its shape has become more convexed; therefore, signifying an increase in the frequency of large-magnitude runoff events (despite plot B having a lower slope angle). In contrast to the LRBC phase, where soil compaction by throughfall was assumed to be the main cause of increased runoff, increases in the AC phase is attributed to increased effective rainfall due to the removal of canopy.
Surface runoff in AC was generally higher than that in the NT and LRBC phases regardless of API11 (Figure 11). This may be caused by high water repellency as a result of increased solar radiation, hence the drying-up of soils and formation of crust. Additionally, the effects of removing the canopy and increasing effective rainfall may have been disproportionately dominant to the extent of exempting influence from soil moisture. Although some studies have attributed this to the latter [42,44,45], at present, we suggest causality to the former based on findings in existing studies [46,47]. The findings of Daikoku et al. [48]—vapour pressure deficit and the below-canopy available energy strongly controls forest floor evaporation in Japan—partly support this. Although saturated soils may also override the influence of API, such conditions never occurred in our well-drained sloping plots.
Compared to the NT and LRBC phases, the decrease in rainfall threshold required for surface runoff generation demonstrated the dominant influence of canopy interception (Figure 12). Although stemflow is known to be a major mechanism that channels canopy-intercepted water to the ground [49,50,51,52], our data has shown that its influence was overridden by the effects of loss in canopy interception. Instead of ground factors, we attribute changes in the AC phase to the loss in canopy interception because of two reasons: (i) following common logging practices, clearcutting has left the lower portion of trunks and roots untouched, hence ground roughness remained unchanged at least in the medium term before root decay takes place; (ii) prior to clearcutting, litter removal in the LRBC phase have discounted the possibility of changes in ground litter being a factor. Therefore, we are able to deduce that it is the increased effective rainfall from the removal of canopy that has caused enhanced surface runoff (amount, duration, and initiation threshold) in the AC phase.

4.4. Additional Consideration and Suggestions

The heterogenous rainfall regime in the region resulted in different rainfall input and moisture conditions throughout the year, which may in turn affect surface properties (such as hydrophobicity) that govern surface runoff. Although surface runoff data of different treatments were collected in different phenological periods, differences in rainfall and moisture conditions were accounted for by the control plot and should not affect the results [13,53,54]. Although effort was made to establish the plots to be as similar as possible, there were small differences in tree species, slope, and plot size. Being situated in a natural forest, it was impossible to establish both plots with the exact tree species and size. The uneven microtopography and undulations on the ground resulted in a 0.7 m2 difference in plot size. This should not affect the results and conclusion because comparisons were performed between different treatment (phases) instead of between different plots. Plot A merely served as a control to account for environmental conditions.
Rainfall intensity is known to significantly affect surface runoff generation in various land cover and regions [55,56,57,58]. The reason for the lack of influence from rainfall intensity in our plot study requires further investigation, but this may be provisionally attributed to surface runoff being naturally high in the area as well as the lack of complex hydrological pathways and sinks found in catchment scale studies [8,59].
This study has quantified the role of ground litter and canopy on surface runoff generation at the plot scale. Results from this study are not directly extrapolatable to the hillslope, catchment, and basin scale due to various hydrological and landscape factors. At the hillslope scale, species composition in a patch area may govern canopy and litter interception. At the catchment scale, various factors such as subsurface flow, groundwater, sinks, and hydrological connectivity need to be accounted for. At the basin scale, land-use and regional weather may be the governing factors instead [22]. In agreement with Liu et al. [22], future studies should cover more species, regions, and spatial scales—larger scales to understand environmental impacts; smaller scales to understand ecohydrological mechanisms.
Although we have investigated changes in surface runoff from litter removal and clearcutting, other hydrological components (infiltration, preferential flow, soil moisture) are still less understood. Investigating these (via moisture sensors, dyes, etc.) will give insights on the below-ground hydrology as well as verify the possible mechanisms that have been discussed in this article.

5. Conclusions

Due to the scarcity of information on the role of ground litter in regenerated broadleaf forests and the effects of clearcutting on surface runoff, we conducted a paired-plot experiment and discussed the possible hydrological mechanisms.
The absence of ground litter increased surface runoff by up to four times. Antecedent moisture had a significant influence on surface runoff generation after ground litter was removed. Without ground litter, 38% less rainfall was required to initiate surface runoff.
Clearcutting increased surface runoff by another four times when compared to the litter-removed period. Without both ground litter and the canopy, antecedent moisture no longer affect surface runoff. Canopy loss resulted in 56% less rainfall required to initiate surface runoff when compared to the ground litter-removed phase.

Author Contributions

Conceptualization, K.K. (Koichiro Kuraji) and M.G.; methodology, K.K. (Koichiro Kuraji); software, A.N., K.K. (Koju Kishimoto), K.T., M.G., and K.K. (Koichiro Kuraji); validation, A.N., K.K. (Koju Kishimoto), K.T., and K.K. (Koichiro Kuraji); formal analysis, A.N., K.K. (Koju Kishimoto), K.T., and K.K. (Koichiro Kuraji); investigation, A.N., K.K. (Koju Kishimoto), K.T., M.G., and K.K. (Koichiro Kuraji); resources, K.K. (Koichiro Kuraji); data curation, A.N., K.K. (Koju Kishimoto), K.T., M.G., and K.K. (Koichiro Kuraji); writing—original draft preparation, K.K. (Koju Kishimoto) and A.N.; writing—review and editing, A.N.; visualization, A.N.; supervision, K.K. (Koichiro Kuraji); project administration, K.K. (Koichiro Kuraji); funding acquisition, K.K. (Koichiro Kuraji). All authors have read and agreed to the published version of the manuscript.

Funding

This work was supported by JSPS KAKENHI (Grant-in-Aid for Young Scientists (B), grant number 26870834); and by the JSPS Core-to-core program (grant number: JPJSCCB20190007).

Institutional Review Board Statement

Not applicable.

Informed Consent Statement

Not applicable.

Acknowledgments

The authors acknowledge all staff of the Ecohydrology Research Institute for providing support in establishing and maintaining the experimental plots. Special mentions: Takanori Sato and Shigenari Satomi.

Conflicts of Interest

The authors declare no conflict of interest. The funders had no role in the design of the study; in the collection, analyses, or interpretation of data; in the writing of the manuscript, or in the decision to publish the results.

References

  1. Forestry Agency Annual Report on Forest and Forestry in Japan Fiscal Year 2018 (Summary). Available online: http://www.rinya.maff.go.jp/j/kikaku/hakusyo/30hakusyo/index.html (accessed on 13 April 2020).
  2. Forestry Agency. Annual Report on Forest and Forestry in Japan—Fiscal Year 2017. Available online: http://www.rinya.maff.go.jp/j/kikaku/hakusyo/29hakusyo/attach/pdf/index-1.pdf (accessed on 18 April 2021).
  3. Food and Agricultural Organization of the United Nations. World Deforestation Slows Down as More Forests Are Better Managed. 2015. Available online: http://www.fao.org/news/story/en/item/326911/icode/ (accessed on 18 April 2021).
  4. Forestry Agency. Annual Report on Forest and Forestry in Japan Fiscal Year 2015. Available online: http://www.rinya.maff.go.jp/j/kikaku/hakusyo/27hakusyo/attach/pdf/index-1.pdf (accessed on 18 April 2021).
  5. The Japanese Forest Society. Forest Science; Special Issue—Possibilities of Conversion to Broadleaf Forests. 2010, Volume 59. Available online: https://www.forestry.jp/publish/ForSci/BackNo/sk59/59.pdf (accessed on 26 April 2021).
  6. Tanaka, N.; Kuraji, K.; Shiraki, K.; Suzuki, M.; Suzuki, M.; Ohta, T.; Suzuki, M. Throughfall, stemflow and rainfall interception at mature Cryptomeria japonica and Chamaecyparis obtusa stands in Fukuroyamasawa watershed. Bull. Tokyo Univ. For. 2005, 113, 197–240. (In Japanese) [Google Scholar]
  7. Miyata, S.; Kosugi, K.; Gomi, T.; Onda, Y.; Mizuyama, T. Surface runoff as affected by soil water repellency in a Japanese cypress forest. Hydrol. Process. 2007, 21, 2365–2376. [Google Scholar] [CrossRef]
  8. Sidle, R.C.; Hirano, T.; Gomi, T.; Terajima, T. Hortonian overland flow from Japanese forest plantations—an aberration, the real thing, or something in between? Hydrol. Process. 2007, 21, 3237–3247. [Google Scholar] [CrossRef]
  9. Murakami, S.; Tsuboyama, Y.; Shimizu, T.; Fujieda, M.; Noguchi, S. Variation of evapotranspiration with stand age and climate in a small Japanese forested catchment. J. Hydrol. 2000, 227, 114–127. [Google Scholar] [CrossRef]
  10. Saito, T.; Kumagai, T.; Tateishi, M.; Kobayashi, N.; Otsuki, K.; Giambelluca, T.W. Differences in seasonality and temperature dependency of stand transpiration and canopy conductance between Japanese cypress (Hinoki) and Japanese cedar (Sugi) in a plantation. Hydrol. Process. 2017, 31, 1952–1965. [Google Scholar] [CrossRef]
  11. Sun, X.; Onda, Y.; Otsuki, K.; Kato, H.; Gomi, T. The effect of strip thinning on forest floor evaporation in a Japanese cypress plantation. Agric. For. Meteorol. 2016, 216, 48–57. [Google Scholar] [CrossRef] [Green Version]
  12. Kuraji, K.; Gomyo, M.; Nainar, A. Thinning of cypress forest increases subsurface runoff but reduces peak storm-runoff: A lysimeter observation. Hydrol. Res. Lett. 2019, 13. [Google Scholar] [CrossRef] [Green Version]
  13. Gomyo, M.; Kuraji, K. Effect of the litter layer on runoff and evapotranspiration using the paired watershed method. J. For. Res. 2016, 21, 306–313. [Google Scholar] [CrossRef]
  14. Abe, Y.; Gomi, T.; Nakamura, N.; Kagawa, N. Field estimation of interception in a broadleaf forest under multi-layered structure conditions. Hydrol. Res. Lett. 2017, 11, 181–186. [Google Scholar] [CrossRef] [Green Version]
  15. Onda, Y.; Gomi, T.; Mizugaki, S.; Nonoda, T.; Sidle, R.C. An overview of the field and modelling studies on the effects of forest devastation on flooding and environmental issues. Hydrol. Process. 2010, 24, 527–534. [Google Scholar] [CrossRef]
  16. Li, X.; Niu, J.; Xie, B. Study on Hydrological functions of litter layers in North China. PLoS ONE 2013, 8, e70328. [Google Scholar] [CrossRef]
  17. Prosdocimi, M.; Jordán, A.; Tarolli, P.; Keesstra, S.; Novara, A.; Cerdà, A. The immediate effectiveness of barley straw mulch in reducing soil erodibility and surface runoff generation in Mediterranean vineyards. Sci. Total Environ. 2016, 547, 323–330. [Google Scholar] [CrossRef] [Green Version]
  18. Zhou, Q.; Zhou, X.; Luo, Y.; Cai, M. The effects of litter layer and topsoil on surface runoff during simulated rainfall in Guizhou Province, China: A plot scale case study. Water 2018, 10, 915. [Google Scholar] [CrossRef] [Green Version]
  19. Miyata, S.; Kosugi, K.; Gomi, T.; Mizuyama, T. Effects of forest floor coverage on overland flow and soil erosion on hillslopes in Japanese cypress plantation forests. Water Resour. Res. 2009, 45. [Google Scholar] [CrossRef]
  20. Walsh, R.P.D.; Voigt, P.J. Vegetation litter: An underestimated variable in hydrology and geomorphology. J. Biogeogr. 1977, 4, 253. [Google Scholar] [CrossRef]
  21. Sun, X.; Onda, Y.; Kato, H.; Gomi, T.; Komatsu, H. Effect of strip thinning on rainfall interception in a Japanese cypress plantation. J. Hydrol. 2015, 525, 607–618. [Google Scholar] [CrossRef] [Green Version]
  22. Liu, J.; Gao, G.; Wang, S.; Jiao, L.; Wu, X.; Fu, B. The effects of vegetation on runoff and soil loss: Multidimensional structure analysis and scale characteristics. J. Geogr. Sci. 2018, 28, 59–78. [Google Scholar] [CrossRef] [Green Version]
  23. Nainar, A.; Tanaka, N.; Sato, T.; Kuraji, K. Comparing runoff characteristics between an evergreen cypress forest and a mixed-broadleaf forest during different phenological periods in central Japan. Geophys. Res. Abstr. 2019, 21, 2019–4671. Available online: https://meetingorganizer.copernicus.org/EGU2019/EGU2019-4671.pdf (accessed on 26 April 2021).
  24. Ecohydrology Research Institute. Available online: http://www.uf.a.u-tokyo.ac.jp/eri/ (accessed on 7 April 2021).
  25. Nainar, A.; Tanaka, N.; Sato, T.; Kishimoto, K.; Kuraji, K. A comparison of the baseflow recession constant (K) between a Japanese cypress and mixed-broadleaf forest via six estimation methods. Sustain. Water Resour. Manag. 2021, 7, 1–13. [Google Scholar] [CrossRef]
  26. Gomyo, M.; Kuraji, K. Long-term variation of annual loss and annual evapotranspiration in small watershed with the forest restoration and succession on denuded hills. J. Jpn. For. Soc. 2013, 95, 109–116. [Google Scholar] [CrossRef] [Green Version]
  27. Gomyo, M.; Kuraji, K. Effect of litter layer on water balance and runoff at the watershed scale. Water Sci. 2016, 60, 31–45. [Google Scholar] [CrossRef]
  28. Ecohydrology Research Institute. Map of Ananomiya Experimental Forest; Ecohydrology Research Institute (Archive): Seto, Japan; Available online: https://www.a.u-tokyo.ac.jp/english/institute_e/ai-uforests.html (accessed on 19 April 2021).
  29. United States Department of Agriculture Soil Texture Calculator|NRCS Soils. Available online: https://www.nrcs.usda.gov/wps/portal/nrcs/detail/soils/survey/?cid=nrcs142p2_054167 (accessed on 22 April 2020).
  30. Putuhena, W.M.; Cordery, I. Estimation of interception capacity of the forest floor. J. Hydrol. 1996, 180, 283–299. [Google Scholar] [CrossRef]
  31. Li, X.; Niu, J.; Xie, B. The effect of leaf litter cover on surface runoff and soil erosion in Northern China. PLoS ONE 2014, 9, e107789. [Google Scholar] [CrossRef] [Green Version]
  32. Sayer, E.J. Using experimental manipulation to assess the roles of leaf litter in the functioning of forest ecosystems. Biol. Rev. 2005, 81. [Google Scholar] [CrossRef] [PubMed]
  33. Kim, J.K.; Onda, Y.; Kim, M.S.; Yang, D.Y. Plot-scale study of surface runoff on well-covered forest floors under different canopy species. Quat. Int. 2014, 344, 75–85. [Google Scholar] [CrossRef]
  34. Butzen, V.; Seeger, M.; Marruedo, A.; de Jonge, L.; Wengel, R.; Ries, J.B.; Casper, M.C. Water repellency under coniferous and deciduous forest—Experimental assessment and impact on overland flow. Catena 2015, 133, 255–265. [Google Scholar] [CrossRef]
  35. Deguchi, A.; Hattori, S.; Daikoku, K.; Park, H.-T. Measurement of evaporation from the forest floor in a deciduous forest throughout the year using microlysimeter and closed-chamber systems. Hydrol. Process. 2008, 22, 3712–3723. [Google Scholar] [CrossRef]
  36. Benyon, R.G.; Doody, T.M. Comparison of interception, forest floor evaporation and transpiration in Pinus radiata and Eucalyptus globulus plantations. Hydrol. Process. 2015, 29, 1173–1187. [Google Scholar] [CrossRef]
  37. Crockford, R.H.; Richardson, D.P. Partitioning of rainfall into throughfall, stemflow and interception: Effect of forest type, ground cover and climate. Hydrol. Process. 2000, 14, 2903–2920. [Google Scholar] [CrossRef]
  38. Levia, D.F.; Nanko, K.; Amasaki, H.; Giambelluca, T.W.; Hotta, N.; Iida, S.; Mudd, R.G.; Nullet, M.A.; Sakai, N.; Shinohara, Y.; et al. Throughfall partitioning by trees. Hydrol. Process. 2019, 33, 1698–1708. [Google Scholar] [CrossRef] [Green Version]
  39. Komatsu, H.; Shinohara, Y.; Kume, T.; Otsuki, K. Relationship between annual rainfall and interception ratio for forests across Japan. For. Ecol. Manag. 2008, 256, 1189–1197. [Google Scholar] [CrossRef]
  40. Vernimmen, R.R.E.; Bruijnzeel, L.A.; Romdoni, A.; Proctor, J. Rainfall interception in three contrasting lowland rain forest types in Central Kalimantan, Indonesia. J. Hydrol. 2007, 340, 217–232. [Google Scholar] [CrossRef]
  41. Chappell, N.A.; Bidin, K.; Tych, W. Modelling rainfall and canopy controls on net-precipitation beneath selectively-logged tropical forest. Plant. Ecol. 2001, 153, 215–229. [Google Scholar] [CrossRef]
  42. Reid, L.M.; Lewis, J. Rates, timing, and mechanisms of rainfall interception loss in a coastal redwood forest. J. Hydrol. 2009, 375, 459–470. [Google Scholar] [CrossRef]
  43. Nanko, K.; Onda, Y.; Ito, A.; Ito, S.; Mizugaki, S.; Moriwaki, H. Variability of surface runoff generation and infiltration rate under a tree canopy: Indoor rainfall experiment using Japanese cypress (Chamaecyparis obtusa). Hydrol. Process. 2010, 24, 567–575. [Google Scholar] [CrossRef]
  44. Oishi, A.C.; Oren, R.; Stoy, P.C. Estimating components of forest evapotranspiration: A footprint approach for scaling sap flux measurements. Agric. For. Meteorol. 2008, 148, 1719–1732. [Google Scholar] [CrossRef] [Green Version]
  45. Zheng, C.; Jia, L. Global canopy rainfall interception loss derived from satellite earth observations. Ecohydrology 2020, 13, e2186. [Google Scholar] [CrossRef] [Green Version]
  46. Vesala, T.; Suni, T.; Rannik, Ü.; Keronen, P.; Markkanen, T.; Sevanto, S.; Grönholm, T.; Smolander, S.; Kulmala, M.; Ilvesniemi, H.; et al. Effect of thinning on surface fluxes in a boreal forest. Global Biogeochem. Cycles 2005, 19, GB2001. [Google Scholar] [CrossRef]
  47. Ishii, H.T.; Maleque, M.A.; Taniguchi, S. Line thinning promotes stand growth and understory diversity in Japanese cedar (Cryptomeria japonica D. Don) plantations. J. For. Res. 2008, 13, 73–78. [Google Scholar] [CrossRef]
  48. Daikoku, K.; Hattori, S.; Deguchi, A.; Aoki, Y.; Miyashita, M.; Matsumoto, K.; Akiyama, J.; Iida, S.; Toba, T.; Fujita, Y.; et al. Influence of evaporation from the forest floor on evapotranspiration from the dry canopy. Hydrol. Process. 2008, 22, 4083–4096. [Google Scholar] [CrossRef]
  49. Germer, S.; Werther, L.; Elsenbeer, H. Have we underestimated stemflow? Lessons from an open tropical rainforest. J. Hydrol. 2010, 395, 169–179. [Google Scholar] [CrossRef]
  50. Su, L.; Xu, W.; Zhao, C.; Xie, Z.; Ju, H. Inter- and intra-specific variation in stemflow for evergreen species and deciduous tree species in a subtropical forest. J. Hydrol. 2016, 537, 1–9. [Google Scholar] [CrossRef]
  51. Kuraji, K.; Tanaka, Y.; Tanaka, N.; Karakama, I. Generation of stemflow volume and chemistry in a mature Japanese cypress forest. Hydrol. Process. 2001, 15, 1967–1978. [Google Scholar] [CrossRef]
  52. Tanaka, N.; Levia, D.; Igarashi, Y.; Yoshifuji, N.; Tanaka, K.; Tantasirin, C.; Nanko, K.; Suzuki, M.; Kumagai, T. What factors are most influential in governing stemflow production from plantation-grown teak trees? J. Hydrol. 2017, 544, 10–20. [Google Scholar] [CrossRef] [Green Version]
  53. Dung, B.X.; Gomi, T.; Miyata, S.; Sidle, R.C.; Kosugi, K.; Onda, Y. Runoff responses to forest thinning at plot and catchment scales in a headwater catchment draining Japanese cypress forest. J. Hydrol. 2012, 444–445, 51–62. [Google Scholar] [CrossRef]
  54. Dung, B.X.; Miyata, S.; Gomi, T. Effect of forest thinning on overland flow generation on hillslopes covered by Japanese cypress. Ecohydrology 2011, 4, 367–378. [Google Scholar] [CrossRef]
  55. Mu, W.; Yu, F.; Li, C.; Xie, Y.; Tian, J.; Liu, J.; Zhao, N. Effects of rainfall intensity and slope gradient on runoff and soil moisture content on different growing stages of spring maize. Water 2015, 7, 2990–3008. [Google Scholar] [CrossRef] [Green Version]
  56. Liang, Z.; Liu, H.; Zhao, Y.; Wang, Q.; Wu, Z.; Deng, L.; Gao, H. Effects of rainfall intensity, slope angle, and vegetation coverage on the erosion characteristics of Pisha sandstone slopes under simulated rainfall conditions. Environ. Sci. Pollut. Res. 2020, 27, 17458–17467. [Google Scholar] [CrossRef]
  57. Dos Santos, J.C.N.; de Andrade, E.M.; Medeiros, P.H.A.; Guerreiro, M.J.S.; de Queiroz Palácio, H.A. Effect of rainfall characteristics on runoff and water erosion for different land uses in a tropical semiarid region. Water Resour. Manag. 2017, 31, 173–185. [Google Scholar] [CrossRef]
  58. Zhao, B.; Zhang, L.; Xia, Z.; Xu, W.; Xia, L.; Liang, Y.; Xia, D. Effects of rainfall intensity and vegetation cover on erosion characteristics of a soil containing rock fragments slope. Adv. Civ. Eng. 2019, 2019, 7043428. [Google Scholar] [CrossRef]
  59. Sidle, R.C.; Ziegler, A.D.; Negishi, J.N.; Nik, A.R.; Siew, R.; Turkelboom, F. Erosion processes in steep terrain—Truths, myths, and uncertainties related to forest management in Southeast Asia. For. Ecol. Manag. 2006, 224, 199–225. [Google Scholar] [CrossRef]
Figure 1. Study area. Map of Japan and Aichi prefecture were drawn via the software R v.4.0.3 using packages “maps”, “mapdata”, and “mapproj”. Map of AEF and contours were obtained from the archives of the Ecohydrology Research Institute [28].
Water 13 01205 g001
Figure 2. (a) Denuded state in 1924, (b) regenerated forest cover in 2021. Red dot is reference point.
Water 13 01205 g002
Figure 3. Gradual forest recovery in the Ananomiya experimental forest area. (a) White areas are bare and exposed weathered granite subsoil. (b,c) show gradual forest recovery—corresponding to the reducing bare (white) areas. The reference point (red dot) is the same as in Figure 2.
Water 13 01205 g003
Figure 4. Experimental plots. Treatments were applied to the shaded area (larger than plot B).
Water 13 01205 g004
Figure 5. State of plot B in (a) no treatment (NT) phase; (b) litter removed before clearcutting (LRBC) phase; and (c) after clearcutting (AC) phase.
Water 13 01205 g005
Figure 6. Monthly runoff in plot A, B and precipitation in the different phases.
Water 13 01205 g006
Figure 7. Flow-duration curve of plot A and B in the NT, LRBC, and AC phase.
Water 13 01205 g007
Figure 8. Rainfall-surface runoff plots.
Water 13 01205 g008
Figure 9. Surface runoff in plot B vs. surface runoff in plot A.
Water 13 01205 g009
Figure 10. Treatment effects.
Water 13 01205 g010
Figure 11. Surface runoff against the 11-day antecedent precipitation index (API11).
Water 13 01205 g011
Figure 12. Reduction in rainfall threshold for the initiation of surface runoff. Rainfall threshold in plot B (θPSR_B) was normalised by rainfall threshold in plot A (θPSR_A).
Water 13 01205 g012
Table 1. General statistics in the NT, LRBC, and AC phases.
ParameterNo TreatmentLitter Removal before ClearcutAfter Clearcut
Plot APlot BPlot APlot BPlot APlot B
Rainfall, P (mm)519.01993.51194.0
Total runoff, Q (mm)22.412.333.088.810.1113.7
Runoff ratio, C0.0430.0240.0170.0450.0080.095
Normalised runoff ratio, CN0.5582.64711.875
n205442
min (mm)0.1350.0740.0540.0490.0540.123
max (mm)4.0272.4203.56814.8401.16211.235
mean (mm)1.1200.6150.6121.6440.2412.707
SD (mm)1.1020.7080.6352.2640.2432.430
Freq. QB: Freq. QA, TB/A0.9772.2927.250
Publisher’s Note: MDPI stays neutral with regard to jurisdictional claims in published maps and institutional affiliations.

