
Testing of an Optimization-Simulation Model for Real-Time Flood Operation of River-Reservoir Systems


School of Sustainable Engineering and the Built Environment, Arizona State University, Tempe, AZ 85281, USA
*
Author to whom correspondence should be addressed.
Water 2021, 13(9), 1207; https://doi.org/10.3390/w13091207
Submission received: 27 February 2021
/
Revised: 2 April 2021
/
Accepted: 20 April 2021
/
Published: 27 April 2021
(This article belongs to the Section Hydrology)
Abstract
:A new methodology was developed for the real-time determination gate control operations of a river-reservoir system to minimize flooding conditions. The methodology is based upon an optimization-simulation model approach interfacing the genetic algorithm within MATLAB with simulation software for short-term rainfall forecasting, rainfall–runoff modeling (HEC-HMS), and a one-dimensional (1D), two-dimensional (2D), and combined 1D and 2D combined unsteady flow models (HEC-RAS). Both real-time rainfall data from next-generation radar (NEXRAD) and gaging stations, and forecasted rainfall are needed to make gate control decisions (reservoir releases) in real-time so that at time t, rainfall is known and rainfall over the future time-period (Δt) to time t + Δt can be forecasted. This new model can be used to manage reservoir release schedules (optimal gate operations) before, during, and after a rainfall event. Through real-time observations and optimal gate controls, downstream water surface elevations are controlled to avoid exceedance of threshold flood levels at target locations throughout a river-reservoir system to minimize the damage. In an example application, an actual river reach with a hypothetical upstream flood control reservoir is modeled in real-time to test the optimization-simulation portion of the overall model.
1. Introduction
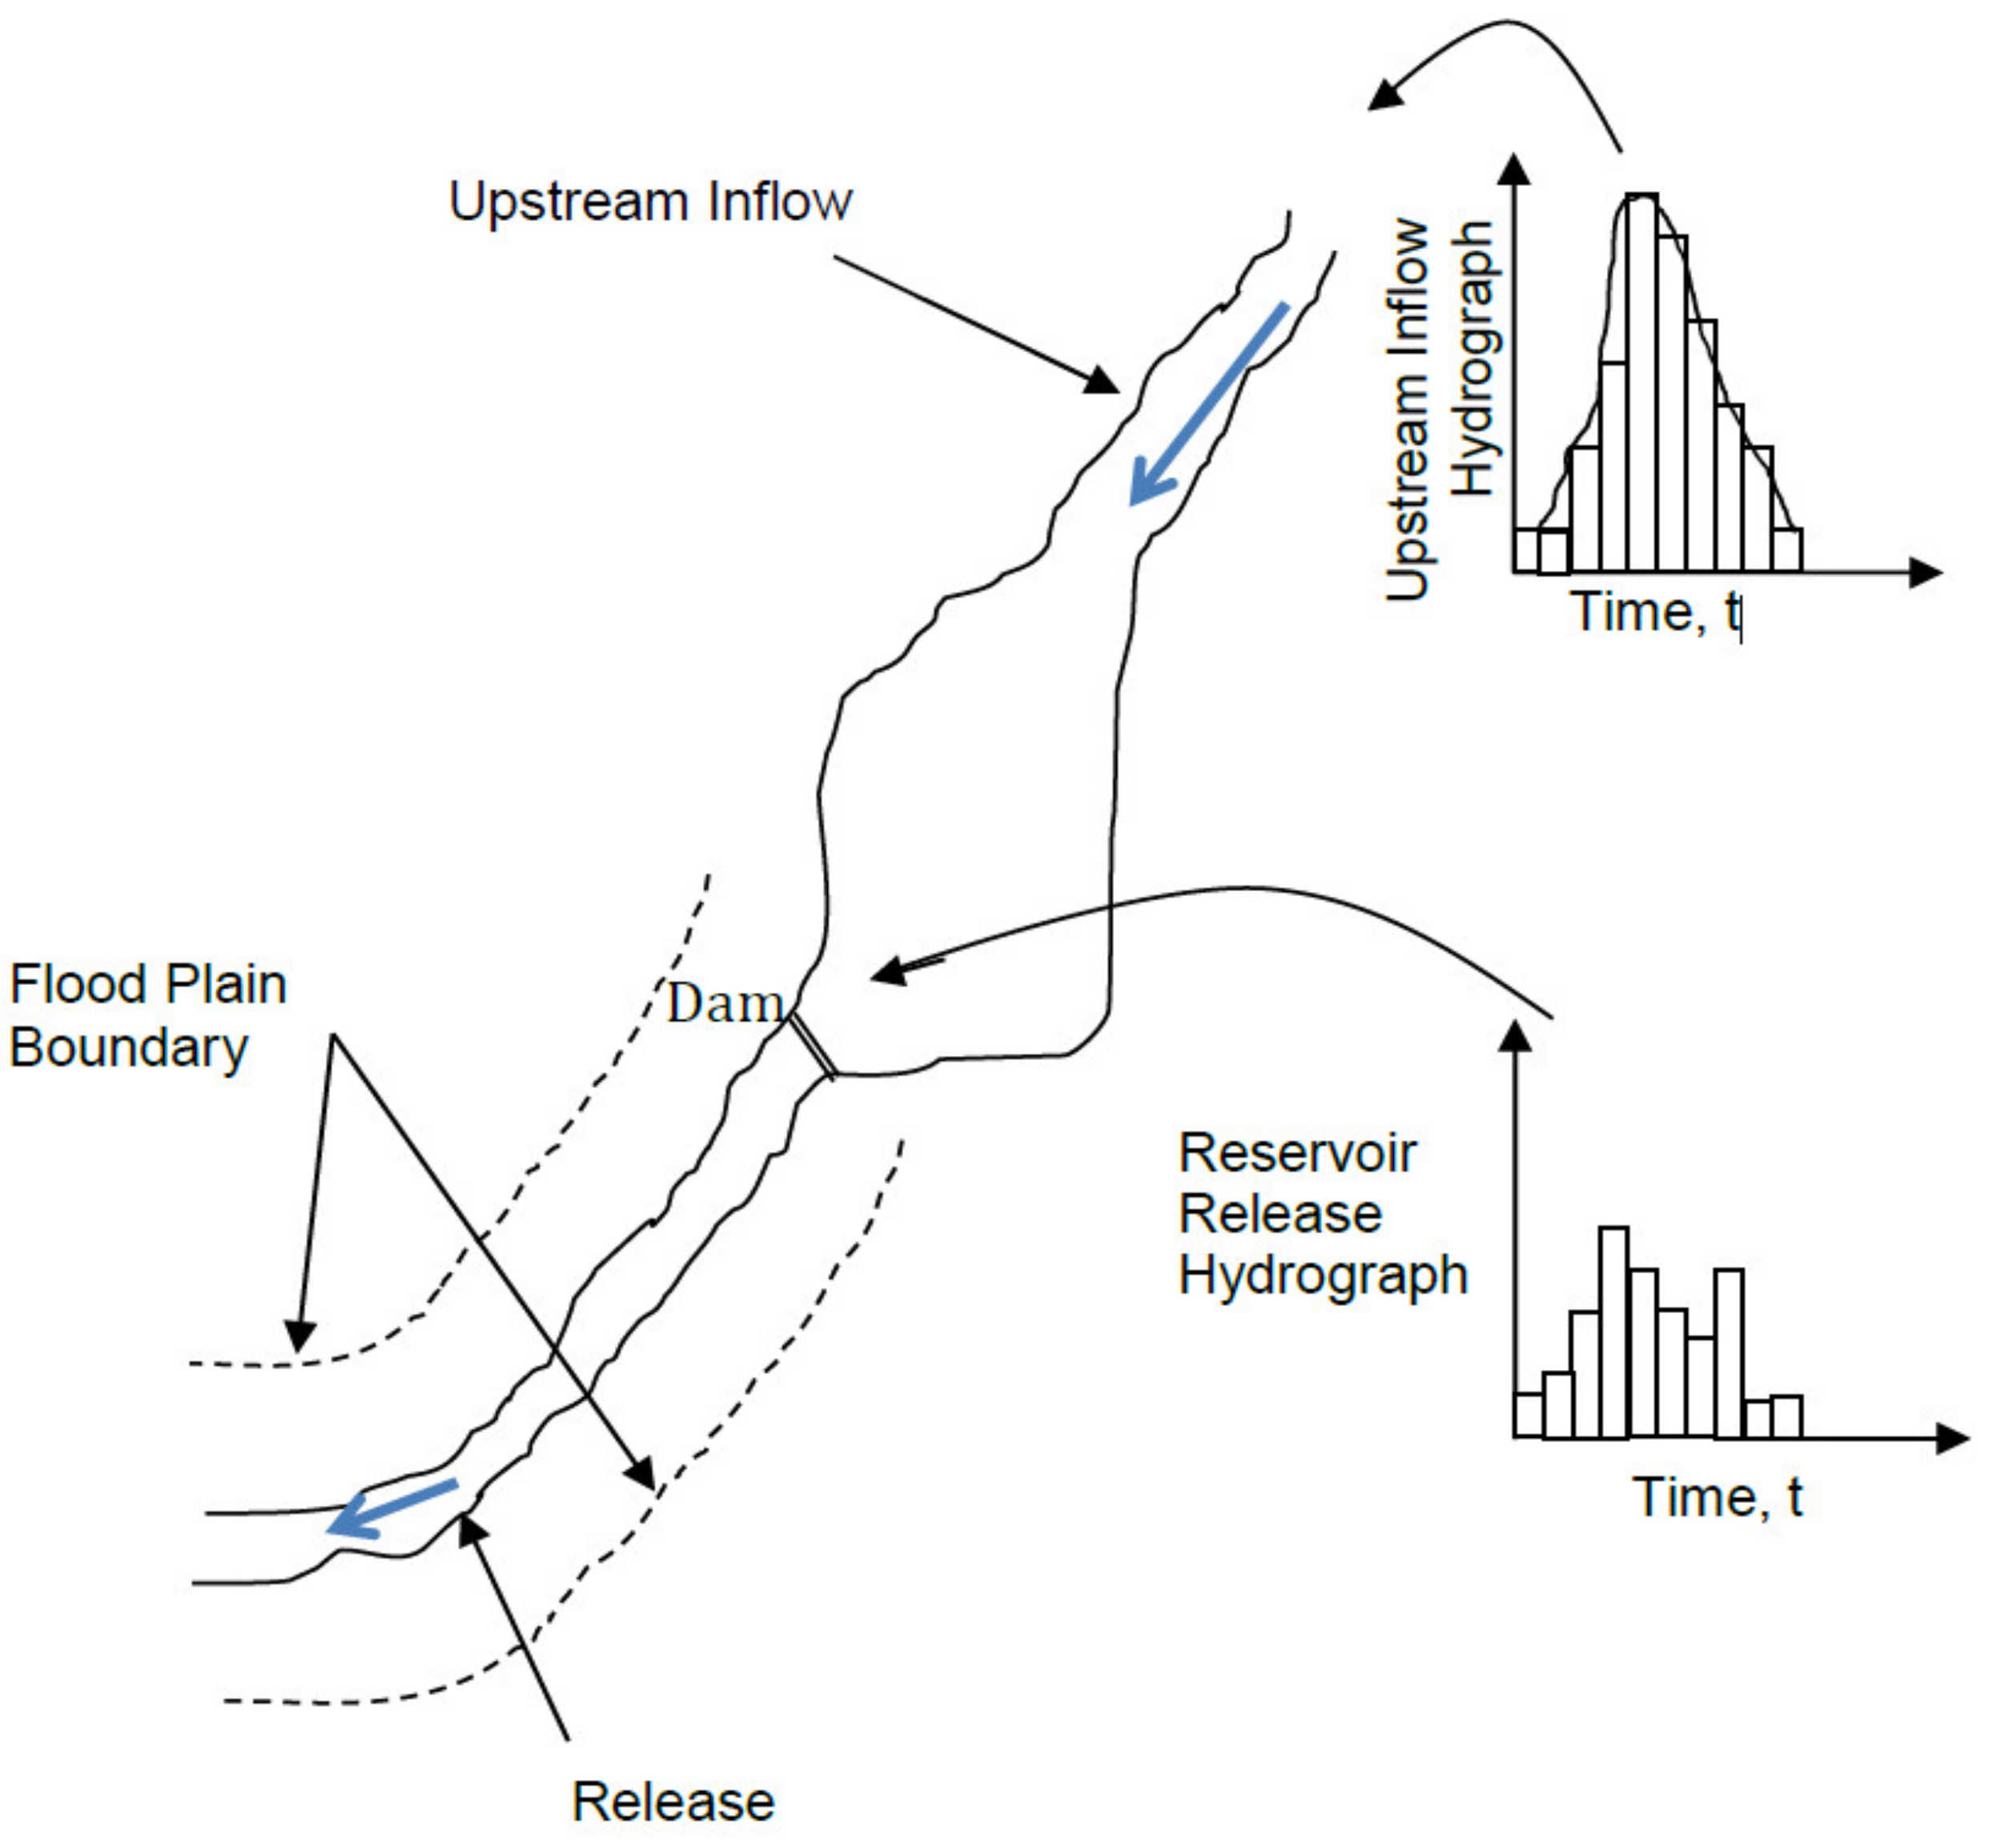
Flooding is a critical issue around the world, and the lack of comprehensive knowledge of watershed hydrology and tools for the real-time operation of river-reservoir systems can result in a lack of lead-time for flood warning and expensive harm to property as well as life. Extreme rainfall, dam breaches, and snowmelt can result in flows exceeding the capacity of the river-reservoir system, resulting in inundation of land downstream. Floods affect millions of people and their properties all over the world. Over the years, humans succeeded partially in diminishing the effect of floods by constructing dams on rivers, and they developed these structures to control flood water by adding more facilities. Flood management includes planned management and real-time management. The modeling approach developed herein focuses on the real-time management of river-reservoir systems (see Figure 1). Real-time flood management requires real-time inflow data to determine releases from control facilities. Sometimes, inflow data may not be available during the event, so forecasting the required data for the short-term depending on the availability is required. The modeling approach focuses on the flooding caused by large rainfall events that require immediate responses in real-time. Flood forecasting studies endeavor to produce, as accurately as possible, future estimates of discharges from a reservoir-river system based on the present state, forecasted rainfall, and the past behavior of the river-reservoir system (Mays [1]).
The estimations of flood forecasts regarding quantity and time grew with the acknowledgment of the consequence of flood warning as a contribution to flood management, implying that the conventional methods of simple or basic extrapolation of forecasts from gauged sites are no longer sufficient. The occurrence of numerous severe events has resulted in numerous national flood forecasting and warning centers. These warning centers have contributed to enhancing the development of monitoring networks, particularly for flood forecasting and warning purposes.
In May 2010, portions of the Cumberland River Basin in the USA experienced a 36 h rainfall that produced record flooding. Officials estimated the storm to be far greater than a 1000-year rainfall event. Catastrophic flooding occurred in greater Nashville, Western Kentucky, and Central Tennessee from 1 to 4 May 2010. The rainfall event began with heavy rainfall on Saturday, 1 May followed by a second period of heavy rainfall on Sunday 2 May, resulting in flooding to record levels in Nashville. Throughout the weekend and into the following Monday morning, the Nashville gage rose more than 33 ft, cresting at more than 52 ft on Monday night and Tuesday, 3 May. Consequently, record releases were made at the U.S. Army Corps of Engineers (USACE) projects on the river, including the Old Hickory Dam just 25 miles upstream of Nashville, causing extreme flooding of the Nashville area. In fact, during the actual operation by the USACE, the Old Hickory Dam was nearly overtopped. The USACE had no simulation or optimization models or rainfall–runoff models to adequately determine the potential flooding caused by the timing and amount of reservoir releases (gate operations) of the Old Hickory dam. Che and Mays [2] applied their simulation/optimization model for the real-time flood control of the operation of river-reservoir systems and illustrated the severity of the actual operation and the need for a real-time optimal operation model.
2. Previous Optimization/Simulation Models for Real-Time Flood Control Operation
There have been many reservoir operation models based upon optimization that have been developed over the years that include flood control as one of their purposes, as reviewed in detail by Che and Mays [3]. However, there have been only a very few optimization models that consider the real-time operation of river-reservoir systems. There have been even fewer models that interface simulation models (a) for rainfall–runoff analysis using both actual rainfall and predicted short-term future rainfall and (b) for unsteady flow propagation of floods through river-reservoir systems. The approach discussed in this paper is such an operation model.
Unver et al. [4] developed a model for the real-time flood management of the Highland Lakes system in Texas. This model did not include an optimization model but did utilize the U.S. National Weather Service (NWS) unsteady flood-routing simulation dynamic wave operation (DWOPER) model interfaced with an operations model and a data management module. An optimization/simulation modeling methodology for real-time optimal flood control operation of river-reservoir systems was later developed by Unver and Mays [5], which was based upon interfacing the nonlinear optimization model, generalized reduced gradient (GRG2), and the U.S. National Weather Service unsteady flood-routing simulation model (DWOPER). Ahmed and Mays [6] interfaced the unsteady 1D flow routing U.S. Geological Survey (USGS) simulation full equation (FEQ) model and a simulated annealing optimization approach for the optimal operation of river-reservoir systems.
Che and Mays [2,3] developed a modeling approach consisting of five major components: (1) the U.S. Army Corps of Engineers (USACE) Hydrologic Engineering Center-Hydrologic Modeling System (HEC-HMS), which simulates rainfall–runoff processes of watershed systems; (2) the U.S. Army Corps of Engineers Hydrologic Engineering Center-River Analysis System (HEC-RAS) for 1D unsteady flow routing; (3) a reservoir release operation model; (4) a short-term rainfall forecasting model to project rainfall over the next few hours during a rainfall event; and (5) the genetic algorithm (GA) optimizer in Excel interfaced with the other components for determining the operation of river-reservoir systems in real-time. One importance of the Che and Mays [2] application to the flooding of the Nashville area mentioned above indicated the need for the combined 1D and 2D modeling of the flooding.
More recently, Nguyen [7] proposed a methodology based upon interfacing three major components: (1) a hydraulic 1D model for simulating the flows in the river including the reservoir system, (2) an operation reservoir module for simulating the multi-reservoir considering physical constraints of the system as well as operation strategies, and (3) an optimization model (Shuffled Complex Evolution algorithm) applied to optimize spillway gates operation. The methodology was applied to the multi-reservoir system in the Vu Gia Thu Bon catchment in Vietnam. Xu et al. [8] developed an inflow flood forecasting based on a distributed hydrological model for the Baipenzhu Reservoir in the Guangdong Province of China.
There are a wide range of GA applications in the literature of optimization problems in hydrology such as water resource management, reservoir operations, groundwater management modeling, and calibration and distributed and conceptual models for rainfall–runoff analysis as pointed out by Nicklow et al. [9], Yoo and Kim [10], and Kawamura and Merebtene [11]. Chiang and Willems [12] combined evolutionary optimization, a genetic algorithm (GA), with a model predictive control (MPC) technique to develop and test a real-time flood control method. They applied this model to the flood operation of 12 gated weirs of the Demer River in Belgium. Kawamura and Merebtene [11] provide an excellent summary of the importance and use of evolution computing, in particular genetic algorithms, for hydrologic systems and water resources management.
Recent research on new reservoir operation models reported in the literature has focused somewhat on the risk-based models for the real-time flood control of control operations of reservoirs. Chen et al. [13] developed a risk-based model for real-time flood control operation of reservoirs under emergency conditions and uncertainties, consisting of three modules: generation of emergency scenarios, Monte Carlo simulations, and risk analysis. The emergency scenarios included extreme floods and the failure of the spillways of reservoirs. Sun et al. [14] proposed a risk analysis model for reservoir real-time optimal operation using the scenario tree-based stochastic optimization method. Neither of these two models interfaces optimization and simulation to solve an optimal control problem for determining real-time gate control operations of river-reservoir systems.
None of these more recent forecasting risk-based models have the capabilities of the model described herein, as illustrated in the model formulation described below.
3. Model Formulation
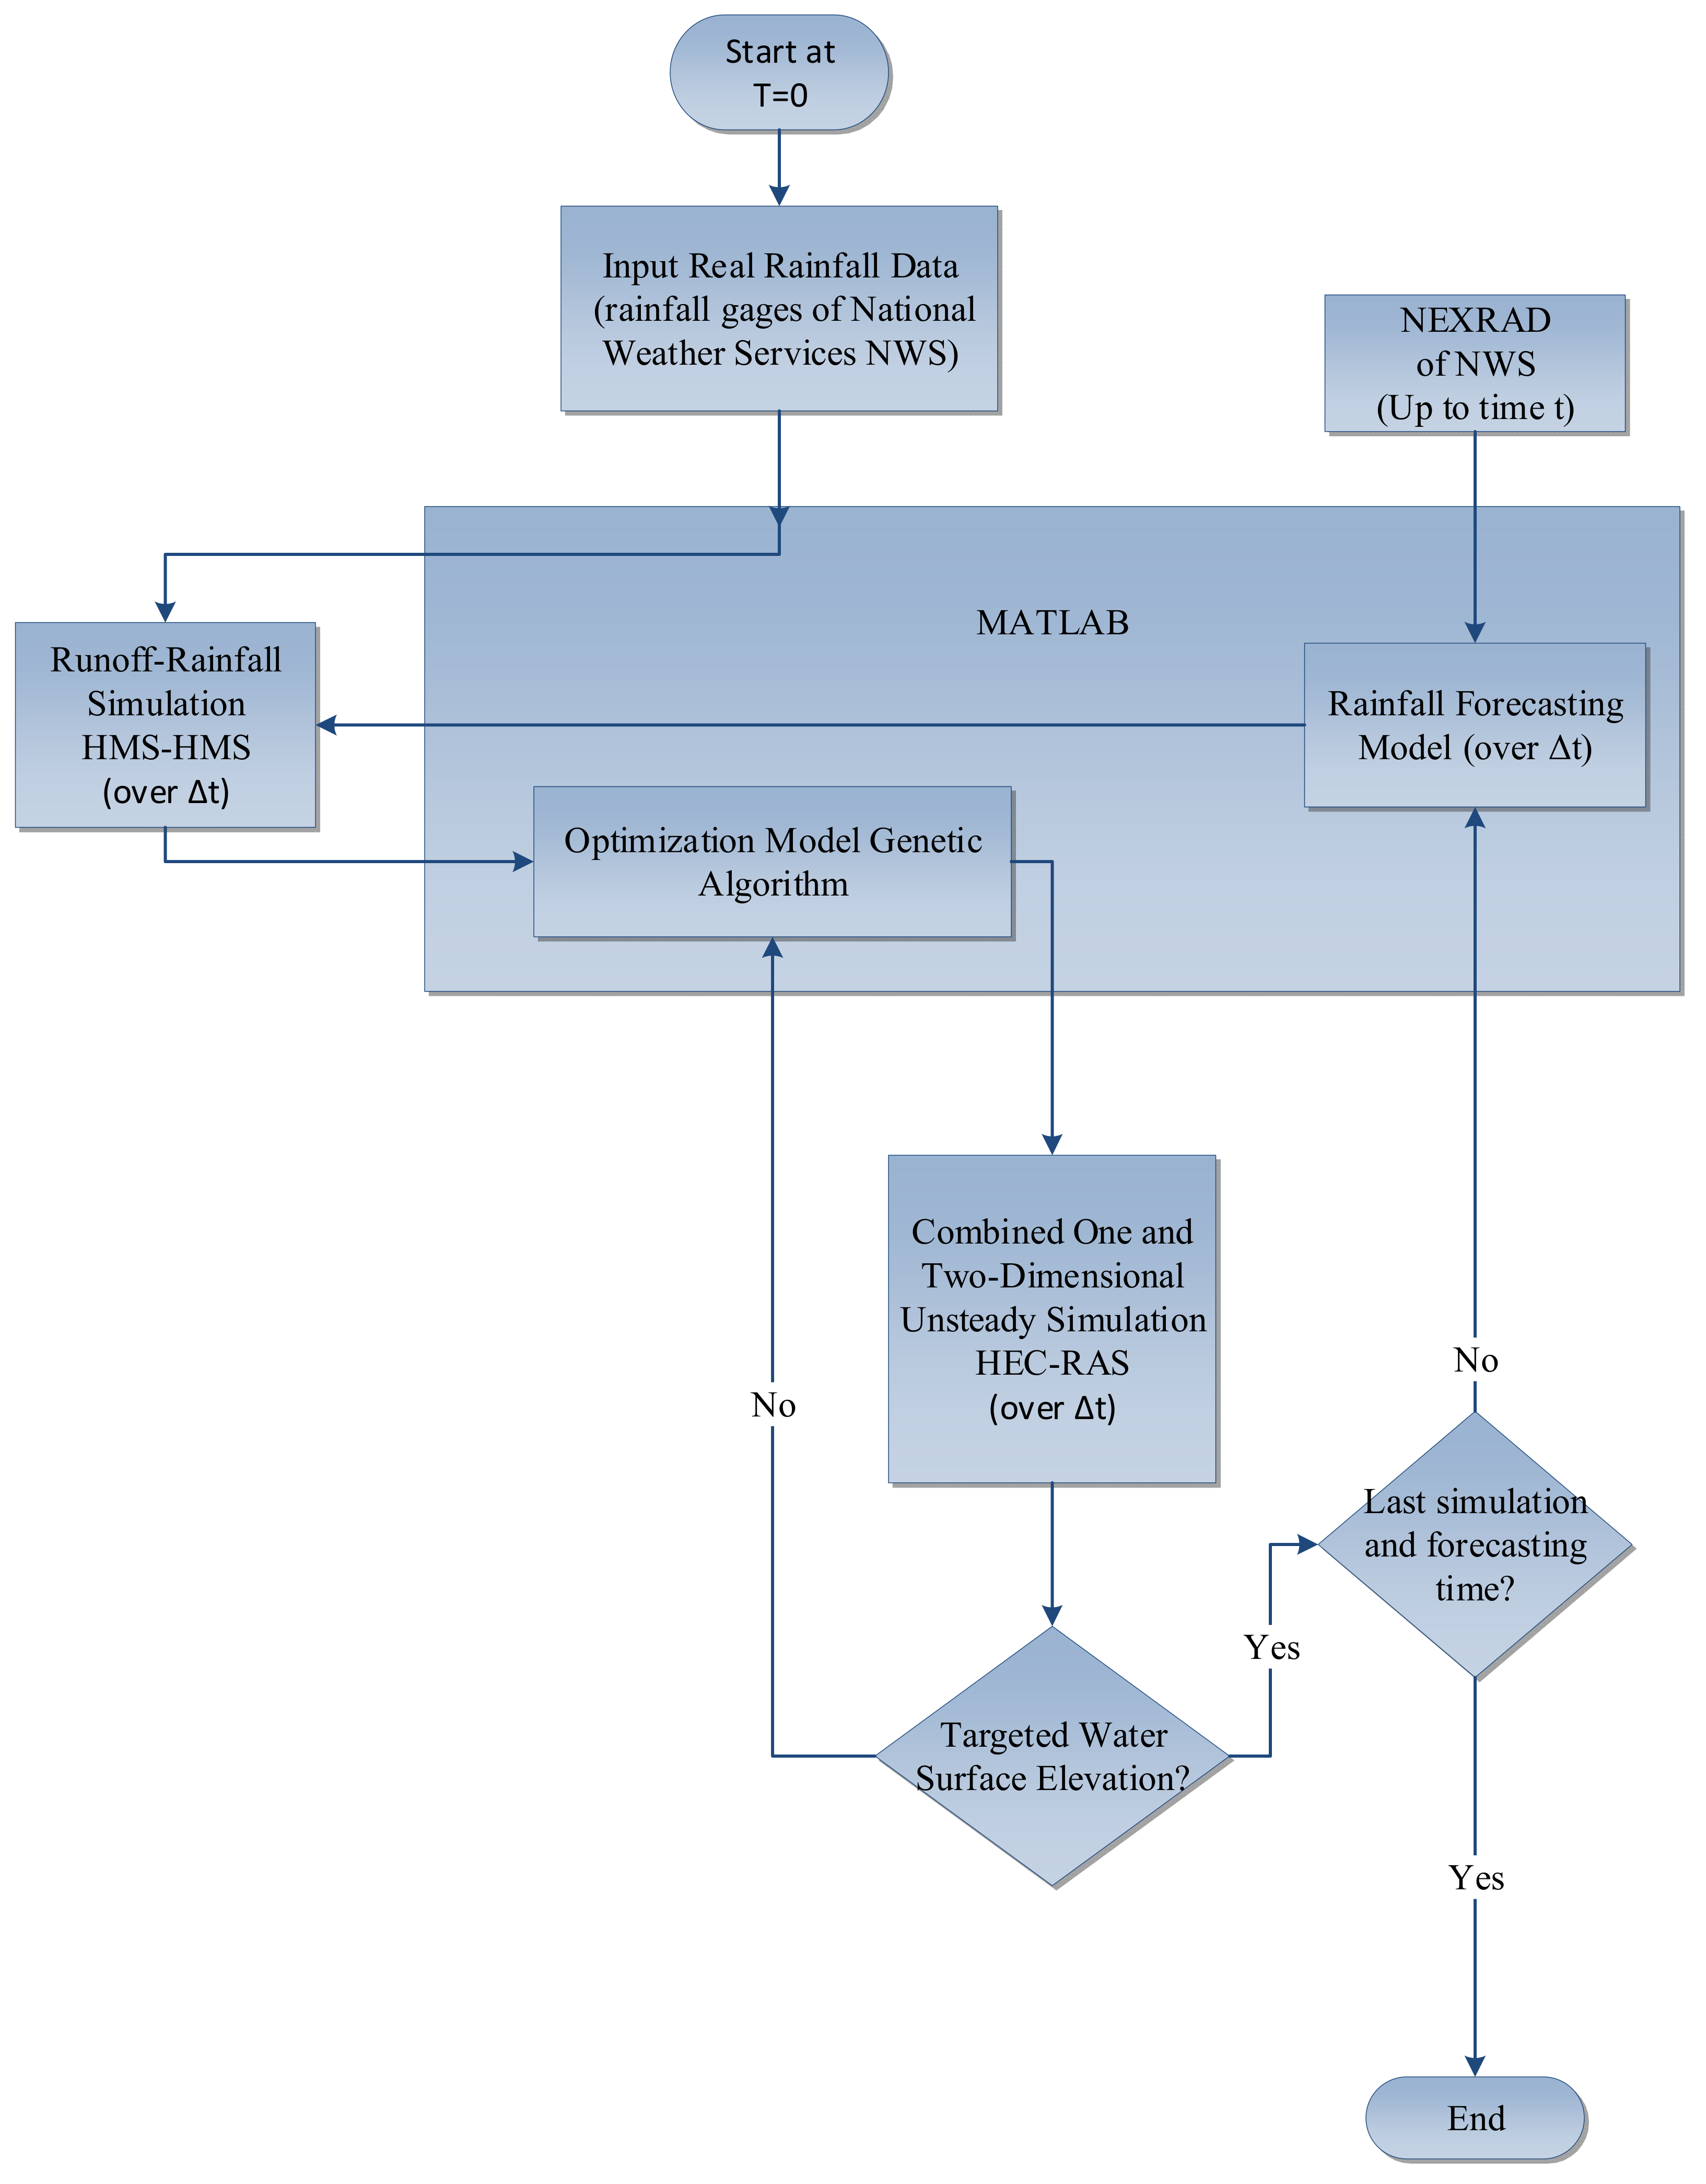
The proposed optimization-simulation model consists of four individual models (interfaced through MATLAB) that make up the larger simulation model as follows: a short-term rainfall forecasting model, a rainfall–runoff mode (HEC-HMS) l, 1D and/or 2D unsteady flow model (HEC-RAS), reservoir operation model, and a genetic algorithm optimization model. Figure 2 illustrates the interconnection of the models.
The overall mathematical formulation is a real-time optimal control problem in which reservoir releases represent the decision variables. The known real-time rainfall input is used as the actual rainfall up to the time of decision making. The model also generates forecasted precipitation using real-time rainfall from a rainfall network of gages or NEXRAD data and measured real-time flood elevations in a river-reservoir system. A methodology for projecting future rainfall within the next few hours was developed as part of the overall methodology. Both measured and forecasted rainfall can be used to run simulations of the watershed rainfall–runoff model, HEC-HMS.
Once the sets of feasible (or optimal) solutions (gate openings, reservoirs releases) are determined, they enter the unsteady flow routing model HEC-RAS to simulate the floods in the river-reservoir system. The main objective of the methodology is to control the flood flows and flood elevations at various locations of a river-reservoir system. One example would be to keep the flow rates or flood elevations at the control point below a certain target, for example, a 100-year flood level. If the objective is not met, the model would repeat its optimization process to determine the reservoir releases until the objective is achieved. Once this occurs, the model moves to the next iteration, in which the updated projected rainfall is used in the rainfall–runoff model (HEC-HMS) to determine the reservoirs’ operation for the next time period. The actual rainfall data are then used to compute the actual watershed runoff, reservoir stages, releases of reservoirs, and the unsteady flows. The processes repeat and continue until the objective is met and all constraints are satisfied for the entire simulation period. The model could be used to start simulating days before the storm events becausethe model can determine the reservoir operation necessary in the system to prepare the floodwaters in the coming days.
To formulate a real-time flood forecasting approach for a river-reservoir system, both meteorological (rainfall) and discharge data are observed and then transmitted to the determining station through a different method of information correspondences. The meteorological and stream data obtained in real-time are then used in the flood forecasting model to estimate the movement of the flood and the corresponding water levels. The lead-time mentioned above ranges from a few hours to days depending on the catchment size and aim of the forecast. The modeling framework should not have excessive input requirements, but at the same time, the forecasted flood should be as accurate as possible. In many cases, river flow modeling based upon 1D flow is problematic for accurately modeling floodplain discharges and water surface elevations, whereas a 2D model or combined 1D and 2D model would be more appropriate. Usually, modeling flow in a network of channels can be performed using 1D modeling. The river flow modeling considered in the modeling approach considers both 1D and 2D unsteady flow modeling using the U.S. Army Corps of Engineers [15] HEC-RAS model.
3.1. Optimization Model
The objective function is to minimize the flow rate at specified control points which minimize the water surface elevations throughout the simulation time so the objective function is expressed as:
where is the flow rate time series or water surface elevation time series at the control-point locations (x, y) of the river-reservoir system that affects the control point location in the downstream 2D area, is the penalty coefficient at control points (cells), and x, y, and t are spatial and temporal indices, respectively. The objective function allows multiple control locations.
Constraints and limitations must also be satisfied which are classified into four main types: hydrologic constraints, hydraulic constraints, bound constraints, and operational constraints.
Hydrologic constraints: represented by the rainfall–runoff relationships defined by the sub-basin areas, rainfall losses due to canopy interceptions, depression storage, soil infiltration, excess rainfall transform methods, watershed runoff routing method, internal boundary conditions, and initial conditions that depict the rainfall–runoff process in different components of a watershed system:
where ( is the matrix of precipitation data in the system, () is the rainfall losses matrix of the watershed system, and ( is the watershed and reach discharge matrix of the system. The hydrologic constraints (Equation (2)) are solved using the HEC-HMS model.
Hydraulic constraints: defined by the Saint-Venant equations for 1D unsteady flow and the 2D form of the unsteady flow equations, in addition to the related relationships of upstream boundary conditions, downstream boundary conditions, external 2D flow area boundary conditions, internal 2D area boundary conditions, and initial conditions that depict the flow in different components of a river-reservoir system,
where ( is the matrix of water surface elevations in the system and () is the discharge matrix of the system. All the hydraulic constraints are in matrix form because the problem has dimensions of space x, y, and time t. Hydraulic constraints are solved using the HEC-RAS model which includes both 1D and 2D capabilities.
Bound constraints: include upper and lower discharge limits that define the maximum and minimum allowable reservoir releases and flow rate at target locations:
The bars above and below the variable denote the upper limit and lower limit for that variable, respectively. Another significant hydraulic constraint is the water surface elevation bounds defined by the allowable upper limit and lower limit at specified locations in the downstream 1D and 2D areas, including reservoir levels:
These constraints are incorporated into the reduced objective function described later.
Operational constraints: include the rules of reservoir operation and releases, reservoir storages and the beginning and the end of the simulation period, reservoir storage capacities, etc., and are also included in the optimization-simulation model.
The above formulated optimization problem is solved using a genetic algorithm in MATLAB. Genetic algorithms iteratively solve unconstrained problems so that constraints (2) are solved by HEC-HMS each time they are evaluated and constraints (3) are solved by the U.S. Army Corps of Engineers HEC-RAS each time they are evaluated. The bound constraints (4)–(6) are placed into the reduced objective function in order to have an unconstrained optimization problem. The following is the reduced (unconstrained) problem that is solved by the genetic algorithm (GA) within MATLAB.
where are penalty weights and the exponent n is greater than one. These penalty weights and exponent n are determined through sensitivity analysis.
The above model formulation is a real-time optimal control problem in which the gate operations defining the reservoir releases are the decision variables. The reduced objective function (unconstrained problem), Equation (7), is not a well-defined continuous function and is amenable to GA solutions when the constraints are solved using the simulation models (HEC-HMS and HEC-RAS) each time the constraints need to be solved. Classical optimization methods such as the simplex method for linear programming and gradient-based methods for nonlinear programming require well-defined functions.Moreover, derivatives of functions are required for nonlinear programming. The genetic algorithm does not require derivatives, nor does it require well-defined continuous functions.
3.2. Unsteady Flow Simulation Model
The U.S. Army Corps of Engineers [15] has introduced the ability to perform two-dimensional (2D) unsteady flow routing in addition to the 1D unsteady flow analysis in the new version of HEC-RAS. Users can now perform one-dimensional (1D) unsteady flow modeling, two-dimensional (2D) unsteady flow modeling, and combined one-dimensional and two-dimensional (1D/2D) unsteady-flow routing. According to Brunner [16], the combined 1D/2D provides the ability to model larger river systems, utilizing 1D modeling where appropriate such as the main river system and 2D modeling in areas that require a higher level of “hydrodynamic fidelity” such as floodplains. For the 2D unsteady flow routing, either the full 2D) Saint-Venant equations or the 2D diffusion wave equations can be employed as described in the U.S. Army Corps of Engineers [15]. The 2D diffusion wave equations allow the software to run faster, and also with greater stability properties, which is important in the type of applications for the optimization-simulation approach used in real-time application to river-reservoir operation tested in this paper. The 2D full Saint-Venant equations are more applicable to a wider range of applications; however, many applications such as the modeling approach developed herein can be accurately modeled with the 2D diffusion wave equations. Because of the optimal control approach described above using the genetic algorithm for optimization, the unsteady flow simulation model is solved many times at each time step of the approach, changing the gate operations, requiring a very large number of times for the unsteady flow model to be solved.
An implicit finite volume solution algorithm is used to solve the 2D unsteady flow equations, allowing for larger computational time steps than explicit methods. Moreover, the approach has other advantages such as improved stability and robustness over traditional finite difference and finite element techniques (Brunner [16]); the wetting and drying of 2D elements is very robust; the 2D flow areas can start completely dry and handle a sudden rush of water into the 2D areas; and the algorithm can handle subcritical, supercritical, and missed flow regimes with flow transitioning through critical depth (e.g., hydraulic jump). The use of a combined 1D/2D model is very important for many applications, as illustrated in the example application described below.
3.3. Short-Term Rainfall Forecasting Model
Short-term forecasting of rainfall is another necessary component in the optimization-simulation model. Forecasted rainfall for the future short term is needed for the rainfall–runoff model at each time interval of the modeling approach. This is used in the rainfall–runoff model for simulating runoff into the short-term future for computing runoffs for the future. A statistical regression analysis approach is used for the rainfall forecasting model based upon an approach following the model presented by Montgomery et al. [17] and previously used by Che and Mays [2]. This rainfall forecasting model is not implemented in the testing application discussed in this paper.
3.4. Rainfall–Runoff Simulation Model
The U.S. Army Corps of Engineers HEC-HMS is the rainfall–runoff simulation model used in the modeling approach as shown in Figure 2. This model is not implemented in the testing application discussed in this paper.
4. Example Application
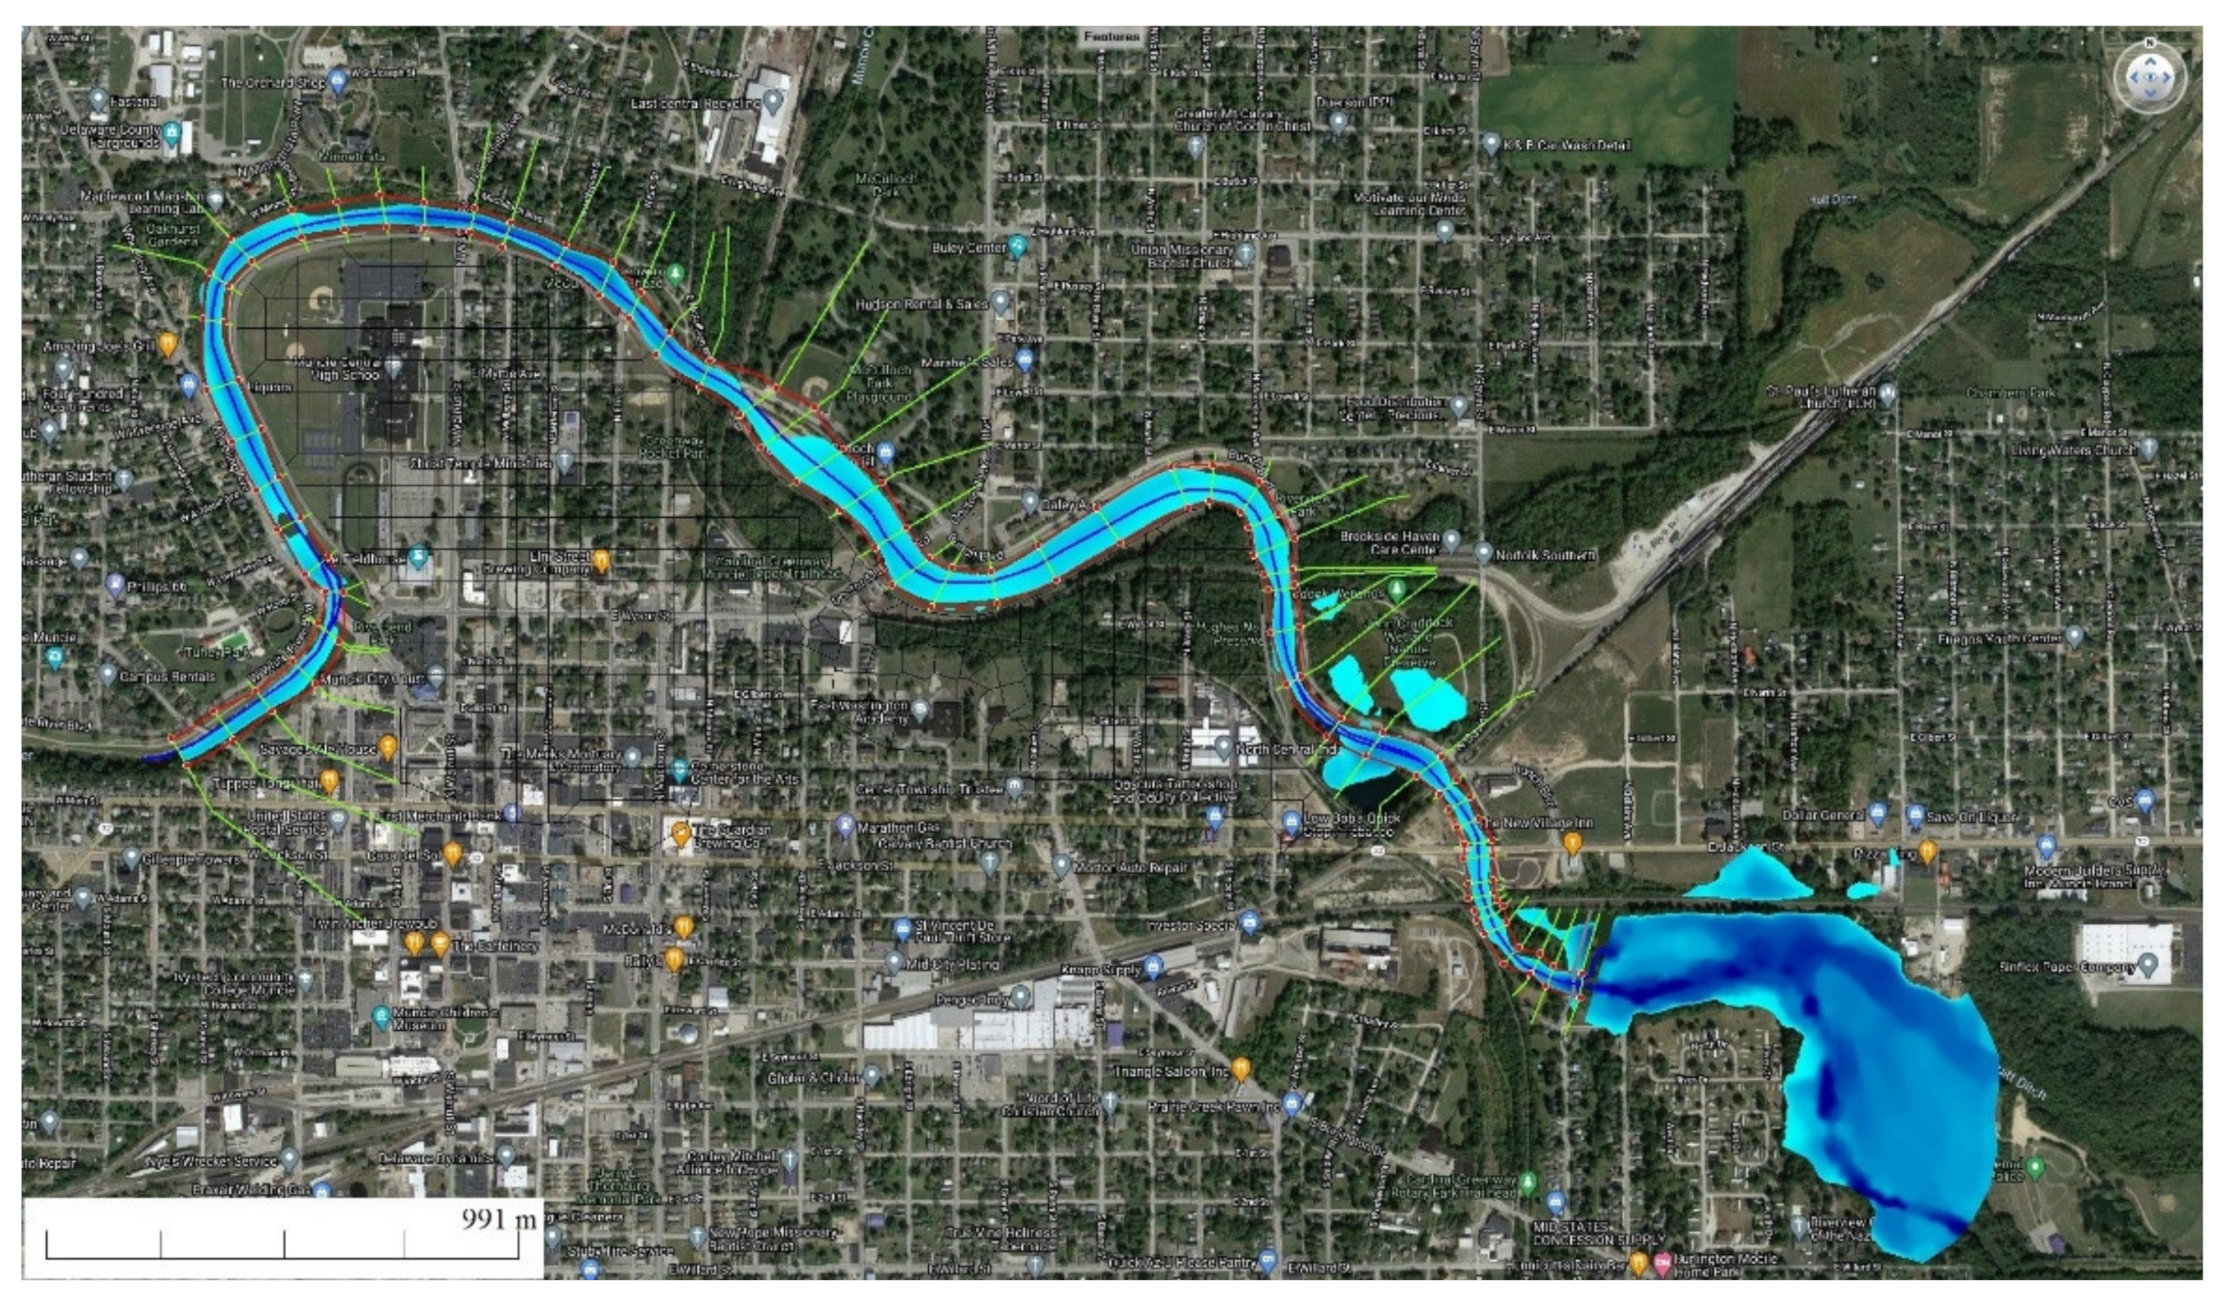
A hypothetical example application, referred to as the Muncie Project (for Muncie, Indiana), is based upon information from Brunner [16]. Muncie is located on the West and East Forks of the White River, which flows through Central and Southern Indiana. The application is designed specifically for testing the optimization-simulation model to determine the optimal operation of the floodgates in a hypothetical reservoir with possible downstream flooding in the river and floodplain of the urban area of Muncie, Indiana. The river reaching downstream of Muncie is real, but the reservoir is hypothetical with one large floodgate as shown in Figure 3. The application assumes a major inflow hydrograph to the hypothetical reservoir so that the HEC-HMS, the rainfall input, and the rainfall forecasting portion of the overall model are not employed in this application. The unsteady flow modeling is performed using the combined 1D unsteady and 2D unsteady (diffusion-wave model) approaches.
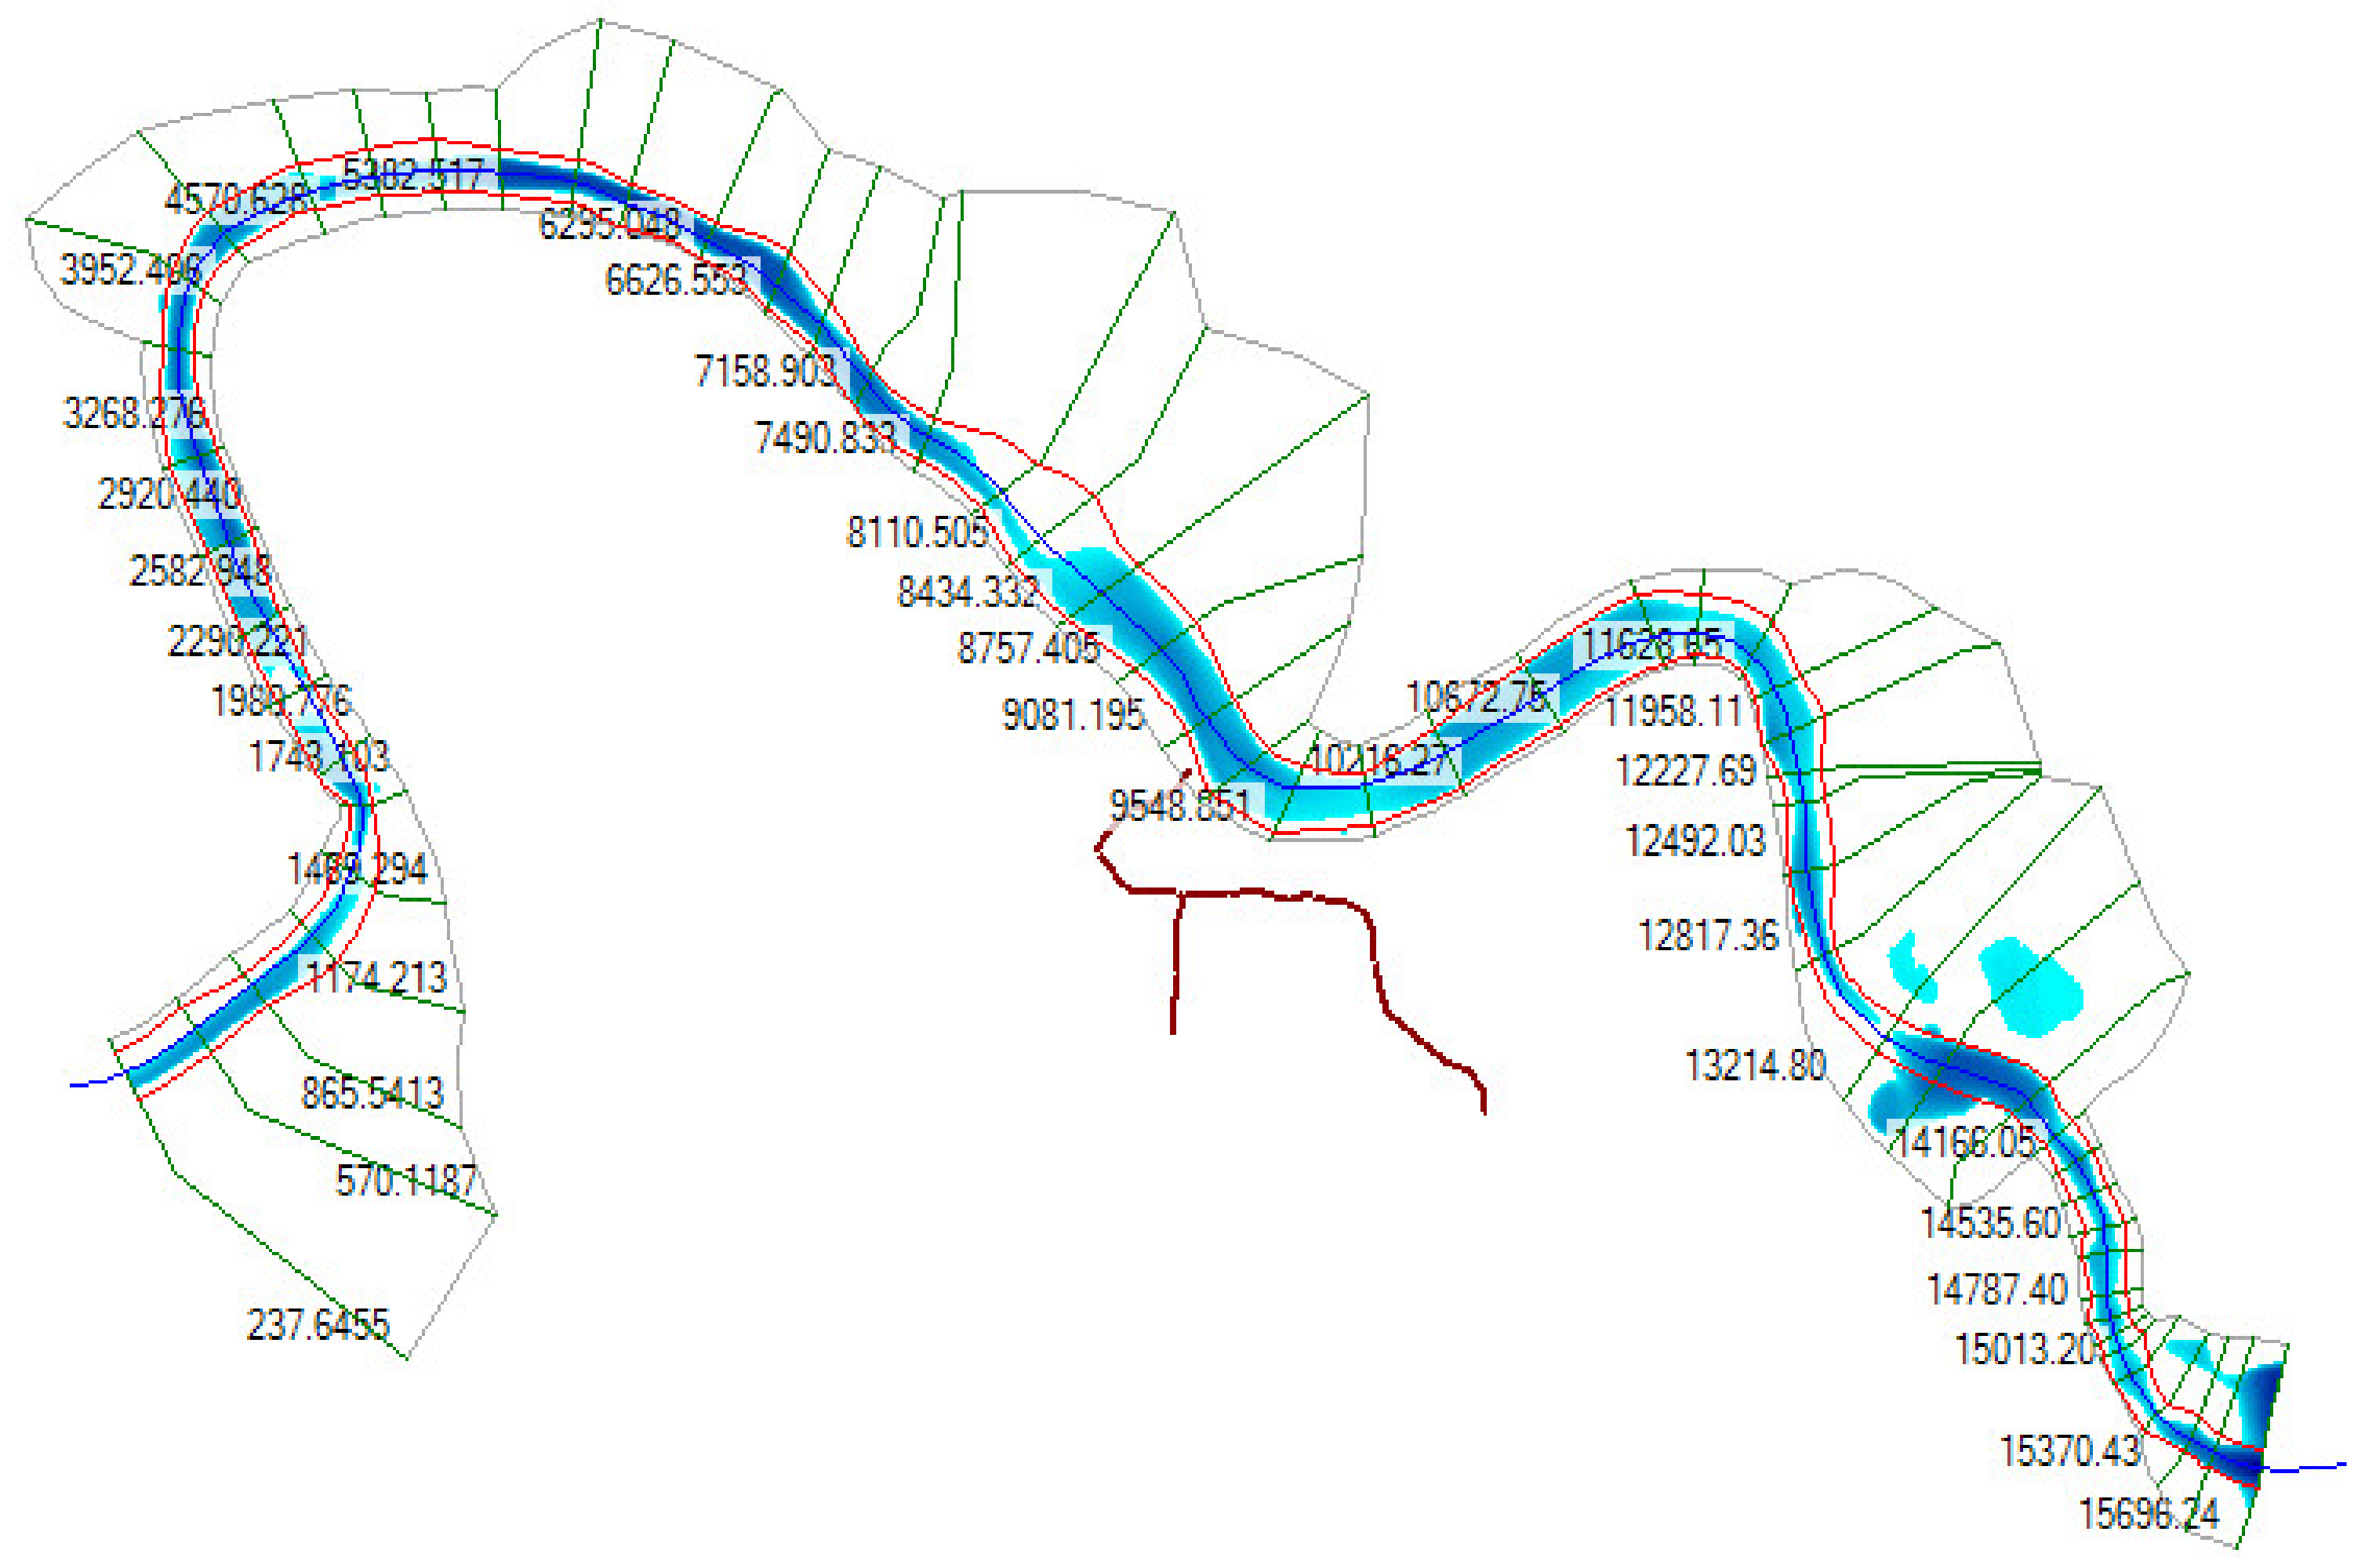
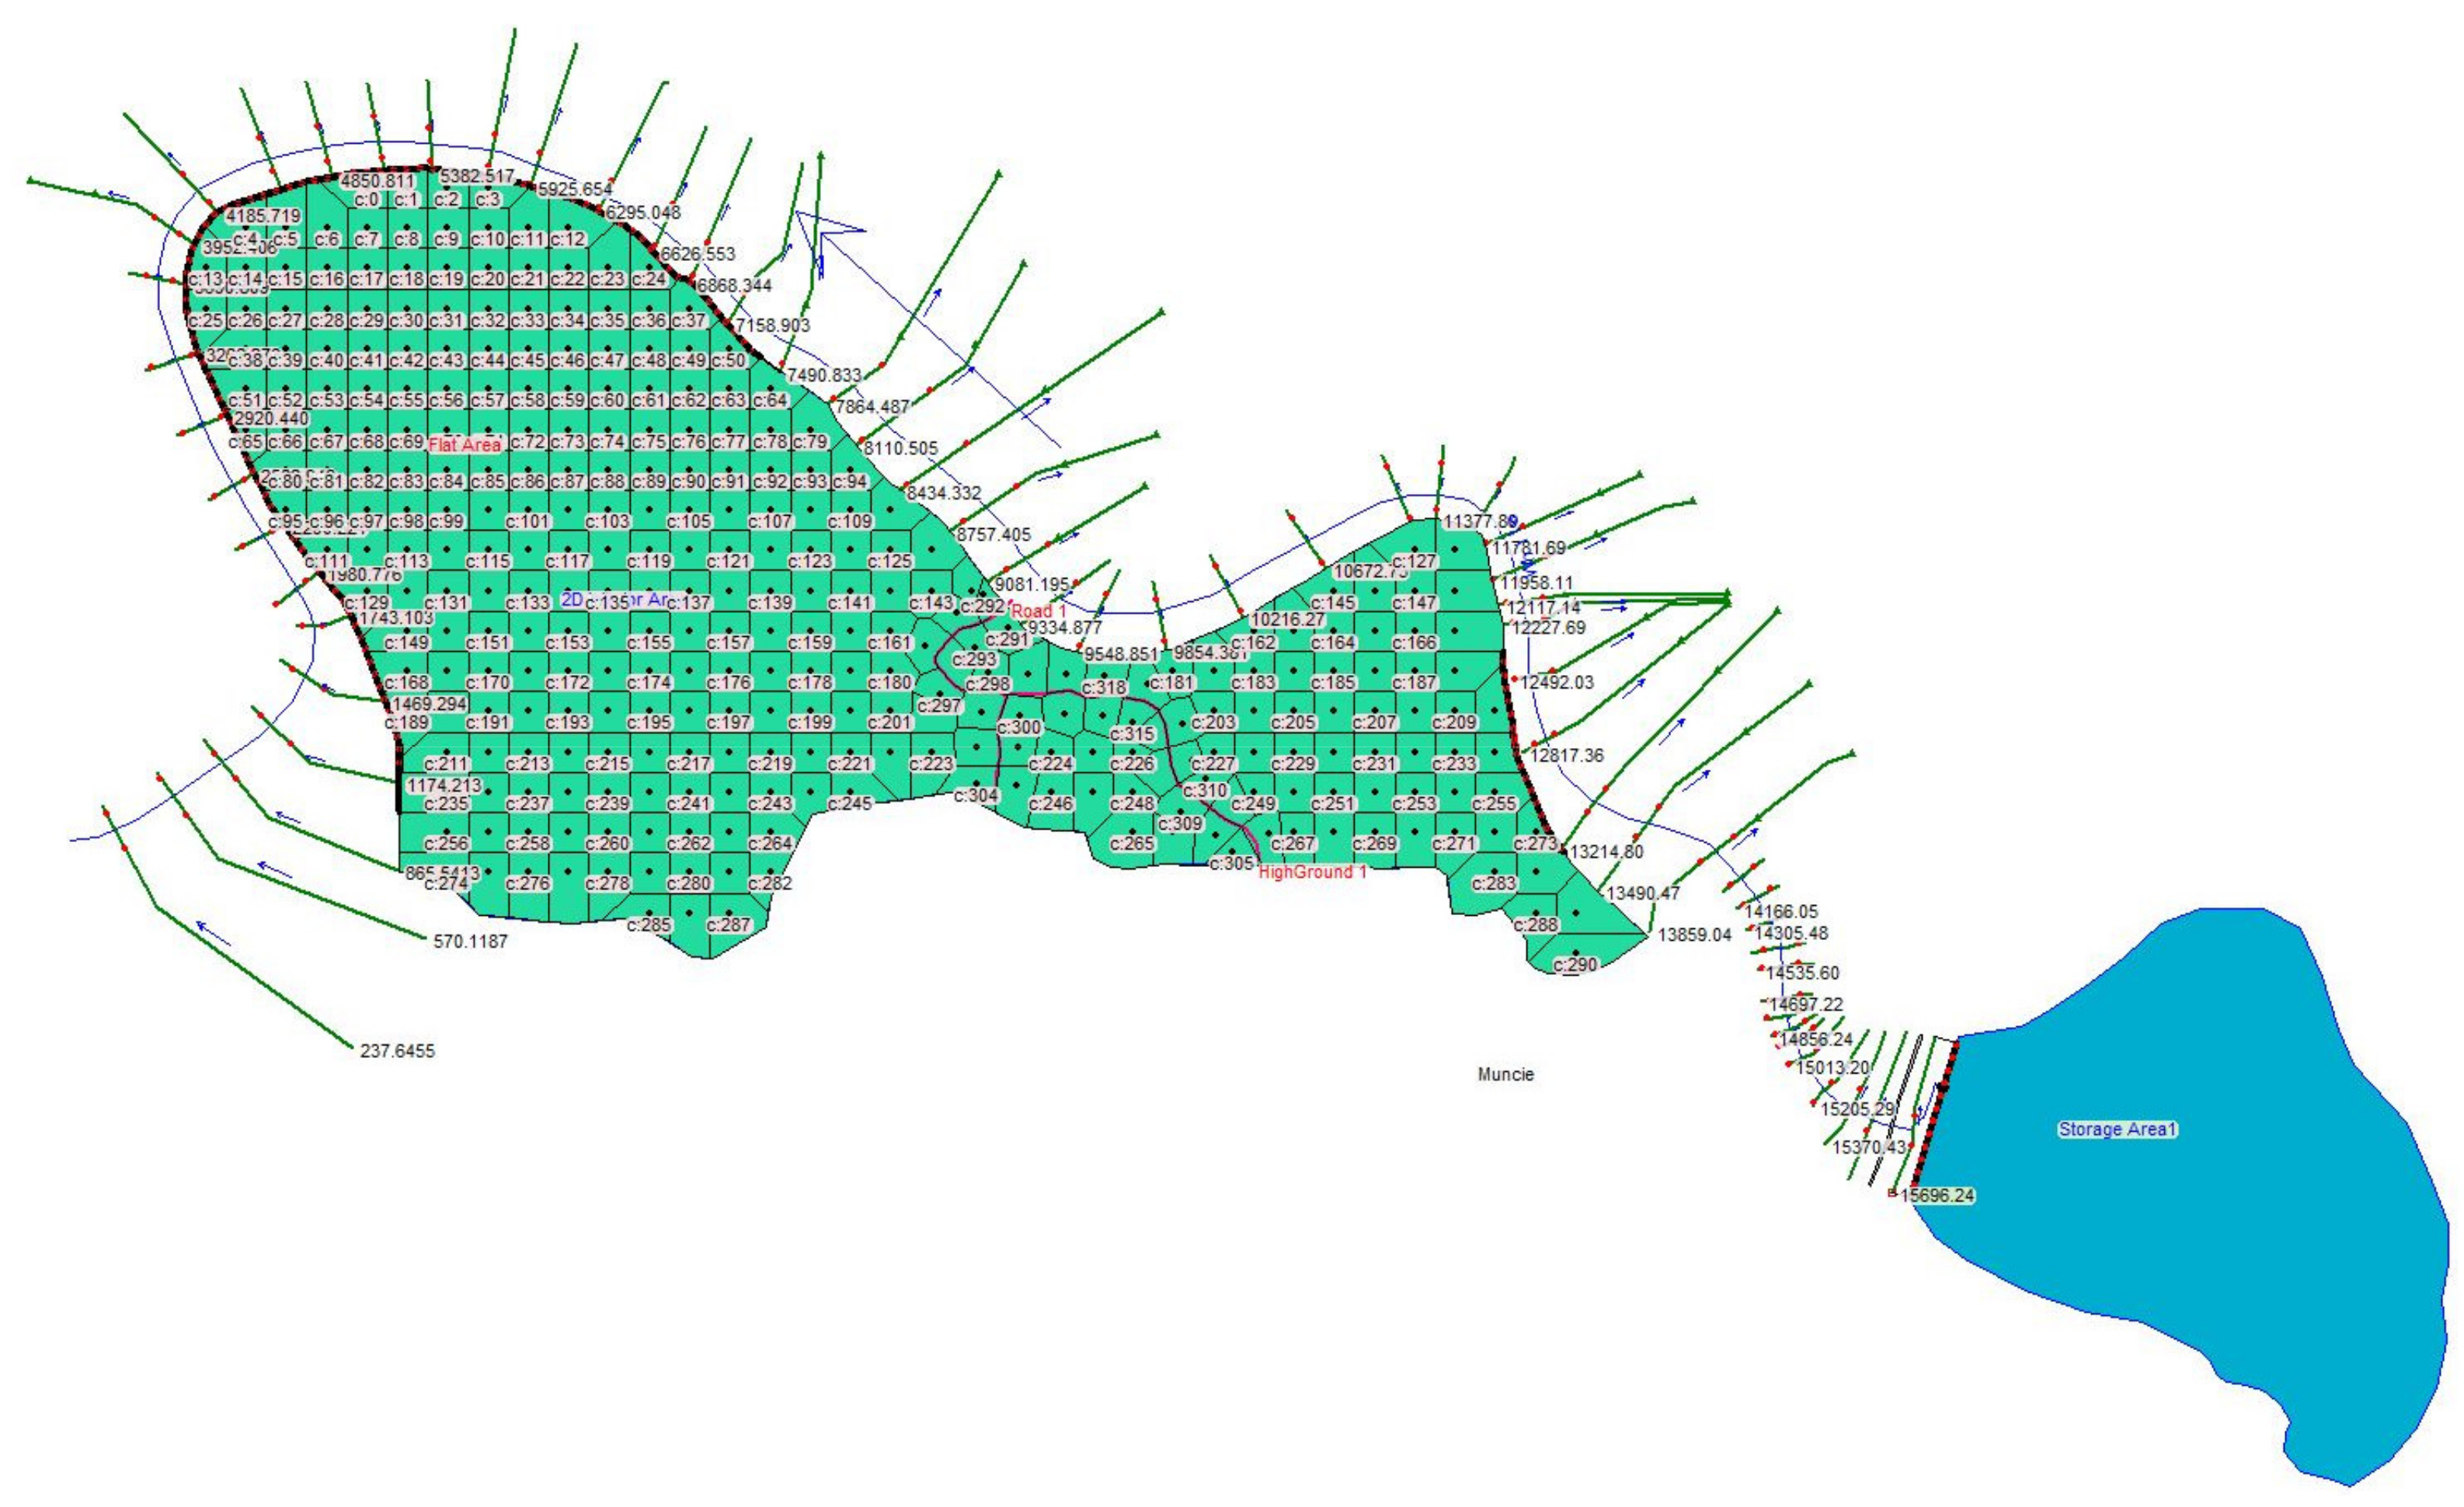
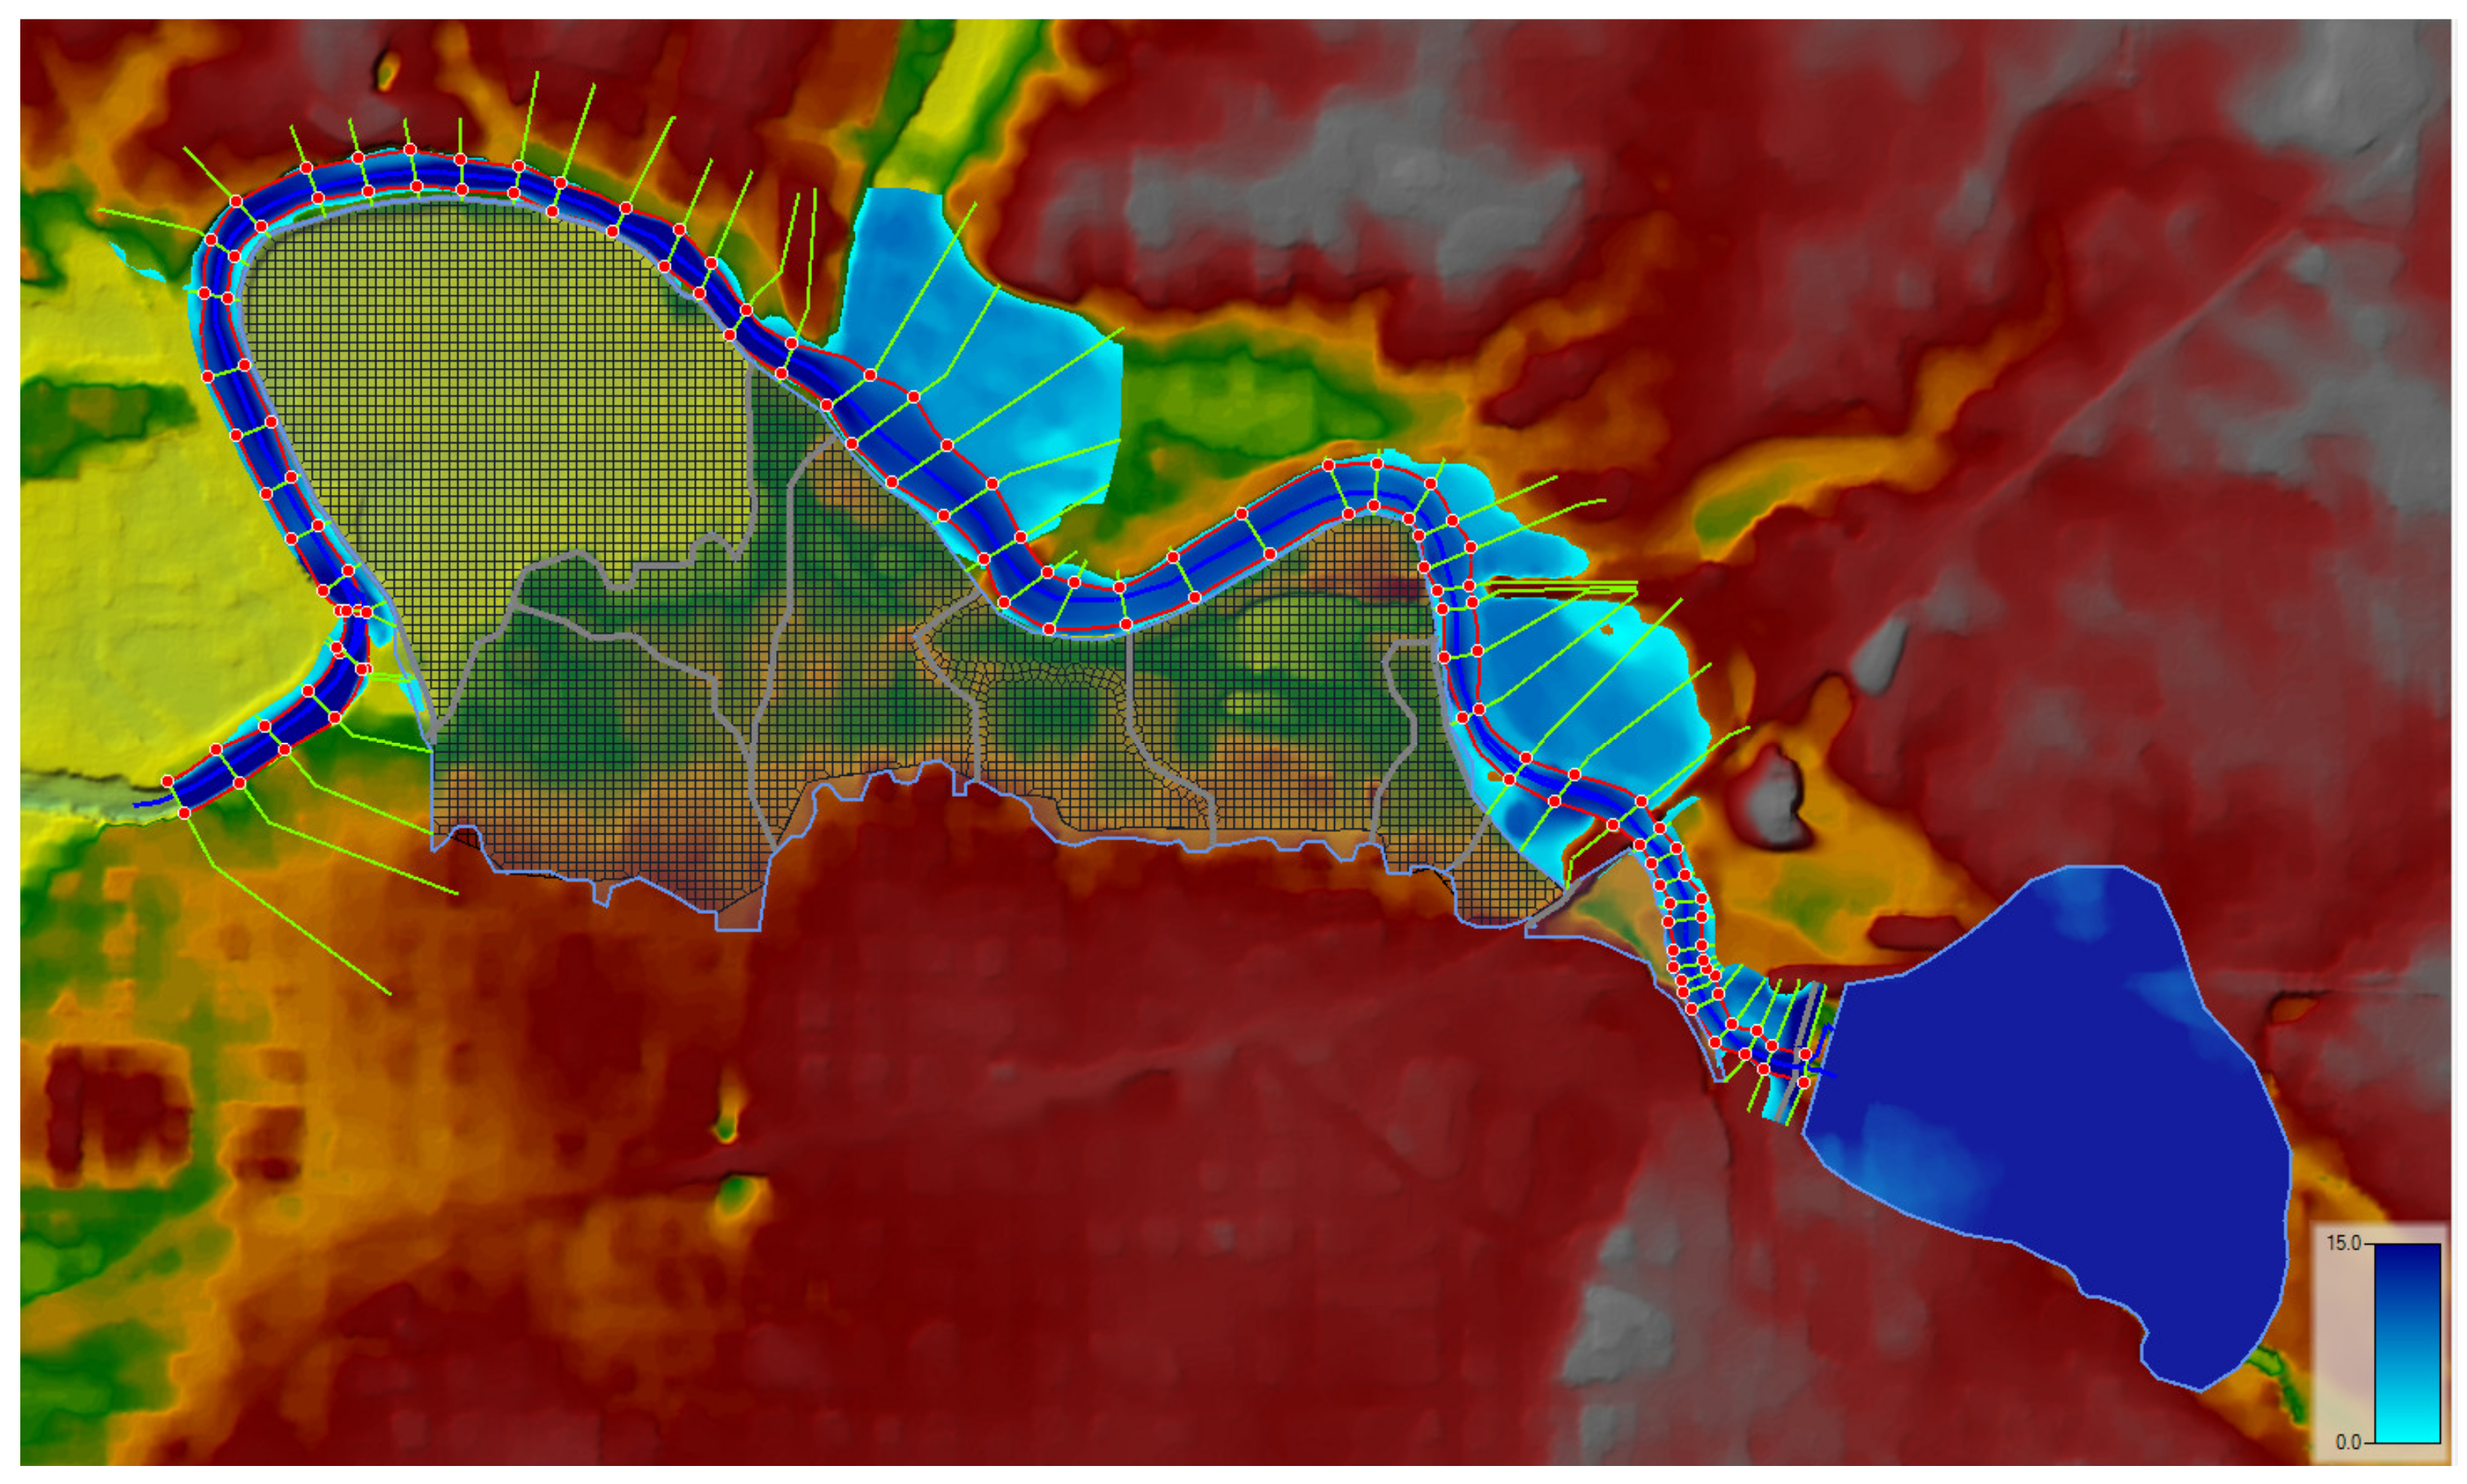
The combined 1D/2D unsteady flow modeling is used with the river reach modeled using the 1D approach (see Figure 4) and the floodplain is modeled using the 2D approach as illustrated in Figure 5. The hypothetical reservoir is connected to the river reach at the very first upstream cross-section (see Figure 5) through a gated spillway in the inline structure. The radial gate is large enough to allow a range of significant discharges for the flooding event. The total gate width is 30 feet with a maximum opening of 21 feet and a discharge coefficient of 0.98. The river channel is assumed to have an initial steady flow of 1000 cfs.
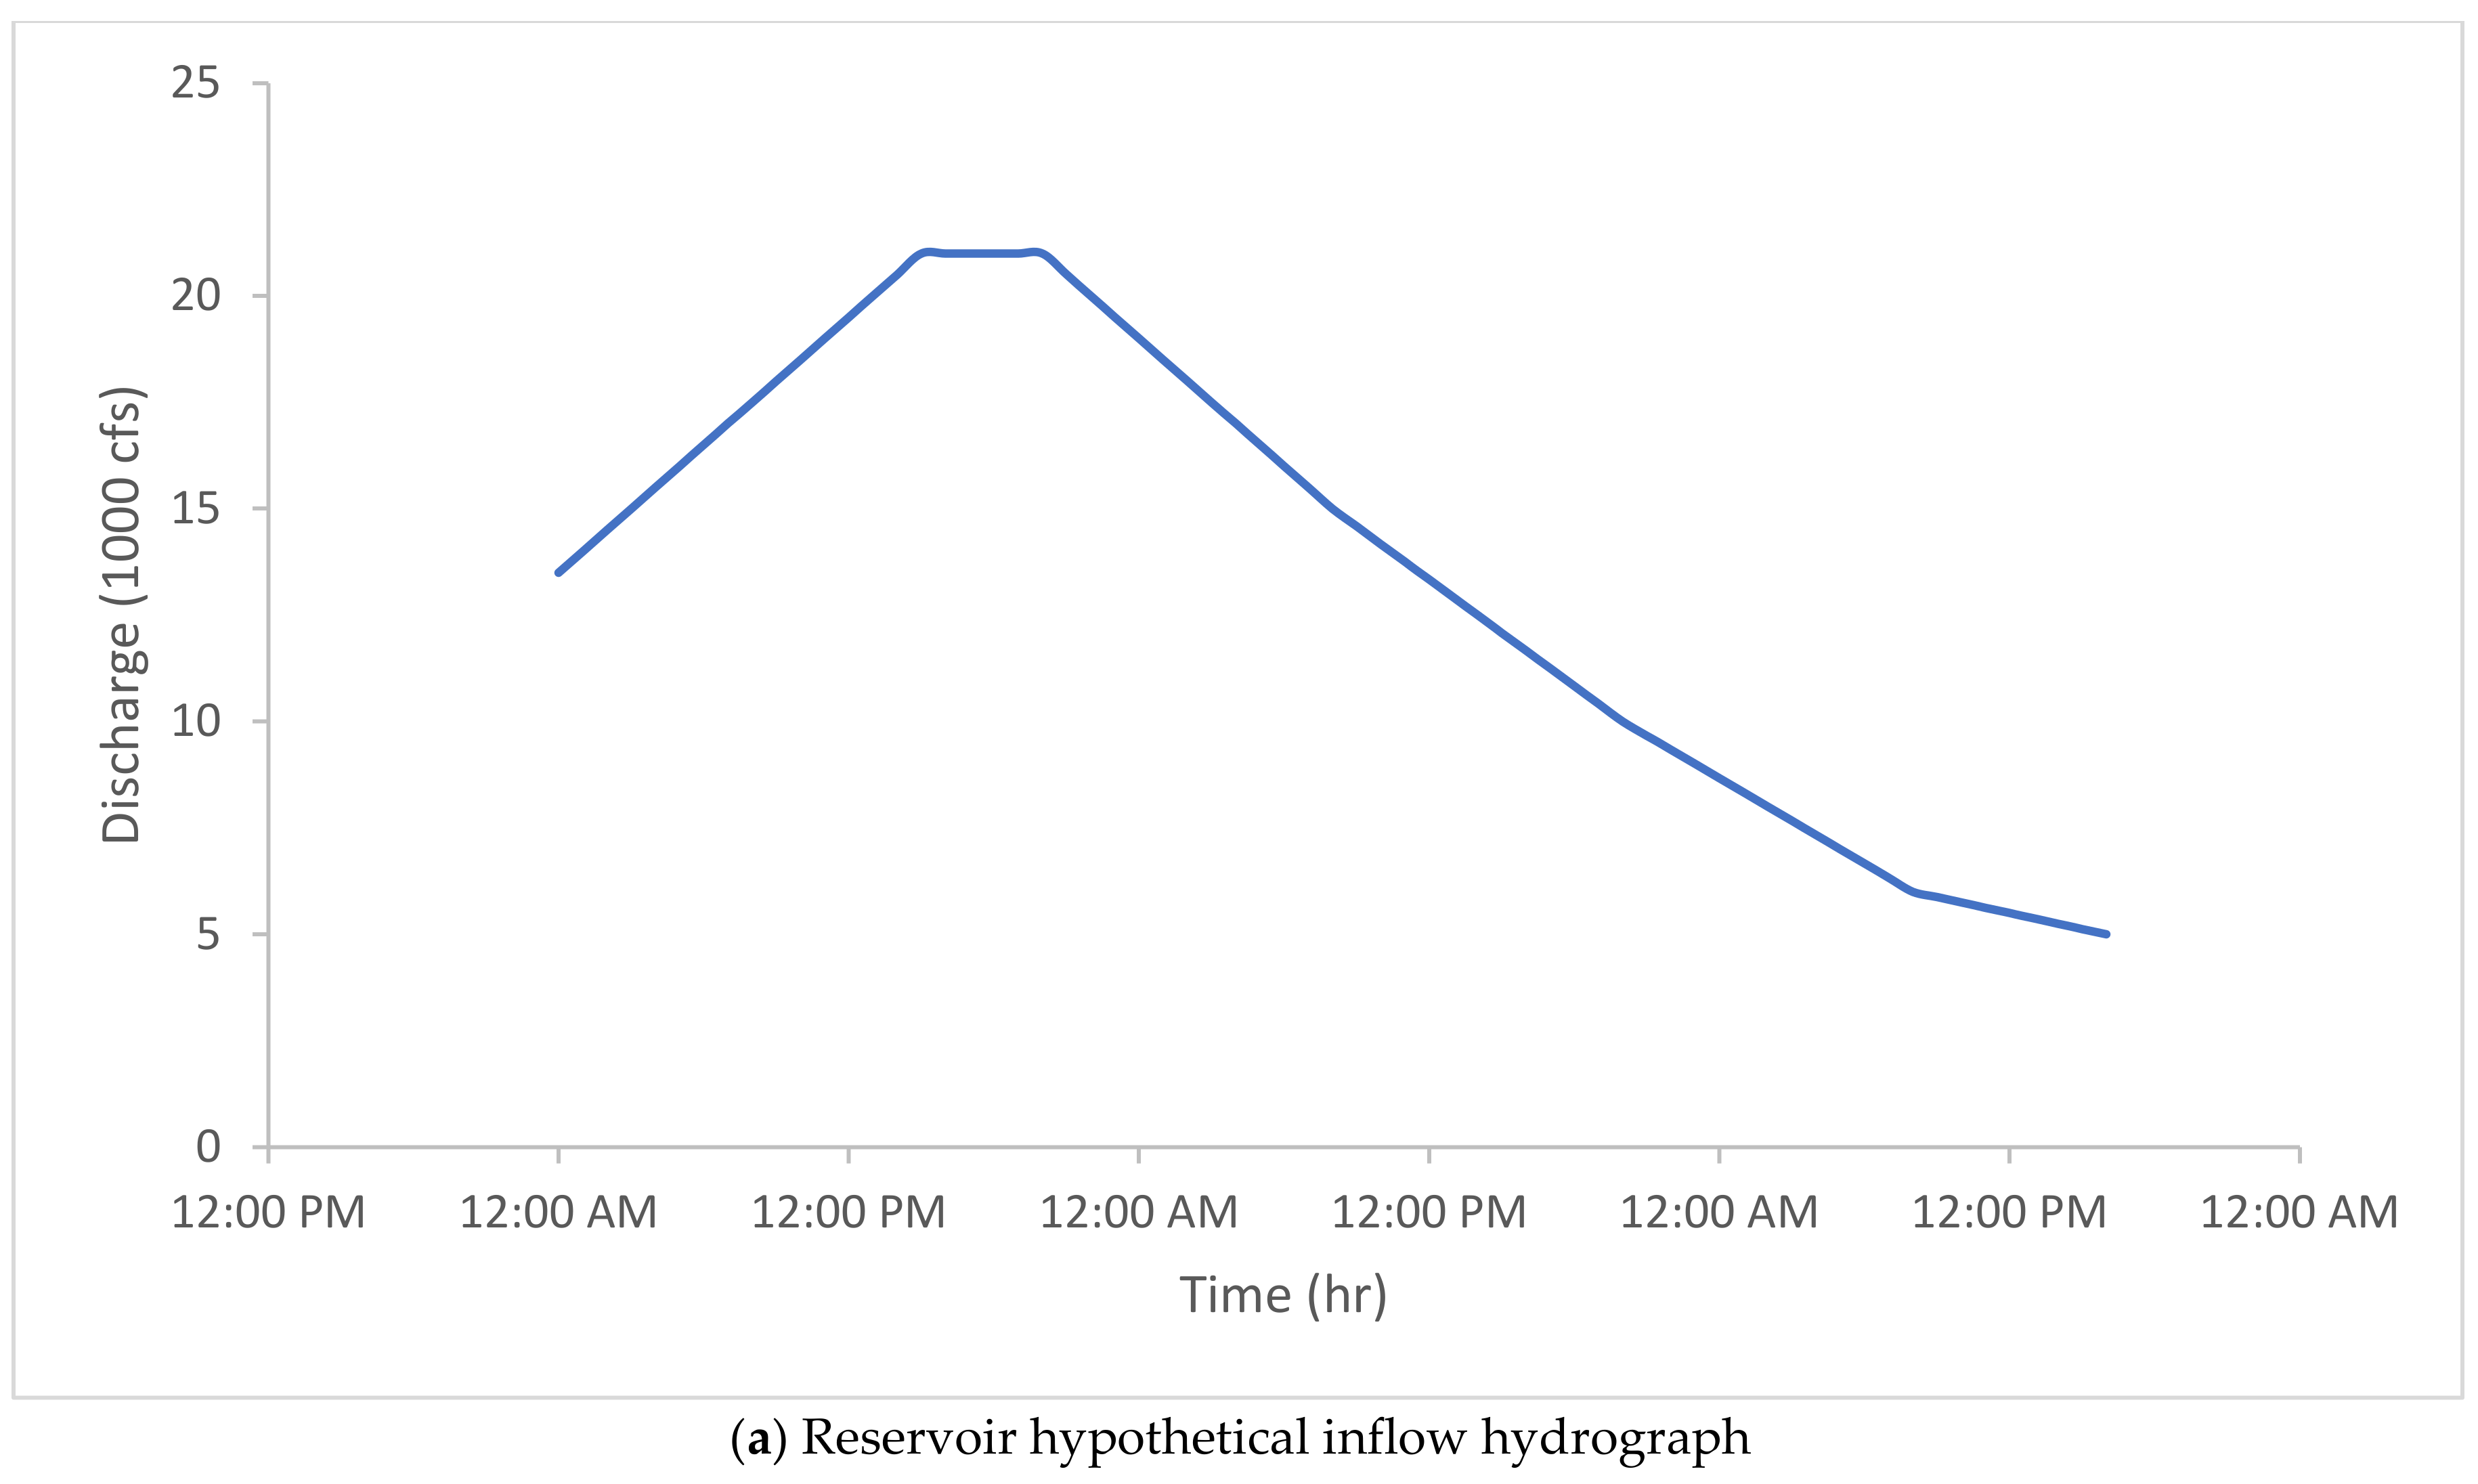
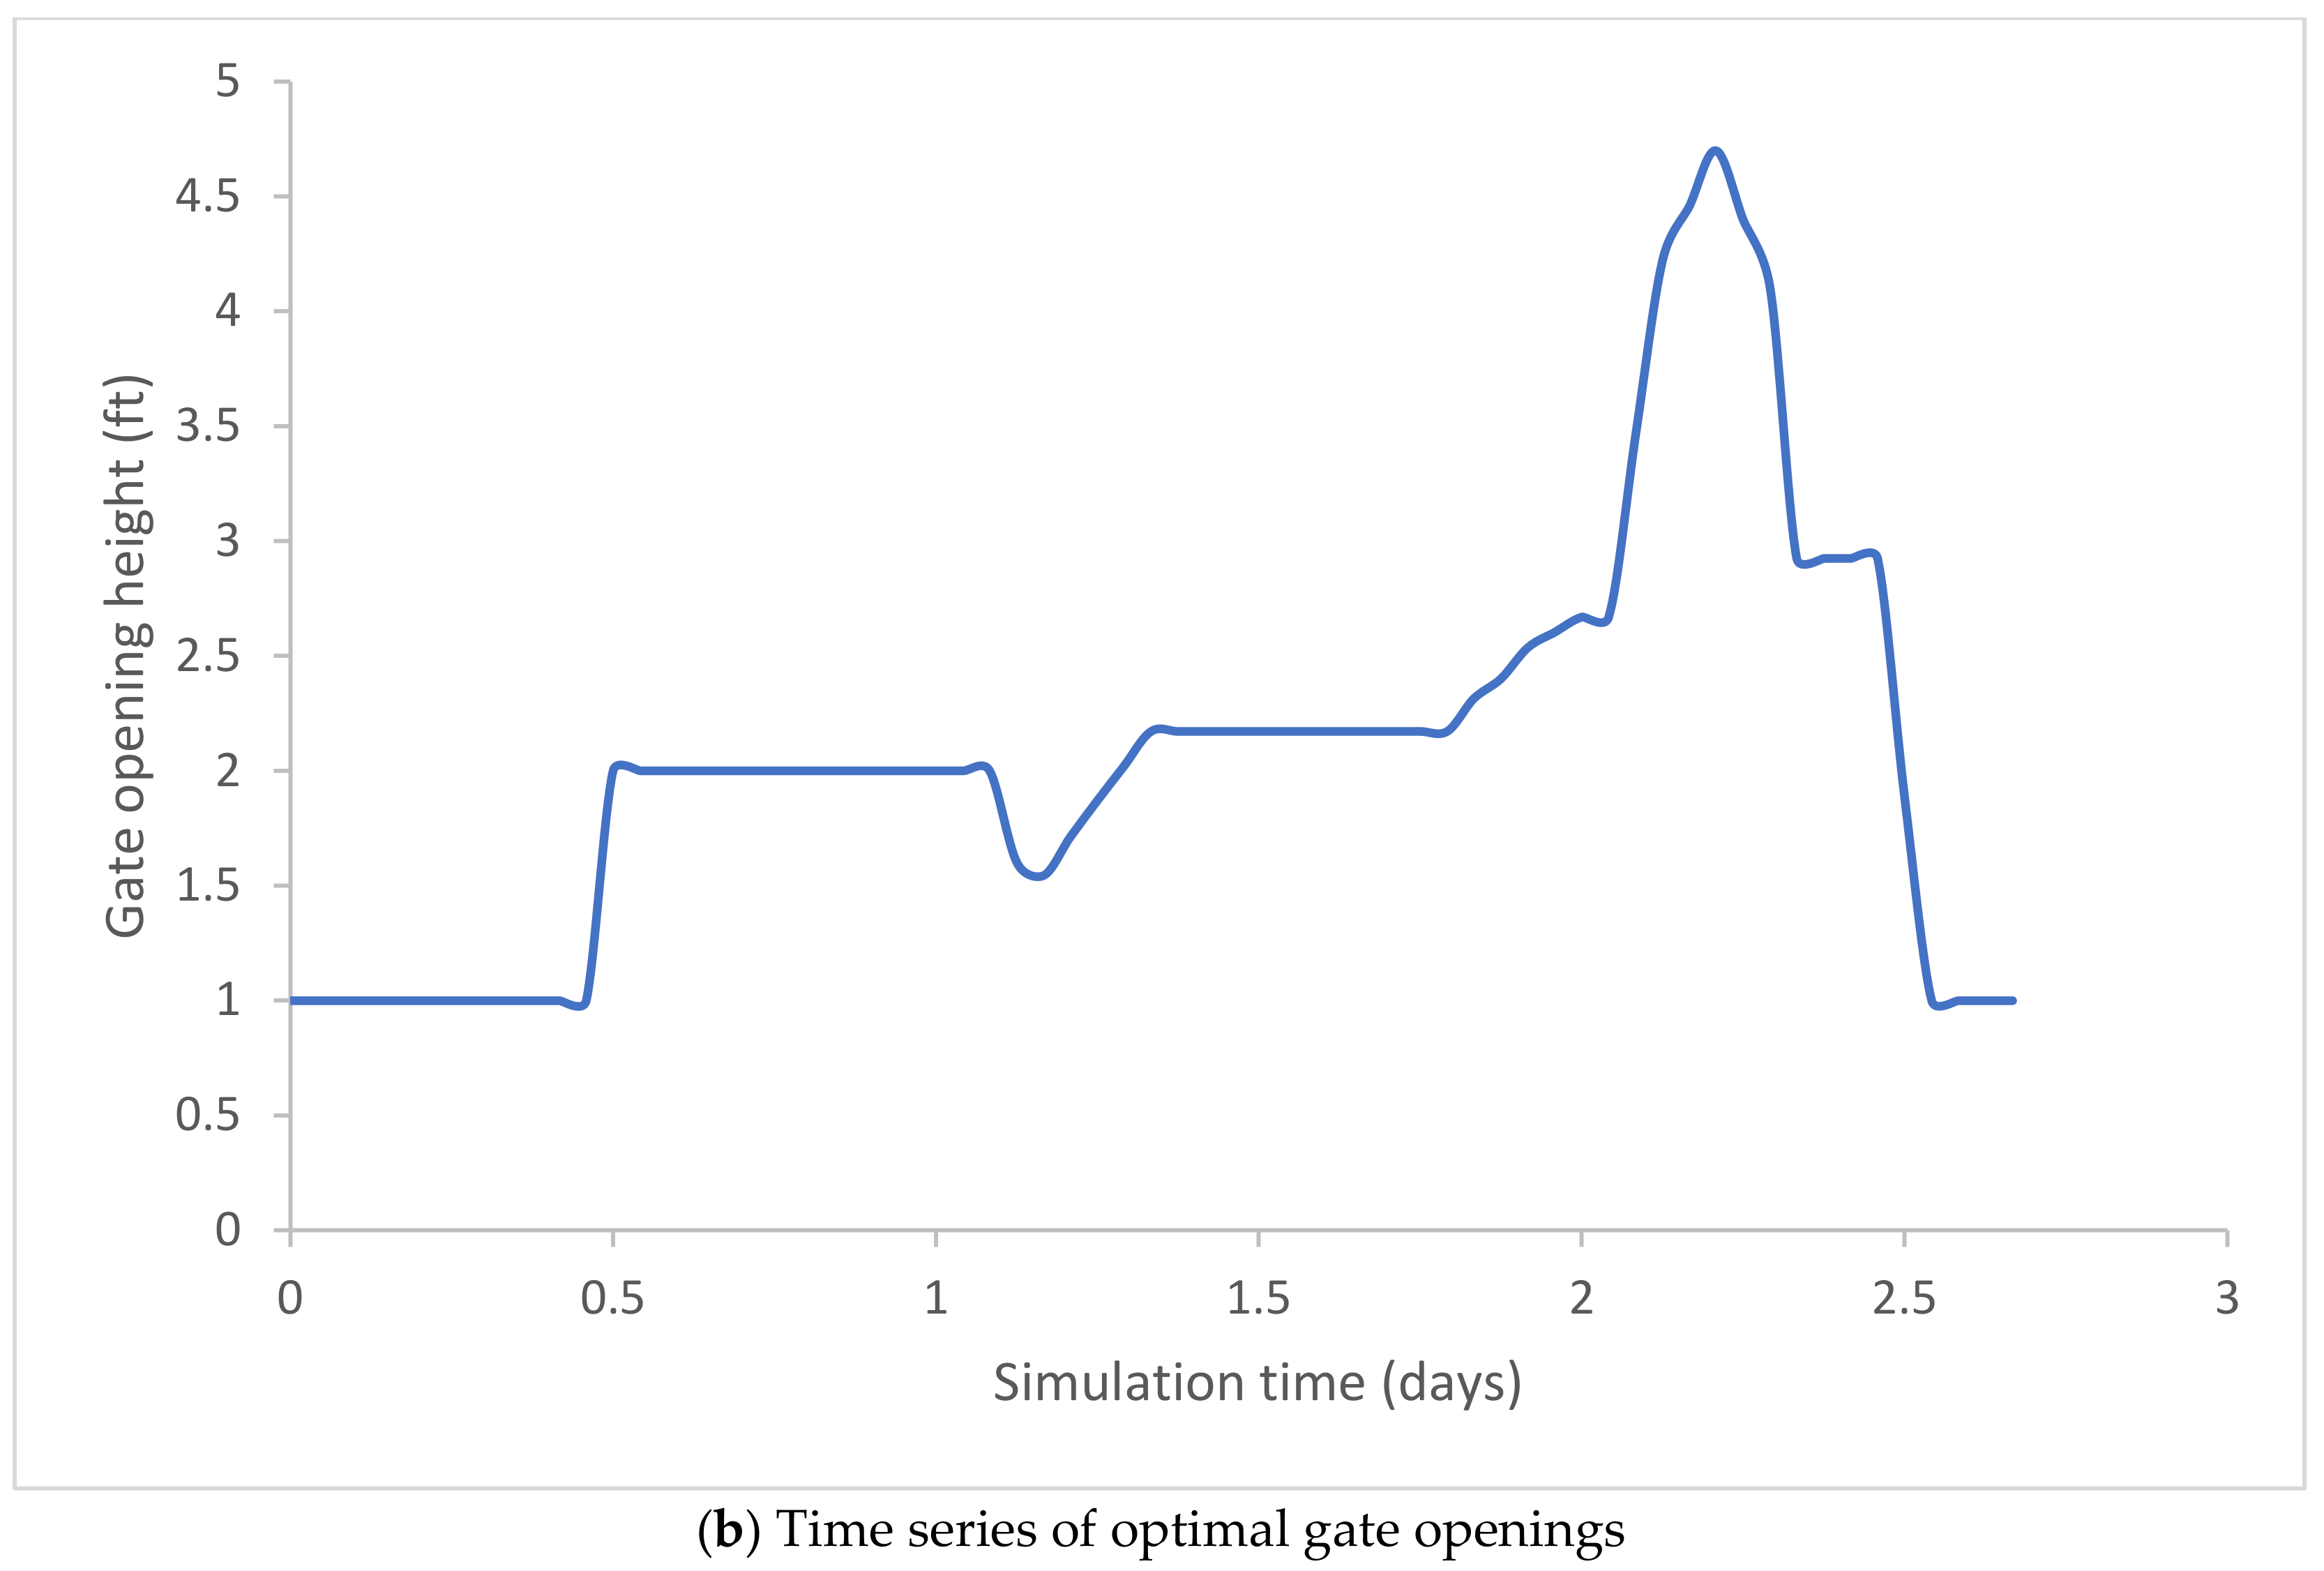
The hypothetical inflow hydrograph to the reservoir is shown in Figure 6a. A computation interval Δt of one hour is used starting at time t = 0. The objective is to determine the optimal sequence of reservoir gate openings to maintain for the targeted downstream water surface elevations below a maximum level during the flooding event. These time series of gate openings should achieve downstream water surface elevations within the allowable range of elevations at the points of interest. The resulting optimal gate openings as a function of time are shown in Figure 6b.
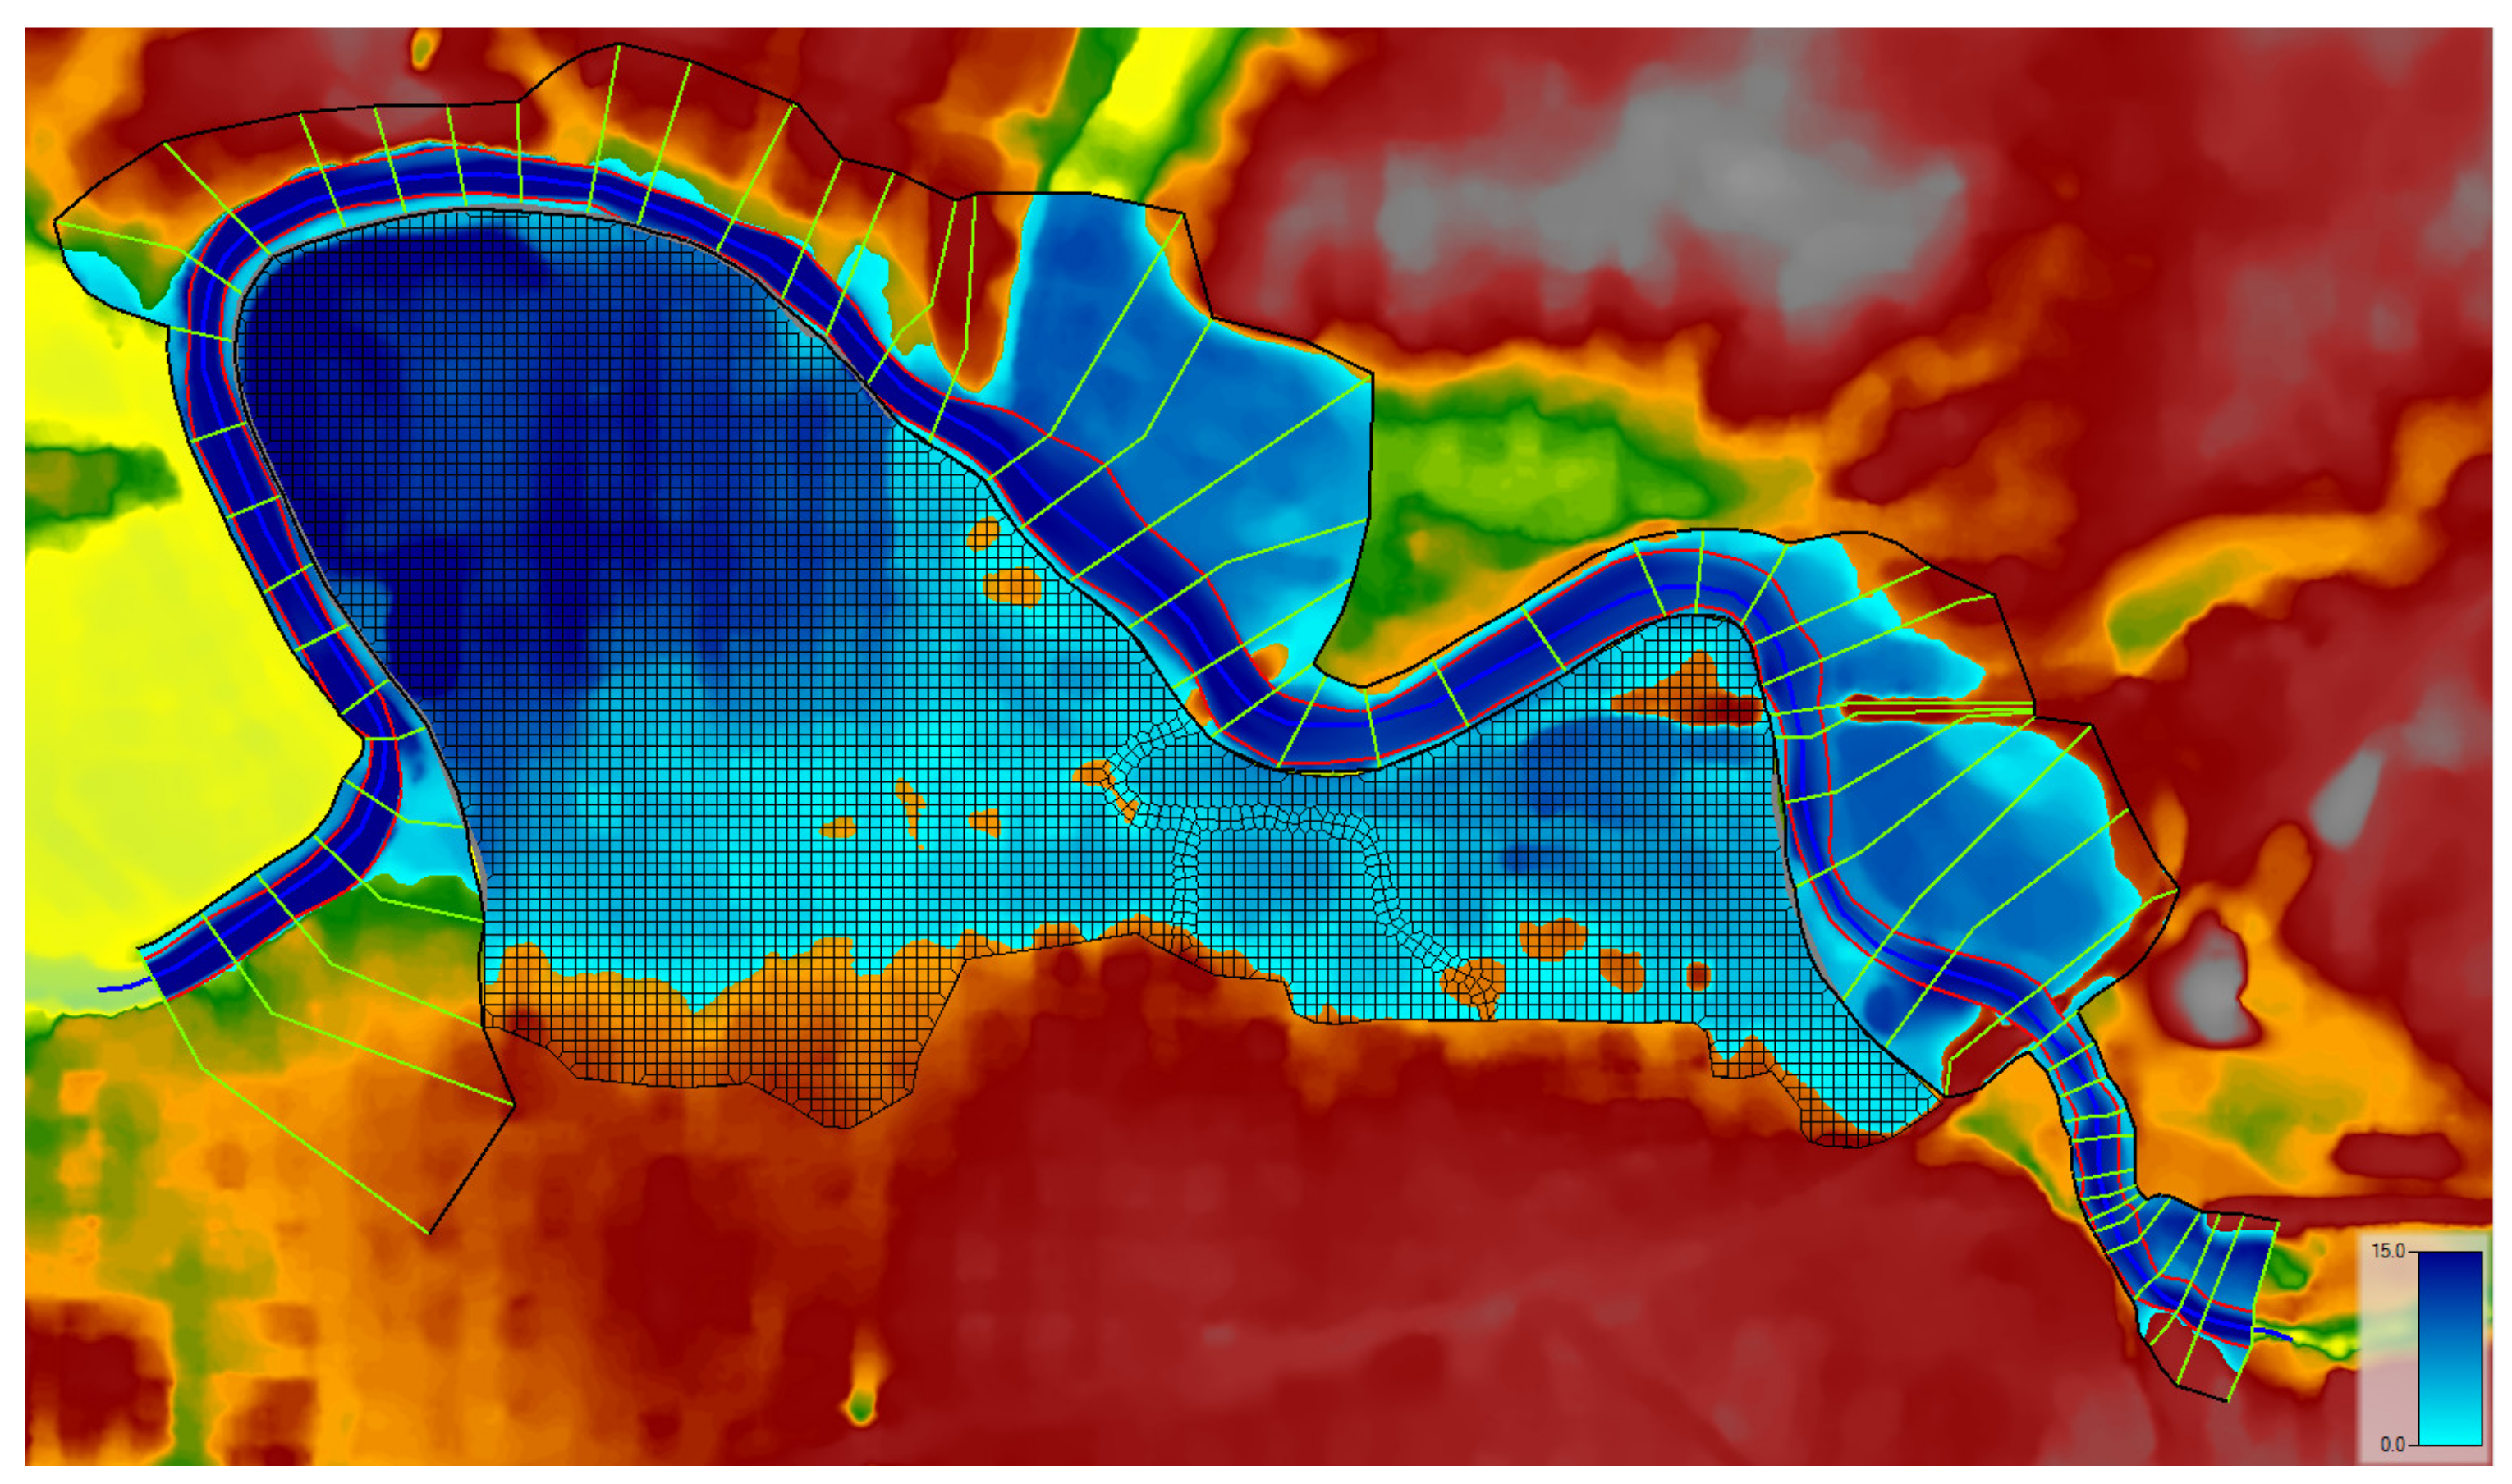
The reservoir operation model, interfaced with the genetic algorithm (GA) in MATLAB, starts generating the possible solutions for determining the reservoir releases over the next Δt using the current and forecasted data. The reservoir operation model and the genetic algorithm solver succeed in keeping the reservoir storage within the desirable range, while the storage for the reservoir is kept above the inactive storage and below the maximum flood storage, thus preventing any potential dam failure. Results are presented in the form of channel and floodplain inundation maps. The flooding condition (maximum inundation area downstream of the dam), assuming a fully open gate, is illustrated in Figure 7 in blue. Figure 8 shows the maximum inundation area (in blue) using the reservoir operation determined by the optimization-simulation model.
For this testing application, the city is kept entirely safe from the flooding. Comparing the floodplain areas on the right bank looking downstream between cross-sections 7864 to 9548 in Figure 7 and Figure 8 shows a darker blue indicating increased floodplain depths of flooding for the optimal results. This area was modeled using 1D unsteady flow.
The most important factor that could limit the application of this model on a large river reservoir is the simulation time for the unsteady flow simulations for each time step and for each iteration of the GA of the optimization. Shorter simulation times allow the optimization model (GA) to increase the number of objective function evaluations, which means the number of times that the simulator (HEC-RAS) is called. Producing a faster simulation model taking into consideration the accuracy of the model was a priority of this research. The most time-consuming parts of the overall model application are the unsteady flow simulations. Every factor that may affect the simulation time, including the mesh size, computation interval, mapping output, and even hydrograph interval, was considered. To obtain faster 2D unsteady simulations, the diffusion wave model was utilized using the current version of HEC-RAS instead of the full 2D simulation.
5. Conclusions
An optimization/simulation model wasdeveloped to determine the optimal operation of gates (reservoir release schedules) before, during, and after flooding events. The proposed optimization-simulation model approach consists of four individual models (interfaced through MATLAB): a rainfall forecasting model, a rainfall–runoff model, a combined (1D/2D) unsteady flow model, and an optimization model solved using genetic algorithm. The optimization-simulation approach uses the U.S. Army Corps of Engineers Hydrologic Engineering Center HEC-HMS and the newest version of the river analysis system HEC-RAS 5.0.3. The reservoir operation model is optimized using the genetic algorithm within MATLAB. Although the genetic algorithm requires many function evaluations (simulation runs of HEC-RAS) to reach an optimum solution, the approach has the significant benefit of being able to interface with simulators.
The HEC-RAS program allows the modeler to choose either the full (2D) equations or diffusion wave equations in two dimensions to solve the model which is set as the default. In general, the 2D diffusion wave equations have reduced computation times and have more stable properties than using the full (2D) equations. Even though a wide range of modeling situations can be precisely modeled with the 2D diffusion wave equation, users can always test if the full 2D equations are required for their specific situation by creating additional simulations. The use of a combined 1D/2D model is very important for many applications, as illustrated in the example application herein, and is recommended especially with the 2D diffusion wave equations because of the large number of unsteady flow simulations required in the overall modeling approach.
Author Contributions
Conception or design of the work: L.M.; Data collection: H.A.-S.; Data analysis and interpretation: H.A.-S.; Drafting the article: H.A.-S.; Critical revision of the article: L.M.; Final approval of the version to be published: L.M. All authors have read and agreed to the published version of the manuscript.
Funding
This research received no funding.
Institutional Review Board Statement
The study did not require ethical approval.
Informed Consent Statement
Not applicable.
Data Availability Statement
Did not report any data.
Acknowledgments
The authors gratefully acknowledge the anonymous reviewers for their comments and suggestions.
Conflicts of Interest
The authors declare no conflict of interest.
References
- Mays, L.W. Flood Simulation for a Large Reservoir System in the Lower Colorado River Basin, Texas. In U.S. Geological Survey Water-Supply; National Water Summary 1988–89—Floods and Droughts, Institutional and Management Aspects; USGS: Reston, VA, USA, 1991; Volume 2375, pp. 143–146. [Google Scholar]
- Che, D.; Mays, L.W. Application of an Optimization/Simulation Model for Real-Time Flood-Control Operation of River-Reservoirs Systems. Water Resour. Manag. 2017, 31, 2285–2297. [Google Scholar] [CrossRef]
- Che, D.; Mays, L.W. Development of an Optimization/Simulation Model for Real-Time Flood-Control Operation of River-Reservoirs Systems. Water Resour. Manag. 2015, 29, 3987–4005. [Google Scholar] [CrossRef]
- Unver, O.I.; Mays, L.W.; Lansey, K.E. Real-time flood management model for the Highland Lakes. J. Water Resour. Plan. Manag. 1987, 113, 620–638. [Google Scholar] [CrossRef]
- Unver, O.I.; Mays, L.W. Model for Real-Time Optimal Flood Control Operation of a Reservoir System. Water Resour. Manag. 1990, 4, 21–46. [Google Scholar] [CrossRef]
- Ahmed, E.S.M.S.; Mays, L.W. Model for Determining Real-Time Optimal Dam Releases during Flooding Conditions. Nat. Hazards 2013, 65, 1849–1861. [Google Scholar] [CrossRef]
- Nguyen, T.H. Optimal Operation of Multi-Reservoir System for Flood Control: Application to the Vu Gia Thu Bon Catchment, Vietnam. Construction Hydraulique; Université Côte d’Azur: Nice, France, 2020. [Google Scholar]
- Xu, S.; Chen, Y.; Xing, L.; Li, C. Baipenzhu Reservoir Inflow Flood Forecasting Based on a Distributed Hydrological Model. Water 2021, 13, 272. [Google Scholar] [CrossRef]
- Nicklow, J.; Reed, P.; Savic, D.; Dessalegne, T.; Harrell, L.; Chan-Hilton, A.; Karamouz, M.; Minsker, B.; Ostfeld, A.; Singh, A.; et al. State of the Art for Genetic Algorithms and Beyond in Water Resources Planning and Management. J. Water Resour. Plan. Manag. 2010, 136, 412–432. [Google Scholar] [CrossRef]
- Yoo, D.G.; Kim, J.H. Meta-heuristic algorithms as tools for hydrological science. Geosci. Lett. 2014, 1, 1–7. [Google Scholar]
- Kawamura, A.; Merabtene, T. Evolutionary Computing: Genetic Algorithms, Handbook of Applied Hydrology, 2nd ed.; Singh, V.J., Ed.; McGraw-Hill Education: New York, NY, USA, 2017. [Google Scholar]
- Chiang, P.K.; Willems, P. Combine Evolutionary Optimization with Model Predictive Control in Real-time Flood Control of a River System. Water Resour. Manag. 2015, 29, 2527–2542. [Google Scholar] [CrossRef]
- Chen, J.; Zhong, P.; Wang, M.; Zhu, F.; Wan, X.; Zhang, Y. A Risk-Based Model for Real-Time Flood Control Operation of a Cascade Reservoir System under Emergency Conditions. Water 2018, 10, 167. [Google Scholar] [CrossRef] [Green Version]
- Sun, Y.; Zhu, F.; Chen, J.; Li, J. Risk Analysis for Reservoir Real-Time Optimal Operation Using the Scenario Tree-Based Stochastic Optimization Method. Water 2018, 10, 606. [Google Scholar] [CrossRef] [Green Version]
- Brunner, G.W. HEC-RAS River Analysis: 2D Modeling User’s Manual; Version 5.0; U.S. Army Corps of Engineers (USACE)—Hydrologic Engineering Center: Davis, CA, USA, 2016.
- Brunner, G.W. Combined 1D and 2D Modeling with HEC-RAS; U.S. Army Corps of Engineers (USACE)—Hydrologic Engineering Center: Davis CA, USA, 2014.
- Montgomery, D.C.; Peck, E.A.; Vining, G.G. Introduction to Linear Regression Analysis; Wiley: Hoboken, NJ, USA, 2012. [Google Scholar]
Figure 1.
Schematic of a River-Reservoir System.

Figure 2.
Modeling approach.

Figure 3.
River reach downstream of Muncie with hypothetical reservoir (storage area in blue on lower right).
Figure 3.
River reach downstream of Muncie with hypothetical reservoir (storage area in blue on lower right).

Figure 4.
One-dimensional (1D) river reach with cross-sections. Water shown in blue: darker blue representing deeper water.
Figure 4.
One-dimensional (1D) river reach with cross-sections. Water shown in blue: darker blue representing deeper water.

Figure 5.
Storage area connected through an inline structure and illustration of the one-dimensional (1D) and two-dimensional (2D) areas.
Figure 5.
Storage area connected through an inline structure and illustration of the one-dimensional (1D) and two-dimensional (2D) areas.

Figure 6.
Inflow hydrograph and optimal gate openings.(a) Reservoir hypothetical inflow hydrograph, (b) Time series of optimal gate openings.
Figure 6.
Inflow hydrograph and optimal gate openings.(a) Reservoir hypothetical inflow hydrograph, (b) Time series of optimal gate openings.


Figure 7.
Inundation area (water depths shown in blue) at the City of Muncie without the O/S model.

Figure 8.
Inundation area (water depths (ft) shown in blue) at the City of Muncie with the optimal O/S model results.
Figure 8.
Inundation area (water depths (ft) shown in blue) at the City of Muncie with the optimal O/S model results.

Publisher’s Note: MDPI stays neutral with regard to jurisdictional claims in published maps and institutional affiliations. |
© 2021 by the authors. Licensee MDPI, Basel, Switzerland. This article is an open access article distributed under the terms and conditions of the Creative Commons Attribution (CC BY) license (https://creativecommons.org/licenses/by/4.0/).
Share and Cite
MDPI and ACS Style
Albo-Salih, H.; Mays, L. Testing of an Optimization-Simulation Model for Real-Time Flood Operation of River-Reservoir Systems. Water 2021, 13, 1207. https://doi.org/10.3390/w13091207
AMA Style
Albo-Salih H, Mays L. Testing of an Optimization-Simulation Model for Real-Time Flood Operation of River-Reservoir Systems. Water. 2021; 13(9):1207. https://doi.org/10.3390/w13091207
Chicago/Turabian StyleAlbo-Salih, Hasan, and Larry Mays. 2021. "Testing of an Optimization-Simulation Model for Real-Time Flood Operation of River-Reservoir Systems" Water 13, no. 9: 1207. https://doi.org/10.3390/w13091207
Note that from the first issue of 2016, this journal uses article numbers instead of page numbers. See further details here.