
Changes in the Soil–Plant–Water System Due to Biochar Amendment


Centre for Agricultural Research, Institute of Soil Sciences and Agricultural Chemistry, Herman O. St. 15, 1022 Budapest, Hungary
*
Author to whom correspondence should be addressed.
Water 2021, 13(9), 1216; https://doi.org/10.3390/w13091216
Submission received: 12 March 2021
/
Revised: 9 April 2021
/
Accepted: 23 April 2021
/
Published: 28 April 2021
(This article belongs to the Special Issue Soil–Plant–Water Dynamics on a Field Scale)
Abstract
:The aim of this study was to do a complex examination of the soil–plant–water system and soil greenhouse gas emissions when biochar is applied to soil planted with sweet corn (Zea mays L. var. saccharata). The study covers two consecutive vegetation periods. We investigated (i) the changes in plant growth, (ii) soil water and temperature at different depths, (iii) greenhouse gas (GHG) emissions (CO2 and N2O) after biochar application, and (iv) the soil water, chemistry, and plant interactions. We used discrete measurements for plant growth, biomass production, and soil chemistry, while continuously monitoring the soil water content and temperature, and the state of plant health (i.e., using spectral reflectance sensors). Plant response in the control plot showed higher values of normalized difference vegetation index (NDVI; 0.3%) and lower values for photochemical reflectance index (PRI) and fraction of absorbed photosynthetically active radiation (fAPAR) by 26.8% and 2.24%, respectively, than for biochar treatments. We found significant negative correlations between fAPAR and soil water contents (SWC), and NDVI and SWC values (−0.59 < r < −0.30; p < 0.05). Soil temperature at the depth of 15 cm influenced soil CO2 emissions to a larger extent (r > 0.5; p < 0.01) than air temperature (0.21 < r < 0.33) or soil water content (r < 0.06; p > 0.05). Our data showed strong connections between GHG production and soil chemical parameters of soil pH, nitrogen, potassium, or phosphate concentrations. Biochar application increased soil CO2 emissions but reduced N2O emissions. Our results demonstrated that biochar amendment to soils can help plant growth initially, but might not result in enhanced crop yield. The plant parameters were substantially different between the investigated years for both control and biochar amended parcels; therefore, long-term studies are essential to document the lasting effects of these treatments.
1. Introduction
Due to the long-term cultivation of agricultural soils, changes in their quality is inevitable. To lessen any negative effects from intensive farming, different techniques or enhancement materials such as reduced tillage, mulch options, and organic fertilizer, compost, or biochar additions might be applied. Biochar use in soils gained interest in recent years as a possible tool to mitigate climate change effects, reduce greenhouse gas (GHG) emissions [1,2], and to improve crop yield [3,4,5]. While the effects of biochar amendment on particular parts of the soil–plant–water system have been studied widely in recent years, examining the interrelations of the whole system still needs to be addressed [6].
Recently, many studies investigated how biochar will affect soil moisture dynamics, especially in soils with low water holding capacities. Increases in water holding capacities have been recorded [7,8,9]; however, clear links between increased plant available water and crop or fruit yield as a result of biochar amendment are still lacking [10]. Soil water dynamics can influence soil chemistry, for example by increasing nutrients leaching off the root zone, where nutrient limitations in soils can affect plant growth and health. Biochar also affects soil physical properties, such as through increased aggregate stability, porosity, and bulk density [11,12,13], which can influence soil moisture levels and, consequently, the available water for plants. Biochar use can cause increased yield production of maize or other crops, which might result from the improved soil conditions of soil moisture [4,14], reduced bulk density [15], or specific soil chemical and biological parameters [13,16]. However, biochar amendment alone cannot guarantee increased maize production [17]; therefore, continuous plant response measurements to soil amendments might provide us with a better understanding of the influencing factors derived from the changing environmental conditions.
Investigating plant health and stress by measuring spectral reflectance changes can provide valuable information on the soil–plant system, especially where nutrient or water limitations might exist [18]. Using dual-channel spectral reflectance sensors to continuously measure these plant responses during the course of plant development can be a useful tool in biochar related studies. The normalized difference vegetation index (NDVI) can provide valuable information on plant health, including its greenness and density [19]. The fraction of absorbed photosynthetically active radiation (fAPAR) values can be strongly correlated to the canopy density and leaf area of the investigated plants [4] or to the NDVI values [20]. The photochemical reflectance index (PRI) can provide valuable information on plant stress [18], which might be initialized by the changes in soil physical and chemical parameters. Using these types of sensors to continuously measure selected plants can enable us to observe even the delayed changes in plant response to modified environmental conditions [21], especially when fixed field sensor measurements are gathered. These spectral indices can be indirectly applied to monitor changes in soil chemical or hydrological conditions such as drought, to estimate crop production, or to provide information on fertilizer or irrigation treatments. Biochar effects on the soil–plant–water system using noninvasive spectral sensors among well-accepted measurement techniques are limited in the current literature [4]; therefore, the information presented here might provide a newer perspective on our existing knowledge on biochar related field studies and set the foundation for future method developments in soil science.
The effect of biochar amendment on soil CO2 and N2O emissions is not unequivocal. The most important abiotic factors driving soil GHG emissions are soil water content and temperature. Biochar additions can change several important GHG drivers: they might positively modify soil water holding capacity and soil water content, resulting in more favorable soil moisture conditions for cropped plants [9,22]. The resulting higher soil water content and stronger vegetation with higher root biomass can further modify soil CO2 emission. The type of vegetation and the cover crop can also significantly impact soil CO2 emissions [23]. Simultaneously, biochars have high potential to sequester carbon, thus reducing soil CO2 emission [24,25]. Several studies reported elevated CO2 emission after biochar usage [26,27], while others found reduced CO2 emissions [28,29]. Positive or negative effects of biochar usage on soil GHG emission are not only highly dependent on soil structure but also on biochar parameters such as its type or pyrolysis temperature [30,31]. Therefore, the combined effect of changes in the soil’s physical and chemical parameters on plant development and GHG production as a result of biochar amendment is very complex. Hence, extending our current knowledge on biochar use can provide useful information prior to new field applications.
Soil can be a sink of N2O and its potential should be assessed under varying environmental conditions. Biochar amendment can significantly influence the soil’s physical properties, especially soil porosity, which might be one of the main drivers of soil N2O emission. Increased soil porosity provides higher oxygen content in the soil, thus the rate of the anaerobic denitrification process and soil N2O emission can be expected to decrease [32]. Other soil properties and processes such as soil pH, the rate of nitrogen immobilization, or the amount of available organic carbon can be also affected by biochar usage and can cause suppressed N2O emission [33]. Many studies support the effects of biochar on decreasing soil N2O emission [34,35,36], a negative or no correlation between N2O emission and biochar amendment [34,37].
To understand how the soil–plant–water interactions change when biochar is used, the soil’s physical, chemical, and biological characteristics need to be carefully examined. Therefore, the aim of the present study was to do a multifaceted examination of the soil–plant–water system when biochar is applied to soil planted with maize (Zea mays L. var. saccharata). The main objectives of the present study were to investigate the changes in (i) plant growth and health using weekly and continuous measurements, (ii) soil physical and chemical parameters with special focus on soil water and temperature values, and (iii) greenhouse gas emissions of CO2 and N2O. We hypothesized that the following mechanisms are influencing the soil–plant–water system as a result of biochar application: (i) hydrological changes in soil, (ii) alterations in soil physical and chemical properties, and (iii) plant response to the amendment. We also hypothesized that these changes will be measurable using different noninvasive techniques, such as spectral reflectance sensors, which is a novel technique to study plant responses in biochar related studies.
2. Materials and Methods
2.1. Site Information and Experimental Setup
The study site is located at a long-term cultivated (alfalfa changed to maize) field (47.2485 N; 18.1986 E, temperate climate zone, 201 m a.s.l.). The average amount of annual daylight in the study area is 1870–2000 daylight hours; the annual average air temperature is 9.5–9.7 °C, and during the vegetation period the average air temperature is 16.5 °C [38]. The average daily wind speed is below 3 m s−1 throughout most of the year [38]. The average annual precipitation was around 800 mm, out of which 191 and 240 mm fell during the investigated plant growth (8 June through 2 August 2017 and 2018, respectively). The used meteorological data was retrieved from on-site instruments (e.g., rain gauge ECRN 100, Decagon Devices, Pullman, WA, USA). The investigated soil type was silt loam with 32.5% sand, 55.5% silt, and 12.0% clay content. According to the Word Reference Base (WRB) the soil is classified as Leptosol (Rendzina) [39].
The type and amount of biochar used in the experiment were determined based on earlier experiments and literature review [4,40]. In total, 3.5 t ha−1 biochar was applied to the soil, hoed into the top 20 cm soil layer [35]. According to the manufacturer (SonnenErde GmbH, Riedlingsdorf, Austria), the biochar was made from paper fiber sludge and grain husks from spelt (wheat; 1:1 w/w) using Pyreg-reactor technology at 600 °C, using slow pyrolysis technique with a residence time of 20 min [41]. The chemical properties of the biochar used in the study were the following: pH = 10.3 ± 0.0, total organic carbon (TOC) = 47.3%, total N = 1.0 ± 0.1%, based on TOC value the C/N ratio = 47.3, and NH4+-N = 1.9 ± 0.1 mg kg−1.
Four treatments were chosen for soil chemical and GHG analyses, namely empty plots or control with no plants (EC), control with maize (MC), biochar amended plots with no plants (EBC), and biochar amended plots with maize (MBC). The experimental plots had the dimensions of 8 m × 2 m, where individual 1 m × 1 m plots were chosen for CO2 and N2O measurements in four replicates. Maize seeds were sown in the following scheme: 2 seeds were sown in all points with 25 cm distance apart points and 80 cm distance between rows. Soil chemical sample collections were performed in triplicates. More details on these measurements are described below. Biochar application was completed by hand at the beginning of the study, while mechanical soil loosening using a rototiller was performed resulting in 10 cm of soil depth having biochar amendment. No additional biochar application was performed during the spring of the second year.
2.2. Plant Measurements
Sweet corn (maize) was used in the present experiment (Mv Julius, Agricultural Institute, Centre for Agricultural Research, Martonvásár, Hungary). Seeding events occurred on 9 April 2017 and 16 April 2018. It took approximately 3 weeks for the plants to get to the 2-leaf stage. Harvests occurred on 2 August 2017 and 17 July 2018 and the removal of the plants for biomass measurements was on 17 September 2017 and 21 September 2018. Maize height was measured weekly until reaching maturity (late June or early July). Together 68 and 59 plants were measured in the control and 66 and 47 plants in the biochar amended plots during 2017 and 2018, respectively. The lower number in the biochar treatments during the second year resulted from a weather event when some plants got damaged and became no longer representative of our study. For the statistical analyses, the plants were distinguished between treatments as each plant was considered as a replicate.
Plant growth measurements such as stem diameter and plant height were measured weekly for all plants, to analyze the extent of average growth changes between different treatments. The crop yield was collected at harvest, where the fresh weights of the whole ears were measured immediately for all samples and dry weight masses after oven drying at 70 °C, until the weights became constant for selected samples. Biomass (root, leaf, stem, and tassel) values were measured after removing all soil particles from the roots and air drying all samples.
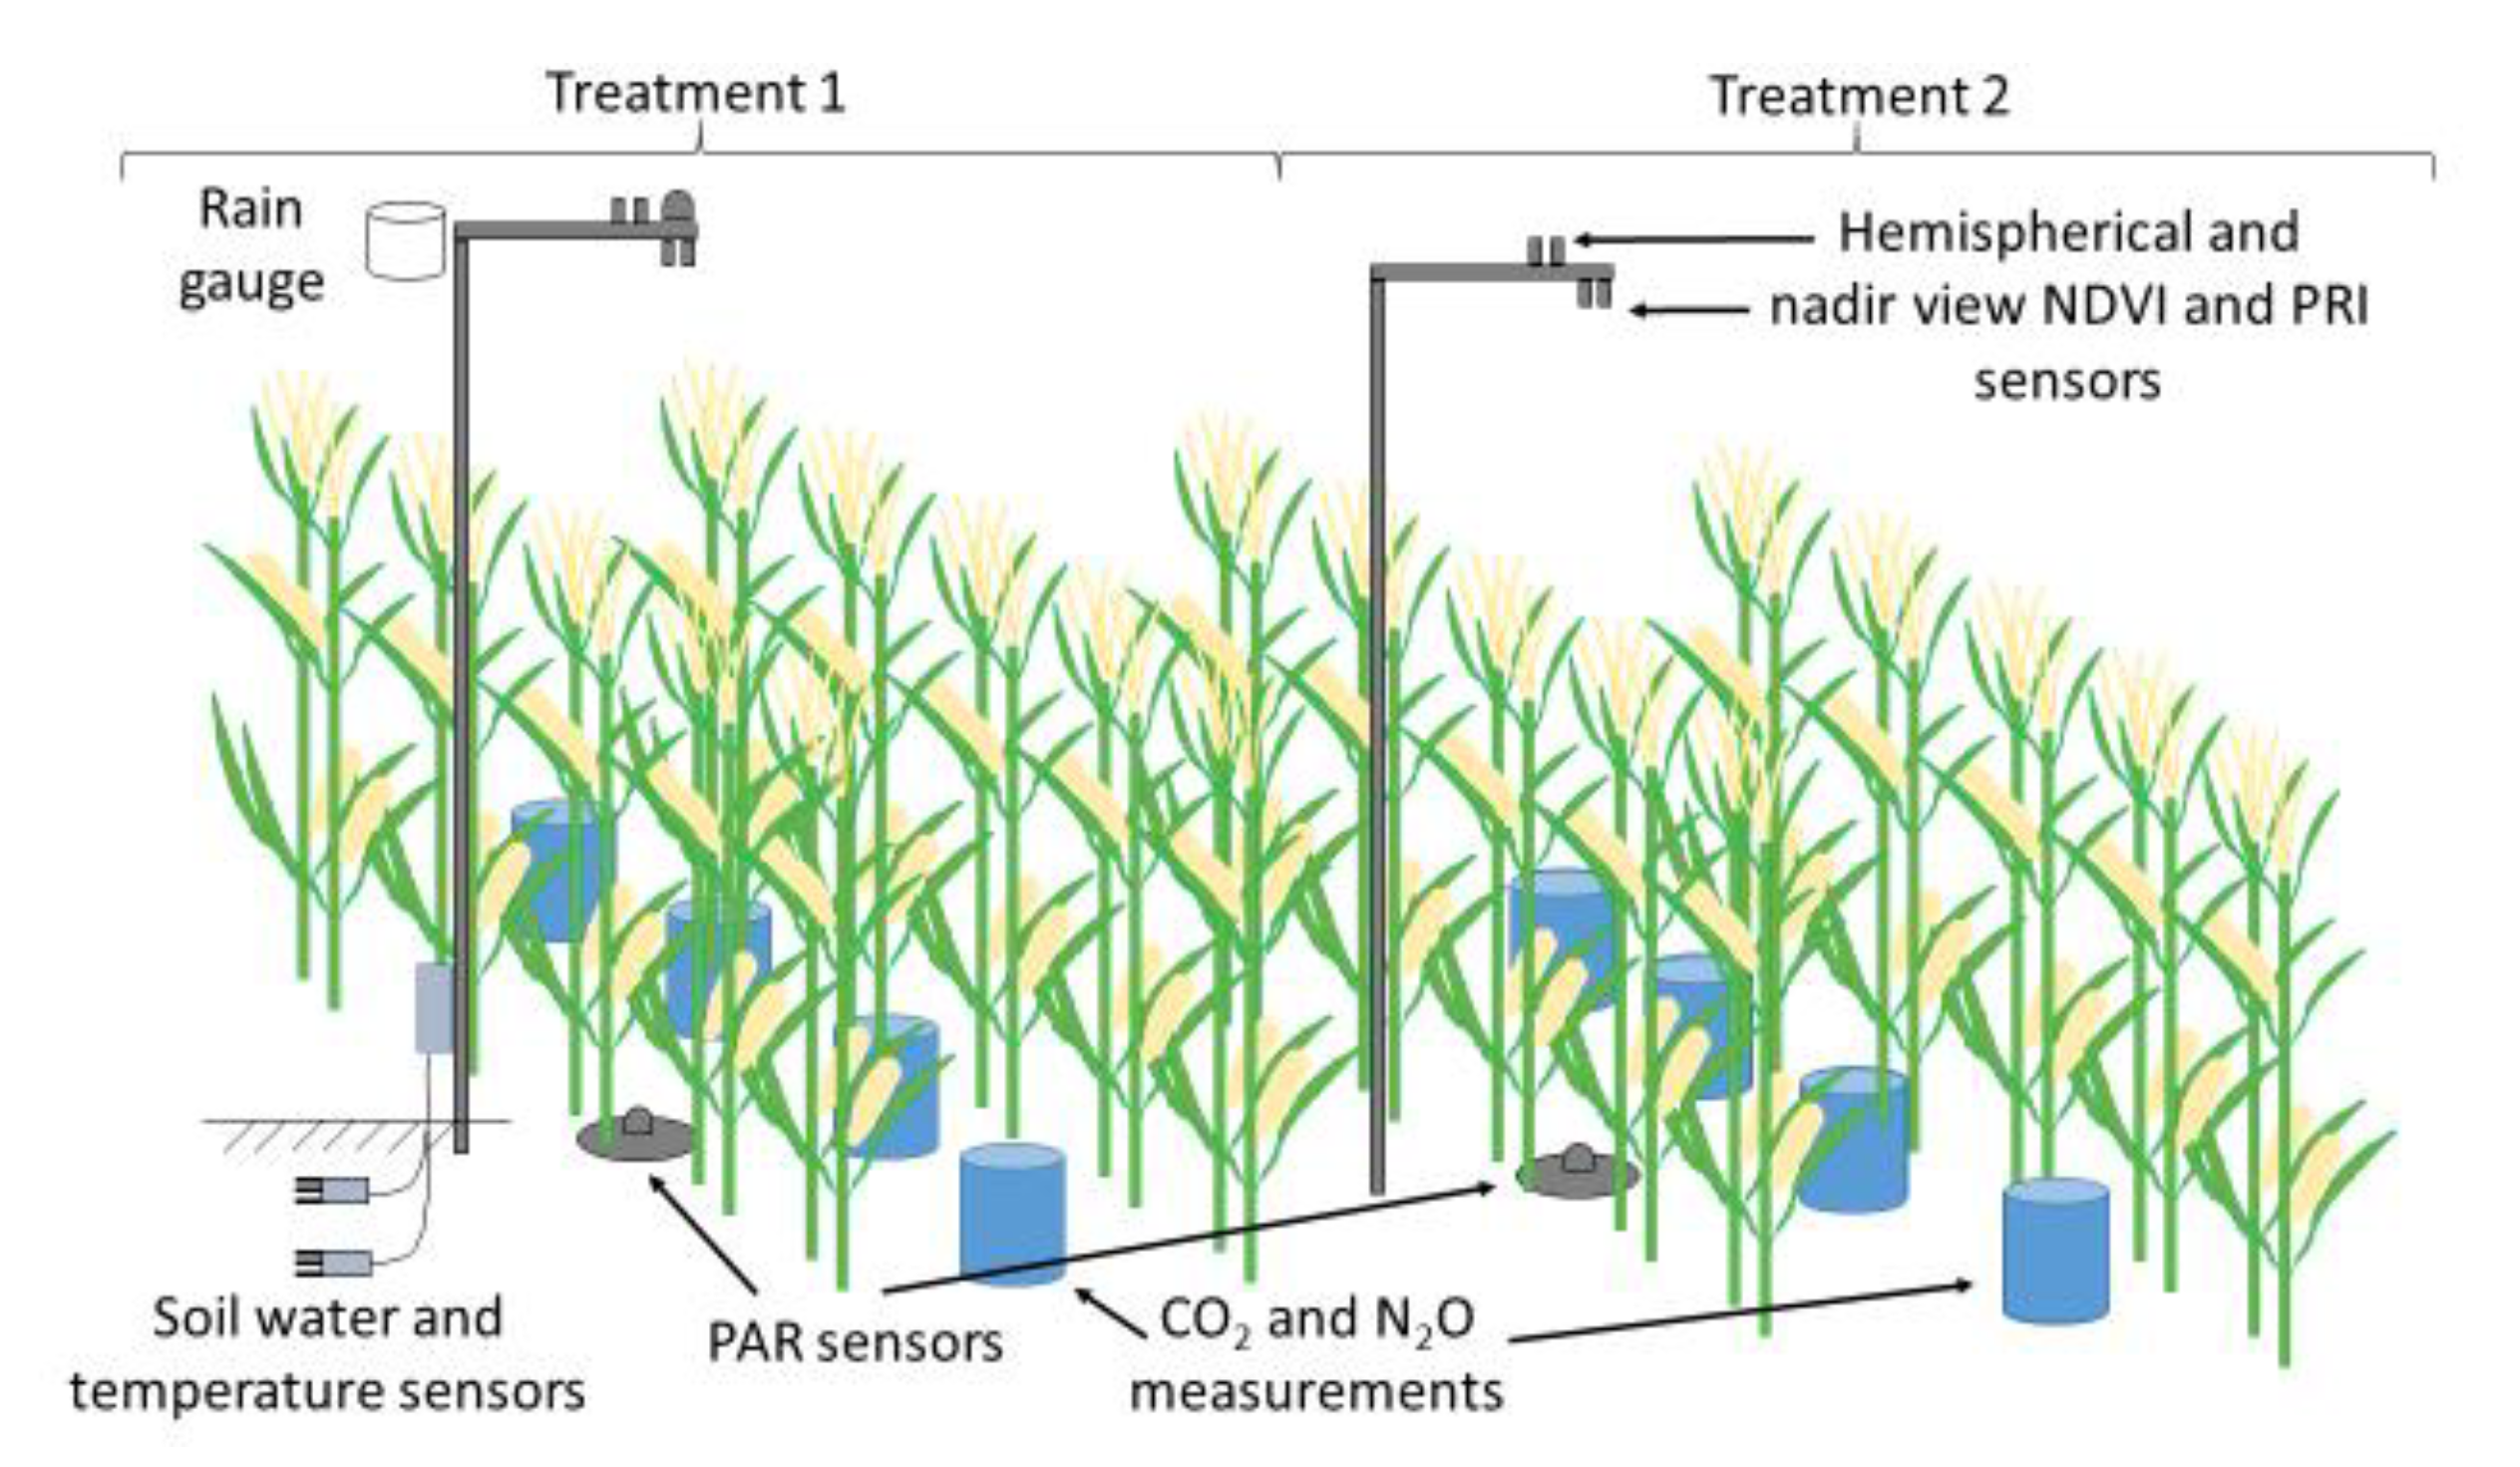
During the second year of the experiment, a photosynthetically active radiation (PAR) sensor (Apogee Instruments, Logan, UT, USA) was placed at 2.5 m above the ground and the information was used as reference PAR data of radiation reaching the leaf surface. Both treatments received a PAR sensor, which was placed below plant replicates, ensuring the same distance from plant stems for the treatments. This setup enabled us to continuously measure the photochemical response of four partial plants per treatment. From the measured PAR values we calculated the fraction of the absorbed PAR (fAPAR) as a difference of the hemispherical and below canopy radiation flux over the below canopy radiation flux [42]. Only data from midday (10:00–13:00) were used; all other measurements were omitted. Photon flux values are presented in µmol m−2 s. At the same time with the PAR sensors, spectral reflectance sensors of Photochemical Reflectance Index (PRI) and Normalized Difference Vegetation Index (NDVI; Decagon Devices, Pullman, WA, USA; measuring 532 and 570 nm and 630 and 800 nm spectral irradiance, respectively) were included in the experimental setup. One hemispherical sensor was placed 2.5 m above ground, and two PRI sensors (nadir field view) were placed at the same distance from two plant replicates’ meeting point in terms to collect data on entering and reflecting the 532 and 570 nm or 630 and 800 nm wavelengths of the sunlight. The schematics of the experimental setup is shown in Figure 1.
The PRI values were calculated based on Gamon et al. [43] using the following equation:
where Pr represents the field stop lens sensor for reflected radiation from the canopy, while Pi the hemispherical sensor for incident radiation values. The uncorrected reflectance values (Pr/Pi) were calculated for each waveband (532 and 570 nm) and used to calculate uncorrected PRI.
The NDVI values were calculated based on radiance [43,44] using the following equation:
where Nr represents the field stop lens sensor for reflected radiation from the canopy, while Ni the hemispherical sensor for incident radiation values. The uncorrected reflectance values (Nr/Ni) were calculated for each waveband (630 and 800 nm) and used to calculate uncorrected NDVI.
From the collected data, midday NDVI, PRI, and fAPAR values were used, meaning that measurements prior to 10 am and after 1 pm were omitted to ensure no shadows from other plants influenced the collected data. Afterward, these daily values (21 measurements per treatment) were averaged before further analysis.
2.3. Physical and Chemical Characteristics of the Soil
Continuous soil water content (SWC) and soil temperature monitoring was implemented during the first year of the study at 15 and 40 cm below the soil surface using 5TM soil moisture and temperature sensors (Decagon Devices Inc., Pullman, WA, USA). These sensors were calibrated specifically to the soil used in the present study. SWC represents the volumetric water content (VWC) of the investigated soils throughout the study. Soil samples were collected prior to soil enhancer amendments (15 March 2017) in triplicates from the top 2–12 cm of the soil by a sample corer. These samples were composites as they were not sampled in the same place. Samples were homogenized, sieved (<2 mm) and analyzed for total nitrogen (NTot), NH4+-N, NO3−-N, K2O (Al soluble), P2O5 (Al soluble), soil organic carbon (SOC) content, electrical conductivity, and pHH2O. The amount of NTot was determined using the modified Kjeldahl method (ISO 11261:1995) and the amount of SOC was measured by wet digestion using the Tyurin method. K2O and P2O5 measurements were conducted using an inductively coupled plasma optical emission spectrometry (Quotation ICP-OES, Ultima 2, Thermo Fischer Scientific, Waltham, MA, USA) after ammonium lactate extraction (Al). The soil pH was measured in 1:2.5 soil:water suspensions. Soil element concentrations are reported as mg kg−1 dry weight soil.
Soil samplings and analyses were repeated around harvest time both in 2017 and 2018. Particle size distribution was determined using the sieve-pipette method. The soil:water suspension was mixed in a sedimentation cylinder, then sampled with a pipette to collect particles of a given size.
2.4. CO2 Measurements and Gas Chromatography—Flame Ionization Detector (GC-FID) Analyses
During the study, CO2 measurements were taken on a weekly to biweekly basis from mid-March to mid-October, 2017 and 2018. Air samples were taken from the headspace of the 20 cm high and 10 cm diameter chambers equipped with a rubber septum on top, permanently placed 5 cm deep into the soil. Air samples were taken at each sampling time in triplicates and were used as controls, while respiration measurements were conducted in four replicates per treatment. Measurements from planted plots were taken between rows.
Gas samples were collected after 20 min incubation time into evacuated 10 mL exetainer vials and CO2 production was quantified using a FISIONS 8000 gas chromatograph (FISONS Instruments, Glasgow, UK) with a flame ionization detector (FID) equipped with a methanizer. GC-FID instrument column parameters were 2 m by 3 mm, Porapak Q 80–100 mesh (Sigma Aldrich, Budapest, Hungary). The method used a splitless injection with hydrogen carrier gas (pressure: 90 kPa; flow: 30 mL min−1). The injection volume of 250 µL was used. The detector temperature was set at 150 °C, while the oven temperature was kept constant at 80 °C for the duration of 180 s. The methanizer temperature was set at 350 °C. Calibration standards of 405 and 5000 mg kg−1 CO2 were run prior to and after each sample run, containing approximately 14 samples. CO2 concentrations are presented as mg kg−1 and emission values as mg CO2 m−2 s−1.
2.5. N2O Measurements and GC-ECD Analyses
Gas samples were collected after 30 min incubation time into evacuated 22 mL exetainer vials, and N2O production was quantified using a Perkin Elmer (Waltham, MA, USA) Clarus 500 gas chromatograph with an electron capture detector (ECD). GC-ECD instrument column parameters were 2 m × 3 mm, Porapak Q 80–100 mesh (Sigma Aldrich, Budapest, Hungary). The method used a split injection with nitrogen carrier gas (pressure: 90 kPa; flow: 20 mL min−1) and nitrogen as make up gas. The detector temperature was set at 310 °C, while the oven temperature was kept constant at 39 °C for the duration of 300 s. Calibration standards of 0.32 and 5.00 mg kg−1 N2O (Messer specialty gases, Budapest, Hungary) were run prior to and after each sample run. N2O concentrations are measured as mg kg−1 and emission values presented as µg N2O m−2 s−1. Measurements from the planted plots were taken between rows.
2.6. Statistical Analyses
The collected data was analyzed using linear regression analyses (Model I, Ordinary Least Squares method), where the independent variables were the soil water or soil temperature, or the soil chemical parameters, and the dependent variable the CO2 or N2O emissions. We used the ordinary least square (OLS) method to estimate the linear regression factors. To find statistical significance between treatments the one-way ANOVA and for the spectral sensor data the repeated measures ANOVA application was used, followed by a post hoc Tukey HSD test. Pearson’s correlation coefficient (r) was used to evaluate the linear correlation between the soil or the soil/biochar mixtures’ chemical properties and the measured GHG emissions. All statistical calculations were performed using the software package R (R Core Team, Version 4.0.2, Vienna, Austria). Statistical significance of the data sets was determined at p < 0.05.
3. Results
3.1. Crop Growth and Crop Yield
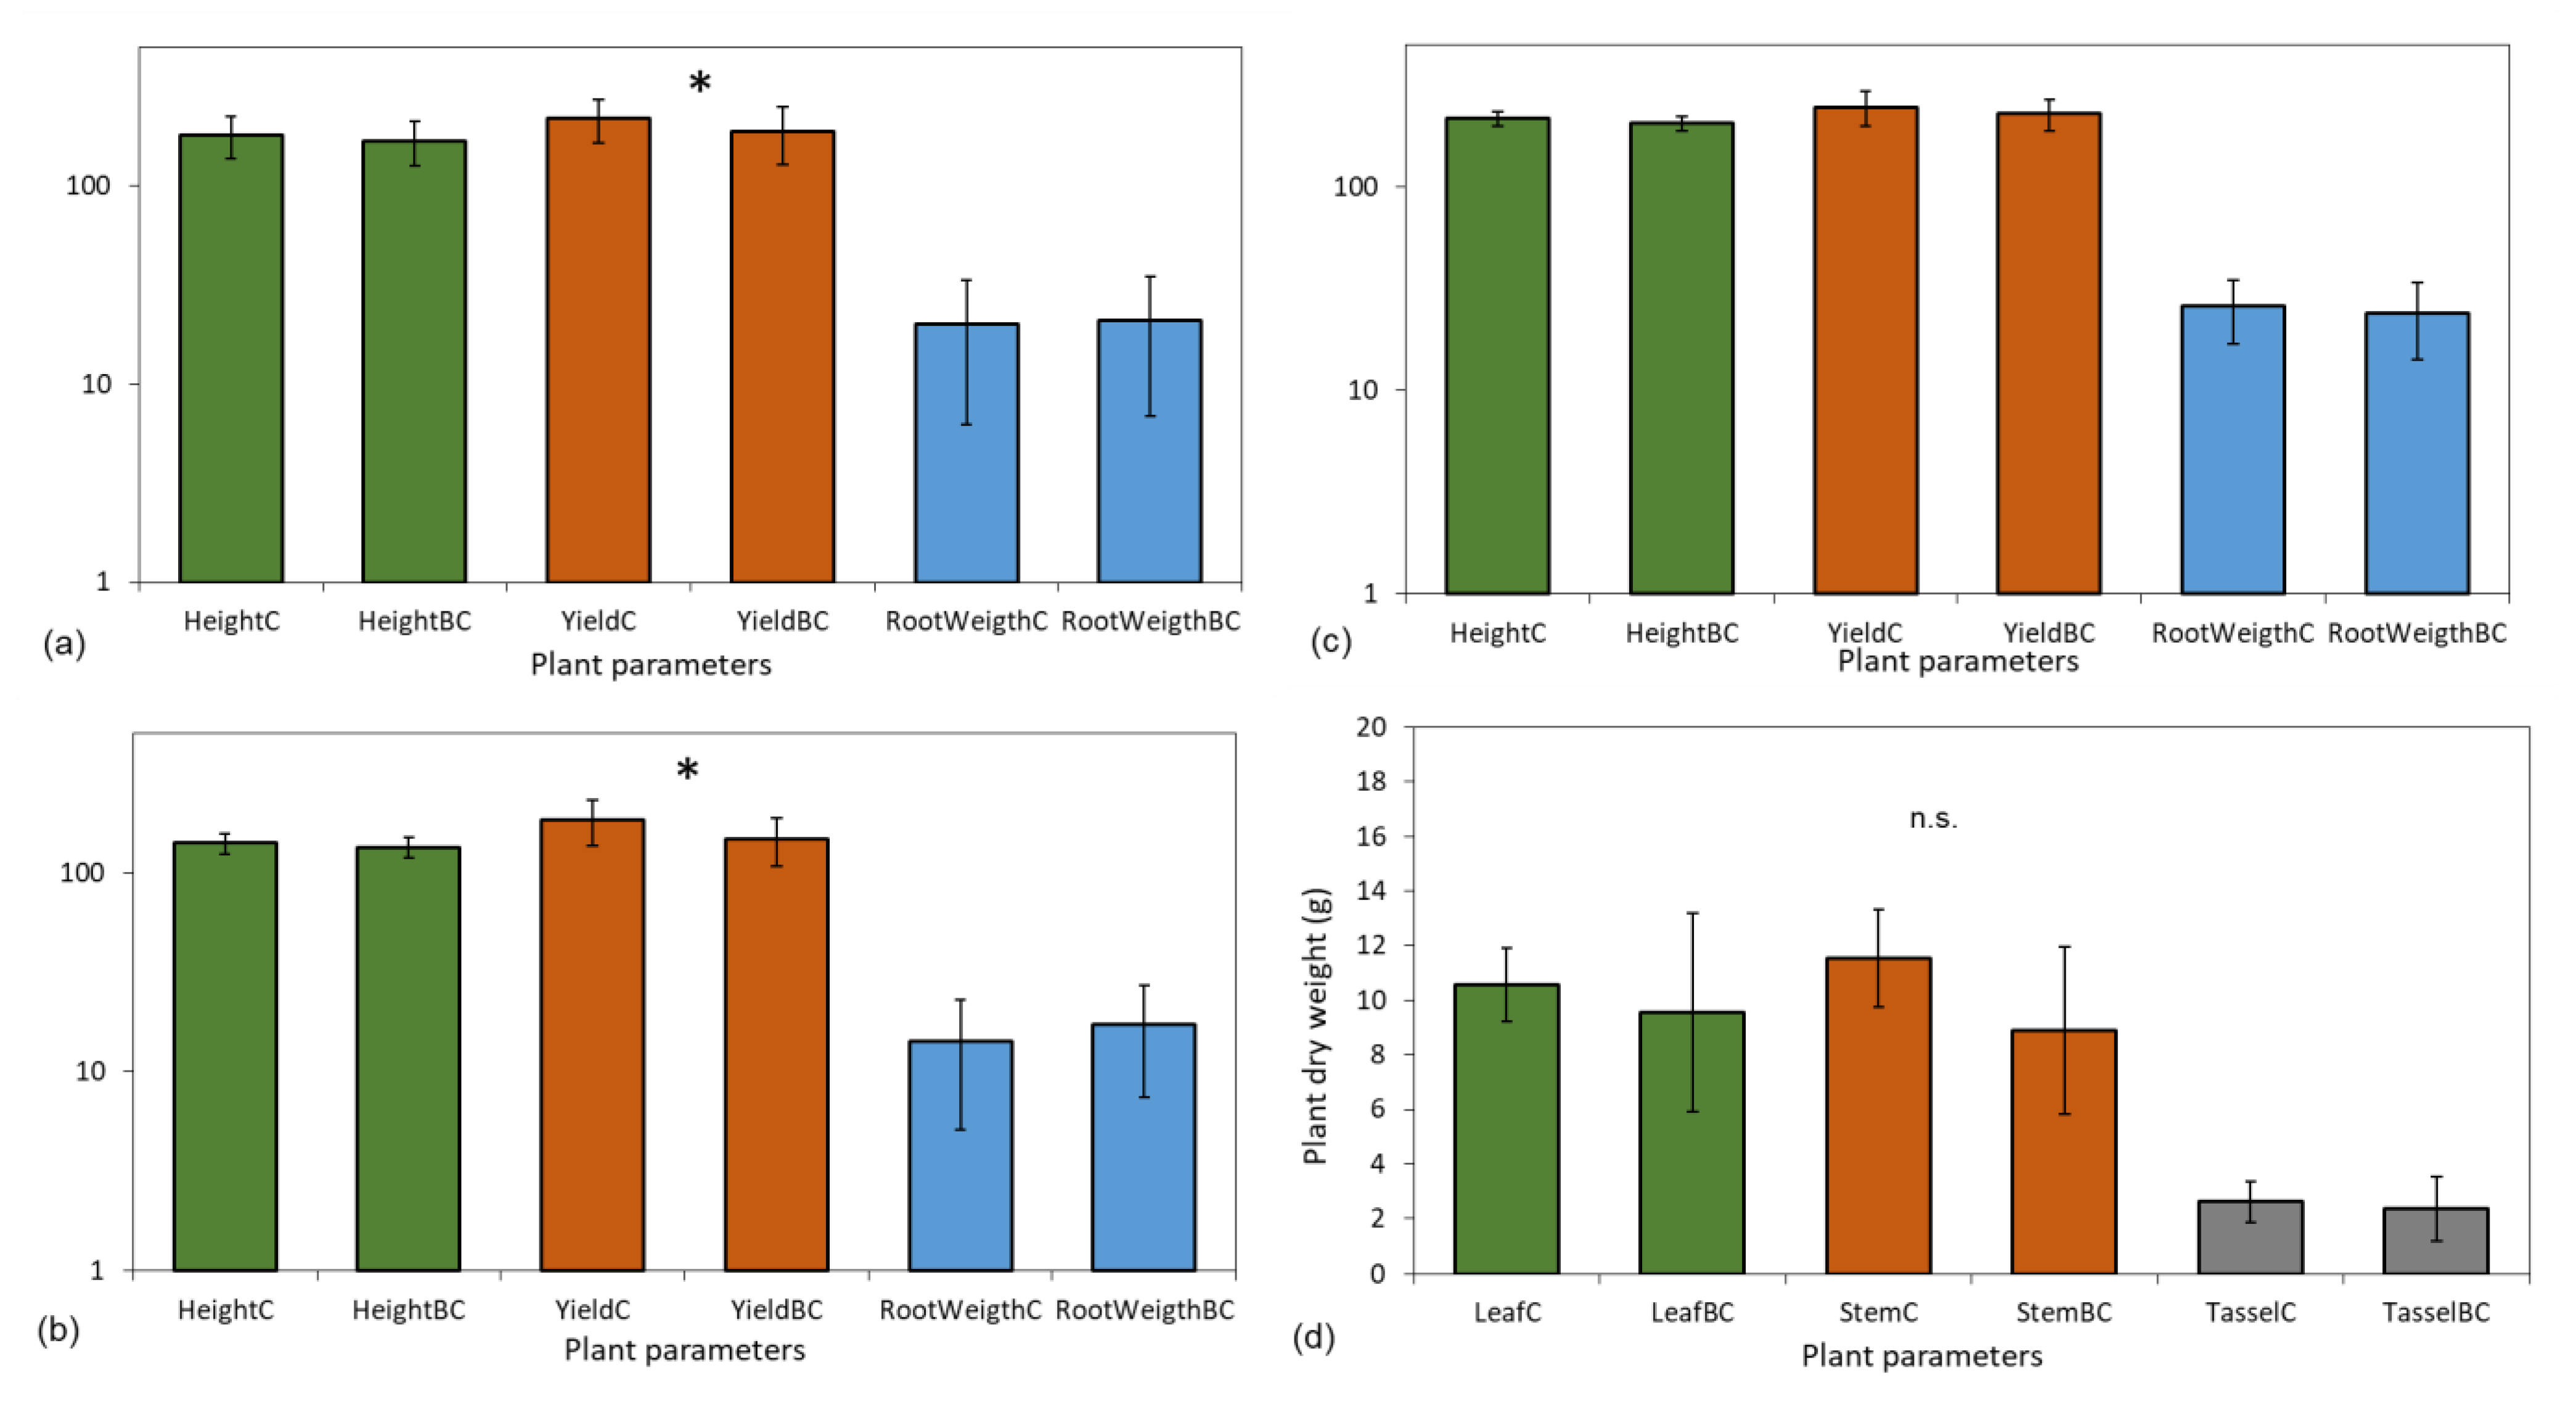
During the investigated years of 2017 and 2018, there were no significant differences observed between treatments for overall plant heights and aboveground or root biomass (Figure 2a,c,d). Crop yield showed significantly lower values for the biochar treatments compared to the control during the first year of the study, which diminished for the second year (Figure 2b). Between years, however, substantial differences were observed for both plant height and crop yield, indicating the importance of studying the long-term effects of biochar amendments. When examining the root dry mass of the plants, we found that biochar treatment improved root growth especially at the first year of the study; these differences also reduced by the end of the second year (Figure 2c). We also investigated separately the leaf, stem, and tassel dry weight of the plants, but found no significant differences between the treatments for either investigated years (Figure 2d).
There were only weak or moderately strong relationships observed between the investigated plant parameters (Table 1), most notably between leaves or root and stem thickness (r > 0.5).
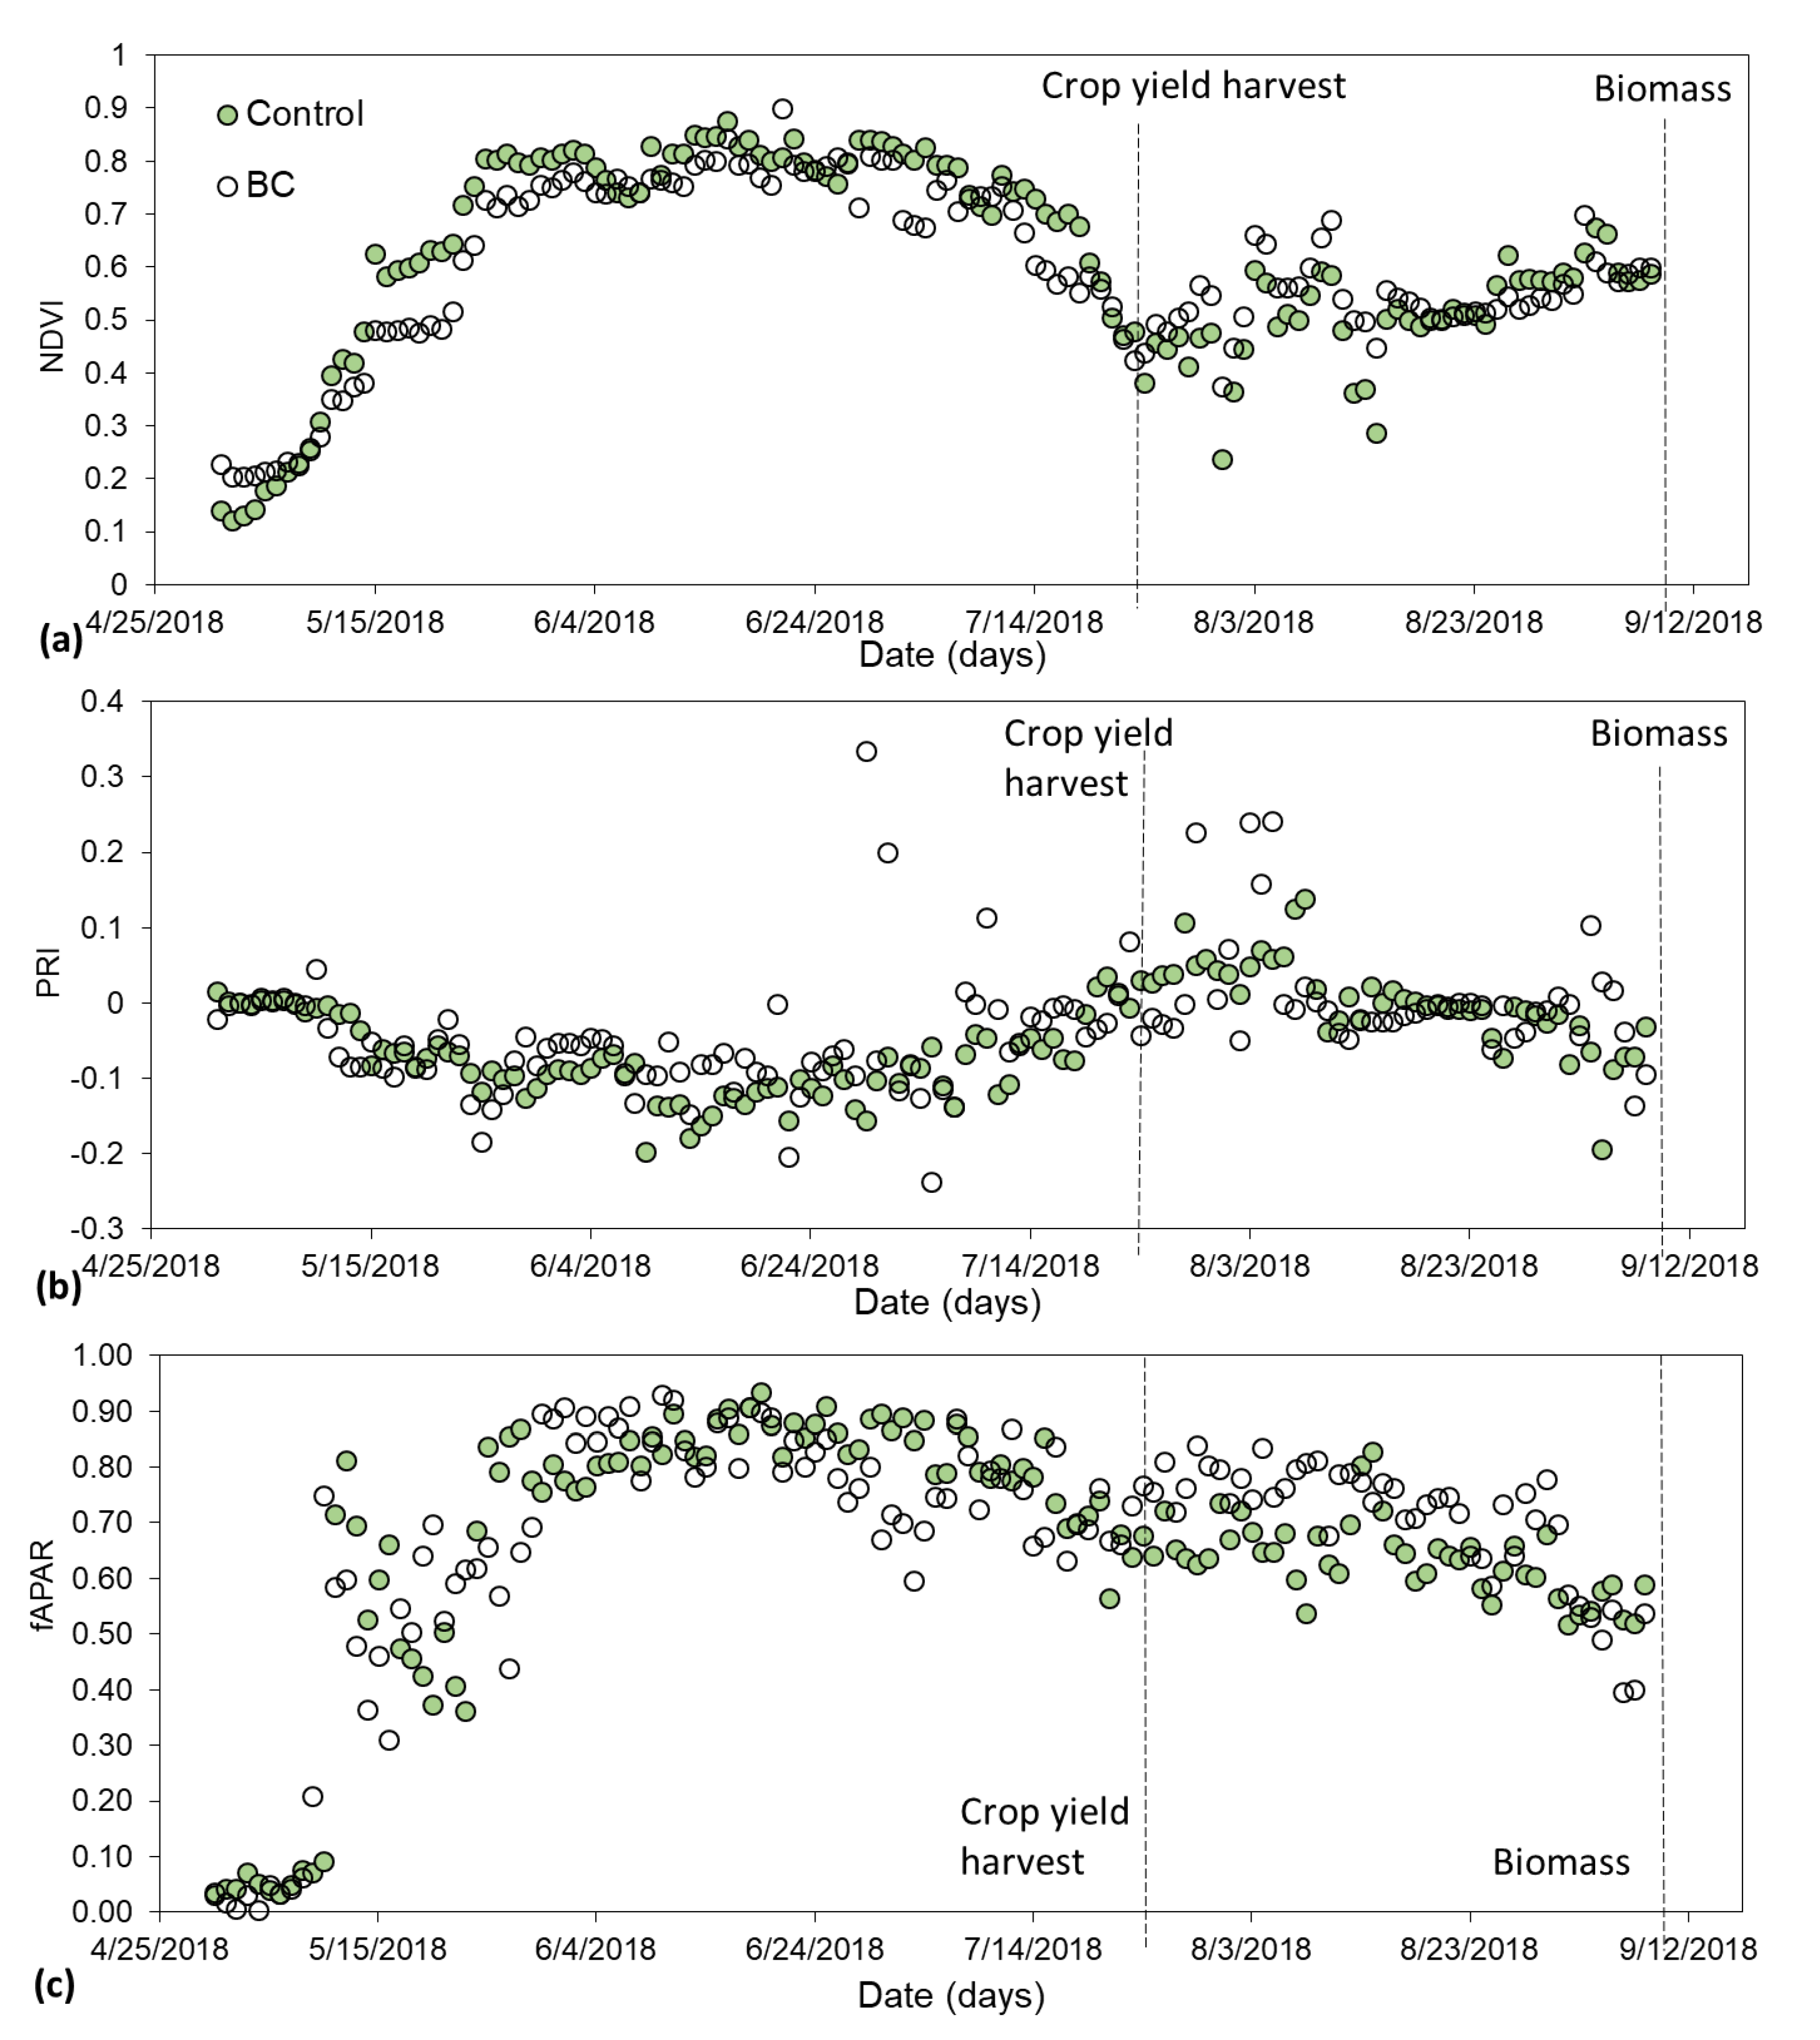
While some small variations were observed between control and biochar treatments for both NDVI and PRI, these differences were statistically only significant when time was considered (p < 0.01). Based on the NDVI data, after initially lower measurements, the control had higher values than the plants grown in biochar amended soils (Figure 3a). This finding shows an initially positive effect of biochar on the investigated plants; however, at later plant growth phases, the control plots had healthier and denser vegetation. After crop yield harvesting, biochar treatments also showed high NDVI values, while the plants were left in the soil. Plant heights were higher in the control, which corresponds with the higher NDVI values. Similar to the NDVI data, PRI values were similar for both treatments (p > 0.05), with somewhat lower values for the control compared to plants grown in biochar amended soil (Figure 3b). fAPAR values showed similar tendencies as well, with consistently higher values for biochar treatments only after crop yield harvest (Figure 3c). We found strong positive correlations between plant heights, aboveground biomass, and the first year’s belowground biomass (r > 0.5; p < 0.05). Negative correlations were observed for crop yield (overall and 2017) and biomass production (Table S1). Based on our results, biomass production for both treatments was similar, and the biochar amendment did not cause significant improvements. Strong, negative correlations were observed between PRI and fAPAR or NDVI values, and a strong positive correlation between NDVI and fAPAR (Table 1).
3.2. Soil Physical and Chemical Properties
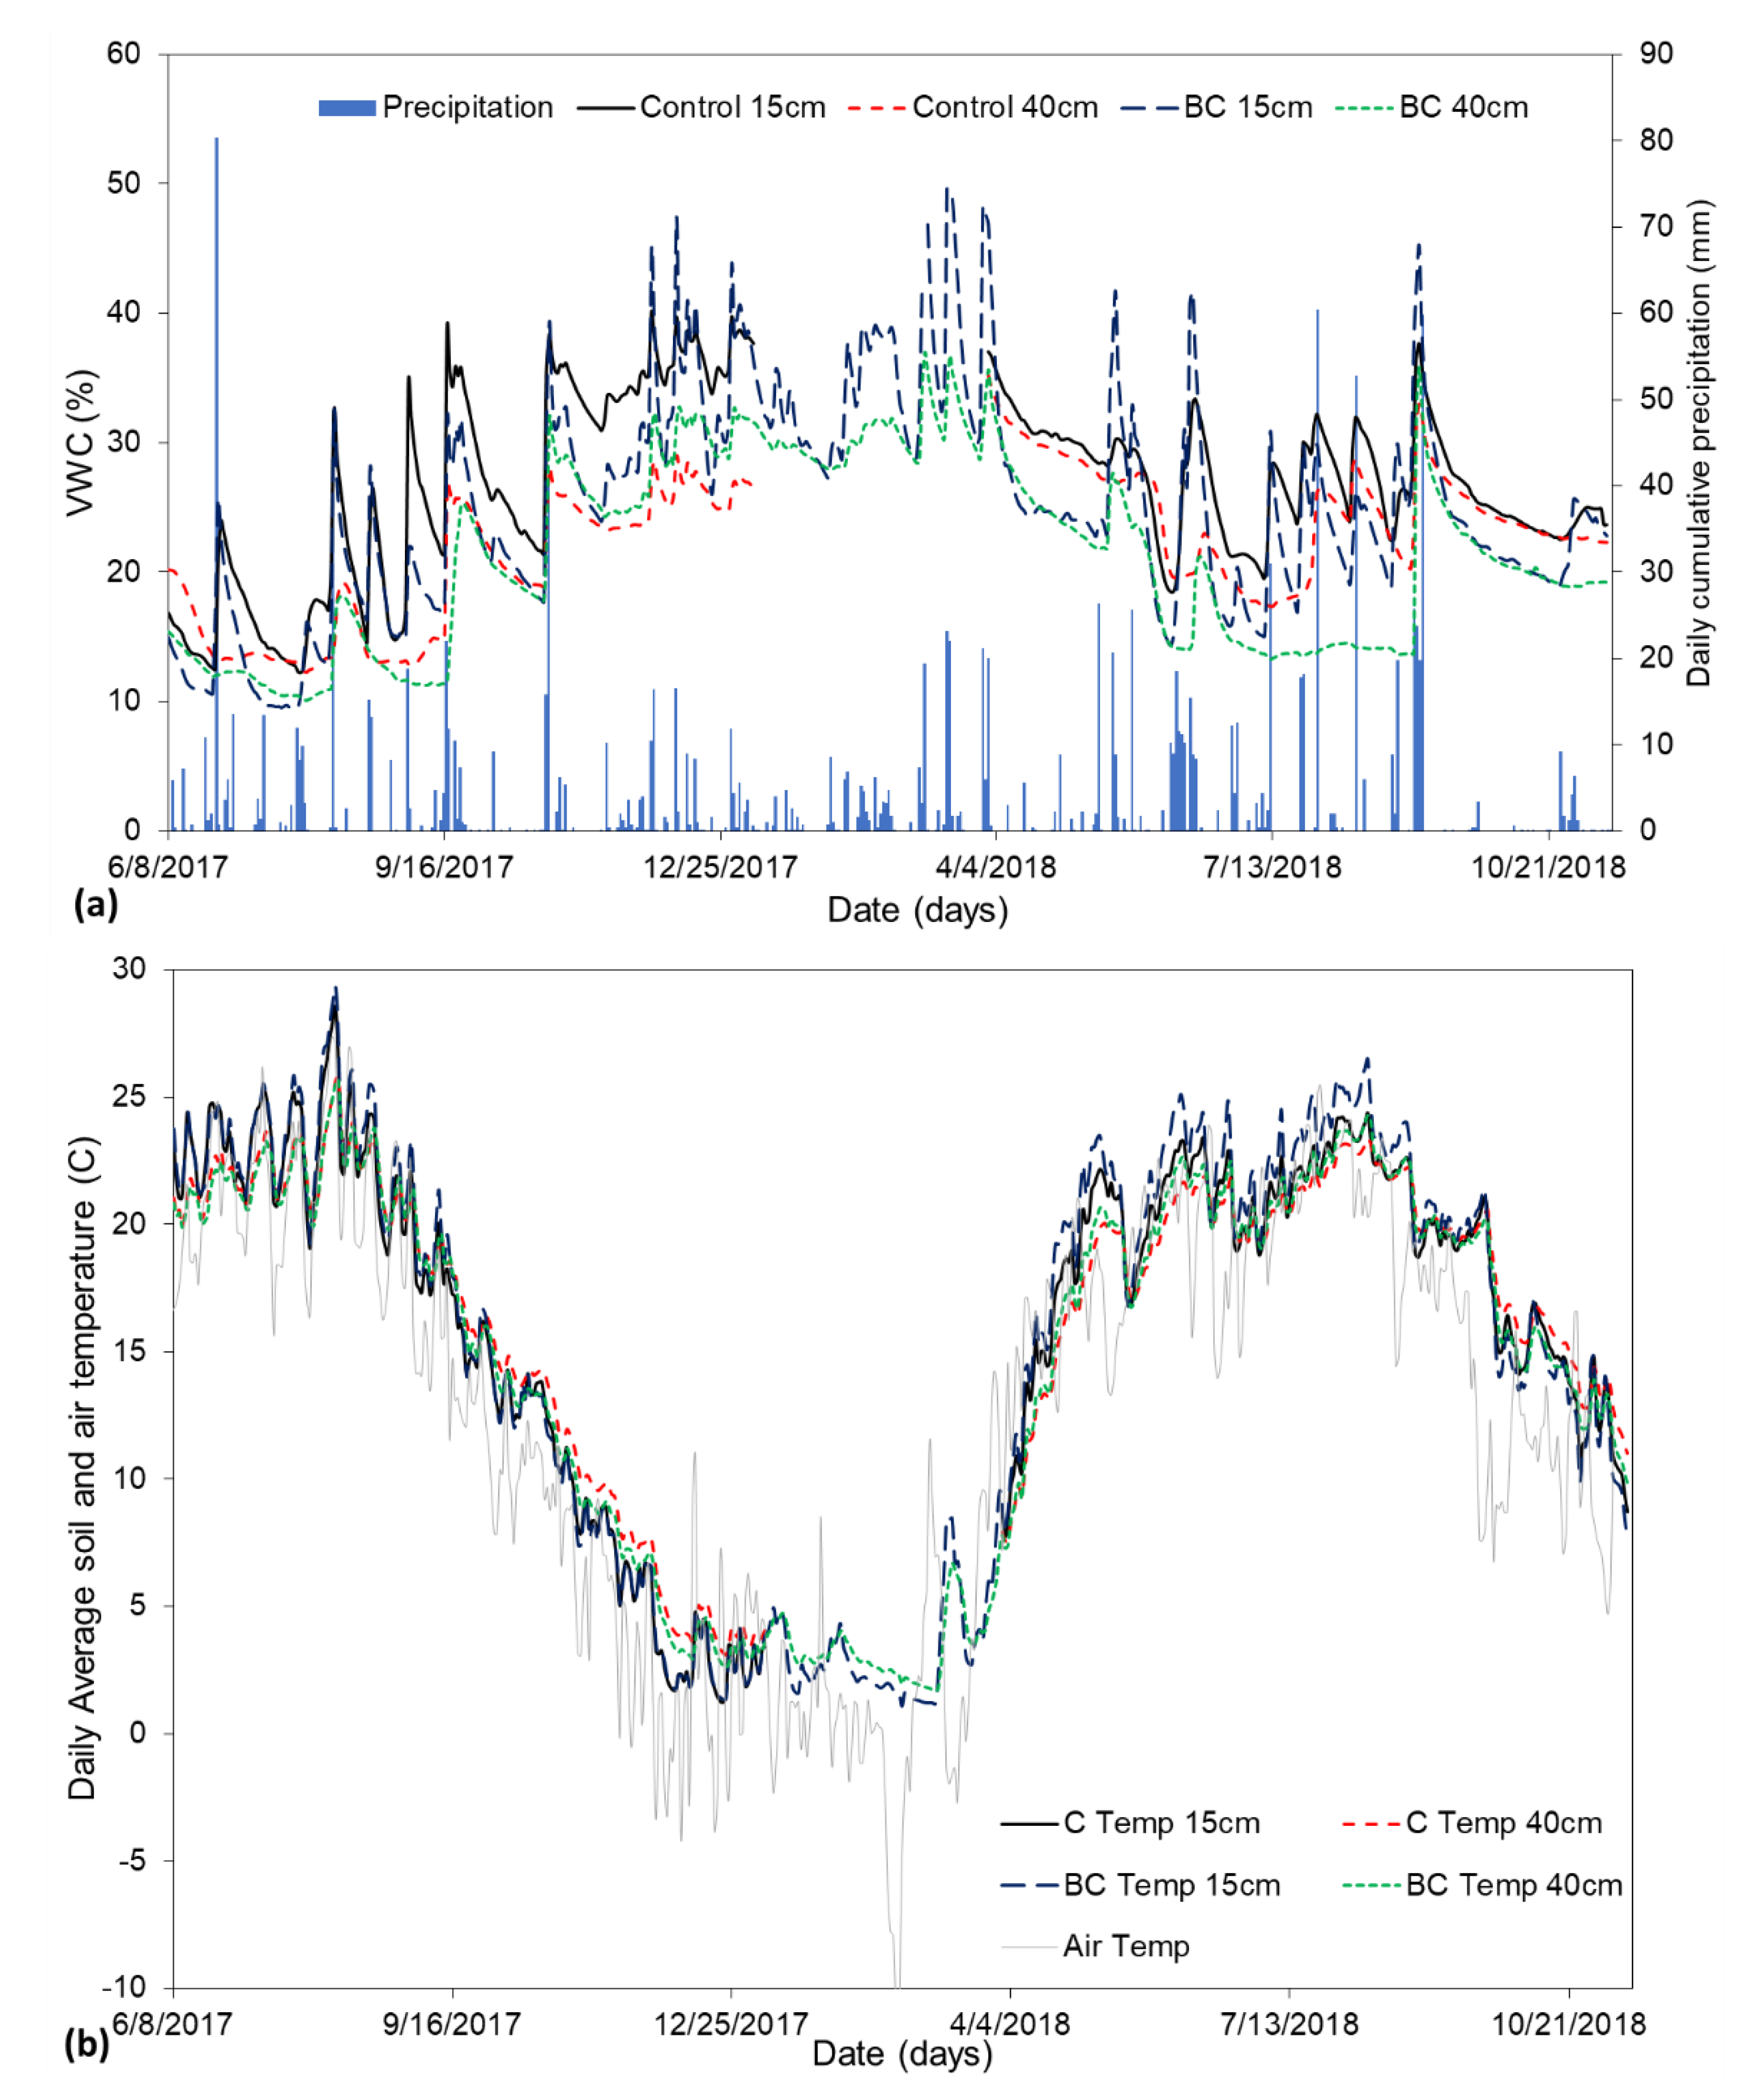
Soil water content was measured at 15 and 40 cm below the soil surface for two consecutive vegetation periods. The overall water content for the investigated years showed significant differences between treatments at both depths, and also within treatments at different depths (p ≤ 0.001). When exploring soil moisture changes at rain events, we found that the biochar amended soil had higher water content peaks (Figure 4a). However, the drying periods were also more intense in the biochar added soils compared to the control, resulting in less optimal conditions for plant growth. Due to these lower soil water values during no precipitation periods, the control had higher overall volumetric water content (VWC) for both years than the biochar amended soil (26.6% and 23.4% average VWC for the two vegetation periods, respectively; Figure 4a).
Soil temperature values were similar in both treatments during the study, with some higher values observed in the biochar amended soils for both investigated depths (Figure 4b). However, these differences were statistically not significant (p > 0.05).
Soil chemical parameters can change as a result of biochar amendment as well as nutrient uptakes by plants. Therefore, samples were collected from both control or empty plots (EC and EBC) and plant-covered (MC and MBC) plots to enable measuring differences caused by the presence of vegetation. The measured soil chemical parameters during the investigated years are presented in Table 2. It was expected that the alkaline biochar would increase soil pH values; however, significant differences were also observed in the non-amended EC18 plots. pH increases due to biochar amendment were more pronounced during the second year of the experiment compared to the first. In many cases, the measured soil chemical values were significantly different between the years (e.g., NH4+, NO3−) and not significant between the treatments (Table 2). These findings were expected as no additional nutrients or fertilizer was added to the soil during the experiment; therefore nutrient usage by plants and/or leaching deeper into the soil matrices could result these changes. For these reasons, decreases in SOC, K2O, P2O5, and NTot values were also observed for the second year of the study (Table 2).
3.3. Greenhouse Gas (GHG) Emissions
CO2 emission was measured during the vegetation period of maize for two consecutive years. While there were significant differences between treatments (p < 0.05), we observed similar CO2 emission trends in both years (Figure 5). During the growing season, until maize plants reached the two leaves stage, CO2 emission values remained at low levels, with values varying between 0.027 and 0.054 mg m−2 s−1 in 2017 and between 0.053 and 0.11 mg m−2 s−1 CO2 in 2018. In late spring and summer, till crop was harvested, higher CO2 emission was measured due to the presence of plant roots and increased air and soil temperatures. The highest values were measured in all four treatments at the end of June, 2017 after a heavy rainfall event (80 mm). In 2018 highest values were also measured during June, since it was a very rainy month in that year for this geographic region, with more than 130 mm rainfall in total. We observed positive correlations between soil temperatures and soil CO2 emissions at the depth of 15 cm (r = 0.51 and r = 0.64; p < 0.01 for empty and planted parcels, respectively); hence, we found that soil temperature was one of the main drivers in soil CO2 emission. Soil water content at the depth of 15 cm or at the depth of 40 cm and air temperature showed a smaller influence on CO2 emission than soil temperature (r < 0.06; p > 0.05 and 0.21 < r < 0.33, respectively).
Soil N2O emission measurements were carried out concurrently with the CO2 emission measurements on the same sampling days. N2O emission values were very low in all treatments, with the highest value of 0.056 µg m−2 s−1 N2O in MBC in 2017. During the growth of the plants, N2O emissions were positive, while during the second half of the vegetation period in 2017 and in the vegetation period in 2018 we observed several negative N2O emission values in most measurement days (Figure 6). As soil can act as a sink of N2O, our findings can support the possible use of biochar in reducing N2O emission. After harvest, all emission values decreased, and thistrend was more pronounced in 2017 (Figure 6a). There were no strong correlations observed between soil N2O emission and environmental parameters such as air temperature, SWC, or soil temperature.
The investigated GHG emissions were highly correlated with several soil chemical parameters, as shown in Table 3. Strong positive correlations were observed between both CO2 and N2O emissions and soil K2O or NH4+ concentrations. Also, positive correlations were observed between CO2 and NO3- and between soil N2O and P2O5 concentrations. Strong negative correlations were observed between GHG emissions and soil pH or NTot concentration (Table 3).
4. Discussion
4.1. Changes in Plant Growth and Soil Chemical and Physical Parameters
This study analyzed the soil’s physical and chemical properties and maize growth and development over time to see how the biochar amendment makes changes to the soil–plant–water system. In this study, crop yield decreased significantly during the first year while showing no significant differences between treatments in the second year. One of the main reasons for biochar amendment to soils is to increase crop yield [45,46], even if indirectly, such as through providing better environmental conditions for the plants to grow. However, many studies found that not all biochar can increase fruit or crop yield. Similar to the present study, Haider et al. [47] found reduced or no differences in grain yield for maize over a four-year-long period after biochar application. The authors indicated manganese deficiency caused by biochar amendment as a possible reason for these lower values. Pokovai et al. [4] showed that biochar can increase Capsicum annuum L. (pepper) fruit production; however, the amount of biochar was concluded to be crucial to achieving these benefits. The C/N ratio of the applied biochar is a very important parameter in soil fertility, especially when the soil is not fertilized with nitrogen. The addition of a compound with a high C/N ratio can cause nitrogen immobilization and therefore induce deficiencies in the plant. In the present study the 47:1 C:N ratio is very high.
In our study, the NDVI values were lower for the plants grown in biochar amended soils compared to the control, which was the opposite result to what was expected. Heidarian Dehkordi et al. [48] investigated chicory growth using high-resolution UAV-based imagery on century-old biochar patches. The authors found that biochar negatively affected plant greenness and observed negative weighted difference vegetation index values after plant maturity, while no significant differences were observed between biochar and control plots for NDVI [36]. Changes in the PRI values can indicate better utilization of the available nitrogen from the soil, as it might reduce the spectral values of PRI [4,49]. While the values were only marginally different between the treatments in the present study, the lower PRI values and the better nitrogen usage for the control treatment could explain the higher crop yield for both years. Similar to our findings, Ronga et al. [49] observed lower NDVI and higher PRI values for tomatoes growing in biochar amended soils compared to the control, assuming better use of available nutrients by the plants. By analyzing the fAPAR values plant developments can be observed, as the reduction in the light reaching the soil surface is directly proportional to the increase in biomass and leaf areas. The amount of light intercepted also depends on the leaves’ inclination, not just the biomass and leaf area. Plants make leaf movements to avoid water and light stress conditions. However, compared to the stiff leaves when the upper portion of the maize leaf bends over, the photosynthetic efficiency might decrease [50]. Therefore, changes in plant physiological traits such as increased aboveground biomass can lead to changes in the water and light response of the maize.
Biochar increased soil temperature at both 15 and 40 cm below the soil surface, which can greatly influence crop growth, especially during drought conditions. In biochar amended soils, the combination of the elevated soil temperature and the lower soil water content between precipitation events can cause declining soil conditions. Vitkova et al. [51] investigated maize and spring wheat yield and soil moisture changes as a result of biochar amendment. Consistent with our study, the authors found lower soil moisture in biochar amended treatment compared to the control, and also verified that crop yield increase was dependent on plant type. The type of biochar is also an important aspect of these types of studies. The biochar used in the present study is known to increase the specific surface area of the soil, which might enhance plant available water and water retention of the soils [13]. However, the increases in soil porosity and surface area for the investigated biochar amended maize parcels were not sufficient to result in improved crop yield. Based on our results, biochar could be more appropriate to enhance soil conditions in areas that are either not prone to drought or where frequent irrigation might be applicable.
4.2. Environmental Factors Affecting Soil GHG Emissions
The current study focused on soil GHG emissions to see how soil biological characteristics might be affected by the changes in the soil’s physical and chemical properties. We found an increase in CO2 and a decrease in N2O emissions when biochar was applied to soils planted with maize. Zhang et al. [46] and Fidel et al. [52] had similar findings under maize production when total N2O emission was decreased by 10.7% and by 40% in the case of biochar usage with 20 t ha−1 and 9.3 t ha−1 doses, respectively. Total CO2 emission was increased in the case of higher (e.g., 40 t ha−1) biochar doses [46]. Increased respiration can be expected as a result of biochar amendment both directly [53] and indirectly, due to higher plant biomass [54]. In the present study, overall root biomass was larger for the biochar amended treatments compared to the control; therefore, root respiration could cause elevated CO2 emissions in biochar amended soils. The presence of plants in the soil alone can change the overall GHG emissions. We observed a 9.5% increase in maize plots compared to plots without plants. Although during the first year of the study biochar amendment increased soil respiration in the plots with maize, it resulted in a 4.5% reduction in the two-year overall CO2 emissions for the planted plots compared with empty plots. It was found in earlier studies that the biochar used can change bulk density, consequently increasing soil porosity, which can result in higher oxygen in the larger pore spaces in the soil [12]. This changed soil physical parameter can cause better environmental conditions for aerobe microorganisms, ultimately increasing soil respiration. Similarly, soil N2O production can decrease as a result of faster soil drying and conditions with higher oxygen levels, which can reduce anaerobic processes. Our results highlight the importance of plant phenological status and the time of the season for GHG emissions. Both CO2 and N2O emissions were the highest earlier in the plant growth and reduced after plant maturity and harvest. Sosulski et al. [55] found similar results with lower CO2 production after plant maturity, especially after harvest. Biochar addition might increase soil CO2 emissions in maize fields; however, this elevated emission could also be much lower compared to other treatments, such as mulching as found by Yang et al. [56]. The present study investigated between row GHG emissions, while within row CO2 surface emissions could show a more pronounced differences, as 64% higher values were observed by Amos et al. [57] when in row measurements were compared to between row CO2 measurements.
Soil physical and chemical parameters can greatly influence soil GHG emissions, which was confirmed by the present study. We found soil temperature to be the main factor driving CO2 emissions, while in our study soil moisture showed no significant effect on GHG emissions. However, our study did not involve many precipitation extremes, and if so the sudden increases in VWC did not last long enough to fully capture its effects on the measured GHG emission as we had weekly GHG measurements. It was observed by Lu et al. [58] that soil temperature can have a more pronounced effect on soil respiration for maize when biochar is applied than soils without biochar or wheat straw addition. In many cases, soil temperature and water content can have a strong combined effect on soil CO2 and N2O emissions [35]. Soil chemical properties can significantly influence GHG production, which was also verified by the current study. The soil pH influenced GHG emissions, showing that an increase in pH value will decrease GHG, especially soil CO2 emissions. However, as the control soil already had high pH values at the beginning of the experiment, acidic conditions were not investigated. As low pH is one of the criteria for N2O emissions to occur in soils [59], our findings with low N2O values can be partially explained by the high pH and oxygen content, and the lacking conditions for an anaerobic environment. The increased adsorption of NO3- or the more complete denitrification of NO3- to N2 might also lead to a decrease in N2O emissions in biochar amended soils, as found by van Zwieten et al. [60] and Lévesque et al. [61]. During the days when no precipitation occurred, biochar amendment resulted in lower soil water content compared to control, which also resulted in a less favorable environment for N2O production by the microorganisms present in the soil, hence resulting in the differences in N2O emissions between the treatments. As biochar application greatly affects soil microbial population—both its density and diversity—the biochemical cycling of nitrogen and carbon changes. The N2O related microbial functional gene compositions can significantly differ in biochar amended soils [62]. Harter et al. [63] highlighted that biochar in soil affects the relative abundance and taxonomic composition of N2O-reducing microbial traits. Heterotrophic ammonia oxidation could be also an important driving factor for N2O production [50]. Although the microbial changes in soils due to biochar amendment were not the scope of this study, it is a crucial part of enhancing our understanding of the entire soil–plant–water system.
5. Conclusions
In the present study, we attained information on maize growth and crop yield for two consecutive years while measuring plant parameters, soil physical and chemical conditions, and GHG emissions. We observed substantial influence of biochar amendment on the soil–plant–water system and showed that soil physical, chemical, and biological properties can greatly affect plant growth and development, and GHG (as CO2 and N2O) productions. Soil temperature was the main driving factor for soil CO2 production (r > 0.5); however, we found strong correlations between GHG and soil chemical parameters, such as pH (r < −0.44) or nutrient contents (e.g., r > 0.51 for NH4+). In the present study, the environmental conditions over time showed a greater influence on the changes in the soil–plant–water system than biochar addition to soil only, which were demonstrated by the significantly lower crop yield or plant heights in 2017 compared to data gathered from 2018. Therefore, our study emphasizes the greater importance of the effects of a given year (e.g., changes in environmental, especially meteorological parameters) on plant growth, crop yield, and changes in soil chemical parameters than biochar amendment alone. However, in our study one type of biochar with the amount of 3 t ha−1 was used. Other types of biochar (e.g., from different parent materials or pyrolysis temperatures), or larger amounts might provide more pronounced differences between planted and biochar amended or non-amended parcels. Overall, careful evaluation of soil property changes over time on selected crop growth and development for additional years is required to further our knowledge on the long-term effects of biochar amendment.
Supplementary Materials
The following is available online at https://www.mdpi.com/article/10.3390/w13091216/s1, Table S1: Pearson correlation analysis (r) and p-value (p) between the investigated plant parameters for both investigated years (2017 and 2018) separately and together. C represents control, BC the biochar amended treatments, 17 and 18 are the years of 2017 and 2018, respectively. Correlation is significant at the p < 0.05 level.
Author Contributions
Conceptualization, Á.H.; methodology, Á.H. and E.T.; formal analysis, Á.H.; resources, Á.H. and E.T.; data curation, Á.H.; writing—original draft preparation, Á.H. and E.T.; writing—review and editing, Á.H. and E.T.; project administration, Á.H.; funding acquisition, Á.H. All authors have read and agreed to the published version of the manuscript.
Funding
This research was funded by the Hungarian National Research Fund, project numbers NKFI/OTKA FK-131792.
Institutional Review Board Statement
Not applicable.
Informed Consent Statement
Not applicable.
Data Availability Statement
Not applicable.
Acknowledgments
The authors would like to thank Imre Potyó for providing help with laboratory and analytical work during the study.
Conflicts of Interest
The authors declare no conflict of interest. The funders had no role in the design of the study; in the collection, analyses, or interpretation of data; in the writing of the manuscript, or in the decision to publish the results.
References
- Kammann, C.; Ratering, S.; Eckhard, C.; Müller, C. Biochar and Hydrochar Effects on Greenhouse Gas (Carbon Dioxide, Nitrous Oxide, and Methane) Fluxes from Soils. J. Environ. Qual. 2012, 41, 1052–1066. [Google Scholar] [CrossRef]
- Liu, Y.; Yang, M.; Wu, Y.; Wang, H.; Chen, Y.; Wu, W. Reducing CH4 and CO2 emissions from waterlogged paddy soil with biochar. J. Soils Sediments 2011, 11, 930–939. [Google Scholar] [CrossRef]
- Jeffery, S.; Abalos, D.; Spokas, K.A.; Verheijen, F.G.A. Biochar Effects on Crop Yield. In Biochar for Environmental Management: Science and Technology, 2nd ed.; Lehmann, J., Joseph, S., Eds.; Earthscan: London, UK, 2015; pp. 301–326. [Google Scholar]
- Pokovai, K.; Tóth, E.; Horel, Á. Growth and Photosynthetic Response of Capsicum annuum L. in Biochar Amended Soil. Appl. Sci. 2020, 10, 4111. [Google Scholar] [CrossRef]
- Rékási, M.; Szili-Kovács, T.; Takács, T.; Bernhardt, B.; Puspán, I.; Kovács, R.; Kutasi, J.; Draskovits, E.; Molnár, S.; Molnár, M.; et al. Improving the fertility of sandy soils in the temperate region by combined biochar and microbial inoculant treatments. Arch. Agron. Soil Sci. 2018, 65, 44–57. [Google Scholar] [CrossRef]
- Das, S.K.; Ghosh, G.K.; Avasthe, R. Valorizing biomass to engineered biochar and its impact on soil, plant, water, and microbial dynamics: A review. Biomass Convers. Biorefinery 2020, 1–17. [Google Scholar] [CrossRef]
- Karhu, K.; Mattila, T.; Bergström, I.; Regina, K. Biochar addition to agricultural soil increased CH4 uptake and water holding capacity—Results from a short-term pilot field study. Agric. Ecosyst. Environ. 2011, 140, 309–313. [Google Scholar] [CrossRef]
- Mao, J.; Zhang, K.; Chen, B. Linking hydrophobicity of biochar to the water repellency and water holding capacity of biochar-amended soil. Environ. Pollut. 2019, 253, 779–789. [Google Scholar] [CrossRef]
- Yu, O.-Y.; Raichle, B.; Sink, S. Impact of biochar on the water holding capacity of loamy sand soil. Int. J. Energy Environ. Eng. 2013, 4, 44. [Google Scholar] [CrossRef] [Green Version]
- Atkinson, C.J. How good is the evidence that soil-applied biochar improves water-holding capacity? Soil Use Manag. 2018, 34, 177–186. [Google Scholar] [CrossRef] [Green Version]
- Ouyang, L.; Wang, F.; Tang, J.; Yu, L.; Zhang, R. Effects of biochar amendment on soil aggregates and hydraulic properties. J. Soil Sci. Plant Nutr. 2013, 13, 991–1002. [Google Scholar] [CrossRef] [Green Version]
- Makó, A.; Barna, G.; Horel, Á. Soil physical properties affected by biochar addition at different plant phaenological phases. Part II. Int. Agrophysics 2019, 1, 1–7. [Google Scholar] [CrossRef]
- Barna, G.; Makó, A.; Takács, T.; Skic, K.; Füzy, A.; Horel, Á. Biochar alters soil physical characteristics, arbuscular mycorrhizal fungi colonization, and glomalin production. Agronomy 2020, 10, 1933. [Google Scholar] [CrossRef]
- Haider, G.; Koyro, H.-W.; Azam, F.; Steffens, D.; Müller, C.; Kammann, C. Biochar but not humic acid product amendment affected maize yields via improving plant-soil moisture relations. Plant Soil 2015, 395, 141–157. [Google Scholar] [CrossRef]
- Tanure, M.M.C.; da Costa, L.M.; Huiz, H.A.; Fernandes, R.B.A.; Cecon, P.R.; Junior, J.D.P.; da Luz, J.M.R. Soil water retention, physiological characteristics, and growth of maize plants in response to biochar application to soil. Soil Tillage Res. 2019, 192, 164–173. [Google Scholar] [CrossRef]
- Agegnehu, G.; Bass, A.M.; Nelson, P.N.; Bird, M.I. Benefits of biochar, compost and biochar–compost for soil quality, maize yield and greenhouse gas emissions in a tropical agricultural soil. Sci. Total Environ. 2016, 543, 295–306. [Google Scholar] [CrossRef] [PubMed]
- Borchard, N.; Siemens, J.; Ladd, B.; Möller, A.; Amelung, W. Application of biochars to sandy and silty soil failed to increase maize yield under common agricultural practice. Soil Tillage Res. 2014, 144, 184–194. [Google Scholar] [CrossRef]
- Thenot, F.; Méthy, M.; Winkel, T. The Photochemical Reflectance Index (PRI) as a water-stress index. Int. J. Remote Sens. 2002, 23, 5135–5139. [Google Scholar] [CrossRef]
- Gamon, J.A.; Field, C.B.; Goulden, M.L.; Griffin, K.L.; Hartley, A.E.; Joel, G.; Penuelas, J.; Valentini, R. Relationships Between NDVI, Canopy Structure, and Photosynthesis in Three Californian Vegetation Types. Ecol. Appl. 1995, 5, 28–41. [Google Scholar] [CrossRef] [Green Version]
- Fensholt, R.; Sandholt, I.; Rasmussen, M.S. Evaluation of MODIS LAI, fAPAR and the relation between fAPAR and NDVI in a semi-arid environment using in situ measurements. Remote Sens. Environ. 2004, 91, 490–507. [Google Scholar] [CrossRef]
- Xu, S.; Liu, Z.; Zhao, L.; Zhao, H.; Ren, S. Diurnal Response of Sun-Induced Fluorescence and PRI to Water Stress in Maize Using a Near-Surface Remote Sensing Platform. Remote Sens. 2018, 10, 1510. [Google Scholar] [CrossRef] [Green Version]
- Omondi, M.O.; Xia, X.; Nahayo, A.; Liu, X.; Korai, P.K.; Pan, G. Quantification of biochar effects on soil hydrological properties using meta-analysis of literature data. Geoderma 2016, 274, 28–34. [Google Scholar] [CrossRef]
- Bogunovic, I.; Andabaka, Z.; Stupic, D.; Pereira, P.; Galic, M.; Novak, K.; Telak, L.J. Continuous grass coverage as a management practice in humid environment vineyards increases compaction and CO2 emissions but does not modify must quality. Land Degrad. Dev. 2019, 30, 2347–2359. [Google Scholar] [CrossRef]
- Zimmerman, A.R.; Gao, B.; Ahn, M.-Y. Positive and negative carbon mineralization priming effects among a variety of biochar-amended soils. Soil Biol. Biochem. 2011, 43, 1169–1179. [Google Scholar] [CrossRef]
- Woolf, D.; Amonette, J.E.; Street-Perrott, F.A.; Lehmann, J.; Joseph, S.G. Sustainable biochar to mitigate global climate change. Nat. Commun. 2010, 1, 56. [Google Scholar] [CrossRef] [PubMed] [Green Version]
- He, Y.; Zhou, X.; Jiang, L.; Li, M.; Du, Z.; Zhou, G.; Shao, J.; Wang, X.; Xu, Z.; Bai, S.H.; et al. Effects of biochar application on soil greenhouse gas fluxes: A meta-analysis. GCB Bioenergy 2017, 9, 743–755. [Google Scholar] [CrossRef]
- Troy, S.M.; Lawlor, P.G.; Flynn, C.J.O.; Healy, M.G. Impact of biochar addition to soil on greenhouse gas emissions following pig manure application. Soil Biol. Biochem. 2013, 60, 173–181. [Google Scholar] [CrossRef] [Green Version]
- Spokas, K.A.; Reicosky, D.C. Impacts of sixteen different biochars on soil greenhouse gas production. Ann. Environ. Sci. 2009, 3, 179–193. [Google Scholar]
- Yang, S.; Jiang, Z.; Sun, X.; Ding, J.; Xu, J. Effects of Biochar Amendment on CO2 Emissions from Paddy Fields under Water-Saving Irrigation. Int. J. Environ. Res. Public Health 2018, 15, 2580. [Google Scholar] [CrossRef] [Green Version]
- Shen, Y.; Zhu, L.; Cheng, H.; Yue, S.; Li, S. Effects of Biochar Application on CO2 Emissions from a Cultivated Soil under Semiarid Climate Conditions in Northwest China. Sustainability 2017, 9, 1482. [Google Scholar] [CrossRef] [Green Version]
- Yuan, H.; Lu, T.; Wang, Y.; Huang, H.; Chen, Y. Influence of pyrolysis temperature and holding time on properties of biochar derived from medicinal herb (radix isatidis) residue and its effect on soil CO2 emission. J. Anal. Appl. Pyrolysis 2014, 110, 277–284. [Google Scholar] [CrossRef]
- Ameloot, N.; De Neve, S.; Jegajeevagan, K.; Yildiz, G.; Buchan, D.; Funkuin, Y.N.; Prins, W.; Bouckaert, L.; Sleutel, S. Short-term CO2 and N2O emissions and microbial properties of biochar amended sandy loam soils. Soil Biol. Biochem. 2013, 57, 401–410. [Google Scholar] [CrossRef]
- Cayuela, M.; van Zwieten, L.; Singh, B.; Jeffery, S.; Roig, A.; Sánchez-Monedero, M. Biochar’s role in mitigating soil nitrous oxide emissions: A review and meta-analysis. Agric. Ecosyst. Environ. 2014, 191, 5–16. [Google Scholar] [CrossRef]
- Cox, J.; Davy, M.; Van Zwieten, L.; Morris, S.; Kimber, S. Biochar and compost soil amendments affect soil carbon and greenhouse gas emissions. Acta Hortic. 2017, 225–232. [Google Scholar] [CrossRef]
- Horel, Á.; Tóth, E.; Gelybó, G.; Dencső, M.; Potyó, I. Soil CO2 and N2O Emission Drivers in a Vineyard (Vitis vinifera) under Different Soil Management Systems and Amendments. Sustainability 2018, 10, 1811. [Google Scholar] [CrossRef] [Green Version]
- Ribas, A.; Mattana, S.; Llurba, R.; Debouk, H.; Sebastià, M.; Domene, X. Biochar application and summer temperatures reduce N2O and enhance CH4 emissions in a Mediterranean agroecosystem: Role of biologically-induced anoxic microsites. Sci. Total Environ. 2019, 685, 1075–1086. [Google Scholar] [CrossRef] [PubMed]
- Van Zwieten, L.; Kimber, S.; Morris, S.; Macdonald, L.M.; Rust, J.; Petty, S.; Joseph, S.; Rose, T. Biochar improves diary pasture yields by alleviating P and K constraints with no influence on soil respiration or N2O emissions. Biochar 2019, 1, 115–126. [Google Scholar] [CrossRef] [Green Version]
- Dövényi, Z. Magyarország Kistájainak Katasztere; MTA Földrajztudományi Kutatóintézet: Budapest, Hungary, 2010; p. 876. (In Hungarian) [Google Scholar]
- FAO; IUSS. International Soil Classification System for Naming Soils and Creating Legends for Soil Maps—Update 2015; FAO: Rome, Italy, 2015; p. 203. [Google Scholar]
- Alburquerque, J.A.; Calero, J.M.; Barrón, V.; Torrent, J.; Del Campillo, M.C.; Gallardo, A.; Villar, R. Effects of biochars produced from different feedstocks on soil properties and sunflower growth. J. Plant Nutr. Soil Sci. 2014, 177, 16–25. [Google Scholar] [CrossRef]
- Shackley, S. The Economic Viability and Propspects for Biochar in Europe: Shifting Paradigms in Uncertain Times. In Biochar in European Soils and Agriculture. Science and Practice; Shackley, S., Ruysschaert, G., Zwart, K., Glaser, B., Eds.; Routledge: London, UK, 2016; pp. 205–226. [Google Scholar]
- Monteith, J.L. Climatic variation and the growth of crops. Q. J. R. Meteorol. Soc. 2007, 107, 749–774. [Google Scholar] [CrossRef]
- Gamon, J.A.; Kovalchuck, O.; Wong, C.Y.S.; Harris, A.; Garrity, S.R. Monitoring seasonal and diurnal changes in photosynthetic pigments with automated PRI and NDVI sensors. Biogeosciences 2015, 12, 4149–4159. [Google Scholar] [CrossRef] [Green Version]
- Soudani, K.; Hmimina, G.; Dufrêne, E.; Berveiller, D.; Delpierre, N.; Ourcival, J.-M.; Rambal, S.; Joffre, R. Relationships between photochemical reflectance index and light-use efficiency in deciduous and evergreen broadleaf forests. Remote Sens. Environ. 2014, 144, 73–84. [Google Scholar] [CrossRef]
- Cornelissen, G.; Martinsen, V.; Shitumbanuma, V.; Alling, V.K.G.; Breedveld, G.D.; Rutherford, D.W.; Sparrevik, L.M.; Hale, S.E.; Obia, A.; Mulder, J. Biochar Effect on Maize Yield and Soil Characteristics in Five Conservation Farming Sites in Zambia. Agronomy 2013, 3, 256–274. [Google Scholar] [CrossRef] [Green Version]
- Zhang, A.; Liu, Y.; Pan, G.; Hussain, Q.; Li, L.; Zheng, J.; Zhang, X. Effect of biochar amendment on maize yield and greenhouse gas emissions from a soil organic carbon poor calcareous loamy soil from Central China Plain. Plant Soil 2012, 351, 263–275. [Google Scholar] [CrossRef]
- Haider, G.; Steffens, D.; Moser, G.; Müller, C.; Kammann, C.I. Biochar reduced nitrate leaching and improved soil moisture content without yield improvements in a four-year field study. Agric. Ecosyst. Environ. 2017, 237, 80–94. [Google Scholar] [CrossRef]
- Dehkordi, R.H.; Denis, A.; Fouche, J.; Burgeon, V.; Cornelis, J.T.; Tychon, B.; Gomez, E.P.; Meersmans, J. Remotely-sensed assessment of the impact of century-old biochar on chicory crop growth using high-resolution UAV-based imagery. Int. J. Appl. Earth Obs. Geoinf. 2020, 91, 102147. [Google Scholar] [CrossRef]
- Ronga, D.; Caradonia, F.; Parisi, M.; Bezzi, G.; Parisi, B.; Allesina, G.; Pedrazzi, S.; Francia, E. Using Digestate and Biochar as Fertilizers to Improve Processing Tomato Production Sustainability. Agronomy 2020, 10, 138. [Google Scholar] [CrossRef] [Green Version]
- Duncan, W.C. Cultural Manipulation for Higher Yields. In Physiological Aspects of Crop Yield; University of Nebraska—Lincoln: Madison, WI, USA, 1969; pp. 327–339. [Google Scholar]
- Vitkova, J.; Surda, P.; Kondrlova, E.; Horak, J.; Rodny, M. Analysis of soil water content and crop yield after biochar application in field conditions. Plant Soil Environ. 2017, 63, 569–573. [Google Scholar]
- Fidel, R.B.; Laird, D.A.; Parkin, T.B. Effect of Biochar on Soil Greenhouse Gas Emissions at the Laboratory and Field Scales. Soil Syst. 2019, 3, 8. [Google Scholar] [CrossRef] [Green Version]
- Smith, J.L.; Collins, H.P.; Bailey, V.L. The effect of young biochar on soil respiration. Soil Biol. Biochem. 2010, 42, 2345–2347. [Google Scholar] [CrossRef]
- Major, J.; Lehmann, J.; Rondon, M.; Goodale, C. Fate of soil-applied black carbon: Downward migration, leaching and soil respiration. Glob. Chang. Biol. 2010, 16, 1366–1379. [Google Scholar] [CrossRef]
- Sosulski, T.; Szymańska, M.; Szara, E. CO2 Emissions from Soil Under Fodder Maize Cultivation. Agronomy 2020, 10, 1087. [Google Scholar] [CrossRef]
- Yang, X.; Meng, J.; Lan, Y.; Chen, W.; Yang, T.; Yuan, J.; Liu, S.; Han, J. Effects of maize stover and its biochar on soil CO2 emissions and labile organic carbon fractions in Northeast China. Agric. Ecosyst. Environ. 2017, 240, 24–31. [Google Scholar] [CrossRef]
- Amos, B.; Arkebauer, T.J.; Doran, J.W. Soil Surface Fluxes of Greenhouse Gases in an Irrigated Maize-Based Agroecosystem. Soil Sci. Soc. Am. J. 2005, 69, 387–395. [Google Scholar] [CrossRef] [Green Version]
- Lu, N.; Liu, X.-R.; Du, Z.-L.; Wang, Y.-D.; Zhang, Q.-Z. Effect of biochar on soil respiration in the maize growing season after 5 years of consecutive application. Soil Res. 2014, 52, 505. [Google Scholar] [CrossRef]
- Richardson, D.; Felgate, H.; Watmough, N.; Thomson, A.; Baggs, E. Mitigating release of the potent greenhouse gas N2O from the nitrogen cycle—Could enzymic regulation hold the key? Trends Biotechnol. 2009, 27, 388–397. [Google Scholar] [CrossRef]
- Van Zwieten, L.; Kimber, S.W.L.; Morris, S.G.; Downie, A.; Berger, E.; Rust, J.H.; Scheer, C. Influence of biochars on flux of N2O and CO2 from Ferrosol. Soil Res. 2010, 48, 555–568. [Google Scholar] [CrossRef]
- Lévesque, V.; Rochette, P.; Hogue, R.; Jeanne, T.; Ziadi, N.; Chantigny, M.H.; Dorais, M.; Antoun, H. Greenhouse gas emissions and soil bacterial community as affected by biochar amendments after periodic mineral fertilizer applications. Biol. Fertil. Soils 2020, 56, 907–925. [Google Scholar] [CrossRef]
- Huang, R.; Wang, Y.; Liu, J.; Li, J.; Xu, G.; Luo, M.; Xu, C.; Ci, E.; Gao, M. Variation in N2O emission and N2O related microbial functional genes in straw- and biochar-amended and non-amended soils. Appl. Soil Ecol. 2019, 137, 57–68. [Google Scholar] [CrossRef]
- Harter, J.; Weigold, P.; El-Hadidi, M.; Huson, D.H.; Kappler, A.; Behrens, S. Soil biochar amendment shapes the composition of N2O-reducing microbial communities. Sci. Total Environ. 2016, 562, 379. [Google Scholar] [CrossRef] [PubMed]
Figure 1.
Schematics of the experimental setup.

Figure 2.
Maize growth of height (cm), crop yield (g), and root dry weight (g) for (a) the two-year averages, (b) 2017, (c) 2018 and (d) aboveground biomass in control (C) and biochar (BC) amended soils. * indicates statistically significant differences between treatments. n.s. represents no significant differences.

Figure 3.
Average midday values of (a) normalized difference vegetation index (NDVI), (b) photochemical reflectance index (PRI), and (c) fraction of absorbed photosynthetically active radiation (fAPAR) data for the control and biochar (BC) treatments during vegetation growth in 2018. Dotted lines represent the times of crop yield and biomass harvests.

Figure 4.
Changes in (a) soil volumetric water content (VWC) and (b) soil temperature as influenced by biochar (BC) addition.
Figure 4.
Changes in (a) soil volumetric water content (VWC) and (b) soil temperature as influenced by biochar (BC) addition.

Figure 5.
Soil CO2 emission for the different treatments measured in (a) 2017 and in (b) 2018. n = 4; ± SD. EC represents empty control plots, MC represents the control plots with maize, EBC represents the empty plots with biochar, and MBC represents the plots with maize and biochar amendment.
Figure 5.
Soil CO2 emission for the different treatments measured in (a) 2017 and in (b) 2018. n = 4; ± SD. EC represents empty control plots, MC represents the control plots with maize, EBC represents the empty plots with biochar, and MBC represents the plots with maize and biochar amendment.

Figure 6.
Soil N2O emission for the different treatments measured in (a) 2017 and in (b) 2018. n = 4; ± SD. EC represents empty control plots, MC represents the control plots with maize, EBC represents the empty plots with biochar, and MBC represents the plots with maize and biochar amendment.
Figure 6.
Soil N2O emission for the different treatments measured in (a) 2017 and in (b) 2018. n = 4; ± SD. EC represents empty control plots, MC represents the control plots with maize, EBC represents the empty plots with biochar, and MBC represents the plots with maize and biochar amendment.


Table 1.
Pearson correlation analysis (r) and p-value (p) between the investigated plant parameters. Correlation is significant at the * 0.05 and *** 0.001 level.
Table 1.
Pearson correlation analysis (r) and p-value (p) between the investigated plant parameters. Correlation is significant at the * 0.05 and *** 0.001 level.
| p\r | Height | Crop Yield | Root | Leaf | Stem | Tassel | NDVI | PRI | fAPAR |
|---|---|---|---|---|---|---|---|---|---|
| Height | 0.400 | 0.290 | −0.170 | 0.140 | 0.370 | −0.010 | 0.180 | 0.130 | |
| Crop Yield | 0.000 *** | 0.030 | −0.070 | −0.300 | −0.050 | −0.010 | −0.080 | 0.040 | |
| Root | 0.000 *** | 0.638 | −0.050 | 0.540 | 0.380 | 0.090 | 0.070 | 0.150 | |
| Leaf | 0.577 | 0.808 | 0.868 | 0.500 | −0.210 | 0.090 | 0.080 | 0.200 | |
| Stem | 0.671 | 0.351 | 0.071 | 0.097 | −0.020 | −0.130 | 0.180 | −0.290 | |
| Tassel | 0.174 | 0.857 | 0.165 | 0.490 | 0.942 | −0.020 | −0.180 | 0.120 | |
| NDVI | 0.840 | 0.843 | 0.199 | 0.781 | 0.682 | 0.951 | −0.560 | 0.790 | |
| PRI | 0.014 * | 0.279 | 0.329 | 0.797 | 0.572 | 0.522 | 0.000 *** | −0.390 | |
| fAPAR | 0.072 | 0.620 | 0.032 * | 0.505 | 0.365 | 0.666 | 0.000 *** | 0.000 *** |
Table 2.
Chemical characteristics of the soil without (E) and with maize (M) or biochar (BC) amendment during 2017 (17) and 2018 (18) of the experiment. Initial data represents the average values of the soil samples collected prior to plant sowing or biochar application. n = 3; mean ± SD. Small letters represent statistically significant differences between groups (ANOVA with Tukey’s HSD).
| pH-H2O | SOC (%) | Ntot (%) | C/N | K2O (mg kg−1) | P2O5 (mg kg−1) | NH4+ (mg kg−1) | NO3− (mg kg−1) | |
|---|---|---|---|---|---|---|---|---|
| Initial | 7.83 ± 0.1 | 1.45 ± 0.16 | 0.19 ± 0.03 | 7.89 ± 0.67 | 475.3 ± 162.6 | 623.0 ± 166.4 | 6.63 ± 0.29 | 9.73 ± 1.9 |
| EC17 | 7.70 ± 0.05 c | 1.72 ± 0.08 a | 0.20 ± 0 a | 8.56 ± 0.32 a | 543.9 ± 51.6 a | 528.0 ± 68.7 a | 7.10 ± 1.41 a | 63.2 ± 18 a |
| MC17 | 7.73 ± 0.04 c | 1.37 ± 0.1 c | 0.18 ± 0.02 b | 7.67 ± 0.42 a | 502.5 ± 108.9 b | 468.1 ± 60.7 ab | 6.10 ± 0.44 a | 60.3 ± 8.76 a |
| EBC17 | 7.88 ± 0.02 b | 1.62 ± 0.02 ab | 0.19 ± 0.01 b | 8.54 ± 0.45 a | 613.3 ± 130.7 a | 524.6 ± 39.1 a | 5.90 ± 0.99 a | 43. ±8.98 b |
| MBC17 | 7.81 ± 0.04 c | 1.41 ± 0.12 b c | 0.18 ± 0 b | 8.03 ± 0.82 a | 478.5 ± 6.0 b | 468.4 ± 56.4 b | 6.00 ± 1.73 a | 59.6 ± 3.4 a |
| EC18 | 7.99 ± 0.01 a | 1.26 ± 0.02 c | 0.15 ± 0.01d | 8.48 ± 0.13 a | 228.5 ± 13.7 b | 301.2 ± 11.2d | 2.98 ± 0.03 b | 18.9 ± 3.0 c |
| MC18 | 7.89 ± 0.06 b | 1.35 ± 0.06 c | 0.17 ± 0 b | 8.00 ± 0.21 a | 258.4 ± 10.7 b | 395.6 ± 28.6 c | 2.13 ± 0.73 b | 21.3 ± 6.1 c |
| EBC18 | 7.93 ± 0.01 a | 1.33 ± 0.02 c | 0.15 ± 0 cd | 8.64 ± 0.02 a | 259.2 ± 13.1 b | 393.5 ± 0.3 c | 3.22 ± 0.32 b | 17.1 ± 0.5 c |
| MBC18 | 7.85 ± 0.13 c | 1.52 ± 0.1 c | 0.17 ± 0.01 c | 9.08 ± 0.54 a | 301.1 ± 13.9 a | 393.7 ± 18.4 c | 2.97 ± 0.84 b | 19.3 ±1.8 c |
Table 3.
Pearson correlation analysis (r) and p-value (p) between the investigated soil chemical parameters and GHG emissions for the empty and planted with maize plots (n = 27). Correlation is significant at the * 0.05, ** 0.01, and *** 0.001 level.
Table 3.
Pearson correlation analysis (r) and p-value (p) between the investigated soil chemical parameters and GHG emissions for the empty and planted with maize plots (n = 27). Correlation is significant at the * 0.05, ** 0.01, and *** 0.001 level.
| r | pH | SOC | K2O | P2O5 | NTot | NH4+ | NO3− |
|---|---|---|---|---|---|---|---|
| Empty_CO2 | −0.65 | 0.05 | 0.58 | 0.42 | −0.57 | 0.59 | 0.61 |
| Maize_CO2 | −0.62 | 0.33 | 0.59 | 0.54 | −0.62 | 0.51 | 0.59 |
| Empty_N2O | −0.54 | 0.10 | 0.69 | 0.67 | −0.63 | 0.67 | 0.39 |
| Maize_N2O | −0.44 | 0.10 | 0.59 | 0.62 | −0.50 | 0.54 | 0.26 |
| p | pH | SOC | K2O | P2O5 | NTot | NH4+ | NO3− |
| Empty_CO2 | 0.0004 *** | 0.7935 | 0.0019 ** | 0.0325 * | 0.0024 ** | 0.0016 ** | 0.001 *** |
| Maize_CO2 | 0.0008 *** | 0.0983 | 0.0014 ** | 0.0045 ** | 0.0007 *** | 0.0075 ** | 0.0014 ** |
| Empty_N2O | 0.0068 ** | 0.6436 | 0.0002 *** | 0.0003 *** | 0.0009 *** | 0.0003 *** | 0.0613 |
| Maize_N2O | 0.0331 * | 0.6275 | 0.0022 ** | 0.0012 ** | 0.0125 * | 0.006 ** | 0.2189 |
Publisher’s Note: MDPI stays neutral with regard to jurisdictional claims in published maps and institutional affiliations. |
© 2021 by the authors. Licensee MDPI, Basel, Switzerland. This article is an open access article distributed under the terms and conditions of the Creative Commons Attribution (CC BY) license (https://creativecommons.org/licenses/by/4.0/).
Share and Cite
MDPI and ACS Style
Horel, Á.; Tóth, E. Changes in the Soil–Plant–Water System Due to Biochar Amendment. Water 2021, 13, 1216. https://doi.org/10.3390/w13091216
AMA Style
Horel Á, Tóth E. Changes in the Soil–Plant–Water System Due to Biochar Amendment. Water. 2021; 13(9):1216. https://doi.org/10.3390/w13091216
Chicago/Turabian StyleHorel, Ágota, and Eszter Tóth. 2021. "Changes in the Soil–Plant–Water System Due to Biochar Amendment" Water 13, no. 9: 1216. https://doi.org/10.3390/w13091216
Note that from the first issue of 2016, this journal uses article numbers instead of page numbers. See further details here.