Article

Integrative Approach for Groundwater Pollution Risk Assessment Coupling Hydrogeological, Physicochemical and Socioeconomic Conditions in Southwest of the Damascus Basin

by
Nazeer Asmael
1,2,
Jessica D. Villanueva
3,
Nicolas Peyraube
3,4,
Mohamed Baalousha
5,
Frédéric Huneau
6,7,
Alain Dupuy
1,8 and
Philippe Le Coustumer
8,9,*
1
ENSEGID Institut National Polytechnique de Bordeaux, 1 allée F. Daguin, F-3607 Pessac, France
2
Department of Geology, Faculty of Sciences, The University of Damascus, Damascus P.O. Box 5735, Syria
3
School of Environmental Science and Management (SESAM), University of the Philippines, Los Baños, College, Laguna 4031, Philippines
4
Université de Bordeaux, Collège Sciences et Technologies, I2M-GCE (UMR 5295), F-4030 Pessac, France
5
Public Health Research Center, Department of Environmental Health Sciences, University of South Carolina, 413, 921 Assembly Street, Columbia, SC 29208, USA
6
Université de Corse Pascal Paoli, Laboratoire d’Hydrogéologie, Faculté des Sciences et Techniques, Campus Grimaldi, BP 52, F-20250 Corte, France
7
CNRS UMR 6134, SPE, F-20250 Corte, France
8
EA CNRS 4592 Géoressources & Environnement, Université Bordeaux Montaigne, 1 allée F. Daguin, F-3607 Pessac, France
9
CNRS-INRA-Université de Bordeaux UMS 3420, Bordeaux Imaging Center 146 rue Léo Saignat, CS 61292, F-33076 Bordeaux, France
*
Author to whom correspondence should be addressed.
Water 2021, 13(9), 1220; https://doi.org/10.3390/w13091220
Submission received: 12 March 2021 / Revised: 20 April 2021 / Accepted: 23 April 2021 / Published: 28 April 2021
(This article belongs to the Special Issue Application of Smart Technologies in Water Resources Management)

Abstract

:
Groundwater is the main resource for irrigation and drinking supply in most parts of Syria, as for most Mediterranean countries, however this resource suffers from mismanagement. In the study area (northeast of Mt. Hermon), the lack of information makes water management in this area extremely difficult. Assessing groundwater pollution risk is the most essential issue for water resources management, especially in the regions where complex interaction between climate, geology, geomorphology, hydrogeology, water scarcity and water resource mismanagement exist. This complexity leads to significant complication in determining pollution risk of studied system. In the present work, we adopted an integrative approach to assess groundwater pollution risk in the study area. This methodology is based on the analysis of hydrogeological characteristics of aquifer systems and the available information about socioeconomic context and physiochemical groundwater conditions that might affect this system. This approach allowed us to delineate the groundwater pollution risk map based on the analysis of concerning parameters/indicators. The degree of risk was assessed as the sum and average of rating of these parameters and indicators for each subarea. Typically, very high pollution risk index was identified over the Quaternary/Neogene horizon, i.e., shallow and unconfined aquifer and in the lower part of Jurassic aquifer. In these two parts, the majority of anthropogenic activities are concentrated. Low pollution risk index was found for the outcropping of low permeable Quaternary basalt at the Southern part of the study area. A moderate pollution index was identified for the low/moderate permeability of silt, clay and marly limestone-rich horizons of the major part of Neogene aquifer outside of the intersected zones with Quaternary aquifer and for the Paleogene formations. The spatial analysis shows that about 50% of the study area is characterized as being at very high and high pollution risk index. Hence, the overall natural protective capacity of this area is still poor. This study demonstrates the flexibility of the proposed approach to assess groundwater pollution risk in local complex aquifer system characterized by lack of information and data in order to reduce the risk of future groundwater pollution.

1. Introduction

In arid and semiarid countries such as Syria, water resource management is considered as one of the most important task for decision makers. The limited availability of water resources in Syria is a major factor in Syria’s geopolitical instability; moreover, as Syria’s economic condition worsens the continued deterioration of water resources is inevitable [1]. Without sufficient infrastructure and adequate management, it is possible that the problems associated with water scarcity worsen. Water availability in Syria was about 1600 m3 inh·yr−1 in 2000 and is projected to be 700 m3 inh·yr−1 in 2025 taking into account population growth, increasing water demand and climate change effects [2]. In the recent years, and despite the geopolitical crisis, the management of water resources is becoming more important for government authorities at different levels.
In the rural areas of the northeastern part of Mt. Hermon (NEMH) in southwest Syria, groundwater resources are increasingly used for urban and agricultural water demand taking into account the advanced mechanized extractions. Untreated waste effluent from sewers, livestock units and olive mills associated with agricultural activities form the major pollution sources responsible for groundwater quality degradation. The karstic Jurassic aquifer dominates in the mountain area while the alluvial aquifer is located in the flat region. Karstification is one of the most important criteria that influence aquifer pollution [3]. Karst aquifers are considered to be particularly vulnerable to pollution, because of their unique structure [4]. Intensive development of agricultural activities, mainly in the Quaternary alluvial flat area, depends on individual wells which provide water for many residential purposes (e.g., crop irrigation, cattle supply, crop cleaning). Moreover, in this area where there are 40,000 inhabitants living in 14 villages, untreated sewage water is released directly into the environment. Agricultural drainage water infiltrates to reach the groundwater or flow directly into surface water.
Increased anthropogenic pressure on groundwater resources in NEMH brought to increase the challenges of sustainable groundwater resource management. From the hydrogeological point of view, this system has been characterized previously based on our three papers cited in this manuscript [5,6,7]. For the complex groundwater flow system of this area [5,6,7], the developing of application to delineate groundwater pollution risk map can be fraught with problems. However, in our proposed approach, we will integrate the acquired knowledge about hydrogeological characteristics with the socioeconomic context and physicochemical groundwater properties in this scarcity water resource region in order to consider the polluting activities and contaminant loading that are or will be applied in this area and that could affect the water resource quality. The final evaluation can help policy makers to avoid the potential harm to groundwater before serious impacts occur [8,9]. The anthropogenic activities that take place at the surface can affect groundwater quality. However, the geological and hydrogeological characteristics of the aquifer can provide protection against the infiltration of contaminants. Vulnerability in general refers to the degree in which human or environmental systems are likely to experience harm due to actual or potential presence of particular pollutant or group of pollutants [10,11].
The concept of groundwater pollution risk is not a property that can be directly measured in the field and its determination is difficult as it depends on many parameters and factors affecting this risk. It is based on a combination of hazard, vulnerability and related consequences of contamination [12,13]. Consequently, the risk of groundwater pollution depends on the hydrogeological features and the presence of pollutants. However, we can have high aquifer vulnerability, but in the absence of important contaminant load there is no pollution risk, and vice versa.
In order to protect the aquifer system, it is fundamental to determine areas where aquifers may be more vulnerable to contamination that eventually can reduce the groundwater quality. Groundwater pollution risk assessment provides a tool to highlight areas (visual analysis), susceptible to contamination in order to prevent and control groundwater pollution. More than a hundred methods for assessing the vulnerability and pollution risk of groundwater systems have been developed worldwide [14,15]. These methods can be classified into three general categories, namely simulation-based process, statistical method and overlapping method. Groundwater pollution risk mapping constitutes an important tool for groundwater management and protection [16,17]. The mapping included hydrogeological settings, hydrological features and potential contamination entries (point and nonpoint sources). Thus, two important factors will be used in this work, the hydrogeological characteristic of the aquifer system and anthropogenic data.
The purpose of this study is (i) to develop an analysis that can provide a basis for developing adaptations to the safety and protection of the complex aquifer system in the study area by preventing or reducing the risk of future groundwater pollution; and (ii) to generate a map with different degrees of groundwater pollution risk index to be use as a tool for the decision makers during the future planning of land-use and sewage effluent discharge control. The further use of this map to estimate the pollution risk and associated pressure can help the planners to determine the adopted strategy or scenario for groundwater resource management and protection purposes. Perhaps with additional information at smaller scales, a final modified map can be reproduced.
The proposed approach allows to assess the risk of groundwater degradation as a result of an interaction of different parameters and factors, even when information is lacking. The described risk refers to the potential of groundwater contamination. A very high and high groundwater pollution risk value implies that the aquifer will be impacted, or has already been impacted due to the anthropogenic contamination source and the accessibility of the contaminants to the aquifer. A low groundwater pollution risk value implies limited sources of contamination and/or natural aquifer protection capacity.

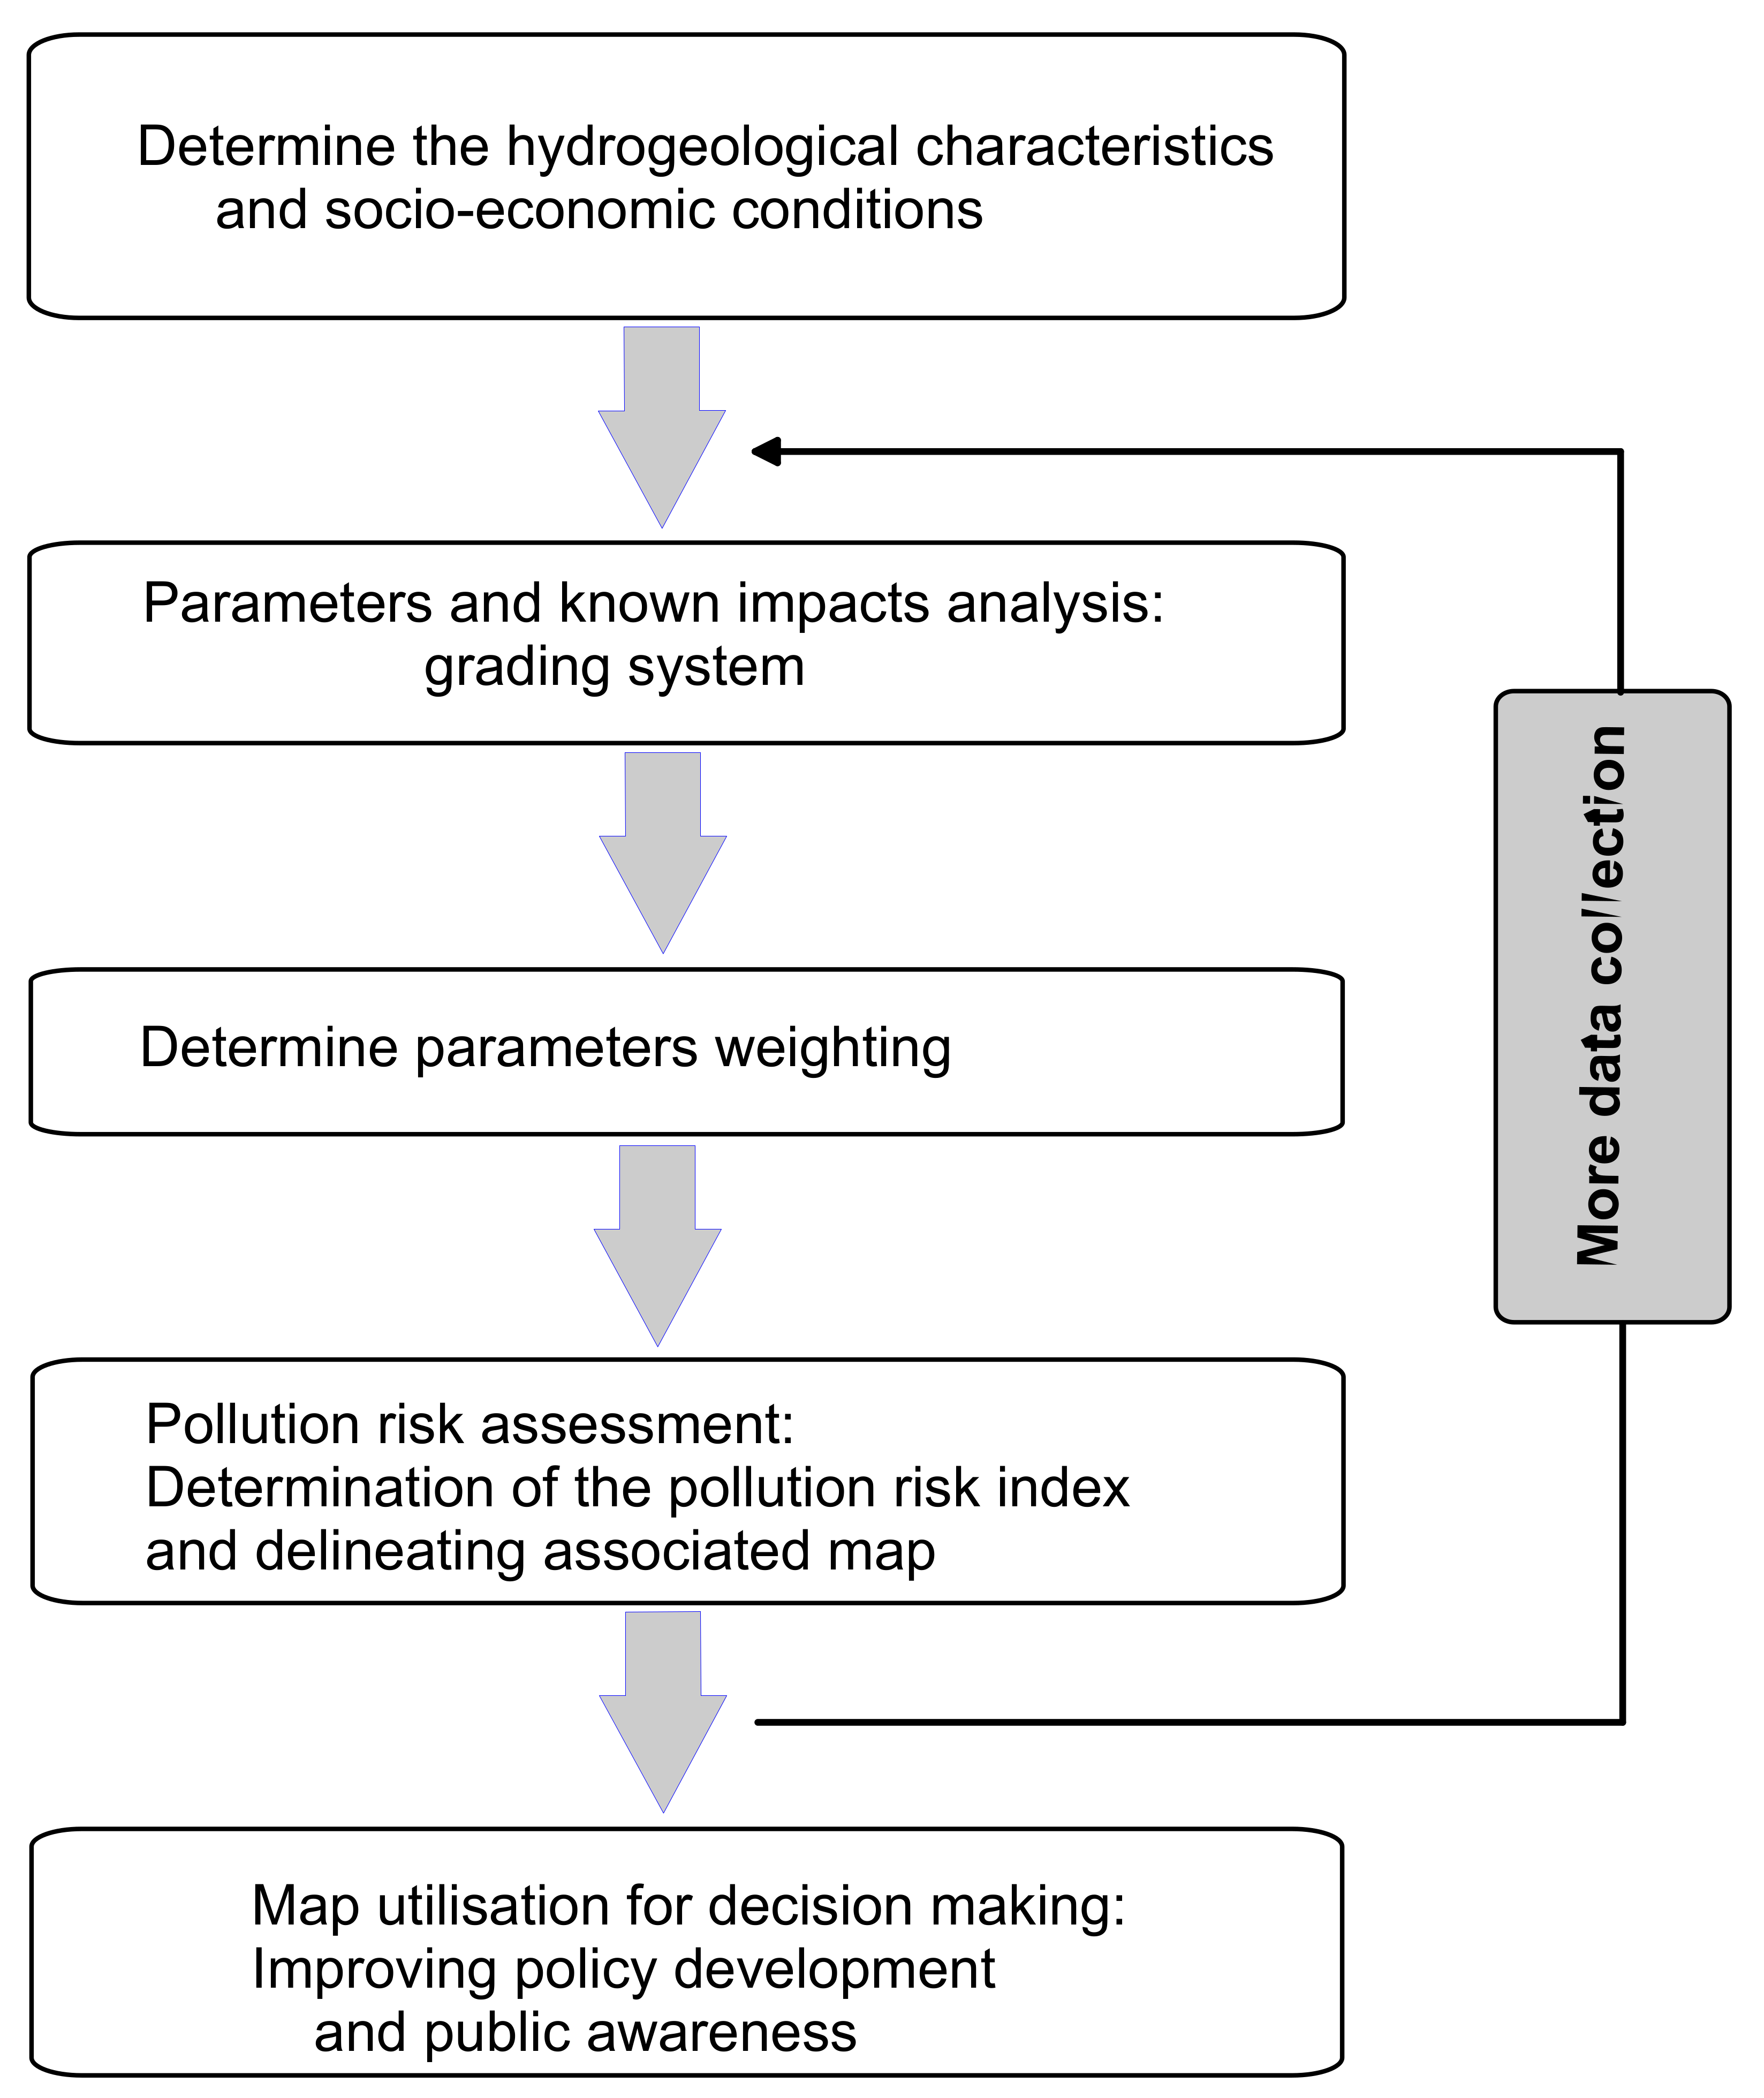
2. Methodology: Outline of the Proposed Integrative Approach for Assessing Groundwater Pollution Risk
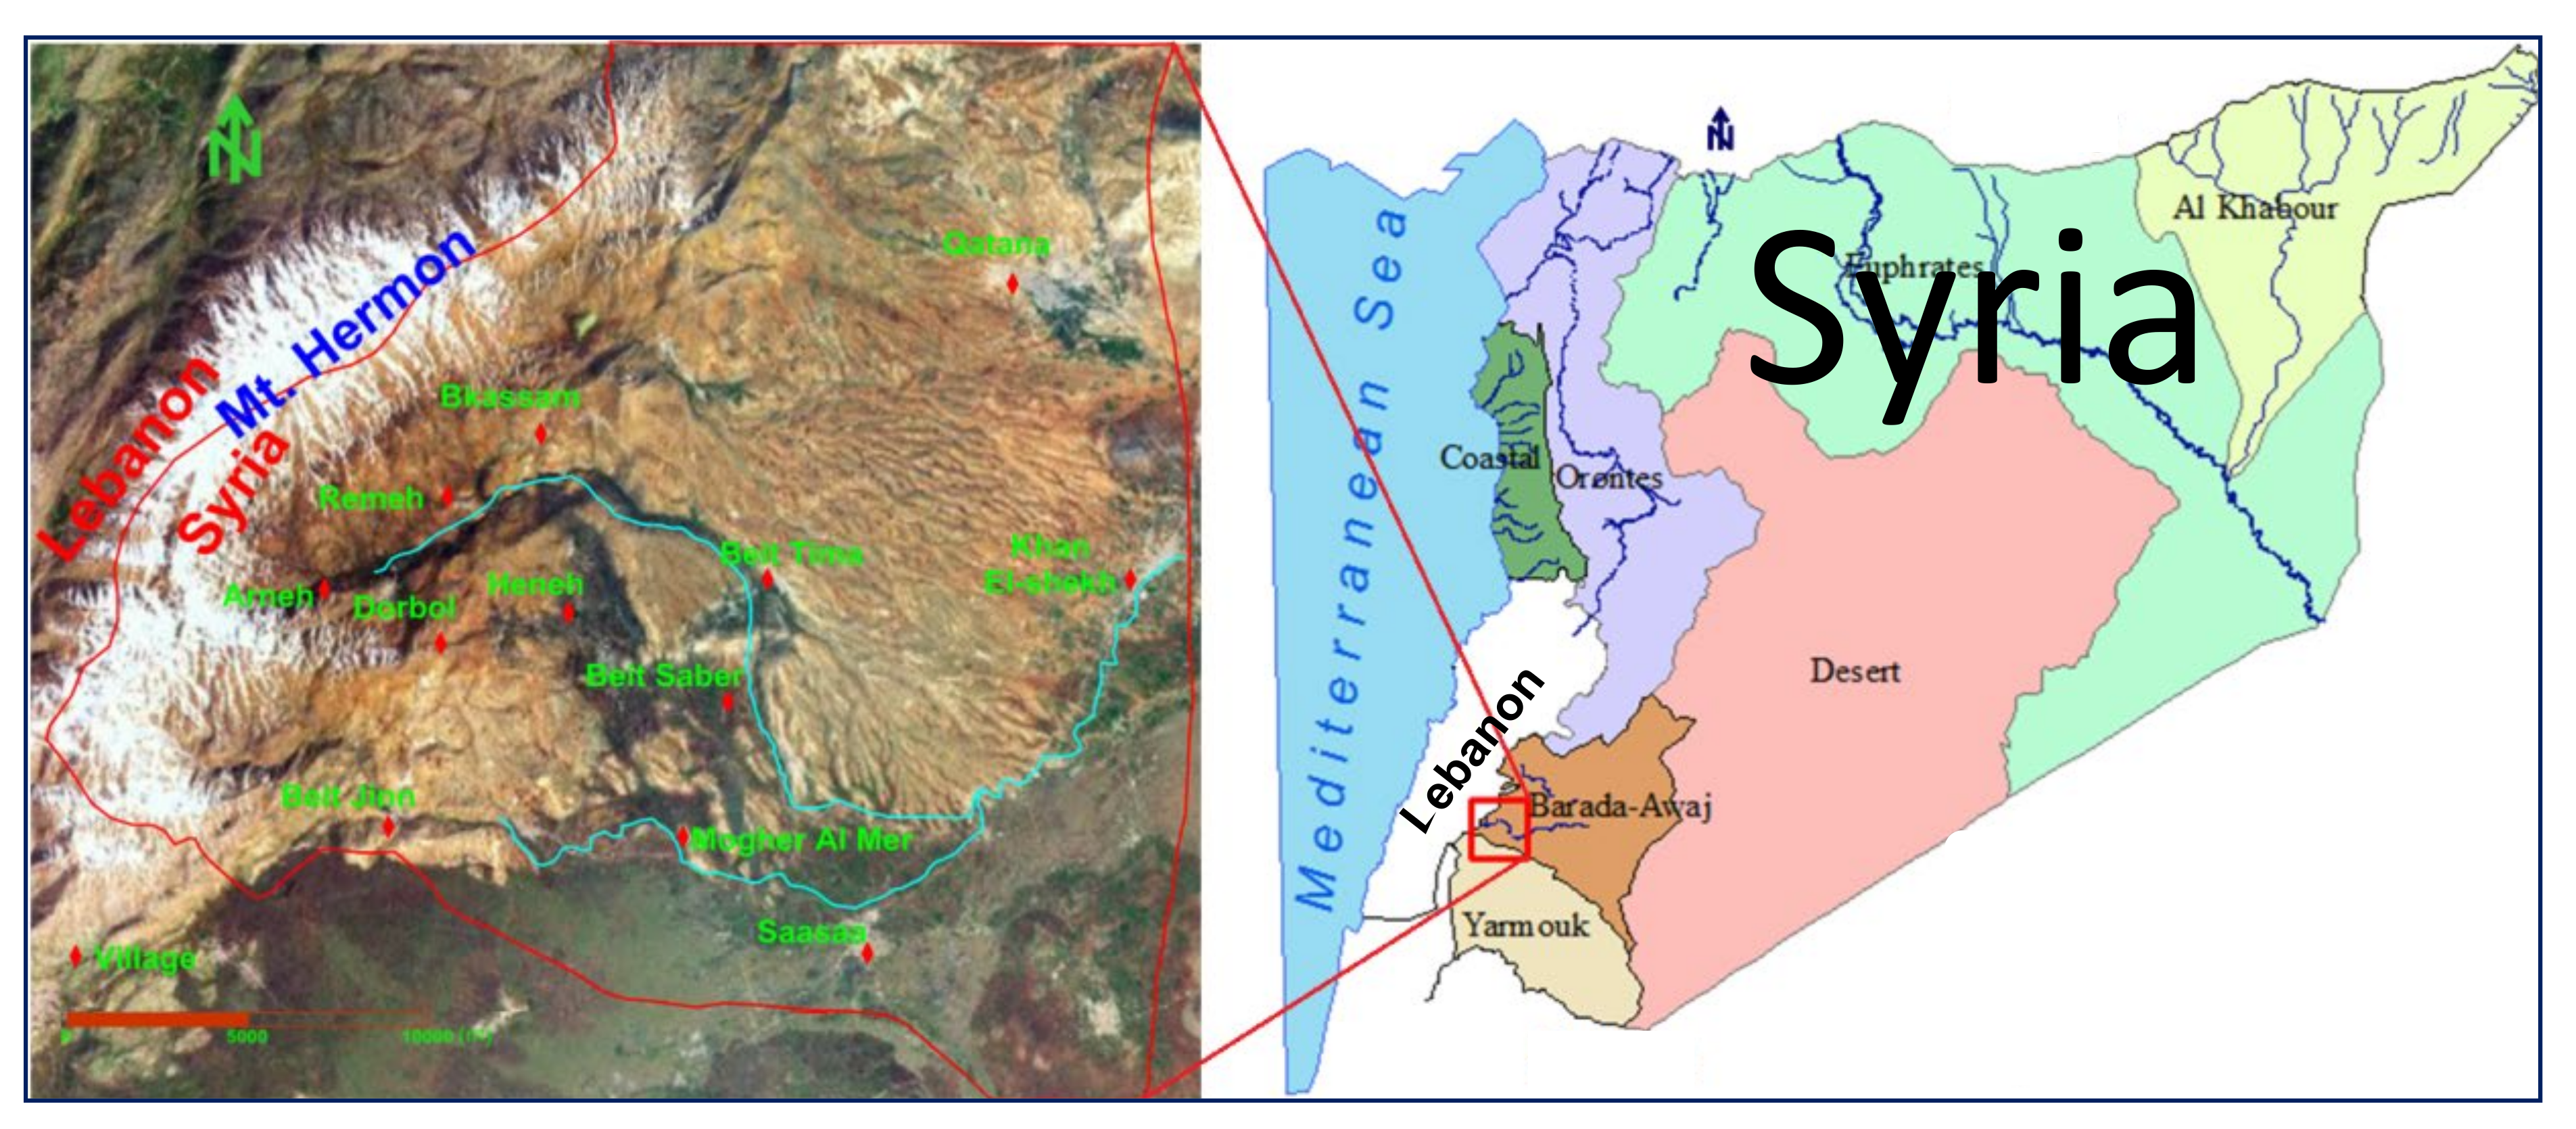
The acquired information about geological setting, hydrogeological characteristics and anthropogenic activities, which intensively effect the groundwater quantity and quality in the NEMH, have been integrated to map pollution risk of the aquifer system in this area. The proposed integrative approach is based on assessment/analysis of defined parameters/indicators and the weighing indicator followed by projecting the results under the form of a digitalized map. In this case, the weighting system is chosen, the weight of each parameter/indicator depends on its importance in the final evaluation in order to determine the pollution risk score which affects the pollution risk assessment of groundwater. However, we attribute a value between 1 and 5 concerning both physicochemical and socioeconomic parameters and from 1 to 10 for the hydrogeological parameters in order to put major emphasis on the hydrogeological characteristics of the aquifer system, the most significant factor for aquifer system protection capacity in this rural area. Thus, the criteria used in order to score each parameter/indicator are very flexible and special for this case study. This method is in line with GOD application which involves a mapping overlay based on a factor-scoring system implemented by Foster [18] for aquifer vulnerability assessment. The grading system used in this methodology is illustrated in Table 1. The parameters/indicators used to assess groundwater pollution risk as well as their weight are presented in Table 2. Nevertheless, these tables are not definitive and can be updated when more data becomes available.
The hydrochemistry, stable isotopes and the result of groundwater modelling, as a previous conducted studies in NEMH area [5,6,7], enabled better hydrogeological understanding of a complex aquifer system of this area. However, the acquired information, the geological outcrop observation, field parameters (EC, pH and T) [19], spatial variation of nitrate concentration, and relative anthropogenic contamination load were integrated as initial screening tools as shown in Table 2 and Figure 1 in order to determine groundwater pollution risk. This integrative approach (IA) is based mainly on the hydrogeological system properties combined with anthropogenic influence. Nevertheless, the first involves consideration of weighting indices. The second one involves map production.
From the Table 1 which rates the parameters according to the measured values and weighted factors by using the following formula:
F i n a l   G r a d e = 1 N P C = 1 N P C + 1 M H G C = 1 M H G C + 1 Z S E = 1 Z S E
where, PC are the physicochemical parameters (N = 4), HGC are the hydro-geoclimatological parameters (M = 8) and SE are the socioeconomic parameters (Z = 8), the final grade is calculated (Table 2). The parameters of the physicochemical and socioeconomic themes have indices ranging from 1 to 5. Nevertheless, there are only four parameters concerning the physicochemical theme, which increases their relative contribution to the final grade compared to the parameters of the socioeconomic theme. In addition, the parameters of the hydro-geoclimatological theme range from 1 to 10, which makes their relative contribution higher than the other parameters of the other themes. However, the parameters of the hydro-geo-climatic theme have a considerable impact, while the parameters of the other two themes have less consequence on the final grade.

3. Site Description

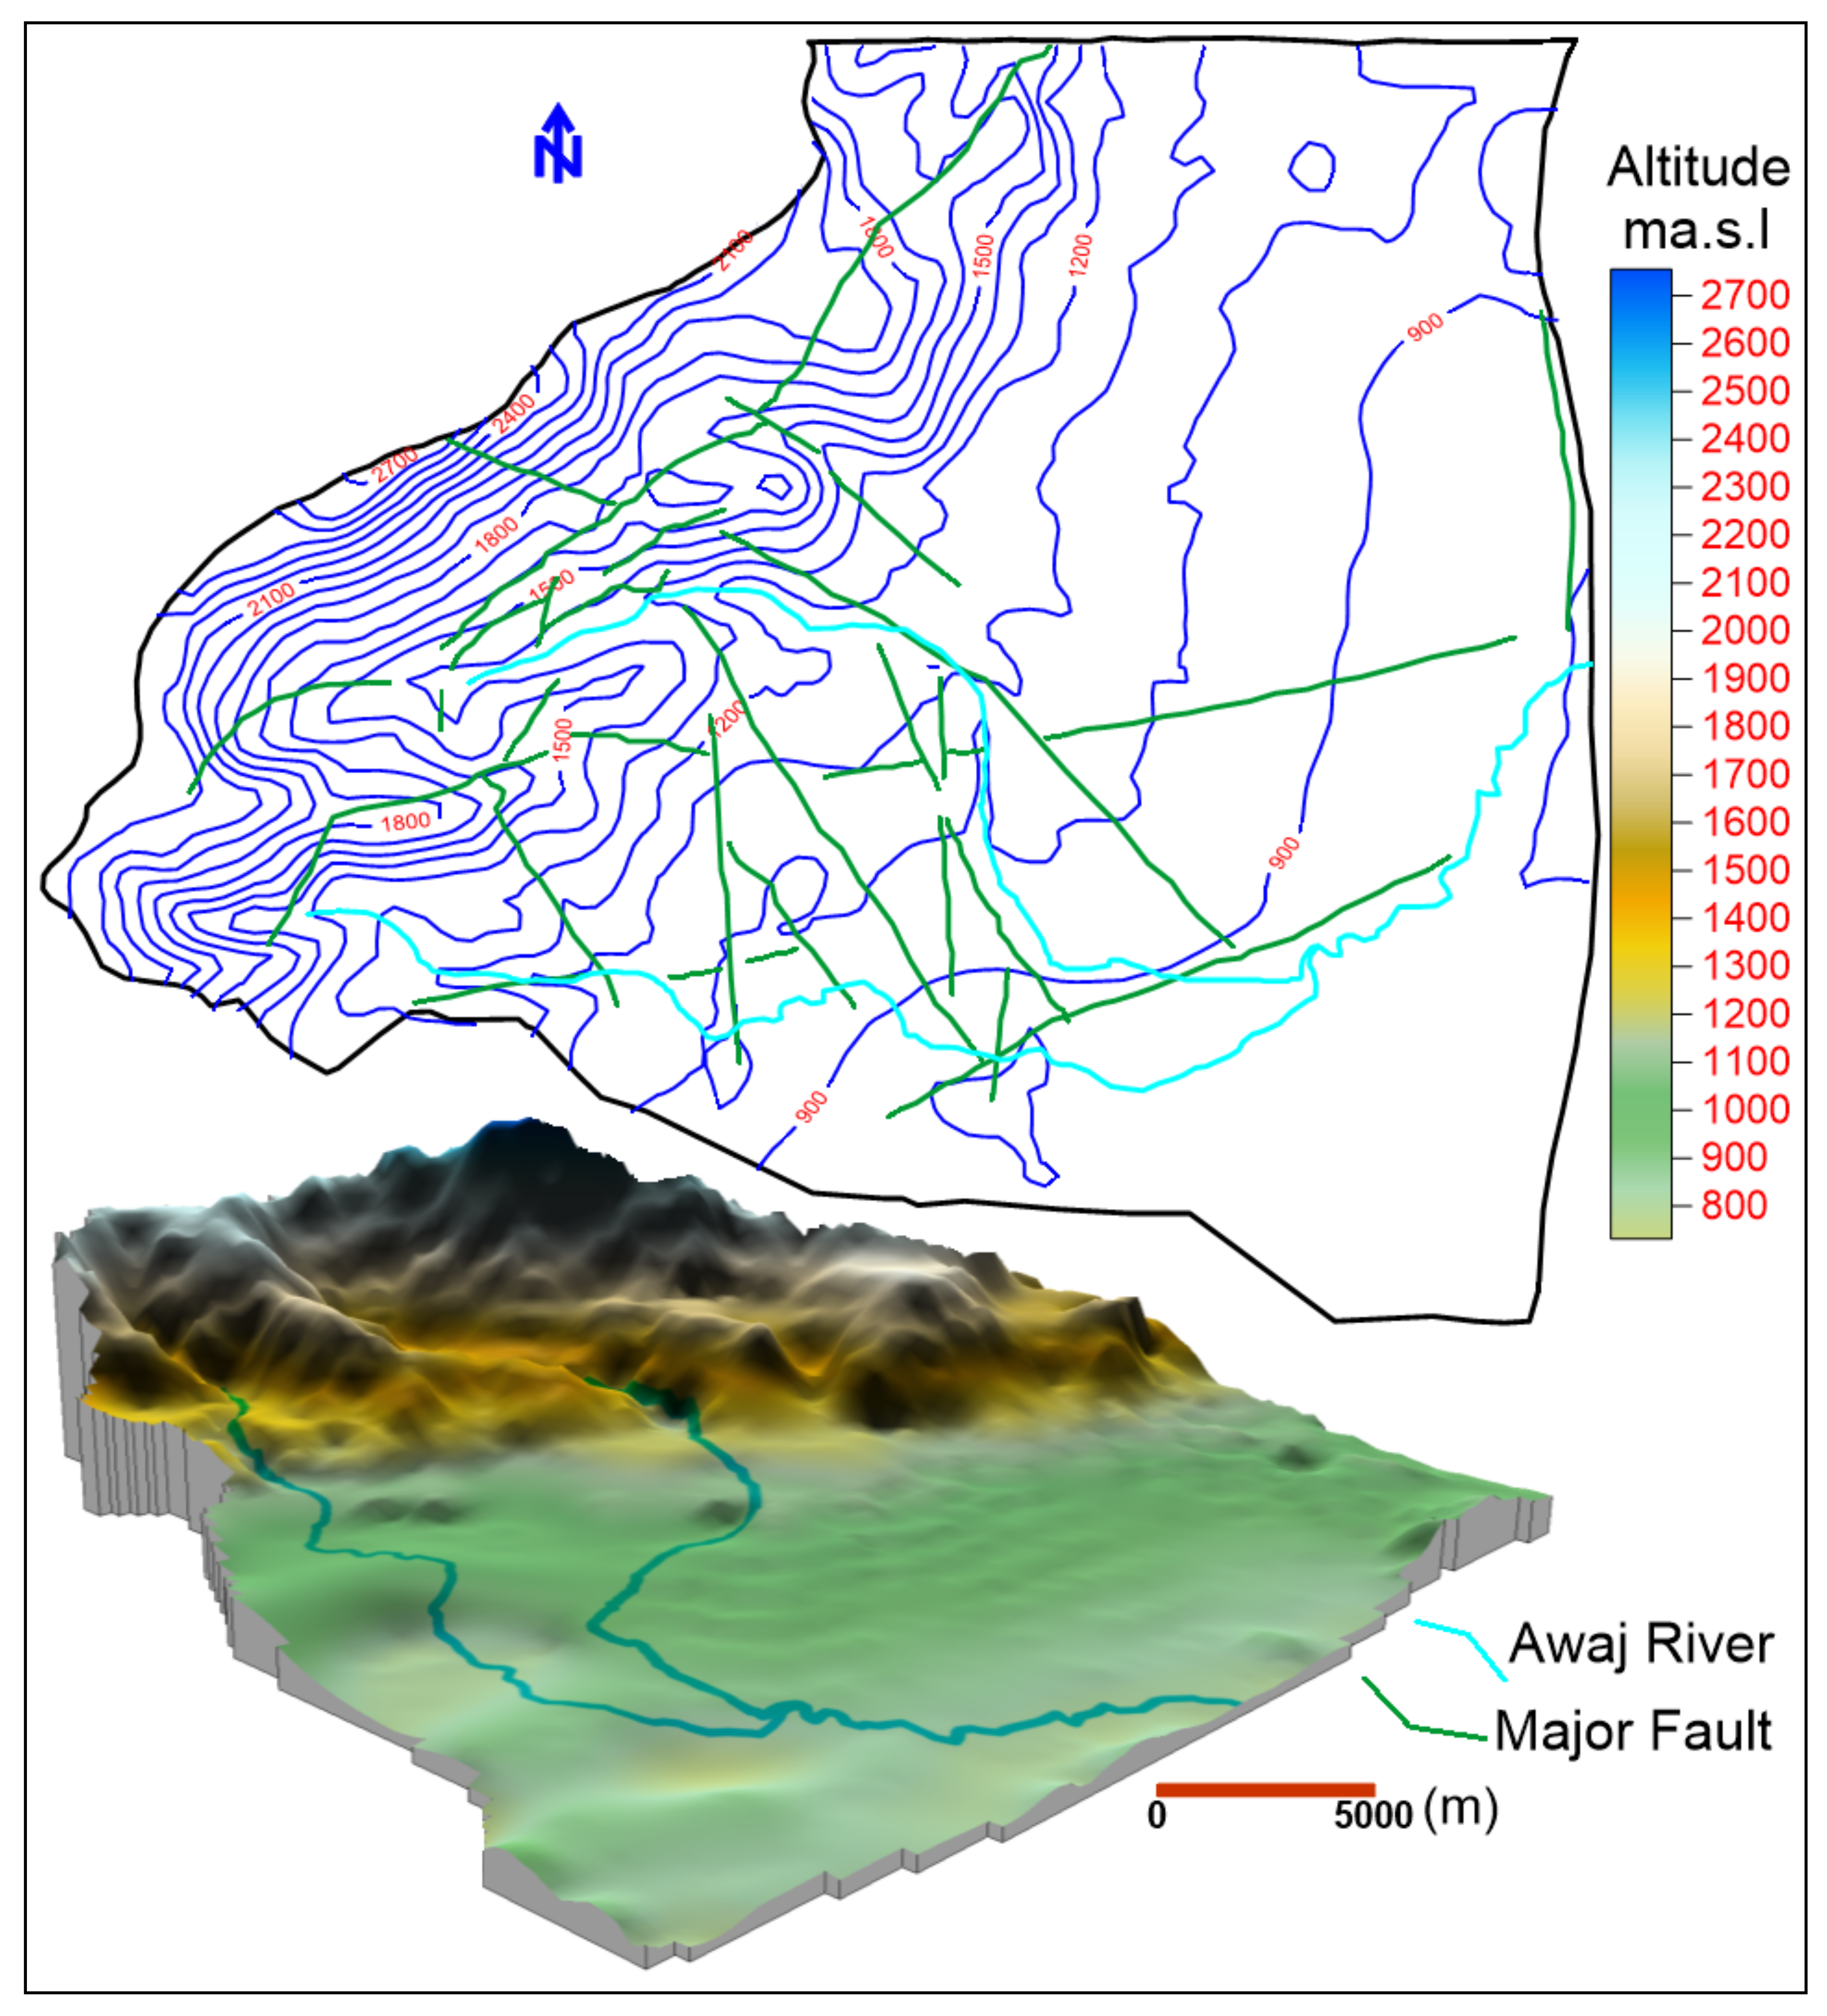
3.1. General Settings of the Study Area

The study area occupies the southwestern part of Barada and Awaj Basin (Damascus basin) where Mt. Hermon is located (Figure 2). Mt. Hermon is the highest point of the Anti-Lebanon Mountains. This mountain stretches for a length of 55 km and a width of 25 km of mostly karstified limestone [20]. It is an open isolated major trending anticline that lies along the southwestern margin of the Early Mesozoic Palmyride rift system [21]. It continues, with hinge axis trending in the NE–SW direction, parallel to the Syrian–Lebanese border (Figure 2). The lithological and geological structures result in steep slopes in the western and northwestern mountain ridges, where the karstic landforms dominate, and a flat relief in the central and eastern parts where the alluvial and basalt formations outcropped. The general slope of the study area is from west to east and southeast. Its gradient reaches a value of about 50% at the slope of Mt. Hermon and less than 2% in the eastern or southeastern parts. The narrow, deep Arneh valley connects the mountainous part with the plain central region. The elevation of this area varies between 800 and 2800 m.a.s.l. The importance of the Hermon area, in addition to its strategic location, comes from the fact that its snowcap and precipitation feed every stream, spring and river in that area. The infiltrated precipitation in the mountainous area either discharges locally as karst springs in the upper part of the Arneh Valley (Figure 2), or recharges the aquifers. Climate changes have resulted in a decrease in winter temperatures and total precipitation amount and in an increase in summer temperatures. Decreasing trend of annual precipitation amount is expected to continue with a reduction of up to 20% by the year 2050 [21,22,23,24,25]. These factors have led to the domination of a dry continental climate and contribute to the increasing water demand on the unsustainable abstraction of groundwater resources [26].
The study area is approximately 600 km2 where Awaj River forms a main water course in the eastern slope of Mt. Hermon by the junction of two main tributaries, Sebarani and Jenani (Figure 2). These two tributaries are fed by a large number of karst springs controlled by subsurface geology and distributed along the slope of Mt. Hermon in the Arneh and Beit Jinn valleys. The river flowing east and mostly characterized by a seasonal flow regime. Its total long is 91 km and its supply catchment area estimated to be 1120 km2 [27]. The annual median discharge of the Awaj River was 4.7 m3·s−1 between the years 1982 and 2004 [27], but decreased to approximately 2.2 m3·s−1 with a total drought period during summer in more recent years (2004–2014) [28]. In former days, this river terminates in the Al-Hijanah lake situated in the eastern Ghouta oasis southeast of Damascus.

3.2. Geological, Hydrogeological and Hydroclimatological Conditions

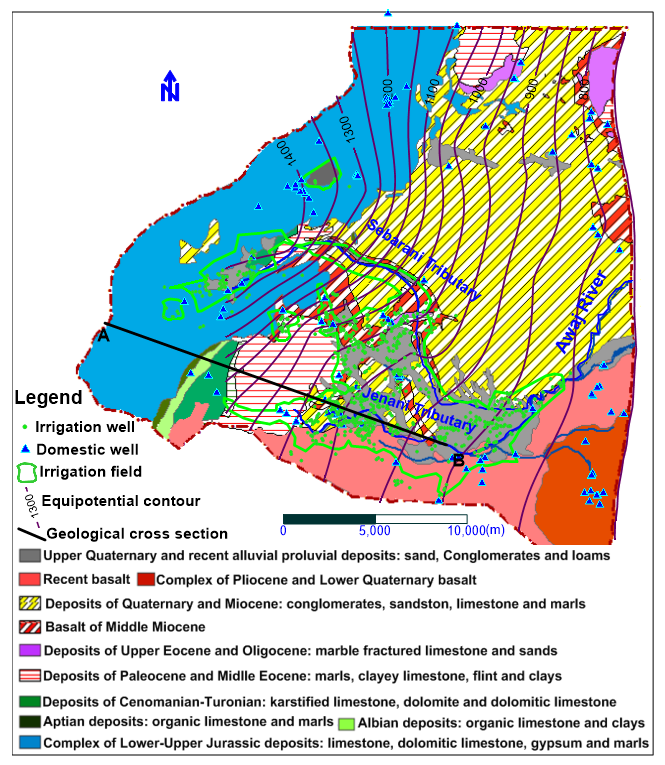
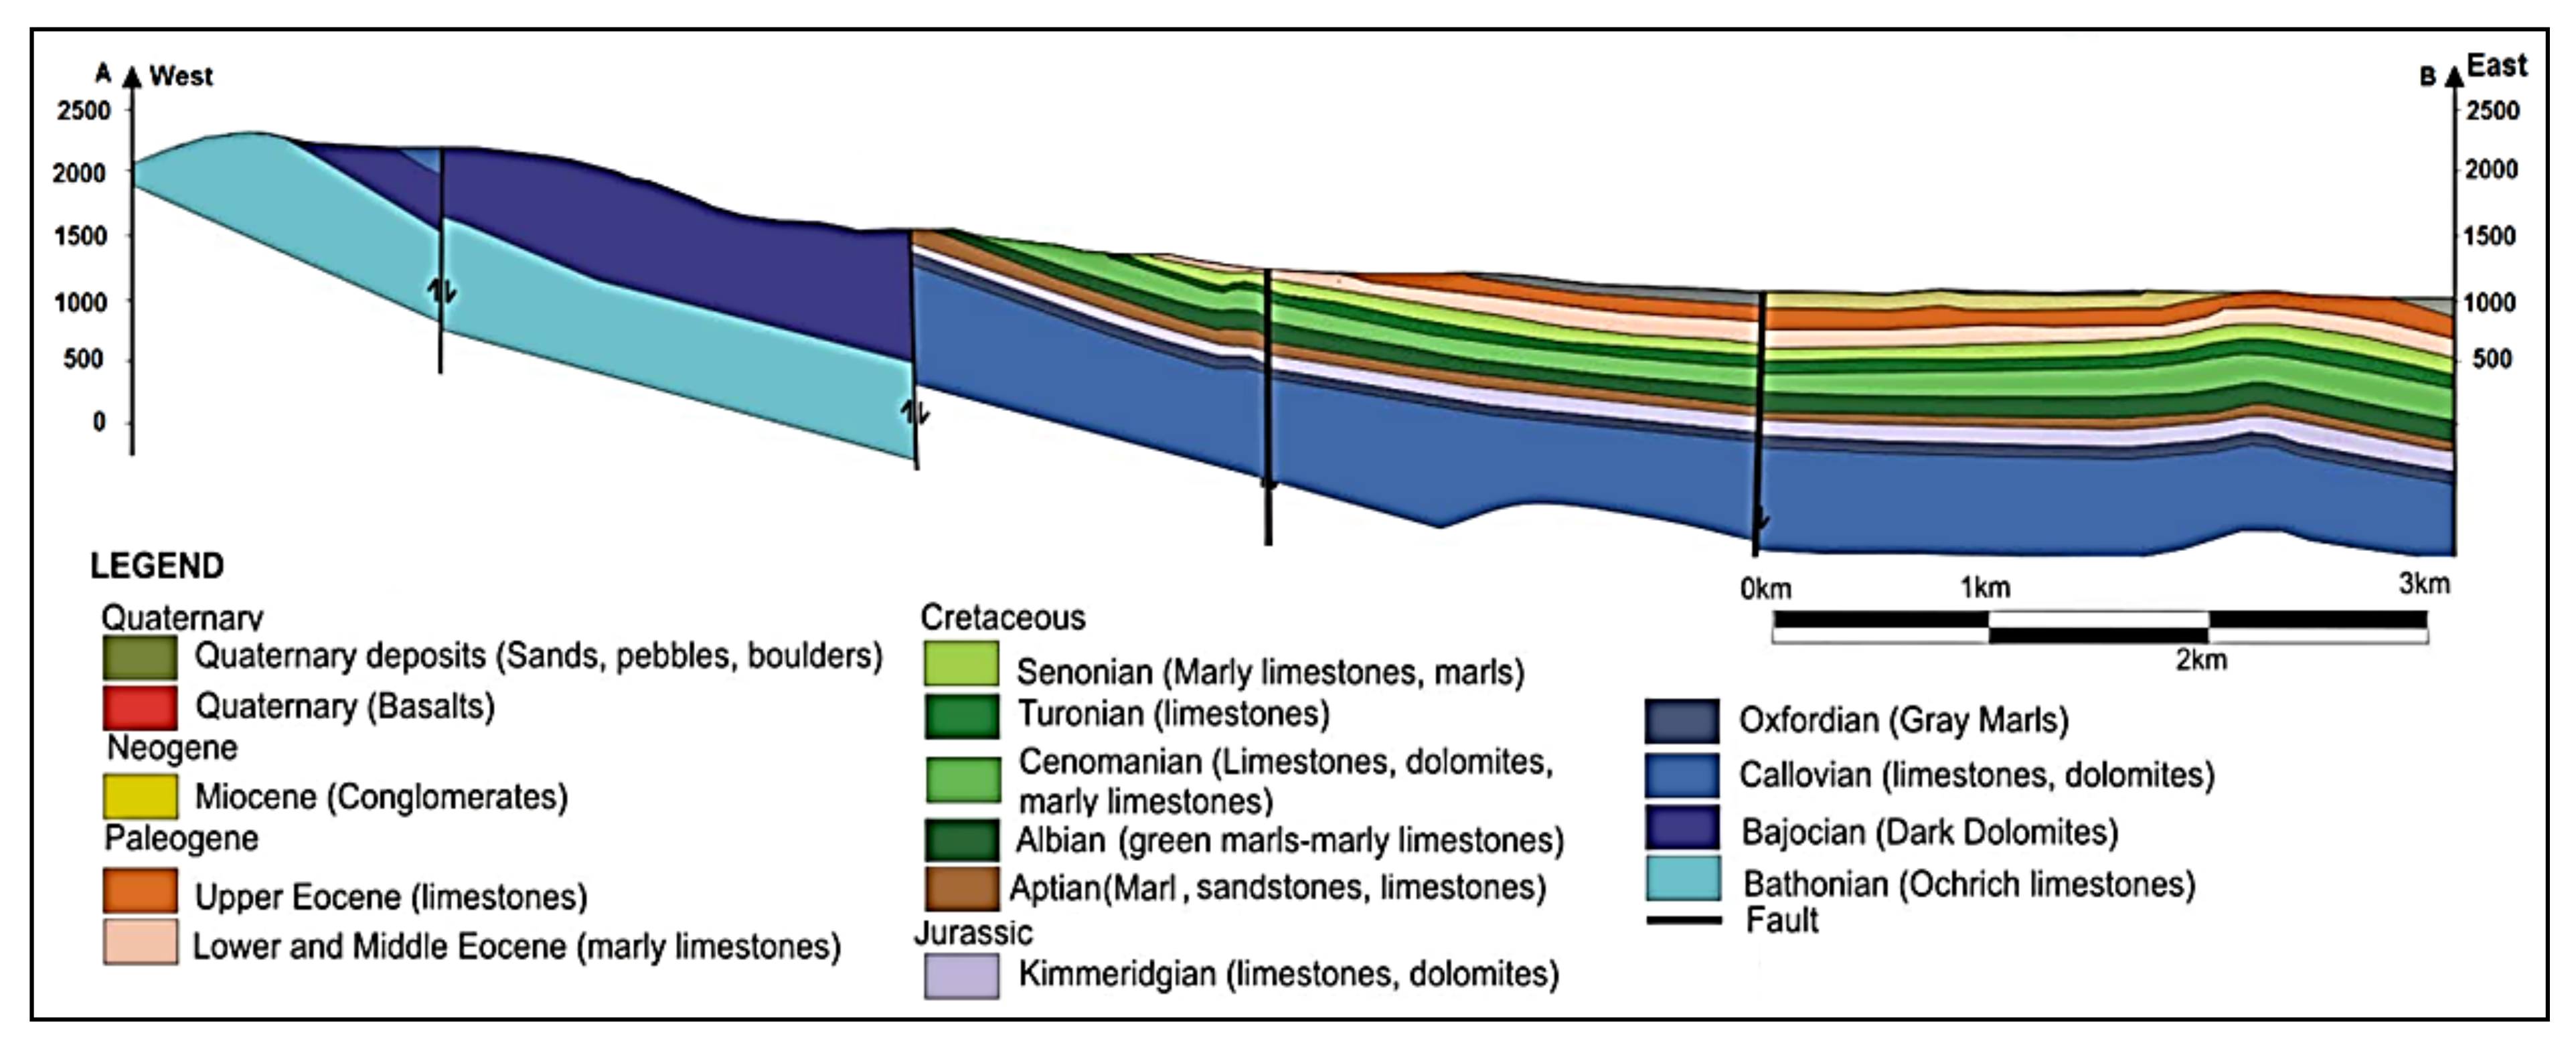
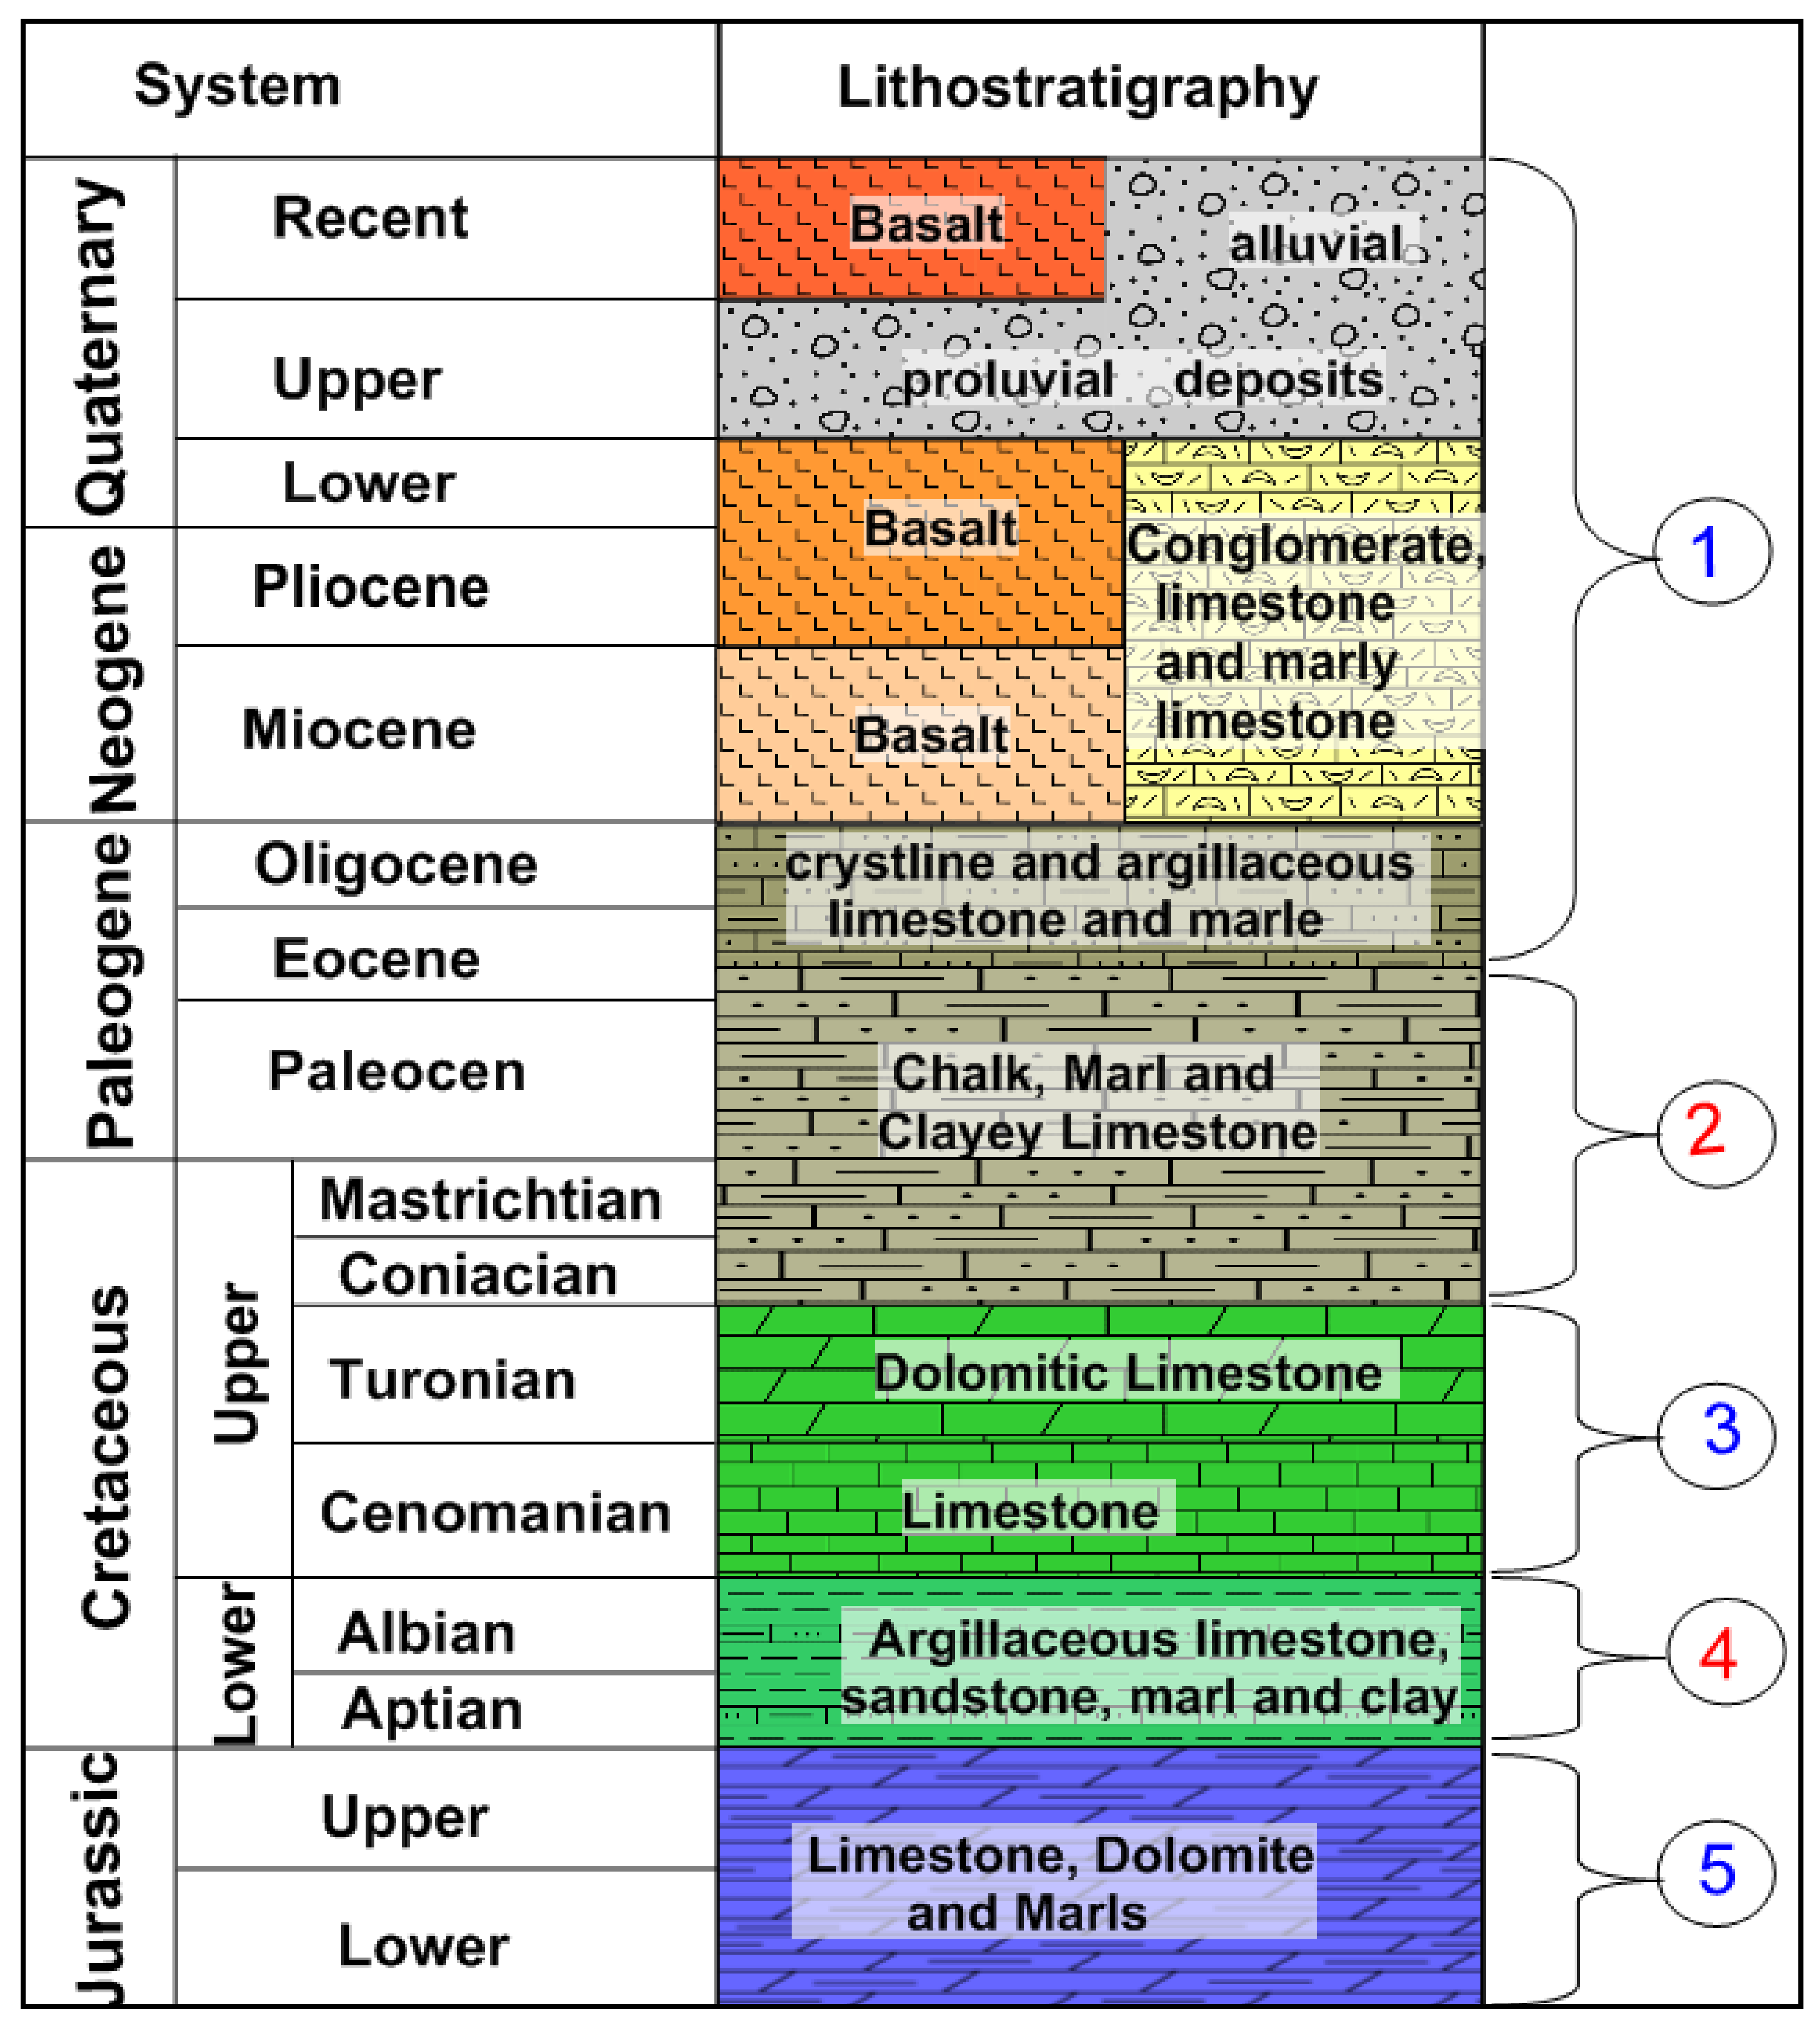
3.2.1. Geological Conditions

Geology plays a significant role in terms of storage, flow and quality of the groundwater [29].
The complexity of thick karstified strata of Jurassic limestone, which interbeds with dolomite, dolomitic limestone, gypsiferous limestone and marl is outcropped in the western portion of the study area in Mt. Hermon (Figure 3).
Limited exposure of Cretaceous and Paleogene formations is found locally in the southwestern portion of the study area (Figure 3). The Cretaceous rock sequence ranges from Aptian to Senonian. The Aptian and Albian formations are mostly composed of organic limestone containing marls and clays. The Cenomanian-Turonian rock strata are composed of limestone, dolomitic limestone layers and crystalline dolomite with interbeds of argillaceous limestone, marl and sandstone. The Paleogene formations consist of intercalation of marly layers, marly limestone, clay and the limestone of Upper Eocene which is characterized by nummulites [30,32].
The plain area is characterized by the exposure of the Neogene and Quaternary deposits. These deposits are mainly made of conglomerates, limestone and marly limestone, and dark-colored basalt of Miocene age which is characterized by fractures filled with calcite, soil and clay. The Quaternary basalts resulting from lava overflow from volcanic vents [32] are located in the southern and southeastern portions of the study area (Figure 3). Figure 4 displays geological cross section showing subsurface lithology as well as the major faults.
The geological structure of the study area is the result of Jurassic to recent deposition, tectonic and volcanism sequences. Sporadic uplifts along with comprehensive folding and faulting at shallow depth resulted to a variety of surface forms and geologic structures. As a result of folding and faulting structures, the Jurassic formations have been found to be in direct contact with the Paleogene and Neogene formations. The tectonic stresses, have induced dense jointing, faulting and fracturing of the geological formations which play a principal role in terms of infiltration, storage capacity and the location, direction and rate of water discharge. The majority of the aquifers in the mountainous part is weakly permeable outside of the tectonic zones and karstic process.
In general, two major fault directions, playing a significant role in the underground flow, can be depicted in the study area (Figure 5). The first one tending in northeast–southwest parallel to the hinge axis of Mt. Hermon, and the second one oriented northwest–southeast toward the groundwater flow direction, as we will see later, which can increase the vulnerability of the aquifer system.

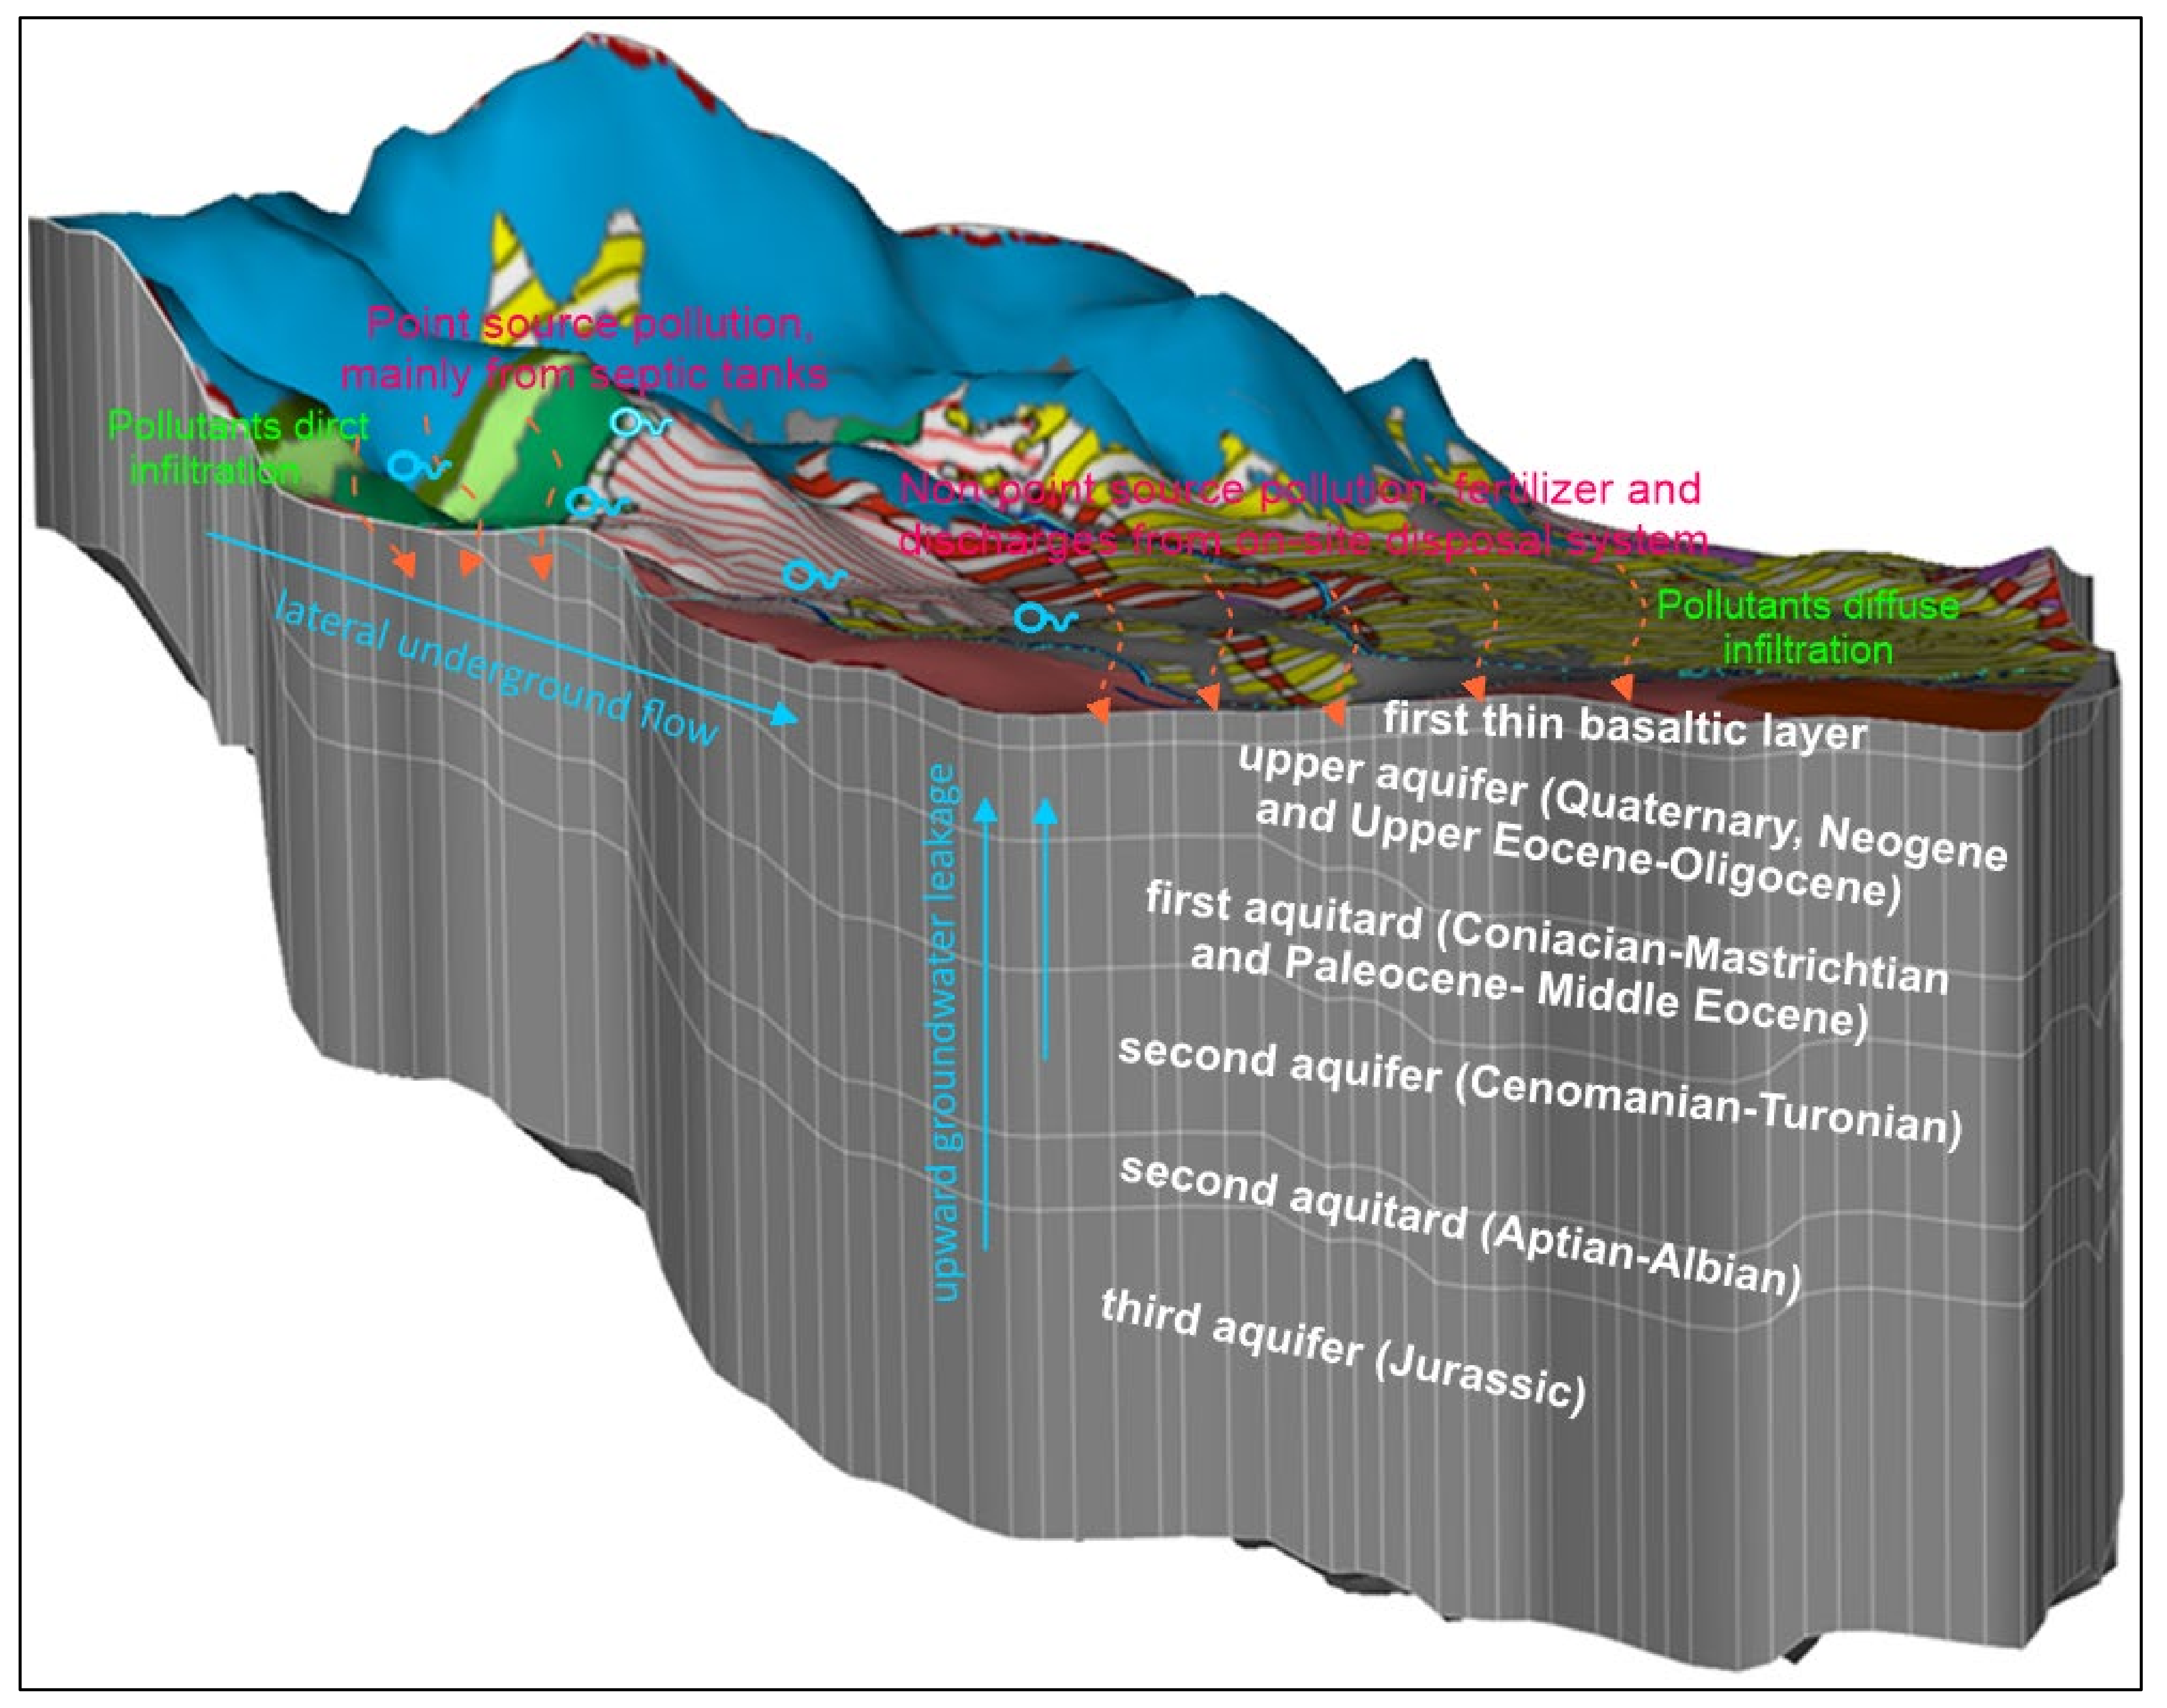
3.2.2. Hydrogeological Conditions

Hydrogeological setting is a composite description of all the geological and hydrogeological factors controlling groundwater flow into, through and out of an area [33,34]. The majority of water flow in the study area exists as subsurface flow. The aquifers in this area can be classified into karstic and porous aquifers. The tectonically broken and karstified rocks as well as the step-like pattern create favorable infiltration conditions for precipitation in the elevated part of the Jurassic part. While, the unconsolidated or semi-consolidated Neogene and Quaternary deposits are presented mainly in the plain area and form a porous aquifer. The well-developed karstic features in the carbonate rocks enhance a large preferential groundwater flow and relatively little surface runoff [20].
As a result of intensive tectonic/dislocations that predominate in the study area, there are no reliable regionally continuous impermeable beds. Thus, there is no hydraulic isolation between the aquifers. However, the aquifer system has been divided into two hydrodynamic subsystems. The first one is shallow and develops in the unconsolidated or semiconsolidated Quaternary/Neogene formations in the plain region which forms the upper aquifer horizon. The second one is deep and develops in the Cretaceous and Jurassic carbonate strata where the preferential flow mechanism contributes potentially to the groundwater flow patterns. The two systems are hydraulically well connected either by lateral inflow along the slope of the Mt. Hermon in the western portion or by upward leakage of groundwater from deep aquifers into the upper aquifer horizon [7]. The discrimination between different aquifers and aquitards in the study area is shown in Figure 6.
By using FEFLOW [35], a 3D representation of these aquifers and intercalated aquitards is showed in Figure 7 [7]. The two integrated subsystems are illustrated in this figure as well as the contaminants pathway concepts dominated for each system. The contaminants can be transported directly from the land surface to the water table or indirectly by the hydraulic connection between two hydrodynamic subsystems.

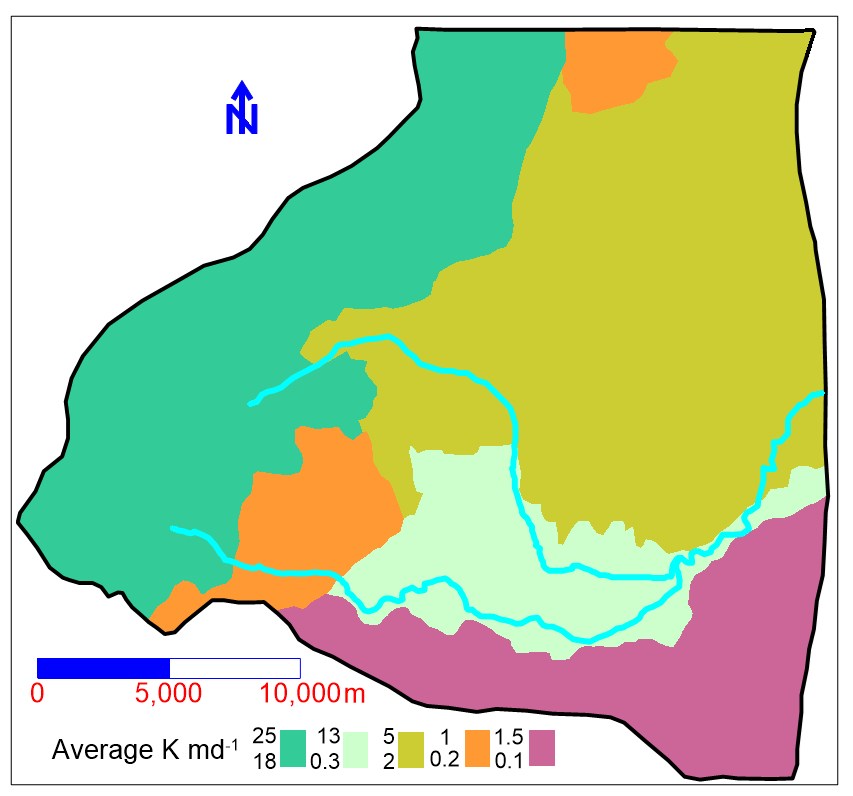
Hydraulic Conductivity of the Aquifer System
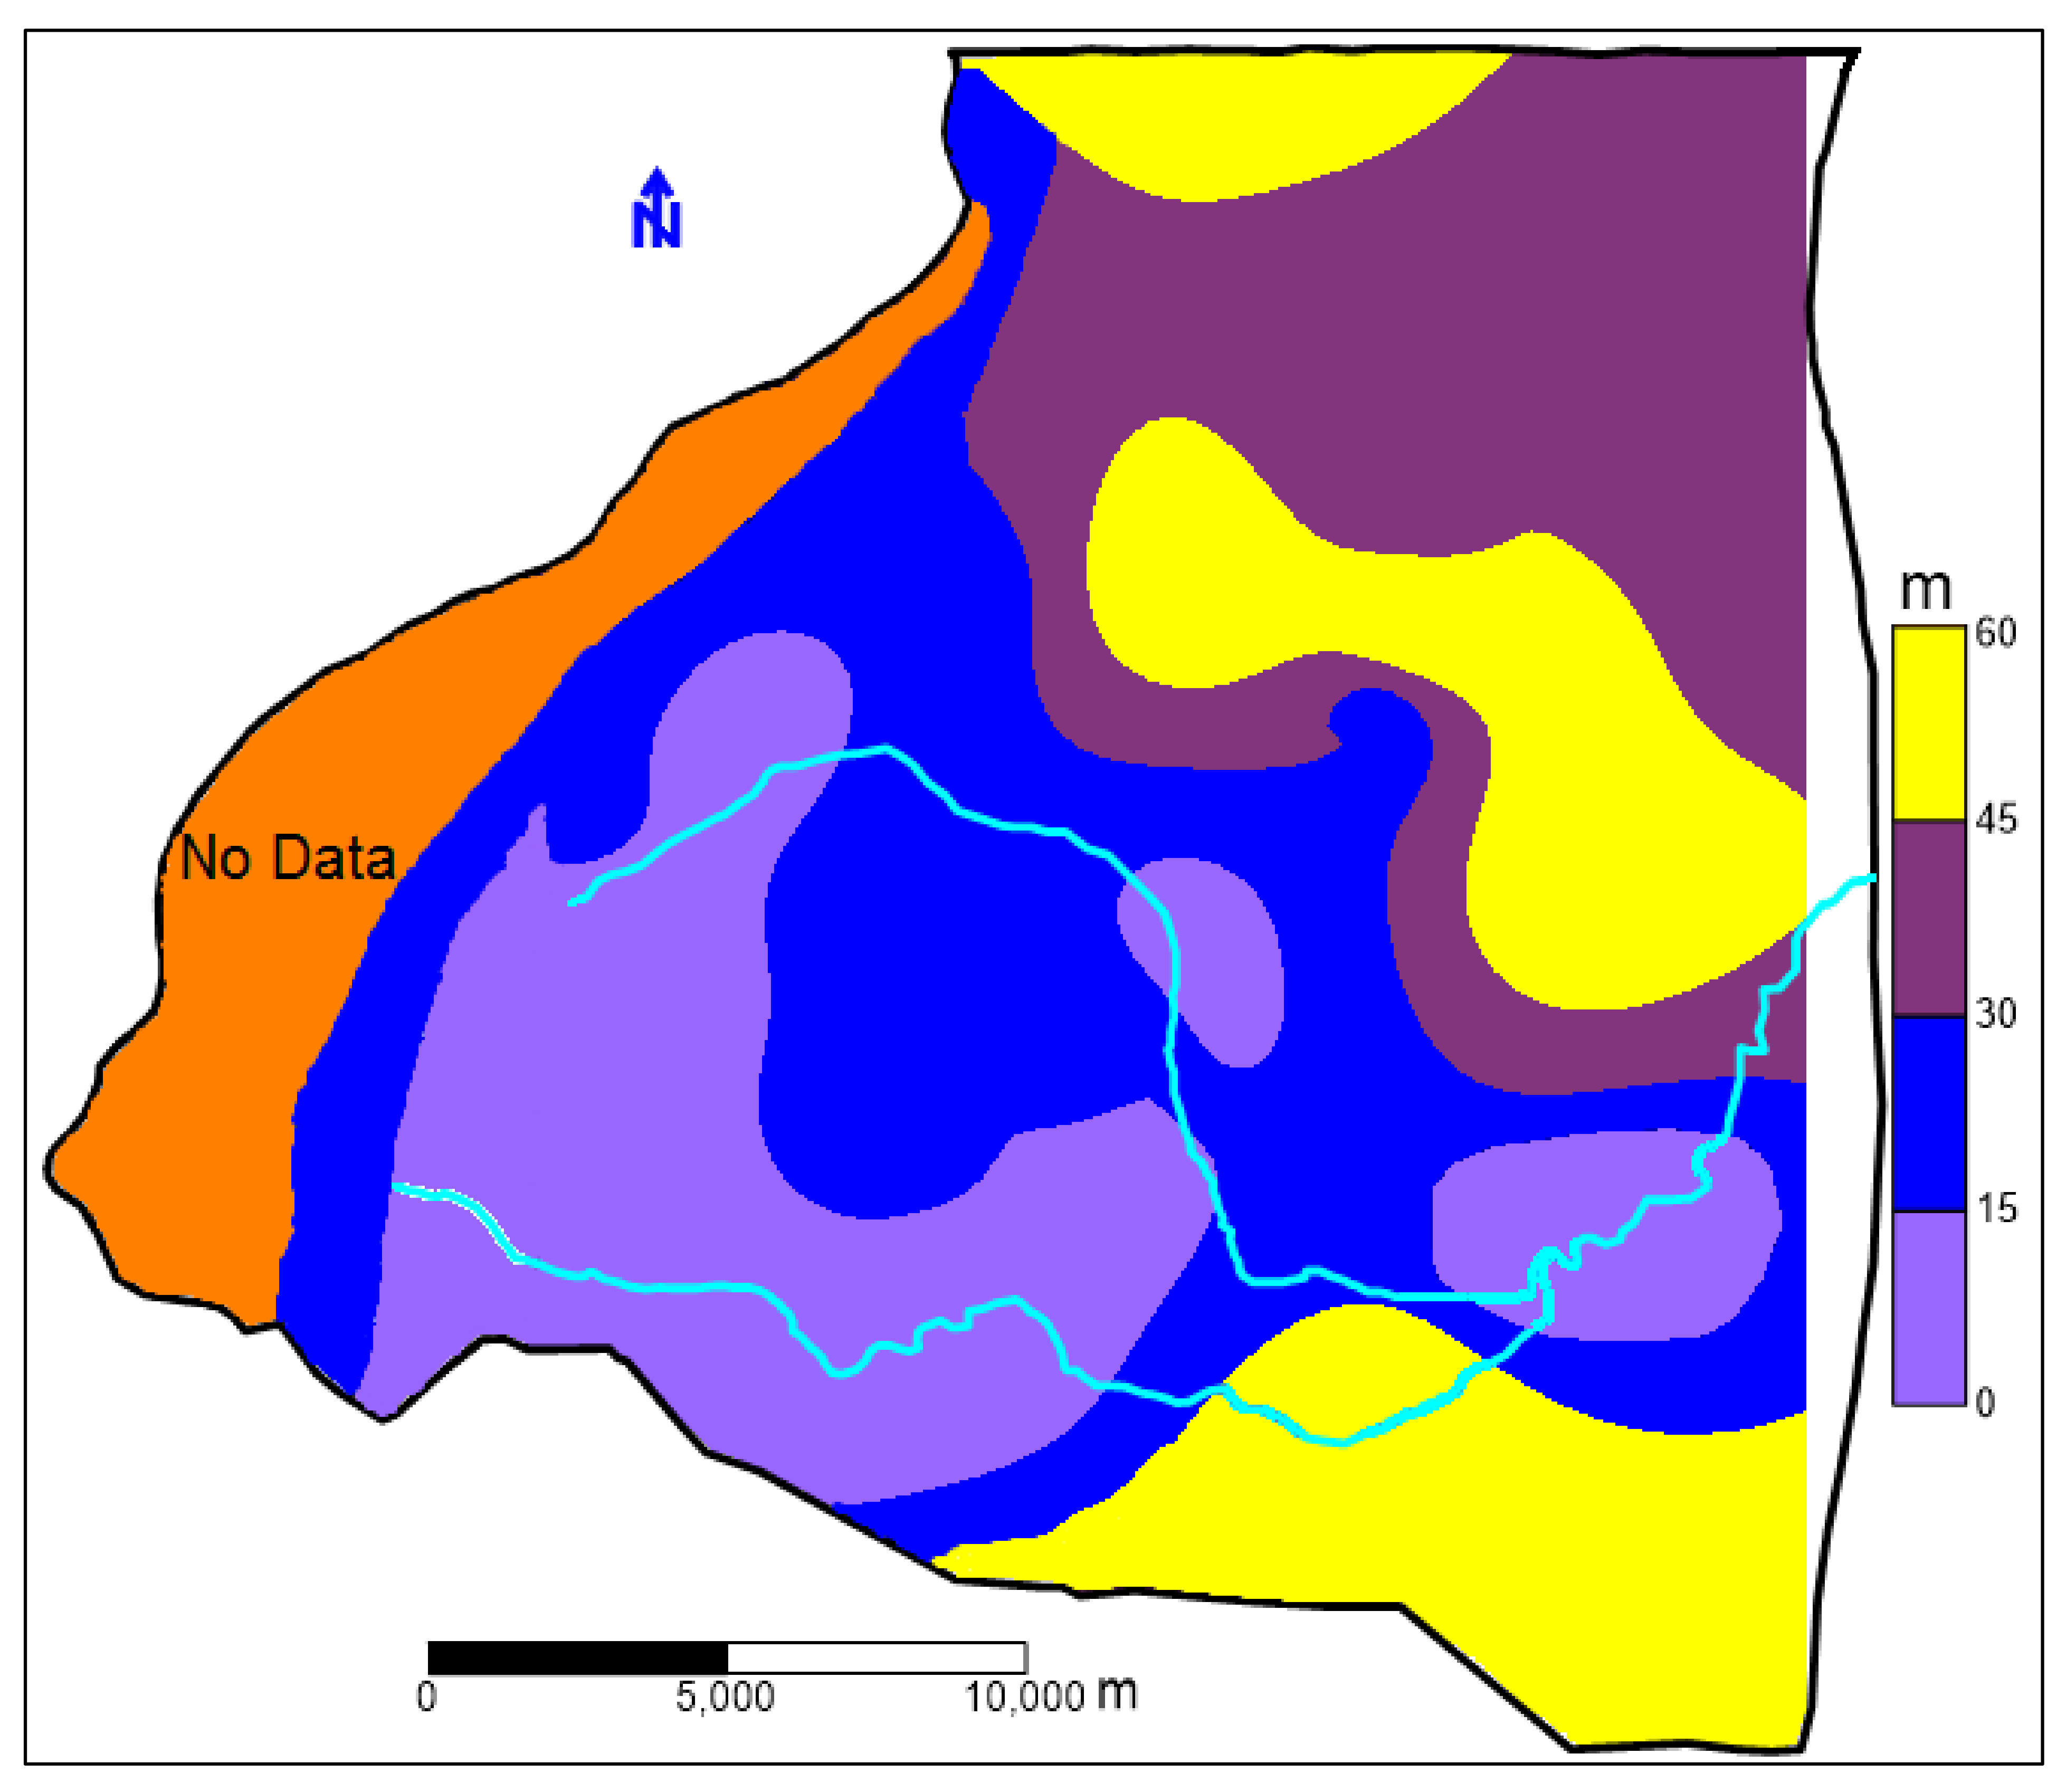
Hydraulic conductivity of an aquifer is represented as averages over areas and refers to its ability to transmit water. Higher hydraulic conductivity indicates that the aquifer is more vulnerable, as the pollutants move faster, while, low conductivity means high resistance against contamination transportation [36,37]. However, the hydraulic conductivity plays a considerable role in the infiltration and the dispersion of the pollutants from the surface to the aquifers. The available data obtained from pumping tests [30] are used to extrapolate the hydraulic conductivity value for different aquifer system in the whole study area (Figure 8). The hydraulic conductivity for the upper aquifer horizon (unconfined aquifer) varied within a reasonable range based on values between 0.3 and 13 md−1. For the Cretaceous and Jurassic aquifers, there was insufficient data on their spatial distribution across these aquifers. Thus, uniform hydraulic conductivities for these aquifers were defined as 25 and 18 md−1, respectively [7].

Groundwater Depth

Based on groundwater level measurements in the wells and piezometers located in the study area during October 2006, the depth to groundwater level relative to the ground surface is shown in Figure 9. The shallow water table was measured in the Quaternary aquifer of the Arneh valley and the plain area, while the highest values were measured in the north, northeast and south of the study area. Although the groundwater table is located at a depth greater than the median depth of 15 m in most of the study area, the hydrogeological characteristics and the hydrodynamic exchange between the aquifer system suggest that the depth to the groundwater table is not an important factor to consider when determining aquifers pollution risk. This is most likely true for the unconsolidated upper aquifer horizon as well as for the exposed fractured and highly karstified part of the complex aquifer horizon of Jurassic and Cretaceous aquifers.

Piezometric Map of the Aquifer System

The upper aquifer horizon (Neogene and Quaternary aquifers) is in direct connect with the Jurassic and Cretaceous aquifer in the western, mountainous side of the study area [7]. However, the available data of groundwater static levels measured in the two system during October 2006 and the altitudes were used to construct the equipotential contour lines for the whole system as shown in Figure 3. The general groundwater flow is organized towards the east direction. Minor flow direction is also recognized from northwest to southeast toward the faults direction (Figure 5) where several springs with relatively high discharges emerge close to the limit of the basalt formations in the plain region. A steeper hydraulic gradient is observed in the western and northern mountainous parts, where the karsts and faults are more dominant.

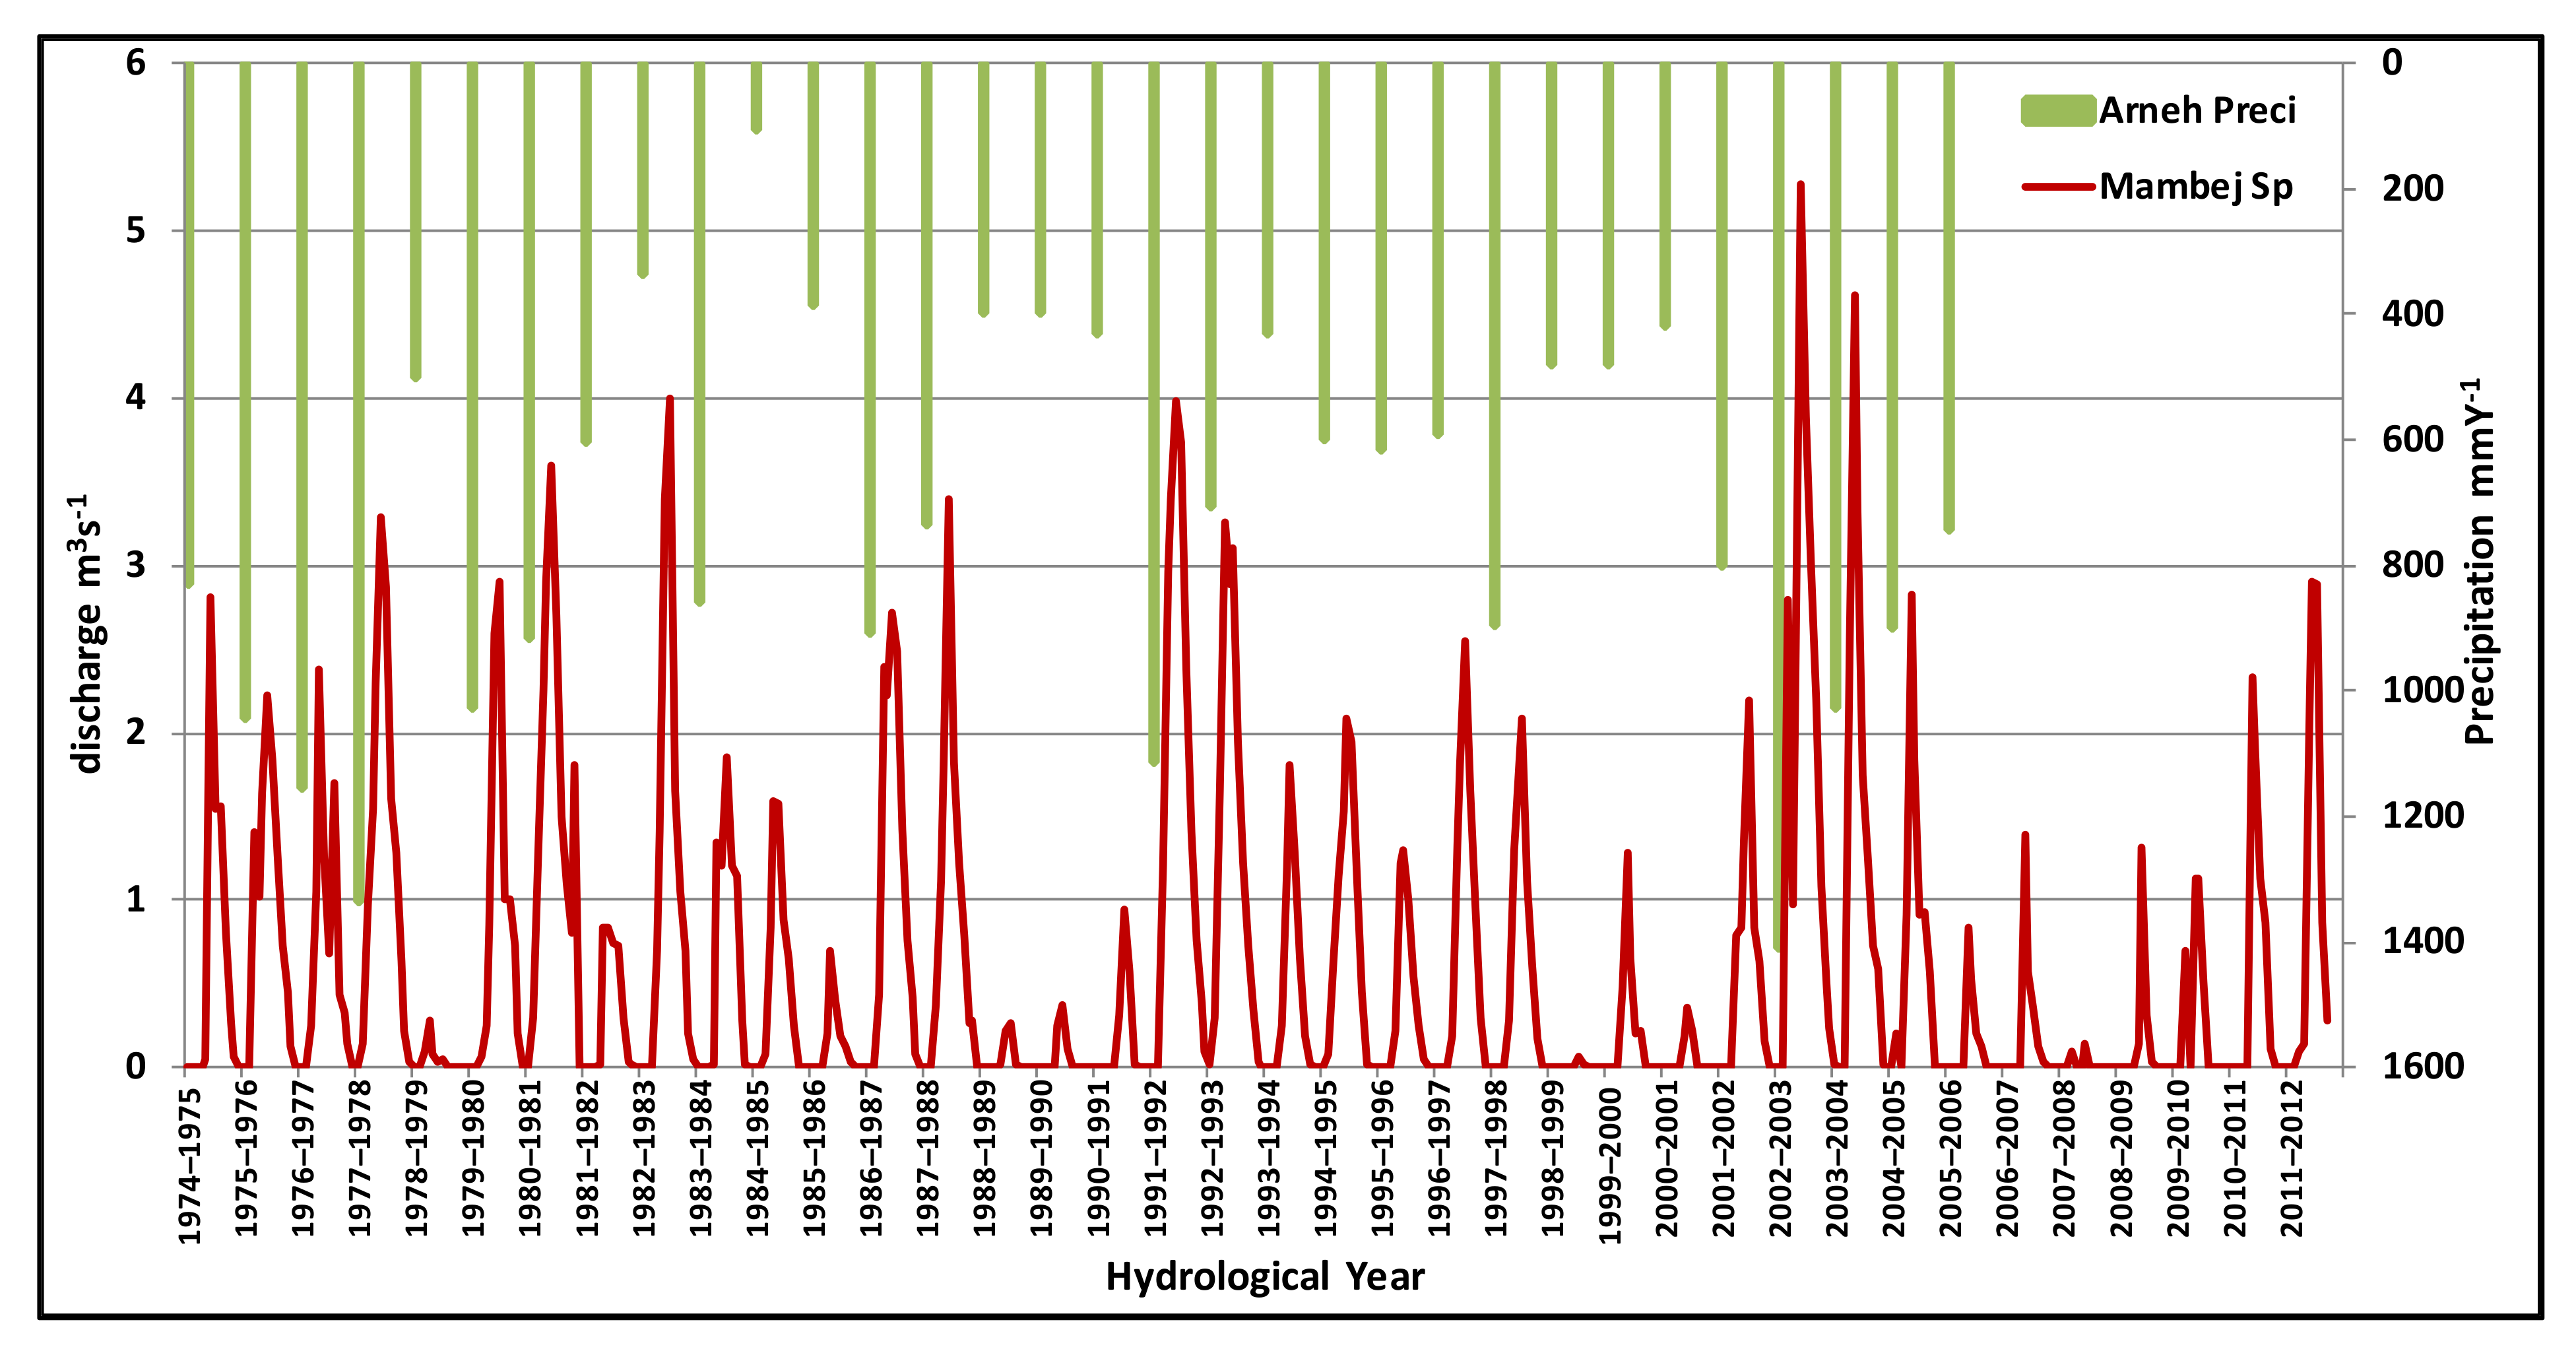
3.2.3. Hydroclimatological Conditions

The climate of the study area is generally considered as a modified Mediterranean type with continental influence (warm dry summer and cool rainy winter, with two transitional periods in spring and autumn). The climate conditions of this area are often subjected to high variability due to the influence of different air mass circulation and the local effect of two main geographical features, the Mediterranean Sea and the Anti-Lebanon Mountains. The recent climate changes, including a decrease in winter temperatures and total precipitation amount as well as an increase in summer temperatures, lead to a prevailing dry continental climate over this region [26,38].
The climate conditions vary from semihumid (moderate) in the western portion in Mt. Hermon, to semiarid in the plain region. Between December and March, the higher region of Mt. Hermon (>1500 m.a.s.l), usually receives the precipitation in the form of snow, which may persist until June. The drainage network is found along the slopes of the Mt. Hermon ridge at the altitude of more than 1000 m.a.s.l where the two tributaries of Awaj River (Sebarani and Jenani) are generated. The major factors affecting stream discharge in this area are precipitation and snowmelt. The amount of snowfall at the altitude between 2200 and 2400 m is estimated to be between 1100 and 1700 mm. The snowmelt contributes to about 80% of the total precipitation for the altitude above 2400 m, about 60% for the altitude between 2000 and 2400 m, and about 30% at the altitude of 1500 m [39]. Surprisingly, it was observed that snowfall on Mt. Hermon and the Anti-Lebanon Mountains had twice the water content as the same volume of snow falling at the same altitude on the Alps [40,41]. The precipitation plays a significant role on the groundwater recharge which estimated to be about 173 × 106 m3·y−1 in the study area for the hydrological year 2009–2010 [7]. In this part of the Mediterranean region, the amount of precipitation decreases eastwards, and varies from more than 1000 mmy−1 at Mt. Hermon to less than 300 mmy−1 in the eastern parts. The wide range of the amount of precipitation in this relatively small area is related to the existence of mountains which constitute a barrier preventing wet depression from the Mediterranean Sea to reach the eastern region. The highest portion of precipitation in the mountainous parts is infiltrated throughout the karstic rocks to recharge groundwater or discharge as karstic springs [6,7].
The hydrograph variation of Mambej spring, which is located at the limit between the Neogene and Quaternary formations in the southeast portion of the study area, and its response to precipitation input event is shown in Figure 10. This hydrograph shows how the spring responds rapidly to precipitation with sharp changes in flow. It gives insight into the karst structure and dynamic flow of the aquifer. Heavy rainfall during the rainy season leads to a substantial input into the subsurface karst network and well-developed conduits. The rapid increase in spring flow, from almost zero to several cubic meters per second, suggests short transit time and indicates that the flow regime of this spring is developed into an intricate system of dissolution-enlarged fissures within the epikarst which highlights the aquifer’s low resistance against pollution.
The monthly average air temperature ranges between 25 °C and 27 °C in summer within the plain region, while this value is about 19 °C in the mountains at an elevation above 2000 m.a.s.l during the same period. In winter, the monthly average air temperature ranges from 10 °C to 15 °C within the plain area and decreases to less than 0 °C above 1500 m.a.s.l. The average temperature over the Eastern Mediterranean area has increased by 1.5–4 °C in the last 100 years [26].
The relative humidity values are essentially related to temperature oscillation [42], thus low monthly values are usually about 24–50% during summer (July and August) and may reach up to 60–70% during winter (January and February). The humidity values generally decrease eastward across the recharge area for any given elevation.
The annual potential evaporation varies between 1500 mmy−1 in the flatlands to 1100 mmy−1 in the mountainous parts. The lowest value of potential evaporation is estimated to be at 500 mmy−1 for altitudes higher than 2600 m.a.s.l. Evapotranspiration in the mountainous area varies between 300–400 mmy−1, while it is about 100 mmy−1 in the flatland area [30,43].

4. Impact of Water and Land Use on Groundwater Contamination in the Study Area

The hydrogeological complex and laterally heterogeneous multiaquifer system of the study area is tapped by urban wells at different depths. Agriculture is the main economic activity in this area. Groundwater is the main source for both domestic and agricultural activities mainly in the plain region. This source is under intense anthropogenic pressure and constant threat of contamination. Therefore, and from a potential contamination perspective, protection of groundwater resource against the contamination problem can be considered as an impending important subject. The agricultural land, which consists of irrigated fields, dry farming and orchards, covers around 92 km2. The actual trend of this area is associated with high population growth and poor sanitation facilities as well as extensive use of fertilizers, (ammonium nitrate and ammonium phosphate) that may lead to nitrate contamination of groundwater. The exposed parts of the karstified Jurassic and Cretaceous aquifers in the mountain area show unfavorable conditions for exploitation. On the other hand, when they underlie at a reasonable depth in the flat area, they form a favorable but relatively deep aquifer. However, domestic sewages, especially on-site sanitation systems such as pit latrines or discharge of effluents to surface water, exacerbate groundwater contamination.
In the last 20 years and due to surface water resources regression resulting from climate change and increasing of water demand, the groundwater becomes an important source of water supply in the study area. About 1000 dug wells (most of which are illegal), have been drilled for both domestic and agricultural purposes. Increasing the agricultural activities has a negative impact on the quality and quantity of the groundwater resources [6]. Figure 3 shows main agricultural fields and spatial distribution of abstraction wells. However, in the plain area, where the majority of these wells are located, the quality of groundwater is clearly impacted. This will be further elaborated in the following sections.

5. Field Parameters and Dissolved Solutes (NO3)

The characteristics of some physiochemical parameters of groundwater change over a very short time scale. These parameters should be measured in the field, therefore they are called field parameters. Among them, electric conductivity (EC) and hydrogen ion concentration (pH) which are significantly affected by the temperature (T). However, these three parameters directly affect many of the physical and chemical characteristics of groundwater. They can be used to identify different source of contamination from surface infiltration, or leakage between the different aquifers which have a different water quality.

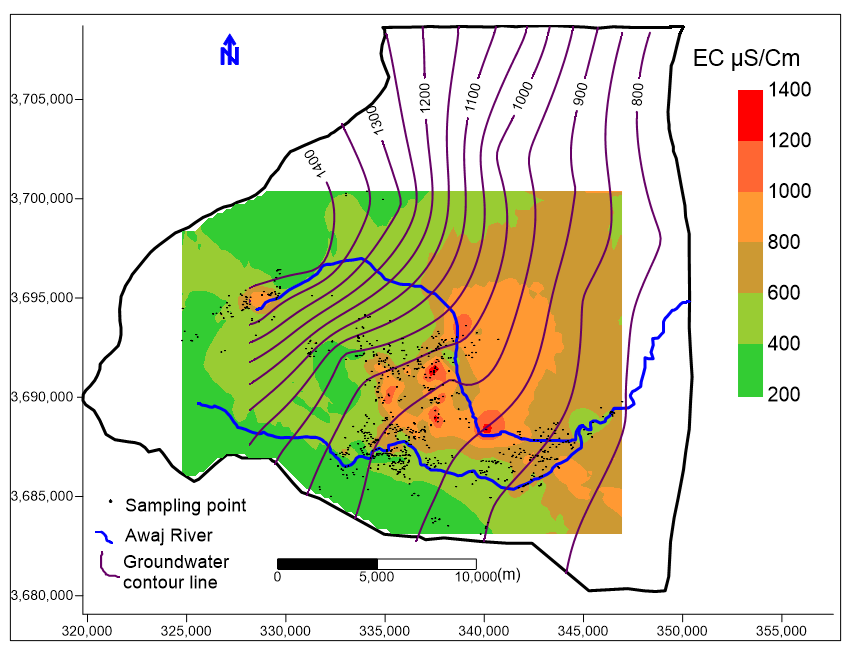
5.1. Electric Conductivity (EC)

When groundwater is not affected by pollution, it is characterized by low values of EC. The EC values were measured in 750 groundwater samples collected during the dry period (July and August) of 2006 [19]. These samples cover about 360 km2 of the study area and are mainly located in the plain region (Figure 11). Generally, the EC values show a gradual increase from the upland recharge areas (mountain parts) towards the lowland discharge areas (plain area) coinciding with groundwater flow direction (Figure 11). Along the Arneh valley, where the Sebarani tributary of Awaj River is generated, relatively high values of EC indicate the influence of the salinization caused by the dissolution of local evaporite formations such as gypsum and anhydrite. In general, the lowest values of EC, (200–400 µS·cm−1) are measured in the western mountain area (Jurassic part) as well as in the basaltic formation in the southern part of the study area. The highest values of EC (800–1400 µS·cm−1), are measured in the plain area (Neogene and Quaternary aquifers), indicate the effect of irrigation return flow, evapotranspiration, and groundwater flow direction.

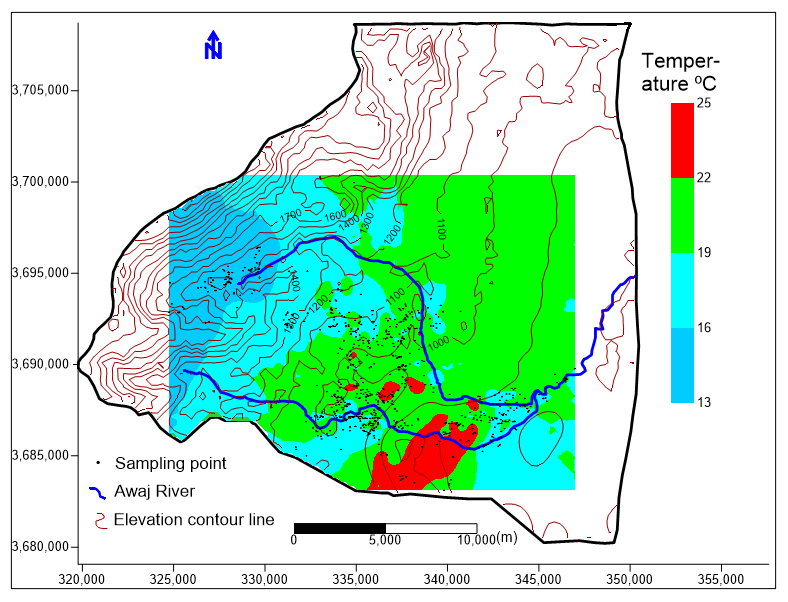
5.2. Groundwater Temperature Distribution

The spatial distribution of temperature of 750 groundwater samples measured in July and August 2006 is shown in Figure 12. This figure shows that the groundwater samples that are situated at more than 1400 m and mainly located in the Jurassic part showing water temperature of below 16 °C. At these elevations, groundwater temperature is affected by altitude and snow melting. Generally, groundwater temperature increases in the eastern direction toward the highest values in the southern part of the study area (22–25 °C), and then decreases again in the southeastern part of this area.
The relatively low temperature values (16–19 °C) measured in the southeastern part, could be used as a tracer to indicate flow patterns from the Jurassic aquifer in the west towards the Neogene/Quaternary aquifer, as tectonically-induced flow controlled by regional faults. The recharge by the Awaj River, which is characterized by low temperature and intensively used in agricultural activities in this part, might also contribute to decrease the groundwater temperature. In contrast, some groundwater samples demonstrate high temperature values (22–25 °C) as a result of upward leakage of groundwater from deep aquifers [7]. These samples also demonstrate high EC values (Figure 13).

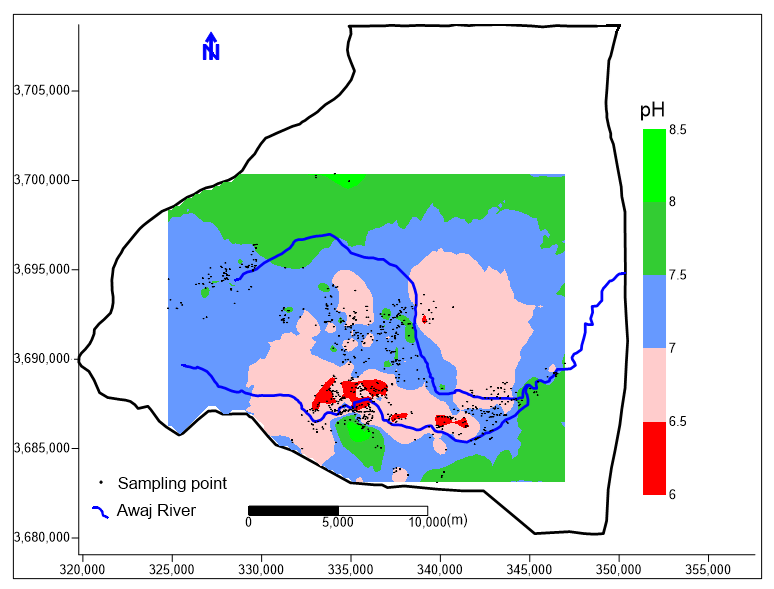
5.3. Hydrogen Ion Concentration (pH)
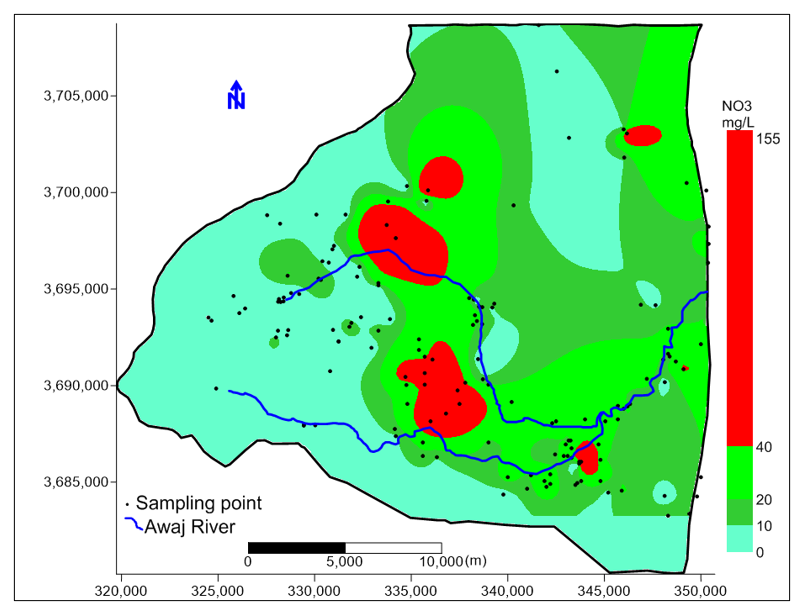
Groundwater pH is a fundamental property that describes acidity and alkalinity. It also largely controls the chemical form of many organic and inorganic substances dissolved in water [44].
The groundwater pH alternations depend on the rocks geology of both the recharge area and the aquifers as well as the residence time of groundwater. The pH measured in the groundwater samples, shows both acidity and alkalinity, but the majority of these samples are characterized by pH values ranging from 6.5 to 7.5 (Figure 13). A few samples demonstrating high pH values (7.5–8.5) are located mainly in the southern and southeastern parts of the study area where the basalt Quaternary formations are exposed. The acidic zones, (pH: 6–6.5), are located in the plain area. The groundwater table fluctuates due to extensive pumping in this zone introducing oxygen to the hydraulically impacted zone. The entrapped air is dissolved subsequently during stages of groundwater table rise, thereby oxidizing iron sulphide minerals commonly present in the sediments [44,45]. The contamination resulting from the domestic wastewater disposal of surrounding villages, decaying organic material and interbedding of sand formations might have contributed in reducing the pH values in this area.

5.4. Dissolved Solutes (NO3)

As mentioned, agriculture is the main economic activity which influences the quality of groundwater, particularly through the leaching of nitrate. The agricultural and urban activities are mainly predominant in the plain area where the soil is very vulnerable to leaching by excess irrigation. The intensive uses of fertilizers and manure in these activities, the irrigation return flow, the wastewater disposal and the waste generated directly by animals have increased the nitrate concentration in the groundwater. During flood periods (March and April 2006), the total coliforms and fecal coliforms (Escherichia coli), have been detected in three springs located in the plain area which indicates a fecal contamination resulted from untreated sewage water or animal waste [6]. The nitrate value in groundwater has been often used as an indicator of groundwater pollution from overland input and groundwater vulnerability [46,47,48]. Actual nitrate concentration values measured in 150 groundwater samples [5], show that nitrate levels vary from 0 to 154 mg L−1 with an average of 21.7 mg L−1. The areal distribution of this variable is shown in Figure 14. The high nitrate values were measured in the plain region may indicate that the aquifer has been influenced by anthropogenic activities taking place at or near the land surface where considerable numbers of groundwater abstraction wells are situated. The high values were also measured in two villages located at the lower part of the Jurassic aquifer (about 1600 m.a.s.l) as a result of rapid septic tank infiltration. The highly karstified limestone of this part enhances quick infiltration of untreated wastewater and increases the nitrate concentration in the groundwater.

6. Results and Discussion

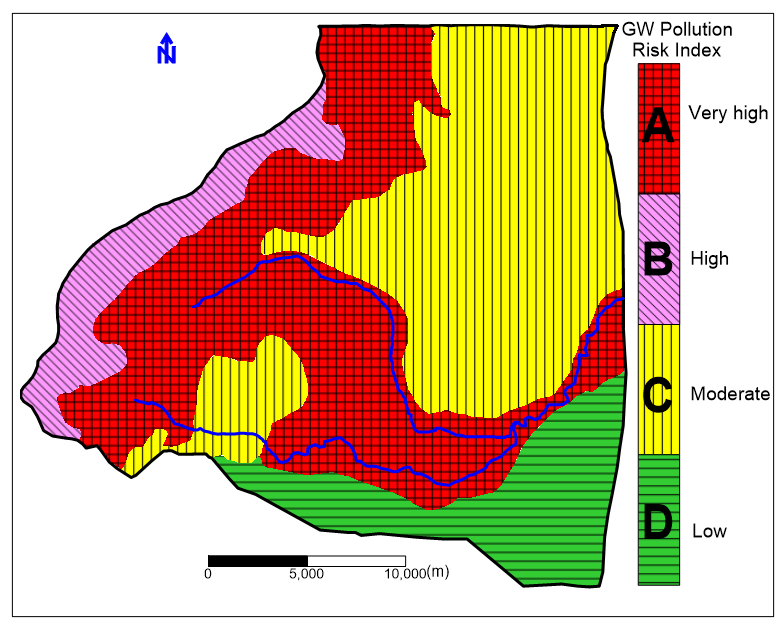
6.1. Delineation of Groundwater Pollution Risk Map

The degree of the pollution risk is determined by using an index that resulted from the average then sum of final evaluation of hydrogeological, physicochemical and socioeconomic parameters/indicators for each zone (Table 3).
The final calculated value (Table 3), defines the pollution risk score, where the lower pollution risk score determines the higher aquifer system protection. Based on this evaluation, four classes or pollution risk indices can be identified (Table 3). The range 0–5 is considered as low pollution risk, 5–10 is considered as moderate pollution risk, 10–15 is considered as high pollution risk and more that 15 is considered as very high pollution risk. However, the study area has been divided into four subareas according to the pollution risk. The result shows that around 40% of aquifer system is within very high pollution risk, 9% is estimated as high pollution risk, 38% is within moderate pollution risk and 13% is within a low pollution risk category (Table 3).
A very high pollution risk category corresponds to the upper aquifer horizon of the alluvial and proluvial Quaternary, that extends as a narrow strip along the two tributaries of Awaj River, and the karstified Neogene aquifer in the central part of the study area. This aquifer horizon is the subject of intensive exploitation to mainly meet the agricultural needs. In this part, the groundwater level is relatively shallow and the recharge from irrigation return flow is considerable. The anthropogenic activities contribute in various ways to groundwater contamination. The major springs, which are located in this aquifer horizon, play a considerable role in agricultural and domestic activities. These springs are mainly recharged from the karstified Jurassic aquifer [6]. A very high pollution risk index was also defined for the lower part of the Jurassic aquifer where several villages are located. This area is characterized by a high recharge rate as confirmed by stable isotopic composition of groundwater [6]. The karst features (e.g., dolines, sinkholes) and major faults contribute to increase the vulnerability and the pollution risk of this zone.
The high pollution risk index might be given to the upper fractured zone of Jurassic aquifer, which is almost eroded from the soil and characterized by the scarcity of vegetation cover and the absence of urban activities. The steep slope and lack of biogeomorphic impacts of biota in this zone, compared with the lower zone, might affect the dissolution potential of the rocks. The EC, pH, T and NO3 values measured in the groundwater samples as well as the isotopic composition of rainfall and groundwater [6], and the springs’ regime, suggest quick conduit flow within this zone.
In the major part of the Neogene, where an ancient drainage network can be recognized from satellite photo (Figure 2), and the Paleogene, the marly and clayey limestone and clay formations are predominant. This help to increase the protective capacity of the unsaturated zone. Otherwise, the karstic landform is absent or less developed on the surface layer of these formations and the urbanization activities are also less developed. However, the weighted parameters/indicators showed that the moderate pollution risk index of groundwater can be defined for this part.
The low pollution risk index of groundwater is located in the Quaternary basaltic aquifer. The surface basaltic deposits, which forms thick impermeable formation, contributes to protecting the aquifer. The groundwater level of this aquifer is situated at a considerable depth and associated with a considerably low recharge rate.
The simplified groundwater pollution risk index map (Figure 15) and land use map (Figure 3), show that the irrigation zones are located in the very high pollution risk index area. It indicates that the applied fertilizers to the irrigation zones and organic wastes from urban areas infiltrate toward the aquifers and affect directly the quality of groundwater.

6.2. Groundwater Pollution Risk Index Assessment and Water Resources Management

The protection of groundwater resources can be considered as a part of an overall water resource management approach. Groundwater pollution risk assessments can help in attaining sustainable water resources management by protecting the groundwater resources when a new decision will be taken for future development. The final groundwater pollution risk index map can be considered as a helpful tool especially when groundwater can be exposed to contamination as a result of activities that take place on the land surface as what was seen in the plain area in our case study. Proper interpretation of the groundwater pollution risk index map can help the planners to determine the adopted strategy or to establish a management scenario in order to avoid the groundwater pollution threat. However, this map identifies different groundwater susceptible areas due mainly to natural impacts and then the anthropogenic effects. It may draw interest on decision makers, hydrogeologists or another end-user who would like to know the groundwater risk that can result from a particular activity or development. It can also help in creating different protection zones [49,50]. The development of the integrative approach (IA) for groundwater pollution risk assessment of the study area, allowed us to discriminate between the different four zones. The delineation of different zones in different colors aid visually in classifying, distinguishing and interpreting groundwater pollution risk map of this area. This map gives an indication of the overall risk to groundwater pollution in this area. It shows that about 90% of this area varies from very high to moderate pollution risk index, meaning that, the natural attenuation processes capacity of the system is very low. However, about 50% of the study area falls under a high and very high pollution risk index which reduces the protection capacity of the unsaturated zone of this area. However, the most human-related activities are located in this area which increases the risk of human impact and pollution on groundwater. In moderate and low groundwater pollution risk zones, the natural protections of groundwater resources are reasonable and high, respectively. In these zones, there are less agricultural and urban activities which reduce the risk of groundwater pollution.
The Jurassic aquifer together with the Cretaceous aquifer form the most important water-bearing system in the Damascus basin and in Syria in terms of storage capacity and discharge of springs [42]. These aquifers are located in the very high and high groundwater pollution risk zones. However, the majority of springs, abstraction wells and two tributaries of the Awaj River are situated in very high and high pollution risk zones. Nevertheless, further investigations and risk assessment should be conducted before any urban development planning or water exploitation project in order to protect and limit the possible impact on groundwater resources in this area.
Reducing activities that increase the nitrate concentration in the polluted area is an important procedure to improve the water quality. The result of groundwater modelling [7], shows strong hydraulic connection between the karstified Jurassic aquifer and other aquifers, either directly or by upward leakage. Because of the fast and short transit time of groundwater flow and subsequently, of pollutants, e.g., fecal and pathogenic microorganisms with very poor attenuation, the groundwater pollution risk of this aquifer must be considered. However, this aquifer has to be included into immediate planning in order to protect this vital source mainly against the septic tanks and olive mill wastewater. Consequently, the strong investment in sewage systems and quality control of groundwater should be a priority condition.
This study demonstrates the role of groundwater pollution risk assessment and mapping approach in developing an educational and hydrogeological relevant tool. This tool can be used to support hydrogeological conceptualization, to develop priorities for aquifer protection policies, in particular, and to contribute to improving water resource management decisions in general. It helps to develop of an efficient management plan of water resources throughout the emphasizing areas that need further investigation and effective intervention. It also provides an overview of water resources threats which can help in raising awareness of the highest level of groundwater protection. However, a low pollution risk index observed for some parts of the study area does not mean that there is no risk for contamination in the future. This simply means that the geological and hydrogeological conditions of these parts offer a more natural protection to groundwater resources.
Several factors such as effective hydraulic connection between the aquifer systems, potentially important of geological structures especially the major faults zones, intensive development of anthropogenic activities and missing the sewage treatment system contribute to increase groundwater pollution risk. The delineated groundwater pollution risk index map can be used as a general guideline for water management development plan by reducing the risk of pollutants that could reach groundwater.

7. Conclusions

The preliminary obtained result is considered an important approach to determine the degrees of groundwater pollution risk in a region with limited data available. By combining geological, hydrogeological, physiochemical and socioeconomic potential impact, the groundwater pollution risk index has been defined by using a grading system which allows us to integrate the values and weights of major factor. Spatial projection of the results has allowed us to delineate spatial variabilities of potential groundwater pollution in the study area. The result shows that about 50% of the area falls within very high and high pollution risk categories. In fact, the predominance of karstified and fissured carbonate rocks of the Jurassic aquifer in the mountain area as well as the outcropping of alluvial and proluvial (sediments from temporal streams) deposits in the plain area, which are highly sensitive to in situ anthropogenic pollutants, correspond to the obtained results. However, the overall protective capacity of the aquifer system in NEMH has been strongly affected. The pollution risk increases from the upper part to the lower part of Jurassic aquifer. The development of karstic process reduces the protective capacity of the unsaturated zone in the lower part of this aquifer. The absence of urbanization activities at the higher part, compared to the lower one, leads to the absence of anthropogenic contaminant sources and hence the risk to pollution. For the outcropping of low permeable Quaternary basalt in the southern and southeastern region of the study area, where the anthropogenic activities are almost absent, low pollution risk index was assigned. The moderate pollution risk was assigned to the major part of Neogene aquifer and Paleogene formations due to the natural protective capacity of the unsaturated zone, relatively low hydraulic conductivity and less of anthropogenic activities development.
The risk of contamination of the aquifer system of NEMH area is due mainly to the hydrogeological characteristics of this system. However, anthropogenic activities play a considerable role in the deterioration of groundwater quality and increasing of groundwater pollution risk in this area. The result shows that the sewer system losses and septic tanks as well as using of chemical fertilizers and manures in the agricultural activities have a very strong impact on groundwater nitrate contamination. Nevertheless, and with ever-growing demand for the groundwater in this area, priority areas for groundwater management are strongly suggested. The integrative approach (IA) that was employed in order to produce the final map based on available data and information is very promising, especially in a region under high tension and lack of control. IA could give a complete assessment of the overall risk of groundwater pollutions if a full data set can be prepared. It is expected that further researches based on more data collection and groundwater monitoring will decrease the degree of uncertainty and validate the obtained pollution risk index map.
Despite its limitations, the proposed approach can provide an important tool for the sustainable management of groundwater resources in this area and another area of different region of the country.

Author Contributions

All the authors contributed extensively to the work presented in this paper and commented on the manuscript at all stages. N.A., A.D. and P.L.C. designed the research and revisions. N.A., J.D.V., N.P., F.H. and M.B. gave input on the fields of hydrogeology and spatial analysis. N.A. wrote the manuscript with contribution of all authors. All authors have read and agreed to the published version of the manuscript.

Funding

This research received no external funding.

Institutional Review Board Statement

The study was conducted according to the guidelines of the Declaration of Helsinki, and approved by the Institutional Review Board.

Informed Consent Statement

Informed consent was obtained from all subjects involved in the study.

Acknowledgments

The authors are grateful to Abdallah Al-Kattea, Director of Integrated Water Resources Management, General Authority for Water Resources, Ministry of Water Resources, Syria for his assistance in providing the field parameter data. Special thanks go also to Jan Willem Foppen from UNESCO-IHE Delft Institute for his support and supervision of fieldwork carried out in the study area on November and December 2006. Very special thanks go to Paul McLachlan for his aid in editing the final version of this article.

Conflicts of Interest

The authors declare no conflict of interest.

References

  1. Gleick, P.H. Water, Drought, Climate Change, and Conflict in Syria. Amer. Meteor. Soc. J. 2014, 6, 331–340. [Google Scholar] [CrossRef]
  2. Angelakis, N.A. Water Resources Management in Syrian Arab Republic with Emphasis on Non-Conventional Sources; Food and Agriculture Organization of the United Nations—FAO: Damascus, Syria, 2003; p. 176. [Google Scholar]
  3. Kattaa, B.; Al-Fares, W.; Al Charideh, A. Groundwater vulnerability assessment for the Banyas Catchment of the Syrian coastal area using GIS and the RISKE method. J. Environ. Manag. 2010, 91, 1103–1110. [Google Scholar] [CrossRef] [PubMed]
  4. Doerfliger, N.; Jeannin, P.Y.; Zwahlen, F. Water vulnerability assessment in karst environments: A new method of defining protection areas using a multi-attribute approach and GIS tools (EPIK method). Environ. Geol. 1999, 39, 165–176. [Google Scholar] [CrossRef] [Green Version]
  5. Asmael, N.M.; Huneau, H.; Garel, E.; Celle-Jeanton, H.; Le Coustumer, P.; Dupuy, A. Hydrochemistry to delineate groundwater flow conditions in the Mogher Al Mer area (Damascus Basin, Southwestern Syria). Environ. Earth Sci. 2014, 72, 3205–3225. [Google Scholar] [CrossRef]
  6. Asmael, N.M.; Huneau, H.; Garel, E.; Celle-Jeanton, H.; Le Coustumer, P.; Dupuy, A.; Hamid, S. Origin and recharge mechanisms of groundwater in the upper part of the Awaj River (Syria) based on hydrochemistry and environmental isotope techniques. Arab. J. Geosci. 2015, 8, 10521–10542. [Google Scholar] [CrossRef]
  7. Asmael, N.M.; Dupuy, A.; Huneau, H.; Hamid, S.; Le Coustumer, P. Groundwater Modeling as an Alternative Approach to Limited Data in the Northeastern Part of Mt. Hermon (Syria), to Develop a Preliminary Water Budge. Water 2015, 7, 3978–3996. [Google Scholar] [CrossRef] [Green Version]
  8. Murray, K.S.; Rogers, D.T. Groundwater Vulnerability, Brownfield Redevelopment and Land Use Planning. J. Environ. Plann. Manag. 1999, 42, 801–810. [Google Scholar] [CrossRef]
  9. Al-Adamat, R.; Al-Shabeeb, A.A.-R. A Simplified Method for the Assessment of Groundwater Vulnerability to Contamination. J. Water Resour. Prot. 2017, 9, 305–321. [Google Scholar] [CrossRef] [Green Version]
  10. Füssel, H.M. Vulnerability: A generally applicable conceptual framework for climate change research. Glob. Environ. Chang. 2007, 17, 155–167. [Google Scholar] [CrossRef]
  11. Popescu, I.C.; Gardin, N.; Brouyère, S.; Dassargues, A. Groundwater vulnerability assessment using physically-based modeling: From challenges to pragmatic solutions. In ModelCARE’ 2007: Sixth Int. Conf on Calibration and Reliability in Groundwater Modelling; IAHS Press: Wallingford, UK, 2008; pp. 83–88. [Google Scholar]
  12. Varnes, D.J. Commission on Landslides and Other Mass-Movements-IAEG Landslide Hazard Zonation: A Review of Principles and Practices; The UNESCO Press: Paris, France, 1984. [Google Scholar]
  13. Uricchio, V.F.; Giordano, R.; Lopez, N.A. Fuzzy knowledge-based decision support system for groundwater pollution risk evaluation. J. Environ. Manag. 2004, 73, 189–197. [Google Scholar] [CrossRef]
  14. Ouedraogo, I.; Girard, A.; Vanclooster, M.; Jonard, F. Modelling the Temporal Dynamics of Groundwater Pollution Risks at the African Scale. Water 2020, 12, 1406. [Google Scholar] [CrossRef]
  15. Amharref, M.; Bouchnan, R.; Bernoussi, A.S. Extension of DRASTIC Approach for Dynamic Vulnerability Assessment in Fissured Area: Application to the Angad Aquifer (Morocco). In Hydrogeological and Environmental Investigations in Karst Systems; Springer: Berlin/Heidelberg, Germany, 2015. [Google Scholar]
  16. Kazakis, N.; Voudouris, S.K. Groundwater vulnerability and pollution risk assessment of porous aquifers to nitrate: Modifying the DRASTIC method using quantitative parameters. J. Hydrol. 2015, 525, 13–25. [Google Scholar] [CrossRef]
  17. Patrikaki, O.; Kazakis, N.; Voudouris, K. Vulnerability map: A useful tool for groundwater protection: An example from Mouriki Basin, North Greece. Fresen Environ. Bull. 2012, 21, 2516–2521. [Google Scholar]
  18. Foster, S.S.D. Fundamental Concepts in Aquifer Vulnerability, Pollution Risk and Protection Strategy. In Vulnerability of Soil and Ground Water Pollutants; Van Duijvenbooden, W., Van Waegenigh, H.G., Eds.; TNO Committee on Hydrological Research Information: The Hague, The Netherlands, 1987; pp. 69–86. [Google Scholar]
  19. RDWSSA (Water Utility of Damascus Rif). Interim Report-Hydrogeological Study of Mogher Al Mer Area, Damascus Rural Water and Sanitation Project; RDWSSA: Damascus, Syria, 2006. Unpublished Report. (In Arabic) [Google Scholar]
  20. Rimmer, A.; Salingar, Y. Modelling precipitation-streamflow processes in karst basin: The case of the Jordan River sources. Israel. J. Hydrol. 2006, 331, 524–542. [Google Scholar] [CrossRef]
  21. Wilson, M.; Shimron, A.E.; Rosenbaum, J.M.; Preston, J. Early Cretaceous magmatism of Mount Hermon, Northern Israel. Contributions to Mineralogy and Petrology. Contrib. Miner. Petr. 2000, 139, 54–67. [Google Scholar] [CrossRef]
  22. Black, E. The impact of climate change on daily precipitation statistics in Jordan and Israel. Atmos. Sci. Lett. 2009, 10, 192–200. [Google Scholar] [CrossRef]
  23. Evans, J.P. 21st century climate change in the Middle East. J. Clim. Chang. 2009, 92, 417–432. [Google Scholar] [CrossRef]
  24. Gonçalves, M.; Barrera Escoda, A.; Guerreiro, D.; Baldasano, J.M.; Cunillera, J. Seasonal to yearly assessment of temperature and precipitation trends in the North Western Mediterranean Basin by dynamical downscaling of climate scenarios at high resolution (1971–2050). Clim. Chang. 2014, 122, 243–256. [Google Scholar] [CrossRef] [Green Version]
  25. Mathbout, S.; López-Bustins, J.A.; Martin-Vide, J.; Bech, J.; Rodrigo, F.S. Spatial and temporal analysis of drought variability at several time scales in Syria during 1961–2012. Atmos. Res. 2018, 200, 153–168. [Google Scholar] [CrossRef]
  26. Alpert, P.; Krichak, D.O.; Sharif, H.; Haim, D.; Osetinsky, I. Climatic trends to extremes employing regional modeling and statistical interpretation over the E. Mediterranean. Glob. Planet Chang. 2008, 63, 163–170. [Google Scholar] [CrossRef]
  27. MOI. Annual Water Resources Report of Barada and Awaj Basin; MOI: Damascus, Syria, 2005. Unpublished Report. (In Arabic)
  28. Melhem, R.; Higano, Y. Policy measures for river water management in Barada Basin, Syria. Stud. Reg. Sci. 2001, 32, 1–23. [Google Scholar] [CrossRef] [Green Version]
  29. Taylor, R.G.; Todd, M.C.; Kongola, L.; Maurice, L.; Nahozya, E.; Sanga, H.; MacDonald, A.M. Evidence of the dependence of groundwater resources on extreme rainfall in East Africa. Nat. Clim. Chang. 2013, 3, 374–378. [Google Scholar] [CrossRef] [Green Version]
  30. Selkhozpromexport. Water resources use in Barada and Awaj Basins for irrigation of crops. In USSR. Ministry of Land Reclamation and Water Management; Selkhozpromexport: Moscow, Russia, 1986. [Google Scholar]
  31. Asmael, N. Hydrochemistry, Isotopes and Groundwater Modeling to Characterize Multi-Layered Aquifers Flow System in the Upper Part of Awaj River—Damascus Basin (Syria). Ph.D. Thesis, University of Bordeaux Montaigne, Bordeaux, France, 2015. [Google Scholar]
  32. Dubertret, L. L’Hydrologie et aperçu sur l’Hydrographie de la Syrie et du Liban dans leurs relations avec la géologie. Rev. Géogr. Phys. Géol. Dyn. 1933, 4, 347–452. (In French) [Google Scholar]
  33. Kim, Y.J.; Hamm, S.-Y. Assessment of Potential for Groundwater Contamination Using the DRASTIC/EGIS Technique, Cheongju Area, South Korea. Hydrogeol. J. 1999, 7, 227–235. [Google Scholar] [CrossRef]
  34. Alwathaf, Y.; El Mansouri, B. Assessment of Aquifer Vulnerability Based on GIS and ARCGIS Methods: A Case Study of the Sana’a Basin (Yemen). J. Water Resour. Prot. 2011, 3, 845–855. [Google Scholar] [CrossRef] [Green Version]
  35. DHI-WASY GmbH. FEFLOW 6-Finite elements subsurface flow and transport simulation system. In User’s Manual; DHI-WASY GmbH: Berlin, Germany, 2010. [Google Scholar]
  36. Rahman, A. A GIS based DRASTIC model for assessing groundwater vulnerability in shallow aquifer in Aligarh, India. Appl. Geogr. 2008, 28, 32–53. [Google Scholar] [CrossRef]
  37. Muhammad, A.M.; Zhonghua, T.; Dawood, A.S.; Earl, B. Evaluation of local groundwater vulnerability based on DRASTIC index method in Lahore, Pakistan. Geofis. Int. 2015, 54, 67–81. [Google Scholar] [CrossRef] [Green Version]
  38. IPCC. The Scientific Basis, Contribution of WG I to the Third Assessment Report of the Intergovernmental Panel on Climate Change. In Climate Change; Cambridge University press: Cambridge, UK, 2001. [Google Scholar]
  39. Ministry of Irrigation, Syria (MOI). Hermon Project Report; Ministry of Irrigation, Syria (MOI): Damascus, Syria, 1994. (In Arabic)
  40. Aouad-Rizk, A.; Job, J.-O.; Khalil, S.; Touma, T.; Bitar, C.; Boqcuillon, C.; Najem, W. Snow in Lebanon: A preliminary study of snow cover over Mount Lebanon and simple snowmelt model. Hydrol. Sci. J. 2005, 50, 555–569. [Google Scholar]
  41. Brielmann, H. Recharge and Discharge Mechanism and Dynamics in the Mountainous Northern Upper Jordan River Catchment, Israel. Ph.D. Thesis, Ludwig-Maximilians-University, Munich, Germany, 2008. [Google Scholar]
  42. Japan International Cooperation Agency (JICA). The Study of Water Resources Development in the Western and Central Basins in Syrian Arab Republic, Phase I; JICA: Osaka, Japan, 2001. Unpublished Report. (In Arabic)
  43. Kattan, Z. Environmental isotope study of the major karst springs in Damascus limestone aquifer systems: Case of the Figeh and Barada springs. J. Hydrol. 1997, 193, 161–182. [Google Scholar] [CrossRef]
  44. Sundaram, B.; Feitz, A.; de Caritat, P.; Plazinska, A.; Brodie, R.S.; Coram, J.; Ransley, T. Groundwater Sampling and Analysis—A Field Guide. In Geoscience Australia Record; Geoscience Australia: Canberra, Australia, 2009. [Google Scholar]
  45. WHO. Guidelines for Drinking-Water Quality, Fourth Edition, Incorporating the First Addendum; World Health Organization: Geneva, Switzerland, 2017. [Google Scholar]
  46. Huan, H.; Wang, J.; Teng, Y. Assessment and validation of groundwater vulnerability to nitrate based on a modified DRASTIC model: A case study in Jilin City of Northeast China. Sci. Total Environ. 2012, 440, 14–23. [Google Scholar] [CrossRef]
  47. Corniello, A.; Ducci, D.; Ruggieri, G. Areal identification of groundwater nitrate contamination sources in periurban areas. J. Soils Sediments 2007, 7, 159–166. [Google Scholar] [CrossRef]
  48. Shrestha, S.; Semkuyu, D.J.; Pandey, V.P. Assessment of groundwater vulnerability and risk to pollution in Kathmandu Valley, Nepal. Sci. Total Environ. 2016, 556, 23–35. [Google Scholar] [CrossRef]
  49. González, A.; Sánchez, A.L.; Requena, P.M.; Varela, M.S. Assessment of the microbiological quality of groundwater in three regions of the Valencian Community (Spain). Int. J. Environ. Res. Public Health 2014, 11, 5527–5540. [Google Scholar] [CrossRef] [Green Version]
  50. Meerkhan, H.; Teixeira, J.; Marques, J.E.; Afonso, M.J.; Chaminé, H.I. Delineating Groundwater Vulnerability and Protection Zone Mapping in Fractured Rock Masses: Focus on the DISCO Index. Water 2016, 8, 462. [Google Scholar] [CrossRef] [Green Version]
Figure 1. Flowchart showing the component of proposed approach and evaluation process for groundwater pollution risk assessment in NEMH.
Water 13 01220 g001
Figure 2. The location of the study area in Barada and Awj Basin (left) and the map of Syria (right), which is divided into seven hydrogeological basins, after the Ministry of Irrigation, Syria, unpublished data.
Water 13 01220 g002
Figure 3. The different geological formation outcrop in the study area, after [30,31], equipotential contours map of October 2006 and location sites of irrigation field and spatial distribution of abstraction wells.
Water 13 01220 g003
Figure 4. Geological cross section showing subsurface lithology in the study area as well as the major structure within this area, updated after [19,31].
Water 13 01220 g004
Figure 5. Major faults that depicted in the study area (after [30,31]) together with elevation contours as well as the DEM of this area.
Water 13 01220 g005
Figure 6. Different aquifers and aquitards discriminated in the study area, (after [30,31]). 1, 3 and 5 are aquifers, 2 and 4 are aquitards.
Water 13 01220 g006
Figure 7. A 3D representation of the aquifers and aquitards of NEMH area as well as pollution pathway concept, modified from [7].
Water 13 01220 g007
Figure 8. Spatial distribution of the hydraulic conductivity (md−1) in the aquifer system of NEMH, after [31].
Water 13 01220 g008
Figure 9. Spatial distribution of depth to groundwater level during October 2006 in the study area.
Water 13 01220 g009
Figure 10. The variations of the monthly discharge of Mambej spring and the annual amount of precipitation measured at Arneh station.
Water 13 01220 g010
Figure 11. Spatial distribution of EC (µS·cm−1) values in groundwater samples based on available data of field survey conducted in July and August 2006 and associated equipotential contour map based on groundwater level measured during October 2006.
Water 13 01220 g011
Figure 12. Spatial distribution of groundwater temperature (T, °C) in the study area based on available data of field survey conducted from July to August 2006.
Water 13 01220 g012
Figure 13. Spatial distribution of pH values in groundwater samples based on available data of field survey conducted from July to August 2006.
Water 13 01220 g013
Figure 14. Spatial distribution of NO3 (mg L−1) values measured in the groundwater samples, December 2006.
Water 13 01220 g014
Figure 15. Spatial distribution of simplified groundwater pollution risk index map of NEMH showing the pollution risk classes.
Water 13 01220 g015
Table 1. A proposed grading system (range and rating) designed for this study.
ThemeParameter/IndicatorRangeRating (Index Value)
PhysicochemicalNitrate (mg L−1)0–101
10–202
20–403
40–504
>505
Cond (μS·cm−1)200–6001
600–8002
800–10003
1000–12004
>12005
pH6.5–7.51
6.5–6, 7.5–82
6–5.5, 8–8.53
5.5–5, 8.5–94
<5, >95
T (°C)10–151
15–202
20–253
25–304
>305
Hydro-geoclimatologicalFault systemAbsent0
Poorly developed2–4
Moderately developed4–6
Well-developed6–8
Extensively developed8–10
Karst indexAbsent0
Low2–4
Moderate4–6
High6–8
Very high8–10
Average hydraulic conductivity (md−1)1–51
5–102–4
10–154–7
15–207–10
Aquifer typesConfined1
Unconfined10
Average precipitation (mmy−1)<1001
100–2502–4
250–5004–6
500–7506–8
750–10008–10
Infiltration coefficient (%)<101
10–151–2
15–202–3
20–503–4
50–704–7
>707–10
Groundwater depth from the ground surface (m)0–1510
15–3010–6
30–456–4
45–604–1
Number of springs1–52–4
5–104–6
10–206–8
>208–10
SocioeconomicDegree of urbanization (Inhabitant)10–50001
5000–10,0001–2
10,000–20,0002–3
20,000–30,0003–4
30,000–40,0004–5
Land use for farming—km2 (%)1–101
10–201–2
20–302–3
30–403–4
40–504–5
Irrigated area km2 (%)1–201
20–302–3
30–403–4
40–504–5
Wells number
(Exploitation potential)
1–501
50–2001–2
200–3502–3
350–5003–4
>5004–5
Irrigation return flow/(%)1–101
10–201–2
20–302–3
30–403–4
40–504–5
Number of conveyance irrigation canal11
1–41–2
4–72–3
7–103–4
>104–5
Applied fertilizers (1000 kg·y−1)1–101
10–201–2
20–302–3
30–403–4
40–504–5
Sewage system correlation with inhabitantsAbsent (10–5000)1
Absent (5000–10,000)1–2
Absent (10,000–20,000)2–3
Absent (20,000–30,000)3–4
Absent (30,000–40,000)4–5
Table 2. The range of different parameters and factors used to assess the aquifer pollution risk to contamination in the NEMH.
ThemeParameter/IndicatorPollution Risk Zone
ABCD
P.R/R 1RSD 2P.R. S 3P.R/RRSDP.R. SP.R/RRSDP.R. SP.R/RRSDP.R. S
PhysicochemicalNitrate (mg L−1)20–1550.5650–100.11110–400.4920–200.462
Cond (μS·cm−1)200–14000.334No Data--400–10000.13200–6000.351
pH6–7.50.091No Data--6.5–8.50.0237–80.052
T (°C)13–250.133No Data--16–220.09216–250.113
Hydro-geoclimatologicalFault systemExtensively developed-10Well-developed-8Poorly developed-2Absent-0
Karst indexVery high-10High-8Low-4Absent-0
Average hydraulic conductivity (m d−1)18-1020-107-31-1
Aquifer typesUnconfined-10Unconfined-10Unconfined-10Confined-1
Average precipitation (mmy−1)250 in the plain area and 850 in the mountains-81000-10250-4215-3
Infiltration coefficient (%)9% in the plain area and 76% in the mountains-1077%-1020%-310%-1
Groundwater depth (m)0–30-9no data-9 *15–60-545–60-2
Number of springs23-1012-75-42-2
SocioeconomicDegree of urbanization (Inhabitant)36,500-5Absent--3500-1Almost absent-1
Land use (km2)≈90 (≈40%)-4Absent--Limited-1limited-1
Irrigated area (km2)≈50 (≈20%)-2Absent--≈5-1≈1-1
Wells number830-50--60-141-1
Irrigation return flow/(%)42-50--0--0--
Number of conveyance irrigation canal11-50--0--0--
Applied fertilizers (1000 kg·y−1)≈47-5Absent-01.9-11.4-1
Sewage system-correlation with inhabitantsAbsent-5Absent-0Absent-1Absent-1
1 Pollution risk range, 2 relative standard deviation, 3 pollution risk score, * the given value is based on available related information (spring, karst index, average hydraulic conductivity… etc.).
Table 3. The parameters scoring system adopted for the evaluation and calculation of pollution risk score of each zone and index of each zone and associated areas (km2 and %) adopted by the authors for a multilayered aquifer system of NEMH.
Impact FactorPollution Risk Zone/Average Pollution Risk Score
ABCD
Physicochemical3.312.52
Socioeconomic4.9011
Hydro-geo-climatological9.694.41.3
Sum of three components of impact factor17.8107.94.3
Pollution Risk IndexVery HighHighModerateLow
Area (km2)2395323278
Area (%)4093813
Publisher’s Note: MDPI stays neutral with regard to jurisdictional claims in published maps and institutional affiliations.

