
Influence of Meteorological Factors on the Potential Evapotranspiration in Yanhe River Basin, China


1
State Key Laboratory of Soil Erosion and Dryland Agriculture on Loess Plateau, Institute of Soil and Water Conservation, Chinese Academy of Sciences and Ministry of Water Resources, Yangling, Shaanxi 712100, China
2
University of Chinese Academy of Sciences, Beijing 100000, China
3
State Key Laboratory of Soil Erosion and Dryland Agriculture on Loess Plateau, Northwest A & F University, Yangling, Shaanxi 712100, China
*
Authors to whom correspondence should be addressed.
Water 2021, 13(9), 1222; https://doi.org/10.3390/w13091222
Submission received: 9 April 2021
/
Revised: 24 April 2021
/
Accepted: 24 April 2021
/
Published: 28 April 2021
Abstract
:Potential evapotranspiration (ET0) is an essential component of the hydrological cycle, and quantitative estimation of the influence of meteorological factors on ET0 can provide a scientific basis for studying the impact mechanisms of climate change. In the present research, the Penman–Monteith method was used to calculate ET0. The Mann–Kendall statistical test with the inverse distance weighting were used to analyze the spatiotemporal characteristics of the sensitivity coefficients and contribution rates of meteorological factors to ET0 to identify the mechanisms underlying changing ET0 rates. The results showed that the average ET0 for the Yanhe River Basin, China from 1978–2017 was 935.92 mm. Save for a single location (Ganquan), ET0 increased over the study period. Generally, the sensitivity coefficients of air temperature (0.08), wind speed at 2 m (0.19), and solar radiation (0.42) were positive, while that of relative humidity was negative (−0.41), although significant spatiotemporal differences were observed. Increasing air temperature and solar radiation contributed 1.09% and 0.55% of the observed rising ET0 rates, respectively; whereas decreasing wind speed contributed −0.63%, and relative humidity accounted for −0.85%. Therefore, it was concluded that the decrease of relative humidity did not cause the observed ET0 increase in the basin. The predominant factor driving increasing ET0 was rising air temperatures, but this too varied significantly by location and time (intra- and interannually). Decreasing wind speed at Ganquan Station decreased ET0 by −9.16%, and was the primary factor underlying the observed, local “evaporation paradox”. Generally, increase in ET0 was driven by air temperature, wind speed and solar radiation, whereas decrease was derived from relative humidity.
1. Introduction
According to the sixth report of the IPCC(Intergovernmental Panel on Climate Change)[1], the increase in global mean surface temperature has reached 0.87 °C in 2006–2015. Warming temperatures intensify hydrological cycling and affect the spatiotemporal allocation of water resources, increasing the frequency and intensity of water-related disasters [2] and posing challenges to people’s safety, socioeconomic development, and environmental security. Therefore, hydrological research is of utmost importance.
Evapotranspiration (ET), composed of water evaporation and transpiration from the surface, water, and plants, is an essential component of the water cycle, with corresponding control over the balances of water and energy. In practical applications, the concepts are divided into actual and potential (ET0), where the former refers to ET under the true conditions of the surface, and latter describes ET levels when the surface is theoretically supplied with limitless water [3]. ET0 represents the limit value of actual ET in a region [4], determines the dry and wet condition of a basin, and is an important indicator for estimating basin ET capacity [2]. Although ET under warming climates has been increasing in some regions, such as western Africa [5], Israel [6], and southern China [7], ET0 is largely decreasing around the globe in a phenomenon known as the “evaporation paradox” [8,9,10,11]. Scholars exploring the causes of changes in ET0 have found that the decline in ET0 in Australia [8], Iran [12], and southern Canada [10] were mainly caused by wind speed; whereas a decline in ET0 in India was most closely related to relative humidity [13]. In China, the most critical factor linked to the decline of ET0 is water vapor pressure [14]; however, due to the large geographical differentiation of natural conditions across the diverse regions of China, the drivers of ET0 display significant spatial heterogeneity. ET0 of the Yellow River Basin has been increasing, with patterns most closely associated with air temperature, followed by incoming solar radiation [15]. The most important meteorological factor for ET0 in the Yangtze River Basin was relative humidity [16], but decreases in solar radiation and wind speed were the main factors influencing lowered levels of ET0 [17]. ET in the upper reaches of the Heihe River Basin was also most correlated to relative humidity, but the observed changes were mainly driven by wind speed [18]. The observed decrease of ET0 on the Qinghai-Tibet Plateau was related to a decrease of wind speed as well, in addition to a decrease in net radiation, and increase in air temperature [19]. The increasing ET0 of the Loess Plateau was caused by the combined effect of rising air temperatures and declining in relative humidity, wind speed, and sunshine hours [20]. As indicated by the varied response of ET0 to the complexities of the changing climate across spatially heterogeneous areas, the precise influence of climate factors on ET0 are still highly uncertain and deserving of further exploration. Further, Liu et al. [21] found that the change of ET0 was not only affected by the climate sensitivity coefficient but is also related to the changing trend of meteorological factors. Thus, only by combining the sensitivity coefficient and contribution rate can we systematically and quantitatively analyze the driving mechanisms of change for ET0 [22].
Since the 1990s, climate change and anthropogenic activity have had a pronounced impact on the hydrological cycle of the Loess Plateau. The Yanhe River Basin (YRB), a typical watershed in the hilly and gully region of the Loess Plateau, provides an optimal opportunity for a more in-depth understanding of the impacts of climate change on ET0 in a region of great significance for understanding the allocation of water resources and components of the water cycle for the region. Therefore, the YRB was selected as the study area for the present research. The Penman–Monteith method was used to calculate ET0, with the objectives of analyzing sensitivity to four major meteorological variables and changing trends of various climate factors. Subsequently, the contribution of these factors were quantitatively estimated, so as to reveal the mechanisms of observed ET0 changes in the YRB over the past 40 years. Broadly, this study contributes to a more thorough understanding of the impact mechanisms of climate change on the hydrological cycle and provides a scientific basis for water resource evaluation and management, in addition to informing agricultural planting structures.
2. Data and Methods
2.1. Study Area
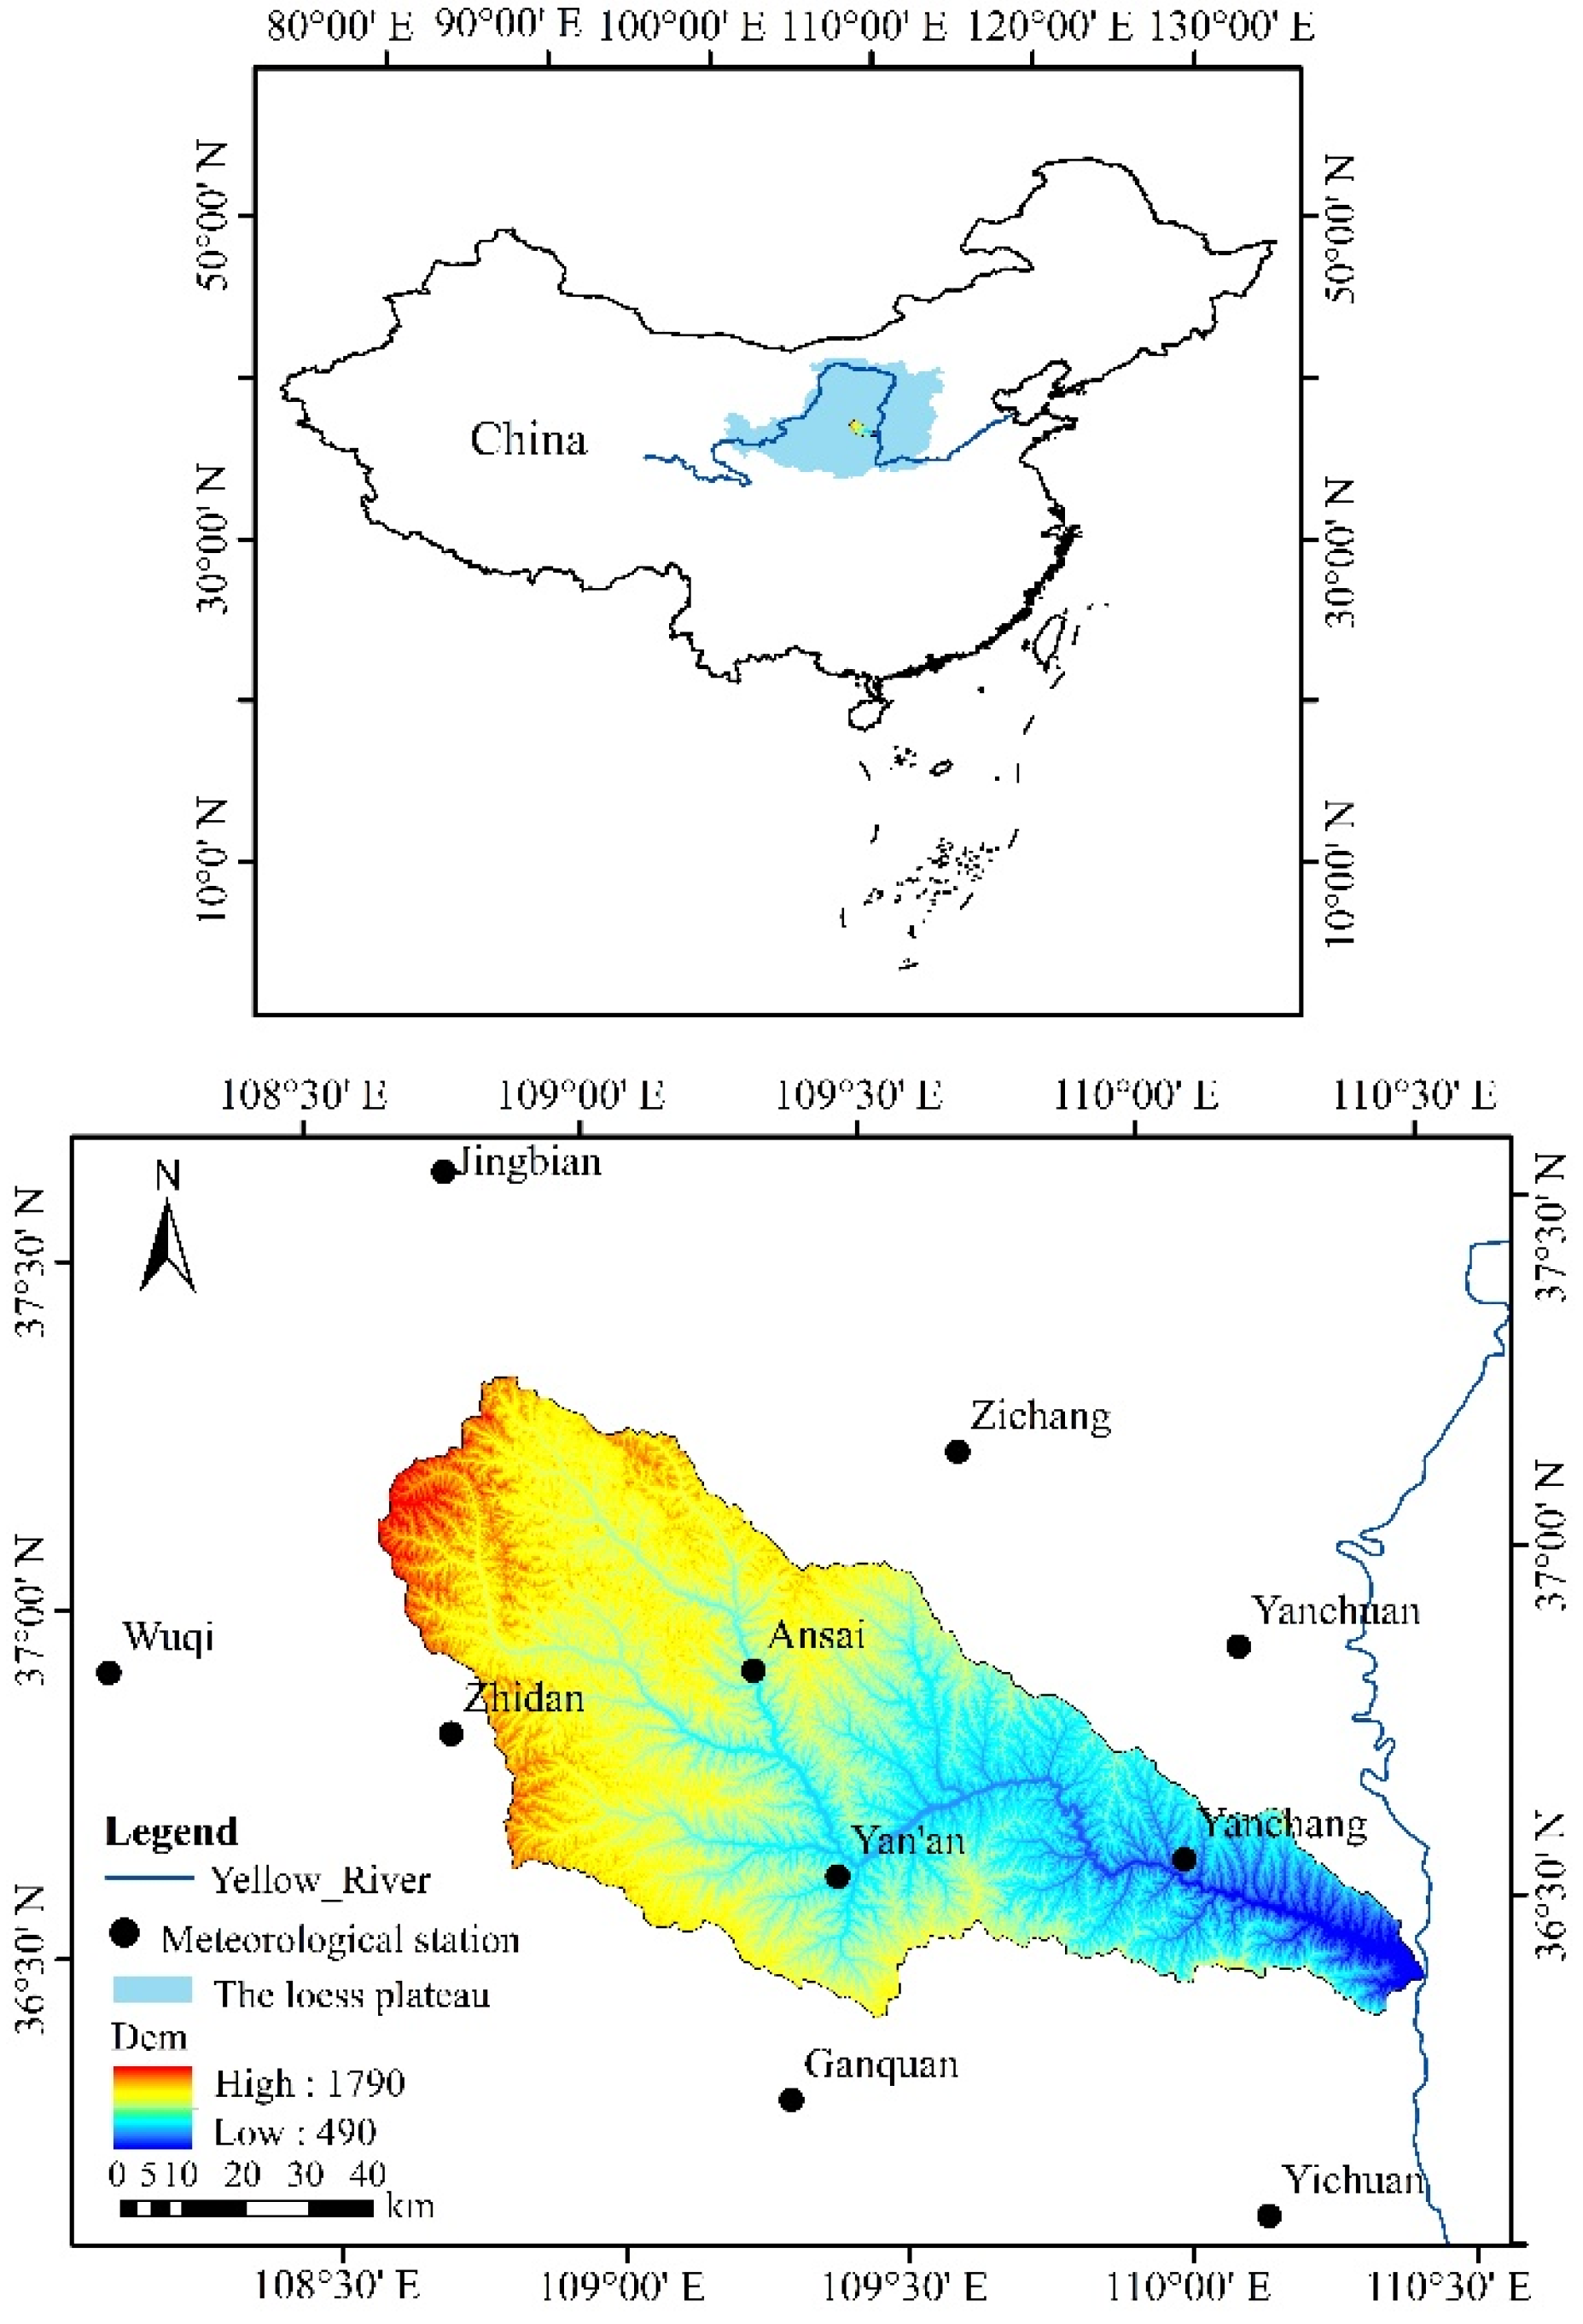
The YRB is a first-level tributary of the middle reaches of the Yellow River, extending 286.9 km over a total drainage area of 7725 km2. It originates from Zhoushan, Tianciwan Township, Jingbian County, and proceeds to flow through four primary counties and cities—Zhidan, Ansai, Baota, and Yanchang—and enters the Yellow River near the bank of Nanhegou Township in Yanchang County. The YRB maintains a continental monsoon climate, which is dry-windy in spring, warm-rainy in summer, cool-rainy in autumn, and cold-dry in the winter [23]. Average annual levels are: precipitation, about 520 mm; air temperature, 8.8–10.2 °C; evaporation 898–1678 mm; and sunshine duration, 2450 h [24].
2.2. Data
The meteorological data in the present study were acquired from China Meteorological Data Network (http://data.cma.cn/ (accessed on 20 June 2020)), and included the daily average, maximum, and minimum air temperatures (T, Tmax, and Tmin, respectively), wind speed at 10 m (U10), sunshine duration (n, in h), daily average relative humidity (RH), and the daily precipitation (P). The U10 was converted into wind speed of 2 m (U2) by . Data were collected across a time series from 1978–2017, derived from the specific control hydrological station of Ganguyi, and meteorological stations in Jingbian, Wuqi, Zhidan, Ansai, Yan’an, Zichang, Yanchuan, Yanchang, Ganquan and Yichuan (Figure 1).
2.3. ET0
The Penman-Monteith method, a commonly accepted standard in the literature, was used in the present research to calculate ET0 (Equation (1)) [25]:
where is potential evapotranspiration (mm); is the net radiation (MJ·mm−2·day−1); G is the soil heat flux (MJ·mm−2·day−1); γ is the psychrometric constant (kPa·°C−1); T is mean daily air temperature (°C); U2 is the wind speed at 2 m height(m·s−1); es and ea are saturation and actual vapor pressure (kPa), respectively; and ∆ is the slope of the vapor pressure curve (kPa·°C−1).
2.4. Calculation of Sensitivity Coefficient
The dimensionless sensitivity coefficient [26,27,28,29] was used to characterize the sensitivity of ET0 to climate change. This method analyzes the impact of a single climatic factor on ET0, while holding all others constant, and is calculated according to Equation (2):
where is change in the climate factor being assessed, and is the partial derivative of with respect to climate factor .
A positive (negative) sensitivity coefficient indicates that will increase (decrease) as the variable increases; and the absolute value of the sensitivity coefficient indicates the climatic factor’s degree of influence. An of −0.1, for example, indicates that a 10% increase (decrease) of factor will cause a 5% decrease (increase) in when the other meteorological variables are held constant. In the present study, the sensitivity coefficients of average air temperature, humidity, wind speed, and solar radiation were calculated and denoted as , , , , respectively. In this study, we regarded March to May as spring, June to August as summer, September to November as autumn and December to February as winter. Further, the monthly and annual values of the sensitivity coefficients were obtained by averaging the daily sensitivity coefficients.
2.5. Calculation of Contribution Rate
In the research here, the contribution rate of climatic factors to ET0 was indicated by multiplying by the relative change rate of factor i [7], and computed according to Equations (3) and (4).
where is the contribution rate of change of to (%), is the relative rate of change of climatic factor , is the number of years in the study period, is the linear trend rate of climatic factor , and is the average value of the climatic factor.
Similarly to Si, positive (negative) indicates the positive (negative) effect of climatic factor on the change of , and the greater its absolute value, the greater its contribution.
2.6. Analytical Method
The non-parametric Mann–Kendall statistical test [30,31] was used to detect the trends of the sensitivity coefficients, and resulting contribution rates of ET0 in the YRB from 1978 to 2017. The inverse distance weighting method was used to further interpolate the sensitivity coefficient and contribution rate [32].
3. Results
3.1. Temporal and Spatial Characteristics of ET0 and Meteorological Factors
The changes in multi-year average monthly and meteorological factors for the YRB are shown in Table 1. Averages from 1978–2017 were: air temperature, 9.59 °C (maximum observed from June to August); RH, 60.05% (maximum observed from August to October); wind speed at 2 m height, 1.16 m·s−1 (maximum observed from March to May); solar radiation, 5645.81 MJ·mm−2·day−1 (maximum observed from May to July); and precipitation, 495.19 mm (maximum observed from July to September). The results of the Mann–Kendall statistical test indicated that air temperature (p < 0.01), solar radiation, and precipitation showed an increasing trend with time, while RH and wind speed at 2 m height were decreasing. The average ET of YRB was 935.92 mm, peaking from May to July. Overall, showed an increasing trend (p < 0.1), while values for September–October were decreasing, although not at a statistically significant level.
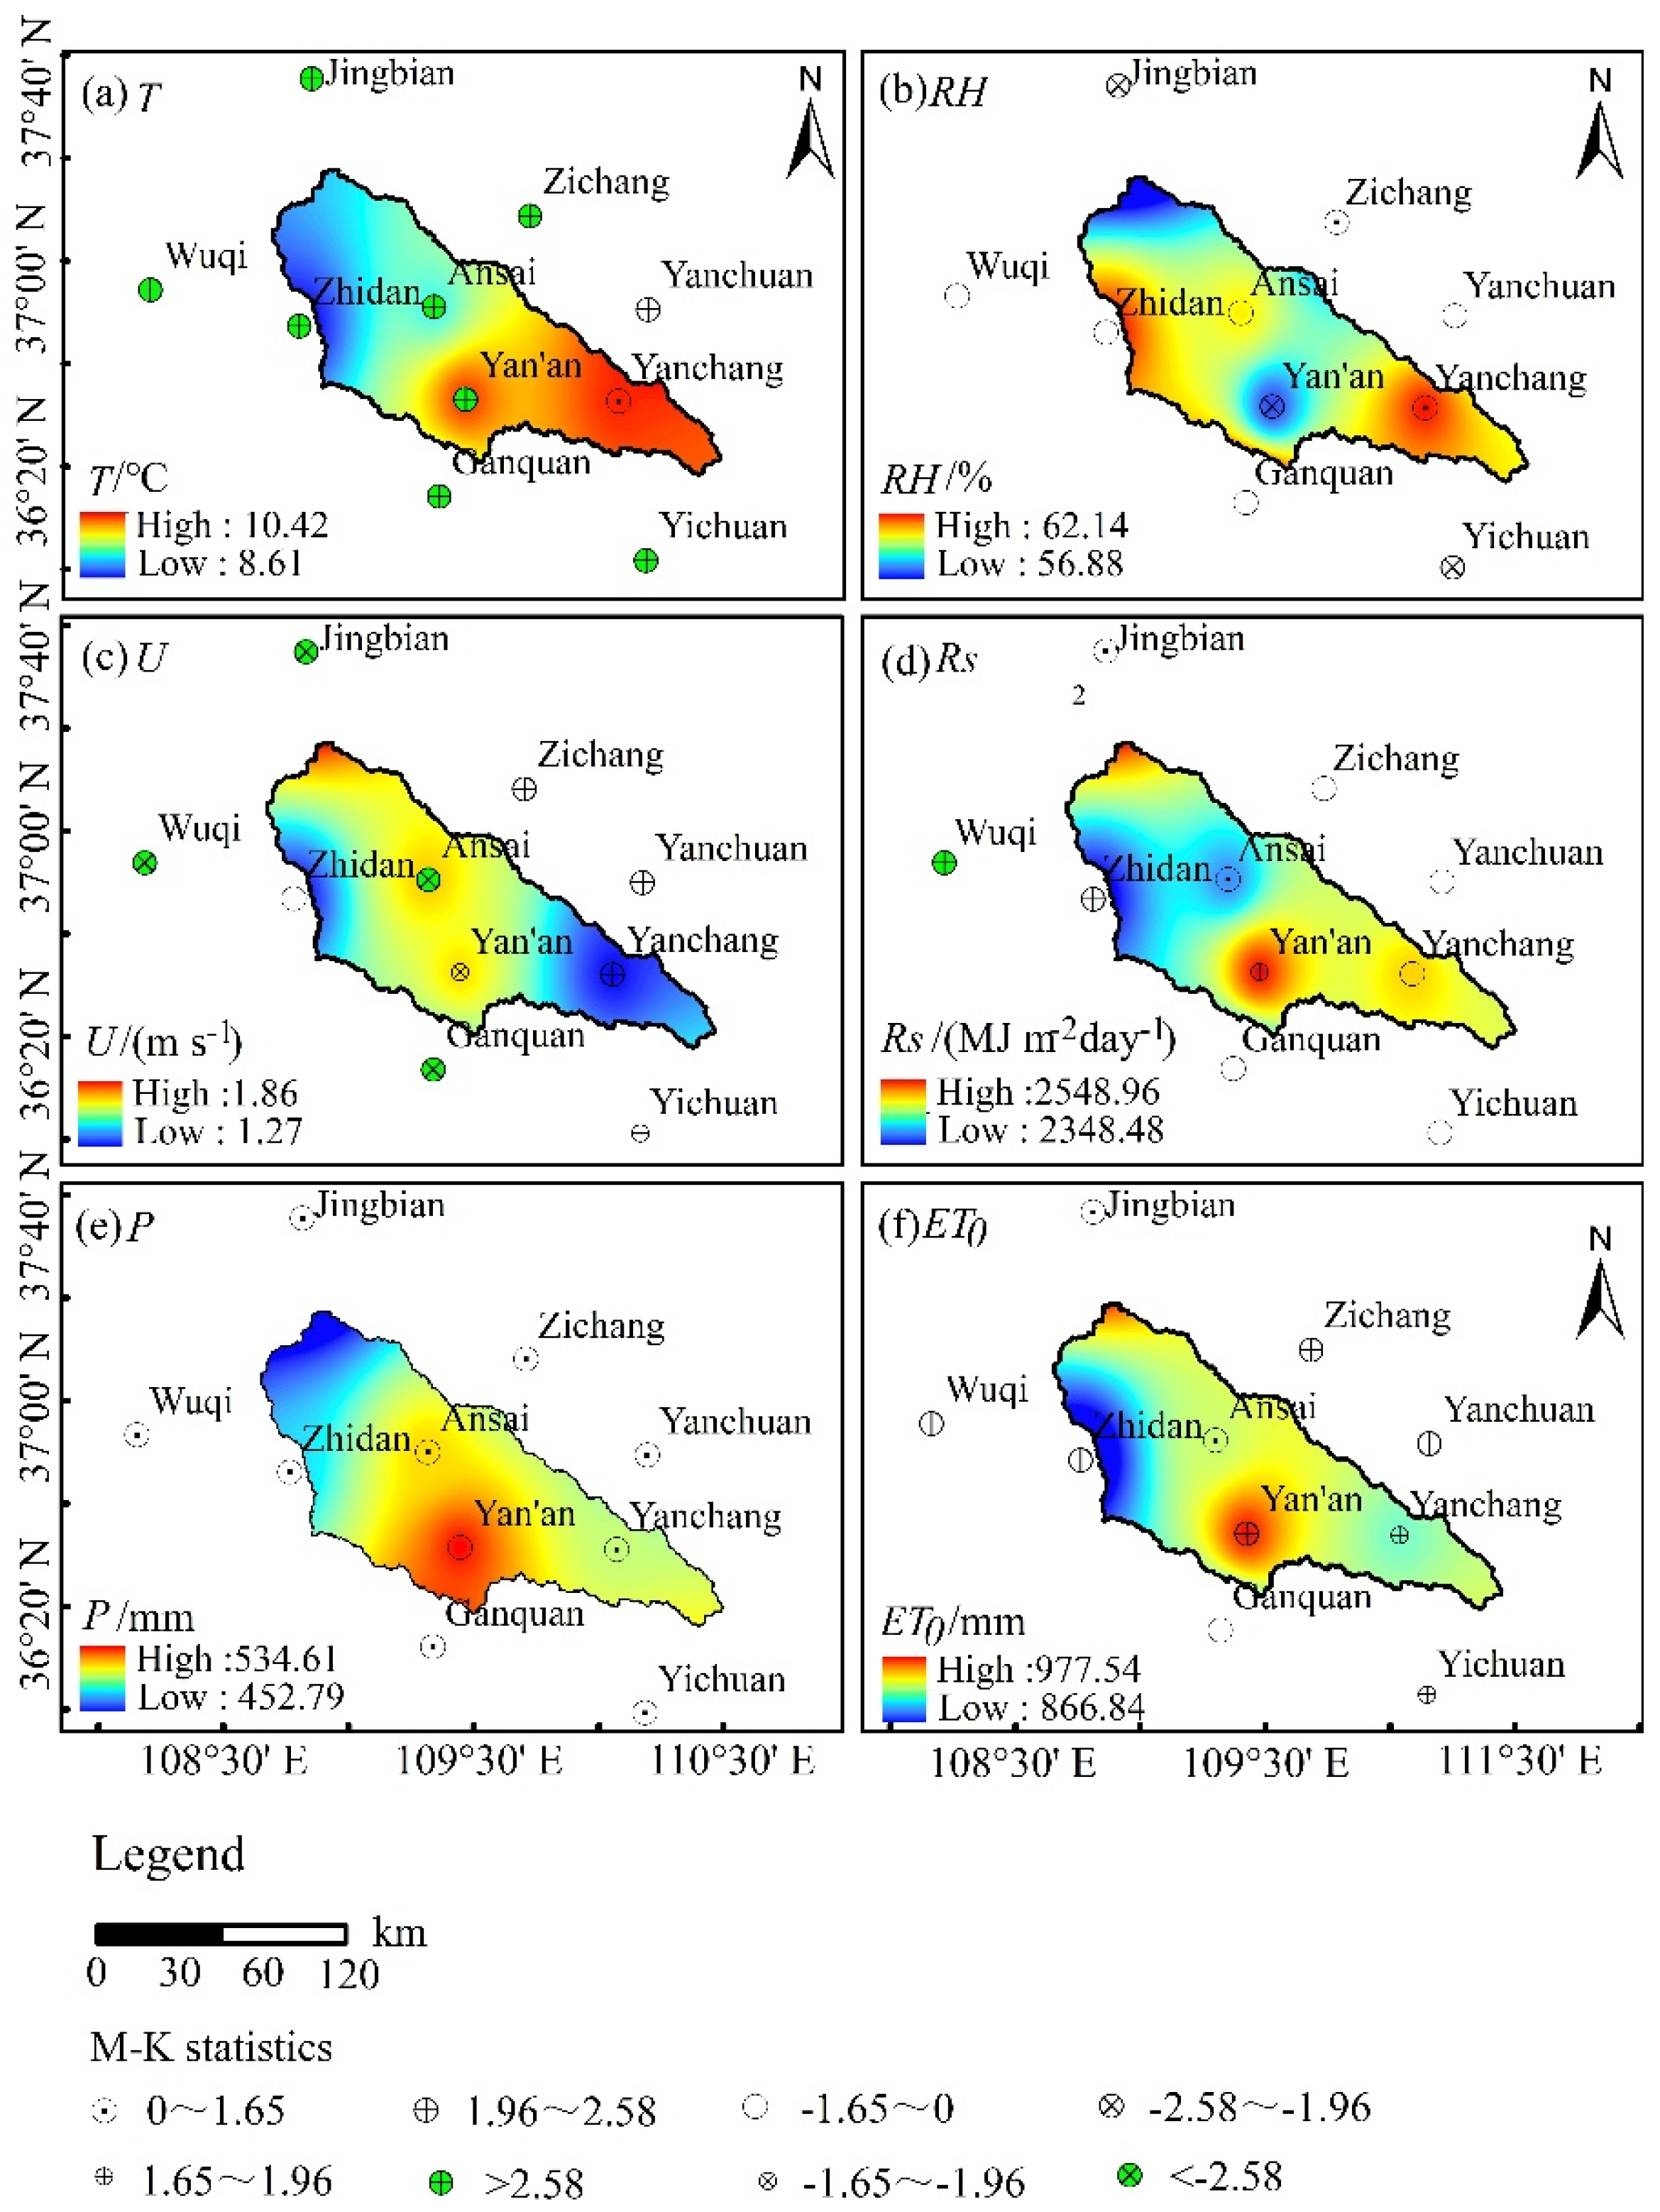
Average annual air temperature of YRB from 1978 to 2017 presented a geographical distribution pattern of southeastern highs and northwestern lows, both of which increased over time (Figure 2). RH displayed highs in the west and east, and lows in the north and south. Only the Zichang and Yanchang stations showed an insignificant rising trend in RH, indicating that the YRB underwent significant warming and drying. U2 reached lows in the east and west, highs to the north and south, with an overall downward trend save for the Zichang, Yanchang, Yanchuan, and Yichuan stations showing an increase. The incoming solar radiation in the southeast was less than that in the south, and displayed a decreasing trend; whereas the solar radiation at Yan’an and Jingbian stations were the highest in the basin, showing an upward trend. Precipitation in the YRB had a distribution pattern of south > southeast > northwest, peaking at Yan’an and Ganquan stations. Save for the sole location of Yan’an, precipitation in the basin showed an upward trend. was greatest in the south and least in the west. An upward trend was observed for all sites except Ganquan, where decreasing levels with increasing air temperature indicated the local existence of the “evaporation paradox” phenomenon. It can be seen that the intra-annual characteristics of meteorological factors and ET0 were variable, and spatial heterogeneity was significant throughout the study region.
3.2. Sensitivity of ET0 to Meteorological Factors
3.2.1. Temporal Characteristics
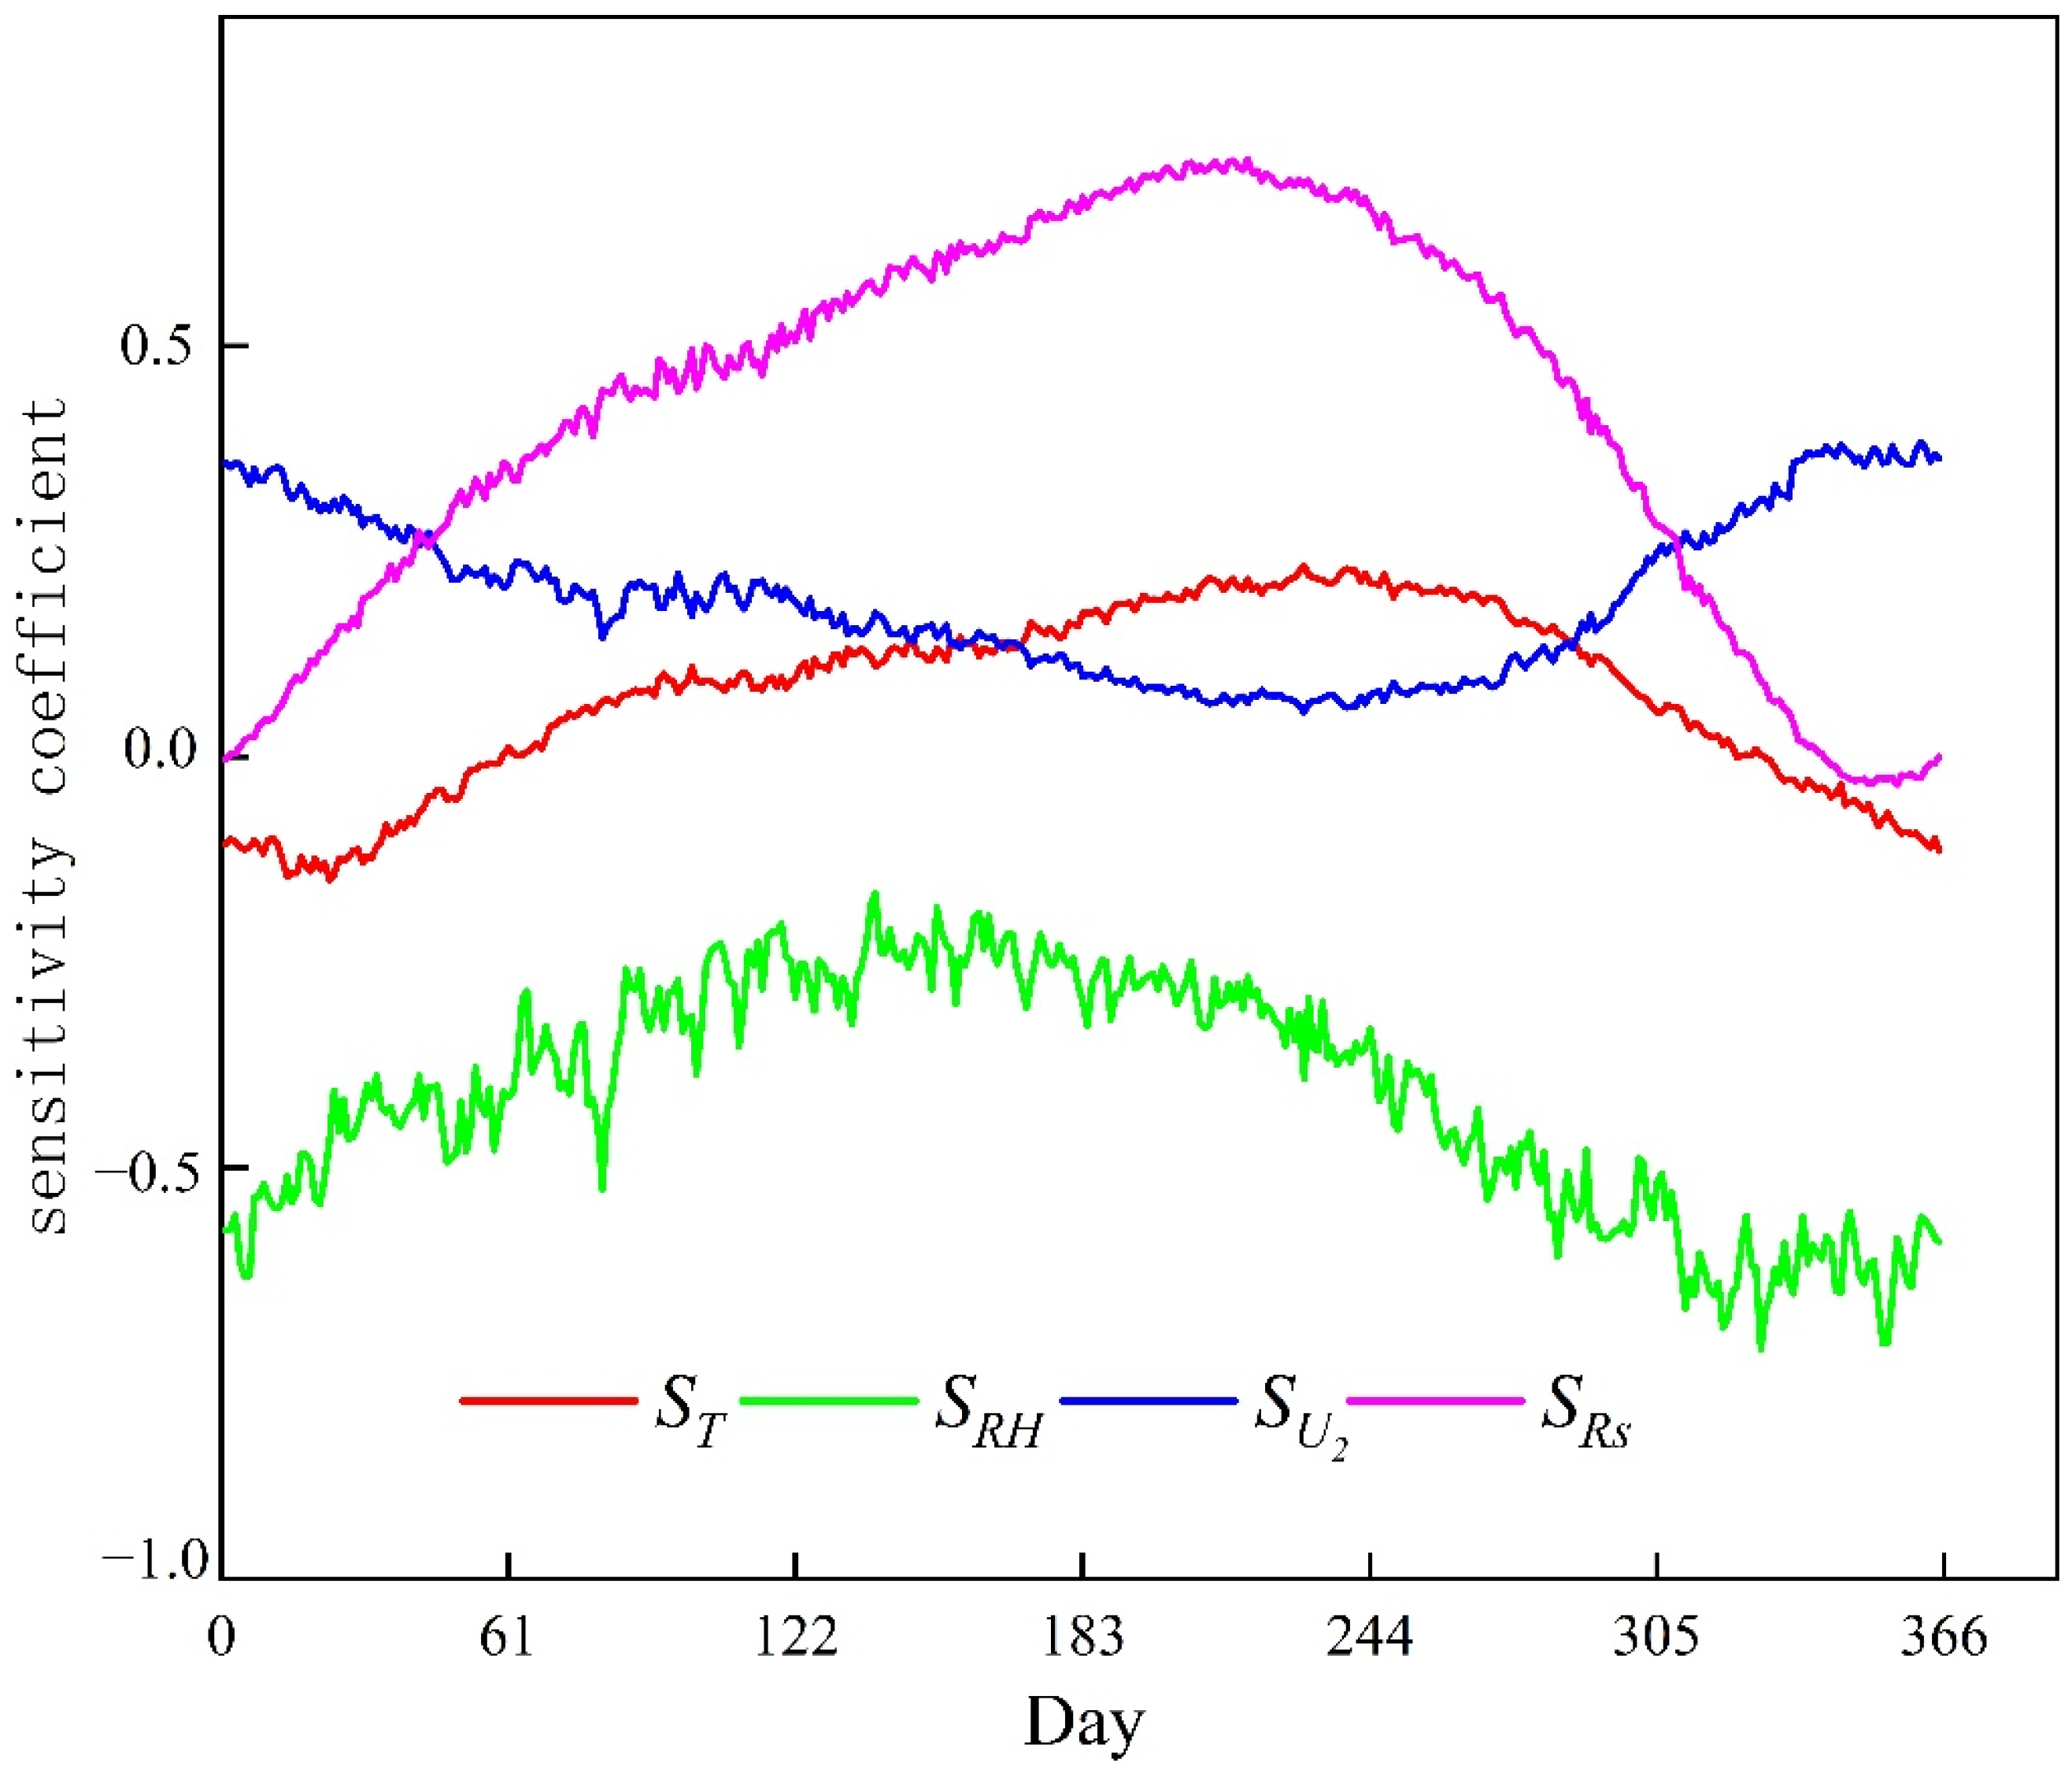
, , and showed an intra-annual, single peak pattern, indicating that ET0 was more sensitive to temperature conditions and sunshine duration in the summer over this scale. In addition, showed a unimodal distribution, displaying that ET0 was most sensitive to wind speed in the winter (Figure 3). On an interannual scale, , , and increased, whereas decreased. The absolute value of was the largest of the factors examined, indicating that ET0 was most sensitive to solar radiation, and increased by 4.2% for every 10% increase in solar radiation (while holding all other factors constant; Table 2). Examining each month across all years, was positive except for in the winter, was consistently negative, was positive throughout, and was positive except for December. From analyses of the absolute values for the sensitivity coefficients of ET0, it was revealed that spring–summer values were mainly affected by solar radiation, and autumn-winter values by RH. Examining the M-K statistics, the monthly sensitivity coefficients of ET0 in the YRB were variable: increased over the study period, but declined in the months from March–September (save for April); decreased annually, but increased within each year from March–June; increased overall, but decreased in the month of October; and mostly decreased annually, but increased each year in April and May. It was found that over the 40-year study period, the sensitivity of ET0 to air temperature and wind speed had increased, while sensitivity to solar radiation and RH decreased. The sensitivity of ET0 to the climatic factors examined varied by month throughout the year, and within each month of the year as well.
3.2.2. Spatial Characteristics
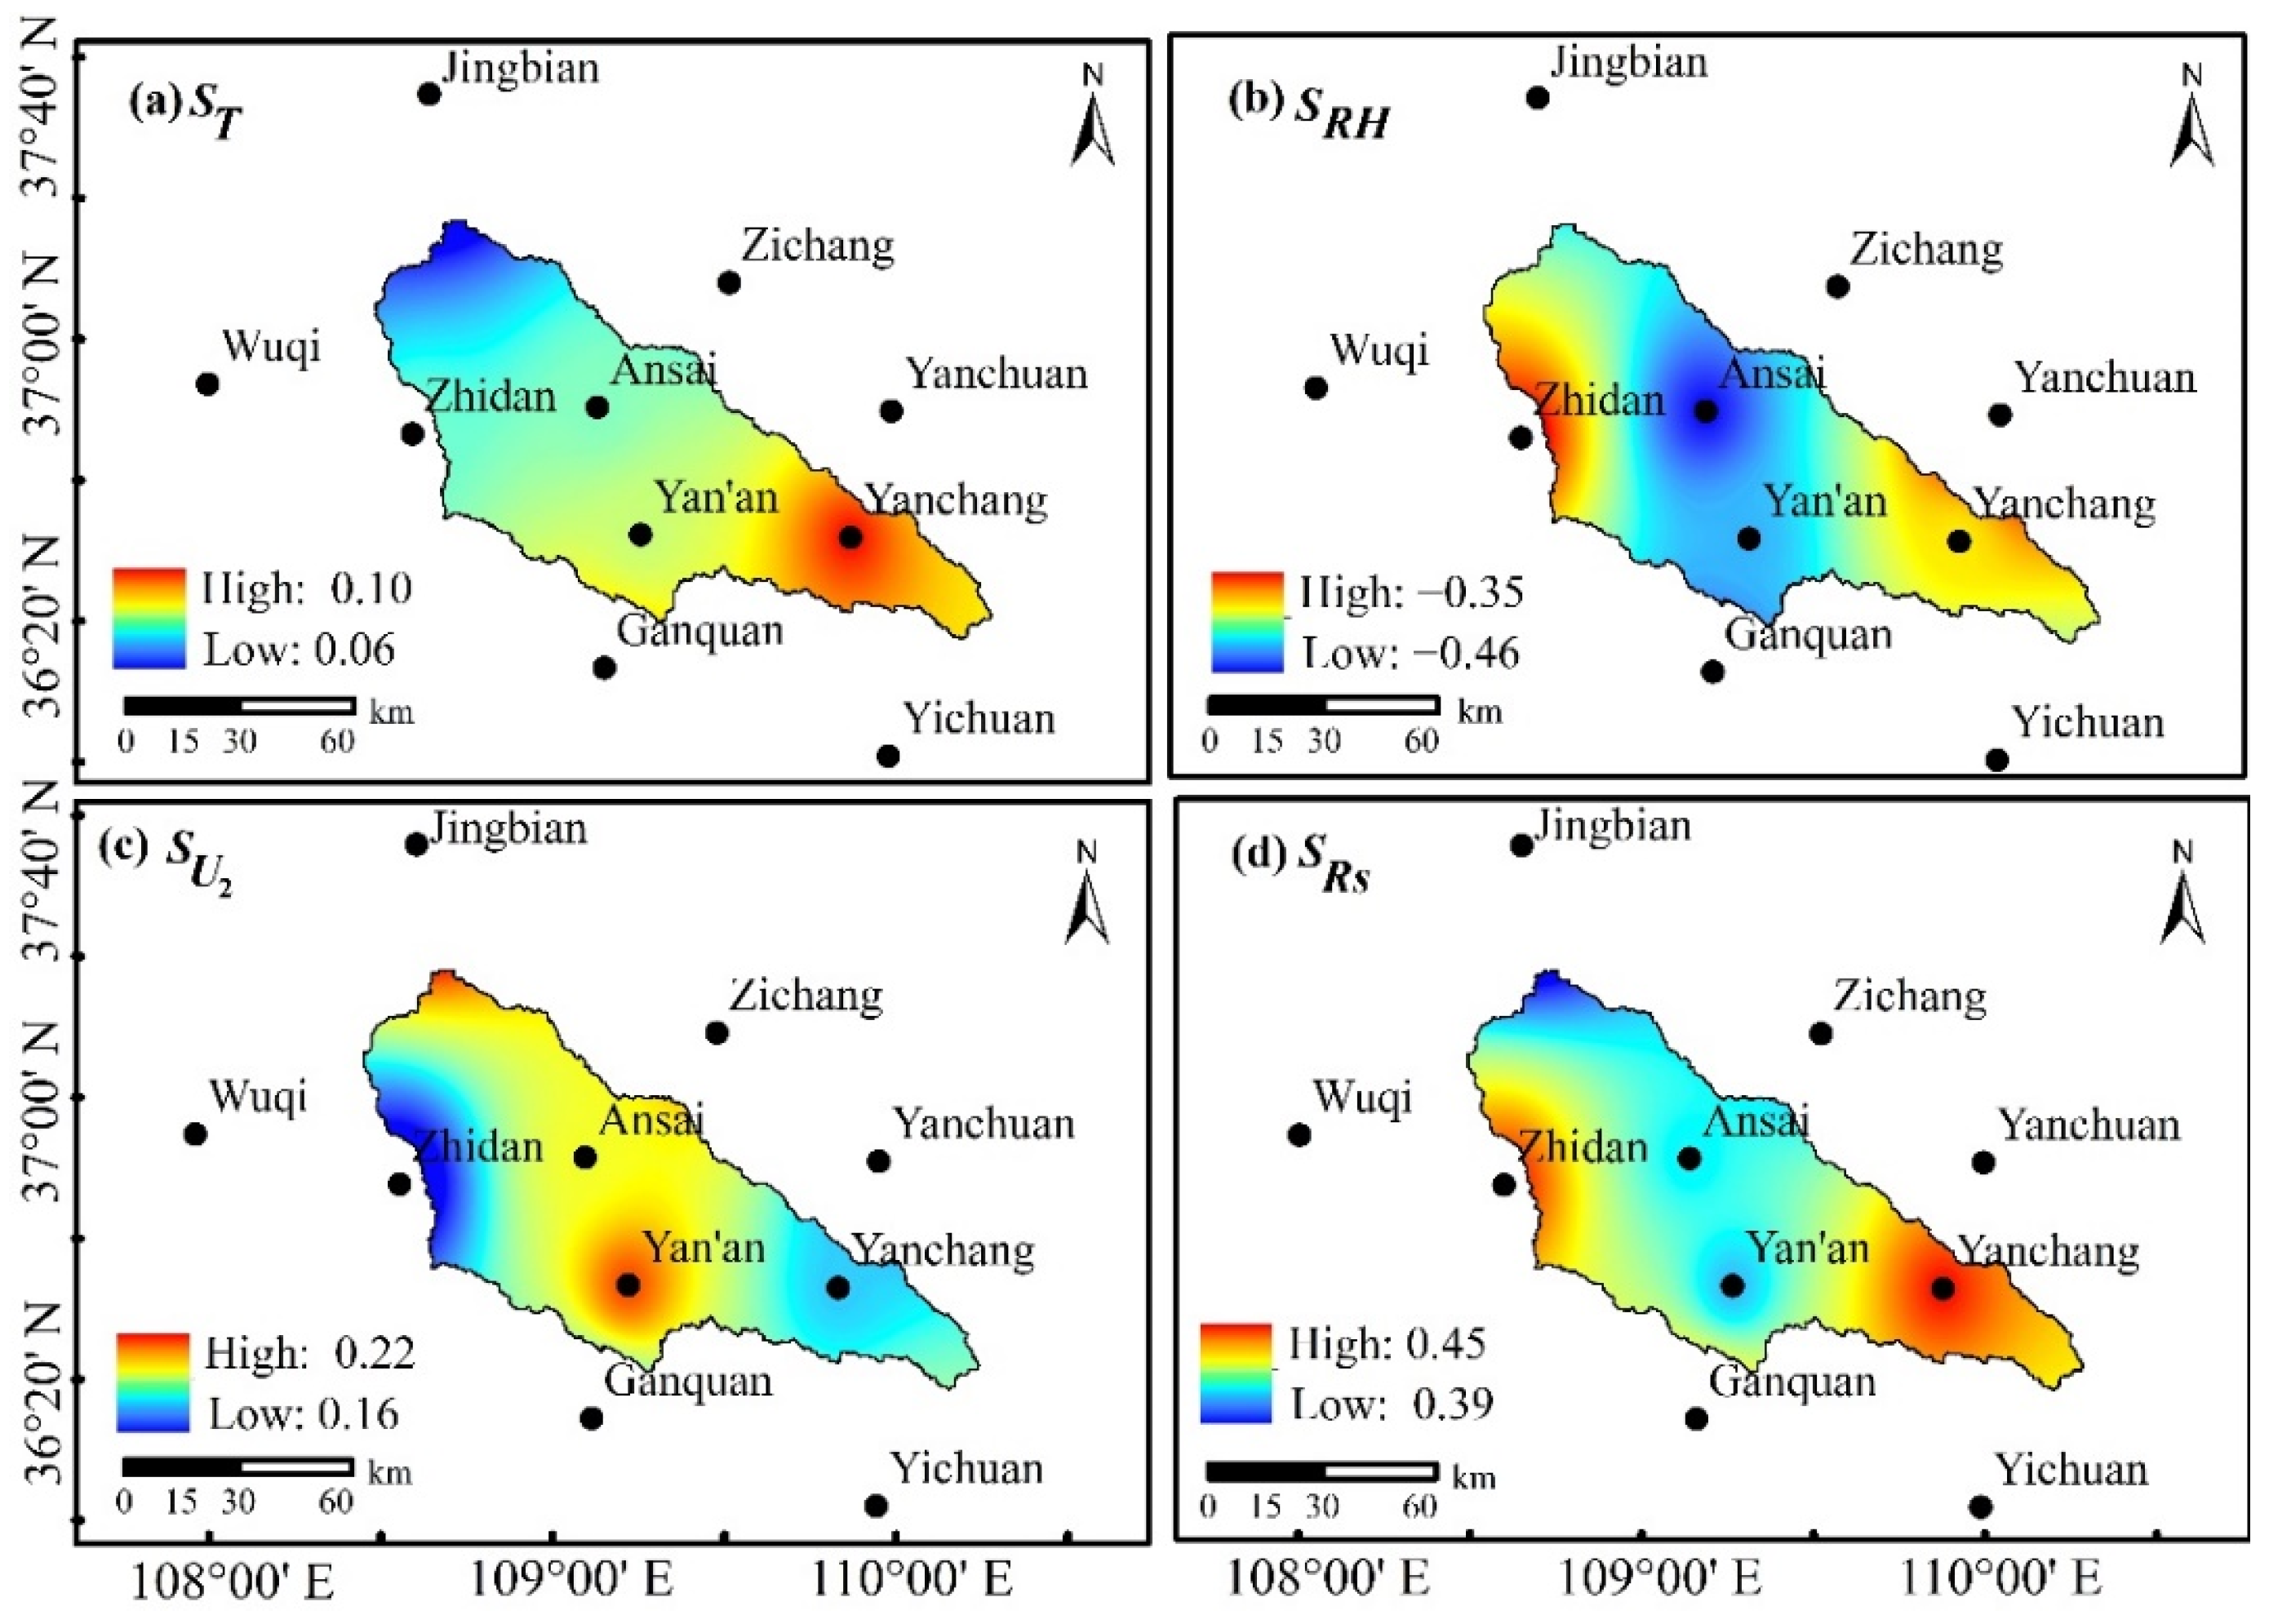
, , and at each site in the YRB were positive values, whereas was the sole factor with a negative value. The absolute values of at the Jingbian, Zichang, Ansai, Yan’an, Ganquan, and Yichuan stations were the largest of all factors, indicating the importance of RH when determining ET0. The absolute values of at the Wuqi, Zhidan, Yanchuan, and Yanchang stations were larger than elsewhere, confirming the importance of solar radiation on ET0. tended to increase across all stations, save for Yan’an, Yanchang, and Yichuan; whereas tended to decrease save for Jingbian, Wuqi, Yan’an, and Ganquan stations. Except for Wuqi station, sensitivity of was increasing. was increased only at Ansai, Ganquan, and Wuqi stations, while decreasing at all other sites (Table 3). Therefore, the ET0 of the YRB was most sensitive to RH and solar radiation, but this influence appears to be weakening. Contrarily, the sensitivity of ET0 to air temperature and wind speed was small, but sensitivity is increasing.
The geographic distribution of ET0 sensitivity to climatic factors was derived by spatial interpolation of the sensitivity coefficients for each station (Figure 4): gradually decreased from SE to NW of the basin, peaking in the Yanchang area; increased from the central to SE and SW of the basin, reaching its maximum in Zhidan and Yanchuan, respectively; was roughly opposite of , with a minimum in the Zhidan area; the distribution pattern of was similar to that of , reaching maximums in Zhidan, Ganquan, and Yanchang. Thus, the sensitivity of ET0 to each climate factor analyzed varied significantly by geographic location.
3.3. Contribution Rate of Meteorological Factors
On an annual scale, when the T increased by 14.35%, ET0 increased by 1.09%. Since SRH was negative, an increase in RH by 2.09% led to a decrease in ET0 by 0.85%. If U2 decreased by 3.24%, ET0 decreased by 0.63%; and when solar radiation increased by 1.32%, ET0 increased by 0.55%. Overall, air temperature was the dominant meteorological factor contributing to ET0 of the YRB from 1978–2017. From an intra-annual perspective, the increase in air temperature in January and February led to an increase in ET0. The increases of ET0 in March, July, and August were most strongly correlated with the decrease in RH. The observed increase in ET0 in April and May was primarily caused by the decrease in U2. The most significant driver of ET0 in June was solar radiation, and the observed increase in ET0 caused by U2 nearly offset the decrease driven by lowered RH. In September and October, the most significant factor determining lowered ET0 was the decline in solar radiation. T was the dominant controlling factor of ET0 in November. In November, although ET0 had the greatest level of sensitivity to RH, its contribution rate was only 0.03%, permitting the inference that the decreasing trend of RH was not the primary cause of the observed decrease in ET0. The most significant contribution to ET0 in December was U2. In December, although ET0 was sensitive to RH, its decline did not lead to a decrease of ET0 (Table 4).
Across the entire study region, a relatively equal change of a single climatic factor had significantly variable contributions to ET0. For example, an increase of RH by 0.74%, lead to a decrease in ET0 at the Zichang station by 0.34%, and a decrease at the Yanchang station of 0.24% (Table 5). Through comparison, it was found that the dominant meteorological factor at Jingbian, Zichang, Ansai, Ganquan, Yanchang, and Yanchuan stations was U2. Solar radiation contributed the most to ET0 at Wuqi station, and RH was the controlling factor at Zhidan, Yan’an, and Yichuan stations. Air temperature contributed positively to the increase of ET0 across the entire basin, whereas the effects of RH, U2, and solar radiation on ET0 displayed significant spatial variability. For example, the contribution rate of RH to the recorded ET0 values of Zichang and Yanchang stations was negative, but all other stations recorded positive rates (Table 5). Because ET0 of Zichang and Yanchang stations had a negative sensitivity coefficient to RH, the observed increase in RH had a negative effect on ET0. Conversely, other sites had a positive effect on ET0 due to the decreasing levels of RH.
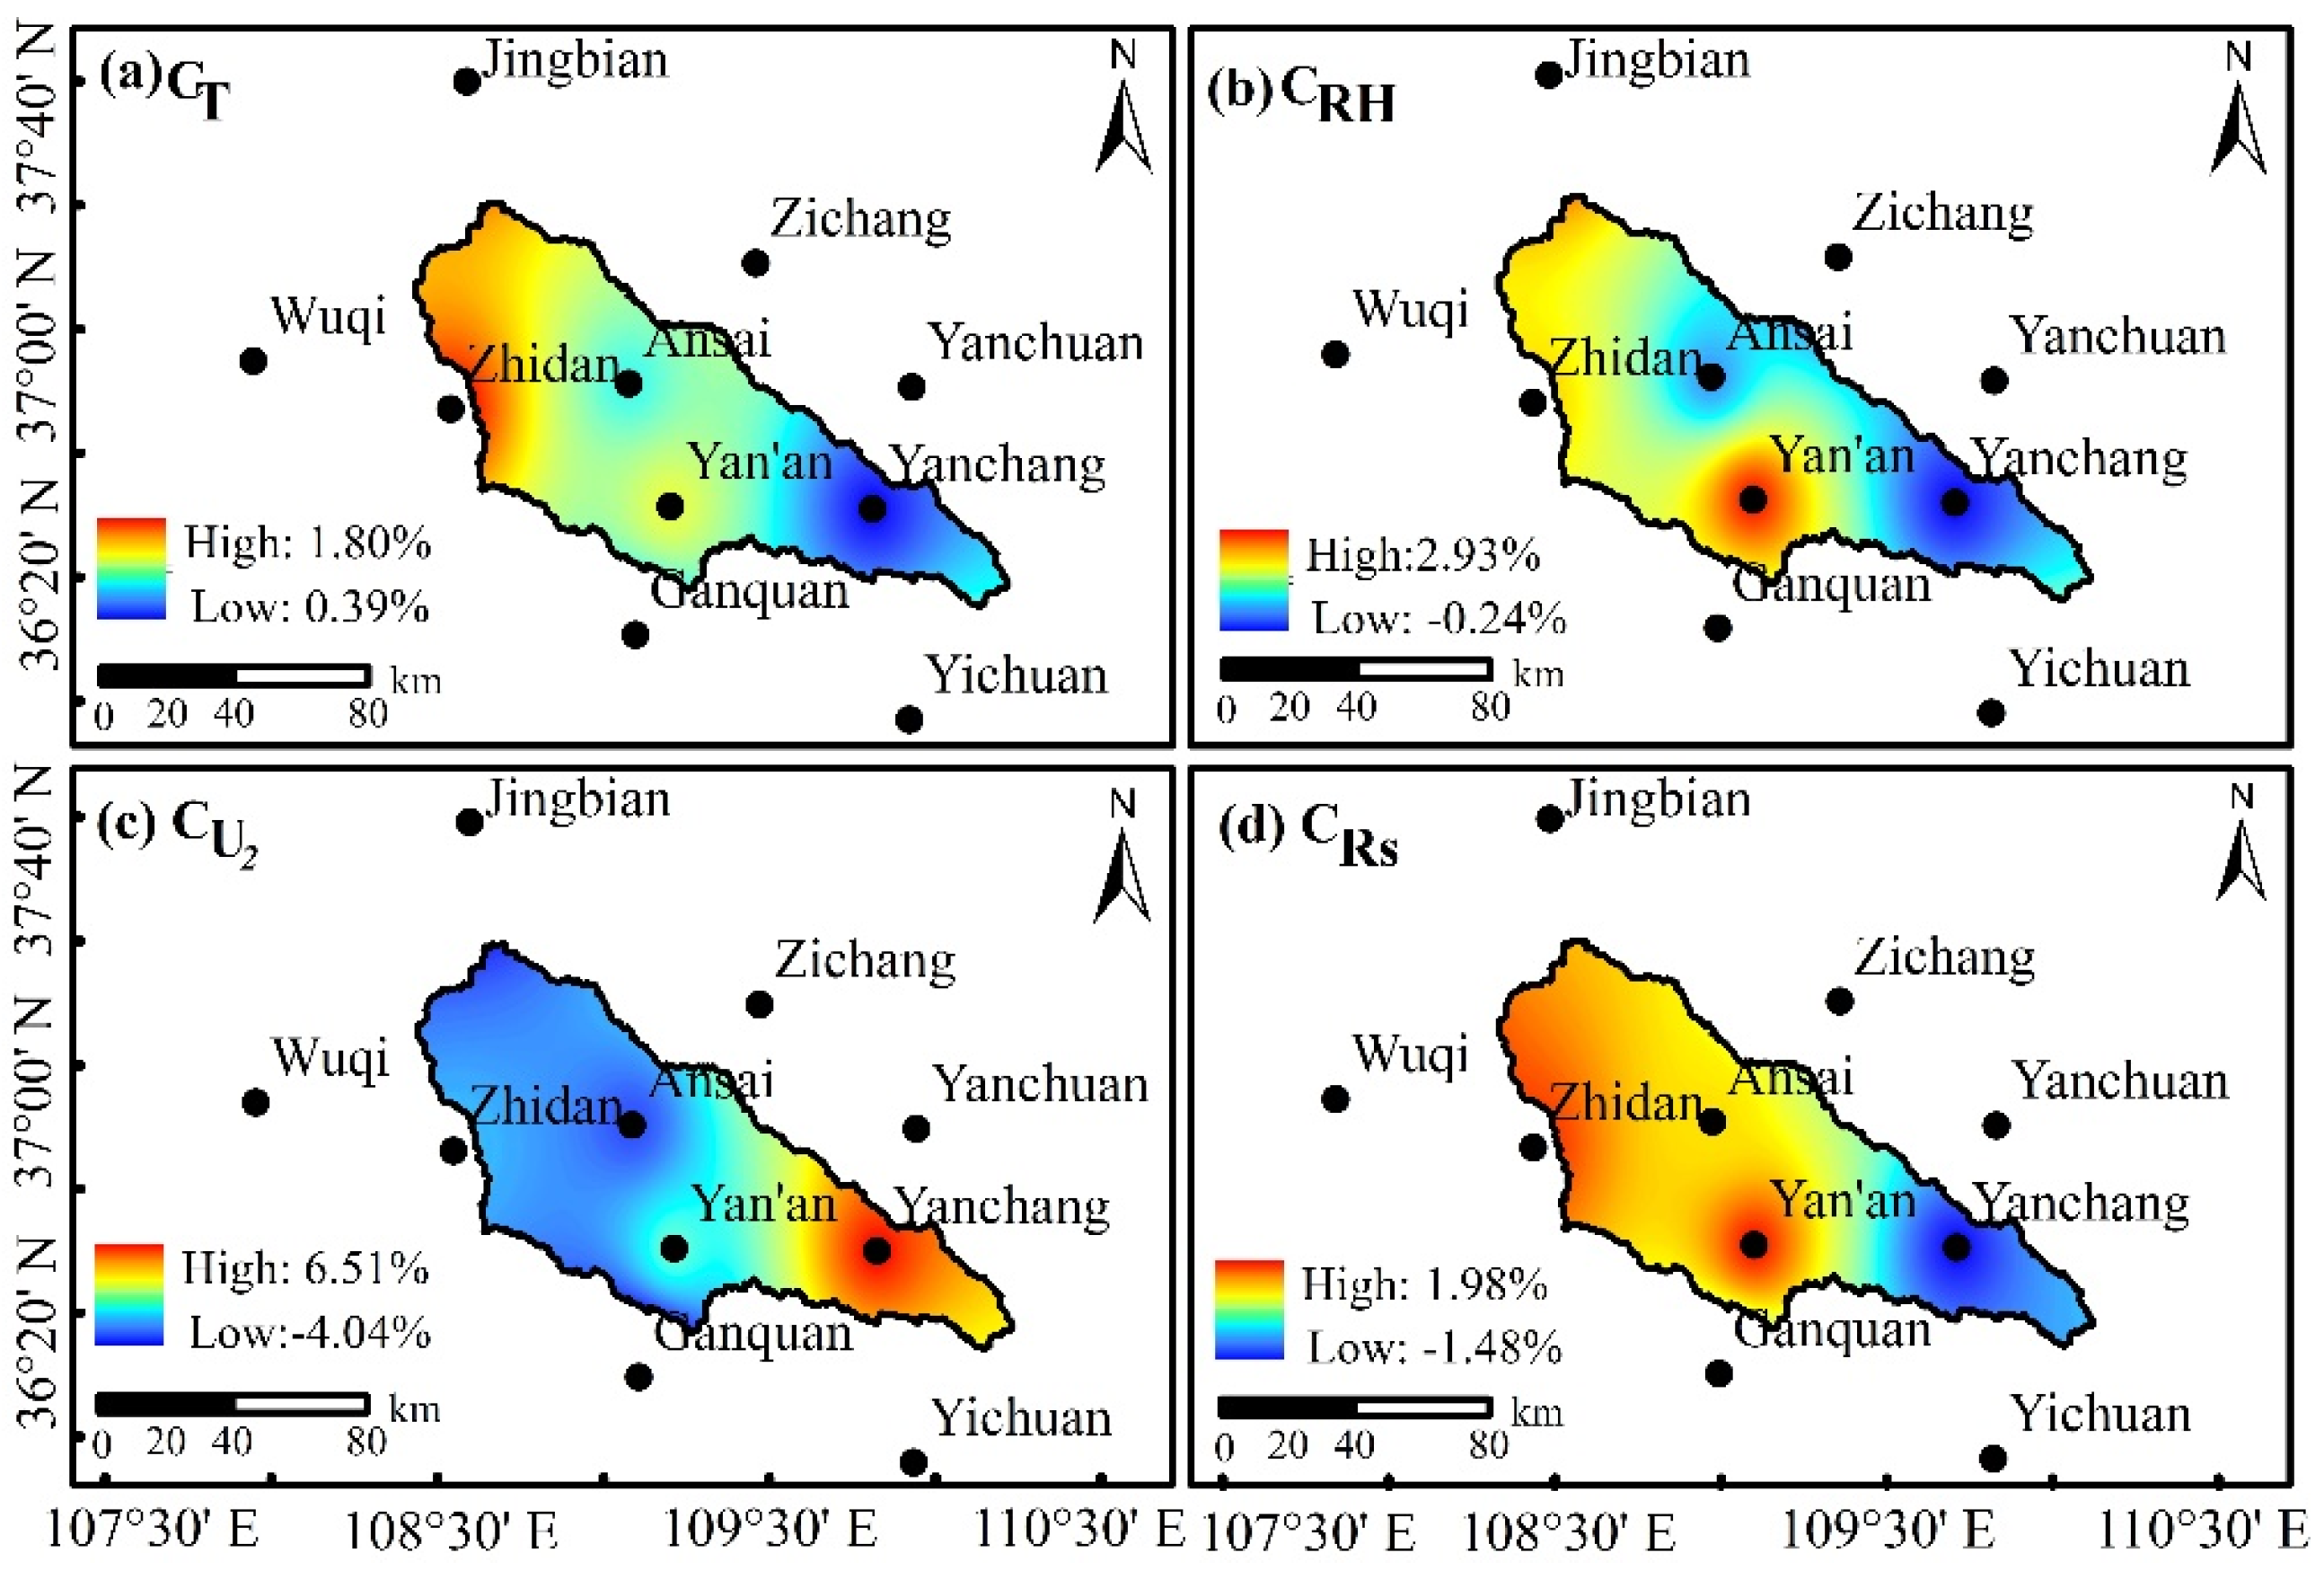
Thus, the geographic zonality each meteorological factor’s contribution to ET0 was significant. The influence of T and solar radiation on ET0 gradually decreased from NW to SE of the basin, whereas U2 displayed precisely the opposite pattern. The contribution of RH to ET0 decreased radially from Zhidan to the surrounding areas (Figure 5). By combining Figure 2 and Figure 5, it can be ascertained that the high ET in the Yan’an area was primarily driven by RH and solar radiation, whereas the low ET observed in the Zhidan area was mainly affected by U2. Because the sensitivity coefficient of ET0 to RH in Ganquan was negative, the recorded decrease in RH had a positive effect on ET0. Similarly, the sensitivity coefficient of ET0 to U2 and solar radiation was positive, so the recorded decrease in U2 and solar radiation contributed to the observed decrease in ET0. Therefore, the main factors behind the “evaporation paradox” phenomenon observed in Ganquan were decreasing values of U2 and solar radiation.
4. Discussion
Previous studies have found that a combination of the changing meteorological factors, sensitivity coefficients, and contribution rates can more accurately analyze the drivers of ET0 [21,22].
4.1. Dominant Factors of ET0 Variation in the YRB
The calculated absolute values (i.e., strengths) for the sensitivity coefficients of the climatic factors analyzed on ET0 were Rs > RH > U2 > T; however, sensitivities varied significantly by month. For example, the sensitivity coefficient of ET0 to solar radiation in December was −0.01, but reached 0.7 in July and August from1978 to 2017. Additionally, the sensitivity coefficient of T in the winter (December, January, February) was negative, but positive throughout the remainder of the year. Combined with the results of trend analysis of meteorological factors, it was found that T still maintained a positive correlation with ET0, since T in the winter months was low as well.
The absolute values of the contribution rates for each meteorological factor to ET0 were T > RH > U2 > solar radiation; and furthermore, these rates for each individual factor varied significantly by month. For example, the contribution rates of T to ET0 for January, February, and December were 1.95%, 6.68%, and 1.46%, respectively; but these rates in June, July, and August were 0.64%, 1.16%, and 0.96%, thus indicating that the contribution of T to the increase of ET0 was higher in winter months than in summer. Furthermore, although the sensitivity coefficient of ET0 to T was small, its contribution was large as the significantly increasing trends of air temperature (p < 0.01) led to an increase of ET0. These findings are similar to the results of a study on ET0 climate sensitivity coefficients in the Yellow River Basin [15]. In the YRB, although the sensitivity coefficient of ET0 to solar radiation was the greatest, its overall contribution to ET0 was low due to its relatively stable rate over time.
Combined with precomplaint sensitivity analysis and contribution rate analysis in the present study, it can be seen that only by combining the sensitivity coefficients of changing meteorological factors to ET0, can we ascertain their true contribution rates for a more comprehensive understanding of the causes of changes in ET0.
In the present study, the multi-year average air temperature of the YRB showed an increasing trend, with a positive sensitivity coefficient, and a contribution rate of 1.09%. RH has displayed a decreasing trend with time, a sensitivity coefficient of −0.41, and contribution rate of −0.85%. It can be seen, however, that the decreasing trend of RH did not cause the increase in ET0 in the YRB. U2 also displayed a decreasing trend with time, a positive sensitivity coefficient of ET0, and a contribution rate of −0.63%. Solar radiation showed an increasing trend with time, a positive sensitivity coefficient, and contribution rate of 0.55%. Thus, it can be concluded that the negative contribution rates of meteorological factors ET0 were less than the positive. Accordingly, ET0 in the YRB has shown an increasing trend from 1978–2017 mostly related to T, U2, and solar radiation, whereas observed decreases in ET0 were primarily driven by RH.
4.2. Evaporation Paradox in the YRB
Another pertinent point was that although the ET0 of the YRB showed an overall increasing trend, ET0 at the Ganquan Station decreased, indicating a sole, local existence of the “evaporation paradox”. The absolute value of the sensitivity coefficients for the meteorological factors in the Ganquan area were RH > solar radiation > U2 > T; and the absolute values of their contribution rates were U2 > RH > solar radiation > T. In the Ganquan area, the increasing trend of air temperature was significant, but its corresponding contribution rate was relatively low. Solar radiation decreased with time, and its corresponding contribution rate to ET0 was −0.74%, nearly offsetting the positive contribution rate of air temperature. The sensitivity coefficient for RH was −0.46, with a contribution rate of 1.37%, indicating that the downward trend of RH had a positive effect on ET0. Lastly, the sensitivity coefficient for U2 was only 0.17, but its significant downward trend resulted in a contribution rate of −9.16%, making it the dominant factor driving the observed decreasing trend in ET0. This is similar to results found by Roderick & Farquhar [8], Dinpashoh et al. [12], Burn & Hesch [10], and Luo et al. [18].
5. Conclusions
In this paper, the effects of air temperature (T), relative humidity (RH), wind speed at 2 m (U2), and solar radiation on the potential evapotranspiration (ET0) in the Yanhe River Basin (YRB), China were quantitatively estimated using sensitivity coefficients and contribution rates, combined with the changing trend of meteorological factors observed from 1978–2017. The main conclusions of this study can be summarized as follows:
The absolute value of the sensitivity coefficients of ET0 to meteorological factors in the YRB was solar radiation > RH > U2 > T, although sensitivities displayed significant temporal (intra- and interannual) and spatial differences. The absolute values of the contribution rates for each meteorological factor were T > RH > U2 > solar radiation. Similarly, the contribution rates for the same climatic factors displayed significant spatiotemporal heterogeneity.
The observed increase of ET0 in the YRB was related to T, U2, and solar radiation; whereas decreases in ET0 were mostly related to RH. The most dominant factor controlling ET0 across the entire YRB was T, but this displayed significant spatiotemporal differences at local scales. The “evaporation paradox” phenomenon observed in the Ganquan area was driven primarily by wind speed.
It can be seen from this study only by combining the sensitivity coefficients of changing meteorological factors to ET0, with their respective contribution rates, we can systematically and quantitatively analyze the driving mechanisms of observed changes in ET0.
Author Contributions
Data curation and writing—original draft preparation, Y.L.; writing—review and editing, and supervision, funding acquisition, P.G. and X.M. Conceptualization, Y.L., P.G. and X.M.; methodology, Y.L., P.G. and X.M.; formal analysis, P.G. and X.M.; resources, Y.L. and P.G.; data curation, Y.L. and P.G.; writing—original draft preparation, Y.L.; writing—review and editing, Y.L., P.G. and X.M.; visualization, Y.L.; supervision, Y.L., P.G. and X.M.; project administration, P.G. and X.M.; funding acquisition, P.G. All authors have read and agreed to the published version of the manuscript.
Funding
This work was founded by the National Key Research and Development Program of China, Grant/Award Number: 2016YFC0501707.
Institutional Review Board Statement
Not applicable.
Informed Consent Statement
Not applicable.
Data Availability Statement
The daily series of meteorological data used in this study are avaliable on National Meteorological Science Centre of China (http://data.cma.cn// (accessed on 28 April 2021)).
Acknowledgments
The authors acknowledge contributions from all members of the project team.
Conflicts of Interest
The authors declare no conflict of interest.
References
- IPCC. Summary for Policymakers. In Global Warming of 1.5 C. An IPCC Special Report on the Impacts of Global Warming of 1.5 C Above Pre-Industrial Levels and Related Global Greenhouse Gas Emission Pathways, in the Context of Strengthening the Global Response to the Threat of Climate Change, Sustainable Development, and Efforts to Eradicate Poverty; Masson-Delmotte, V.P., Zhai, H.-O., Pörtner, D., Roberts, J., Skea, P.R., Shukla, A., Pirani, W., Moufouma-Okia, C., Péan, R., Pidcock, S., Eds.; IPCC: Geneva, Switzerland, 2008; in press. [Google Scholar]
- Zhou, J. Spatial and Temporal Variation of Droughts Over China Based on Various Potential Evapotranspiration Formulas; Nanjing University of Information Science and Technology: Nanjing, China, 2019. [Google Scholar]
- Food and Agriculture Organization of the United Nations. Crop Evapotranspiration: Guidelines for Computing Crop Requirements; Food & Agriculture Organization: Rome, Italy, 1998. [Google Scholar]
- Li, X.C. Spatio-Temporal Variation of Actual Evapotranspiration in the Pearl, Haihe and Tarim Basins of China; Nanjing University of Information Science and Technology: Nanjing, China, 2013. [Google Scholar]
- Onyutha, C. Statistical analyses of potential evapotranspiration changes over the period 1930–2012 in the Nile River riparian countries. Agric. For. Meteorol. 2016, 226-227, 80–95. [Google Scholar] [CrossRef]
- Cohen, S.; Ianetz, A.; Stanhill, G. Evaporative climate changes at Bet Dagan, Israel, 1964–1998. Agric. For. Meteorol. 2002, 111, 83–91. [Google Scholar] [CrossRef]
- Yin, Y.; Wu, S.; Chen, G.; Dai, E. Attribution analyses of potential evapotranspiration changes in China since the 1960s. Theor. Appl. Clim. 2010, 101, 19–28. [Google Scholar] [CrossRef]
- Roderick, M.L.; Farquhar, G.D. The cause of decreased pan evaporation over the past 50 years. Science 2002, 298, 1410–1411. [Google Scholar]
- Roderick, M.L.; Farquhar, G.D. Changes in Australian pan evaporation from 1970 to 2002. Int. J. Clim. 2004, 24, 1077–1090. [Google Scholar] [CrossRef]
- Burn, H.D.; Hesch, M.N. Trends in evaporation for the Canadian Prairies. J. Hydrol. 2007, 336, 61–73. [Google Scholar] [CrossRef]
- Fu, G.; Charles, S.P.; Yu, J. A critical overview of pan evaporation trends over the last 50 years. Clim. Chang. 2009, 97, 193–214. [Google Scholar] [CrossRef]
- Dinpashoh, Y.; Jhajharia, D.; Fakheri-Fard, A.; Singh, V.P.; Kahya, E. Trends in reference crop evapotranspiration over Iran. J. Hydrol. 2011, 399, 422–433. [Google Scholar] [CrossRef]
- Chattopadhyay, N.; Hulme, M. Evaporation and potential evapotranspiration in India under conditions of recent and future climate change. Agric. For. Meteorol. 1997, 87, 55–73. [Google Scholar] [CrossRef]
- Liu, C.M.; Zhang, D.; Liu, X.M.; Zhao, C.S. Spatial and temporal change in the potential evapotranspiration sensi-tivity to meteorological factors in China (1960–2007). J. Geogr. Sci. 2012, 22. [Google Scholar] [CrossRef]
- Liu, Q.; Yang, Z.F.; Cui, B.S.; Sun, T. The temporal trends of reference evapotranspiration and its sensitivity to key meteoro-logical variables in the Yellow River Basin, China. Hydrol. Process. 2010, 24, 2171–2181. [Google Scholar]
- Gong, L.B.; Xu, C.Y.; Chen, D.L.; Halldin, S.; Chen, Y.Q. Sensitivity of the Penman-Monteith reference evapotranspi-ration to key climatic variables in the Changjiang (Yangtze River) basin. J. Hydrol. Amst. 2006, 329, 620–629. [Google Scholar] [CrossRef]
- Wang, Y.; Jiang, T.; Bothe, O.; Fraedrich, K. Changes of pan evaporation and reference evapotranspiration in the Yangtze River basin. Theor. Appl. Clim. 2006, 90, 13–23. [Google Scholar] [CrossRef]
- Luo, K.; Tao, F.; Deng, X.; Moiwo, J.P. Changes in potential evapotranspiration and surface runoff in 1981-2010 and the driving factors in Upper Heihe River Basin in Northwest China. Hydrol. Process. 2016, 31, 90–103. [Google Scholar] [CrossRef]
- Zhang, Y.Q.; Liu, C.M.; Tang, Y.H.; Yang, Y.H. Trends in pan evaporation and reference and actual evapotran-spiration across the Tibetan Plateau. J. Geophys. Res. Atmos. 2007, 112. [Google Scholar] [CrossRef]
- Li, Z.; Zheng, F.L.; Liu, W.Z. Spatiotemporal characteristics of reference evapotranspiration during 1961–2009 and its pro-jected changes during 2011–2099 on the Loess Plateau of China. Agricultural & Forest Meteorology; Elsevier: Amsterdam, The Netherlands, 2012; Volume 154, pp. 147–155. [Google Scholar]
- Liu, X.M.; Zheng, H.X.; Liu, C.M.; Cao, Y.J. Sensitivity of the potential evapotranspiration to key climatic variables in the Haihe River Basin. Resour. Sci. 2009, 31, 1470–1476. [Google Scholar]
- Su, X.L.; Song, Y.; Niu, J.P.; Ji, F. Sensitivity and attribution of potential evapotranspiration in Jinghuiqu irrigation district. J. Nat. Resour. 2015, 1, 115–123. [Google Scholar]
- Yang, X.N. Effects of Landscape Pattern on Runoff Andsediment in the Loess Plateau: A Multi-Scale Study. Dissertation Submitted to Northwest A & F University, Xianyang, China, 2019. [Google Scholar]
- Jiao, J.Y.; Wang, Z.J.; Wei, Y.H.; Su, Y.; Cao, B.T.; Li, Y.J. Characteristics of erosion sediment yield with extreme rainstorms in Yanhe Watershed based on field. Trans. Chin. Soc. Agric. Eng. 2017, 33, 159–167. [Google Scholar]
- Zhang, X.L.; Xiong, L.H.; Lin, L.; Long, H.F. Application of five potential evapotranspiration equations in Hanjiang Basin. Arid. Land Geogr. 2012, 35, 229–237. [Google Scholar]
- McCuen, R.H. A Sensitivity and Error Analysis Cf Procedures Used for Estimating Evaporation. JAWRA J. Am. Water Resour. Assoc. 1974, 10, 486–497. [Google Scholar] [CrossRef]
- Beven, K. A sensitivity analysis of the Penman-Monteith actual evapotranspiration estimates. J. Hydrol. 1979, 44, 169–190. [Google Scholar] [CrossRef]
- Rana, G.; Katerji, N. A Measurement Based Sensitivity Analysis of the Penman-Monteith Actual Evapotranspiration Model for Crops of Different Height and in Contrasting Water Status. Theor. Appl. Clim. 1998, 60, 141–149. [Google Scholar] [CrossRef]
- Hupet, F.; Vanclooster, M. Effect of the sampling frequency of meteorological variables on the estimation of the reference evapotranspiration. J. Hydrol. 2001, 243, 192–204. [Google Scholar] [CrossRef]
- Mann, H.B. Non-Parametric Test against Trend. Econometrica 1945, 13, 245–259. [Google Scholar] [CrossRef]
- Kendall, M.G. Rank Correlation Measures; Charles Griffin: London, UK, 1975; p. 202. [Google Scholar]
- Lin, Z.H.; Mo, X.G.; Li, H.X.; Li, H.B. Comparison of Three Spatial Interpolation Methods for Climate Variables in China. Acta Geogr. Sin. 2002, 57, 47–56. [Google Scholar]
Figure 1.
Location of the Yanhe River Basin and the meteorological stations used in this study (black dots).
Figure 1.
Location of the Yanhe River Basin and the meteorological stations used in this study (black dots).

Figure 2.
Spatial distribution of factors: (a) air temperature, (b) humidity, (c) wind speed at 2 m height, (d) solar radiation, (e) precipitation, and (f) the potential evapotranspiration.
Figure 2.
Spatial distribution of factors: (a) air temperature, (b) humidity, (c) wind speed at 2 m height, (d) solar radiation, (e) precipitation, and (f) the potential evapotranspiration.

Figure 3.
Characteristics of average daily sensitivity coefficient of ET0 to meteorological factors.
Figure 3.
Characteristics of average daily sensitivity coefficient of ET0 to meteorological factors.

Figure 4.
Spatial distribution of sensitivity coefficients of ET0 to meteorological factors: (a) air temperature, (b) humidity, (c) wind speed at 2 m height, (d) solar radiation.
Figure 4.
Spatial distribution of sensitivity coefficients of ET0 to meteorological factors: (a) air temperature, (b) humidity, (c) wind speed at 2 m height, (d) solar radiation.

Figure 5.
Spatial distribution of contribution rate of each meteorological factor: (a) air temperature, (b) humidity, (c) wind speed at 2m height, (d) solar radiation.
Figure 5.
Spatial distribution of contribution rate of each meteorological factor: (a) air temperature, (b) humidity, (c) wind speed at 2m height, (d) solar radiation.


Table 1.
Temporal characteristics of ET0 and meteorological factors in Yanhe River Basin.
| Time | Mean | M-K Statistics | ||||||||||
|---|---|---|---|---|---|---|---|---|---|---|---|---|
| T/°C | RH/% | U2/(m s−1) | Rs/(MJ mm−2 Day−1) | P/mm | ET0/(mm) | T | RH | U2 | Rs | P | ET0 | |
| Jan. | −6.07 | 53.85 | 1.03 | 304.92 | 3.00 | 23.37 | 1.68 | 0.72 | 0.93 | 0.51 | 0.63 | 0.49 |
| Feb. | −2.05 | 52.44 | 1.13 | 336.89 | 5.65 | 33.90 | 2.73 | 1.1 | −0.09 | 0.61 | 2.14 | 1.7 |
| Mar. | 4.33 | 50.53 | 1.32 | 478.71 | 14.28 | 66.43 | 3.12 | −2.31 | −0.19 | 2.42 | −2.33 | 3.36 |
| Apr. | 11.76 | 46.48 | 1.48 | 580.06 | 24.05 | 104.39 | 2.24 | −0.47 | −3.03 | 1.44 | 1.07 | 0.49 |
| May. | 17.20 | 50.93 | 1.40 | 664.94 | 43.40 | 133.22 | 0.75 | −0.37 | −2.07 | 1 | 0.54 | 0.28 |
| Jun. | 21.29 | 57.66 | 1.26 | 655.36 | 60.54 | 139.72 | 1.68 | −1.17 | −0.93 | 0.93 | −1.1 | 1 |
| Jul. | 22.99 | 69.01 | 1.11 | 631.68 | 115.24 | 134.55 | 2.63 | −1.24 | 0.72 | 0.72 | 0.3 | 1.63 |
| Aug. | 21.24 | 74.17 | 1.03 | 573.99 | 107.19 | 114.22 | 1.7 | −2.21 | 1.12 | −0.42 | −1 | 0.7 |
| Sep. | 16.04 | 74.92 | 0.98 | 453.95 | 71.85 | 78.29 | 2.82 | −0.21 | 1.84 | −1.86 | 0.98 | −0.49 |
| Oct. | 9.63 | 70.20 | 1.02 | 384.49 | 34.76 | 53.65 | 1.61 | 1.26 | 0.05 | −1.05 | 0.72 | −0.21 |
| Nov. | 2.22 | 62.64 | 1.07 | 304.19 | 12.64 | 32.13 | 1.98 | −0.19 | −0.23 | −0.02 | −0.3 | 0.68 |
| Dec. | −4.23 | 57.03 | 1.04 | 276.63 | 2.60 | 22.07 | 0.89 | −0.68 | 1.35 | 0.63 | 0.56 | 0.96 |
| Year | 9.59 | 60.05 | 1.16 | 5645.81 | 495.19 | 935.92 | 3.8 | −1.12 | −0.7 | 0.56 | 0.42 | 1.65 |
Table 2.
Temporal characteristics of sensitivity coefficient of ET0 to meteorological factors.
| Time | Mean | M-K Statistics | ||||||
|---|---|---|---|---|---|---|---|---|
| ST | SRH | SU2 | SRs | ST | SRH | SU2 | SRs | |
| Jan. | −0.12 | −0.51 | 0.32 | 0.09 | 1.33 | −2.31 | 1.35 | −0.56 |
| Feb. | −0.05 | −0.43 | 0.25 | 0.27 | 2.10 | −1.77 | 0.56 | −0.58 |
| Mar. | 0.04 | −0.36 | 0.20 | 0.40 | −0.33 | 1.82 | 2.82 | −2.21 |
| Apr. | 0.09 | −0.28 | 0.20 | 0.48 | 0.19 | 0.89 | 0.16 | 1.12 |
| May. | 0.12 | −0.25 | 0.16 | 0.56 | −0.19 | 1.07 | 0.30 | 0.09 |
| Jun. | 0.14 | −0.24 | 0.13 | 0.63 | −0.89 | 1.24 | 0.93 | −0.07 |
| Jul. | 0.19 | −0.28 | 0.09 | 0.70 | −1.98 | −0.02 | 1.70 | −1.07 |
| Aug. | 0.22 | −0.33 | 0.07 | 0.70 | −2.54 | −1.37 | 2.63 | −2.83 |
| Sep. | 0.20 | −0.44 | 0.09 | 0.61 | −1.33 | −2.77 | 1.37 | −2.38 |
| Oct. | 0.13 | −0.54 | 0.16 | 0.43 | 0.61 | −1.82 | −0.42 | −0.37 |
| Nov. | 0.02 | −0.62 | 0.29 | 0.16 | 1.00 | −0.91 | 1.12 | −1.19 |
| Dec. | −0.07 | −0.61 | 0.37 | −0.01 | 2.84 | −0.93 | 1.40 | −1.21 |
| Year | 0.08 | −0.41 | 0.19 | 0.42 | 0.82 | −1.51 | 2.80 | −1.82 |
Table 3.
M-K statistics of Sensitivity coefficient of ET0 to meteorological factors of Yanhe River Basin.
Table 3.
M-K statistics of Sensitivity coefficient of ET0 to meteorological factors of Yanhe River Basin.
| Station | Mean | M-K Statistics | ||||||
|---|---|---|---|---|---|---|---|---|
| ST | SRH | SU2 | SRs | ST | SRH | SU2 | SRs | |
| Jingbian | 0.03 | −0.46 | 0.26 | 0.34 | 1.12 | 3.05 | 2.89 | −0.40 |
| Wuqi | 0.07 | −0.36 | 0.17 | 0.43 | 0.56 | 2.07 | −0.07 | 1.54 |
| Zichang | 0.07 | −0.43 | 0.21 | 0.40 | 0.51 | −3.57 | 1.42 | −1.30 |
| Zhidan | 0.08 | −0.34 | 0.16 | 0.45 | 2.77 | −1.21 | 2.10 | −0.77 |
| Ansai | 0.08 | −0.45 | 0.20 | 0.41 | 1.26 | −0.16 | 1.07 | 0.72 |
| Yan’an | 0.08 | −0.44 | 0.21 | 0.41 | −1.56 | 0.05 | 1.33 | −1.30 |
| Ganquan | 0.09 | −0.46 | 0.17 | 0.45 | 2.68 | 3.38 | 0.54 | 1.72 |
| Yanchuan | 0.08 | −0.28 | 0.17 | 0.44 | 0.61 | −2.68 | 4.24 | −3.36 |
| Yanchang | 0.10 | −0.39 | 0.18 | 0.45 | −1.72 | −2.96 | 3.36 | −3.22 |
| Yichuan | 0.09 | −0.45 | 0.20 | 0.42 | −1.56 | −2.49 | 3.61 | −3.84 |
Table 4.
Temporal characteristic of contribution rate of meteorological factors to ET0 in Yanhe River Basin.
Table 4.
Temporal characteristic of contribution rate of meteorological factors to ET0 in Yanhe River Basin.
| Time | RT/% | CT/% | RRH/% | CRH/% | RU2/% | CU2/% | RRS/% | CRS/% |
|---|---|---|---|---|---|---|---|---|
| Jan. | −16.15 | 1.95 | 3.10 | −1.59 | 2.34 | 0.76 | 0.53 | 0.05 |
| Feb. | −123.61 | 6.68 | 8.25 | −3.57 | 0.71 | 0.18 | 1.79 | 0.49 |
| Mar. | 63.48 | 2.86 | −23.68 | 8.61 | −4.53 | −0.92 | 11.87 | 4.79 |
| Apr. | 12.65 | 1.15 | −4.60 | 1.26 | −23.55 | −4.70 | 5.30 | 2.54 |
| May. | 2.77 | 0.33 | −3.47 | 0.88 | −22.31 | −3.66 | 4.09 | 2.31 |
| Jun. | 4.57 | 0.64 | −6.65 | 1.58 | −11.78 | −1.57 | 2.65 | 1.68 |
| Jul. | 6.11 | 1.16 | −5.64 | 1.59 | 3.95 | 0.34 | 2.25 | 1.58 |
| Aug. | 4.48 | 0.96 | −6.40 | 2.09 | 6.20 | 0.43 | −2.29 | −1.60 |
| Sep. | 9.70 | 1.95 | −0.57 | 0.25 | 8.53 | 0.73 | −9.20 | −5.58 |
| Oct. | 11.47 | 1.44 | 4.18 | −2.25 | −5.09 | −0.81 | −6.80 | −2.89 |
| Nov. | 66.20 | 1.26 | −0.04 | 0.03 | −4.10 | −1.17 | −2.04 | −0.33 |
| Dec. | −21.83 | 1.46 | −4.92 | 3.01 | 10.80 | 3.96 | 2.62 | −0.04 |
| Year | 14.35 | 1.09 | 2.09 | −0.85 | −3.24 | −0.63 | 1.32 | 0.55 |
Table 5.
Contribution rate of meteorological factors to ET0 of stations in Yanhe River Basin.
| Station | RT/% | CT/% | RRH/% | CRH/% | RU2/% | CU2/% | RRS/% | CRS/% |
|---|---|---|---|---|---|---|---|---|
| Jingbian | 27.75 | 2.02 | −9.00 | 3.91 | −31.68 | −6.76 | 2.79 | 1.12 |
| Wuqi | 12.34 | 0.94 | −3.92 | 1.35 | −17.78 | −2.82 | 8.81 | 3.95 |
| Zichang | 16.19 | 1.25 | 0.74 | −0.34 | 10.52 | 2.10 | −0.21 | −0.08 |
| Zhidan | 19.71 | 1.86 | −4.56 | 2.10 | −8.13 | −1.40 | 4.27 | 1.90 |
| Ansai | 11.10 | 0.89 | −1.46 | 0.40 | −18.65 | −3.13 | 2.23 | 0.98 |
| Yan’an | 12.91 | 1.25 | −7.57 | 2.93 | 0.16 | 0.03 | 4.43 | 1.98 |
| Ganquan | 18.00 | 0.54 | −2.99 | 1.37 | −35.71 | −9.16 | −2.18 | −0.74 |
| Yanchuan | 8.27 | 0.54 | −0.51 | 0.18 | 40.06 | 6.90 | −1.17 | −0.50 |
| Yanchang | 4.70 | 0.39 | 0.74 | −0.24 | 34.65 | 6.51 | −3.42 | −1.48 |
| Yichuan | 15.34 | 1.33 | −4.67 | 2.12 | 8.13 | 1.64 | −2.58 | −1.09 |
Publisher’s Note: MDPI stays neutral with regard to jurisdictional claims in published maps and institutional affiliations. |
© 2021 by the authors. Licensee MDPI, Basel, Switzerland. This article is an open access article distributed under the terms and conditions of the Creative Commons Attribution (CC BY) license (https://creativecommons.org/licenses/by/4.0/).
Share and Cite
MDPI and ACS Style
Luo, Y.; Gao, P.; Mu, X. Influence of Meteorological Factors on the Potential Evapotranspiration in Yanhe River Basin, China. Water 2021, 13, 1222. https://doi.org/10.3390/w13091222
AMA Style
Luo Y, Gao P, Mu X. Influence of Meteorological Factors on the Potential Evapotranspiration in Yanhe River Basin, China. Water. 2021; 13(9):1222. https://doi.org/10.3390/w13091222
Chicago/Turabian StyleLuo, Yu, Peng Gao, and Xingmin Mu. 2021. "Influence of Meteorological Factors on the Potential Evapotranspiration in Yanhe River Basin, China" Water 13, no. 9: 1222. https://doi.org/10.3390/w13091222
Note that from the first issue of 2016, this journal uses article numbers instead of page numbers. See further details here.