
Optimizing the Hydrothermal Carbonization of Sewage Sludge—Response Surface Methodology and the Effect of Volatile Solids


Chair of Wastewater Technology, Institute IWAR, Technical University of Darmstadt, Franziska-Braun-Str. 7, 64287 Darmstadt, Germany
*
Author to whom correspondence should be addressed.
Water 2021, 13(9), 1225; https://doi.org/10.3390/w13091225
Submission received: 23 March 2021
/
Revised: 23 April 2021
/
Accepted: 25 April 2021
/
Published: 28 April 2021
(This article belongs to the Section Wastewater Treatment and Reuse)
Abstract
:This study focuses on identifying the optimum conditions of sewage sludge hydrothermal carbonization by Box–Behnken Design and on the effects of volatile solids on heating value and on process water load. To get insight into the solid and process water characteristics, we applied the Box–Behnken Design on the hydrothermal reaction temperature (190, 220, 250 °C), reaction time (0.5, 2.25, 4 h) and pH (3.9, 5, 6.1). The response surface of the liquid phase revealed decreasing dissolved organic carbon (DOC) concentrations with increasing temperature from 9446 mg/L (190 °C) to 7402 mg/L (250 °C) at 4 h reaction time. For the same hydrothermal conditions, NH4-N concentration increased from 754 to 1230 mg/L. Reaction temperature was identified as the most important process parameter, whereas reaction time and pH had only minor effects. Moreover, linear coefficients of the models were more decisive than the interrelation and quadratic coefficients. Volatile solids (VS) of the feedstock were found to significantly influence both the load of the process water and the change in heating value of the hydrochars. Process water load increased steadily with higher VS. The heating value only increased with more than around 65–80% VS in feedstock.
1. Introduction
In municipal wastewater treatment, the main distinction is made between primary sewage sludge (PS), waste activated sludge (WAS), including precipitation sludge from phosphorus removal, and anaerobically digested sludge (ADS). The type of sludge as well as a number of process parameters determine its elementary main components, which are in the ranges of 3.4–6.64% H, 22.8–51.20% C, 1.9–8.85% N, and 13.86–52.30% O and are usually <1.37% S [1,2,3,4,5]. In recent years, the treatment and disposal of sewage sludge is gaining more and more attention as its components, especially phosphorus and the chemically bound energy, are considered valuable and worth recovering. To this end, technologies such as anaerobic digestion, phosphorus extraction and combustion are widely used for sewage sludge treatment. Current trends towards renewable energies, further optimization of sewage sludge treatment processes and carbon sequestration promote alternative technologies such as the hydrothermal carbonization (HTC), which reproduces the natural coalification of organic matter in the presence of water in a technical application [6].
Both temperature and feedstock significantly determine chemical pathways and the thermochemical breakdown of the biomass structure into lower weight molecules. Due to the diverse composition of sewage sludge including polysaccharides, proteins, and lipids, it is still a challenge to define the pathways and kinetics during its hydrothermal treatment [7]. The hydrothermal carbonization changes the elemental composition of sewage sludge significantly, as dehydration and decarboxylation lead to higher C content and in contrast to lower N, H and O content [8]. A review of several studies by Wang et al. [7] shows increasing carbon content with increasing reaction temperature and reaction time of the hydrothermal treatment. The breakdown of molecules via dehydration and decarboxylation leads to a mass loss during HTC, resulting in a reduction of volatile solids and consequently an accumulation of inorganic material [7,9]. The mass loss is generally in a wide range up to 33%, depending on the sewage sludge properties and the hydrothermal conditions [3,5].
Depending on temperature, roughly more than 60% C remains in the solids during hydrothermal treatment. A minor amount of less than 5% C enters the gas phase as CO2 and consequently the difference of 35–40% C is found in the process water [8]. Accordingly, the reported TOC and COD concentrations vary in a wide range between 4500 and 24,900 mg/L C and 13,000 and 66,300 mg/L O2, respectively [10,11]. Carbonaceous compounds such as lipids were reported to hydrolyze almost completely to free fatty acids during hydrothermal treatment up to 280 °C within 15–20 min. These fatty acids have been identified mainly as acetic acid and propionic acid and are predominantly derived from unsaturated lipids [12,13]. With increasing reaction times, aldehydes, ketones and monosaccharides have been found to be degraded, while organic acids, mainly formic, lactic and acetic acid, are formed [14]. Sugars, 5-HMF and Furfural have also been proven to degrade with longer reaction times and reaction temperatures [15].
Dissolved nitrogen is predominantly present as organic nitrogen (org. N, containing proteins, amino acids, melanoidins) and ammonium (NH4-N). The release of NH4-N results from the deamination and decarboxylation of amino acids, which in turn are degraded from proteins [16]. Dote et al. [17] determined 19 amino acids which are almost completely present in the liquid phase as NH4-N and organic nitrogen. Increasing shares of NH4-N with increasing reaction temperatures and reaction times indicate an intensification of deamination processes [18]. Elevating temperatures from 150 to 270 °C increased the ratio of 30% N to over 70% N of the total nitrogen present in the process water [19]. Similar results were obtained with dewatered sewage sludge by Chen et al. [20], which show a decline of amino acids and a doubling of NH4-N concentration in process water as temperature increases from 170 °C to 320 °C. A simultaneous decrease in carbohydrates was attributed to the Maillard’s reaction and the associated formation of its recalcitrant products. Melanoidins such as aldehydes, furans, pyrroles, pyrazines and pyridines are the brownish colored reaction products of amino acids and sugars under hydrothermal conditions, which mainly contribute to the dissolved nitrogen as their polarity and consequently their solubility is higher than for proteins [21,22]. On the other hand, melanoidins were proven to decompose to char, gas, NH4-N and other decomposed products at temperatures above 200 °C [23]. Nitrogen concentrations, in process water after the hydrothermal treatment of sewage sludge, range from 700 to 4900 mg NH4-N/L and total nitrogen (TN) 1500–5500 mg TN/L [24,25].
The hydrothermal carbonization of sewage sludge has received growing attention in recent years. Literature shows that numerous works deal with the optimization of the process and use of the hydrochars, energy balances or the question of how to handle the resulting high loaded process water. Still, results of studies regarding the interrelation between the loads and process parameters, as well as the load level and the change in the higher heating value (HHV) is very heterogeneous and demands further investigations. With this in mind, this study aims firstly to provide structured insight into the characteristics of the hydrochars and process water and their dependence on the reaction temperature, the reaction time and the feedstock pH. A three-level full factorial design is intended to highlight the interrelation of all three parameters on the migration and transformation of carbon and nitrogen during hydrothermal carbonization. Secondly, the mass fraction of volatile solids prior to hydrothermal treatment is correlated with the process water load and the increase or decrease in the HHV after hydrothermal treatment. Since the hydrothermal carbonization transfers parts of the sewage sludge’s organic and inorganic components into the liquid phase, the organics mainly determine the load of the process water and the HHV. Thus, our experiments improve the understanding of the HTC of sewage sludge and contribute to the optimization of process water treatment.
2. Materials and Methods
2.1. Sampling
Sewage sludge samples were obtained from two municipal wastewater treatment plants (WWTP) in Germany (Table 1). The raw sewage sludge of WWTP A (RS1) contained PS and WAS and was used for the Box–Behnken Design. Additionally, PS and WAS samples were taken from WWTP B and mixed to obtain raw sewage sludge RS2 (1/3 w/w PS and 2/3 w/w WAS) and RS3 (2/3 w/w PS and 1/3 w/w WAS). WAS of WWTP B was diluted to 3%, 5% and 7% TS using the effluent of the same WWTP. After preparation, all samples were frozen in portions at –20 °C to avoid degradation processes in feedstock prior to HTC. Samples were thawed overnight at an ambient temperature just before each hydrothermal run.
2.2. Experimental Procedure
The hydrothermal experiments were performed using a 0.5 L batch reactor (midiclave Typ 3E/0.5lt, Büchi, AG, Switzerland), which is electrically heated and water cooled. The stirrer was set to 2000 rpm. A 95–98% w/w sulfuric acid was added to RS1 before the runs to adjust pH 3.9 and pH 5. The reaction time of the experiment was counted when the difference to the set temperature was <1%. Reaction temperature remained constant ± 1% of set value during the whole experiment. It took the reactor about 0.75–2.0 h to heat up (corresponding to 1.92 ± 0.38 °C/min) and after the desired reaction time approx. 0.75 h to cool down to ambient conditions. The pressure was equal to the vapor pressure at a given temperature (up to 41 bar max.). the total solids (TS) and the total volatile solids (VS) were analyzed and the coal slurry was centrifuged at 19,500 rpm (rcf: 22,319 g) at 20 °C for 30 min (Sigma 3K30, Sigma Laborzentrifugen GmbH, Osterode am Harz, Germany). For the following analysis of the solids, the dewatered samples were used and the liquid was analyzed from the supernatant of centrifugation. Throughout the experiments, especially at higher temperatures, strong caking occurred on the inner reactor wall, which was removed by scraping and rinsing after each run.
2.3. Hydrochar Analysis
Solid outputs were analyzed in terms of TS and VS according to DIN EN 12880:2000 and DIN EN 15936:2012 and dried at 105 °C before further analysis. A calorimeter was used to determine the higher heating value (HHV) (IKA C200, IKA®-Werke GmbH & CO. KG, Staufen, Germany) and an elemental analyzer to obtain the CHN-composition (VarioEL III CHN, Elementar Analysensysteme GmbH, Langenselbold, Germany). The chemical oxygen demand (COD) of the dried solids was measured according to DIN 38414 S9:1986. The analysis of each parameter was performed as duplicate or triplicate.
2.4. Process Water Analysis
Process water samples were filtered via 0.45 µm PES syringe filters before analysis. To determine dissolved organic carbon (DOC), chemical oxygen demand (COD) total nitrogen (TN) and ammonium (NH4-N) HACH tests LCK 387, LCK 514, LCK 338, LCK 303 and a HACH Photometer DR 3900 were used (Hach Lange GmbH, Düsseldorf, Germany). UV254 was determined with a HACH Photometer DR 5000 at a cell length of 10 mm (100-QS, Hellma GmbH, Müllheim, Germany), pH and conductivity by inoLab Multi 9620 IDS (Xylem Analytics Germany Sales GmbH & Co. KG, Weilheim, Germany). The ratio of UV254 to DOC was defined as the specific UV absorbance (SUVA) in L/(mg·m).
2.5. Determination of the Reaction Intensity
The reaction intensity, as introduced by Ruyter [26], was used to evaluate the correlation of the reaction temperature and reaction time (1). This semi-empirical approach showed a good fit to experimental data and considers the greater impact of the reaction temperature compared to reaction time [27]:
where f is the reaction intensity, t the reaction time in seconds and T the temperature in kelvin. To consider varying heating times (see Section 2.2), the mean temperature and the mean reaction times above 180 °C were used to calculate reaction intensity.
2.6. Experimental Design
To point out the effects of various process parameters and their interaction on the process water, we used response surface methodology (RSM) with Box–Behnken Design (BBD) (e.g., [28]) and three factors (reaction temperature T, reaction time t, pH) at three levels for RS1. The tested temperature was 190, 220 and 250 °C, the time was 0.5, 2.25 and 4 h and the pH was 3.9, 5, 6.1. These process parameters were chosen, since they cover a wide range of typical and technically feasible process parameters of hydrothermal treatment of sewage sludge. The runs were performed randomly. A second-order polynomial equation according to Equation (2) was used to model the investigated parameters.
where y is the calculated response value (DOC, NH4-N, NH4-N/TN), xi and xj are the investigated variables (in this study T, t, pH), β0 is the intercept, βi the linear, βii the quadratic and βij the interactive constant. The model’s constants were fitted to the experimental data using Microsoft Excel 2016 and Minitab 19. The coefficient of determination R2 as the ratio of the sum of squared errors SSE to the sum of squared total deviations SST according to Equation (3) was used to evaluate the model’s accuracy.
Since R2 alone does not measure the accuracy and large values of R2 are not equivalent to a good fit of the model, Baş and Hoyaci [29] suggested to also take the absolute average deviation (ADD) into account (Equation (4)).
Therein, p is the number of runs, yi,exp and yi,cal are the experimental and the calculated results. To evaluate the model’s accuracy further, the common interpretation of R2 and AAD should be carried out. R2 should be close to 1.0 and AAD should be as small as possible. The statistical significance of the parameters was determined by analysis of variance (ANOVA) with p-test using Minitab 19.
3. Results and Discussion
3.1. Results of Box–Behnken Design (Raw SEWAGE Sludge 1)
The results for each run for the analyzed parameters of the hydrochars (HHV) and the liquid phase (DOC, NH4-N and NH4-N/TN) are summarized in Table 2. Table 3 depicts the coefficients fitted to Equation (2). High R2 and low AAD were determined for all model fits, indicating a valid correlation between measured values and modelled values.
The analysis of variance (ANOVA) can be found in the Appendix A (Table A1, Table A2, Table A3 and Table A4).
3.2. Surface Analysis of Hydrochars (Raw Sewage Sludge 1)
The HHV at intensifying hydrothermal conditions was mainly driven by the reaction’s temperature (Figure 1a) and increased from 18.1 MJ/kg TS at 190 °C for 0.5 h to 21.0 MJ/kg TS at 250 °C for 0.5 h. Reaction time became more influential at higher temperatures, since the HHV for 4 h elevated by 1.1 MJ/kg TS at 250 °C but only by 0.6 MJ/kg TS at 190 °C. This indicates that soluble compounds from hydrolysis polymerize and aromatize, which leads to the formation of additional solids, as also described by [30]. Consequently, the longer the reaction time, the more polymerization reactions take place and the higher the HHV. Furthermore, the increase in reaction temperature and reaction time resulted in an almost linear increase in HHV. Comparing the HHV of the hydrochars with that of the feedstock with 18.04 MJ/kg TS (see Table 2), almost no positive effect could be observed at mild hydrothermal conditions. At the most intense HTC conditions at 250 °C for 4 h, the HHV increased by 21% to 21.9 MJ/kg TS.
The ratio of HHV3.9/HHV6.1 in Figure 1b shows that the reduction of pH promoted a slight HHV increase. This was more pronounced at 190 °C since the HHV was about 6% higher at pH 3.9, while at 250 °C it was only about 2%. As the model shows no minimum at 250 °C, an ongoing impact of acid beyond 250 °C seems likely. Acidic milieus support the formation of carbonaceous products in general. Arrhenius acids such as the used H2SO4 generally promote hydrolysis, dehydration and condensation reaction [31,32], which potentially accelerate polymerization and lead to higher carbon content of the solids. An acidic environment at 200 °C has been reported to accelerate dehydration and coalification reactions while suppressing decarboxylation and hydride transfer reactions [33]. Titirici et al. [34] recommend thermal conditions below 200 °C in an acidic milieu as most of the carbon in the feedstock remains bound in the solid phase. Our findings confirm a greater benefit of an acidic environment at lower reaction conditions.
3.3. Surface Analysis of Process Water Load (Raw Sewage Sludge 1)
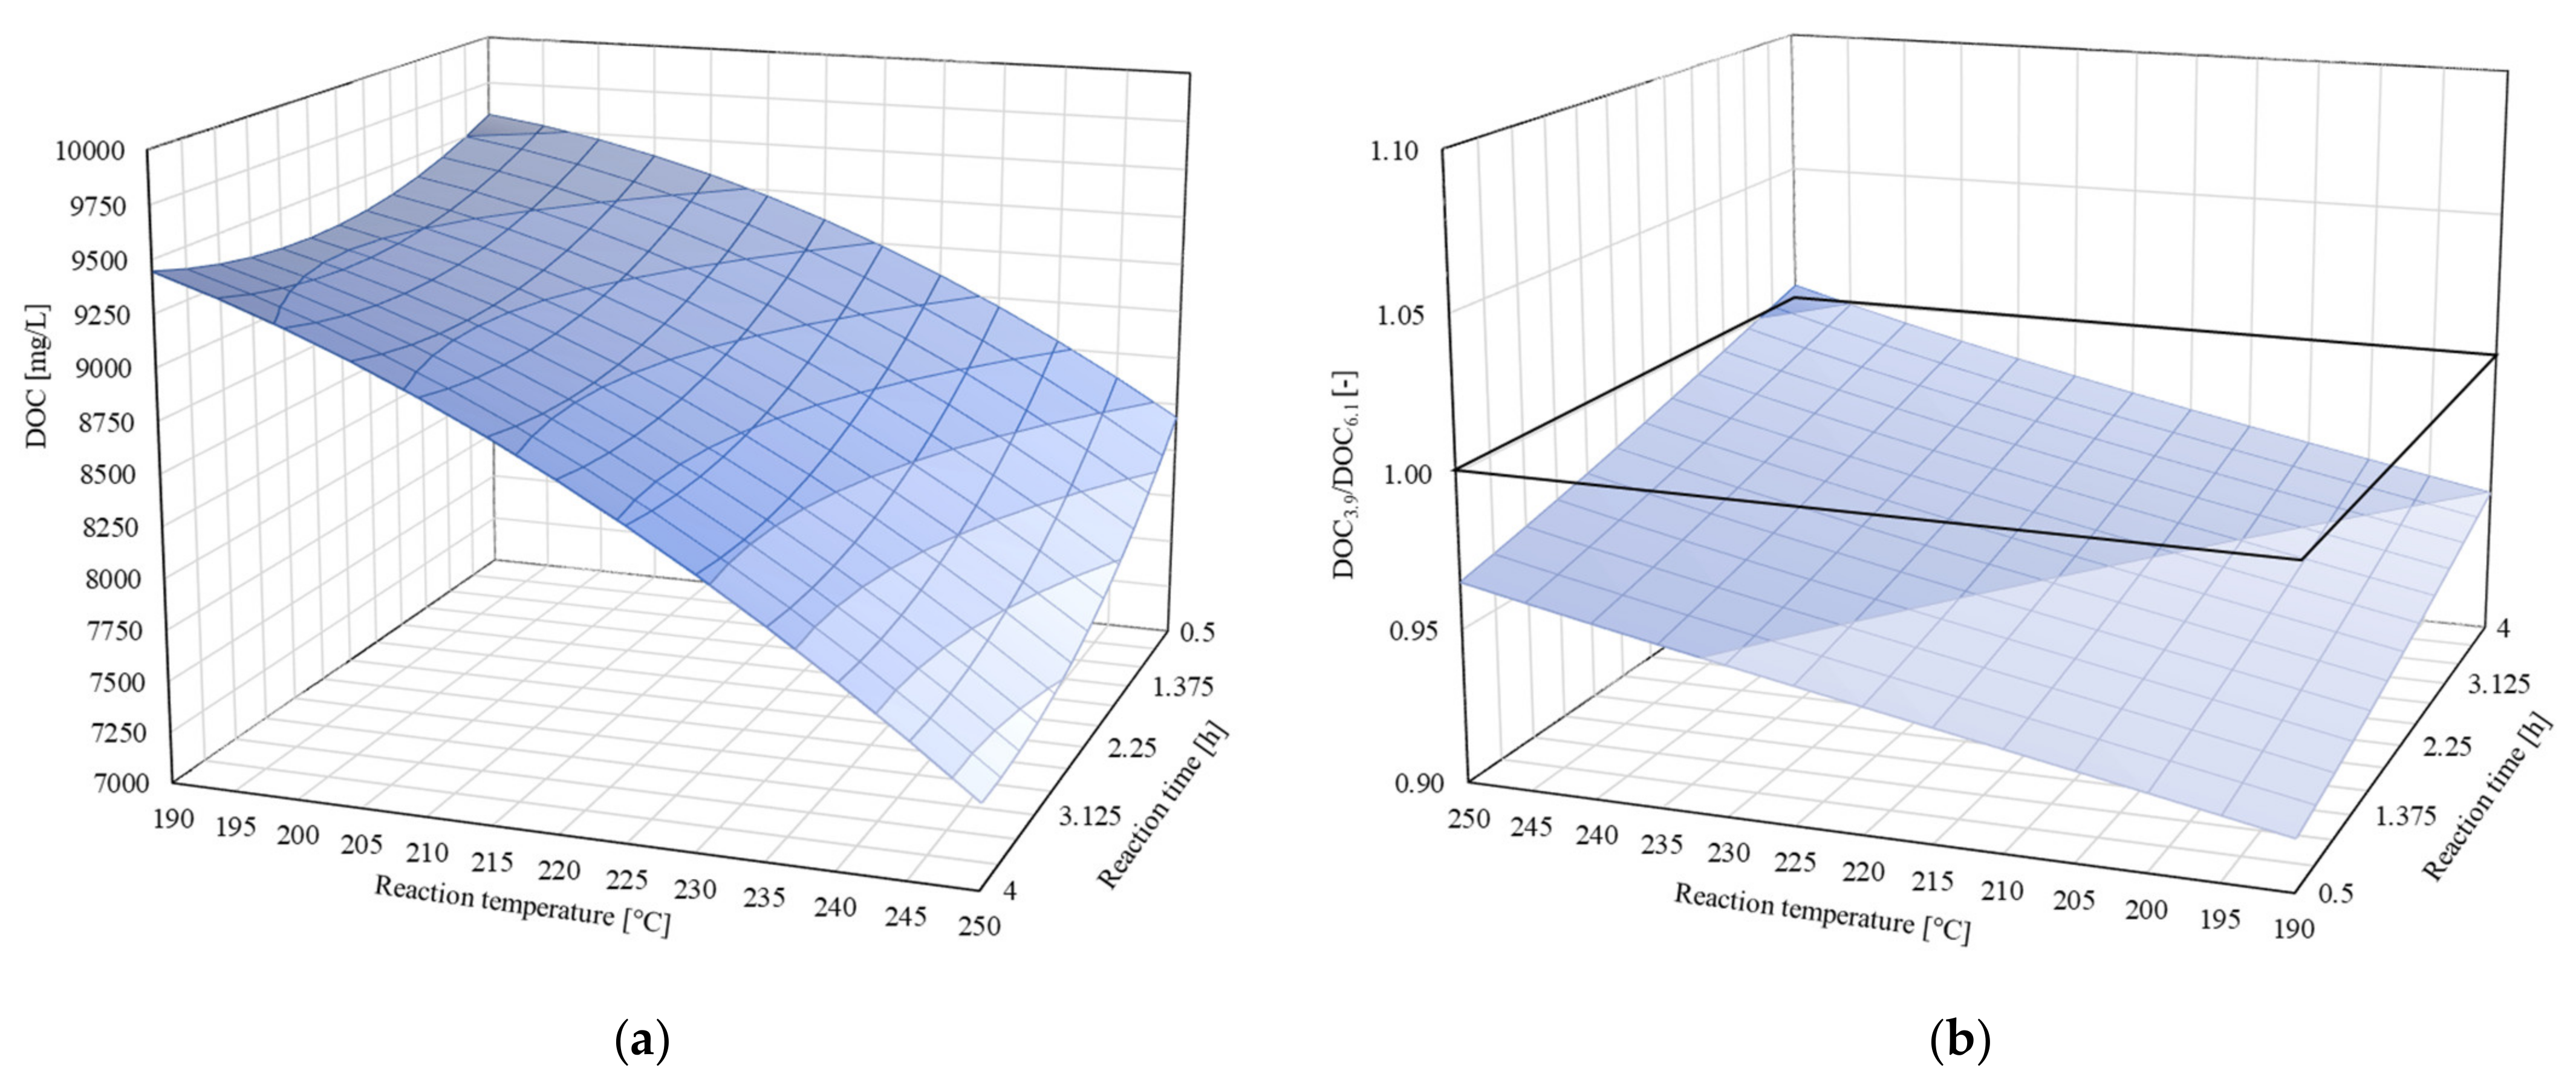
Figure 2a shows the response surface plot for DOC and the interaction between temperature and time for a fixed pH of 6.1. In general, the DOC concentration in process water decreased with higher reaction temperature and longer reaction times. Since temperature mainly governs hydrothermal reactions, the DOC concentration declined from 9558 mg/L at 190 °C to 8161 mg/L at 250 °C (0.5 h). Lower temperatures cause more degradation and hydrolysis processes, whereas higher temperatures lead to more polymerization reactions [35]. Polymerization reactions and the associated formation of solids reduced the DOC concentration in the liquid phase and correspond to the rising HHV in Figure 1a. For a reaction time of 4 h and an elevation in temperature from 190 to 250 °C, the reactions that took place reduced the DOC concentration by 28%. The extension of the reaction time at 190 °C and 2.25 h showed a minor local minimum with 9303 mg/L, which does not follow the overall trend. This may be attributed to the chosen design of experiments, since no corner points are tested in the experiments of the BBD [28]. Nevertheless, the model highlights the general dependencies and the interrelation between the parameters.
Prolonging the reaction time from 0.5 to 4 h reduced the DOC concentration depending on the reaction temperature. At 220 °C, the DOC concentration was reduced by 5% from 9107 to 8655 mg/L and at 250 °C by 10% from 8179 to 7402 mg/L. This reduction was more distinctive for higher temperatures and thus enhanced polymerization reactions at higher temperatures and fits to the previous observation of the hydrochars. In order to minimize DOC in process water, high temperatures in combination with long reaction times seem favorable. The same trends were observed at 300 and 350 °C and the extension of the reaction time from 0.5 to 60 min by Shanableh [36]. In contrast, the general findings of our study are somewhat different to the results of Sun et al. [37], who found higher impacts on the DOC yields for lower temperatures. Nevertheless, the effect of the time was also less dominant than that of the temperature.
The impact of adding H2SO4 to the feedstock on the DOC concentration is referred to by the ratio DOC3.9/DOC6.1. Figure 2b shows, that the catalyst reduced the DOC concentration by 0.92 for T = 190 °C and t = 0.5 h. Its effect became less significant for higher hydrothermal conditions, and at 250 °C for 4 h an even larger negative effect became apparent. These findings correspond to the previous observations of a higher HHV in reverse order (Figure 1b). The decreasing effects of an acidic catalyst with increasing reaction temperature was also observed by Rogalinski et al. [38]. They observed increased liquefaction yields using CO2 up to 260 °C and attributed this to an already increased reaction rate at temperatures above 260 °C. A study from Zou et al. [39] with marine microalgae suggests that the catalytic impact at a lower catalytic concentration might be negated by the organic acids formed during HTC as stated by Asghari and Yoshida [14]. In accordance to our study, they observed lower liquefaction yields for temperatures up to 195 °C and reaction times up to 60 min, which was attributed to polymerization. In the present study, only minor differences for the DOC concentration at pH 5 and pH 6.1 were observed. Therefore, results at pH 5 are not depicted.
To get an overview of the load of the process water before and after hydrothermal treatment without considering the different process conditions, all 15 hydrothermal runs of the BBD are summarized (Table 4). Apparently, the hydrothermal treatment of the sewage sludge was associated with a massive additional process water load compared to untreated sewage sludge. The concentration of COD was higher by a factor of 5.8, the DOC concentration by a factor of 6.7 and the absorption at 254 nm (UV254) was 11.7 times higher. Looking at the COD/DOC ratio, a shift from 2.68 to 3.10 mg O2/mg C was observed, which shows that the organic liquid compounds of the HTC process were in a less oxidized form. Furthermore, at higher temperatures the COD/DOC ratio was greater than at low temperatures, indicating ongoing dehydration and decarboxylation reactions. Consequently, less oxygen is bound in the aromatic compounds formed during HTC and more oxygen is needed to oxidize the products of the HTC reaction. The SUVA approximately doubled with the hydrothermal carbonization from 0.82 to 1.63 L/(mg·m). The UV254 reflects aromatic compounds because its PI-electrons absorb in the UV range [40]. The higher SUVA after hydrothermal treatment suggests the excessive formation of aromatic compounds and melanoidins [21]. Stemann et al. [41] found comparable ratios for COD/DOC and SUVA of 2.8 mg O2/mg C and 1.3 L/(mg·m). Recirculating the liquid phase to the HTC process five times led to a decrease in both parameters to 2.5 mg O2/mg C and 0.7 L/(mg·m). Stemann et al. [41] concluded that recirculation leads to an accumulation of aliphatic, organic acids, which were not detected by UV254, whereas reactive components with a higher molecular weight tend to polymerize.
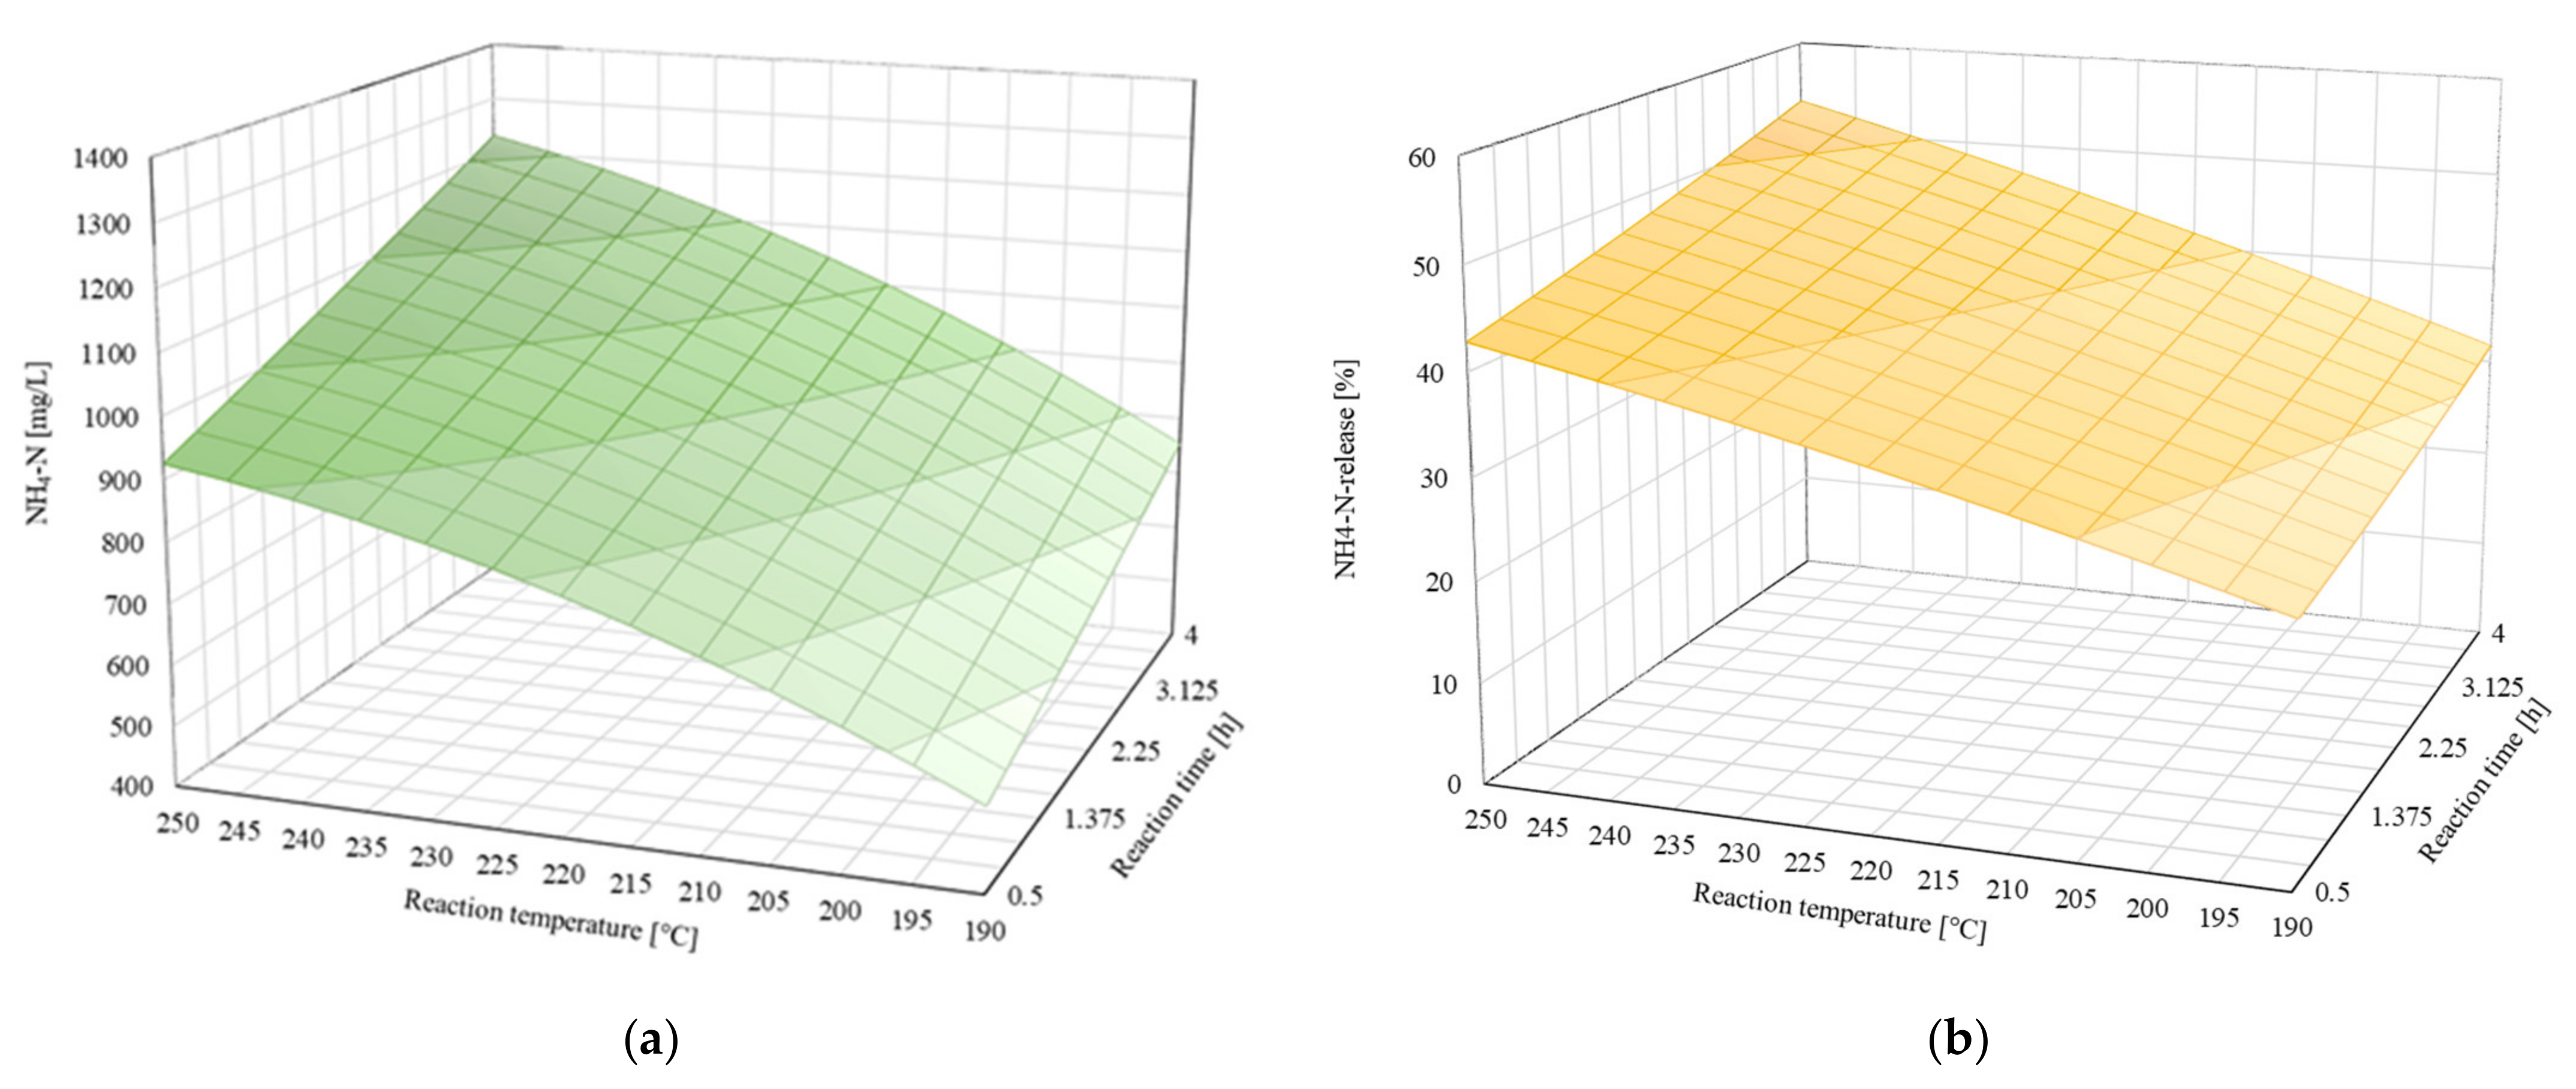
Regarding NH4-N (Figure 3a), opposite trends compared to DOC were observed. Higher temperatures and longer times also led to higher ammonium concentration in the liquid phase. The NH4-N concentration increased from 535 mg/L at 190 °C to 926 mg/L at 250 °C (0.5 h) with a slightly flattening curve with higher temperatures. With an extension of the reaction time up to 4 h, the model illustrates an almost linear increase in the ammonium concentration. The share of NH4-N in TN, referred to as NH4-N-release in % in Figure 3b, was about 26% at the lowest hydrothermal conditions of 190 °C for 0.5 h. When the reaction temperature was increased to 250 °C, about 45% of the total nitrogen was present as NH4-N. Prolonging the reaction time to 4 h led to an increased share of 32% at 190 °C and of 54% at 250 °C. As with NH4-N, higher temperatures and longer reaction times increased the NH4-N-release. The NH4-N concentration and the NH4-N release follow the discussed trend of a higher influence of the reaction time at higher temperatures.
Since for all experiments the concentration of TN in the liquid phase remained relatively consistent at 2254 ± 84 mg/L, lower hydrothermal conditions favor hydrolysis of the solid phase nitrogen, while more intense hydrothermal conditions lead to the decomposition of dissolved nitrogen into lower molecular products with the release of NH4-N [42]. Dissolved organic nitrogen compounds are degraded into NH4-N, for example, as a result of deamination. Sun et al. [37] also used sewage sludge and observed a similar influence of the reaction time at 200 °C, but also discovered a higher increase in NH4-N concentration with an extension of the reaction time from 60 to 90 min at 180 °C by more than 30%. Taking their study and the presented results into account, the reaction time becomes less significant for the nitrogen degradation somewhere between 180 and 190 °C. The share of NH4-N in their study is within approx. 27% at 180 °C for 0.5 h to 51% at 240 °C for 1.5 h and therefore about 15% higher than in our study. Probably the higher nitrogen content of their feedstock of 7.2% (dry basis) in comparison to 5.0% (dry basis) of our feedstock is decisive.
3.4. Impact of the Volatile Solids in Feedstock Sewage Sludge on Higher Heating Value
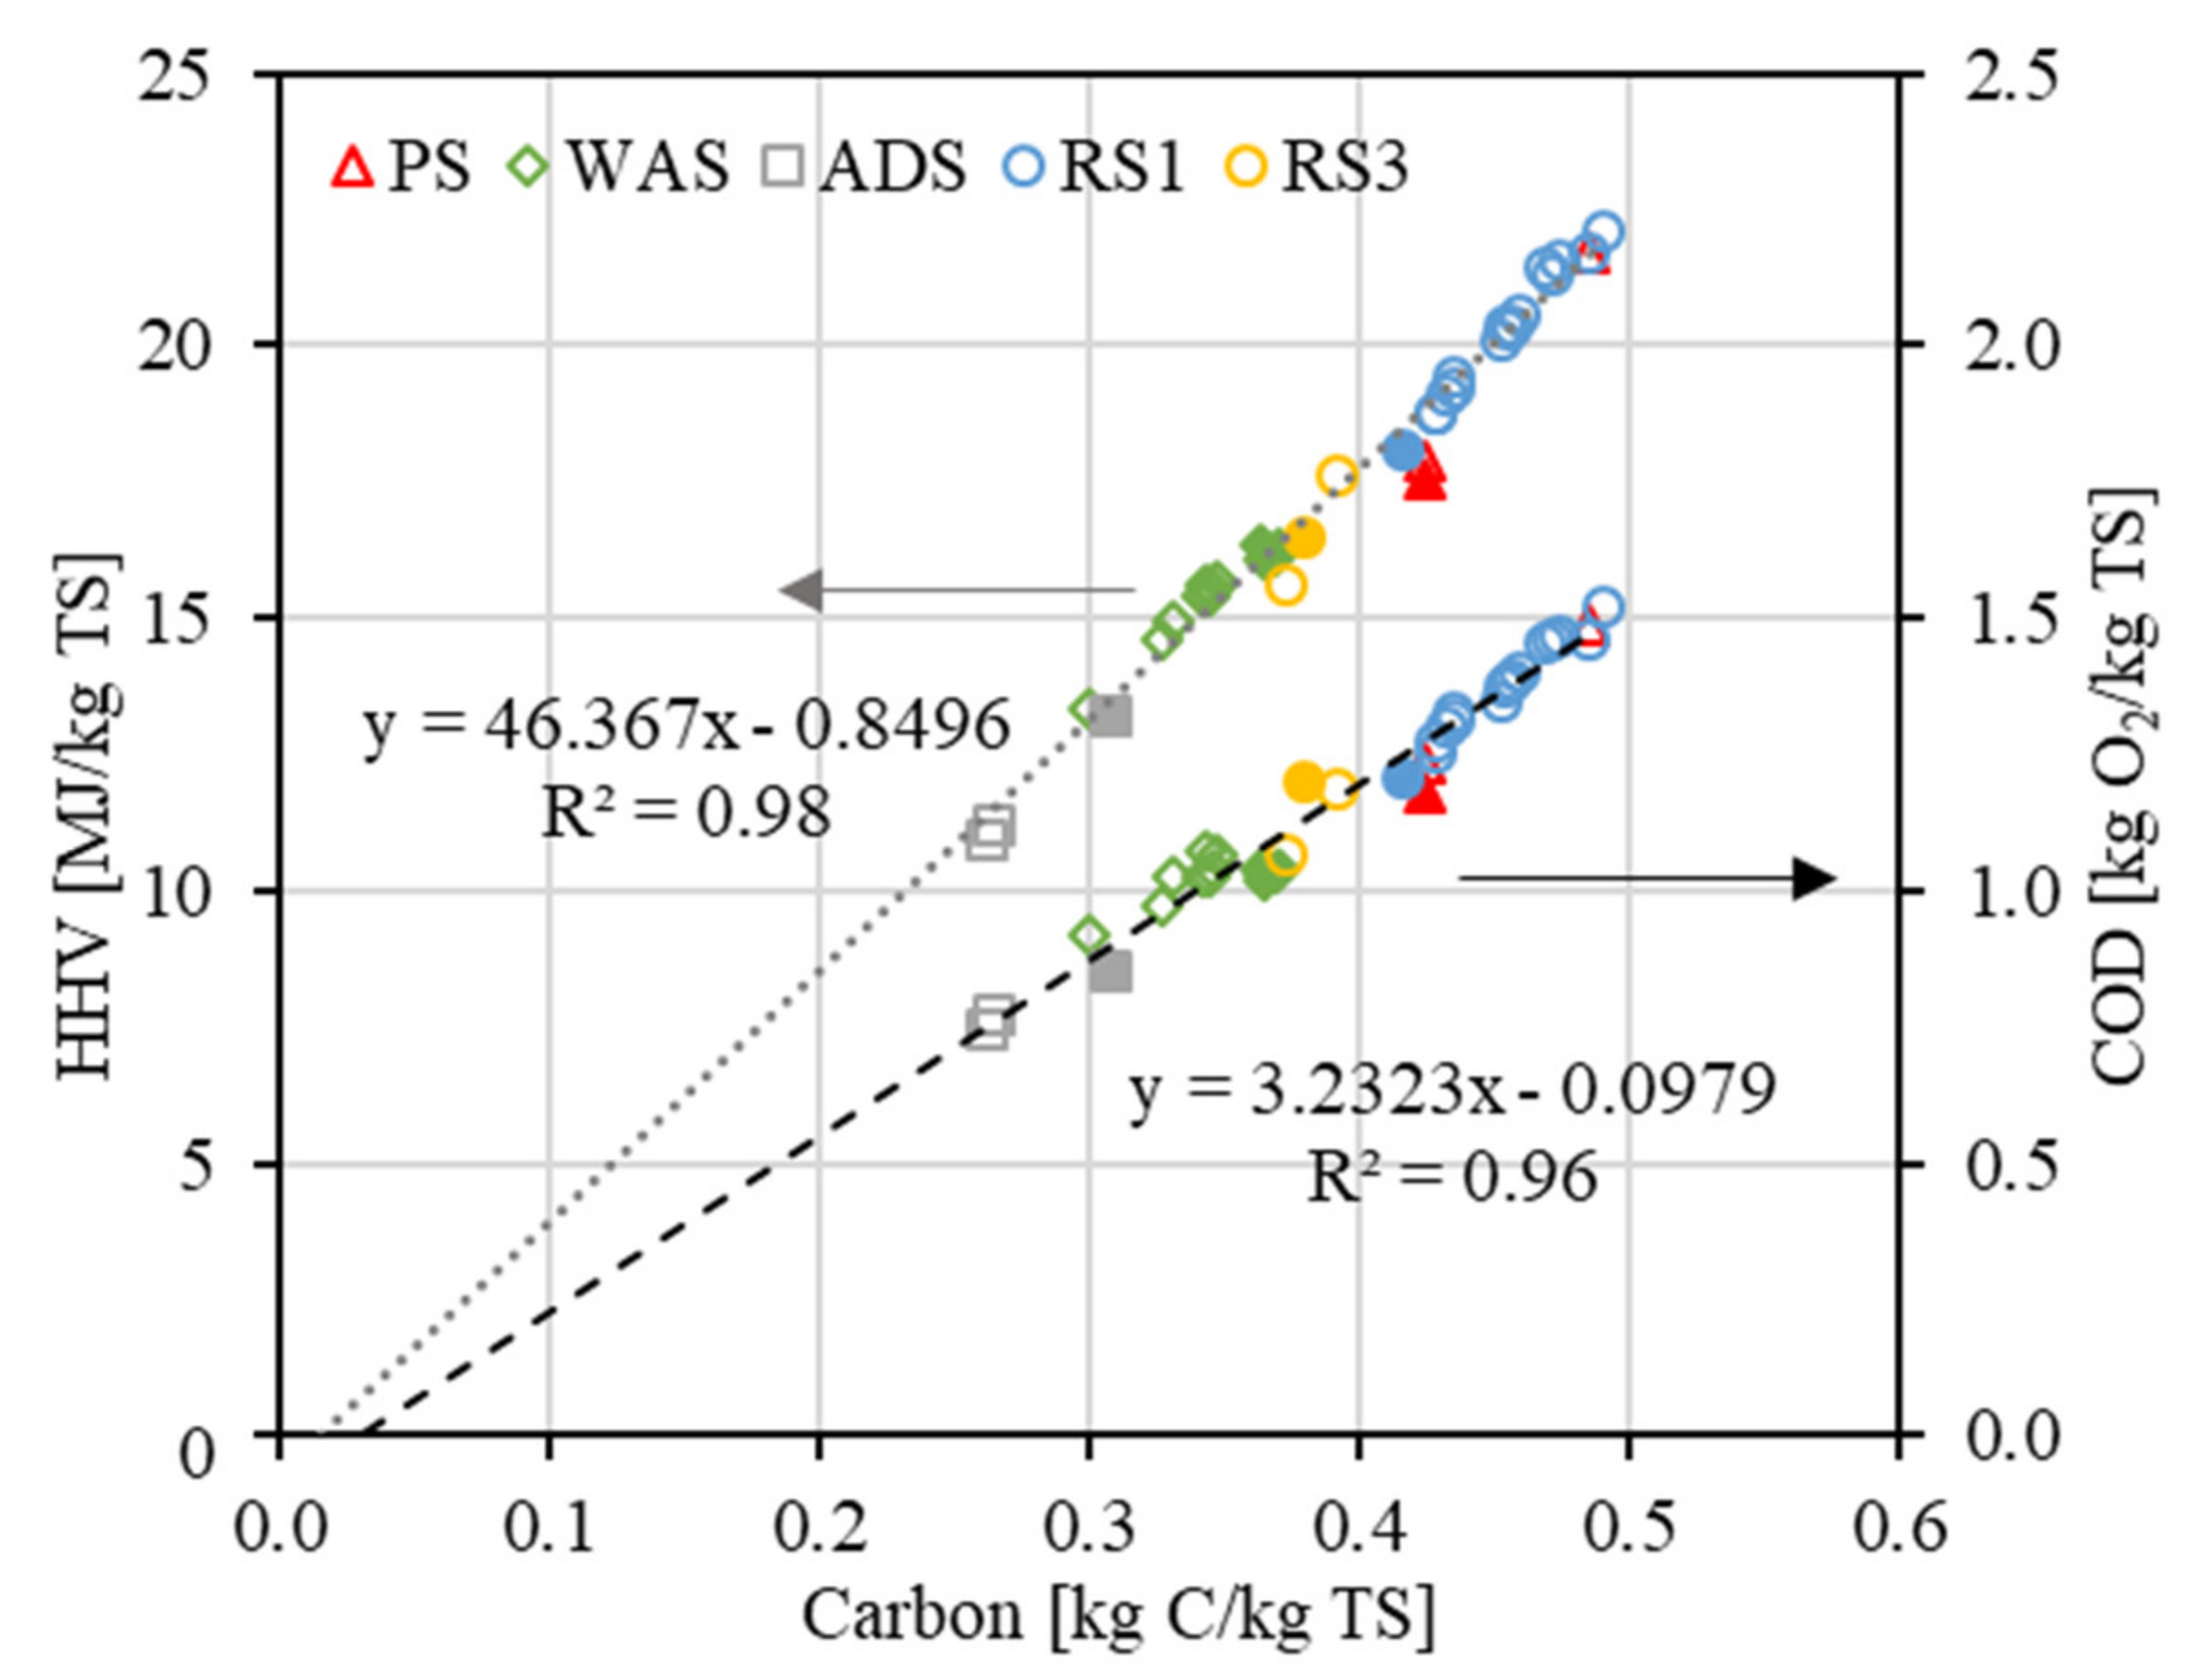
For sewage sludge and its hydrochars, the HHV (in the range of 10.9 to 22.1 MJ/kg TS), the COD (in the range of 0.75 to 1.52 kg O2/kg TS) and the carbon content (in the range of 0.26 to 0.49 kg C/kg TS) strongly correlate with each other (Figure 4). The HHV and COD correlated linearly to carbon content showing high correlation factors R2 = 0.98 and 0.96. These correlations allow only one parameter to be measured and the other parameters to be determined from it, which can be useful in case of limited analytical capabilities. With this in mind, only the HHV was discussed further below. Nonetheless, the relation of COD, HHV and carbon content must be determined for every series of tests [43].
Figure 4 also shows that the HHV and carbon content of some hydrochars were higher than the feedstock (e.g., PS and RS1), whereas for some hydrochars these parameters were lower (DS, WAS) than in feedstock. Hence, the hydrothermal treatment of sewage sludge does not necessarily increase the HHV of hydrochars. Figure 5 depicts the percentage change of the HHV caused by hydrothermal treatment as a function of ash content and thus of volatile solids in the feedstock. At first sight, an increase in the HHV appears to become unlikely with increasing ash content in feedstock. On the one hand, organic compounds are dissolved to a certain degree during HTC due to hydrolysis, resulting in decreasing organics content in the solids and a mass loss. On the other hand, dehydration, decarboxylation and polymerization induce carbonization and therefore a higher HHV. An ash content of around 28% seems to mark a turning point where the two effects were balanced and beyond which the hydrothermal treatment no longer affects HHV positively. Even below 28% ash content, lower temperatures of 180–190 °C often resulted in only a limited elevation. As expected, higher temperatures mostly led to higher HHVs compared to the feedstock due to decarboxylation and dehydration as well as polymerization reactions. The data also suggest that the origin of the sewage sludge and therefore its composition is less relevant for the change in HHV than the ash content of the feedstock since different sewage sludges behave similarly. Studies by Zhao et al. [2], Zheng et al. [44] and our study using WAS all follow the trend described. While Zhao et al. [2] increased the HHV of sewage sludge with 18.8% ash by up to 7% at the highest temperature of 240 °C, we measured no decrease at 250 °C and a decline of −10% at 190 °C for a WAS with 29.0% ash. The WAS used by Zheng et al. [44] had an ash content of 41.2% and their data implicate a drop in heating value of −34% at 280 °C. Kim et al. [45] carbonized ADS with an initial ash content of 26.1% and reached an increase in HHV of up to 18% at 250 °C. In contrast, the hydrothermal treatment of the ADS we used (41.5% ash) reduced the HHV by −18% (at 250 °C) to −20% (at 190 °C). For both types of feedstock (WAS, ADS), the HHV reduces when the ash content is above 20–35%. For their study, Danso-Boateng et al. [46] used PS with minor ash content of 16.0% and increased the HHV by 20% to 22%. The municipal sewage sludge used by Zhang et al. [4] contained 33.1% ash and resulted in a reduction of the HHV of −5% (at 190 °C) to −2% (at 260 °C). Prolonging the reaction time from 1 to 24 h led to a percental change of −2% (190 °C) to 4% (260 °C).
Although varying experimental setups and hydrothermal conditions make it difficult to objectively compare the results of the studies, the data show some coherence among the diverse experiments. With this in mind, it seems reasonable to consider a maximum ash content of the feedstock of 20% to 35%, beyond which an increase in the HHV seems unlikely. This corresponds to a VS of 65–80%. According to these findings, not all sewage sludges are suitable to generate a higher calorific product, by means of HTC.
3.5. Impact of Volatile Solids on Process Water Load
The concentrations of DOC or TOC and NH4-N in process water are related to the VS as well as carbon and nitrogen content of the feedstock sewage sludge. Table 5 summarizes the concentrations of DOC and NH4-N in the process water after hydrothermal treatment at varying reaction intensities for the different sludges. To obtain process water concentration from hydrothermal treatment only, the concentration change resulting from thawing was deducted.
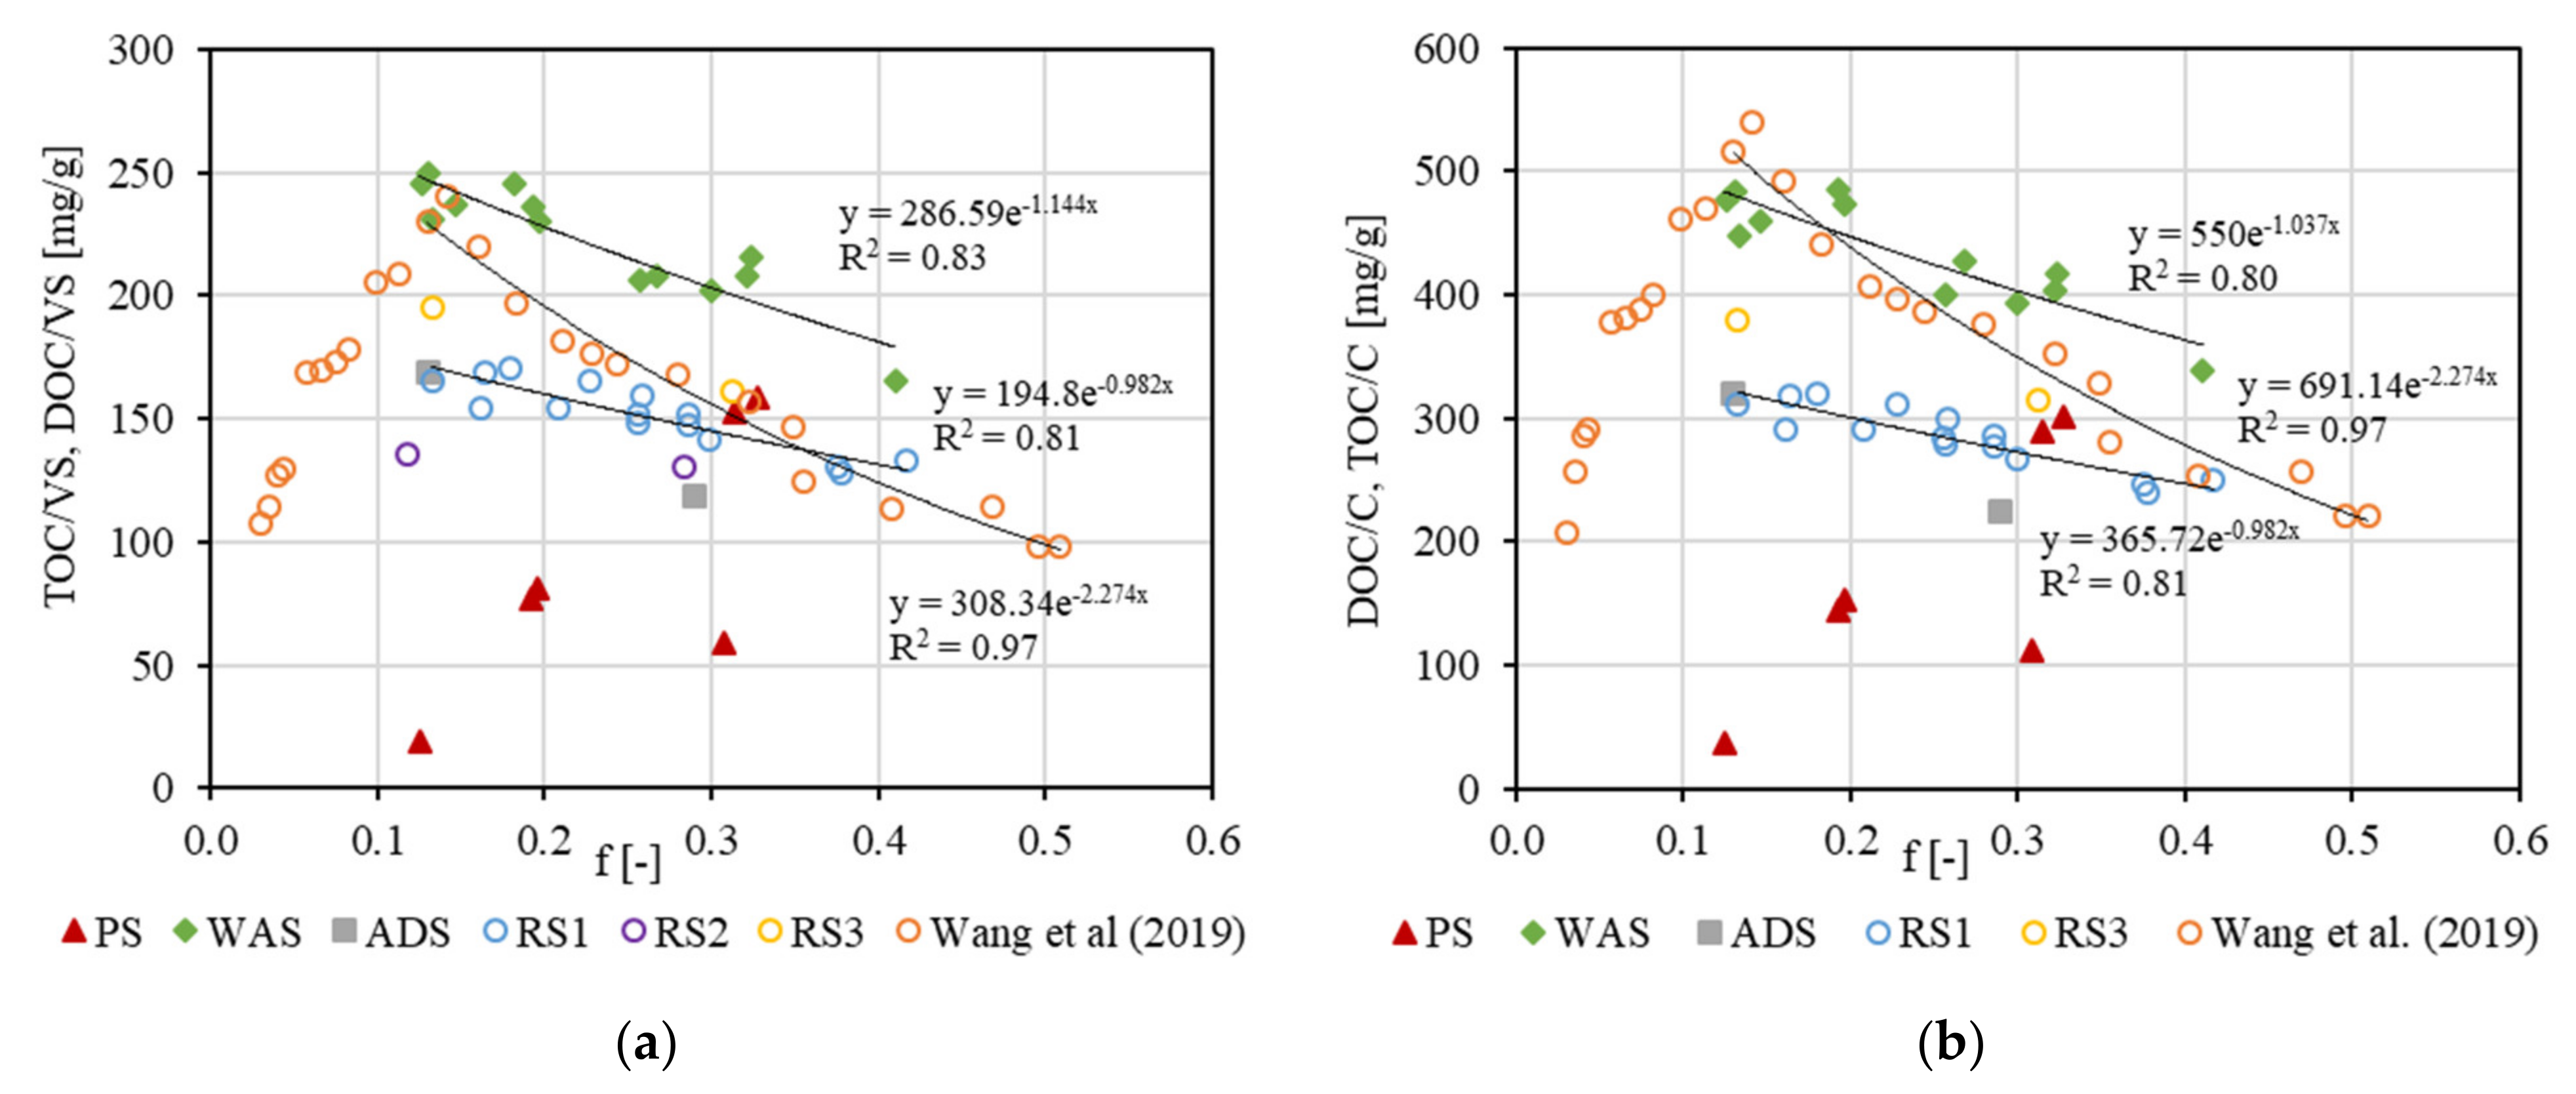
Depending on the reaction intensity, the DOC/VS release ratio in Figure 6a behaved differently for each type of sewage sludge: The hydrothermal carbonization of WAS resulted in a DOC/VS of 250 mg DOC/g VS at a low reaction intensity (f = 0.13) and decreased to 165 mg DOC/g VS at higher temperatures and longer reaction times (f = 0.41). Polymerization reactions, as mentioned above, can lead to an exponential decrease in the VS-specific release with increasing reaction intensity. Despite variations in VS content resulting from the dilution of WAS (see Table 1), the specific release showed no significant deviations. In contrast, Aragón-Briceño et al. [47] detected decreasing process water releases with rising solids loading from 2.5% TS to 17.5% TS and a saturation concentration of organics and ammonium beyond 17.5% TS. Presumably, our method of evaluation and smaller variations in solids loading (3.1% to 9.1%) allow no detailed observation of this effect. The DOC/VS for RS1 decreased from 166 mg DOC/g VS at f = 0.13 to 133 mg DOC/g VS at f = 0.42. Although different pH values and their effects on hydrothermal processes were not considered in the calculation of f, the curve fit is good (R2 = 0.81). A contrary trend was observed for PS, as a low f (0.12) resulted in an organic load of 19 mg DOC/g VS and a high f (0.33) in an organic load of 153 mg DOC/g VS. This may be attributed to the more structured solids in primary sewage sludge, which are further decomposed with increasing reaction intensity. Similar findings with PS under less harsh reaction conditions were obtained by Danso-Boateng et al. [48]. The other sewage sludges contain basically no structured material and a maximum degradation has already been reached at a lower reaction intensity than those studied (f < 0.12). This is supported by data from Wang et al. [24], who investigated the concentration of several parameters in process water, such as TOC, as a function of f using a Chinese raw sewage sludge. They observed higher TOC concentrations up to nearly 21,000 mg/L (f = 0.14) in comparison to our RS1 with DOC = 7703 mg/L (f = 0.13). When taking into account the VS of sewage sludge, their data agreed with our results at a comparable level: starting from 230 mg TOC/g VS at f = 0.13, the TOC/VS ratio was reduced to 133 mg TOC/g VS at f = 0.41. In addition, data of Wang et al. [24] imply a further reduction of the VS-specific TOC release due to the intensified hydrothermal treatment for f > 0.41. The reduction of their TOC/VS ratio was more pronounced than in our experiments, possibly because samples were not filtered at 0.45 µm or analytical methods were different. It is important to mention that the results of Wang et al. [24] limit the extrapolation of the regression lines: the reaction intensity f = 0.14 marks a turning point with the maximum release, indicating the transition between thermal hydrolysis and hydrothermal carbonization.
The trends in the specific release of DOC/TOC relative to organic carbon in the feedstock sewage sludge, denoted as DOC/C and TOC/C in Figure 6b, behaved very similarly to DOC/VS. The specific C releases of WAS and RS1 decreased from 476 mg DOC/g C and 311 mg DOC/g C at f = 0.13 to 339 mg DOC/g C and 250 mg DOC/g C at f = 0.41 (WAS) and f = 0.42 (RS1). The C-specific release can also be interpreted as a percentage of organic solids carbon which was dissolved into the process water. Taking RS1 as an example, hydrolysis at lower reaction intensities released 31% carbon into the process water and polymerization reactions at higher reaction intensities reduced the share of carbon released to 25%. This caused an increasing carbon content and an associated increasing HHV in the hydrochars, as discussed in Section 3.2. Comparing the VS-specific and C-specific release, no major differences of the overall picture can be observed. This suggests that the carbon content is not the only factor affecting the carbon release into the process water and that considering a correlation between the release of carbon in the process water and the carbon in the feedstock is not sufficient. As our analytics provide no detailed insights, further research should be carried out to identify other main drivers for the carbon release resulting from the hydrothermal treatment of sewage sludge.
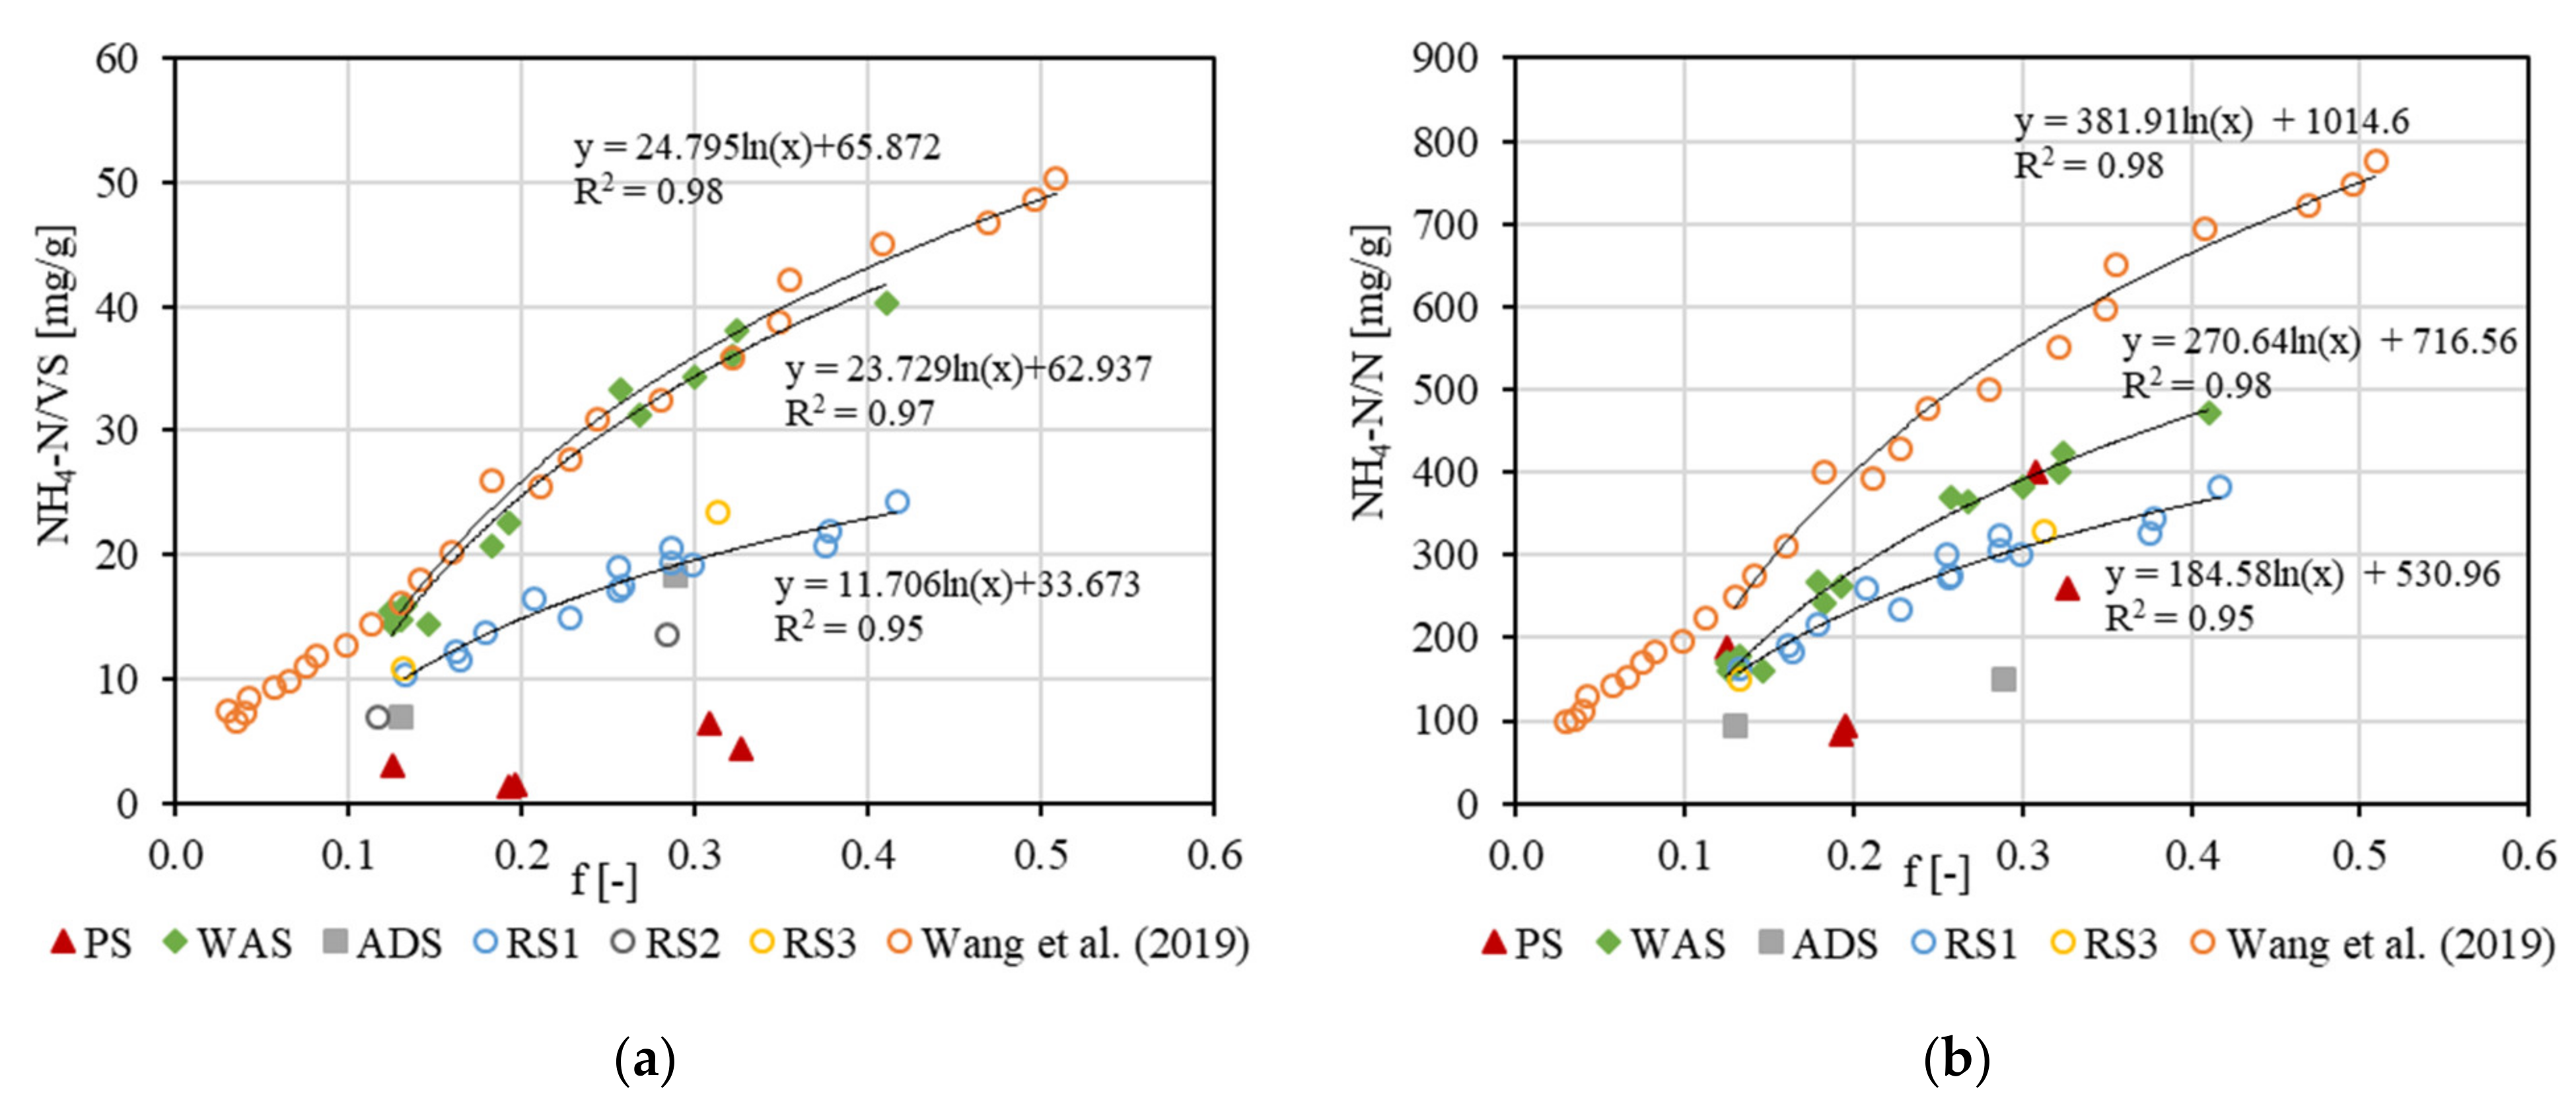
The release of ammonium is also related to the VS and depicted in Figure 7a. Elevating reaction intensity increased the VS-specific release of NH4-N for each sewage sludge. For PS, raising f led to a minor increase in the NH4-N/VS ratio from 3.1 mg NH4-N/g VS at f = 0.12 to 4.3 mg NH4-N/g VS at f = 0.33. The increase in NH4-N/VS as a consequence of a more intense reaction was more evident for WAS, as the ratio elevated from 15 mg NH4-N/g VS at f = 0.13 to 40 mg NH4-N/g VS at f = 0.41. R2 is 0.97 for a logarithmic VS-specific correlation, which seems plausible due to the release being limited by nitrogen in the solids. The intensification of hydrothermal conditions of WAS led to a higher NH4-N concentration by a factor of 2.6, whereas for PS the factor was only 1.4. These observations can be attributed to the different composition of the sewage sludges, as the protein content in WAS is up to 2.3 times higher than in PS in a range of 19–41% and 14–30%, respectively [7,13]. Besides, WAS contains only a few structural materials. As also assumed for DOC release, hydrothermal treatment could break down these smaller molecules to a greater extent and release more ammonium. The raw sewage sludges RS1, RS2 and RS3 are within the range of WAS and PS. Despite variations in the pH of RS1, the results showed a good correlation with R2 = 0.95. The NH4-N/VS of ADS ranged from 7 mg NH4-N/g VS at f = 0.13 to 18 mg NH4-N/g VS at f = 0.29. So, the nitrogenous compounds in the in ADS seem to be degraded to the same extend as for the other sewage sludges, despite the previous biological hydrolysis during anaerobic digestion. The data from Wang et al. [24] showed an almost identical curve than our data of WAS and a more linear behavior for f < 0.14. This suggests that similar behavior is likely for our sludges at lower reaction intensities and that the correlation’s extrapolation is not valid.
The nitrogen-specific release of NH4-N in feedstock sewage sludges, denoted as NH4-N/N in Figure 7b, started with 92–249 mg NH4-N/g N at f = 0.12–0.13. Depending on the sewage sludge, NH4-N was released to different degrees and resulted in 309 mg NH4-N/g N (RS1), 471 mg NH4-N/g N (WAS) and 695 mg NH4-N/g N ([24]) at f ≈ 0.41. This corresponded to a release of 30.9% to 69.5% of the total nitrogen in the sewage sludge as ammonium. Extrapolating the regressions beyond their maximum tested hydrothermal conditions suggests a limit, which is below the theoretical maximum of 1000 mg NH4-N/g N for the sewage sludges investigated in this study. Accordingly, the hydrothermal treatment under the shown hydrothermal conditions did not decompose the entire nitrogen in the feedstock sewage sludge as ammonium. As several other studies consistently indicate no complete breakdown of dissolved nitrogen to ammonium due to hydrothermal carbonization, nitrogen remains as dissolved organic nitrogen on the one hand and in hydrochars on the other hand [17,49]. Comparing the NH4-N/VS and the NH4-N/N, some deviations become apparent. For example, the nitrogen-specific NH4-N-release of PS did not seem to match the VS-specific NH4-N-release in Figure 7a, as the spread of the values measured was larger. A closer look reveals that the percentage spread is identical but is illustrated super elevated in Figure 7b. These fluctuations might be due to the heterogeneous mixture of PS, which could have affected sampling. Nevertheless, the ratio of the NH4-N concentration to the nitrogen in the feedstock PS showed that the degree of release is of the same magnitude. The NH4-N/N accounted for the lower nitrogen in PS and lifted the N-specific release to a comparable level to the other sewage sludges. ADS showed a minorNH4-N/N than the other sewage sludges. During anaerobic digestion, proteins were already hydrolyzed and present as NH4-N in the process water (which were deducted in the graphs). This seems to limit the degradation of nitrogen resulting from hydrothermal treatment, which was not represented in the NH4-N/VS. The lower NH4-N/N illustrate that bonding forms of nitrogen in the feedstock sewage sludge determine the extent of NH4-N release during hydrothermal treatment.
4. Conclusions
The main reaction parameters on the hydrothermal treatment of sewage sludge temperature and time were predominantly described by their linear coefficients in the model fits of the BBD. The results of these model fits suggest that intensifying HTC process conditions favor the higher HHV of the hydrochars and hence coalification. Simultaneous polymerization reactions form additional hydrochars, which led to lower DOC concentrations in the process water. These reactions were accelerated at pH 3.9, but the effect of pH decreased with increasing intensity of hydrothermal conditions. For a technical application, costs and benefits in the particular case must be weighed up, as it results in a trade-off between higher reaction temperatures by additional energy input and additional operating resources by the addition of acids.
Regarding nitrogen, harsher hydrothermal conditions led to an ongoing deamination and the associated increase in NH4-N load in the liquid phase. However, even with the most intense hydrothermal treatment of 250 °C for 4 h, a fraction of 46% remained as dissolved organic nitrogen. The high carbon and nitrogen concentrations in the process water permit no direct discharge of the process water and require extensive purification. Consistently, the treatment of the process water, the aim of the hydrochars application and the hydrothermal conditions must be adjusted to one another. This adjustment of the process steps with another requires an understanding of the level of process water load, which was shown to be mainly affected by VS as well as carbon and nitrogen content. The specific C and N release illustrated enables the estimation of process water load as a function of the type of sewage sludge and the hydrothermal conditions. This can be a useful tool for the technical application of HTC for sewage sludge treatment within the framework of a holistic management of the produced residues. As an example, the anaerobic digestion of process water DOC allows for the recovery of energy, which would not necessarily require low DOC concentrations in the liquid. However, no conclusions about the biodegradability can be drawn from the measurement of organic concentration alone. In order to remove ammonium, high ammonium concentrations favor stripping or, since phosphorus concentrations are also high, MAP precipitation. A possible alternative could be biological nitrogen removal. In any case, the high concentration of remaining dissolved organic nitrogen has to be mineralized in order to be eliminated from process water, e.g., by nitrification and denitrification. The development of adequate solutions is the subject of current and future research.
Author Contributions
Conceptualization, T.B. and M.E.; methodology, T.B.; formal analysis, T.B.; investigation, T.B.; data curation, T.B.; writing—original draft preparation, T.B.; writing—review and editing, M.E.; visualization, T.B.; supervision, M.E.; project administration, M.E.; funding acquisition, M.E. All authors have read and agreed to the published version of the manuscript.
Funding
This research was funded by the German Federal Ministry of Education and Research (BMBF) within the project “IntenKS”, grant number 02WCL1470A. We acknowledge support by the Deutsche Forschungsgemeinschaft (DFG—German Research Foundation) and the Open Access Publishing Fund of Technical University of Darmstadt.
Institutional Review Board Statement
This study did not involve any humans or animals, therefore this statement is excluded.
Informed Consent Statement
This study did not involve any humans or animals, therefore this statement is excluded.
Data Availability Statement
The data presented in this study are available on request from the corresponding author.
Acknowledgments
The authors gratefully thank L. Hennemann, K. Pilatus, L. Schreiber and J. Schäfer for conducting parts of the experiments.
Conflicts of Interest
The authors declare no conflict of interest.
Appendix A

Table A1.
ANOVA for the model of HHV. DF: degrees of freedom, SS: sum of squares, MS: mean squares.
| Source | DF | Sequential SS | Adjusted SS | Adjusted MS | F-Value | p-Value |
|---|---|---|---|---|---|---|
| Model | 9 | 16,817,438 | 16,817,438 | 1,868,604 | 16.38 | 0.003 |
| Linear | 3 | 16,545,650 | 16,545,650 | 5,515,217 | 48.33 | 0.000 |
| T (Temperature, °C) | 1 | 14,284,513 | 14,284,513 | 14,284,513 | 125.18 | 0.000 |
| t (time, h) | 1 | 1,168,156 | 1,168,156 | 1,168,156 | 10.24 | 0.024 |
| pH (pH-value, -) | 1 | 1,092,981 | 1,092,981 | 1,092,981 | 9.58 | 0.027 |
| Quadratic | 3 | 38,745 | 38,745 | 12,915 | 0.11 | 0.949 |
| T2 | 1 | 15 | 218 | 218 | 0 | 0.967 |
| t2 | 1 | 33,345 | 35,235 | 35,235 | 0.31 | 0.602 |
| pH2 | 1 | 5384 | 5384 | 5384 | 0.05 | 0.837 |
| 2-Way Interactions | 3 | 233,044 | 233,044 | 77,681 | 0.68 | 0.601 |
| T·t | 1 | 66,178 | 66,178 | 66,178 | 0.58 | 0.481 |
| T·pH | 1 | 153,468 | 153,468 | 153,468 | 1.34 | 0.299 |
| t·pH | 1 | 13,398 | 13,398 | 13,398 | 0.12 | 0.746 |
| Error | 5 | 570,565 | 570,565 | 114,113 | ||
| Lack of fit | 3 | 535,270 | 535,270 | 178,423 | 10.11 | 0.091 |
| Pure error | 2 | 35,296 | 35,296 | 17,648 | ||
| Total | 14 | 17,388,003 |
Table A2.
ANOVA for the model of DOC. DF: degrees of freedom, SS: sum of squares, MS: mean squares.
| Source | DF | Sequential SS | Adjusted SS | Adjusted MS | F-Value | p-Value |
|---|---|---|---|---|---|---|
| Model | 9 | 5,431,550 | 5,431,550 | 603,506 | 13.25 | 0.005 |
| Linear | 3 | 4,789,919 | 4,789,919 | 1,596,640 | 35.06 | 0.001 |
| T (Temperature, °C) | 1 | 4,343,878 | 4,343,878 | 4,343,878 | 95.38 | 0.000 |
| t (time, h) | 1 | 161,028 | 161,028 | 161,028 | 3.54 | 0.119 |
| pH (pH-value, -) | 1 | 285,012 | 285,013 | 285,013 | 6.26 | 0.054 |
| Quadratic | 3 | 443,294 | 443,294 | 147,765 | 3.24 | 0.119 |
| T2 | 1 | 210,109 | 198,164 | 198,164 | 4.35 | 0.091 |
| t2 | 1 | 172,770 | 156,433 | 156,433 | 3.43 | 0.123 |
| pH2 | 1 | 60,416 | 60,416 | 60,416 | 1.33 | 0.302 |
| 2-Way Interactions | 3 | 198,338 | 198,338 | 66,113 | 1.45 | 0.333 |
| T·t | 1 | 105,625 | 105,625 | 105,625 | 2.32 | 0.188 |
| T·pH | 1 | 66,306 | 66,306 | 66,306 | 1.46 | 0.282 |
| t·pH | 1 | 26,406 | 26,406 | 26,406 | 0.58 | 0.481 |
| Error | 5 | 227,723 | 227,723 | 45,545 | ||
| Lack of fit | 3 | 80,706 | 80,706 | 26,902 | 0.37 | 0.789 |
| Pure error | 2 | 147,017 | 147,017 | 73,508 | ||
| Total | 14 | 5,659,273 |
Table A3.
ANOVA for the model of NH4-N. DF: degrees of freedom, SS: sum of squares, MS: mean squares.
Table A3.
ANOVA for the model of NH4-N. DF: degrees of freedom, SS: sum of squares, MS: mean squares.
| Source | DF | Sequential SS | Adjusted SS | Adjusted MS | F-Value | p-Value |
|---|---|---|---|---|---|---|
| Model | 9 | 492,059 | 492,059 | 54,673 | 62.54 | 0.000 |
| Linear | 3 | 475,817 | 475,817 | 158,606 | 181.41 | 0.000 |
| T (Temperature, °C) | 1 | 394,938 | 394,938 | 394,938 | 451.73 | 0.000 |
| t (time, h) | 1 | 79,501 | 79,501 | 79,501 | 90.93 | 0.000 |
| pH (pH-value, -) | 1 | 1378 | 1378 | 1378 | 1.58 | 0.265 |
| Quadratic | 3 | 10,266 | 10,266 | 3422 | 3.91 | 0.088 |
| T2 | 1 | 9891 | 9896 | 9896 | 11.32 | 0.02 |
| t2 | 1 | 98 | 74 | 74 | 0.08 | 0.783 |
| pH2 | 1 | 276 | 276 | 276 | 0.32 | 0.598 |
| 2-Way Interactions | 3 | 5977 | 5977 | 1992 | 2.28 | 0.197 |
| T·t | 1 | 1914 | 1914 | 1914 | 2.19 | 0.199 |
| T·pH | 1 | 156 | 156 | 156 | 0.18 | 0.69 |
| t·pH | 1 | 3906 | 3906 | 3906 | 4.47 | 0.088 |
| Error | 5 | 4371 | 4371 | 874 | ||
| Lack of fit | 3 | 417 | 417 | 139 | 0.07 | 0.971 |
| Pure error | 2 | 3954 | 3954 | 1977 | ||
| Total | 14 | 496,431 |
Table A4.
ANOVA for the model of NH4-N/TN. DF: degrees of freedom, SS: sum of squares, MS: mean squares.
Table A4.
ANOVA for the model of NH4-N/TN. DF: degrees of freedom, SS: sum of squares, MS: mean squares.
| Source | DF | Sequential SS | Adjusted SS | Adjusted MS | F-Value | p-Value |
|---|---|---|---|---|---|---|
| Model | 9 | 965,646 | 965,646 | 107,294 | 74.06 | 0.000 |
| Linear | 3 | 955,835 | 955,835 | 318,612 | 219.92 | 0.000 |
| T (Temperature, °C) | 1 | 823,866 | 823,866 | 823,866 | 568.66 | 0.000 |
| t (time, h) | 1 | 112,038 | 112,038 | 112,038 | 77.33 | 0.000 |
| pH (pH-value, -) | 1 | 19,931 | 19,931 | 19,931 | 13.76 | 0.014 |
| Quadratic | 3 | 4239 | 4239 | 1413 | 0.98 | 0.474 |
| T2 | 1 | 2707 | 2272 | 2272 | 1.57 | 0.266 |
| t2 | 1 | 0.511 | 0.625 | 0.625 | 0.43 | 0.54 |
| pH2 | 1 | 1.022 | 1.022 | 1.022 | 0.71 | 0.439 |
| 2-Way Interactions | 3 | 5571 | 5571 | 1857 | 1.28 | 0.376 |
| T·t | 1 | 3801 | 3801 | 3801 | 2.62 | 0.166 |
| T·pH | 1 | 0.149 | 0.149 | 0.149 | 0.1 | 0.762 |
| t·pH | 1 | 1622 | 1622 | 1622 | 1.12 | 0.338 |
| Error | 5 | 7244 | 7244 | 1449 | ||
| Lack of fit | 3 | 6296 | 6296 | 2099 | 4.43 | 0.19 |
| Pure error | 2 | 0.948 | 0.948 | 0.474 | ||
| Total | 14 | 972,890 |
References
- Zhai, Y.; Peng, C.; Xu, B.; Wang, T.; Li, C.; Zeng, G.; Zhu, Y. Hydrothermal carbonisation of sewage sludge for char production with different waste biomass: Effects of reaction temperature and energy recycling. Energy 2017, 127, 167–174. [Google Scholar] [CrossRef]
- Zhao, P.; Shen, Y.; Ge, S.; Yoshikawa, K. Energy recycling from sewage sludge by producing solid biofuel with hydrothermal carbonization. Energy Convers. Manag. 2014, 78, 815–821. [Google Scholar] [CrossRef] [Green Version]
- Danso-Boateng, E.; Holdrich, R.G.; Martin, S.J.; Shama, G.; Wheatley, A.D. Process energetics for the hydrothermal carbonisation of human faecal wastes. Energy Convers. Manag. 2015, 105, 1115–1124. [Google Scholar] [CrossRef] [Green Version]
- Zhang, J.-H.; Lin, Q.-M.; Zhao, X.-R. The Hydrochar Characters of Municipal Sewage Sludge Under Different Hydrothermal Temperatures and Durations. J. Integr. Agric. 2014, 13, 471–482. [Google Scholar] [CrossRef]
- Paneque, M.; La Rosa, J.M.; de Kern, J.; Reza, M.T.; Knicker, H. Hydrothermal carbonization and pyrolysis of sewage sludges: What happen to carbon and nitrogen? J. Anal. Appl. Pyrolysis 2017, 128, 314–323. [Google Scholar] [CrossRef] [Green Version]
- Bergius, F. Die Anwendung Hoher Drücke bei Chemischen Vorgängen und eine Nachbildung des Entstehungsprozesses der Steinkohle; Wilhelm Knapp: Halle, Germany, 1913. [Google Scholar]
- Wang, L.; Chang, Y.; Li, A. Hydrothermal carbonization for energy-efficient processing of sewage sludge: A review. Renew. Sustain. Energy Rev. 2019, 108, 423–440. [Google Scholar] [CrossRef]
- Escala, M.; Zumbühl, T.; Koller, C.; Junge, R.; Krebs, R. Hydrothermal Carbonization as an Energy-Efficient Alternative to Established Drying Technologies for Sewage Sludge: A Feasibility Study on a Laboratory Scale. Energy Fuels 2013, 27, 454–460. [Google Scholar] [CrossRef]
- Wang, L.; Li, A. Hydrothermal treatment coupled with mechanical expression at increased temperature for excess sludge dewatering: The dewatering performance and the characteristics of products. Water Res. 2015, 68, 291–303. [Google Scholar] [CrossRef] [PubMed]
- Aragón-Briceño, C.; Ross, A.B.; Camargo-Valero, M.A. Evaluation and comparison of product yields and bio-methane potential in sewage digestate following hydrothermal treatment. Appl. Energy 2017, 208, 1357–1369. [Google Scholar] [CrossRef]
- Weiner, B.; Breulmann, M.; Wedwitschka, H.; Fühner, C.; Kopinke, F.-D. Wet Oxidation of Process Waters from the Hydrothermal Carbonization of Sewage Sludge. Chem. Ing. Tech. 2018, 90, 872–880. [Google Scholar] [CrossRef]
- Holliday, R.L.; King, J.W.; List, G.R. Hydrolysis of Vegetable Oils in Sub- and Supercritical Water. Ind. Eng. Chem. Res. 1997, 36, 932–935. [Google Scholar] [CrossRef]
- Wilson, C.A.; Novak, J.T. Hydrolysis of macromolecular components of primary and secondary wastewater sludge by thermal hydrolytic pretreatment. Water Res. 2009, 43, 4489–4498. [Google Scholar] [CrossRef] [PubMed]
- Asghari, F.S.; Yoshida, H. Acid-Catalyzed Production of 5-Hydroxymethyl Furfural from d -Fructose in Subcritical Water. Ind. Eng. Chem. Res. 2006, 45, 2163–2173. [Google Scholar] [CrossRef]
- Reza, M.T.; Becker, W.; Sachsenheimer, K.; Mumme, J. Hydrothermal carbonization (HTC): Near infrared spectroscopy and partial least-squares regression for determination of selective components in HTC solid and liquid products derived from maize silage. Bioresour. Technol. 2014, 161, 91–101. [Google Scholar] [CrossRef] [PubMed]
- Klingler, D.; Berg, J.; Vogel, H. Hydrothermal reactions of alanine and glycine in sub- and supercritical water. J. Supercrit. Fluids 2007, 43, 112–119. [Google Scholar] [CrossRef]
- Dote, Y.; Inoue, S.; Ogi, T.; Yokoyama, S. Distribution of Nitrogen to Oil Products from Liquefaction of Amino Acids. Bioresour. Technol. 1998, 64, 157–160. [Google Scholar] [CrossRef]
- Toor, S.S.; Rosendahl, L.; Rudolf, A. Hydrothermal liquefaction of biomass: A review of subcritical water technologies. Energy 2011, 36, 2328–2342. [Google Scholar] [CrossRef]
- Zhuang, X.; Huang, Y.; Song, Y.; Zhan, H.; Yin, X.; Wu, C. The transformation pathways of nitrogen in sewage sludge during hydrothermal treatment. Bioresour. Technol. 2017, 245, 463–470. [Google Scholar] [CrossRef]
- Chen, H.; Rao, Y.; Cao, L.; Shi, Y.; Hao, S.; Luo, G.; Zhang, S. Hydrothermal conversion of sewage sludge: Focusing on the characterization of liquid products and their methane yields. Chem. Eng. J. 2019, 357, 367–375. [Google Scholar] [CrossRef]
- Dwyer, J.; Starrenburg, D.; Tait, S.; Barr, K.; Batstone, D.J.; Lant, P. Decreasing activated sludge thermal hydrolysis temperature reduces product colour, without decreasing degradability. Water Res. 2008, 42, 4699–4709. [Google Scholar] [CrossRef]
- Fan, Y.; Hornung, U.; Dahmen, N.; Kruse, A. Hydrothermal liquefaction of protein-containing biomass: Study of model compounds for Maillard reactions. Biomass Convers. Biorefin. 2018, 8, 909–923. [Google Scholar] [CrossRef]
- Minowa, T.; Inoue, S.; Hanaoka, T.; Matsumura, Y. Hydrothermal Reaction of Glucose and Glycine as Model Compounds of Biomass. J. Jpn. Inst. Energy 2003, 83, 794–798. [Google Scholar] [CrossRef]
- Wang, L.; Chang, Y.; Liu, Q. Fate and distribution of nutrients and heavy metals during hydrothermal carbonization of sewage sludge with implication to land application. J. Clean. Prod. 2019, 225, 972–983. [Google Scholar] [CrossRef]
- Sun, X.H.; Sumida, H.; Yoshikawa, K. Effects of Liquid Fertilizer Produced from Sewage Sludge by the Hydrothermal Process on the Growth of Komatsuna. Br. J. Environ. Clim. Chang. 2014, 4, 261–278. [Google Scholar] [CrossRef]
- Ruyter, H.P. Coalification model. Fuel 1982, 61, 1182–1187. [Google Scholar] [CrossRef]
- Dunne, D.J.; Agnew, J.B. Thermal Upgrading of Low-Grade, Low-Rank South Australia Coal. Energy Sources. 1992, 14, 169–181. [Google Scholar] [CrossRef]
- Montgomery, D.C. Design and Analysis of Experiments, 5th ed.; John Wiley & Sons, INC.: New York, NY, USA, 2001. [Google Scholar]
- Bas, D.; Boyaci, I.H. Modeling and optimization I: Usability of response surface methodology. J. Food Eng. 2007, 78, 836–845. [Google Scholar] [CrossRef]
- Sevilla, M.; Fuertes, A.B. The production of carbon materials by hydrothermal carbonization of cellulose. Carbon 2009, 47, 2281–2289. [Google Scholar] [CrossRef] [Green Version]
- Peterson, A.A.; Vogel, F.; Lachance, R.P.; Fröling, M.; Antal, M.J.; Tester, J.W. Thermochemical biofuel production in hydrothermal media: A review of sub- and supercritical water technologies. Energy Environ. Sci. 2008, 1, 32–65. [Google Scholar] [CrossRef]
- Watanabe, M.; Aizawa, Y.; Iida, T.; Aida, T.M.; Levy, C.; Sue, K.; Inomata, H. Glucose reactions with acid and base catalysts in hot compressed water at 473 K. Carbohydr. Res. 2005, 340, 1925–1930. [Google Scholar] [CrossRef] [PubMed]
- Titirici, M.M.; Thomas, A.; Yu, S.-H.; Müller, J.-O.; Antonietti, M. A Direct Synthesis of Mesoporous Carbons with Bicontinuous Pore Morphology from Crude Plant Material by Hydrothermal Carbonization. Chem. Mater. 2007, 19, 4205–4212. [Google Scholar] [CrossRef]
- Titirici, M.-M.; Thomas, A.; Antonietti, M. Back in the black: Hydrothermal carbonization of plant material as an efficient chemical process to treat the CO2 problem? New. J. Chem. 2007, 31, 787. [Google Scholar] [CrossRef]
- Akhtar, J.; Amin, N.A.S. A review on process conditions for optimum bio-oil yield in hydrothermal liquefaction of biomass. Renew. Sustain. Energy Rev. 2011, 15, 1615–1624. [Google Scholar] [CrossRef]
- Shanableh, A. Production of useful Organic Matter from Sludge using Hydrothermal Treatment. Water Res. 2000, 34, 945–951. [Google Scholar] [CrossRef]
- Sun, X.H.; Sumida, H.; Yoshikawa, K. Effects of Hydrothermal Process on the Nutrient Release of Sewage Sludge. Int. J. Waste Resour. 2013, 3, 2. [Google Scholar]
- Rogalinski, T.; Liu, K.; Albrecht, T.; Brunner, G. Hydrolysis kinetics of biopolymers in subcritical water. J. Supercrit. Fluids 2008, 46, 335–341. [Google Scholar] [CrossRef]
- Zou, S.; Wu, Y.; Yang, M.; Li, C.; Tong, J. Thermochemical Catalytic Liquefaction of the Marine Microalgae Dunaliella tertiolecta and Characterization of Bio-oils. Energy Fuels 2009, 23, 3753–3758. [Google Scholar] [CrossRef]
- Abbt-Braun, G.; Frimmel, F.H. Basic Characterization of Norwegian NOM Samples-Similarities and Differences. Environ. Int. 1999, 25, 161–180. [Google Scholar] [CrossRef]
- Stemann, J.; Putschew, A.; Ziegler, F. Hydrothermal carbonization: Process water characterization and effects of water recirculation. Bioresour. Technol. 2013, 143, 139–146. [Google Scholar] [CrossRef]
- Yin, F.; Chen, H.; Xu, G.; Wang, G.; Xu, Y. A detailed kinetic model for the hydrothermal decomposition process of sewage sludge. Bioresour. Technol. 2015, 198, 351–357. [Google Scholar] [CrossRef]
- Heidrich, E.S.; Curtis, T.P.; Dolfing, J. Determination of the Internal Chemical Energy of Wastewater. Environ. Sci. Technol. 2011, 45, 827–832. [Google Scholar] [CrossRef] [PubMed]
- Zheng, C.; Ma, X.; Yao, Z.; Chen, X. The properties and combustion behaviors of hydrochars derived from co-hydrothermal carbonization of sewage sludge and food waste. Bioresour. Technol. 2019, 285, 121347. [Google Scholar] [CrossRef] [PubMed]
- Kim, D.; Lee, K.; Park, K.Y. Hydrothermal carbonization of anaerobically digested sludge for solid fuel production and energy recovery. Fuel 2014, 130, 120–125. [Google Scholar] [CrossRef]
- Danso-Boateng, E.; Holdrich, R.G.; Shama, G.; Wheatley, A.D.; Sohail, M. Kinetics of faecal biomass hydrothermal carbonisation for hydrochar production. Appl. Energy 2013, 111, 351–357. [Google Scholar] [CrossRef]
- Aragón-Briceño, C.I.; Grasham, O.; Ross, A.B.; Dupont, V.; Valero-Camargo, M.A. Hydrothermal carbonization of sewage digestate at wastewater treatment works: Influence of solid loading on characteristics of hydrochar, process water and plant energetics. Renew. Energy 2020, 157, 959–973. [Google Scholar] [CrossRef]
- Danso-Boateng, E.; Shama, G.; Wheatley, A.D.; Martin, S.J.; Hold, R.G. Hydrothermal carbonisation of sewage sludge: Effect of process conditions on product characteristics and methane production. Bioresour. Technol. 2015, 177, 318–327. [Google Scholar] [CrossRef] [Green Version]
- Inoue, S.; Sawayama, S.; Dote, Y.; Ogi, T. Behaviour of Nitrogen during Liquefactoin of Dewatered Sewage Sludge. Biomass Bioenergy 1997, 12, 473–475. [Google Scholar] [CrossRef]
Figure 1.
Response surface plots of (a) the HHV at pH = 6.1 and (b) the effect of different pH values on the HHV.
Figure 1.
Response surface plots of (a) the HHV at pH = 6.1 and (b) the effect of different pH values on the HHV.

Figure 2.
Response surface plots for (a) DOC at pH = 6.1 and (b) the effect of different pH on the DOC concentration.
Figure 2.
Response surface plots for (a) DOC at pH = 6.1 and (b) the effect of different pH on the DOC concentration.

Figure 3.
Response surface plots for (a) NH4-N at pH = 6.1 and (b) NH4-N release at pH = 6.1.

Figure 4.
Relation between the HHV and the carbon content of all sewage sludges investigated (filled icons) and their hydrochars (framed icons) resulting from HTC.
Figure 4.
Relation between the HHV and the carbon content of all sewage sludges investigated (filled icons) and their hydrochars (framed icons) resulting from HTC.

Figure 5.
Correlation of the ash content of the feedstock and the change of HHV calculated by (HHVhydrochar-HHVfeedstock)/HHVhydrochar·100. Data adapted from: Danso-Boateng et al. [46]: PS, 190 °C, 200 °C, 4 h; Zhang et al. [4]: 190 °C, 260 °C, 1 h; Zhao et al. [2]: WAS, 180 °C, 200 °C, 220 °C, 240 °C, 0.25 h, 0.5 h, 0.45 h; Zheng et al. [44]: WAS, 180 °C, 230 °C, 280 °C, 1 h; Kim et al. [45]: ADS 180 °C, 200 °C, 220 °C, 250 °C, 0.5 h; this study: see Table 1, 190 °C, 220 °C, 250 °C at various reaction times.

Figure 6.
Curves of the ratio (a) DOC/VS (TOC/VS: data adapted from Wang et al. [24]) and (b) DOC/C (TOC/C: data adapted from Wang et al. [24]) with an increasing reaction intensity during the hydrothermal treatment of various sewage sludges.

Figure 7.
Curves of the ratio (a) NH4-N/VS and (b) NH4-N/N with increasing reaction intensity during hydrothermal treatment of various sewage sludges. Data adapted from Wang et al. [24].
Figure 7.
Curves of the ratio (a) NH4-N/VS and (b) NH4-N/N with increasing reaction intensity during hydrothermal treatment of various sewage sludges. Data adapted from Wang et al. [24].

Table 1.
Overview of the tested sewage sludges. The spread of the measuring values was evaluated using the mean value and the deviation of each measured value to the mean value. The maximum deviations are ±7.1% for TS, ±8.6% for TS, ±0.7% for C, ±2.2% for H, ±2.1% for N, ±0.8% for COD and ±1.5% for HHV.
| Tested Sewage Sludges | TS % | VS % | C % | H % | N % | HHV MJ/kg TS | COD g O2/kg TS |
|---|---|---|---|---|---|---|---|
| WWTP A | |||||||
| Raw sewage sludge 1 (RS1) | 5.9 | 4.6 | 41.6 | 5.9 | 5.0 | 18.0 | 1201 |
| WWTP B | |||||||
| Primary sewage sludge (PS) | 4.5 | 3.7 | 42.5 | 6.4 | 1.3 | 17.5 | 1177 |
| Waste activated sludge (WAS) | 9.2 | 6.6 | 36.9 | 6.0 | 6.5 | 16.2 | 1026 |
| 2nd batch WAS | 9.1 | 6.8 | 36.7 | 5.7 | 6.4 | 16.1 | 1022 |
| WAS diluted 2.33:3 w/w | 7.1 | 5.1 | 36.4 | 5.8 | 6.4 | 16.3 | 1034 |
| WAS diluted 1.67:3 w/w | 5.1 | 3.6 | 37.0 | 5.5 | 6.5 | 16.3 | 1035 |
| WAS diluted 1:3 w/w | 3.1 | 2.2 | 36.6 | 5.4 | 6.4 | 16.1 | 1015 |
| Raw sewage sludge 2 (RS2) | 6.6 | 5.0 | - | - | - | - | - |
| Raw sewage sludge 3 (RS3) | 7.9 | 5.9 | 38.1 | 5.8 | 5.3 | 16.4 | 1197 |
| Anaerobically digested sewage sludge (ADS) | 4.2 | 2.4 | 30.9 | 4.6 | 4.4 | 13.1 | 850 |
Table 2.
Variables of the BBD and the results for the solid phase and the liquid phase of RS1. The spread of the measuring values was evaluated using the mean value and the deviation of each measured value to the mean value. The maximum deviations are ±0.8% for HHV, 3.7% for DOC and 1.7% for NH4-N.
Table 2.
Variables of the BBD and the results for the solid phase and the liquid phase of RS1. The spread of the measuring values was evaluated using the mean value and the deviation of each measured value to the mean value. The maximum deviations are ±0.8% for HHV, 3.7% for DOC and 1.7% for NH4-N.
| Operation Settings | Hydrochar | Liquid Phase | |||||
|---|---|---|---|---|---|---|---|
| Run | T °C | t h | pH - | HHV MJ/kg TS | DOC mg/L | NH4-N mg/L | NH4-N/TN % |
| untreated | - | - | - | 18.04 | 1458 | 92 | 26 |
| HTC-1 | 220 | 2.25 | 5 | 20.30 | 8510 | 975 | 40 |
| HTC-2 | 190 | 0.5 | 5 | 18.74 | 9160 | 575 | 26 |
| HTC-3 | 190 | 4 | 5 | 19.07 | 9395 | 730 | 32 |
| HTC-4 | 250 | 0.5 | 5 | 21.27 | 8055 | 980 | 45 |
| HTC-5 | 250 | 4 | 5 | 22.12 | 7640 | 1223 | 54 |
| HTC-6 | 220 | 0.5 | 6.1 | 19.25 | 9160 | 783 | 35 |
| HTC-7 | 220 | 4 | 6.1 | 20.08 | 8520 | 1045 | 44 |
| HTC-8 | 220 | 0.5 | 3.9 | 20.34 | 8650 | 858 | 38 |
| HTC-9 | 220 | 4 | 3.9 | 21.40 | 8335 | 995 | 44 |
| HTC-10 | 190 | 2.25 | 6.1 | 18.75 | 9320 | 630 | 27 |
| HTC-11 | 250 | 2.25 | 6.1 | 21.70 | 7545 | 1058 | 47 |
| HTC-12 | 190 | 2.25 | 3.9 | 19.41 | 8655 | 658 | 32 |
| HTC-13 | 250 | 2.25 | 3.9 | 21.57 | 7395 | 1110 | 52 |
| HTC-14 | 220 | 2.25 | 5 | 20.55 | 8365 | 893 | 40 |
| HTC-15 | 220 | 2.25 | 5 | 20.36 | 8890 | 905 | 39 |
Table 3.
Decoded constants, coefficients of the BBD and the corresponding R2 and AAD for RS1.
| Coefficient | Hydrochar | Liquid Phase | ||
|---|---|---|---|---|
| HHV | DOC | NH4-N | NH4-N/TN | |
| β0 | 17834 | −7743 | −3549 | −56.6 |
| β1 | 13.1 | 115.2 | 32.73 | 0.709 |
| β2 | −27 | 508 | −122.5 | −4.2 |
| β3 | −1259 | 2182 | 65 | −5.24 |
| β12 | 2.45 | −3.1 | 0.417 | 0.0186 |
| β13 | 5.94 | −3.9 | −0.189 | −0.0058 |
| β23 | −30.1 | −42.2 | 16.23 | 0.331 |
| β11 | −0.009 | −0.257 | −0.0575 | −0.000872 |
| β22 | −31.9 | 67.2 | 1.46 | 0.134 |
| β33 | −32 | −105.7 | −7.1 | 0.435 |
| R2 | 0.97 | 0.96 | 0.99 | 0.99 |
| AAD (%) | 0.600 | 1.210 | 1.369 | 1.546 |
Table 4.
Sum parameters to characterize the organic load of the untreated liquid phase and the hydrothermally treated liquid phase (mean value ± standard errors of n = 15).
Table 4.
Sum parameters to characterize the organic load of the untreated liquid phase and the hydrothermally treated liquid phase (mean value ± standard errors of n = 15).
| WWTP A | COD mg O2/L | DOC mg C/L | COD/DOC mg O2/mg C | UV254 1/m | SUVA L/(mg·m) |
|---|---|---|---|---|---|
| RS 1 (untreated) | 3911 | 1458 | 2.68 | 1196 | 0.82 |
| RS 1 (HTC) | 26,263 ± 1221 | 8506 ± 614 | 3.10 ± 0.13 | 13,896 ± 1205 | 1.63 ± 0.05 |
Table 5.
Resulting DOC and NH4-N in process water of the tested sewage sludges after HTC.
| WWTP A | f - | DOC mg/L | NH4-N mg/L |
|---|---|---|---|
| RS1 | 0.13–0.42 | 6088–7938 | 483–1130 |
| WWTP B | |||
| PS | 0.12–0.31 | 708–6200 | 53–239 |
| WAS | 0.12–0.41 | 4693–16,795 | 522–2765 |
| RS2 | 0.12–0.28 | 6610–6835 | 347–684 |
| RS3 | 0.13–0.31 | 9510–11,485 | 635–1380 |
| ADS | 0.13–0.29 | 2896–4108 | 170–448 |
Publisher’s Note: MDPI stays neutral with regard to jurisdictional claims in published maps and institutional affiliations. |
© 2021 by the authors. Licensee MDPI, Basel, Switzerland. This article is an open access article distributed under the terms and conditions of the Creative Commons Attribution (CC BY) license (https://creativecommons.org/licenses/by/4.0/).
Share and Cite
MDPI and ACS Style
Blach, T.; Engelhart, M. Optimizing the Hydrothermal Carbonization of Sewage Sludge—Response Surface Methodology and the Effect of Volatile Solids. Water 2021, 13, 1225. https://doi.org/10.3390/w13091225
AMA Style
Blach T, Engelhart M. Optimizing the Hydrothermal Carbonization of Sewage Sludge—Response Surface Methodology and the Effect of Volatile Solids. Water. 2021; 13(9):1225. https://doi.org/10.3390/w13091225
Chicago/Turabian StyleBlach, Tobias, and Markus Engelhart. 2021. "Optimizing the Hydrothermal Carbonization of Sewage Sludge—Response Surface Methodology and the Effect of Volatile Solids" Water 13, no. 9: 1225. https://doi.org/10.3390/w13091225
Note that from the first issue of 2016, this journal uses article numbers instead of page numbers. See further details here.