
Probabilistic Approach to Precipitation-Runoff Relation in a Mountain Catchment: A Case Study of the Kłodzka Valley in Poland


Department of Hydrology and Water Resources Management, Faculty of Geographical and Geological Sciences, Adam Mickiewicz University, Bogumiła Krygowskiego str. 10, 61-680 Poznan, Poland
*
Author to whom correspondence should be addressed.
Water 2021, 13(9), 1229; https://doi.org/10.3390/w13091229
Submission received: 15 April 2021
/
Revised: 22 April 2021
/
Accepted: 26 April 2021
/
Published: 28 April 2021
(This article belongs to the Section Hydrology)
Abstract
:On the basis of daily precipitation and discharges recorded in 1974–2013 relations between precipitation and runoff in the Kłodzka Valley (KV) in south-western Poland were analyzed. The degree of synchronicity between them was determined using the bivariate Archimedean copulas. This study aims at identifying and then describe in a probabilistic way the precipitation and runoff relations in the area playing an important role in the formation of water resources, but also particularly exposed to flooding. It was found that isolines of the synchronous occurrence of precipitation and total runoff in the Nysa Kłodzka catchment controlled by gauge Kłodzko had a zonal distribution, with the synchronicity values decreasing from south-east to north-west of the study area. This proves that its eastern part is more hydrologically active, compared to the western part, and as such it determines the amount of water resources of the study area. The decrease in synchronicity is influenced by the type and spatial distribution of precipitation, the structure of water supply, and the geological structure of the study area. Moreover, probabilistic methods applied in this research differ from those used in previous research on the hydrology of KV, as we propose using the copula functions. The method presented can be used to evaluate the availability of water resources in areas playing a key role in their formation on different scales.
1. Introduction
The hydrological cycle has many interconnected components, with runoff connecting precipitation to bodies of water [1]. A wide range of rainfall-runoff models are currently used by researchers and practitioners; however, the applications of these models are highly dependent on the purposes for which the modeling is made [2]. There is much rainfall-runoff modelling that is carried out purely for research purposes as a means of formalizing knowledge about hydrological systems. The demonstration of such understanding is an important way to develop an area of science. However, the ultimate aim of prediction using models must be to improve decision making about a hydrological problem, whether that be in water resource planning, flood protection, mitigation of contamination, licensing of abstractions, or other areas [3]. While there are many examples of studies focusing primarily on the hydrological consequences of the assumed rainfall [4,5,6,7,8], the researches have rarely analyzed the precipitation-runoff relationship in terms of the water resource forming and the river regime types in the given area.
The Kłodzka Valley (hereinafter referred to as KV) in south-western Poland is an area particularly vulnerable to catastrophic floods, in particular triggered by excessive rainfall during the summer months. It is located in the Sudetes Mountains, which along with the Sudeten foreland is the second richest in water resources of the regions of Poland, after the Carpathians [9]. KV is a part of the Odra River basin, which belongs to the Baltic Sea drainage basin. Extreme rainfall, most often leading to floods in the upper and middle Odra basin, is usually associated with low pressure centers (of frontal origin) moving over Poland from southern Europe along the Vb route according to Van Bebber’s classification. These rainfall events are long-lasting, even up to several days [10]. Moreover, apart from the weather, the morphological conditions of the area (altitude, exposure, terrain, etc.) usually play an important role in shaping the distribution of the fields of intense precipitation. Particularly important is the orographic forcing of humid air masses, flowing from the northern sector, on the orographic barrier, which in the Odra River basin are formed by the Sudetes. Hence, the highest sums of one- or several-day rainfall with high intensity occur in the mountains. Thus, the amount of water discharged from mountain catchments has the most important and largest share in the formation of floods on the Odra River [11].
There have been numerous case studies focusing on the extreme floods recorded in KV. They were devoted to the estimation of the precipitation volume causing summer floods [11], the history of summer floods during the last centuries [12], or the role of torrential rains and floods in modeling the relief of KV [13]. Besides these studies based on the recorded datasets, there were also theoretical models constructed for the KV rivers [14,15,16,17]. Among the scientific contributions of these papers, the discovery of a meaningful level of differences between the daily maximum and mean design discharges and between the rate of change of flood magnitude can be mentioned [14]. Important from the practitioners’ point of view, in [15] a new system for computing the multi-model ensemble predictions of water levels (called HydroProg) is proposed, applied in the process of real-time modeling and forecasting of river flow in the upper Nysa Kłodzka catchment.
While the aforementioned studies focus on the analysis of floods in KV or on the overall catchment response to the occurrence of precipitation, there are few analyses related to the total water abundance in that area. Olichwer [18] studied the long-term variability of water resources in the Kłodzko region through the characteristics of the total and groundwater runoff. In analyzing the variability of the total and groundwater runoff, decreasing long-term trends in the total and groundwater runoff can be observed. It is primarily affected by very noticeable declining trends during the summer period, which is related to both the total and groundwater runoff. Perz [19] identified the characteristics of the flow regime of the rivers in KV in terms of the runoff, the structure, and the spatio-temporal variabilities. He determined that the runoff conditions in the analyzed sub-catchments were different and found that the rivers in KV had different regime characteristics, and that there were significant differences in the total runoff, from 375 mm in Kłodzko to above 700 mm in the Wilczka River. The differences were also concluded in terms of the groundwater runoff and its contribution to the total runoff, which ranged between 31% and 53%.
As can be seen from the above review, numerous researchers analyzed relations between extreme precipitation and runoff in KV. However, there is a lack of research on the water resources and relations between average values of precipitation and runoff in that area. This study aims at filling this research gap by identifying and then describing elements of the water balance, and more specifically precipitation and runoff relations in the area playing an important role in formation of water resources, but also particularly exposed to flooding. Moreover, probabilistic methods applied in this research differ from those used in previous research on hydrology of KV, as we propose to use the copula function, which has been widely recognized in studies on the synchronous occurrence of hydrological and meteorological phenomena in a catchment. Recently the bivariate copulas have been successfully applied to analyze dependencies between precipitation and runoff in the Upper Huai River Basin in China [20], the maximum runoff synchronicity and its spatial differentiation in the Warta River catchment in Poland [21], and the maximum and mean flow synchronicity in the Upper Indus River Basin in Pakistan [22].
2. Study Area and Methods
2.1. Study Area
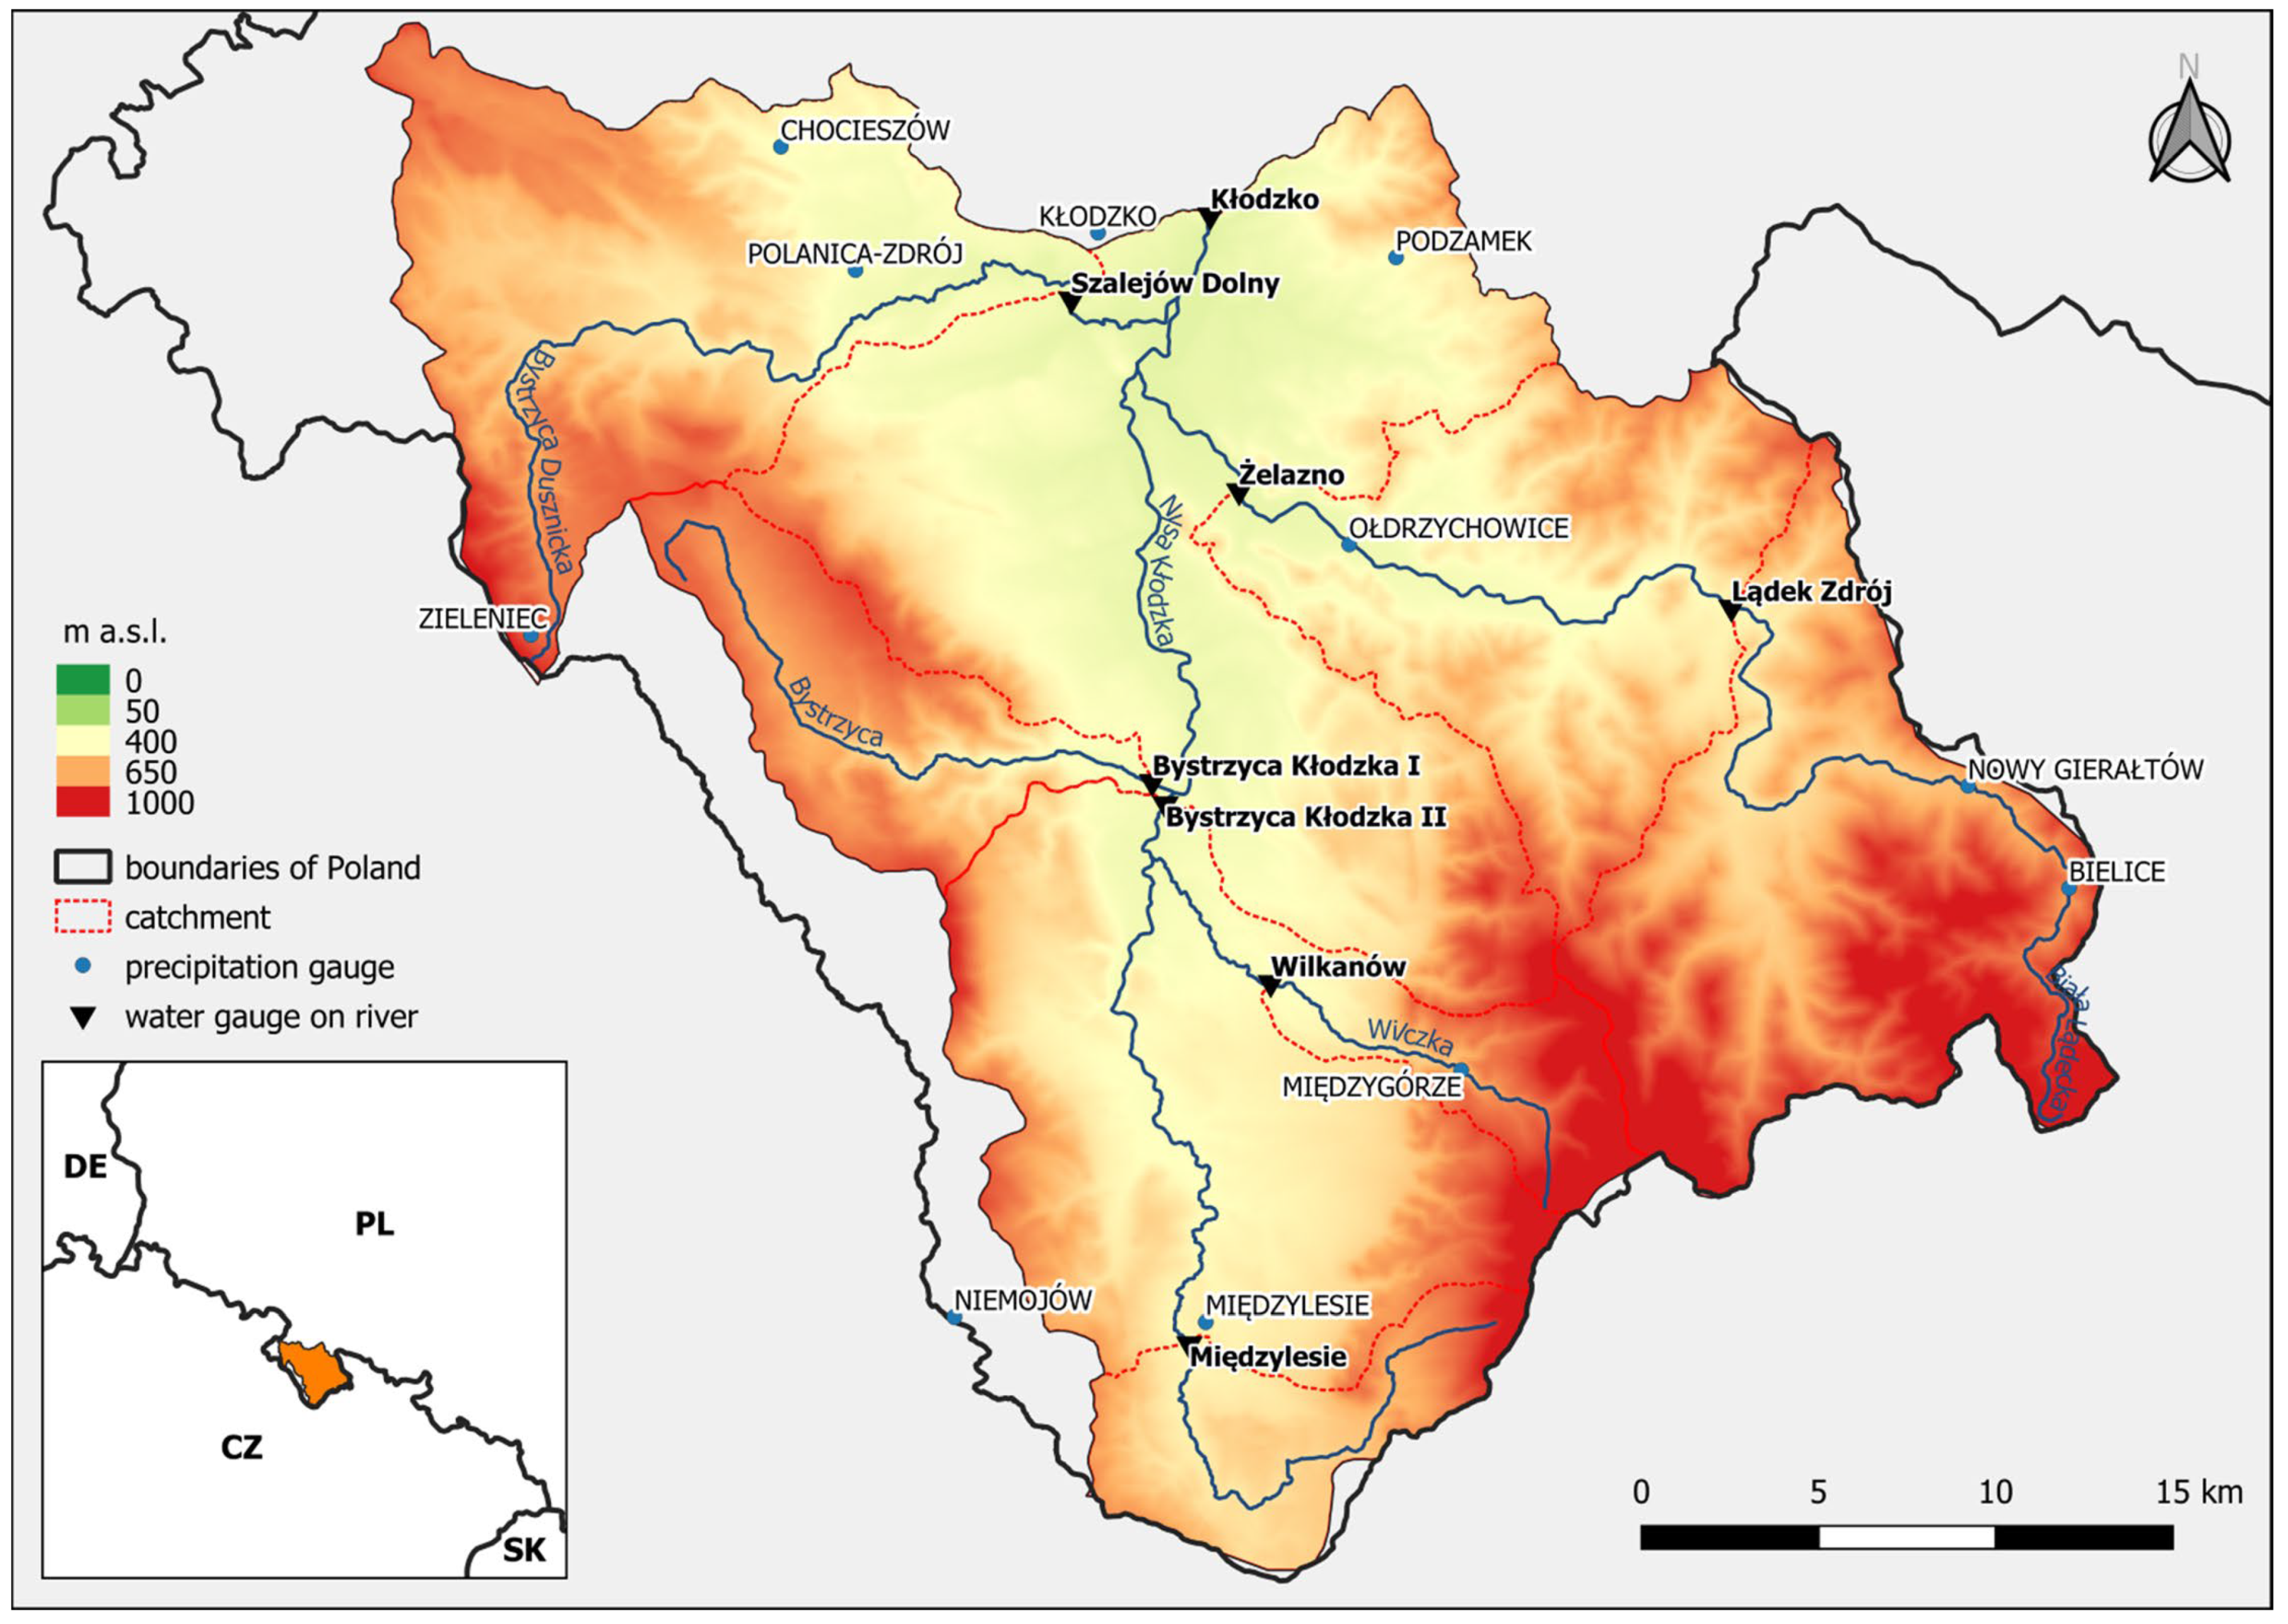
KV is located in the south-western part of Poland, and in this paper it is understood as an area drained by the upper section of the Nysa Kłodzka River and its tributaries to gauge Kłodzko (Figure 1). According to the physical-geographical regionalization of Poland by Kondracki [23] KV belongs to the sub-province Sudetes with the Sudetes Foreland, and to two macro-regions: The Central Sudetes and the Eastern Sudetes. That area includes the following meso-regions: The Upper Nysa Trench, the Śnieżnik Massif, the Złote Mountains, the Bardzkie Mountains, the Bystrzyckie Mountains, the Orlickie Mountains, the Table Mountains, the Kłodzka Valley (KV), and the Ścinawka Depression [23,24].
According to [23,24], KV is a tectonic ditch running longitudinally and dividing the Sudetes into the central and eastern parts. In the western part it is bordered by the Bystrzyckie Mountains, and in the eastern part by the Śnieżnik Massif, the Złote Mountains, and the Bardzkie Mountains [23]. KV does not have a clearly defined northern border, with the Lower Ścinawka River and the Noworudzkie Lowering being its extensions [23]. The study area is characterized by relatively large differences in altitude: The Three-Seas Peak is 1145 m a.s.l., while the lowest part of the Kłodzko town is situated about 280 m a.s.l. (Figure 1). In terms of geology, KV is characterized by little variability [13]; the pre-Cambrian metamorphic rocks and sedimentary rocks of the Cretaceous period are dominant. On the other hand, KV is diversified in terms of structure and texture, as well as rock resistance to erosion and weathering processes [13]. The study area has an undulating and hilly, mid-mountain relief, with river valleys characterized by a distinct morphological expression and a different degree of development of the channel system as its important element [13]. Besides river sediments in the valleys, there are remnants of moraine covers and stagnant clays, resulting from the double overlapping by the continental glacier through the passes of the Bardzkie Mountains [23]. The bottom of the valley is partially covered with loess, on which fertile soils have developed. This was of key importance to the development of agriculture, which on turn resulted in significant deforestation of that area [23].
The 182-km long Nysa Kłodzka is the left tributary of the Odra (Oder) River, the second-longest river of Poland. The Nysa Kłodzka is the main river of KV. It has its source in the Śnieżnik Massif, on the slope of the Three-Seas Peak, at an altitude of over 1000 m a.s.l. Initially, the river runs along the Upper Nysa Ditch, which is its natural drainage channel [25]. Then it flows into Kłodzka Valley, where it retains its mountain character until it flows out of the Bardo Mountains. Then, it begins to meander and becomes a lowland river. Its main tributaries within the analyzed area are: The Wilczka (18.2 km), Bystrzyca (25.5 km), Biała Lądecka (52.7 km), and Bystrzyca Dusznicka (33 km) rivers. Their mountainous character along with the topography and geology of their watersheds make these watercourses very prone to floods triggered by sudden or prolonged rainfalls and thaws. For example, the summer flood of July 1997, known as the “millennium flood”, caused huge material losses not only in the Kłodzko region, but also in cities along the Oder River, including Wrocław, killing several dozen people in total. The amount of flood losses is also significantly increased by the concentration of assets in the form of buildings and infrastructure in the river valleys and along the watercourses. For example, the subsoil in the Bystrzyca River watershed is largely made of low-thickness loams [16], which are characterized by a medium water permeability. Therefore, they contribute to increasing surface runoff and faster formation of floods on watercourses.
In terms of climate the upper part of the Nysa Kłodzka catchment is classified as the so-called Kłodzko climatic region of the Sudetes climate district [26]. The lowest temperatures are recorded in the Bystrzyckie Mountains (annual average 4.9 °C), while the highest in the foreland of the Opawskie Mountains (above 8 °C) [26]. The annual precipitation in the analyzed area is varied spatially. In general, higher values are recorded in mountains, that is in the south, west, and east of that area, especially in the watershed of the Bystrzyca Dusznicka and Wilczka rivers, and the upper Biała Lądecka River (Figure 1). On the other hand, the precipitation decreases in the central and northern parts of the area, that is within the lower parts of KV (Figure 1). Among the analyzed rainfall stations, the highest annual precipitation is recorded in Zieleniec (1279 mm), while the lowest is in Kłodzko (577 mm) (Table 1). There are noticeable variations in precipitation on the multi-annual and monthly bases. According to the Köppen–Geiger classification of climates [27] the study area lies within the zone of cold climate with relatively cold winters and warm summers (Dfb). Wrzesiński [28,29] classified the river regime of the study area as nival-pluvial and pluvial-nival. Perz [19] based on the data from 1971–2015 classified rivers of KV into two of five types of regimes: Type 2-nival moderately developed, characteristic of the upper section of the Nysa Kłodzka above gauge Międzylesie and its left-bank tributaries-the Bystrzyca and the Bystrzyca Dusznicka rivers, and type 4-nival-pluvial regime, characteristic of the Nysa Kłodzka River below gauge Międzylesie, as well as the Biała Lądecka and Wilczka rivers (Figure 1, Table 2).
2.2. Data Sets
The study is based on the values of daily precipitation and runoff collected in KV in the multi-year period 1974–2013. Precipitation data were recorded at 11 rain gauge stations (Figure 1, Table 1), while runoff data at eight water gauge stations, three of which are located on the Nysa Kłodzka River, and five on its tributaries—the Wilczka, Bystrzyca, Biała Lądecka and Bystrzyca Dusznicka rivers (Figure 1, Table 2).
In has to be noted that, in case of the Bystrzyca River catchment, the average and probable values were calculated, but they were not presented in the results, because of the lack of rain gauge in that catchment, towards which the synchronicity could be analyzed. Additionally, for the purpose of interpolation of the average and probable values of precipitation, data from the Niemojów rain gauge station were applied; however, they were not included in the synchronicity analysis because of location of that gauge beyond the analyzed area. Interpolation of the precipitation values was conducted by means of the Inverse Distance Weighting (IDW) interpolation method.
All data sets were obtained from the resources of the Institute of Meteorology and Water Management—National Research Institute in Warsaw, Poland.
2.3. Methods
The copula functions have been applied to analyze the synchronous and asynchronous occurrence of precipitation and runoff in river catchments situated in KV. In this study the bivariate Archimedean copulas were used. The concept of copula was introduced by Sklar [30], who defined copula as a joint distribution function of standard uniform random variables. Results of many researchers proved that copulas can be a powerful tool for modeling and sampling multivariate, nonlinearly interrelated hydro-meteorological data [31].
First, the best matching statistical distributions (from Weibull, Gamma, Gumbel, and log-normal) were selected for the analyzed data series. The maximum likelihood method was used to estimate values of distribution parameters. The goodness of fit of a given distribution in the data series was checked by means of the Akaike information criterion (AIC) [32]:
where MSE is the mean square error, and N is the sample size, or
AIC = Nlog (MSE) + 2 (no. of fitted parameters),
AIC = −2log (maximum likelihood for model) + 2 (no. of fitted parameters).
The best fitted distribution type is the one that has the minimum AIC value [32].
Next, the joint distribution of Pt (mm) and Rt (mm) was constructed. It was made for data from each precipitation gauge located in a given catchment with data from a water gauge (closing this particular catchment). In other words it was made only for each pair of hydrologically connected precipitation and runoff data sets, to avoid analyzing random/accidental statistical relations between gauges without hydrological connection.
In general, a bivariate Archimedean copula can be defined as:
where u and v are marginal distributions, the θ, subscript of copula C, is the parameter hidden in the generating function ϕ, and ϕ is a continuous function called a generator that strictly decreases and is convex from I = [0, 1] to [0, ϕ (0)] [33].
Cθ (u,v) = ϕ−1 {ϕ(u) + ϕ(v)},
The Archimedean copula family is often applied in hydrological studies [34], for example in flood frequency analyses. It was found that a copula-based flood frequency analysis performs better than a conventional flood frequency analysis, as joint distribution based on a copula fits the empirical joint distribution (i.e., from observed data using a plotting position formula) better than the established standard joint parametric distribution.
A large variety of copulas belongs to the Archimedean copula family and can be applied when the correlation between hydrological variables is positive or negative. The proofs of these properties have been reported by Genest and Favre [35]. For this reason, one-parameter Archimedean copulas, including the Clayton family, the Gumbel–Hougaard family, and the Frank family, were used in this study. The Gumbel–Hougaard and Clayton copula families are appropriate only for positively correlated variables, while the Frank family is appropriate for both negatively and positively correlated variables (Table 3).
The best-fitted joint distribution was selected through comparison to the empirical joint distribution using the Akaike information criterion (AIC), as mentioned earlier.
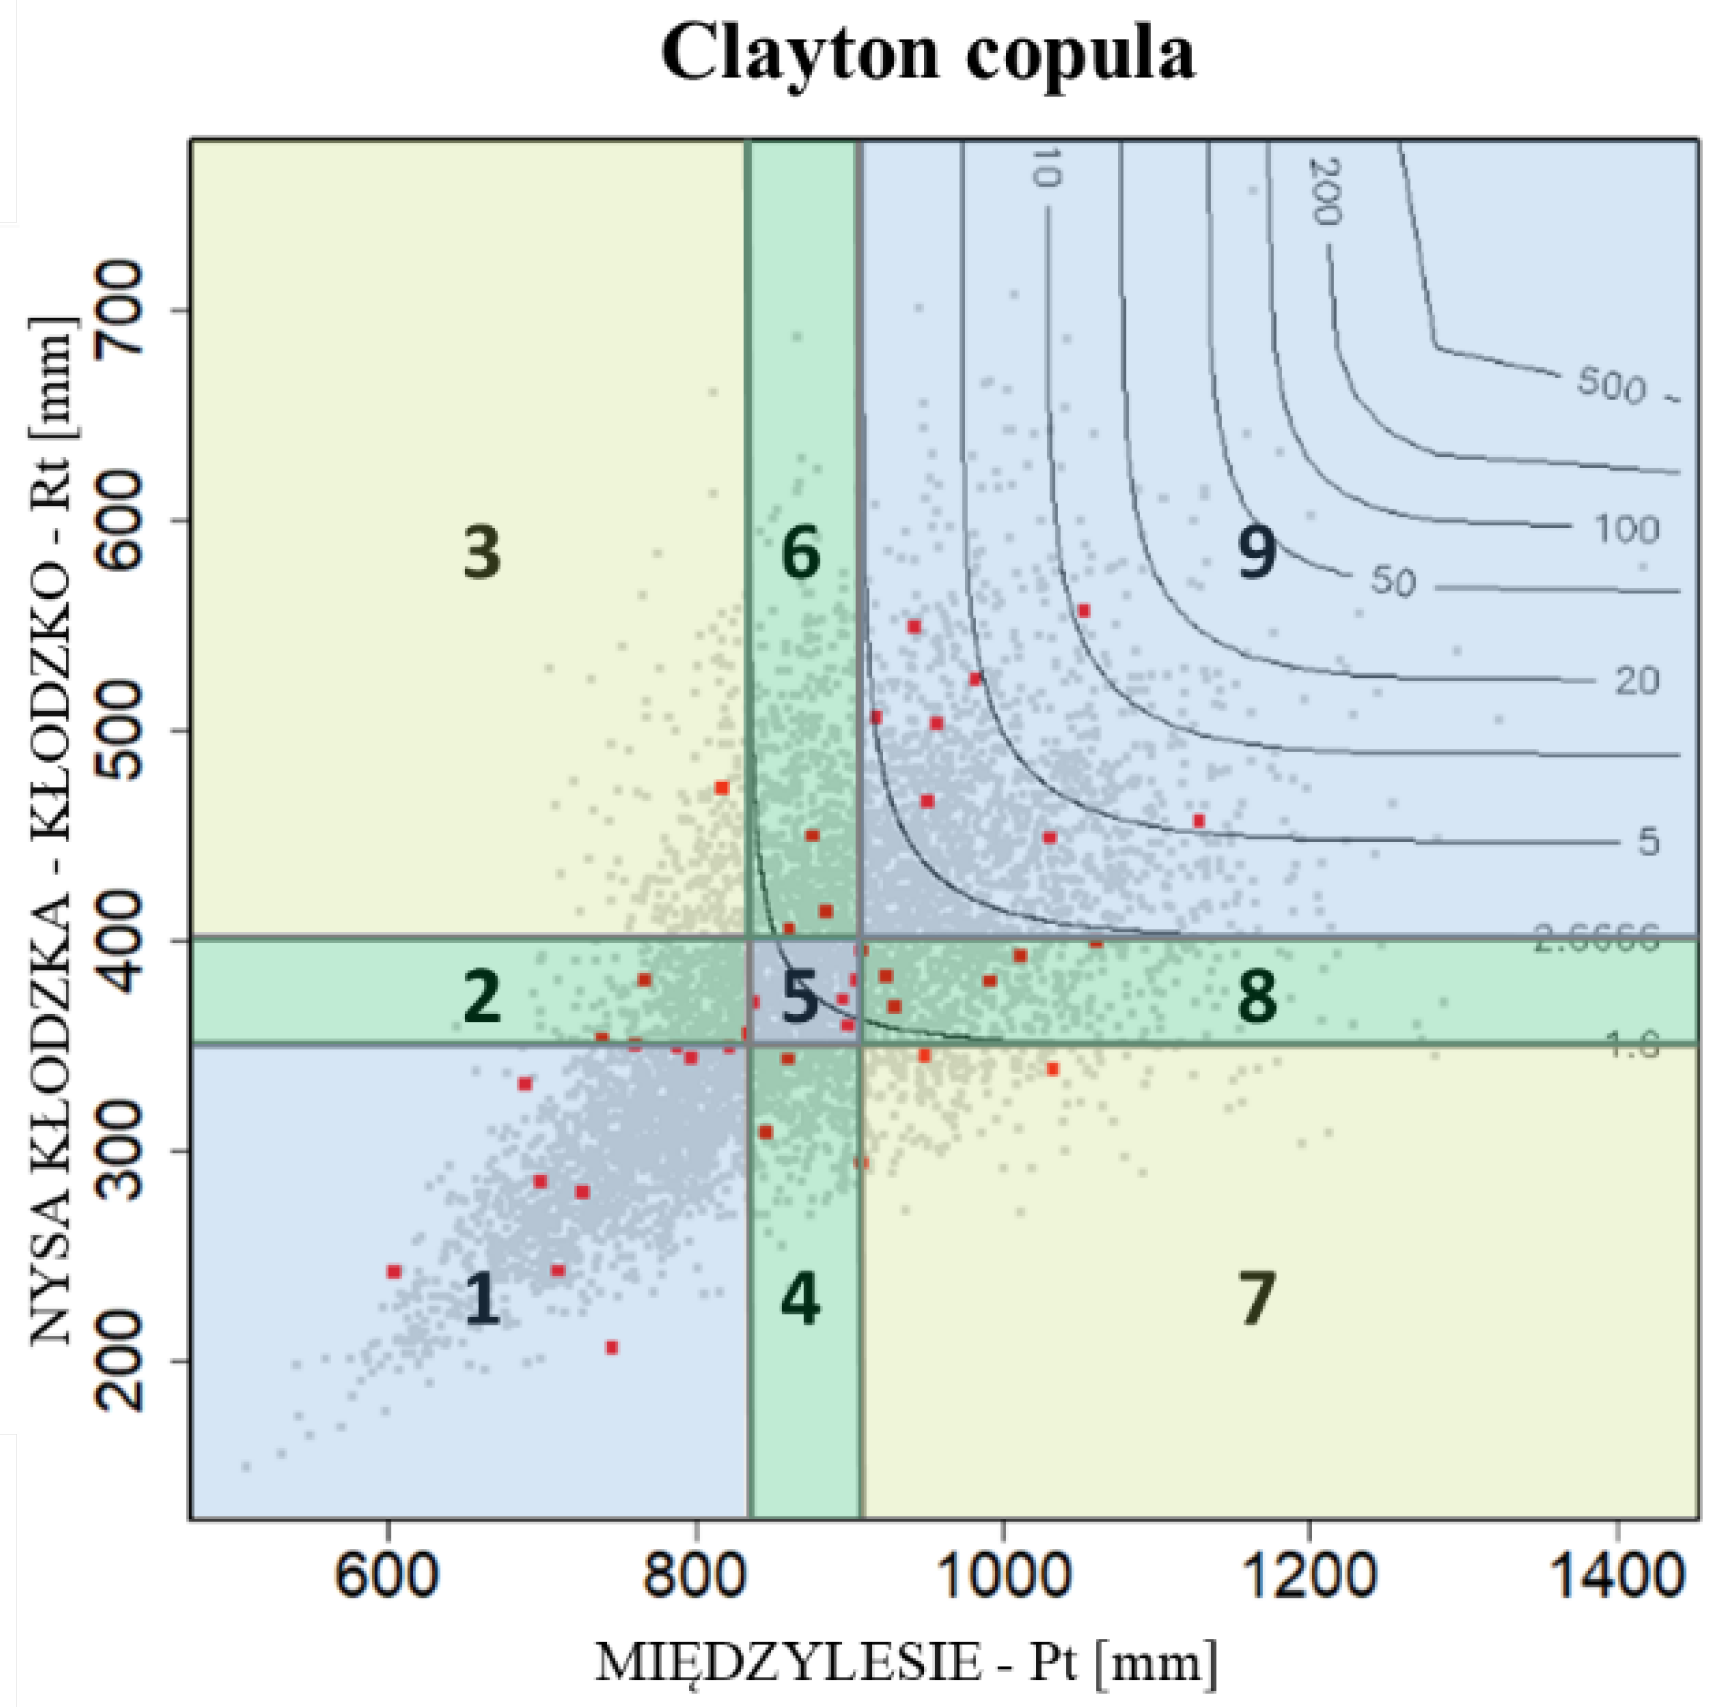
For each pair of series, based on previously computed statistical distribution parameters of marginal data series, 5000 hypothetical values were randomly generated. They were used for the selection of the best-fitted copula family for a given pair of data sets and next for the forming of an appropriate copula. Based on empirical value pairs (red points in Figure 2) for particular years and computed hypothetical points (marked with gray in Figure 2), graphs with probability curves (expressed in return periods) were generated (Figure 2).
All these steps allowed calculating the degree of synchronicity (synchronous occurrence) and asynchronicity (asynchronous occurrence) of Pt and Rt. For each pair of gauges, probability curves at a level of 62.5% (once in 1.6 years), 37.5% (once in approximately 2.7 years), 20% (once in 5 years), 10% (once in 10 years), 2% (once in 50 years), 1% (once in 100 years), 0.5% (once in 200 years), and 0.2% (once in 500 years) were generated (Figure 2 and Figure 3).
Then, the obtained data (generated value pairs) were analyzed in basis 62.5% and 37.5% probability levels [36,37]. According to these levels, nine sectors were designated. They represent different relations between probable values of Pt and Rt. Based on generated value pairs with a distribution imitating the joint distribution of values from compared gauges and their participation in particular sectors (Figure 2), three sectors with the synchronous occurrences of Pt and Rt were designated:
- Sector 1: LPt–LRt (X ≤ Pt62.5%, Y ≤ Rt62.5%);
- Sector 5: MPt–MRt (Pt62.5% < X ≤ Pt37.5%, Rt62.5% < Y ≤ Rt37.5%);
- Sector 9: HPt–HRt (X > Pt37.5%, Y > Rt37.5%);
and six sectors with the asynchronous occurrences:
- Sector 2: LPt–MRt (X ≤ Pt62.5%, Rt62.5% < Y ≤ Rt37.5%);
- Sector 3: LPt–HRt (X ≤ Pt62.5%, Y > Rt37.5%);
- Sector 4: MPt–LRt (Pt62.5% < X ≤ Pt37.5%, Y ≤ Rt62.5%);
- Sector 6: MPt–HRt (Pt62.5% < X ≤ Pt37.5%, Y > Rt37.5%);
- Sector 7: HPt–LRt (X > Pt37.5%, Y ≤ Rt62.5%);
- Sector 8: HPt–MRt (X > Pt37.5%, R62.5% < Y ≤ Rt37.5%).
where X = the values of x coordinates of generated points, Y = the values of y coordinates of generated points, Pt62.5% = the value of Pt with a probability of exceedance of 62.5%, Pt37.5% = the value of Pt with a probability of exceedance of 37.5%, Rt62.5% = the value of Rt with a probability of exceedance of 62.5%, Rt37.5% = the value of Rt with a probability of exceedance of 37.5%, L = “low”, M = “medium”, and H = “high”.
The percent share of generated points in sectors 1, 5, and 9 allowed determination of the degree of synchronicity of Pt and Rt (i.e., between compared precipitation gauge and water gauge on a river). The asynchronicity may be divided into two types: Moderate (the percent share of points in sectors 2, 4, 6, 8—“low-medium”, “medium-low”, “medium-high”, and “high-medium” relations) and high (the percent share of points in sectors 3 and 7—“high-low” and “low-high” relations), respectively.
In other words, the synchronous and asynchronous occurrences of Pt and Rt were determined through a calculation of threshold values of probability ranges:
- Probable values with a probability of occurrence of <62.5% were designated as LPt/LRt;
- Probable values with a probability of occurrence in a range >62.5% and <37.5% were designated as MPt/MRt;
- Probable values with a probability of occurrence > 37.5% were designated as HPt/HRt.
The sum of percent share of synchronous and asynchronous events is always 100%.
For instance, the occurrence of LPt in a given precipitation gauge is a synchronous event if in the same time unit LRt occurs in the catchment (closed by water gauge) which the precipitation gauge is located in, whereas it is the asynchronous one if MRt or HRt occurs.
If the synchronicity of Pt and Rt in a given catchment is 60%, this means that in three out of five years, the probable Pt at a given gauge is within the same probability range as the probable Rt.
In turn, the asynchronicity can be exemplified by the occurrence of high Pt in the given catchment (e.g., a “100-year precipitation”, p = 1%) and the occurrence of low Rt in the same catchment (e.g., at the level of exceedance probability p = 90%). As in the example above, if the synchronicity is 60%, the asynchronicity is 40%, which means that statistically the asynchronous event should occur average twice for every five years.
In the Section 3, the term “synchronicity”/”asynchronicity” means the synchronous / asynchronous occurrence of Rt relative to the Pt in the described catchment. Interpolation both of the synchronicity and precipitation values was conducted by means of the IDW interpolation method.
For the mathematical and statistical processing MS Excel and RStudio software were used. QGIS and MS Publisher software was employed to visualize the obtained results.
3. Results
3.1. Probable Values of Pt and Rt
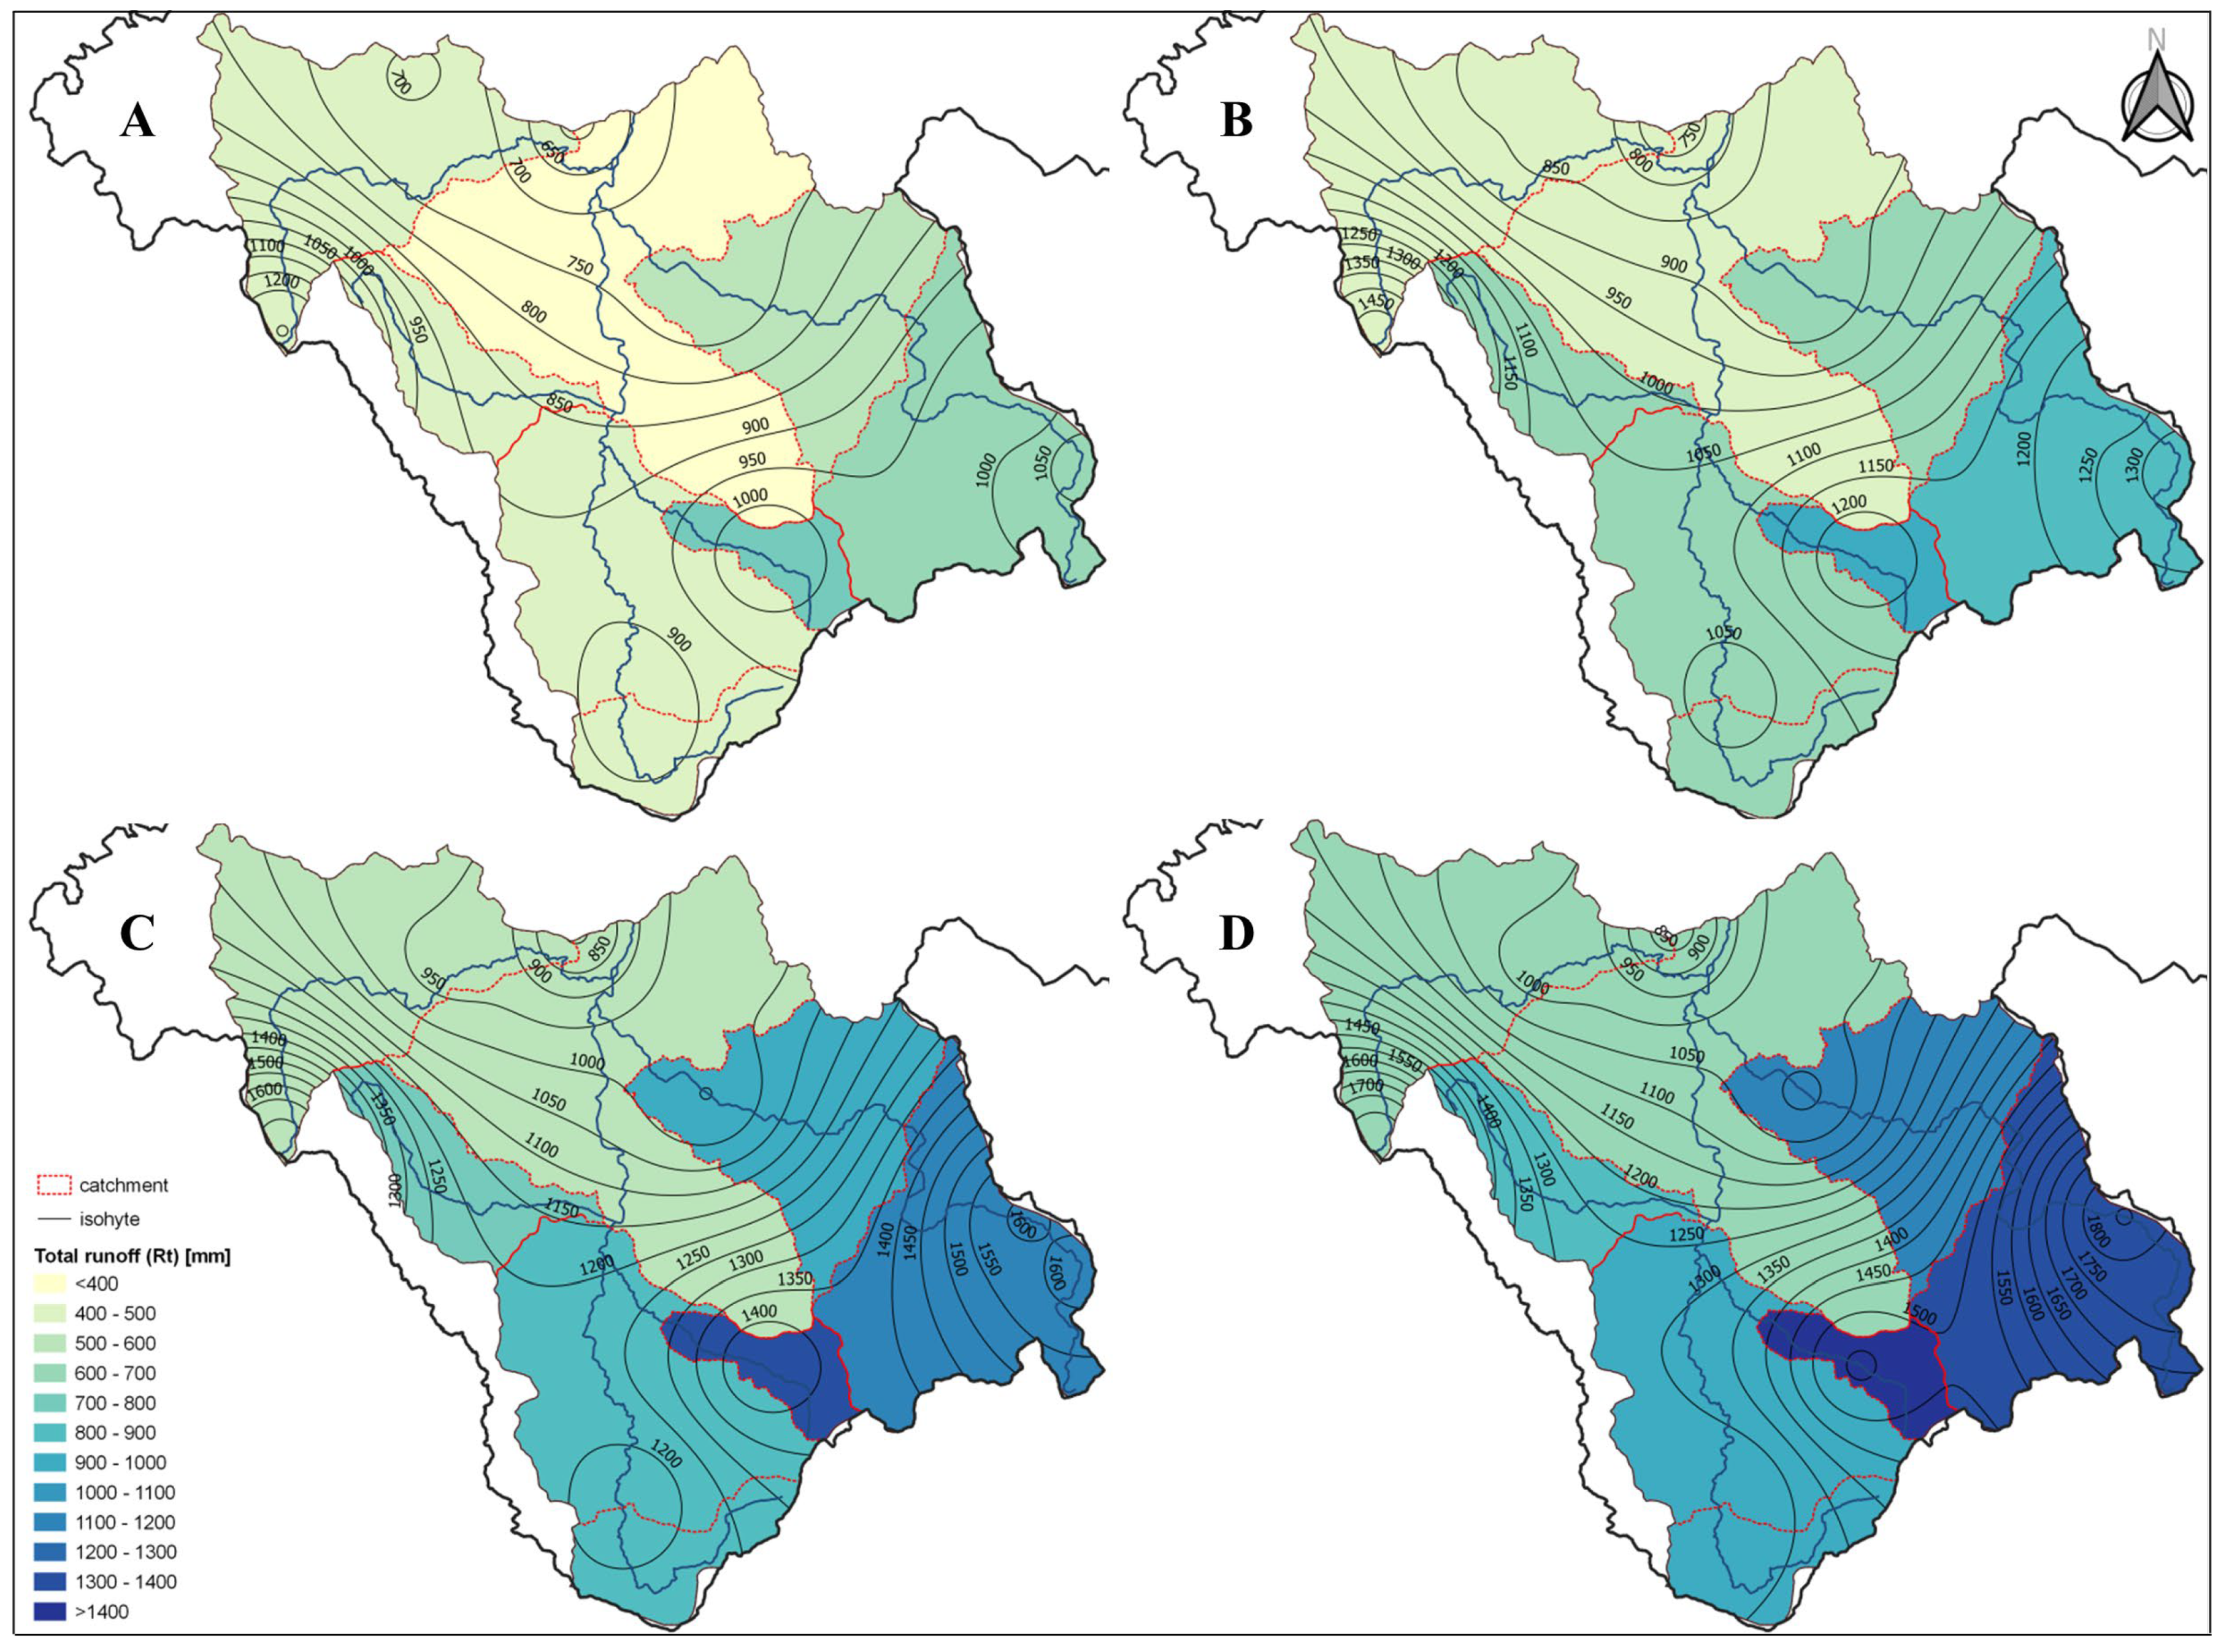
The values of the total runoff in the study area are varied (Figure 4A). They reach the highest values in the eastern part of KV, in the Wilczka (about 740 mm) and Biała Lądecka river catchments (655 mm in gauge Lądek–Zdrój and 512 mm in gauge Żelazno, respectively), while in the whole Nysa Kłodzka catchment area closed by gauge Kłodzko it is significantly lower (about 380 mm). The average precipitation has a specific spatial pattern: Its higher values are recorded in the elevated areas, that is in the western, eastern, and southern parts of KV, and the values decrease towards the north (Figure 4A). The highest average annual rainfall is recorded in the upper Bystrzyca Dusznicka catchment (about 1250 mm).
In general, the spatial distribution of the annual precipitation totals with the exceedance probabilities of 10% (Figure 4B), 1% (Figure 4C), and 0.2% (Figure 4D) follows the distribution of average values of precipitation and runoff (Figure 4A). In the case of the exceedance probabilities of 10% (Figure 4B) and 1% (Figure 4C), the highest precipitation is expected at gauge Zieleniec located in the Bystrzyca Dusznicka catchment, analogically to the annual averages. However, the spatial distribution of precipitation with the exceedance probability of 0.2% is different, and the highest values of annual precipitation can be expected in the Biała Lądecka catchment (over 1850 mm).
The probable values of the annual runoff refer spatially to the annual precipitation totals. Much higher values, similar to the mean values (Figure 4A), are characteristic for the Wilczka and Biała Lądecka catchments, and the upper part of the Nysa Kłodzka River.
This section may be divided by subheadings. It should provide a concise and precise description of the experimental results, their interpretation, as well as the experimental conclusions that can be drawn.
3.2. Synchronicity of Pt and Rt
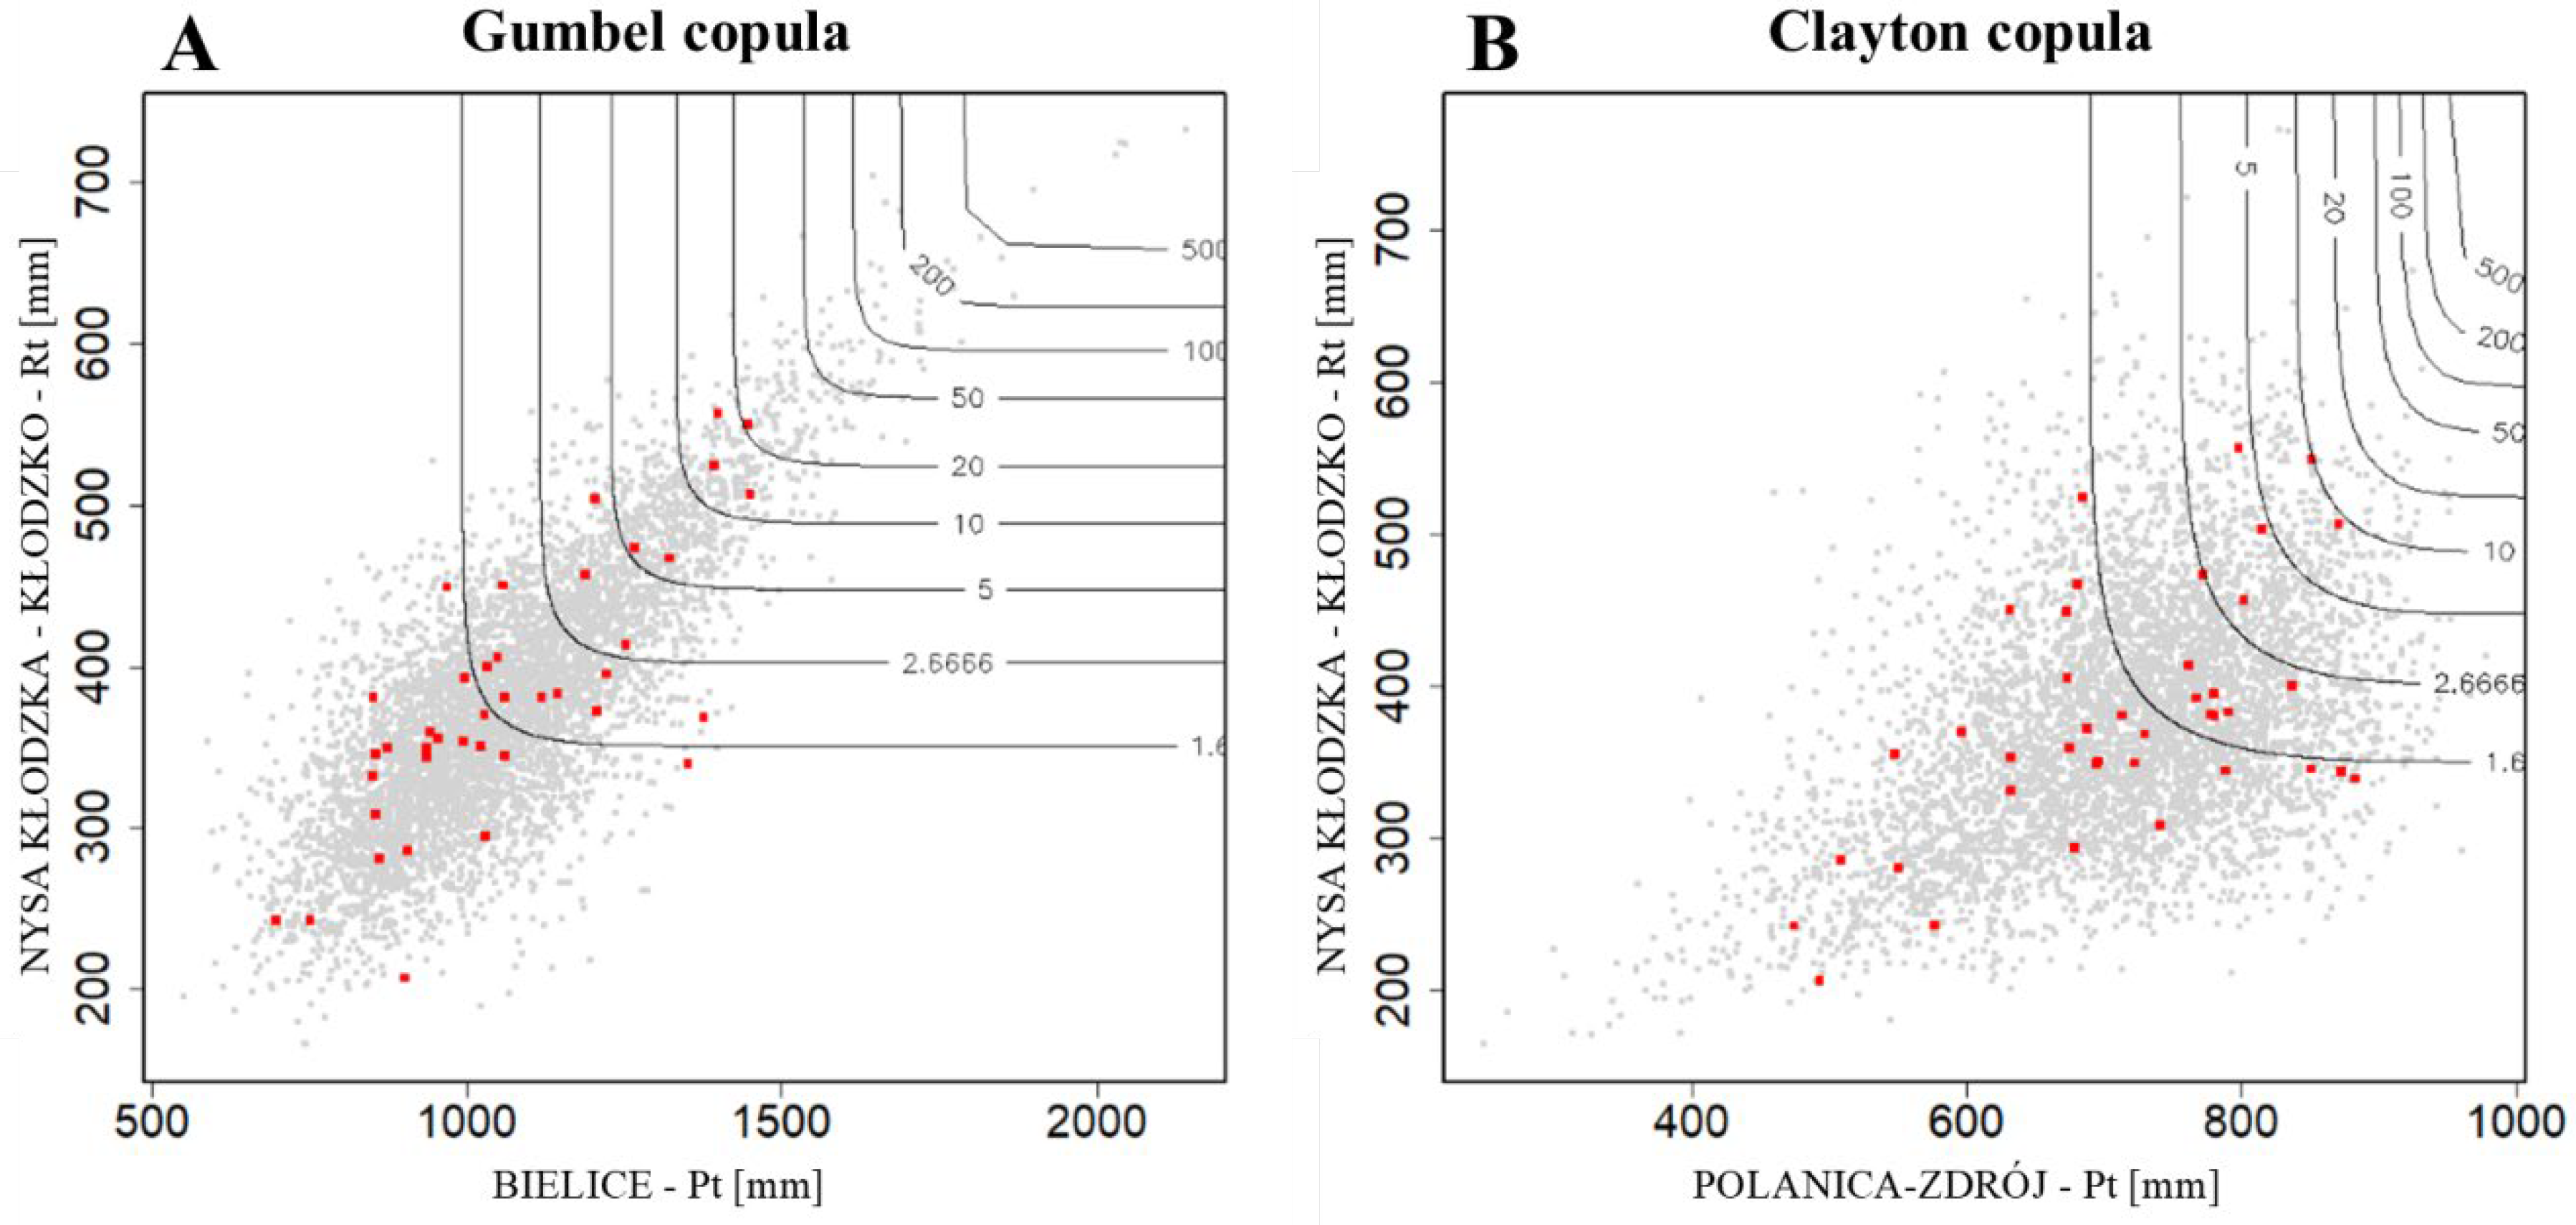
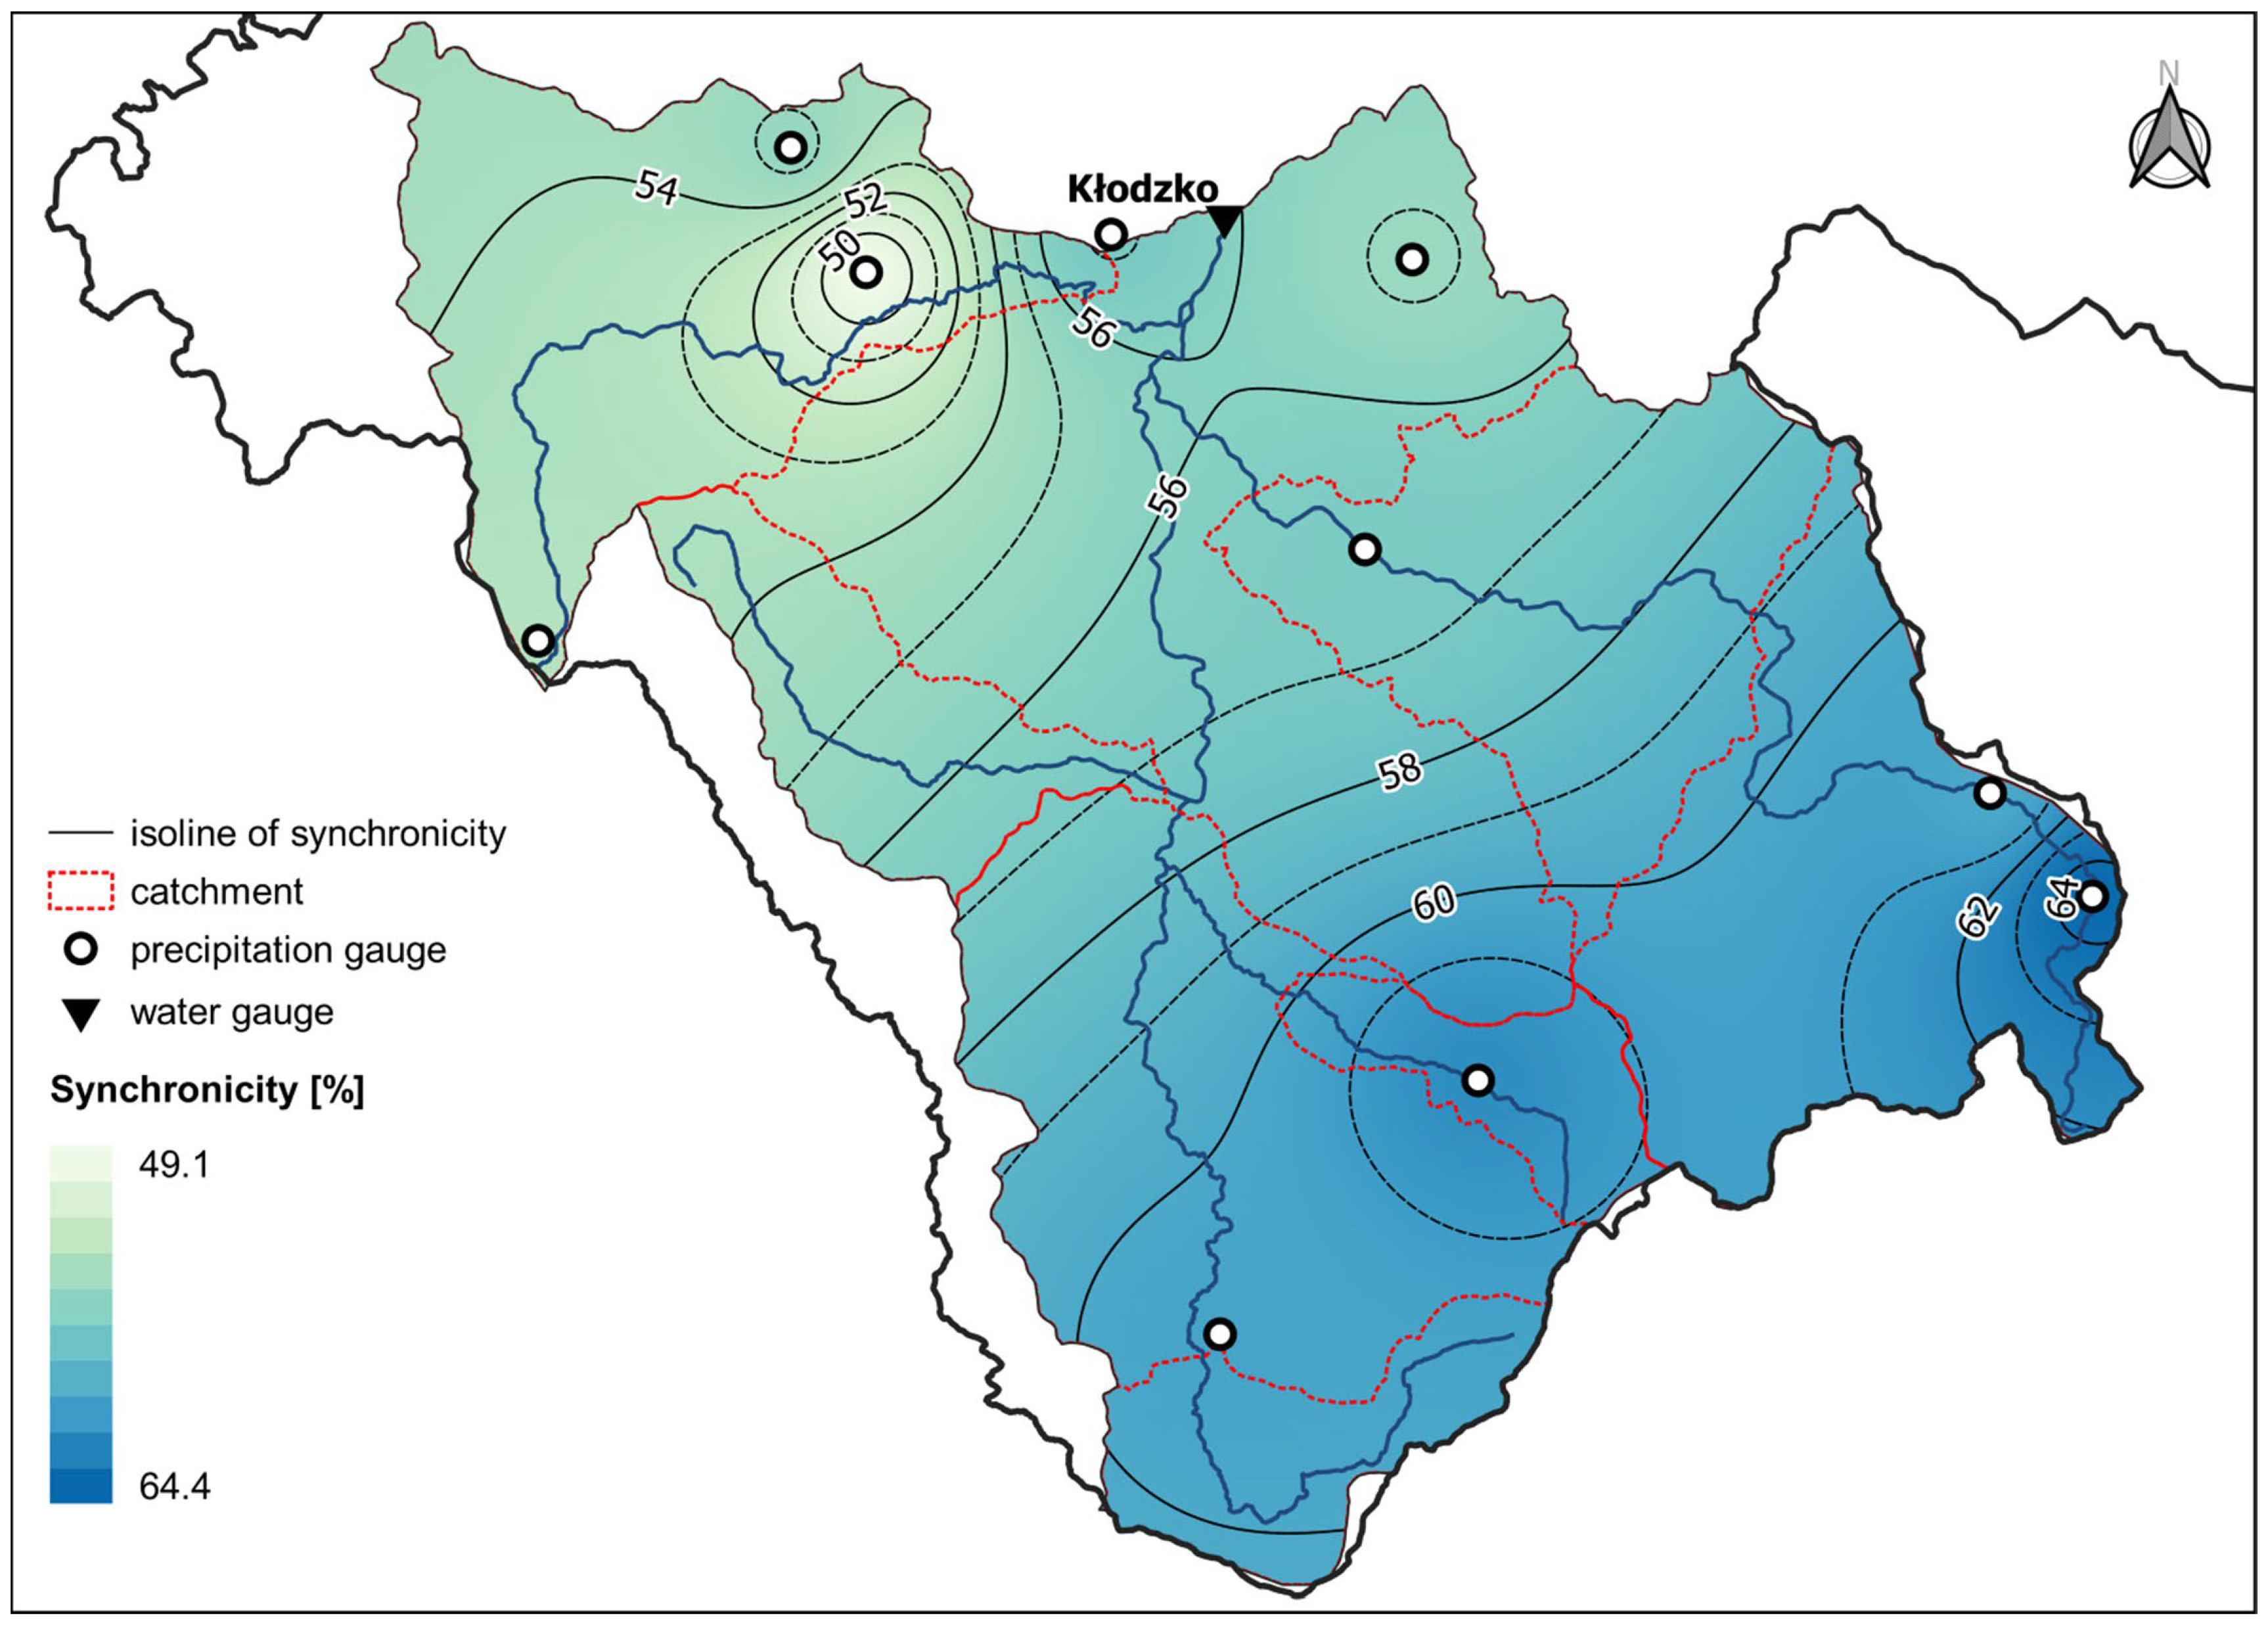
The results shows different degrees of the synchronous occurrence of the river runoff with the annual precipitation recorded in the catchment (Table 4). The strongest relationship has been demonstrated between precipitation recorded in rain gauge Zieleniec and runoff in the Bystrzyca Dusznicka River sub-catchment controlled by water gauge Szalejów Dolny (65.7%), then precipitation in rain gauge Międzylesie and runoff in the Nysa Kłodzka River catchment controlled by water gauge Międzylesie (64.8%), and also precipitation in rain gauge Bielice and runoff in the Nysa Kłodzka River catchment controlled by water gauge Kłodzko (64.4%). By contrast, the least synchronous were the precipitation totals recorded in rain gauge Polanica–Zdrój and runoff in the Nysa Kłodzka River catchment controlled by water gauge Kłodzko (49.1%), and also precipitation in rain gauge Ołdrzychowice and runoff in the Biała Lądecka River sub-catchment down to Żelazno (49.4%).
It can be seen that in many cases precipitation in the upper parts of the catchment area is more synchronous with runoff from a given catchment recorded in profiles closing that catchment, while the degree of synchronicity between precipitation recorded in rain gauges located close to these profiles is noticeably lower (Table 4, Figure 5). Such cases include the Nysa Kłodzka River catchment controlled by water gauge Bystrzyca Kłodzka II, and the Biała Lądecka River sub-catchment controlled by water gauge Bystrzyca Dusznicka. This proves the key importance of precipitation in the upper parts of the catchment area for the formation of total runoff in the Nysa Kłodzka River catchment. This is due both to the volume of precipitation (it is higher in the upper parts of the catchment area, Figure 4A), as well as the shape and geological structure of the terrain-higher parts of the mountains being characterized by steeper slopes, which is translated into the transformation of most of the precipitation into surface runoff, reducing water retention and its subsequent transpiration.
Isolines of the synchronous occurrence of Pt and Rt in the Nysa Kłodzka River catchment controlled by gauge Kłodzko have a zonal distribution, with synchronicity values decreasing from south-east to north-west (Figure 5). This is disturbed in the north-western part of the area, due to the much lower (49.1%) synchronicity detected in gauge Polanica–Zdrój in the Bystrzyca Dusznicka River catchment. The characteristic run of the isolines indicates stronger relationships between precipitation and runoff occurring in the southern and eastern parts of the area (the upper reaches of the Nysa Kłodzka River, and the Wilczka and Biała Lądecka catchments). This indicates a greater share of precipitation in this part of the area in the formation of the total annual runoff. In other words, it can be concluded that the eastern sub-catchments have larger contribution to the formation of the water resources in the study area. Interestingly, sub-catchments with higher synchronicity between precipitation and runoff have also relatively higher annual precipitation; an exception to this rule is the catchment area of the Bystrzyca Dusznicka River, where, with the highest precipitation in the whole study area (1277.8 mm at gauge Zieleniec), the synchronicity with water gauge Kłodzko reaches 53.3% (Table 4, Figure 5). The higher synchronicity of the eastern part of the study area can be attributed to its geology and soil permeability—it is built mostly of Precambrian metamorphic rocks, contrary to the Cretaceous sedimentary rocks prevailing in the western part. Moreover, higher synchronicity may result from relatively large slopes (30°) characteristic for the Śnieżnik Massif and the Bialskie Mountains [13].
4. Discussion and Conclusions
KV is one of the most important areas in Poland in terms of formation of the country’s water resources. At the same time it is one of the areas most vulnerable to floods in Poland. While most recent studies have analyzed extreme hydro-meteorological events in KV, this research has concentrated on relations between average precipitation and runoff in that area. The study confirms the findings of Olichwer [18], who classified the Nysa Kłodzka River catchment as an area of high hydrological activity. That author analyzed the water resource abundance along the Nysa Kłodzka River in individual sub-catchments closed by river gauges Międzylesie, Bystrzyca Kłodzka II, and Kłodzko, respectively, focusing on the total and groundwater runoff. While such an approach allowed for determination of the long-term variability of water resources in KV, the adopted method of dividing the area made it impossible to detect differences between the eastern and western parts (sub-catchments) of the Nysa Kłodzka River catchment. As a result, it was also impossible to obtain the full picture of the complex hydrological relationships of this area. In contrast, the results of our study have proved that, in order to study water resources of a given area, analysis of their changes along the river may be insufficient. Thus, it seems to be justified to investigate water resources of each sub-catchment separately and analyze its impact on the formation of water resources in the whole area, of which it is a part.
It has been revealed that the eastern part of KV is more hydrologically active, while the western part is more hydrologically inert than the eastern one. By hydrological activity we mean contribution of precipitation in respective sub-catchments to runoff in the analyzed area (the Nysa Kłodzka River catchment closed by water gauge Kłodzko). It can be concluded that the eastern sub-catchments are richer in terms of water resources. It should be noted that these are rivers with frequent floods, including catastrophic floods [13]. The greater hydrological activity of the eastern (right) tributaries of the Nysa Kłodzka River is also evidenced by the greater variability of the flow of these rivers and greater abundance of water resources [19]. In the analyzed area, a diversified structure of both the water supply (precipitation) and runoff is also observed. While precipitation in the highest situated areas is similar, and even in the Bystrzyca Dusznicka sub-catchment (rain gauge Zieleniec) in the western part of the area is clearly higher (above 1270 mm), the total runoff is higher in the eastern sub-catchments. In the western part, the component of the total runoff from the snowmelt supply in the spring season is more significant, while in the eastern part the volume of the snowmelt runoff is similar, but the contribution of the summer rainfall grows considerably. That differentiation results from both the location and exposure of the sub-catchments, as well as the meteorological conditions triggering floods in the study area [9,10]. A consequence of the different water supply structure of the KV rivers is also a noticeable differentiation of the runoff regime. In the eastern part of the Nysa Kłodzka River catchment they represent the nival-pluvial type, while in the western part the nival type, with a much lower runoff in the summer season [19,29]. The KV rivers also differ in the terms of the stability and uncertainty of the flow regime characteristics [28,38,39]. Rivers in the eastern part of the area (as Wilczka, Biała Lądecka) and the upper Nysa Kłodzka are characterized by greater entropy (uncertainty) of the flow height than in the western part. On the other hand, the uncertainty of the monthly runoff distribution is higher in the case of the left (western) tributaries of the Nysa Kłodzka River, which proves their greater equalization in the annual cycle than in the case of the right (eastern) tributaries. The Bystrzyca Dusznicka River in the western part of the upper Nysa Kłodzka River catchment is also characterized by the lowest stability of the maximum monthly flows, which makes their uncertainty the highest.
This study is part of the analysis of the synchronous occurrence of hydro-meteorological phenomena using the copula function. In a similar approach, relationships between the amount of rainfall [40] and runoff [21,22,37,41], as well as between the flow and the amount of material transported by water [36,42,43], and also relations between snowmelt flood volume and peak discharge [44], and between the water levels of coastal lakes and sea water levels [45] were analyzed. These papers are evidence of successful application of the copulas in hydro-meteorological studies, but these methods also have their limitations. The major one is data availability and the necessity of using homogenous data sets of the same length and derived from the same observation period. In our research we faced some problems, including the lack of a rain gauge station located in the Bystrzyca River catchment (Figure 1), which made it impossible to analyze the Pt–Rt synchronicity in this catchment.
Another limitation refers to the used copula types; in our study, the bivariate (2D) copula functions were used, but there is a potential to use, e.g., the three-dimensional (3D) copulas, successfully applied in hydrological analyses. Multi-dimensional vine copulas were used for example in adopting a pair-copula function to analyze the encounter frequency of high–low annual runoff-sediment yields between different stations [43], developing probabilistic projections of multidimensional river flood risks at a convection-permitting scale [46], prediction of streamflow and the refinement of spatial precipitation estimates [47], or analyzing extreme storm surges induced by tropical cyclones [48].
The next significant issue, raised in the copula-related research, is uncertainty and reliability of the constructed models. It has to be noted that there is a lack of sufficient efforts, which should be made to uncover the underlying uncertainty, e.g., in the vine copula-based flood risk assessments [46]. On the other hand, there are proofs that probabilistic forecasting can be more informative (e.g., in providing the prediction uncertainty) than other deterministic models [47].
This research is a proposal to further develop and adapt the copula-based methodology in studies on the precipitation-runoff relationships and water resources of a given area. It also confirms the applicative value of the copula theory: The method presented can be used to evaluate the availability of water resources in areas playing the key role in their formation on different scales. Prospective related studies on water resources in KV should seek interdependencies in the precipitation and runoff patterns, and other relations between these variables (analyzed jointly and separately), also in the winter and summer half-years of the hydrological year.
To conclude, major highlights of the implemented research are as follows:
- Copulas can be used in studies on regional precipitation-runoff relations and to determine probabilistic values of analyzed variables.
- The precipitation-runoff relationship can be presented as the synchronous occurrence of these variables, and graphically depicted using isolines of synchronicity.
- The eastern tributaries of the Nysa Kłodzka River are more hydrologically active than the western ones, and they determine the amount of water resources of the study area.
- The regime features of rivers in KV depend on the type and distribution of precipitation over the year, and consequently on its relation with runoff in the sub-catchments of the Nysa Kłodzka River and its tributaries.
Author Contributions
Conceptualization, A.P. and D.W.; methodology, A.P., L.S. and D.W.; software, A.P.; validation, A.P., L.S. and D.W.; formal analysis, A.P.; investigation A.P. and D.W.; resources, D.W. and A.P.; data curation, A.P.; writing—original draft preparation, A.P.; writing—review and editing, A.P., D.W. and L.S.; visualization, A.P.; supervision, A.P. and D.W.; project administration, A.P.; funding acquisition, A.P., L.S. and D.W. All authors have read and agreed to the published version of the manuscript.
Funding
The research was carried out under the “GEO-INTER-APLIKACJE” project (No. POWR.03.02.00-00-I027/17), implemented at the Faculty of Geographical and Geological Sciences of Adam Mickiewicz University in Poznań, Poland.
Data Availability Statement
Data available on request due to restrictions e.g., privacy or ethical. The data presented in this study are available on request from the corresponding author.
Acknowledgments
We thank the editors and reviewers for their comments and suggestions which has significantly helped us to improve the manuscript.
Conflicts of Interest
The authors declare no conflict of interest.
References
- Sitterson, J.; Knightes, C.; Parmar, R.; Wolfe, K.; Muche, M.; Avant, B. An Overview of Rainfall-Runoff Model Types; U.S. Environmental Protection Agency: Washington, DC, USA, 2017.
- Moradkhani, H.; Sorooshian, S. General Review of Rainfall-Runoff Modeling: Model Calibration, Data Assimilation, and Uncertainty Analysis. In Hydrological Modelling and the Water Cycle; Sorooshian, S., Hsu, K.L., Coppola, E., Tomassetti, B., Verdecchia, M., Visconti, G., Eds.; Springer: Berlin/Heidelberg, Germany, 2009; pp. 1–24. [Google Scholar] [CrossRef] [Green Version]
- Beven, K.J. Rainfall-Runoff Modelling: The Primer, 2nd ed.; Wiley-Blackwell: Hoboken, NJ, USA, 2012; ISBN 978-0-470-71459-1. [Google Scholar]
- Teng, F.; Huang, W.R.; Cai, Y.; Zheng, C.M.; Zou, S.B. Application of Hydrological Model PRMS to Simulate Daily Rainfall Runoff in Zamask-Yingluoxia Subbasin of the Heihe River Basin. Water 2017, 9, 769. [Google Scholar] [CrossRef] [Green Version]
- Zhang, W.-Y. Application of NRCS-CN Method for Estimation of Watershed Runoff and Disaster Risk. Geomat. Nat. Hazards Risk 2019, 10, 2220–2238. [Google Scholar] [CrossRef] [Green Version]
- Młyński, D. Analysis of Problems Related to the Calculation of Flood Frequency Using Rainfall-Runoff Models: A Case Study in Poland. Sustainability 2020, 12, 7187. [Google Scholar] [CrossRef]
- Młyński, D.; Wałęga, A. Identification of the Relationship between Rainfall and the CN Parameter in Western Carpathian Mountain Catchments in Poland. Sustainability 2020, 12, 9317. [Google Scholar] [CrossRef]
- Młyński, D.; Wałęga, A.; Książek, L.; Florek, J.; Petroselli, A. Possibility of Using Selected Rainfall-Runoff Models for Determining the Design Hydrograph in Mountainous Catchments: A Case Study in Poland. Water 2020, 12, 1450. [Google Scholar] [CrossRef]
- Bednorz, E.; Wrzesiński, D.; Tomczyk, A.M.; Jasik, D. Classification of Synoptic Conditions of Summer Floods in Polish Sudeten Mountains. Water 2019, 11, 1450. [Google Scholar] [CrossRef] [Green Version]
- Wrona, B. Meteorological and Morphological Conditions of Extreme Precipitation in the Upper and Middle Odra River Basin; Materiały Badawcze, Seria: Meteorologia 41; IMGW: Warszawa, Poland, 2008. (In Polish) [Google Scholar]
- Szalińska, W.; Urban, G.; Otop, I. Assessment of Precipitation Volumes causing Summer Floods in the Middle Odra River Basin. Infrastrukt. Ekol. Teren. Wiej. 2008, 9, 227–238. (In Polish) [Google Scholar]
- Łach, J. The History of Floods in the Kłodzko Land and their Impact on the Direction of Transformation of the Valley Bottoms of the Nysa Kłodzka and Biała Lądecka Rivers. Nauka Przyr. Technol. 2009, 3, 93. (In Polish) [Google Scholar]
- Łach, J. The Role of Torrential Rains and Floods in Modeling the Relief of the Kłodzka Valley and the Western Mountain Ranges of the Eastern Sudetes; Instytut Geografii i Rozwoju Regionalnego Uniwersytet Wrocławski: Wrocław, Poland, 2012; ISBN 978-83-62673-24-7. (In Polish) [Google Scholar]
- Rutkowska, A.; Willems, P.; Niedzielski, T. Relation between Design Floods based on Daily Maxima and Daily Means: Use of the Peak Over Threshold Approach in the Upper Nysa Kłodzka Basin (SW Poland). Geomat. Nat. Hazards Risk 2016, 8, 585–606. [Google Scholar] [CrossRef]
- Niedzielski, T.; Miziński, B. Real-Time Hydrograph Modelling in the Upper Nysa Kłodzka River Basin (SW Poland): A Two-Model Hydrologic Ensemble Prediction Approach. Stoch. Environ. Res. Risk Assess. 2017, 31, 1555–1576. [Google Scholar] [CrossRef] [Green Version]
- Stodolak, R.; Baran, J.; Knap, E. Influence of the Assumed Time Distributions of Rain Variability on the Results of RainFall-Runoff Modeling. Inż. Ekol. 2018, 19, 87–93. (In Polish) [Google Scholar] [CrossRef]
- Jeziorska, J.; Niedzielski, T. Applicability of TOPMODEL in the Mountainous Catchments in the Upper Nysa Kłodzka River Basin (SW Poland). Acta Geophys. 2018, 66, 203–222. [Google Scholar] [CrossRef] [Green Version]
- Olichwer, T. Long-Term Variability of Water Resources in Mountainous Areas: Case Study—Klodzko Region (SW Poland). Carpathian J. Earth Environ. Sci. 2018, 14, 29–38. [Google Scholar] [CrossRef]
- Perz, A. Characteristics of the Flow Regime of the Kłodzka Valley Rivers. Badania Fizjograficzne Seria A Geografia Fizyczna 2019, 70, 65–83. (In Polish) [Google Scholar] [CrossRef]
- Xing, Z.Q.; Yan, D.H.; Zhang, C.; Wang, G.; Zhang, D.D. Spatial Characterization and Bivariate Frequency Analysis of Precipitation and Runoff in the Upper Huai River Basin, China. Water Resour. Manag. 2015, 29, 3291–3304. [Google Scholar] [CrossRef]
- Perz, A.; Sobkowiak, L.; Wrzesiński, D. Spatial Differentiation of the Maximum River Runoff Synchronicity in the Warta River Catchment, Poland. Water 2020, 12, 1782. [Google Scholar] [CrossRef]
- Sobkowiak, L.; Perz, A.; Wrzesiński, D.; Faiz, M.A. Estimation of the River Flow Synchronicity in the Upper Indus River Basin Using Copula Functions. Sustainability 2020, 12, 5122. [Google Scholar] [CrossRef]
- Kondracki, J. Regional Geography of Poland; Wydawnictwo Naukowe PWN: Warszawa, Poland, 2013. (In Polish) [Google Scholar]
- Solon, J.; Borzyszkowski, J.; Jodłowski, M.; Kistowski, M.; Kot, R.; Krąż, P.; Lechnio, J.; Macias, A.; Majchrowska, A.; Malinowska, E.; et al. Physico-Geographical Mesoregions of Poland: Verification and Adjustment of Boundaries on the Basis of Contemporary Spatial Data. Geogr. Pol. 2018, 91, 143–170. [Google Scholar] [CrossRef]
- Staffa, M. Dictionary of Tourist Geography of the Sudetes. Vol. 15: The Kłodzko Valley and the Upper Nysa Trench; I-BiS: Wrocław, Poland, 1993; pp. 315–318. (In Polish) [Google Scholar]
- Regional Water Management Authority (RZGW) in Wrocław. Development of the Nysa Kłodzka River Balance Catchment Characteristics. 2013. Available online: https://wroclaw.rzgw.gov.pl/files_mce/Planowanie%20w%20gospodarowaniu%20wodami/charakterystyka_nysa_klodzka.pdf (accessed on 10 March 2021). (In Polish)
- Peel, M.C.; Finlayson, B.L.; McMahon, T.A. Updated World Map of the Köppen-Geiger Climate Classification. Hydrol. Earth Syst. Sci. 2007, 11, 1633–1644. [Google Scholar] [CrossRef] [Green Version]
- Wrzesiński, D. Use of Entropy in the Assessment of Uncertainty of River Runoff Regime in Poland. Acta Geophys. 2016, 64, 1825–1839. [Google Scholar] [CrossRef] [Green Version]
- Wrzesiński, D. Flow Regime Patterns and Their Changes. In Management of Water Resources in Poland; Zeleňáková, M., Kubiak-Wójcicka, K., Negm, A.M., Eds.; Springer Water: Cham, Switzerland, 2021; pp. 163–180. [Google Scholar] [CrossRef]
- Sklar, A. Fonction de re´Partition an Dimensions et Leurs Marges; Publications de L´Institute de Statistique de l’Université de Paris: Paris, France, 1959; Volume 8, pp. 229–231. [Google Scholar]
- Fan, L.L.; Wang, H.R.; Wang, C.; Lai, W.L.; Zhao, Y. Exploration of Use of Copulas in Analysing the Relationship between Precipitation and Meteorological Drought in Beijing, China. Adv. Meteorol. 2017, 2017, 1–11. [Google Scholar] [CrossRef]
- Akaike, H. A New Look at the Statistical Model Identification. IEEE Trans. Autom. Control. 1974, 19, 716–723. [Google Scholar] [CrossRef]
- Nelsen, R.B. An Introduction to Copulas; Springer: New York, NY, USA, 1999. [Google Scholar]
- Chen, L.; Guo, S. Copulas and Its Application in Hydrology and Water Resources; Springer: Singapore, 2019. [Google Scholar] [CrossRef]
- Genest, C.; Favre, A.-C. Everything You Always Wanted to Know about Copula Modeling but Were Afraid to Ask. J. Hydrol. Eng. 2007, 12, 347–368. [Google Scholar] [CrossRef]
- Zhang, J.; Ding, Z.; You, J. The Joint Probability Distribution of Runoff and Sediment and its Change Characteristics with Multi-Time Scales. J. Hydrol. Hydromech. 2014, 62, 218–225. [Google Scholar] [CrossRef] [Green Version]
- Gu, H.; Yu, Z.; Li, G.; Ju, Q. Nonstationary Multivariate Hydrological Frequency Analysis in the Upper Zhanghe River Basin, China. Water 2018, 10, 772. [Google Scholar] [CrossRef] [Green Version]
- Wrzesiński, D. Uncertainty of Flow Regime Characteristics of Rivers in Europe. Quaest. Geogr. 2013, 32, 43–53. [Google Scholar] [CrossRef] [Green Version]
- Wrzesiński, D.; Sobkowiak, L. Detection of Changes in Flow Regime of Rivers in Poland. J. Hydrol. Hydromech. 2018, 66, 55–64. [Google Scholar] [CrossRef] [Green Version]
- Zhang, Q.; Wang, B.; Li, H. Analysis of Asynchronism-Synchronism of Regional Precipitation in Inter-Basin Water Transfer Areas. Trans. Tianjin Univ. 2012, 18, 384–392. [Google Scholar] [CrossRef]
- Chen, J.; Gu, S.X.; Zhang, T. Synchronous-Asynchronous Encounter Probability Analysis of High-Low Runoff for Jinsha River, China, using Copulas. MATEC Web Conf. 2018, 246, 01094. [Google Scholar] [CrossRef]
- Zhou, N.Q.; Zhao, L.; Shen, X.P. Copula-based Probability Evaluation of Rich-Poor Runoff and Sediment Encounter in Dongting Lake Basin. Sci. Geogr. Sin. 2014, 34, 242–248. (In Chinese) [Google Scholar] [CrossRef]
- You, Q.; Jiang, H.; Liu, Y.; Liu, Z.; Guan, Z. Probability Analysis and Control of River Runoff–sediment Characteristics based on Pair-Copula Functions: The Case of the Weihe River and Jinghe River. Water 2019, 11, 510. [Google Scholar] [CrossRef] [Green Version]
- Ozga-Zielinski, B.; Ciupak, M.; Adamowski, J.; Khalil, B.; Malard, J. Snow-Melt Flood Frequency Analysis by Means of Copula based 2D Probability Distributions for the Narew River in Poland. J. Hydrol. Reg. Stud. 2016, 6, 26–51. [Google Scholar] [CrossRef] [Green Version]
- Plewa, K.; Perz, A.; Wrzesiński, D.; Sobkowiak, L. Probabilistic Assessment of Correlations of Water Levels in Polish Coastal Lakes with Sea Water Level with the Application of Archimedean Copulas. Water 2019, 11, 1292. [Google Scholar] [CrossRef] [Green Version]
- Zhang, B.; Wang, S.; Wang, Y. Probabilistic Projections of Multidimensional Flood Risks at a Convection-Permitting Scale. Water Resour. Res. 2021, 57, 57. [Google Scholar] [CrossRef]
- Liu, Z.; Zhou, P.; Chen, X.; Guan, Y. A Multivariate Conditional Model for Streamflow Prediction and Spatial Precipitation Refinement. J. Geophys. Res. Atmos. 2015, 120. [Google Scholar] [CrossRef] [Green Version]
- Zhang, B.; Wang, S. Probabilistic Characterization of Extreme Storm Surges Induced by Tropical Cyclones. J. Geophys. Res. Atmos. 2021, 126. [Google Scholar] [CrossRef]
Figure 1.
Study area and its geographical position in Poland.

Figure 2.
Example of combined accumulated curves of the probability of exceedance and the determination of sectors (1–9) with their various degrees of synchronicity or asynchronicity. Red points—empirical pairs of values; grey points—generated theoretical points based on calculated parameters of joint distribution.

Figure 3.
Examples of copula plots of gauges with: (A) the maximum synchronicity (gauges: Bielice–Kłodzko) and (B) the maximum asynchronicity (gauges: Polanica–Zdrój–Kłodzko) of the Pt and Rt in 1974–2013.
Figure 3.
Examples of copula plots of gauges with: (A) the maximum synchronicity (gauges: Bielice–Kłodzko) and (B) the maximum asynchronicity (gauges: Polanica–Zdrój–Kłodzko) of the Pt and Rt in 1974–2013.

Figure 4.
Precipitation and total runoff in the analyzed catchment areas of KV: (A) Average values for the multi-year period 1974–2013, (B) with an exceedance probability of 10%, (C) with an exceedance probability of 1%, and (D) with an exceedance probability of 0.2%.
Figure 4.
Precipitation and total runoff in the analyzed catchment areas of KV: (A) Average values for the multi-year period 1974–2013, (B) with an exceedance probability of 10%, (C) with an exceedance probability of 1%, and (D) with an exceedance probability of 0.2%.

Figure 5.
Synchronicity (%) of precipitation and runoff in the Nysa Kłodzka catchment closed by gauge Kłodzko.
Figure 5.
Synchronicity (%) of precipitation and runoff in the Nysa Kłodzka catchment closed by gauge Kłodzko.


Table 1.
Basic characteristics of analyzed rain gauge stations.
| Rain Gauge Station | Coordinates | Altitude (m a.s.l.) | Annual Precipitation (mm) | |
|---|---|---|---|---|
| Latitude | Longitude | |||
| Bielice | 50°16′ N | 17°00′ E | 695 | 935.9 |
| Chocieszów | 50°27′ N | 16°29′ E | 405 | 765.2 |
| Kłodzko | 50°26′ N | 16°36′ E | 356 | 577.2 |
| Międzygórze | 50°13′ N | 16°46′ E | 585 | 985.4 |
| Międzylesie | 50°09′ N | 16°40′ E | 450 | 860.3 |
| Niemojów | 50°09′ N | 16°34′ E | 570 | 1005.8 |
| Nowy Gierałtów | 50°18′ N | 16°57′ E | 635 | 900.4 |
| Ołdrzychowice | 50°21′ N | 16°43′ E | 340 | 747.5 |
| Podzamek | 50°25′ N | 16°43′ E | 400 | 765.3 |
| Polanica-Zdrój | 50°25′ N | 16°31′ E | 390 | 873.3 |
| Zieleniec | 50°19′ N | 16°23′ E | 845 | 1277.8 |
Table 2.
Basic characteristics of analyzed river gauges.
| River | Gauge | Coordinates | Altitude (m a.s.l.) | Catchment Area (km2) | Runoff Depth (mm) | River Regime Type 1 | |
|---|---|---|---|---|---|---|---|
| Latitude | Longitude | ||||||
| Nysa Kłodzka | Międzylesie | 50°09′ N | 16°39′ E | 426 | 49.7 | 444 | 2 |
| Bystrzyca Kłodzka II | 50°17′ N | 16°39′ E | 338 | 260.0 | 481 | 4 | |
| Kłodzko | 50°26′ N | 16°39′ E | 281 | 1084.0 | 375 | 4 | |
| Wilczka | Wilkanów | 50°14′ N | 16°41′ E | 363 | 35.1 | 715 | 2 |
| Bystrzyca | Bystrzyca Kłodzka I | 50°17′ N | 16°39′ E | 340 | 64.0 | 484 | 2 |
| Biała Lądecka | Lądek Zdrój | 50°20′ N | 16°52′ E | 421 | 166.0 | 649 | 4 |
| Żelazno | 50°22′ N | 16°40′ E | 317 | 305.0 | 508 | 4 | |
| Bystrzyca Dusznicka | Szalejów Dolny | 50°25′ N | 16°34′ E | 305 | 175.0 | 388 | 2 |
Table 3.
Copula function, parameter space, generating function , and functional relationship of Kendall’s τθ with a copula parameter for selected single-parameter bivariate Archimedean copulas.
Table 3.
Copula function, parameter space, generating function , and functional relationship of Kendall’s τθ with a copula parameter for selected single-parameter bivariate Archimedean copulas.
| Copula Family | Generator | Parameter | Kendall’s | |
|---|---|---|---|---|
| Clayton | ||||
| Gumbel–Hougaard | ||||
| Frank |
Table 4.
The percent synchronicity and asynchronicity of precipitation and runoff in analyzed rain gauge stations and water gauges in KV.
Table 4.
The percent synchronicity and asynchronicity of precipitation and runoff in analyzed rain gauge stations and water gauges in KV.
| Rain Gauge Station | Sectors | Syn. | Asyn. | ||||||||||
|---|---|---|---|---|---|---|---|---|---|---|---|---|---|
| 1 | 5 | 9 | 2 | 4 | 8 | 6 | 3 | 7 | Total | Moderate | High | ||
| Nysa Kłodzka River at gauge Międzylesie | |||||||||||||
| Międzylesie | 27.7 | 10.2 | 26.9 | 7.2 | 7.5 | 7.4 | 7.7 | 2.4 | 2.9 | 64.8 | 35.2 | 29.8 | 5.3 |
| Nysa Kłodzka River at gauge Bystrzyca Kłodzka II | |||||||||||||
| Międzylesie | 26.4 | 8.8 | 22.6 | 7.2 | 6.2 | 10.1 | 10.2 | 3.7 | 4.8 | 57.8 | 42.2 | 33.7 | 8.5 |
| Międzygórze | 22.6 | 7.9 | 23.3 | 9.0 | 9.7 | 8.0 | 7.6 | 6.0 | 5.9 | 53.7 | 46.3 | 34.4 | 11.9 |
| Nysa Kłodzka River at gauge Kłodzko | |||||||||||||
| Międzylesie | 26.9 | 8.9 | 24.5 | 6.0 | 6.3 | 9.7 | 10.3 | 3.7 | 3.7 | 60.4 | 39.6 | 32.3 | 7.3 |
| Międzygórze | 27.8 | 8.8 | 25.4 | 6.7 | 6.8 | 9.3 | 9.2 | 2.9 | 3.2 | 62.0 | 38.0 | 32.0 | 6.1 |
| Bielice | 26.7 | 10.2 | 27.5 | 8.5 | 8.2 | 7.2 | 6.5 | 2.3 | 2.9 | 64.4 | 35.6 | 30.5 | 5.1 |
| Nowy Gierałtów | 25.5 | 9.1 | 25.5 | 8.2 | 9.4 | 7.4 | 7.0 | 4.2 | 3.8 | 60.0 | 40.0 | 32.0 | 8.0 |
| Ołdrzychowice | 23.9 | 8.1 | 24.8 | 9.0 | 9.1 | 7.8 | 7.1 | 5.1 | 5.1 | 56.8 | 43.2 | 33.0 | 10.2 |
| Zieleniec | 24.3 | 7.9 | 21.0 | 7.3 | 7.1 | 9.6 | 10.2 | 6.4 | 6.1 | 53.3 | 46.7 | 34.2 | 12.5 |
| Chocieszów | 25.6 | 8.0 | 21.6 | 6.7 | 6.6 | 10.2 | 10.2 | 5.5 | 5.6 | 55.2 | 44.8 | 33.7 | 11.1 |
| Polanica-Zdrój | 22.4 | 7.5 | 19.2 | 7.6 | 7.7 | 9.9 | 10.1 | 7.3 | 8.2 | 49.1 | 50.9 | 35.4 | 15.5 |
| Podzamek | 22.5 | 8.3 | 24.1 | 9.2 | 9.2 | 8.3 | 8.0 | 5.1 | 5.3 | 54.9 | 45.1 | 34.7 | 10.4 |
| Kłodzko | 26.4 | 8.5 | 22.3 | 7.3 | 6.8 | 9.3 | 9.9 | 4.8 | 4.9 | 57.1 | 42.9 | 33.3 | 9.7 |
| Wilczka River at gauge Wilkanów | |||||||||||||
| Międzygórze | 25.6 | 9.1 | 26.3 | 8.3 | 9.4 | 7.1 | 6.2 | 4.1 | 3.8 | 61.0 | 39.0 | 31.1 | 7.9 |
| Biała Lądecka River at gauge Lądek Zdrój | |||||||||||||
| Bielice | 25.3 | 9.1 | 28.9 | 8.2 | 8.7 | 6.3 | 7.2 | 3.1 | 3.1 | 63.3 | 36.7 | 30.5 | 6.2 |
| Nowy Gierałtów | 26.8 | 8.7 | 25.5 | 8.3 | 7.9 | 8.3 | 8.3 | 3.1 | 3.0 | 61.0 | 39.0 | 32.8 | 6.1 |
| Biała Lądecka River at gauge Żelazno | |||||||||||||
| Bielice | 25.9 | 9.5 | 26.4 | 8.4 | 8.9 | 7.3 | 7.1 | 3.0 | 3.4 | 61.9 | 38.1 | 31.7 | 6.4 |
| Nowy Gierałtów | 27.1 | 8.9 | 24.3 | 6.3 | 6.3 | 10.0 | 9.3 | 3.4 | 4.4 | 60.3 | 39.7 | 31.9 | 7.8 |
| Ołdrzychowice | 21.5 | 7.3 | 20.5 | 7.4 | 7.8 | 10.3 | 10.1 | 7.5 | 7.5 | 49.4 | 50.6 | 35.6 | 15.0 |
| Bystrzyca Dusznicka River at gauge Szalejów Dolny | |||||||||||||
| Zieleniec | 28.6 | 9.6 | 27.4 | 6.9 | 7.2 | 7.3 | 8.0 | 2.4 | 2.4 | 65.7 | 34.3 | 29.5 | 4.8 |
| Chocieszów | 26.6 | 8.3 | 24.9 | 6.7 | 6.9 | 10.0 | 9.2 | 3.7 | 3.7 | 59.8 | 40.2 | 32.8 | 7.4 |
| Polanica-Zdrój | 23.4 | 7.4 | 21.1 | 7.8 | 7.5 | 10.0 | 10.9 | 5.9 | 6.0 | 51.9 | 48.1 | 36.2 | 11.9 |
Publisher’s Note: MDPI stays neutral with regard to jurisdictional claims in published maps and institutional affiliations. |
© 2021 by the authors. Licensee MDPI, Basel, Switzerland. This article is an open access article distributed under the terms and conditions of the Creative Commons Attribution (CC BY) license (https://creativecommons.org/licenses/by/4.0/).
Share and Cite
MDPI and ACS Style
Perz, A.; Sobkowiak, L.; Wrzesiński, D. Probabilistic Approach to Precipitation-Runoff Relation in a Mountain Catchment: A Case Study of the Kłodzka Valley in Poland. Water 2021, 13, 1229. https://doi.org/10.3390/w13091229
AMA Style
Perz A, Sobkowiak L, Wrzesiński D. Probabilistic Approach to Precipitation-Runoff Relation in a Mountain Catchment: A Case Study of the Kłodzka Valley in Poland. Water. 2021; 13(9):1229. https://doi.org/10.3390/w13091229
Chicago/Turabian StylePerz, Adam, Leszek Sobkowiak, and Dariusz Wrzesiński. 2021. "Probabilistic Approach to Precipitation-Runoff Relation in a Mountain Catchment: A Case Study of the Kłodzka Valley in Poland" Water 13, no. 9: 1229. https://doi.org/10.3390/w13091229
Note that from the first issue of 2016, this journal uses article numbers instead of page numbers. See further details here.