
How Polluting Industries React to Ambient Water Quality: Seven River Basins in China


1
Business School, Hohai University, Nanjing 211100, China
2
Yangtze Institute for Conservation and Development, Hohai University, Nanjing 210098, China
*
Author to whom correspondence should be addressed.
Water 2021, 13(9), 1232; https://doi.org/10.3390/w13091232
Submission received: 29 March 2021
/
Revised: 25 April 2021
/
Accepted: 27 April 2021
/
Published: 29 April 2021
Abstract
:Water pollution in China has expanded from regions to river basins. It is of great significance to study the behaviors of regulated subjects from the perspective of river basins for protecting the water environment and improving the effectiveness of environmental regulations. This paper constructed a basin spatial regression design to discuss the governance effect and economic effect of water pollution from industry in relation to the central environmental protection goal of China, as well as the response and strategy of local government. Considering the validity of the data, the annual average chemical oxygen demand (COD) concentration of each monitoring station was adopted as the ambient water quality index, and there was direct evidence that the ambient water quality index influenced water-polluting industries. We found that, if the downstream COD concentration in the last year rose by 1 mg/L, the water-polluting industries reduced their pollution and output value by 1.9% and 0.2%, respectively. After using the upstream COD concentration as the tool variable, the result was still robust. However, the results of local government’s two strategies, which we can call regulatory constraint force and fiscal incentive force, were opposites. Specifically, the governance effect of polluting industries under regulatory constraints was more significant, while fiscal incentives encourage water-polluting industries to create more value. In addition, we estimated the impact of ambient water quality on water-polluting industries in the Yangtze River Basin and the Yellow River Basin, and revealed that the governance effect exceeded the average value of seven river basins. After further distinguishing the relative upstream cities and relative downstream cities, the results show that the response of relative upstream cities to water quality was significantly higher, and the gap between regions expanded further after 2013.
1. Introduction
The world is facing an invisible water quality crisis: the challenge from pollutants keeps pace with GDP (Gross Domestic Product) growth. Environmental pollution not only poses a threat to human and environmental health, but also has a negative impact on economic development, and seriously polluted areas could even lose one-third of their potential economic growth [1,2]. According to the Bulletin on the State of the Ecological Environment (2018) issued by the Ministry of Ecology and Environment (MEE) of China, water pollution is common in the seven major river basins in China. Among them, the water quality of the Yangtze River and Pearl River is better; the Yellow River, Songhua River and Huaihe River are slightly polluted; and the Haihe River and Liaohe River are moderately polluted. Moreover, the annual economic loss caused by water pollution in river basins exceeds 200 billion yuan, about 10% of GDP in China. City planners and policymakers in various countries are actively concerned about the impact of water quality changes of river basins on economy and ecology [3], and even applied some models to restore rivers to reverse urban river syndrome [4]. This paper aims to explore and design appropriate environmental policies for the water-polluting industry based on the government behavior, so as to achieve the win–win goals of emissions reduction and economic growth in river basins [5,6].
Empirical evidence from developed countries showed that the government is the most important source of environmental pressure and a traditional regulatory structure with strict monitoring and enforcement is the first and greatest driving force for many environmental compliance decisions [7]. It is known to us that environmental factors often have the attributes of public goods. Taking the river basin as an example, it usually has the characteristics of fixed flow direction and pollutant transfer, leading to the typical negative externality of upstream enterprises’ emission behaviors [8]. Thus, the impact of regulators and legislatures on environmental performance is greater than that of community organizations, rights groups, and the media [9]. Environmental monitoring and law enforcement activities from government not only reduce pollution violations, but also greatly reduce emissions [10]. According to the classical decentralization theory, local governments generally have stronger information advantages and supply efficiency than the central government [11]. Local residents vote with their feet to ensure that public services match their preferences, so as to better manage the environment [12]. For this reason, the Chinese government has established a decentralized governance system. The emissions targets are set by the central government, and local governments are responsible for formulating and implementing detailed environmental regulations [13]. Some scholars investigated the emissions reduction effect of vertical reform under China’s water management system, and obtained some positive conclusions [14]. For some specific environmental policies, such as River Chief System [15], National Key Monitoring Enterprises, etc., it has also been verified that the implementation of these policies significantly reduced the emissions of pollutants [16,17].
Considering that environmental strategy is embedded in the political and economic system in China, it may also reflect the self-interest of local officials. The core of water quality management is to control the amount of pollutants discharged into the water in river basins. The direct cost of reducing pollution is related to the scale and technology of the plant itself, while the social benefits are affected by the amount of pollutants produced and number of people affected. As the local regulators, local governments need to pay more attention to the cost and benefits of governance when they strengthen the governance of polluting enterprises, and they may also be subject to political pressure from polluters [18]. Therefore, they tend to make strategic responses to constraints from the central government and seek the maximum political support for their behaviors [19]—that is to say, local governments and environmental protection departments change the environmental law enforcement strength in their jurisdiction according to the pollution emissions level of their adjacent areas [20]. In addition, local governments may even manipulate the location of polluting enterprises to transfer pollutants downstream, e.g., move polluting enterprises away from the monitoring stations set up by the central government and place polluting enterprises near the administrative boundary of the downstream jurisdiction [21,22]. Therefore, local law enforcement activities respond to the benefits and costs of different industry regulations, showing the flexibility of regulatory activities, and there is a limited effect in terms of reducing the actual pollution of enterprises [23].
It is necessary to explore the basin pollution problem from the perspective of different regulators, combined with the dual objectives of environmental governance and economic growth, and study the impact of environmental factors on the polluting industry in different regions of river basins. Our paper systematically reviews the relevant literature on environmental monitoring and law enforcement activities in China and has two scientific aims: one is to test the governance effect and economic effect of water quality monitoring on water-polluting industries, and the other is to explore the role of local governments in the process of environmental regulation and fiscal competition. The contribution of this paper is mainly reflected in the following aspects. Firstly, based on the data of seven river basins in China, a basin spatial regression model was designed from the perspective of behaviors of regulated subjects, which can be applied in other regions of the world. Secondly, according to the decentralization theory, we analyzed the behavior of regulators—that is, the mechanisms of central government and local government in the process of regulatory constraints and fiscal incentives, so as to achieve the win‒win goals of emissions reduction and economic growth in river basins. Thirdly, the Yangtze River Basin and the Yellow River Basin run across the eastern, middle, and western regions in China, and their high and low economic zones overlap with their downstream and upstream regions. Due to their unique geographic and economic characteristics, they were selected for further discussion to provide a reference for investigating the pollution abatement in typical river basins.
The rest of the paper is organized as follows. Section 2 briefly introduces the mechanisms from the perspective of different regulators. Section 3 summarizes the source of data and the establishment of a benchmark model. In Section 4, we explain the results of the empirical method. Some possible extensions are discussed in Section 5. Finally, we give some conclusions and suggestions in Section 6.
2. Background and Conceptual Framework
2.1. What Are the Effects of Environment Monitoring on Emissions Reduction and Economic Growth?
The efficient utilization and effective protection of water resources depend fundamentally on environmental monitoring. The direct goal of environmental monitoring is to reduce the emission of specific pollutants. The discharge reduction effect is inseparable from the construction of legislation and judicial structures, especially strict law enforcement procedures. In 2006, the 11th Five-Year Plan (2006–2010) first pointed out that the total amount of COD emissions should be reduced by 10%, which means that the form of emission control has changed into a double standard of concentration and total amount. As the supervision and inspection of environmental protection can produce a certain emissions reduction effect [24], with the improvement in China’s environmental monitoring, pollution governance has also made remarkable achievements.
Due to the differing intensity of law enforcement in the implementation process, the emissions reduction in provinces with higher penalties is relatively larger [25]. Moreover, judicial strengthening improves the situation of poor law enforcement in environmental governance, which significantly reduces the total amount of industrial wastewater discharge and per capita discharge.
Environmental monitoring can also affect the business activities of economic entities including polluting enterprises, and then have a certain impact on economic growth. According to traditional economic theory, the implementation of environmental policy inevitably brings about a cost rise and a profit margin decline for enterprises [26], which is not conducive to urban economic growth [27]. However, the Porter hypothesis holds that strict environmental policies can induce enterprises to innovate, and even offset external costs, especially for non-state-owned enterprises [28], so as to improve production efficiency.
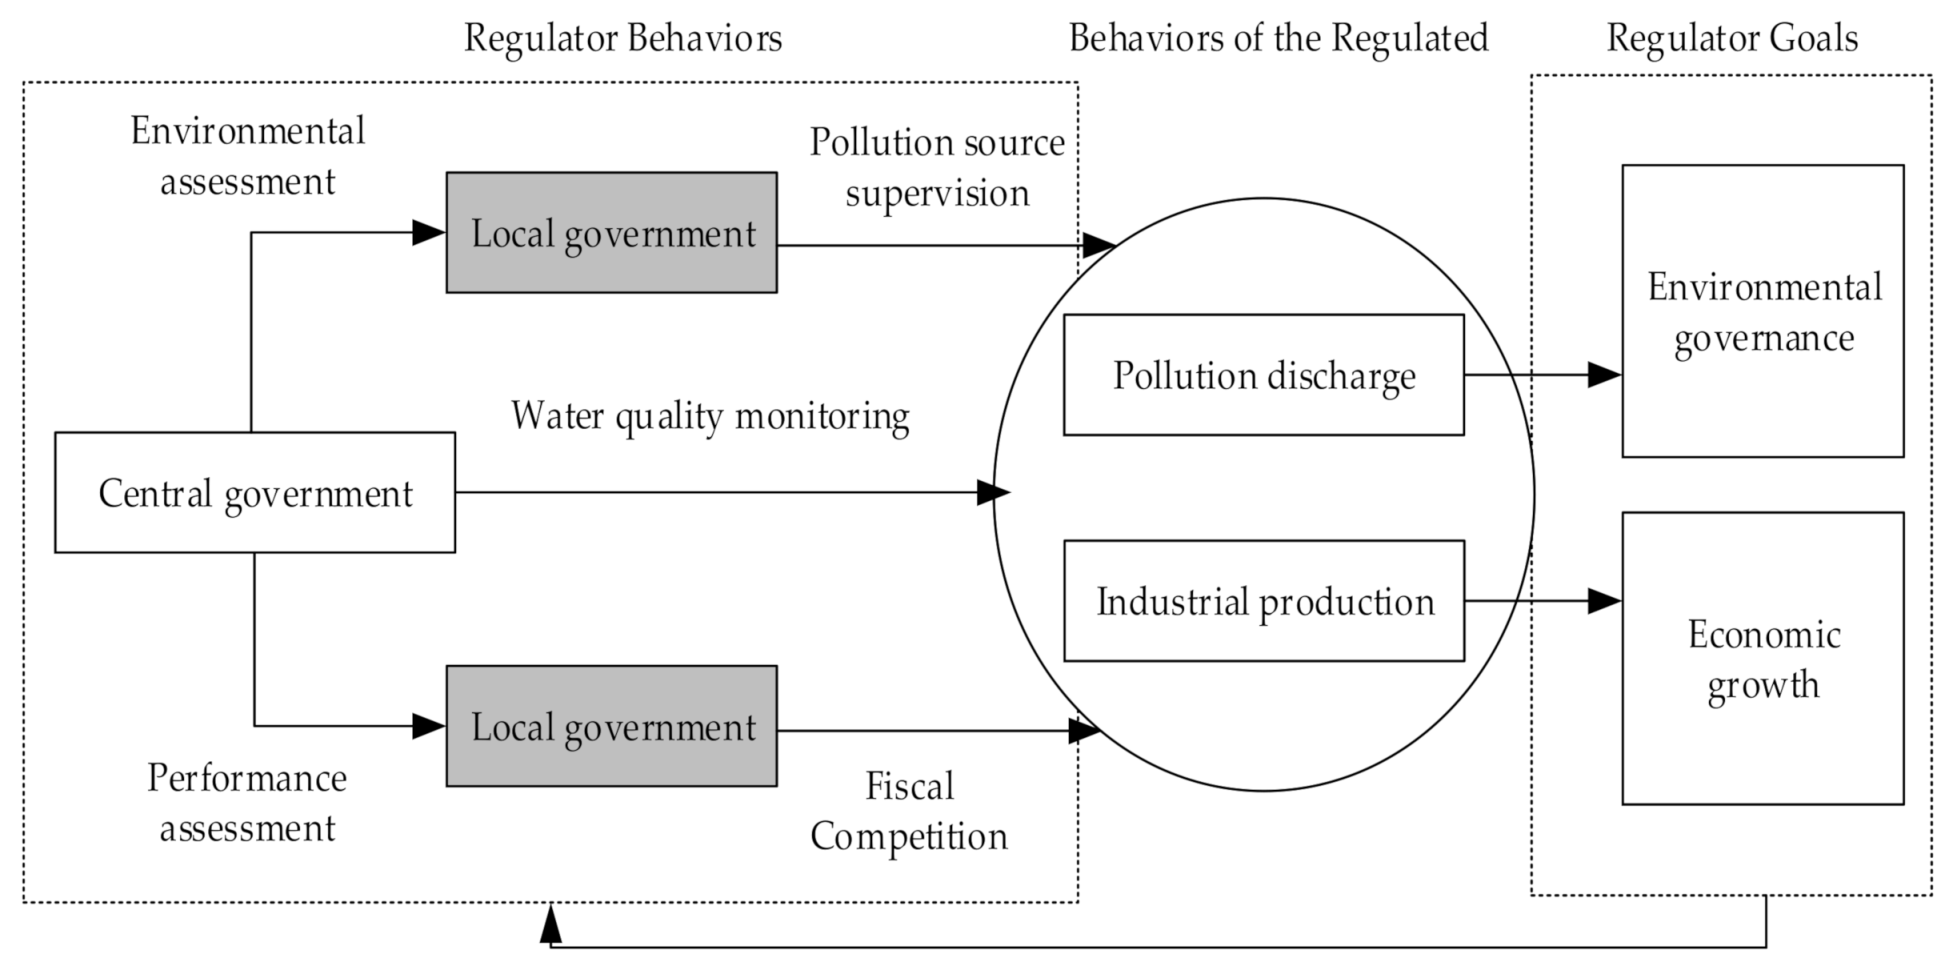
Considering the complementary strategic behaviors of local governments, the lack of independence of regulatory departments makes environmental monitoring a policy tool to achieve their goals [29]. In order to further explore the abatement decisions of local governments, we integrated regulatory constraint force and fiscal incentive force into an analysis framework to explain the failure of the local implementation (see Figure 1).
2.2. Will Changes in the Local Government’s Environmental Measures Affect Polluting Industries?
The first channel we focused on was the environmental measures of the local government, because they can be modified in response to water quality. The pollution haven hypothesis and the Porter hypothesis are representative theories to study the influence of environmental factors on polluting industries [30,31]. The former believes that local regulations transfer polluting industries to areas with weak regulation intensity and emphasizes the negative externality of cross-border pollution. The latter holds that environmental regulation promotes the progress of green technology in developed areas, and the spillover effect transfers technology to less developed areas.
Factor cost, transaction cost, and market demand are the costs of pollution control for enterprises. More stringent environmental regulations mean that enterprises need to pay higher environmental costs. At this time, polluting enterprises are faced with three choices: the first is to choose areas with lower regulatory intensity; the second is to reduce production or even stop production; and the third is to innovate green technology. Their choices depend on the relative cost-effectiveness and the effect of innovative compensation.
With the differentiation of regional economic development, cross-administrative transfer of industries becomes common in China, creating the phenomenon of the Flying Geese Paradigm [32]. In the embryonic stage of environmental regulations, some opportunity-driven firms try to evade strict regulation systems and transfer to relatively loose regions. There is evidence that China’s middle and western regions are becoming pollution refuges for industrial transfer from the eastern region [33]. The polluting industrial transfer is determined by the relative regulation intensity of transfer-in and transfer-out regions. Therefore, with the enhancement of the regulation intensity, the crowding-out effect of environmental policies can reduce the production and emissions of polluting industries [34]. As environmental regulations continue to become stricter, polluting enterprises with poor competitiveness or high pollution discharge will be eliminated or transferred out, while the remaining enterprises will promote the utilization of green technology. In this case, the impact of the innovation compensation effect exceeds the crowding-out effect [35].
Through the above analysis, we believe that the regulatory measures from local governments have a certain impact on the emissions and production of polluting industries, but the difference in the relative regulatory intensity between regions may have different effects. Concretely, the lower supervision intensity leads to the relocation of some opportunity-driven enterprises, and the higher supervision intensity may reduce or even stop production of polluting enterprises, which cannot develop the necessary innovations in a short time.
2.3. Does Local Government’s Fiscal Competition Hinder Environmental Improvement?
The second channel is local government fiscal competition, which can influence environmental governance. According to the traditional fiscal decentralization theory, local residents show their real preferences by voting with their feet [12], which makes local governments compete with each other to provide public goods that are more in line with residents’ preferences. In fact, China’s registered residence system restricts the free flow of residents between provinces—in other words, Chinese residents cannot show their real evaluation of public goods in the same way. Under the vertical assessment system of local government political championships, local environmental protection institutions and local governments have a closer and more direct authoritative relationship, which leads to regional differences in environmental quality.
There are two paths by which fiscal decentralization can affect environmental governance. On the one hand, there exists a spillover effect between local governments. To obtain liquidity factors such as capital and labor [11], local governments often adopt the strategy of bottom-up competition, which mainly manifests as competition to reduce the tax rate [36], increase fiscal expenditure, and decrease environmental regulations [37]. Moreover, they may compete to improve their regulations when pursuing liquidity elements of preference for a high-quality environment [38]. Overall, their competitive behaviors result in the overuse of the natural environment.
On the other hand, the externality of environmental pollution makes it difficult for local governments to cooperate effectively in river basin regulation. Local officials are appointed by the central government in China. Facing the incentive of political promotion, officials have their own motives, and do not necessarily give priority to the public interest. Therefore, under the unified leadership of the central government in China, officials prefer yardstick competition, which emphasizes the comparison of relative performance to deal with asymmetric information in the principal–agent framework [39]. They often choose free riding in basin governance, which brings about a decline in governance efficiency. If the degree of pollution is relatively high, local governments can also adopt the attitude of “not in my backyard” [19].
Generally speaking, for local government officials, although pollution control is directly related to performance appraisal, they are more inclined to develop the regional economy to achieve the maximum political gains. Therefore, no matter which path they choose, with an increasing degree of fiscal competition, the emissions and output of the polluting industry will increase.
3. Methods
3.1. Study Area
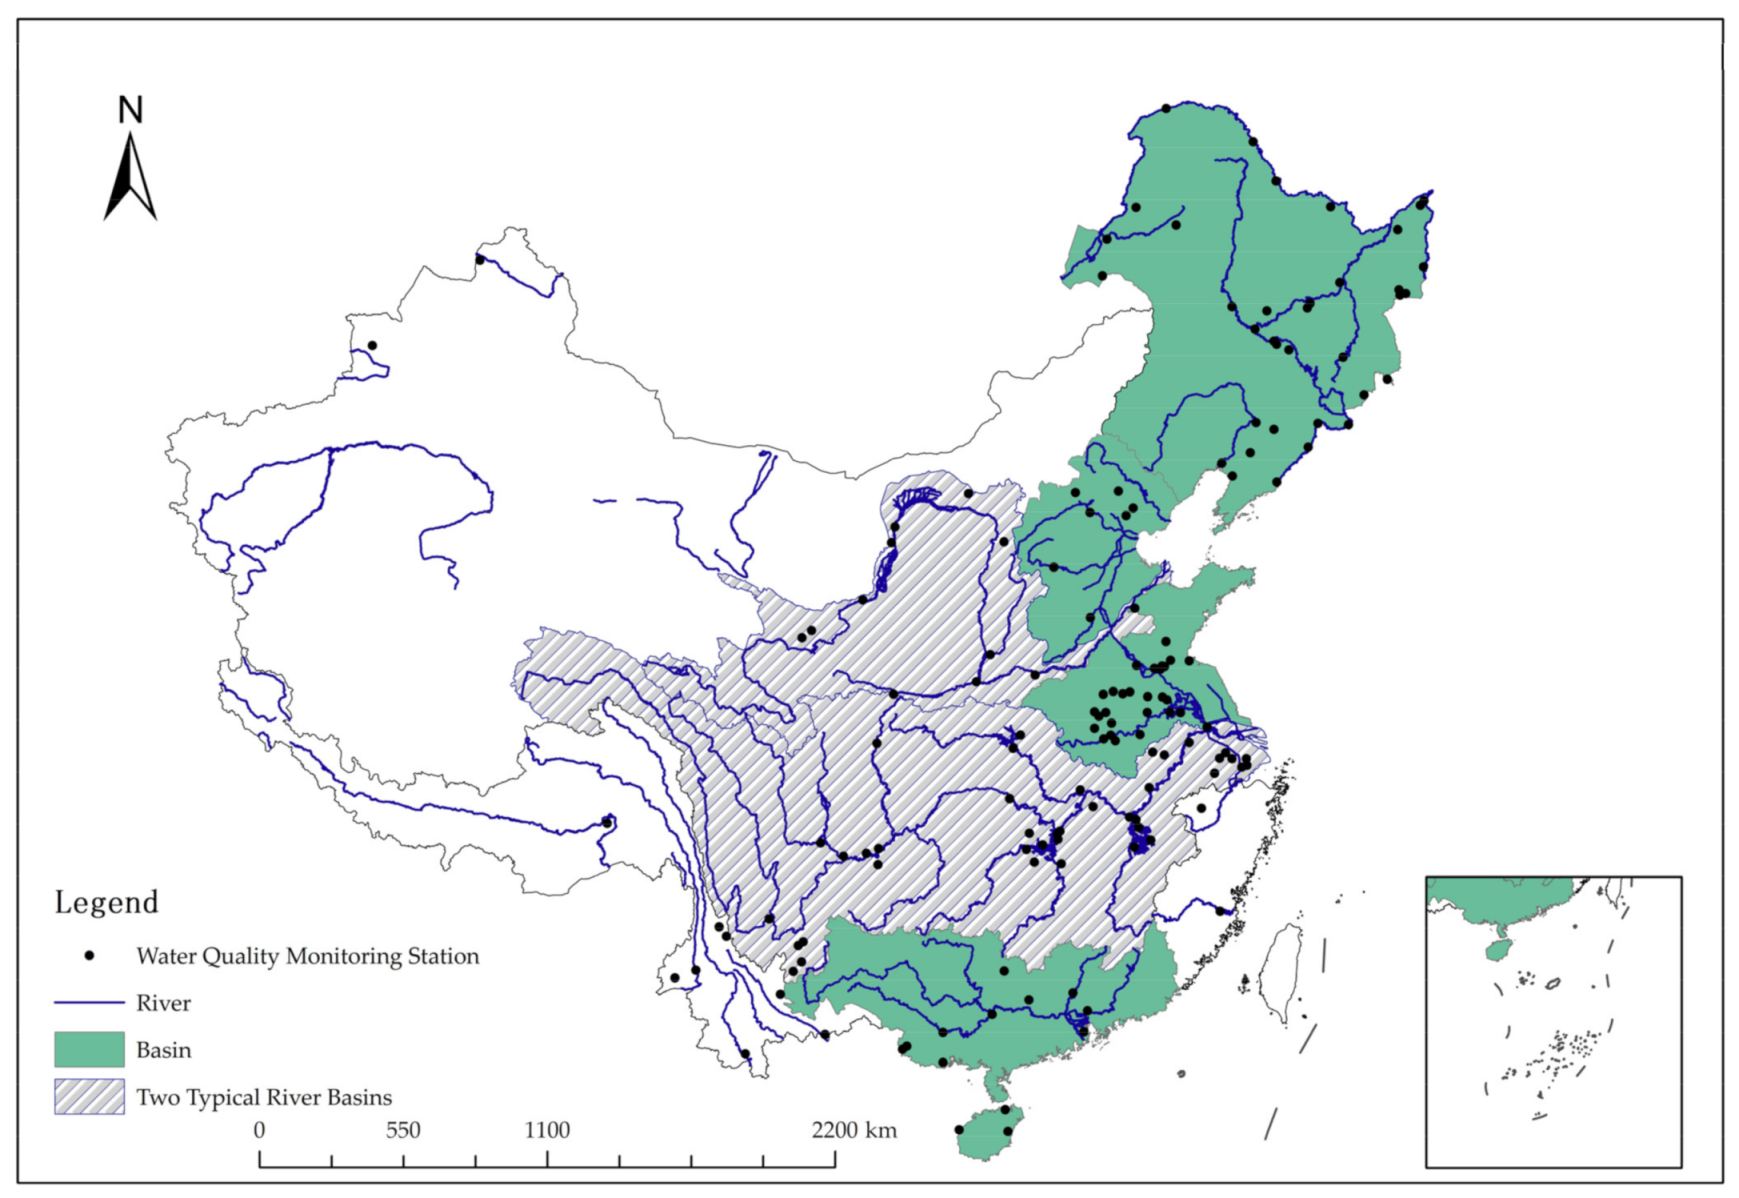
China has a vast territory with great differences in climate and topography. Rivers mainly flow into the Pacific Ocean, followed by the Indian Ocean, while a small number of rivers flow into the Arctic Ocean. Considering that each river has its own basin, the seven major river basins correspond to these seven rivers. Geographically, from north to south, the seven rivers are the Songhua River, Liaohe River, Haihe River, Yellow River, Huaihe River, Yangtze River, and Pearl River, all of which flow into the Pacific Ocean. Among them, the Yangtze River is the largest river in China, ranking third in the world in terms of river length and water inflow, covering a basin area of 1.807 million km2 and flowing through 19 provinces, with a main stream length of 6300 km. The Yellow River is the second-longest river, with a drainage area of more than 0.75 million km2. It flows through nine provinces and gathers more than 40 main tributaries and more than 1000 streams. Figure 2 shows the total coverage of the seven major river basins, especially the Yangtze River Basin and the Yellow River Basin, which are the only two that cross the eastern, middle, and western regions of China. We also note the location of 148 water quality monitoring stations and other main rivers on the map.
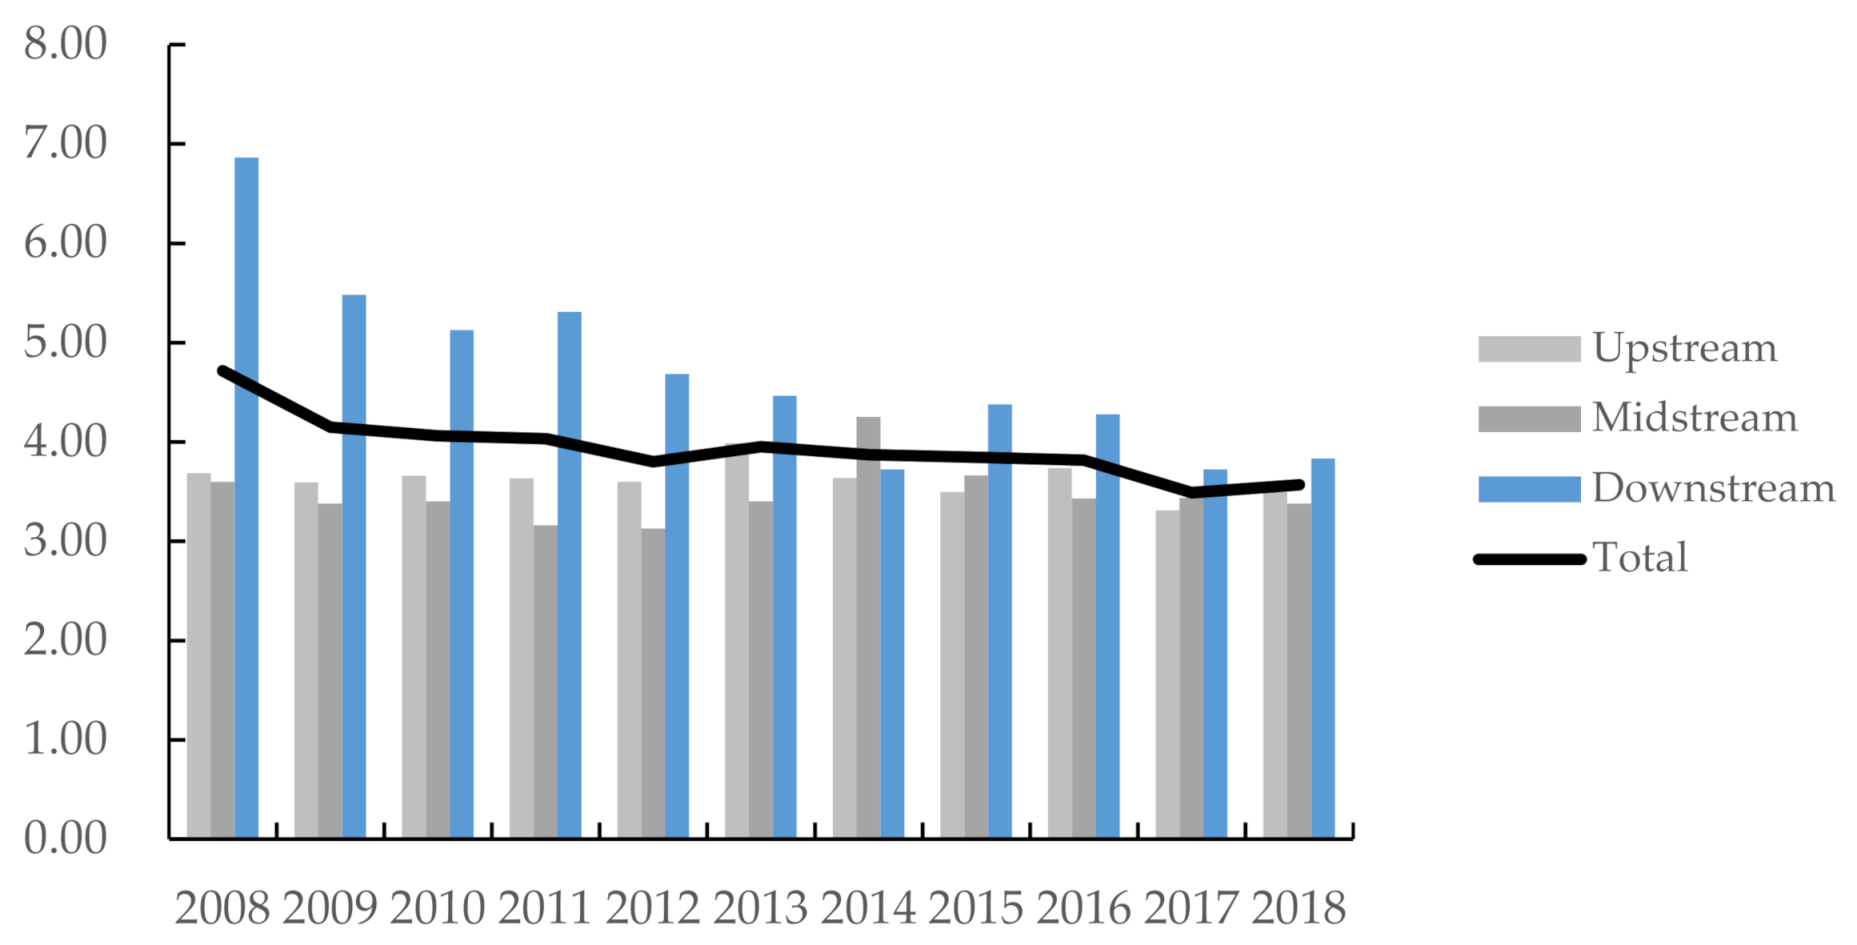
In order to understand pollution control between different regions in the basins, we referred to Zeng [40] and judged the upstream, midstream, and downstream attributes of the water quality monitoring station according to its geographical location. The annual average COD concentration of each monitoring station was used as the water quality index. We found that the COD concentration of the seven basins decreased by 24.3% from 2008 to 2018; in particular, the COD concentration in the downstream decreased by 44.2% (see Figure 3). The main reason for the obvious improvement in water quality may be that, since the 11th Five-Year Plan (2006–2010), China has placed restrictions on COD emissions and linked them with the performance of local officials. The water pollution control policy peaked in 2013. In that year, the general office of the State Council of China issued a stringent assessment method for water resources management, which sets control targets for the water quality compliance rate in water function zones of important rivers and lakes. Around 2014, the COD concentration in the upstream and midstream appeared abnormal—that is, it showed a significant increase, which will be discussed later in the text.
3.2. Data
We used the panel data of cities flowing through the main streams of seven river basins in China from 2008 to 2018, which cover 25 provinces. We evaluated the effect of ambient water quality on polluting industries’ discharges and production using data on the water quality measured at locations downstream from their effluent outfalls.
Considering the heterogeneity of industries, it is necessary to distinguish water-polluting industries. We calculated the proportion of COD emissions in 42 industrial sectors and regarded the 12 exceeding the average discharge intensity as water-polluting industries. Annual average industrial COD discharge is tracked by China’s Environmental Statistics Yearbook. The sample of water-polluting industries was for 2008–2018.
Our paper aims to discuss the environmental and economic effects of polluting industries under water environment monitoring. On the basis of screening out polluting industries, we estimated the sewage discharge of water-polluting industries from each city, and calculated its proportion in the seven river basins, which was taken as the governance effect indicator. Additionally, we calculated the gross output value of water-polluting industries from the panel of cities. Taking 2008 as the base period, we used the producer price index to deflate it, and finally took the logarithm of the adjusted output value as the economic effect indicator. The relevant city information came from China’s Urban Statistical Yearbook and the Statistical Yearbooks of China’s Provinces or Cities, except that producer price data were provided by China’s Industrial Statistical Yearbook. The time range of the yearbooks is 2009 to 2019.
Data on water quality come from the Weekly Report of Water Quality Automatic Monitoring of Key Sections in Major River Basins of China, which is provided by MEE. We used the annual average COD concentration of each monitoring station as the water quality index. From 2008 to 2018, the number of automatic water quality monitoring stations increased from 100 to 148 (see Figure 2). Finally, 112 monitoring stations were selected because of the validity of the data; most of them are concentrated in the Yangtze and Huaihe River Basins. The main stream between the monitoring stations flows through 147 cities in 25 provinces.
Local government behaviors in this paper can be divided into two categories: pollution supervision and fiscal competition. On the one hand, we estimated the relative intensity of local government’s environmental regulations under a vertical environmental system. Based on the research methods from Zhang et al. [41], we sorted out a List of Key National Monitoring Enterprises by prefecture-level cities over the years, which are released by MEE from 2008 to 2018. There are certain standards for the determination of state key monitoring wastewater enterprises. The industrial COD emissions were put in order from large to small, and some of the enterprises, whose total emissions account for 65% of total industrial emissions, were selected as the key monitoring objects. This list of monitoring enterprises was finally determined by MEE and the environmental protection departments of provinces after negotiation. The local environmental protection departments are responsible for supervision and report to the central office for assessment. Therefore, the proportion of monitoring enterprises in the seven riven basins was taken as the regulation intensity index. On the other hand, we referred to Guo and Jia [42] to reflect the local fiscal competition by estimating the ratio of fiscal expenditure and fiscal revenue at the prefecture level. When the indicator value becomes larger, officials are faced with weaker financial self-sufficiency and a higher degree of financial difficulty. Relevant data are from China’s Urban Statistical Yearbook over the period 2009–2019.
We also introduced some control variables based on the three aspects of industrial conditions, regional situation, and natural conditions.
In terms of industrial conditions, we mainly drew on the relevant research from Mao and Sheng [43], and set three indicators: technology structure, scale structure, and cost structure. Among them, capital density measures the capital input of each labor force in each city. The indicator value is mainly determined by the technology structure, and tends to increase with the progress of technology. Therefore, the capital density can reflect the technology structure to some extent. Then, industry size represents regional employment, and also reflects the relative abundance of regional labor resources and the development potential of the industry. This indicator can capture the externalities brought by industrial agglomeration, which is conducive to attracting enterprises [44]. Finally, labor cost indicates the average wages of workers in the city. New structural economics emphasizes that the relative price of factors is the core variable that affects the industrial structure. For some traditional industries, the rise of factor costs such as wages can force the upgrading of the industrial structure [45]; it also reduces the critical point for such enterprises to adopt advanced technology, and hence promotes industrial agglomeration.
In terms of regional situations, following previous studies, we can divide them into four parts. The first is the regional infrastructure. Infrastructure development is the foundation of economic growth [46]. There is no doubt that the condition of water supply is particularly important for the production of polluting industries. The second is the regional economy. Generally speaking, the larger the per capita production value, the more serious the resource consumption and environmental pollution [47]. The third is agricultural emissions. Limited by the availability of data, the amount of chemical fertilizer applied per unit sown area is used to represent the impact of agricultural emissions. The last is domestic sewage. Domestic sewage discharge is relatively intensive in densely populated areas. If the collection and treatment of domestic sewage are not improved in time, it is easy to cause damage to the water environment [48].
Natural conditions mainly refer to annual rainfall. An area with large annual rainfall also has large river runoff, and a large water environment capacity at the same time. Additionally, a stronger river purification capacity brings about better water quality [49].
The descriptive statistics of all variables are summarized in Table 1.
3.3. Model Specification
Our goal is to identify the causal effect of ambient water quality on polluting industries of sewage discharge and industrial production. Due to a possible causal relationship between ambient water quality and polluting firms, this paper estimated a panel data model where the dependent variable is Sewi.t and Indi,t of water-polluting industries and the main independent variable is CODi,t−1. The benchmark model is established as follows:
where i represents a prefecture-level city and t represents the year. Equation (1) mainly investigates the governance effect, while Equation (2) focuses on the economic effect. λ is the coefficient set of related control variables; Xi,t is a series of control variables, specifically including Kli,t, Empi,t, Wagei,t, Infrai,t, Pgdpi,t, Agrii,t, Pdi,t, and Raini,t; μi and νt, respectively, represent the regional effect and time fixed effect; and εi,t is a random disturbance term.
Sewi,t = α0 + α1Sewi,t−1 + α2CODi,t−1 + λXi,t + μi + νt + εi,t
Indi,t = α0 + α1Indi,t−1 + α2CODi,t−1 + λXi,t + μi + νt + εi,t
Of course, some worries about our research may be water-polluting industry classification or the reverse causality. Therefore, we chose polluting industries in another authoritative way to solve the problem of classification of polluting industries. Lagging downstream water quality is affected by lagging pollutant emissions, resulting in lagging water quality being determined endogenously. To solve the potential endogenous problems, we revised Equations (1) and (2) and took the upstream water quality CODui,t−1 as a tool variable, because it directly affects the downstream water quality, while it is not influenced by the enterprise’s pollutant discharge decision.
Sewi,t = α0 + α1Sewi,t−1 + α2CODui,t−1 + λXi,t + μi + νt + εi,t
Indi,t = α0 + α1Indi,t−1 + α2CODui,t−1 + λXi,t + μi + νt + εi,t
In order to verify the behavior decision and strategy reflection of local government under the environmental protection goal, we referred to Zhang and Guo [41] and used the nonlinear method to demonstrate the impact of environmental regulation on environmental pollution. The model is as follows:
where Regui,t and Fini,t represent regulatory constraints and fiscal incentives in city i and year t.
Sewi,t = α0 + α1Sewi,t−1 + α2CODi,t−1 + α3Regui,t + α4Regui,t2 + α5Regui,t3 + α6Fini,t + λXi,t + μi + νt + εi,t
Indi,t = α0 + α1Indi,t−1 + α2CODi,t−1 + α3Regui,t + α4Regui,t2 + α5Regui,t3 + α6Fini,t + λXi,t + μi + νt + εi,t
Considering that the Yangtze and Yellow Rivers run through the east and west of China, playing important strategic roles in Chinese development patterns, the regressions of Equations (1) and (2) were carried out for these two typical rivers. Furthermore, we established Equation (7) on the basis of Equation (1) to identify the differences between relative upstream and relative downstream regions, especially looking at the regulation effect after 2013. The model is established as follows:
where Time is the virtual variable of time, which is 1 in 2013 and after, and 0 before. We can observe the response of the polluting industry to water quality monitoring in upstream and downstream areas after 2013 via the coefficient and size of interaction term Time* CODi,t−1. The larger the absolute value of the coefficient, the more effective the effect. The interaction term Regui,t* Fini,t was introduced to observe the behaviors of local government, which showed that the partial effect of fiscal competition on pollution emissions depends on the degree of pollution regulation.
Sewi,t = α0 + α1Sewi,t−1 + α2CODi,t−1 + α3Time* CODi,t−1 + α4Fini,t + α5Regui,t* Fini,t + λXi,t + μi + νt + εi,t
4. Empirical Results
4.1. Analysis
The sample is a typical short panel; we applied the system GMM (Gaussian Mixture Model) to estimate it, because it is superior to the differential GMM in terms of estimation performance and computational efficiency. In order to avoid pseudoregression and ensure the validity of the estimation results, we used an LLC (Levin-Lin-Chu) test to check the unit root of each variable sequence. The p-value showed that the original hypothesis is rejected at the 5% confidence interval—that is to say, all variables were stable.
Table 2 reports the results of the benchmark regression, showing the governance effect and economic effect after controlling the geographical and temporal characteristics. It can be seen that, consistent with our expectations, the coefficients of water quality were significantly negative. The coefficients in columns (1) and (2) of Table 2 indicate that if the average COD rose by 1 mg/L in the past year, plants reduced their discharge by 1.9% and decreased their production by 0.2%, respectively. Overall, we found positive evidence of past downstream water quality influencing polluting plants’ decisions. Moreover, the coefficients of the lag period of the dependent variables were both significantly positive. This indicated that the intensity of initial pollution causes more serious pollution later, which means that the behavior of water-polluting industries is a cumulative and continuous process.
From the regression results of other control variables, we see that the overall conditions of the industry played a positive role in the decision making of polluting enterprises, especially labor cost and industry size, whose coefficients reached 0.328 and 0.304 in the economic effect. The polluting industries screened out are dependent on resources, most of which belong to traditional manufacturing industries, with the characteristics of low technology, low value-added, and high resource consumption. This means that, for them, the abundance of production factors is the most important factor, and the scale effect will promote their agglomeration. In contrast, they have limited requirements for technical advancement.
In terms of regional conditions, regional infrastructure is very important to polluting industries, and its positive effect on sewage discharge reached 0.089, which passed the 1% significance test. Most areas in China are changing from high energy consumption industry to clean service industry; however, the current economic growth still leads to different degrees of resource consumption and environmental pollution. After controlling the pollution of planting and living caused by agricultural production and residential life, the results show that they both had positive impacts on the polluting industry; in particular, the impact of planting scale on pollution emissions was 0.047.
4.2. Robustness Test
In order to enhance the reliability, we checked the robustness of the above results. The categories of polluting industries were revised first. The Bulletin of the First National Census of Pollution Sources (2010), released by MEE, shows that the total amount of COD discharges from the top seven industrial sectors exceeds more than 81.1% of total emissions in China. For this reason, we referred to Cai et al. [22] and defined these seven industries as polluting industries.
Due to the high correlation between current and lagged pollution emissions, the lagged water quality is determined endogenously. Therefore, upstream water quality is taken as a tool variable because it directly affects the downstream water quality, and is also irrelevant to the pollutant discharge decisions of enterprises [50].
Table 3 shows the results of using upstream water quality as a tool variable. In terms of the governance effect on the polluting industry, the result is not as significant as the original estimate. For every 1 mg/L increase in upstream COD, the emission intensity of the polluting industry reduced by 1.5%, which was 0.4% less than the coefficient in the first column of Table 2. At the same time, if the upstream COD increases by 1 mg/L, the economic effect of polluting industries will be weakened by 0.8%, which is larger than that in Table 2. The results show that our estimation of the causal effects of environmental water quality on emissions and industrial production is robust.
5. Discussion
5.1. Regulatory Constraints and Fiscal Incentives from Local Governments
It is known to us that local governments may control the implementation intensity according to the local economic development, which leads to nonlinear results between regulation intensity and firm behaviors [41]. Moreover, under the pressure of fiscal competition and political promotion, some officials may sacrifice the environment to achieve economic growth, causing more emissions from polluting industries. Therefore, some results from the behavior of local governments raised further research questions.
Table 4 and Table 5 show the stepwise regression results of Equations (5) and (6), respectively. First, we investigated the impact of environmental regulation on polluting industries. There was a positive N-shaped relationship between pollution discharge and environmental regulation. According to the descriptive statistics of the variable, the value range of the regulation indicator was mainly between the two inflection points, which means that the environmental regulations and pollution emissions intensity presented a negative relationship. This proved that improving the regulation intensity can reduce the emissions of enterprises to a certain extent.
In terms of the economic effect, there was an inverted U-shaped relationship between environmental regulations and industrial production, and its inflection point was about 6.5. If the regulation intensity is less than 6.5, the production value becomes higher with the increase in regulation intensity. In these circumstances, lower regulation intensity resulted in the evasion of environmental supervision by some opportunity-driven enterprises. With the resource enrichment and infrastructure improvement, these enterprises develop rapidly and attract the transfer of related industries in other regions, which is greatly conducive to local productive activities. When the intensity exceeds this inflection point, strong supervision significantly reduces industrial production by improving regulation standards. Considering that polluting firms cannot innovate production technology in a short time, they can only reduce or even stop production to avoid the high cost of sewage treatment.
We further analyzed the impact of local government fiscal competition on the polluting enterprises. The results are shown in the last column of Table 4 and Table 5. The coefficients are both positive, which indicates that if the fiscal competition becomes more intense, the local polluting firms will increase their emissions and output. Although COD emissions reduction is directly linked with performance evaluation, officials still vigorously promote economic growth in order to advance their political interests. Moreover, the fiscal competition coefficient of the economic effect was 0.026, which was more significant than the governance effect. This is because local governments make a lot of financial investments to attract capital inflow, and the centralization of industrial capital enhances the industrial agglomeration.
5.2. Discussion in Two Typical River Basins
Among the seven major rivers, the Yangtze River and Yellow River are the two that cut across the regions of eastern, middle, and western China. They play important strategic roles in Chinese development patterns. Moreover, they have unique characteristics of geography and economy—that is, the regions with high and low economic levels overlap with the downstream and upstream of the two rivers. The Yangtze River Basin is an important petrochemical base with a high proportion of steel, automobile, petrochemical, and cement in China, and the Yellow River Basin develops the raw material processing industry in its upstream and midstream. Overall, their development has a strong dependence on water resources. The regression results of these two rivers were estimated according to Equations (1) and (2). It can be seen from Table 6 that the results are significant; in particular, the governance effect exceeded the average level by an absolute value of 0.4%. The central government has issued a series of policies to implement the protection of the water bodies and mountains in these two basins.
Then, we focused on the governance effect by defining regions except for downstream as relative upstream cities, and the cities except for upstream as relative downstream cities. Due to the abnormal values during 2013–2014 (see Figure 3), the water quality indicator of 2013 and subsequent years was recalculated in the form of interactive terms. It is seen in Table 7 that the relative upstream cities had more significant responses to the water environment. Concretely, for every 1 mg/L increase in COD concentration, the wastewater emission was 0.6% less than that downstream. After 2013, the coefficients of the two regions were −0.015 and −0.007, respectively, indicating that the impact of water quality on pollution emissions had increased, and the gap between regions expanded further. This is because the Chinese government has put forward stringent environmental constraints from the perspective of ecological protection, especially higher requirements for environmental protection of water sources [51].
In addition, the behavior of local government was discussed. The coefficient of fiscal competition was positive, while the coefficients of its interaction term was negative. When the regulation index was equal to its mean value, we estimated the partial effect of fiscal competition on pollution emissions, and found that the results of the relative upstream and relative downstream areas were both negative. It can be seen that, after the implementation of environmental protection measures, the local government behavior in the two typical river basins is conducive to pollution reduction.
6. Conclusions
In this paper, from the perspective of river basins, the impact of environmental water quality on polluting industry was discussed by using a panel regression model combined with the spatial characteristics of rivers. We found clear evidence that ambient water quality had both a governance effect and an economic effect on polluting industries. If the average COD rose by 1 mg/L in the year prior, the emissions of the polluting industries would be reduced by 1.9% and the output by 0.2%, respectively. The higher the initial pollution intensity, the more serious the later pollution. Due to most of the polluting industries being resource-dependent, some control variables of industry conditions played positive roles in the emissions and production of polluting enterprises. Pollution from agriculture and residences also had the same significant impact. After revising the classification of polluting industries and taking upstream water quality as an instrumental variable, the estimation results still have good robustness.
In terms of local government behavior responses and strategic choices, there was a negative correlation between the local environmental regulation and pollution emissions—that is, improving the intensity of regulations can reduce the emissions of polluting industries to a certain extent, while the local environmental regulations and industrial production showed an inverted U-shaped relationship in terms of the economic effect. However, the governance effect and economic effect of local government fiscal competition showed no difference. Generally speaking, when the regional fiscal competition became more intense, the emissions and output of local polluting enterprises increased.
To our knowledge, the ecological protection and high-quality development of the Yangtze River Basin and the Yellow River Basin are key development strategies in China. Therefore, taking these two typical basins as research objects, it was estimated that the governance effect in the two basins exceeded the average level, and the absolute value was 0.4% higher than the whole sample data. By further dividing relative upstream cities and relative downstream cities, it was found that the former had more significant responses to water environment in terms of industrial pollution emissions, and the gap between regions expanded further after 2013. The interaction term from the aspect of local government was always negative. When the regulation index was equal to its mean value, the partial effect of fiscal competition on pollution emissions was negative, which indicated that the behavior of local officials was conducive to environmental governance.
In general, with the continuous strengthening of water environment management from the central government in China, water quality monitoring has played a direct and positive role in the emissions reduction of polluting industries. Under competition from local governments, the division by administrative boundary leads to the risk of cross-border pollution. Officials tend to gain promotion through economic competition by reducing the threshold of resource supply and even inducing enterprises to overuse environmental resources, which leads to the development of regional economy and restrains the governance effect of the central government. In conclusion, in order to reduce emissions from polluting industries, regulatory authorities need to adhere to water quality monitoring and management. The central government should design both environmental and economic policies in China so as to avoid the unexpected environmental consequences caused by local government competition. Through the establishment of a set of effective restraints on local government’s behaviors, local governments can match environmental governance to local economic development, and fundamentally improve the water pollution governance.
Author Contributions
Conceptualization, S.-R.Z. and M.S.; data curation, S.-R.Z. and M.-X.L.; writing—original draft preparation, S.-R.Z. and S.-X.D.; writing—review and editing, S.-R.Z. and M.-X.L.; funding acquisition, S.-R.Z.; methodology, S.-X.D. All authors have read and agreed to the published version of the manuscript.
Funding
This research was funded by the National Natural Science Foundation of China (Grant No. 42071278), the Postgraduate Research & Practice Innovation Program of Jiangsu Province (Grant No. SJKY19_0400), and the Fundamental Research Funds for the Central Universities (Grant No. 2019B69714).
Institutional Review Board Statement
Not applicable.
Informed Consent Statement
Not applicable.
Data Availability Statement
The data presented in this study are available in this published article “How Polluting Industries React to Ambient Water Quality: Seven River Basins in China”.
Conflicts of Interest
The authors declare no conflict of interest.
References
- World Bank. Quality Unknown: The Invisible Water Crisis. Available online: https://www.worldbank.org/en/news/feature/2019/08/20/quality-unknown (accessed on 20 August 2019).
- Zhang, N.; Mao, Y. Spatial effects of environmental pollution on healthcare services: Evidence from China. Int. J. Environ. Res. Public Health 2021, 18, 1784. [Google Scholar] [CrossRef] [PubMed]
- Cai, W.; Li, Y.; Shen, Y.; Wang, C.; Wang, P.; Wang, L.; Niu, L.; Zhang, W. Vertical distribution and assemblages of microbial communities and their potential effects on sulfur metabolism in a black-odor urban river. J. Environ. Manag. 2019, 235, 368–376. [Google Scholar] [CrossRef] [PubMed]
- Abdi, R.; Endreny, T.; Nowak, D. A model to integrate urban river thermal cooling in river restoration. J. Environ. Manag. 2020, 258, 110023. [Google Scholar] [CrossRef] [PubMed]
- Li, F.; Phillips, M.A. The influence of the regulatory environment on Chinese urban water utilities. Water Resour. Manag. 2017, 31, 205–218. [Google Scholar] [CrossRef]
- Yu, X.; Wang, P. Economic effects analysis of environmental regulation policy in the process of industrial structure upgrading: Evidence from Chinese provincial panel data. Sci. Total Environ. 2021, 753, 142004. [Google Scholar] [CrossRef] [PubMed]
- Doonan, J.; Lanoie, P.; Laplante, B. Determinants of environmental performance in the Canadian pulp and paper industry: An assessment from inside the industry. Ecol. Econ. 2005, 55, 73–84. [Google Scholar] [CrossRef]
- Lai, W.Y. Pesticide use and health outcomes: Evidence from agricultural water pollution in China. J. Environ. Econ. Manag. 2017, 86, 93–120. [Google Scholar] [CrossRef]
- Delmas, M.A.; Toffel, M.W. Organizational responses to environmental demands: Opening the black box. Strat. Manag. J. 2008, 29, 1027–1055. [Google Scholar] [CrossRef]
- Gray, W.B.; Shadbegian, R.J. Optimal pollution abatement—Whose benefits matter, and how much. J. Environ. Econ. Manag. 2004, 47, 510–534. [Google Scholar] [CrossRef]
- Breton, A. Competitive Governments: An Economic Theory of Politics and Public Finance; Cambridge University Press: Cambridge, UK, 1998. [Google Scholar]
- Tiebout, C.M. A pure theory of local expenditures. J. Politi. Econ. 1956, 64, 416–424. [Google Scholar] [CrossRef]
- Zheng, S.; Kahn, M.E. Understanding China’s urban pollution dynamics. J. Econ. Lit. 2013, 51, 731–772. [Google Scholar] [CrossRef] [Green Version]
- Zhao, L.; Tang, Y.; Chen, S.Y. Environmental governance effect of vertical reform of environmental management system. World Econ. Pap. 2019, 249, 104–124. [Google Scholar]
- Ouyang, J.; Zhang, K.; Wen, B.; Lu, Y. Top-down and bottom-up approaches to environmental governance in China: Evidence from the River Chief System (RCS). Int. J. Environ. Res. Public Health 2020, 17, 7058. [Google Scholar] [CrossRef]
- Shen, K.R.; Jin, G. The policy effects of the environmental governance of Chinese local governments: A study based on the progress of the River Chief System. Soc. Sci. China 2018, 5, 92–115. [Google Scholar]
- Zhang, B.; Chen, X.; Guo, H. Does central supervision enhance local environmental enforcement? Quasi-experimental evidence from China. J. Public Econ. 2018, 164, 70–90. [Google Scholar] [CrossRef]
- Gray, W.B.; Shimshack, J.P. The effectiveness of environmental monitoring and enforcement: A review of the empirical ev-idence. Rev. Env. Econ. Policy 2011, 5, 3–24. [Google Scholar] [CrossRef]
- Shen, K.R.; Zhou, L. Local government competition, vertical environmental regulation and the pollution backflow effect. Econ. Res. 2020, 55, 35–49. [Google Scholar]
- Li, Y.Y.; Shen, K.R. Effectives of pollution control policies in China: An empirical analysis based on provincial industrial pollution data. Manag. World 2008, 7, 7–17. [Google Scholar]
- Duvivier, C.; Xiong, H. Transboundary pollution in China: A study of the location choice of polluting firms in Hebei Province. Environ. Dev. Econ. 2013, 18, 459–483. [Google Scholar] [CrossRef] [Green Version]
- Cai, H.; Chen, Y.; Gong, Q. Polluting thy neighbor: Unintended consequences of China’s pollution reduction mandates. J. Environ. Econ. Manag. 2016, 76, 86–104. [Google Scholar] [CrossRef]
- Lin, L. Enforcement of pollution levies in China. J. Public Econ. 2013, 98, 32–43. [Google Scholar] [CrossRef]
- Dasgupta, S.; Laplante, B.; Mamingi, N.; Wang, H. Inspections, pollution prices, and environmental performance: Evidence from China. Ecol. Econ. 2001, 36, 487–498. [Google Scholar] [CrossRef]
- Fan, Z.Y.; Zhao, R.J. Does rule of law promote pollution control? Evidence from the establishment of the environmental court. Econ. Res. 2019, 54, 21–37. [Google Scholar]
- Long, X.L.; Wan, W. Environmental regulation, corporate profit margins and compliance cost heterogeneity of different scale enterprises. China Ind. Econ. 2017, 6, 155–174. [Google Scholar]
- Chen, Y.J.; Li, P.; Lu, Y. Career concerns and multitasking local bureaucrats: Evidence of a target-based performance evaluation system in China. J. Dev. Econ. 2018, 133, 84–101. [Google Scholar] [CrossRef]
- Wang, B.B.; Qi, S.Z. The effect of market-oriented and command-and-control policy tools on emissions reduction innova-tion—an empirical analysis based on China’s industrial patents data. China Ind. Econ. 2016, 6, 91–108. [Google Scholar]
- Han, C.; Zhang, W.G.; Shan, S. Regulatory governance, public appeal and environmental pollution: Based on strategic in-teraction of environmental governance. Financ. Trade Econ. 2016, 9, 144–161. [Google Scholar]
- Copeland, B.R.; Taylor, M.S. North-South Trade and the Environment. Q. J. Econ. 1994, 109, 755–787. [Google Scholar] [CrossRef]
- Porter, M.E.; Van der Linde, C. Toward a new conception of the environment competitiveness relationship. J. Econ. Perspect. 1995, 9, 97–118. [Google Scholar] [CrossRef]
- Karkalakos, S. Capital heterogeneity, industrial clusters and environmental consciousness. J. Econ. Integr. 2010, 25, 353–375. [Google Scholar] [CrossRef] [Green Version]
- Lin, B.Q.; Zou, Z.Y. Changes of development stages and environmental policy choices in China. Soc. Sci. China 2014, 5, 81–95. [Google Scholar]
- Liu, Y.Q. A Study on the Economic and Environmental Effects of Environmental Regulation. MD. Thesis, Xiamen University, Xiamen, China, 2018. [Google Scholar]
- Huang, J.; Wang, M.J. Technological innovation, industrial agglomeration and environmental pollution. J. Shanxi Univ. Financ. Econ. 2016, 38, 50–61. [Google Scholar]
- Zodrow, G.R.; Mieszkowski, P. Pigou, Tiebout, property taxation and the under provision of local public goods. J. Urban Econ. 1986, 19, 356–370. [Google Scholar] [CrossRef]
- Case, A.C.; Rosen, H.S.; Hines, J.R. Budget spillovers and fiscal policy interdependence: Evidence from the states. J. Public Econ. 1993, 52, 285–307. [Google Scholar] [CrossRef]
- Fredriksson, P.G.; Millimet, D.L. Strategic interaction and the determination of environmental policy across U.S. States. J. Urban Econ. 2002, 51, 101–122. [Google Scholar] [CrossRef]
- Woods, N.D. Interstate competition and environmental regulation: A test of the race-to-the-bottom thesis. Soc. Sci. Q. 2006, 87, 174–189. [Google Scholar] [CrossRef]
- Zeng, W.H. Regulation on trans-boundary water pollution: A study on inter-judiciary river-basin pollution in China. China Econ. Q. 2008, 7, 447–464. [Google Scholar]
- Zhang, C.Y.; Guo, Y.Q. Can pollution-intensive industry transfer achieve win-win development in economy and environment. From the perspective of environmental regulation. J. Financ. Econ. Res. 2015, 41, 96–108. [Google Scholar]
- Guo, Q.W.; Jia, J.X. Fiscal decentralization, government structure and local government’s expenditure size. Econ. Res. 2010, 45, 59–72. [Google Scholar]
- Mao, Q.L.; Sheng, B. China’s manufacturing firms’ entry-exit and dynamic evolution of TFP size. Econ. Res. 2013, 48, 16–29. [Google Scholar]
- Fan, J.Y.; Feng, M.; Li, F.W. Industrial agglomeration and firm total factor production rate. J. World Econ. 2014, 37, 51–73. [Google Scholar]
- Cai, F.; Wang, D.W.; Qu, Y. Flying geese within borders: How China sustains its labor-intensive industries? Econ. Res. 2009, 44, 4–14. [Google Scholar]
- Hirschman, A.O. The Strategy of Economic Development; Yale University Press: London, UK, 1958. [Google Scholar]
- Xu, Z.S.; Kong, F.B. Level of economic development, industrial structure and environmental pollution: An empirical analysis of Jiangxi Province. Contemp. Financ. Econ. 2014, 8, 15–20. [Google Scholar]
- Duc, T.A.; Vachaud, G.; Bonnet, M.P.; Prieur, N.; Loi, V.D.; Anh, L.L. Experimental investigation and modelling approach of the impact of urban wastewater on a tropical river; a case study of the Nhue River, Hanoi, Viet Nam. J. Hydrol. 2007, 334, 347–358. [Google Scholar] [CrossRef]
- Qiao, L.; Shi, Y.T. Impact of runoff variations on water quality in a mountainous stream in the north area of China. S. N. Water Sci. Technol. 2011, 9, 123–125. [Google Scholar]
- Chakraborti, L. Do plants’ emissions respond to ambient environmental quality? Evidence from the clean water act. J. Environ. Econ. Manag. 2016, 79, 55–69. [Google Scholar] [CrossRef]
- He, G.; Wang, S.; Zhang, B. Watering down environmental regulation in China. Q. J. Econ. 2020, 135, 2135–2185. [Google Scholar] [CrossRef]
Figure 1.
Analysis framework of regulators’ behaviors.

Figure 2.
Map of seven major river basins and water quality monitoring stations in China. (Note: The shaded area represents the Yangtze River Basin and the Yellow River Basin, and the green shapes represent the total area of the other five basins.).
Figure 2.
Map of seven major river basins and water quality monitoring stations in China. (Note: The shaded area represents the Yangtze River Basin and the Yellow River Basin, and the green shapes represent the total area of the other five basins.).

Figure 3.
COD concentration in seven major basins (mg/L).


Table 1.
Descriptive statistics of all variables.
| Index | Variable | Indicator (Unit) | Mean | St. Dev. |
|---|---|---|---|---|
| Sewage discharge | Sewi.t | Proportion of wastewater discharge from polluting industries in the whole basin (%) | 1.219 | 1.487 |
| Production value | Indi,t | Logarithm of gross output value (million yuan) of water-polluting industries | 2.916 | 0.512 |
| Ambient water quality | CODi,t−1 | Lagged COD concentration (mg/L) | 3.956 | 2.529 |
| Pollution regulation | Regui,t | Proportion of state-controlled pollution source enterprises in the whole basin (%) | 1.219 | 1.443 |
| Fiscal competition | Fini,t | Ratio of fiscal expenditure to fiscal revenue (%) | 2.635 | 1.827 |
| Capital density | Kli,t | Logarithm of the ratio between the total investment in fixed assets (yuan) and employees (person) | 5.294 | 0.678 |
| Industry size | Empi,t | Logarithm of employees (10,000 persons) | 1.735 | 0.722 |
| Labor cost | Wagei,t | Logarithm of the average wage (yuan) of employees | 4.582 | 0.545 |
| Infrastructure | Infrai,t | Logarithm of total water supply (10,000 tons) | 4.066 | 0.617 |
| Economy | Pgdpi,t | Per capita GDP (10,000 yuan) | 4.914 | 3.343 |
| Planting pollution | Agrii,t | Ratio of chemical fertilizer application amount (converted into pure amount) and sown area (ton/hectare) | 0.367 | 0.232 |
| Living pollution | Pdi,t | Percent of population in urban areas (person/100 km2) | 4.163 | 2.908 |
| Annual rainfall | Raini,t | Annual rainfall (m) | 0.963 | 0.627 |
Table 2.
Dynamic panel model estimation results of ambient water quality impact on water-polluting industries.
Table 2.
Dynamic panel model estimation results of ambient water quality impact on water-polluting industries.
| Variable | Governance Effect | Economic Effect |
|---|---|---|
| Equation (1) | Equation (2) | |
| Sewi,t−1 | 0.655 ***(0.014) | |
| Indi,t−1 | 0.217 ***(0.015) | |
| CODi,t−1 | −0.019 ***(0.005) | −0.002 **(0.001) |
| Kli,t | 0.005 **(0.002) | 0.014 ***(0.005) |
| Empi,t | 0.041 *(0.045) | 0.304 ***(0.035) |
| Wagei,t | 0.121(0.077) | 0.328 ***(0.062) |
| Infrai,t | 0.089 ***(0.027) | 0.029 ***(0.011) |
| Pgdpi,t | 0.005 *(0.004) | 0.002 ***(0.001) |
| Agrii,t | 0.047 *(0.029) | 0.013 *(0.010) |
| Pdi,t | 0.001 *(0.010) | 0.004 *(0.004) |
| Raini,t | −0.096 *(0.020) | −0.025(0.007) |
| Constant | 1.212 ***(0.356) | 0.349 *(0.212) |
| μi | Yes | Yes |
| νt | Yes | Yes |
| AR(1) | 0.0303 | 0.0663 |
| AR(2) | 0.6714 | 0.3849 |
| Sargan test | 0.3088 | 0.1011 |
| Obs | 852 | 852 |
Note: standard error in parentheses; *** p < 0.01, ** p < 0.05, * p < 0.1.
Table 3.
Estimation results using upstream water quality as an instrumental variable.
| Variable | Governance Effect | Economic Effect |
|---|---|---|
| Equation (3) | Equation (4) | |
| Sewi,t−1 | 0.703 ***(0.006) | |
| Indi,t−1 | 0.475 ***(0.022) | |
| Codui,t | −0.015 ***(0.004) | −0.008 ***(0.001) |
| Additional Controls | Yes | Yes |
| μi | Yes | Yes |
| νt | Yes | Yes |
| AR(1) | 0.0344 | 0.0953 |
| AR(2) | 0.4313 | 0.3316 |
| Sargan test | 0.5525 | 0.1726 |
| Obs | 852 | 852 |
Note: standard error in parentheses; *** p < 0.01, ** p < 0.05, * p < 0.1.
Table 4.
The governance effect of local government behavior.
| Variable | Governance Effect | |||
|---|---|---|---|---|
| Equation (5) | ||||
| Sewi,t−1 | 0.618 ***(0.012) | 0.678 ***(0.019) | 0.615 ***(0.015) | 0.659 ***(0.014) |
| CODi,t−1 | −0.014 ***(0.005) | −0.021 ***(0.005) | −0.014 ***(0.005) | −0.017 ***(0.005) |
| Regui,t | 0.078 **(0.010) | 0.134(0.025) | 0.337 ***(0.055) | |
| Regui,t2 | −0.011 ***(0.001) | −0.091 ***(0.009) | ||
| Regui,t3 | 0.006 ***(0.000) | |||
| Fini,t | 0.010 *(0.014) | |||
| Additional Controls | Yes | Yes | Yes | Yes |
| μi | Yes | Yes | Yes | Yes |
| νt | Yes | Yes | Yes | Yes |
| AR(1) | 0.0240 | 0.0258 | 0.0013 | 0.0254 |
| AR(2) | 0.8472 | 0.5885 | 0.2332 | 0.6351 |
| Sargan test | 0.2623 | 0.3977 | 0.1591 | 0.3758 |
| Obs | 852 | 852 | 852 | 852 |
Note: standard error in parentheses; *** p < 0.01, ** p < 0.05, * p < 0.1.
Table 5.
The economic effect of local government behavior.
| Variable | Economic Effect | |||
|---|---|---|---|---|
| Equation (6) | ||||
| Indi,t−1 | 0.221 ***(0.015) | 0.259 ***(0.023) | 0.258 ***(0.015) | 0.228 ***(0.015) |
| CODi,t−1 | −0.002 *(0.001) | −0.002 ***(0.001) | −0.003 **(0.001) | −0.003 ***(0.006) |
| Regui,t | 0.009 ***(0.002) | 0.013 **(0.006) | 0.007(0.007) | |
| Regui,t2 | −0.001 **(0.001) | −0.001(0.001) | ||
| Regui,t3 | 0.000 *(0.000) | |||
| Fini,t | 0.026 ***(0.006) | |||
| Additional Controls | Yes | Yes | Yes | Yes |
| μi | Yes | Yes | Yes | Yes |
| νt | Yes | Yes | Yes | Yes |
| AR(1) | 0.0647 | 0.0635 | 0.0645 | 0.0693 |
| AR(2) | 0.3822 | 0.4416 | 0.4519 | 0.3605 |
| Sargan test | 0.1109 | 0.1095 | 0.1258 | 0.1409 |
| Obs | 852 | 852 | 852 | 852 |
Note: standard error in parentheses; *** p < 0.01, ** p < 0.05, * p < 0.1.
Table 6.
Estimation results of ambient water quality impact on water pollution industry in two typical rivers.
Table 6.
Estimation results of ambient water quality impact on water pollution industry in two typical rivers.
| Variable | Governance Effect | Economic Effect |
|---|---|---|
| Equation (1) | Equation (2) | |
| Sewi,t−1 | 0.852 ***(0.012) | |
| Indi,t−1 | 0.091 ***(0.001) | |
| CODi,t−1 | –0.023 ***(0.005) | –0.002 *(0.001) |
| Additional Controls | Yes | Yes |
| μi | Yes | Yes |
| νt | Yes | Yes |
| AR(1) | 0.0610 | 0.0932 |
| AR(2) | 0.3840 | 0.2101 |
| Sargan test | 0.7366 | 0.7211 |
| Obs | 471 | 471 |
Note: standard error in parentheses; *** p < 0.01, ** p < 0.05, * p < 0.1.
Table 7.
Comparison of the governance effects of two typical rivers on relative upstream and relative downstream cities.
Table 7.
Comparison of the governance effects of two typical rivers on relative upstream and relative downstream cities.
| Variable | Relative Upstream Cities | Relative Downstream Cities | ||
|---|---|---|---|---|
| Equation (7) | ||||
| Sewi,t−1 | 0.556 ***(0.008) | 0.540 ***(0.008) | 0.887 ***(0.007) | 0.882 ***(0.007) |
| CODi,t−1 | −0.011 **(−0.003) | −0.005 ***(0.002) | ||
| Time* CODi,t−1 | −0.015 ***(0.002) | −0.007 ***(0.002) | ||
| Fini,t | 0.026 ***(0.004) | 0.025 ***(0.005) | 0.045 ***(0.005) | 0.042 ***(0.005) |
| Regui,t* Fini,t | −0.027 ***(0.004) | −0.025 ***(0.004) | −0.057 ***(0.004) | −0.056 ***(0.004) |
| Additional Controls | Yes | Yes | Yes | Yes |
| μi | Yes | Yes | Yes | Yes |
| νt | Yes | Yes | Yes | Yes |
| AR(1) | 0.0228 | 0.0238 | 0.0510 | 0.0460 |
| AR(2) | 0.1894 | 0.1631 | 0.3022 | 0.3127 |
| Sargan test | 0.5544 | 0.5968 | 0.6475 | 0.7107 |
| Obs | 306 | 306 | 296 | 296 |
Note: standard error in parentheses; *** p < 0.01, ** p < 0.05, * p < 0.1.
Publisher’s Note: MDPI stays neutral with regard to jurisdictional claims in published maps and institutional affiliations. |
© 2021 by the authors. Licensee MDPI, Basel, Switzerland. This article is an open access article distributed under the terms and conditions of the Creative Commons Attribution (CC BY) license (https://creativecommons.org/licenses/by/4.0/).
Share and Cite
MDPI and ACS Style
Zou, S.-R.; Du, S.-X.; Song, M.; Li, M.-X. How Polluting Industries React to Ambient Water Quality: Seven River Basins in China. Water 2021, 13, 1232. https://doi.org/10.3390/w13091232
AMA Style
Zou S-R, Du S-X, Song M, Li M-X. How Polluting Industries React to Ambient Water Quality: Seven River Basins in China. Water. 2021; 13(9):1232. https://doi.org/10.3390/w13091232
Chicago/Turabian StyleZou, Sheng-Rui, Si-Xuan Du, Min Song, and Ming-Xian Li. 2021. "How Polluting Industries React to Ambient Water Quality: Seven River Basins in China" Water 13, no. 9: 1232. https://doi.org/10.3390/w13091232
Note that from the first issue of 2016, this journal uses article numbers instead of page numbers. See further details here.