
Projection of Future Drought Characteristics under Multiple Drought Indices
by
Muhammad Imran Khan
1, 
Xingye Zhu
1,
Xiaoping Jiang
2,*,
Qaisar Saddique
3,
Muhammad Saifullah
4,
Yasir Niaz
5 and
Muhammad Sajid
6 1
Research Center of Fluid Machinery Engineering and Technology, Jiangsu University, Zhenjiang 212013, China
2
Jiangsu Key Laboratory for Information Agriculture, Nanjing Agricultural University, Nanjing 210095, China
3
Collage of Water Resources & Architectural Engineering, Key Laboratory of Agricultural Soil and Water Engineering in Arid and Semi-Arid Areas, Ministry of Education, Northwest A&F University, Yangling 712100, China
4
Department of Agricultural Engineering, Muhammad Nawaz Shareef University of Agriculture, Multan 66000, Pakistan
5
Department of Agriculture Engineering, Khawaja Fareed University of Engineering and Information Technology, Punjab 64200, Pakistan
6
Department of Management Sciences, Bahira University Lahore, Punjab 54782, Pakistan
*
Author to whom correspondence should be addressed.
Water 2021, 13(9), 1238; https://doi.org/10.3390/w13091238
Submission received: 30 January 2021
/
Revised: 20 April 2021
/
Accepted: 20 April 2021
/
Published: 29 April 2021
(This article belongs to the Special Issue Climate Change Impacts on Water Resources)
Abstract
:Drought is a natural phenomenon caused by the variability of climate. This study was conducted in the Songhua River Basin of China. The drought events were estimated by using the Reconnaissance Drought Index (RDI) and Standardized Precipitation Index (SPI) which are based on precipitation (P) and potential evapotranspiration (PET) data. Furthermore, drought characteristics were identified for the assessment of drought trends in the study area. Short term (3 months) and long term (12 months) projected meteorological droughts were identified by using these drought indices. Future climate precipitation and temperature time series data (2021–2099) of various Representative Concentration Pathways (RCPs) were estimated by using outputs of the Global Circulation Model downscaled with a statistical methodology. The results showed that RCP 4.5 have a greater number of moderate drought events as compared to RCP 2.6 and RCP 8.5. Moreover, it was also noted that RCP 8.5 (40 events) and RCP 4.5 (38 events) showed a higher number of severe droughts on 12-month drought analysis in the study area. A severe drought conditions projected between 2073 and 2076 with drought severity (DS-1.66) and drought intensity (DI-0.42) while extreme drying trends were projected between 2097 and 2099 with drought severity (DS-1.85) and drought intensity (DI-0.62). It was also observed that Precipitation Decile predicted a greater number of years under deficit conditions under RCP 2.6. Overall results revealed that more severe droughts are expected to occur during the late phase (2050–2099) by using RDI and SPI. A comparative analysis of 3- and 12-month drying trends showed that RDI is prevailing during the 12-month drought analysis while almost both drought indices (RDI and SPI) indicated same behavior of drought identification at 3-month drought analysis between 2021 and 2099 in the research area. The results of study will help to evaluate the risk of future drought in the study area and be beneficial for the researcher to make an appropriate mitigation strategy.
1. Introduction
Drought is a natural phenomenon which has a serious impact due to varying precipitation duration, intensity, and distribution [1]. Drought is driven by rainfall deficit, which consists of the typical categories of meteorological drought, hydrological drought, socioeconomic drought, and agricultural drought [2]. Drought characteristics comprise of frequency, duration, intensity, and severity. Drought duration is the time in which the value of drought index is less than the standard value, which has been selected by an analyst. While drought severity is the soil moisture deficiency of the drought below, the given threshold value of drought, and drought intensity is the fraction of drought severity to the drought duration [3]. Moreover, annual average drought frequency can also be calculated by using the total number of drought events identified during drought period divided by the total duration of the drought period. Similarly, inter arrival or drought initiation time is an important characteristic that is defined as the period between initiation of one drought or starting month of precipitation and soil moisture deficit period [4]. Drought characteristics have been studied comprehensively and the inter arrival period of the agricultural droughts is inspected by using the statistical modeling approaches of the monthly PDSI data [5]. Similarly, Standardized Precipitation Index and Reconnaissance Drought Index were applied by using the monthly meteorological data for the assessment of drought intensity in Cyprus [6] and a similar study was conducted in Malta [7]. In the study by [8], the authors examined the hydrological drought identification by using a truncation level to identify the dry and wet periods in the historical river flow data. Similarly, ref. [9] examined the frequency and drought intensity of low flows. Stream Flow Drought Index and Standardized Runoff Index were used for the characterizing of hydrological drought. Stream Flow Drought Index is based on the cumulative volumes of stream flow, which was presented by [10] and used in two river basins in Greece. Simulated runoff data from the Variable Infiltration Capacity hydrological model was used by [11] to get the results of the Standardized Runoff Index instead of observed stream flow data. Moreover, new drought index which is called Regional Drought Area Index (RDSI) was developed for the better identification of severe drought events and weather types. Regional Drought Area Index (RDSI) is based on the daily stream flow and was proposed to characterize the drought affected area in northern-western Europe [12,13]. Considering the changes in precipitation and the increasing global temperature leads to climate change, variations may occur in the frequency of extreme events such as drought hazards [14]. Moreover, dependency on only one climatic variable (e.g., precipitation or temperature), which does not give complete information on drought events and absence of evapotranspiration, reduces its effectiveness [15]. Therefore, the drought index should be able to quantitatively characterize the severity of drought by assimilating the data of several factors, such as precipitation and evapotranspiration into a single numerical digit [16]. Many studies have showed that a single drought index might not illustrate the true descriptions of drought anomalies and, therefore, a multi drought index approach should be used for the comprehensive assessment of drought events [17]. Drought indices are the main methods for observing drought anomalies based on meteorological or hydrological variables. A large number of drought indices have been introduced for characterizing various aspects of drought anomalies across space and time, which include the Palmer Drought Severity Index and Standardized Precipitation Index. The Standardized Precipitation Index is used for detecting meteorological drought. The derivation of the Standardized Precipitation Index applies to a number of drought indices; for example, the Standardized Precipitation Evapotranspiration Index [18]. Similarly, one more drought index called Reconnaissance Drought Index was introduced by [19] and showed that the evaluation of drought events by using meteorological drought indices leads to accurate assessment if there is accurate balance between input and output and this cannot be attained by the drought indices like Standardized Precipitation Index without any output estimation. Additionally, the SPI does not demonstrate the true picture of atmospheric conditions, except precipitation. Furthermore, the Standardized Precipitation Index has many limitations, for example, lack of consideration of potential evapotranspiration (PET), runoff, and infiltration. Therefore, there is a crucial need of a drought index that also considers the other climatic variables such as temperature and evapotranspiration. Moreover, researchers recommended that for studying drought monitoring and food security, it is much better to use SPI with other drought indices. Multiple drought indices have been used in a compound framework by many researchers worldwide [20].
Drought is the phenomenon, which is greatly occurring due to climate variations. Present and future information about variations in climate at the local, regional, and global scale is essential to develop national and international level mitigation approaches for natural disasters (e.g., drought) [21,22]. Due to the advancement in modeling and significance of the climate system, the general circulation models have become an important tool for the climate change processes [23]. General circulation models (GCMs) can simulate the present climate change and project future climate changes under different scenarios driven by different radiative forces. The World Climate Research Program (WCRP) developed the Coupled Model Inter-Comparison Project, which provides the simulated data by using various climate models. The project significance is that, it can provide the opportunity for the comparison of multi model ensemble strategy development [24]. Generally, the output of the multi model ensemble is found to be much better than the single model simulation. The possible explanation is that the multi model has distinctly different parameterizations as compared to the single model simulations [25]. Therefore, the multi model ensemble can produce more reliable predicted data [26]. Moreover, the fifth experiment (CMIP5) of the Coupled Model Inter-Comparison Project used for the IPPCC fifth assessment report is available. Extensive effort has been made in the development of CMIP5, including a large number of models running with fine resolution with representative concentration pathways of external forcing, more scenarios, and more saved diagnostics as compared to the previous CMIP experiment [27].
The multi model ensemble is a very beneficial approach for the future climate change assessment of China. China is an agricultural country with a distinct climate, which varies over space and time due to the topographical gradient [28]. China is also facing agriculture and water resources problem due to climate change of the 21st century [29]. Agriculture plays a key role to fulfill the need of food of 1.3 billion people. The climate in China shows that distribution of water resources is uneven, rich in south while drier in the north of the country. Many regions situated in the transitional zones of the country have water resources that could be significantly affected due climatic variations. China is already facing some hazardous climate extreme events. For example, the 1998 floods drowned 21 × 106 ha of land and damaged 5 million homes in the Yangtze basin, which caused a total USD 20 billion economic loss [30]. Heavy rainfall phenomena caused flood events and shows a spatial heterogeneity [31]. These events (heavy rainfall) become more common in the northwestern part of China while less frequent in the northeast part of China. Drought is one of the extreme indicators of climate variability in China. Droughts are hazardous for agriculture and human life because most of the region already has a quite dry condition [32]. The country already suffered severe droughts during the 1960s, 1970s, and 1990s due to the climate variability [33]. Moreover, the northeast part of the country recently suffered a severe drought [34]. Therefore, the objective of this research is to assess the projected drought events characteristics by using the statistical downscaled data of precipitation and temperature of CMIP5 GCMs under various representative concentration pathways. Moreover, future drought duration, severity, and intensity are identified for future water resources management of the region.
2. Study Area
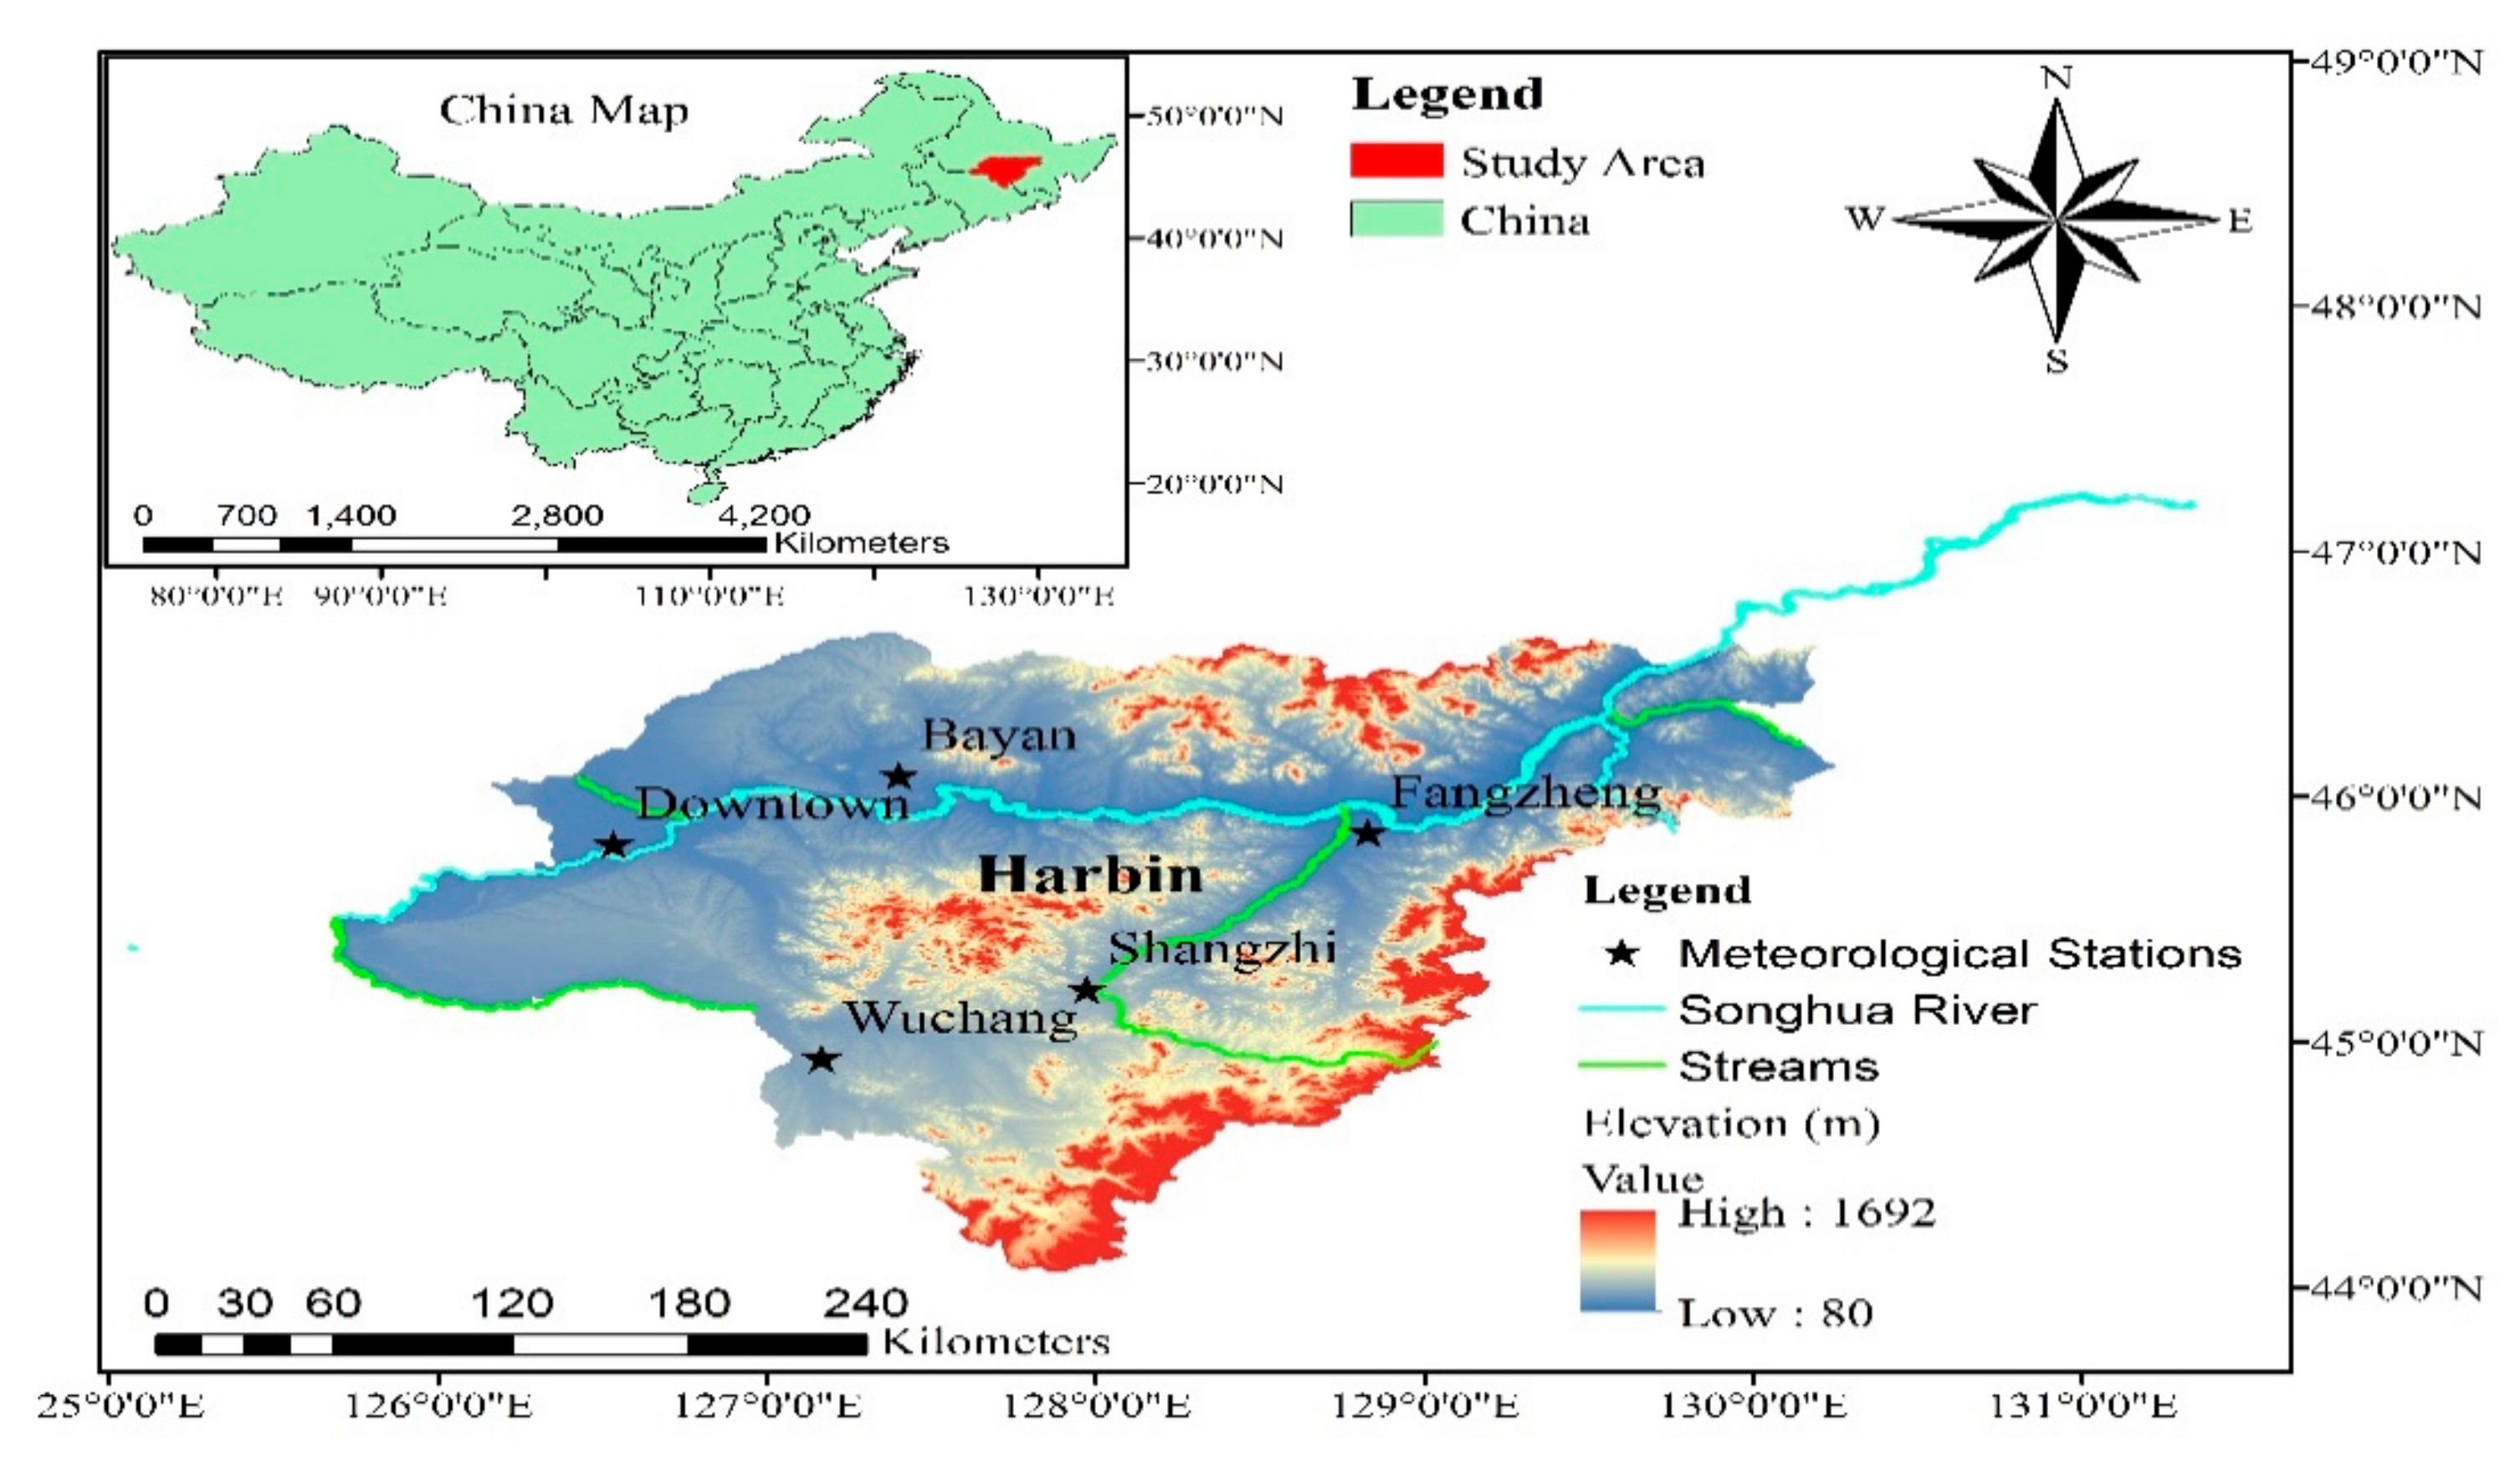
This study was conducted in the Songhua River Basin of northeast China. The research area is situated between 125°42′−130°10′ E and 44°04′−47°40′ N. The region belongs to the mid temperate continental monsoon climate, with four divergent seasons, a long winter, and a short summer. The annual average temperature of the research area is 2.6 °C, wind speed is 3.8 m/s, and rainfall is 450–650 mm. The Songhua River is a seasonally frozen river which starts from November to April. The study area is rich in natural resources, with rapid development of agriculture and animal husbandry. The planting industry has become a significant pillar for the economy of the country. It has become the main grain production based in Heilongjiang province and also the main commodity grain producing areas in country [35]. The area is also under the influence of the East Asian Monsoon, which experienced strong north winds in the winter and south wind in the summer [36]. Downtown and Bayan stations experienced higher variations in precipitation as compared to Shangzhi and Wuchang stations [37]. The elevation is high in the northwest and southeast side, and low in the northeast and southwest. There are many mountains in the region, and the area above 300 m elevation accounts for 36% of the land area of the region. Songnen plain and Sanjiang plain are the two major agricultural plains and account for 37 percent of the total area [38]. The Songhua River Basin is composed of three sub river basins: namely the Nenjiang River Basin in the west, the Upper Songhua River Basin in the south, and the Lower Songhua River Basin in the northeast. The Nenjiang River tributary originates from the Yilehuli Mountain in the Great Khingan Mountains, traveling 1370 km from northwest to southeast and drainage area 297,000 km2. The upper Songhua River originates from Tianchi Lake in the Changbai Mountain and flows 958 km from southeast to northwest, drainage land area of 73,400 km2. With a mild slope and wide river channel, the Lower Songhua River carries the combined flow from the Nenjiang and upper Songhua Rivers and flows towards 939 km northeast before entering the Amur River. The elevation of the Songhua River Basin varies from 50 to 2700 m above sea level, with an extensive floodplain—the Songnen Plain—in the middle of the basin after the confluence of the Nenjiang and upper Songhua Rivers [39]. The location of the study area is presented in Figure 1.
3. Materials and Methods
The drought events have been assessed by using a precipitation base drought index called Precipitation Decile (PD) and Standardized Precipitation Index (SPI). The drought events have also been identified by using the Reconnaissance Drought Index which is based on potential evapotranspiration data. Short term (3 months) and long term (12 months) projected meteorological droughts were identified by using these three drought indices. Future climate precipitation and temperature time series data of various Representative Concentration Pathways (RCPs) were estimated by using outputs of the Global Circulation Model downscaled with a statistical methodology.
3.1. Generating Future Climatic Data
Precipitation and temperature data were downscaled by using MarkSim generator from 2021 to 2099. MarkSim is a 3rd order Markov precipitation generator [40,41]. It works as a down-scaler for both climatic typing and stochastic downscaling. The algorithm of MarkSim is a daily precipitation simulator. Generally, the third order model is necessary for the tropical climate, while the lower order model can be used for the temperate climate [42]. The core efficiency of MarkSim in simulating the variance of precipitation observed in temperate and tropical zones is its advanced use of resampling of the Markov method parameters. Generally, MarkSim used the historical data for the 12-month baseline transfer probabilities. Therefore, it works for a huge set of parameters which includes rainstorm size. It is not recalibrated every time because it is a globally valid model and there is already a calibration set over 10,000 climatic stations globally. These were grouped into 702 climatic clusters by applying the 36 value of monthly maximum/minimum temperature and precipitation. The MarkSim model used regression to calculate the sum of the 117 parameters from the cluster, most characteristics of the climate point to be simulated.
MarkSim estimated the maximum temperature, solar radiation, and minimum temperature on a daily basis from the average of these variables by using the methods developed by [43]. Solar radiation values on a monthly basis are estimated from the temperature by using the model [44]. MarkSim assured that in the long run, data or values used for an initial point for a simulation series will be reverted as the mean of the simulated series. This shows the property of valid weather simulator. When GCM (General Circulation Models) differentials are added to the initial values, not only may the value of the regression coefficient change, but they can change the climate clusters. It means simulated clusters can be shifted to a different type. Therefore, we have a form called “climate typing” which can alter depending on the GCM (General Circulation Models) differentials as can be the response of the regression for parameters. MarkSim can be used as a climatic record for any location globally. Generally, a climatic record consists of longitude, latitude, elevation, precipitation, maximum/minimum temperature, and solar radiations. It also comprises the temporal phase angle which h means the degree in which the climatic record is “rotated” in the period. This rotation is needed because it eradicates the timing differences in the climatic events, for example, season in the southern and northern hemisphere, therefore, examination can be done on the standard climatic data. The weather record is rotated to a standard period by using the 12-point fast Fourier transform which is based on the 1st point angel calculated by using the temperature and precipitation [45]. Almost all processes are done in a rotated date space in MarkSim. We ran the MarkSim for basin wide in the Songhua River Basin of China by selecting 17 GCMs as shown in Table 1 by using 20 year replications.
3.2. Meteorological Drought Indices
The Standardized Precipitation Index (SPI) is one of the most commonly used drought indexes designed by McKee at Colorado University. SPI is based on each element of water resources system reacting to the scarcity of precipitation over a various time scale. SPI has many advantages such as (a) precipitation data used in SPI can be used to calculate the current period water deficit, (b) SPI is related to the probability, (c) SPI is used to measure the drought as well as wet events. The most important advantage of the Standardized Precipitation Index is that it can be used to calculate the dry and wet events at multiple time scales (3, 6, 9, and 12 months). This is significant as the time scale over the deficit of precipitation divides various types of dry events [46]. Generally, SPI is computed for the five-time intervals (1, 3, 6, 9, and 12 month) but it is flexible according to the period chosen. The Standardized Precipitation Index is calculated by fitting the Gamma probability density function to give a distribution of precipitation frequency at various time scales (from 1 to 12 month). A maximum likelihood method is used for the parameter estimation of each area or basin. Gamma distribution is not defined for zero precipitation while distribution of precipitation may contain zero value. Therefore, a “naïve” method has been used in this research. This method substituted the small amount (say 0.1 mm) of precipitation to the null precipitation. This small amount of precipitation does not affect the precipitation distribution. The error presented by this method is depending upon the number of months which have a zero precipitation. Complete formulation of the Standardized Precipitation Index calculation has already been presented by [47]. The drought index is based on α and β in a gamma distribution [48]. The cumulative probability of precipitation is measured by using the following dynamics [49]:
where T denotes the gamma function.
The probability q (zero precipitation) can be measured by dividing dry month over the total extent of monthly data time series:
where H(P) denotes the cumulative probability.
For the computation of the value SPI, an equal-probable transformation through H (P) is used:
where Φ denotes the standard normal cumulative distribution function.
The Precipitation Decile is another commonly used index which was introduced by [50]. This index distributes the probability of occurrence of precipitation into the 10th of precipitation distribution. Every group is called the Precipitation Decile. If the summation of fall is between the lowest value of the Precipitation Decile, then the region is considered to be under drought. The drought ends when the calculated precipitation during the previous month already places the three-month total in or above the 4th or 8th Precipitation Decile [51].
The Reconnaissance Drought Index was proposed in the meeting of MEDROPLAN. The Reconnaissance Drought Index has the following expression. The 1st expression is known as initial value of RDI (αo) which showed the cumulative form by using the monthly time series and can be calculated by every month or 12 months of the hydrological year. The αo is normally calculated for the ith year in the annual basins by applying the following formula:
where Pij and PETij describe the precipitation and potential evapotranspiration (PET) of the jth month of ith year. The Reconnaissance Drought Index has some advantages as compared to other commonly used drought indices.
(a) This index can be calculated any time period and calculation always indicates the significant figure; (b) This index is effectively linked with agricultural drought; (c) The index is also associated with the meteorological conditions of the area and it can be easily compared with FAO aridity index (AI); (d) The Reconnaissance Drought Index can be used under the climatic instability environment for the investigation of the significance of different climatic factor changes which are associated with water deficit problems.
It is concluded from the above advantages that the Reconnaissance Drought Index is a suitable index for the estimation of drought severity over the large geographic area. The analysis showed that RDI is a more sensitive drought index than those indices which are only based on precipitation, for example, SPI. The Reconnaissance Drought Index can calculate the drought for any period from one month to 12 months. The Reconnaissance Drought Index (RDI) can give very significant results if the time duration of the analysis matches with the growing seasons of the crops in the study area. The Standardized Precipitation Index is solely dependent upon precipitation and previous studies show that it was not effectively correlated with agricultural production [52]. The Reconnaissance Drought Index has a crucial advantage due to the inclusion of potential evapotranspiration which enhances its validity in research studies pointing to risk assessment in agriculture because of the occurrence of droughts. Generally, water requirement is increasing due to the rise in temperature. Therefore, the Reconnaissance Drought Index is a good choice for the future as an indicator for the risk assessment of droughts.
4. Results and Discussions
Drought analysis was conducted at the study area by applying the various drought indices by using future statistical downscaled data of precipitation and temperature time series of different Representative Concentration Pathways (RCPs). Moreover, drought severity, drought intensity, and drought duration were also calculated for the meaningful evaluation of drought severities in the research area. The basic criterion of different drought classes for SPI and RDI is given in Table 2 while the classification of the Precipitation Decile can be seen in Table 3.
4.1. RCP2.6
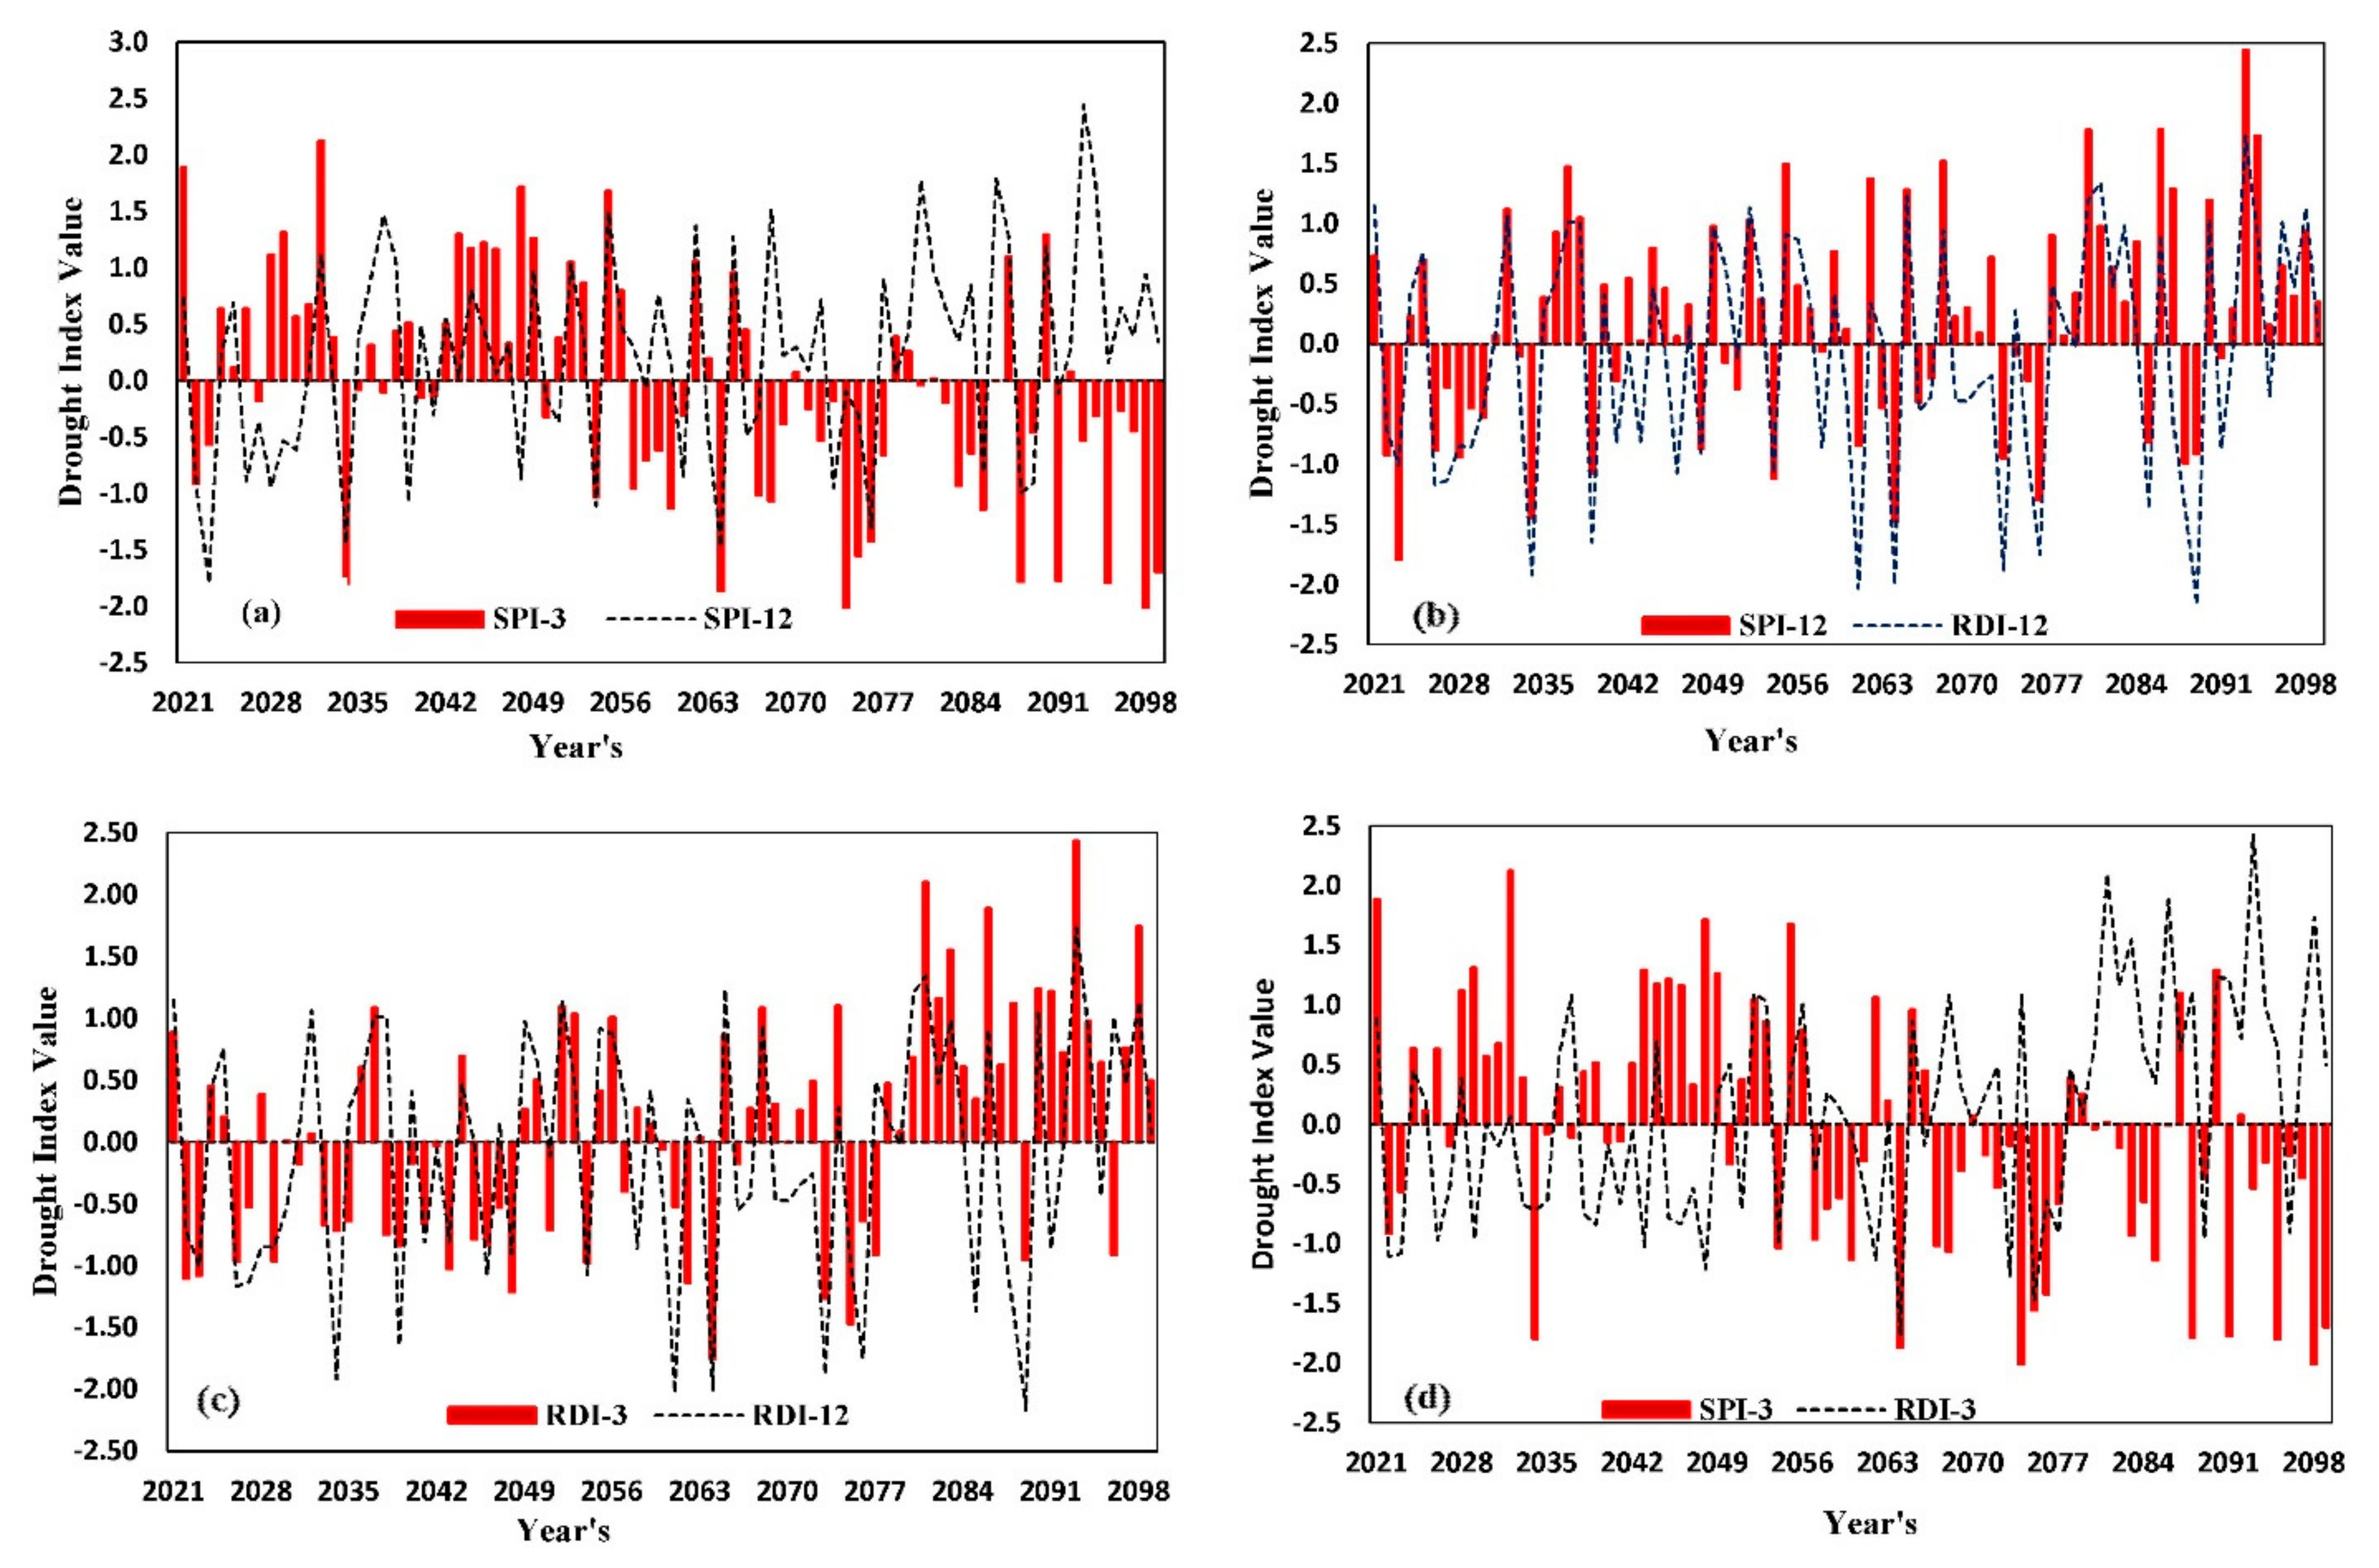
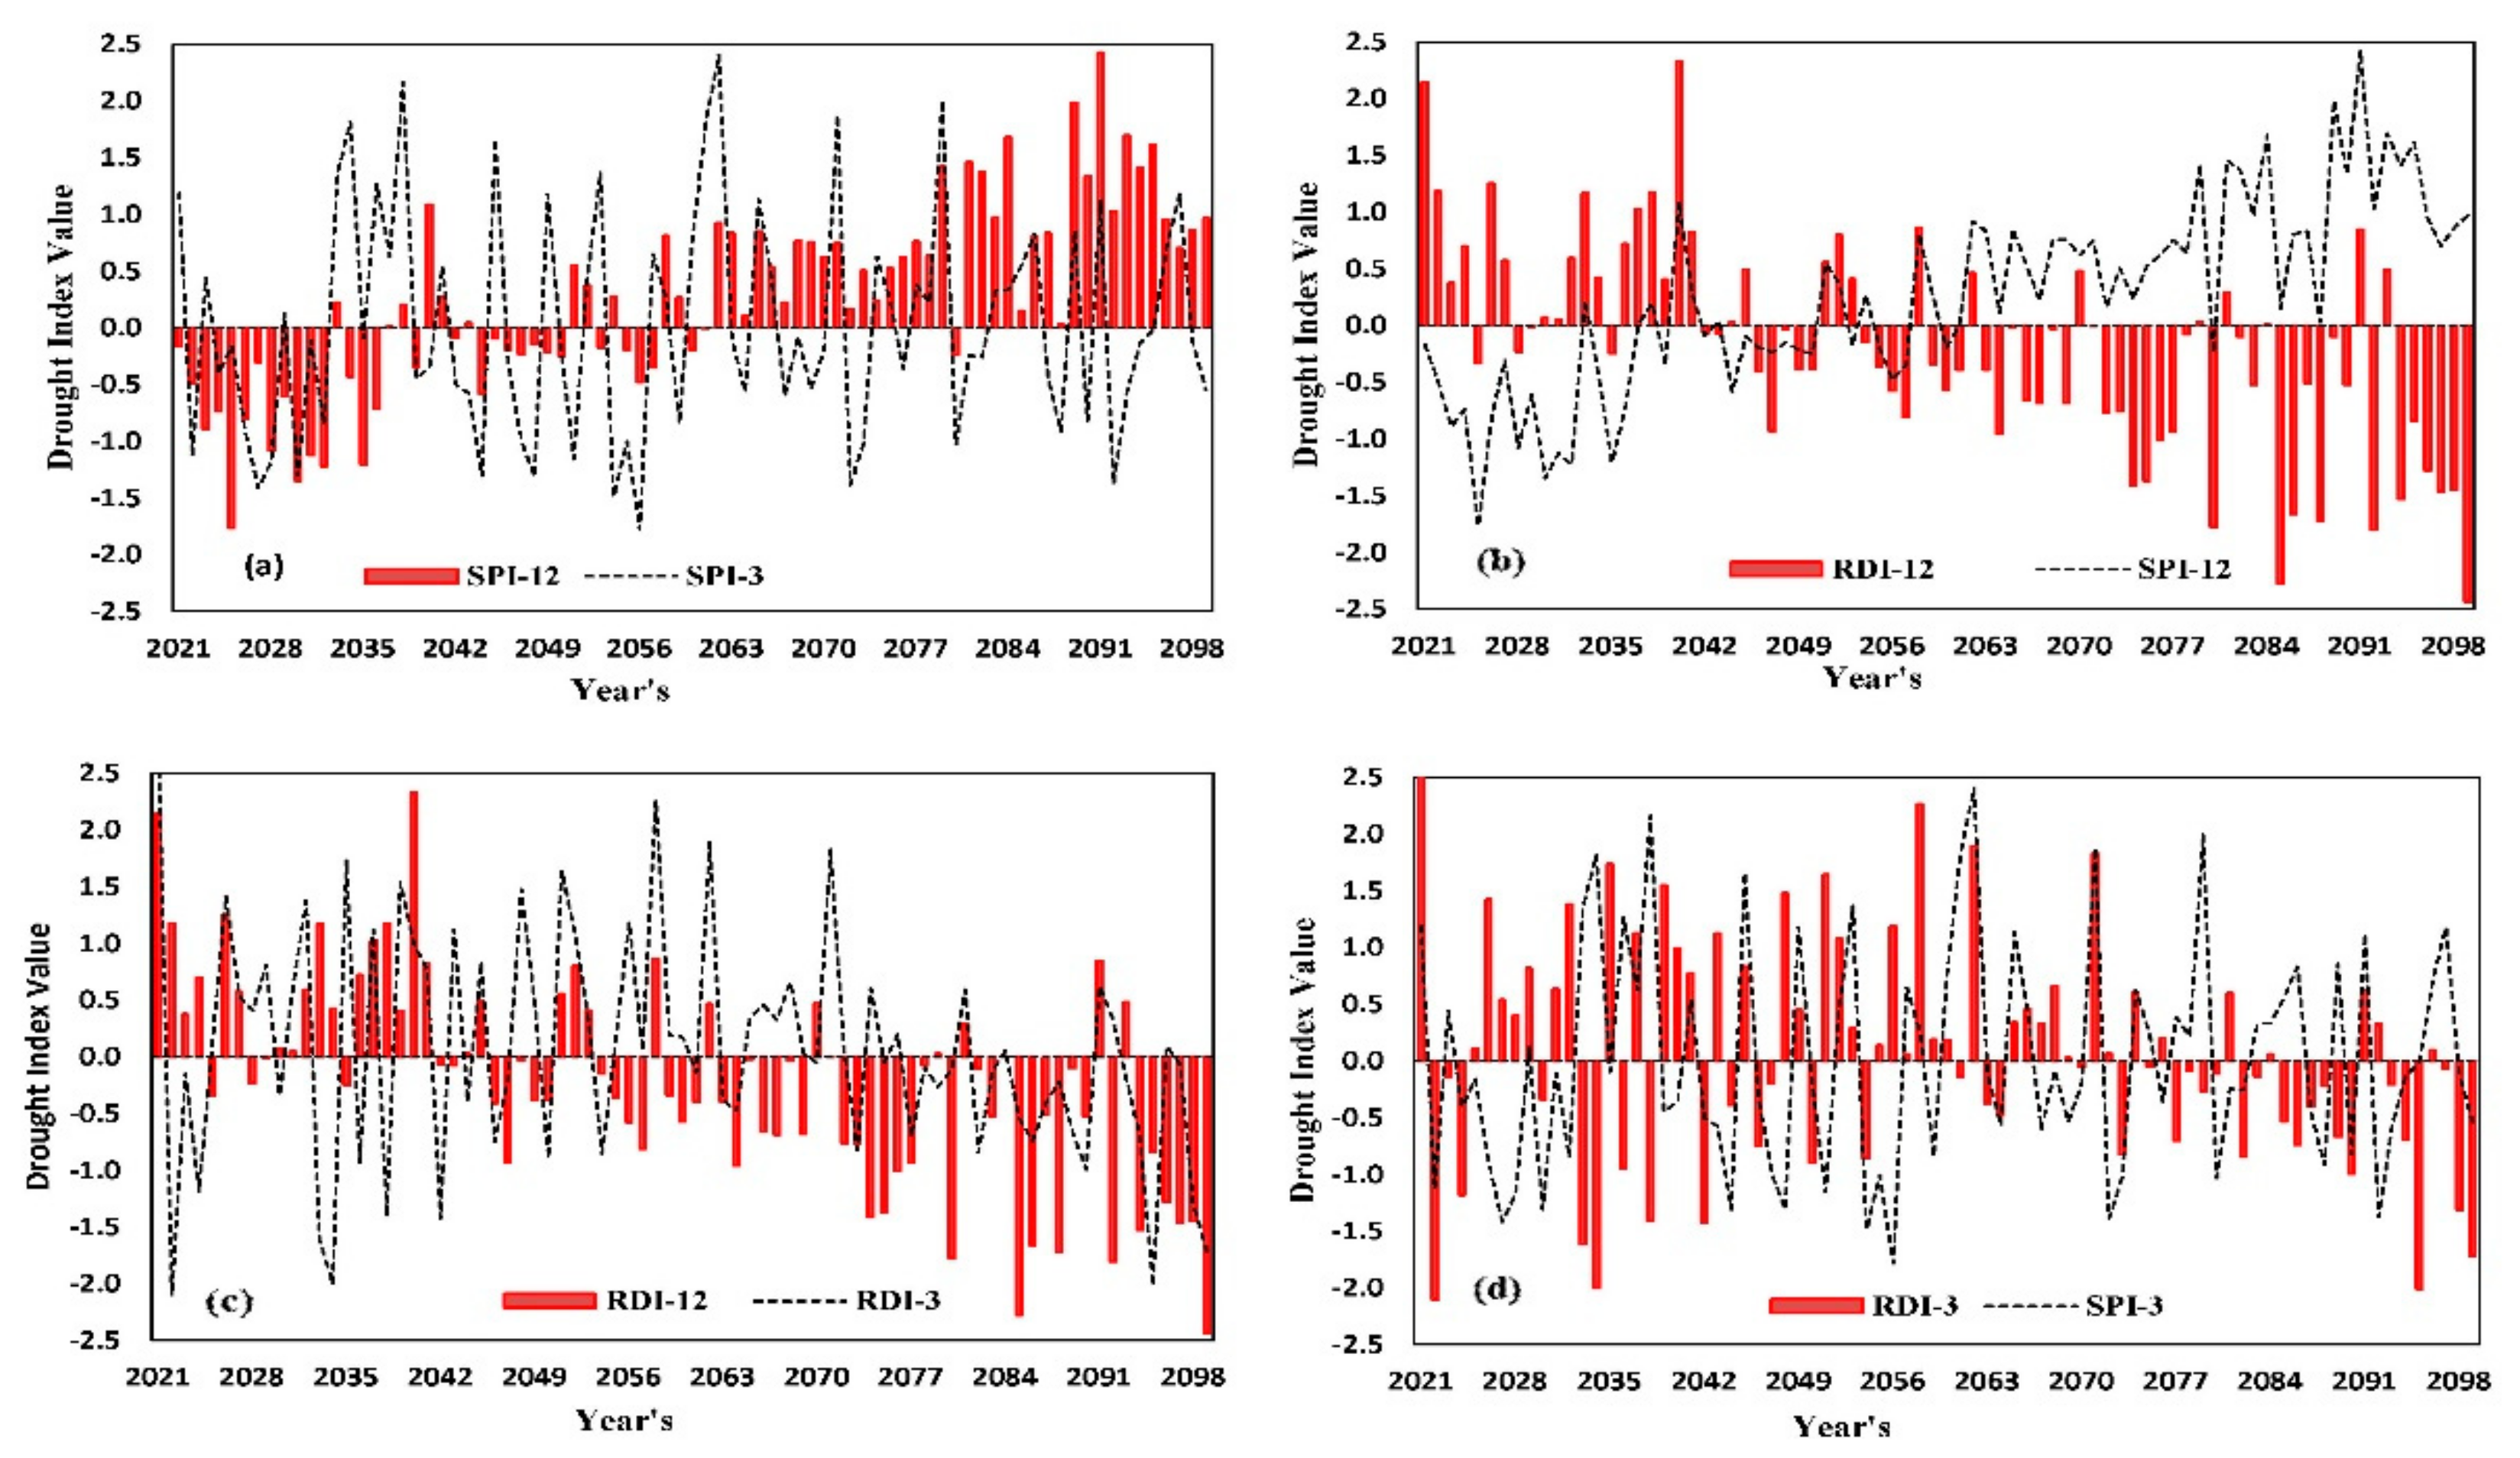
The Reconnaissance Drought Index, Precipitation Decile, and Standardized Precipitation Index were used for the assessment of short-term drought (3 months) and long-term drought (12 months) by using the Representative Concentration Pathway (RCPs) climatic data. The detailed information about RCP 2.6 was already discussed in the Method and Datasets section. Figure 2 shows the dry and wet trends of the study area by month wise (i.e., SPI-3 and SPI-12) and drought indices wise (SPI-12 and RDI-12).
The drought severities were investigated by using the drought characteristics (i.e., drought severity (DS), drought intensity (DI), and drought duration (DD)). The drought analysis at 3 months showed that mild drying trends are expected to prevail during the period 2082 to 2085. The characteristics of drought showed that the drought duration was prolonged up to 4 years with drought severity −0.91 and drought intensity (−0.23). Similarly, moderate drought conditions are projected to occur between 2021–2023 and 2066–2068. The drought duration is expected up to 3 years with drought severity (−1.04) and drought intensity (−0.35) during the above-mentioned periods. The results show that almost the same drought characteristics occur between 2021 and 2023 and between 2066 and 2068. Severe drought conditions projected from 2073 to 2076 with drought severity −1.66 and drought intensity −0.42, while extreme drying trends are projected between 2097 and 2099 with drought severity −1.85 and drought intensity −0.62 as presented in Table 4 and Figure 2. As shown in Figure 2b, the Reconnaissance Drought Index is performing much better for the assessment of long term drought as compared to the Standardized Precipitation Index, while Figure 2d showed that the Standardized Precipitation Index is performing much better for the assessment of short term (3 month) droughts, especially assessment of drought anomalies after the 2060’s in the research area. Many researchers have investigated that the Standardized Precipitation Index is dominated for the assessment of drought onset. For example, ref. [53] investigated the drying trend in the Songhua River Basin by using SPI and results showed that short-term drought onset is dominated by SPI. The overall results showed that extreme drought hazards are expected to dominate during the last phase (2070–2099) at 3-month analysis in the study area.
The Standardized Precipitation Index was also used to evaluate the drought anomalies at a 12-month basis in the study area. Generally, mild and moderate drought conditions are projected to prevail in the study area during the 12-month drought analysis during the period 2021 to 2099 in the research area. The drought duration predicted 3 to 4 years and drought severity values varied between −0.70 and −1.36. The highest drought severity was projected between 2021 and 2023 while lower drought severity was predicted between 2027 and 2030. Similarly, a 3-month drought analysis was also conducted by using the Reconnaissance Drought Index in the research area. A mild drought is projected during 2025–2027 (DS −0.75 and −0.25), 2032–2035 (DS −0.68 and DI −0.17), 2044–2048 (DS −0.84 and DI −0.17), and 2060–2062 (DS −0.83 and DI −0.28). A moderate drought expected during the period 2021–2023 (DS −1.09 and DI −0.36) and 2074–2077 (DS −1.01 and DI −0.25) as shown in Table 4.
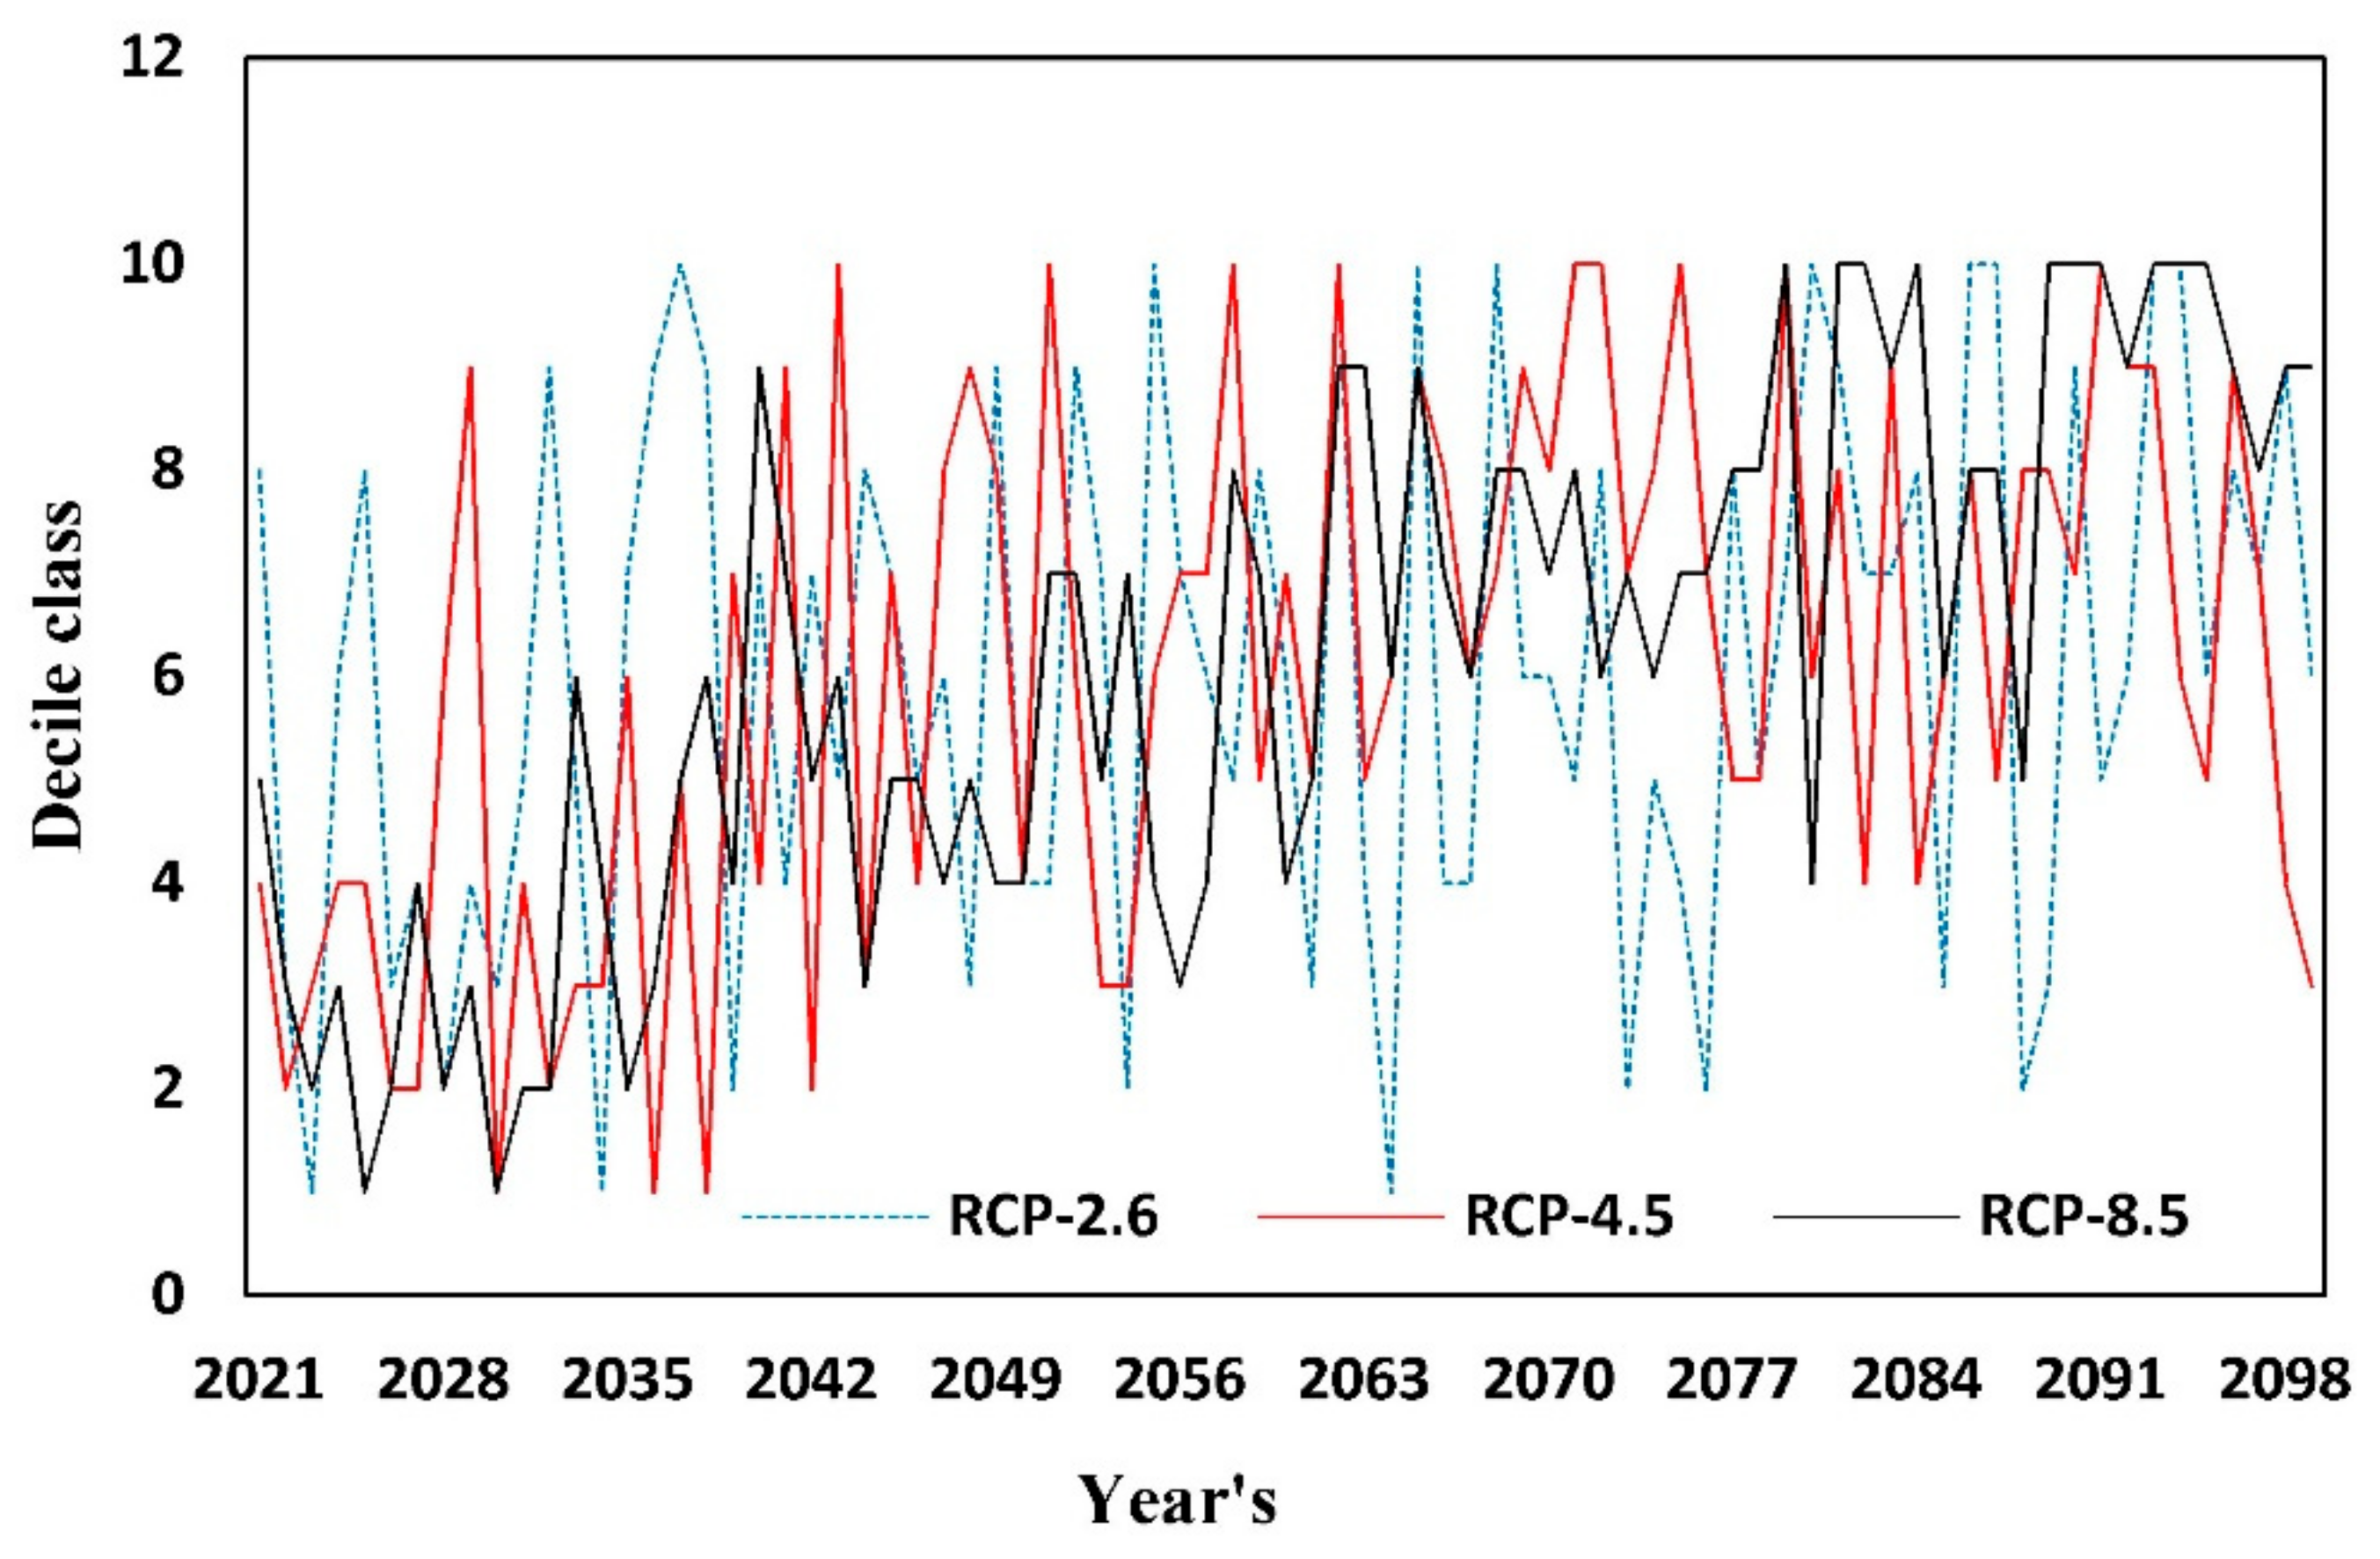
Drought anomalies were also calculated at a 12-month time scale in the research area by using the Reconnaissance Drought Index. This drought index is based on the precipitation (P) and potential evapotranspiration (PET) data. The results showed mild drying trends projected between 2021 and 2023 and between 2025 and 2030. The drought severity ranges between −0.86 to −1.37 while drought intensity is projected to vary between −0.15 to −0.46 as shown in Table 4. Similarly, one more precipitation base drought index called the Precipitation Decile was used for the assessment of meteorological drought in the research area. Figure 3 presented the drought anomalies between 2021 and 2099 in the study area. The outcomes showed drying trends experienced during the years 2034, 2066, and 2090. The results showed that the average precipitation in these years is much below than normal precipitation.
The Reconnaissance Drought Index, Precipitation Decile, and Standardized Precipitation Index were used to identify the drying trends in the research area by using the RCP2.6. Every kind of drought index has different inside calculation procedures. Therefore, the drought characteristic procedure was adopted to find out the exact drought timing and drought intensity in the research area. The Precipitation Decile drought index is the simplest one for the prediction of drought while the Reconnaissance Drought Index and Standardized Precipitation Index are more advanced and have multiple directions for drought assessment. Moreover, the initial theoretical bases of the Reconnaissance Drought Index and Standardized Precipitation Index are different, regarding their calculation process. The Standardized Precipitation Index is calculated as a “rolling” drought index in a monthly consecutive order [54], normally with five running time intervals (i.e., 1, 3, 6, 9, and 12 months). The Reconnaissance Drought Index is calculated for discrete reference periods (i.e., 3, 6, 9, and 12 months) on the hydrological year [55].
4.2. RCP4.5
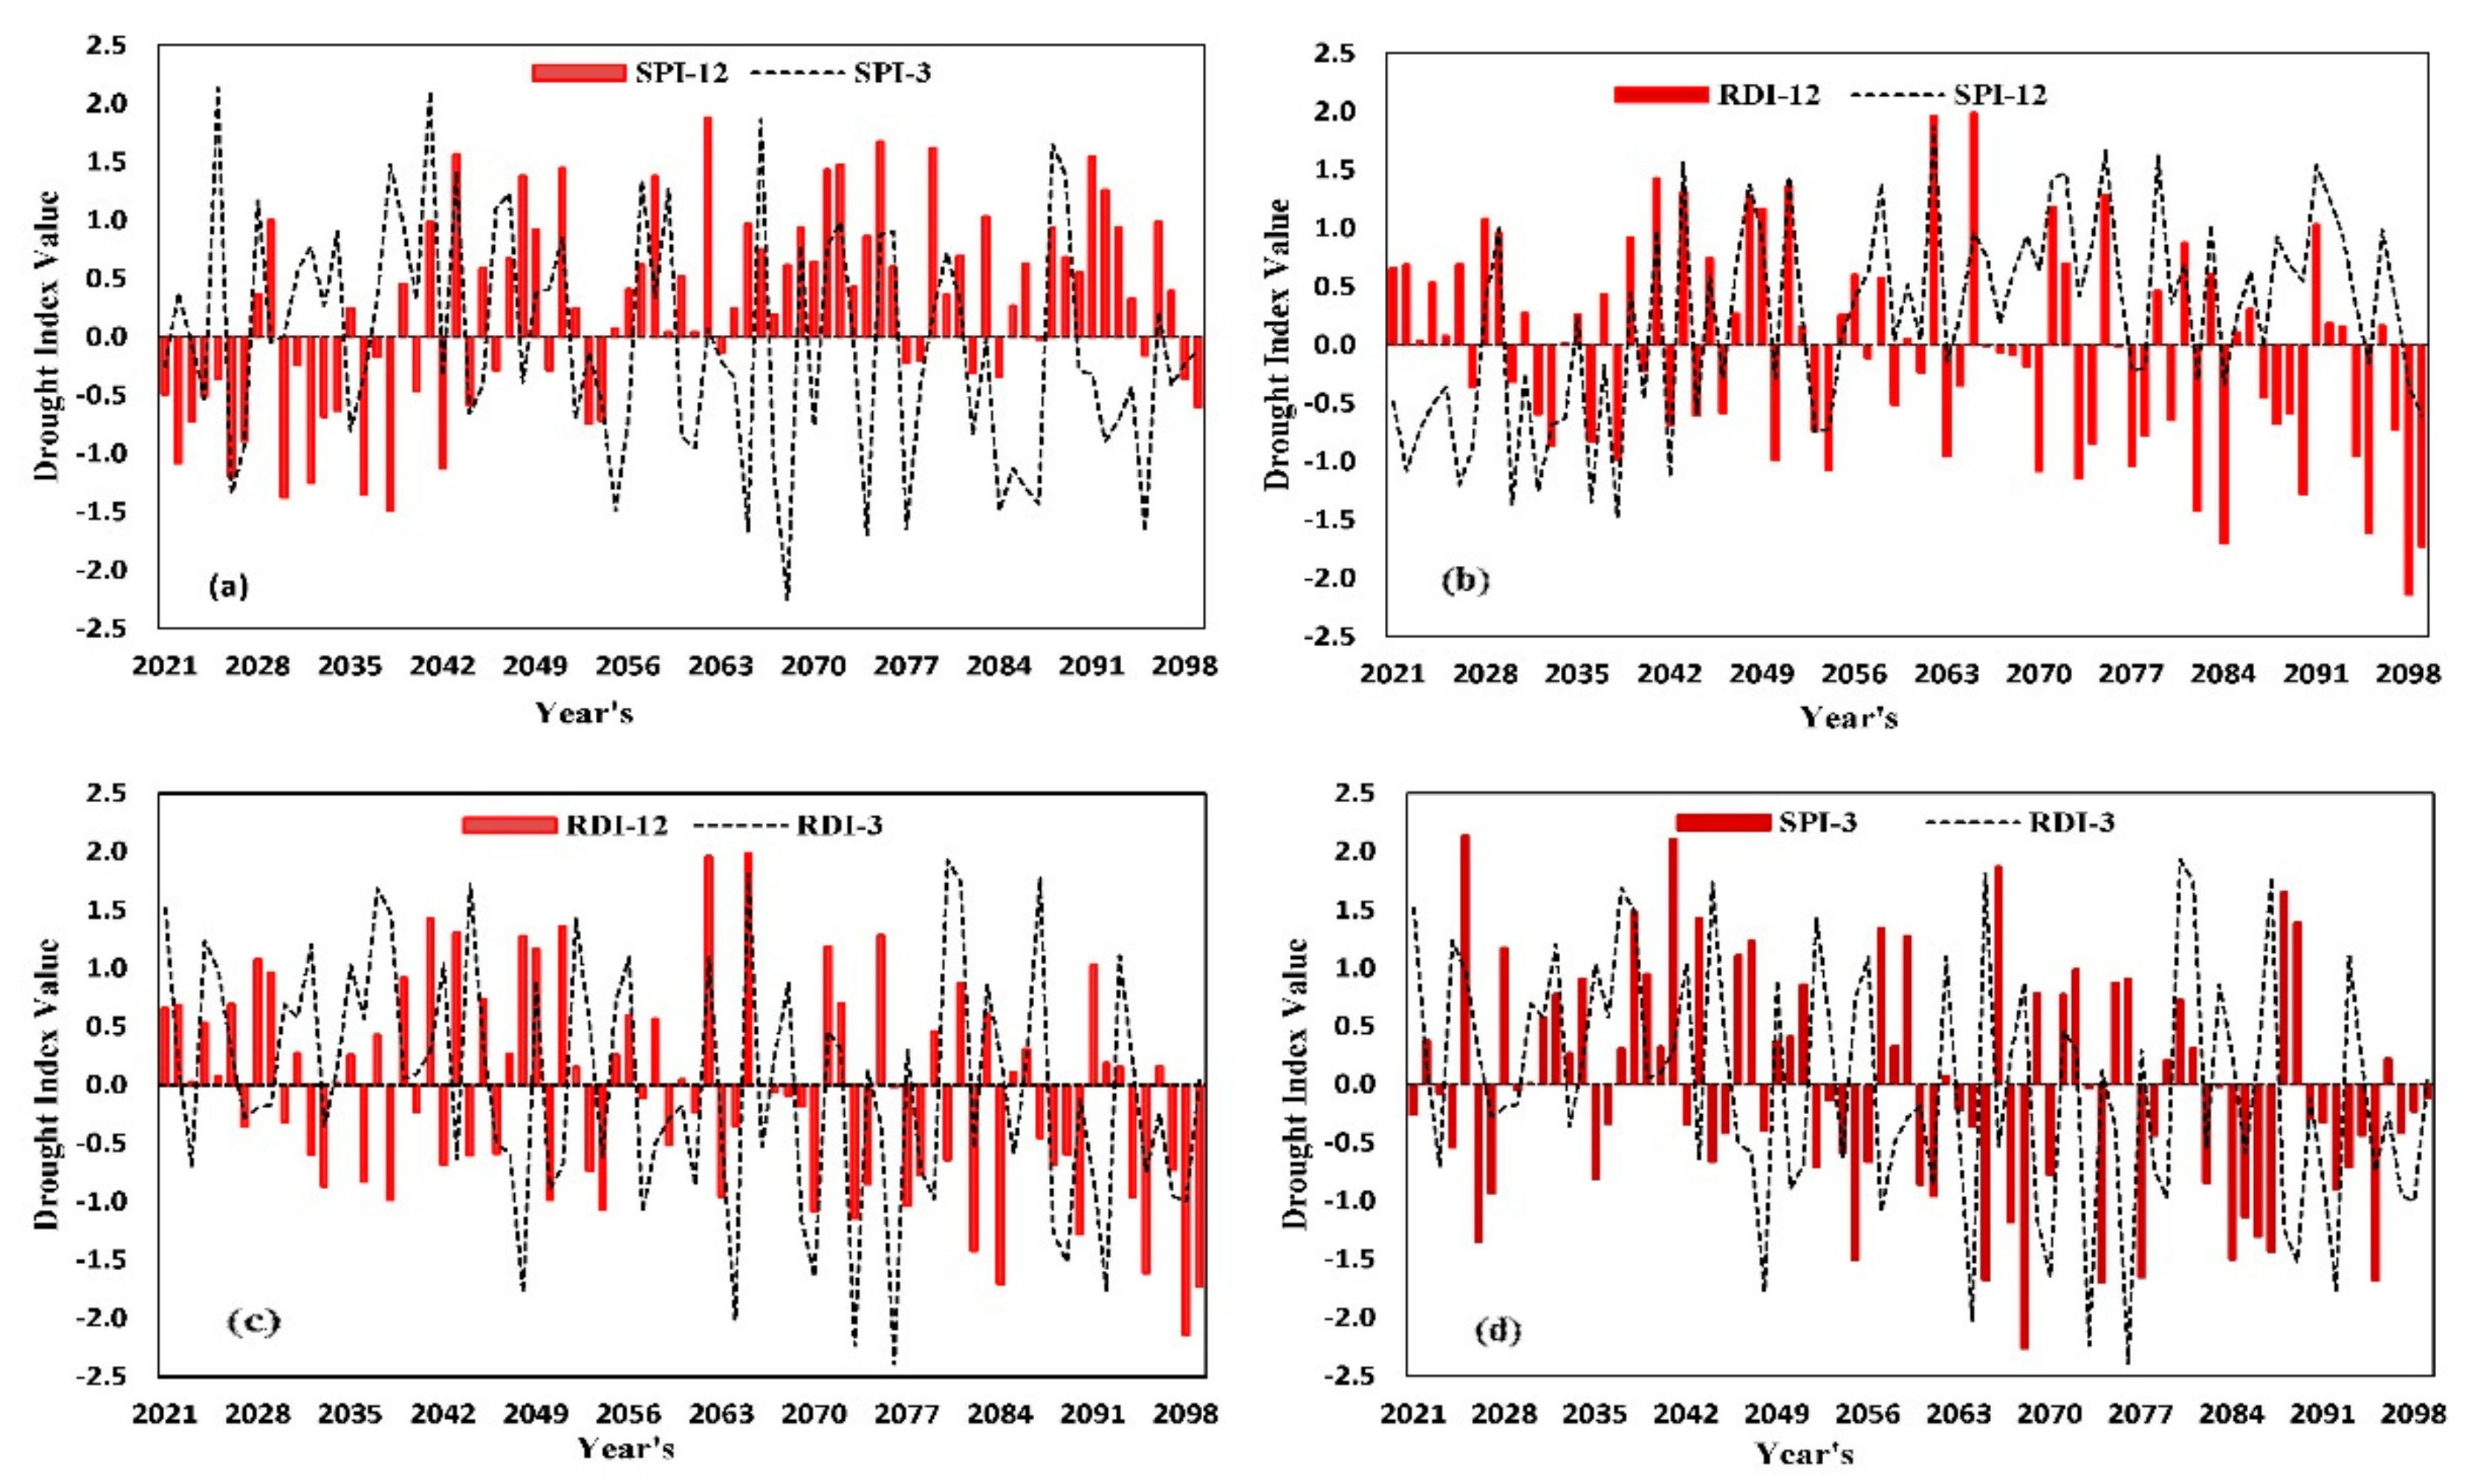
The Standardized Precipitation Index, Precipitation Decile, and Reconnaissance Drought Index were used to identify drought trends under the Representative Concentration Pathway 4.5. The details about RCP 4.5 have been discussed in an earlier section of the paper. The drying trends scenario under the Representative Concentration Pathway 4.5 are shown in Figure 4. The 3-month analysis under the Standardized Precipitation Index showed that mild drought is expected to occur during the period 2053–2056 (DD, 4 year), 2059–2061 (DD, 3 year), and 2091–2093 (DD, 3 year). The drought characteristics showed that drought severity values varied between −0.80 and −0.91 and the highest value of drought intensity projected was during 2059–2061 (DI value—0.30) while the lowest value projected was during 2053–2056 (DI value—0.23) as shown in Table 5 Similarly, drought analysis was also conducted at a 12-month basis under RCP 4.5 by using the Standardized Precipitation Index. Overall, results showed a mild and moderated drought condition during 2021 and 2099. It was noticed that the years 2021 to 2024, 2031 to 2034, and 2052 to 2054 projected under mild drought with drought intensity varied between −0.14 and −0.24 while drought severities values range between −0.70 and −0.85. Moderate drought conditions are expected to occur during 2025–2027. Generally, there was no evidence found about severe or extreme droughts during the 12-month drought analysis by using the Standardized Precipitation Index in the study area.
A comparative analysis of 3- and 12-month drying trend was investigated by using the Reconnaissance Drought Index and Standardized Precipitation Index as shown in Figure 4b,d. The results showed that the Reconnaissance Drought Index prevails during the 12-month drought assessment as shown in Figure 4b while almost both drought indices (RDI and SPI) showed the same behavior of drought identification at 3-month drought analysis between 2021 and 2099 in the research area.
The Reconnaissance Drought Index was also used for the identification of drying trends at 3 and 12 months between 2021 and 2099. Firstly, we described the results of 3-month drought analysis and then 12-month drought analysis. It was noticed that most of the period are expected to be under mild drought conditions. For example, mild drought is projected to occur between 2045–2048, 2049–2051, 2056–2058, and 2096–2098 while moderated drought noticed between 2069 and 2071, 2087 and 2089, and 2090 and 2092. The highest drought severity is projected during the period 2069–2071 (drought severity value −1.40) whereas the lowest value of drought severity (−0.40) was projected during 2045–2048 as shown in Table 5. The 12-month drought analysis by using the Reconnaissance Drought Index showed mild, moderate, and severe drought conditions expected in the study area between 2021 and 2099. For instance, the period 2096 to 2099 showed severe drying conditions are expected with drought severity (−1.53) and drought intensity (−0.38) while moderated drought conditions are expected between 2093 and 2095 with drought severity (−1.28) and drought intensity (−0.43) in the study area. It was also noticed that most of the period is expected to be under mild drought conditions as shown in Table 5.
The Precipitation Decile index was also used under RCP 4.5 to predict the drying trends in the research area. It was observed that most of the period is expected to be under drying between 2021 and 2040 as shown in Figure 3.
4.3. RCP8.5
As shown in Figure 5, the drought trends in the study area are determined by using the Reconnaissance Drought Index and Standardized Precipitation Index under the Representative Concentration Pathway 8.5. Reconnaissance Drought Index and Standardized Precipitation Index have been used to identify the drought anomalies at 3-months and 12-month bases in the research area. The outcomes of 3-month drought analysis by using the Standardized Precipitation Index revealed that the periods 2041–2044 and 2091–2093 are expected to be under mild drought conditions with drought severity ranges varied between −0.79 to −0.97 and drought intensity ranges between −0.20 to −0.32 as shown in Table 6. Moderate drought conditions are expected to prevail during the periods of 2025–2028 (DS-1.16 and DI-0.29), 2046–2048 (DS-1.15 and DI-0.38), 2053–2056 (DS-1.42 and DI-0.36), and 2071–2073 (DS-1.20 and DI-0.40).
Similarly, drought anomalies were also assessed at a 12-month time scale by using the Standardized Precipitation Index under the Representative Concentration Pathway 8.5. Generally, the study area is expected to undergo mild and moderate drought conditions between 2021 and 2099 at a 12-month time scale drought analysis. The mild drought is expected during the periods 2021–2026 and 2034–2036 and drought severity varies between −0.93 and −0.96 and drought intensity range between −0.16 and −0.32. Reconnaissance Drought Index analysis at 3 months and 12 months showed that a mild, moderate, and severe drought conditions are expected during the future. The 3-month drought analysis showed that a mild drought condition is expected during the periods 2084–2086 and 2088–2090 while moderate drought is going to occur during the period 2093–2095. Similarly, severe drought anomalies are projected to occur during the period 2032–2034 and 2097–2099 as shown in Table 6. The highest severity of drought is projected to occur during the period 2032 to 2034 with drought severity value −1.81 and drought intensity −0.60. The 12-month drought analysis conducted by using the Reconnaissance Drought Index showed that the periods 2071–2077, 2084–2088, and 2093–2099 are expected to undergo a severe drought condition. The highest drought severity was found −1.54 with drought intensity value −0.31 through 2084 to 2088 during the 12-month drought analysis. Our results are in line with previous research in the study area [56]. The previous research showed that RDI evaluated the severe drought much better in the research area, which means that RDI is more sensitive in the assessment of severe drought and drought events are one of the primary causes of climate change. RDI is very sensitive to climate change due to the inclusion of evapotranspiration. The inspection of future drought events in Songhua River Basin could provide the behavior of various drought indices. For example, SPI uses a single variable (precipitation) for drought identification while RDI is an evapotranspiration-based drought index in which the researcher can find the footprint of the temperature. Temperature-based drought indices are very sensitive to climate change [57]. Many studies showed that evapotranspiration-based drought indices performed much better in the assessment of severe drought. Achievement of this study recognizes the claim of the RDI developer concerning the limitation of SPI.
Figure 5 showed the comparison of the Reconnaissance Drought Index and Standardized Precipitation Index at 3-month and 12-month drought analysis. The results showed that the Standardized Precipitation Index performs better in detecting a drought anomaly during the first half (2021–2050) while the Reconnaissance Drought Index proves to be a better drought index to detect drought anomalies during the 2nd half (2051–2099) at 12-month drought analysis in the study area as shown in Figure 5b. Similarly, 3-month comparative drought analysis showed that both drought indices are performing almost in a similar way to detect the drought anomalies in the study area during the period 2021–2099 as shown in Figure 5d.
The Precipitation Decile (PD) was also used to detect drought anomalies in the study area. The Precipitation Decile is the simplest drought index as compared to the Reconnaissance Drought Index and Standardized Precipitation Index and it is solely based on precipitation data and gives a result in the form of classes. These classes vary from 1 to 10. The class 1–2 shows the much below normal precipitation while class 9–10 shows that precipitation is much above normal conditions. The class 5–6 shows the normal precipitation. Figure 3 shows the precipitation anomalies in the study area during 2021–2099. The detailed pattern of the much below normal, below normal, near normal, above normal, and much above normal precipitation is presented in the Figure 3.
Based on the investigation of drought events, it was noted that this study would be useful for the better management of water resources in the region. Climatic variables (e.g., precipitation) are normally accepted for the description of drought variability. This study used data of very limited parameters (precipitation, temperature) for the drought evaluation. Therefore, there is still a need for further research studies to explore how other factors (solar radiations, soil moisture, wind speed, humidity) can potentially affect drought phenomenon.
5. Conclusions
Drought is the phenomenon which is occurring greatly due to climate variations. Future drought projection plays an important role in the planning and management of water resource systems. Different future scenarios RCP 2.6, RCP 4.5, and RCP 8.5 were evaluated with shorter and longer time scales to select the best scenarios for future projected droughts based on the Reconnaissance Drought Index and Standardized Precipitation Index for the study area.
The results showed that a greater number of drought events are predicted under RCP4.5 as compared to RCP 2.6 and RCP 8.5. Moderate drought is observed prolonged as compared to mild, severe, and extreme drying trends for the shorter timer period under RCP 2.6. The results also revealed that extreme drought hazards are expected to dominate during the last phase (2070–2099) at 3-month analysis under RCP2.6. The outcomes revealed that mild drying trends are projected between 2021 and 2023 and between 2025 and 2030. The drought severity ranges between (−0.86 to −1.37) while drought intensity is projected to vary between −0.15 to −0.46 at 12-month drought analysis under RCP2.6. It was also observed that the Precipitation Decile predicted a greater number of drought years under RCP 2.6. It was noticed that the years 2021 to 2024, 2031 to 2034, and 2052 to 2054 projected under mild drought have drought intensity varying between −0.14 and −0.24 while drought severities values range between −0.70 and −0.85 under RCP4.5. The Precipitation Decile index was also used under RCP 4.5 to predict the drying trends in the research area. It was observed that most of the period is expected to be under drying between 2021 and 2040.
The mild drought is expected to occur between 2021–2026 and 2034–2036 with drought severity varying between −0.93 and −0.96 and drought intensity ranging between −0.16 and −0.32. The Reconnaissance Drought Index analysis at 3 months and 12 months showed that a mild, moderate, and severe drought conditions are expected during the future under RCP 8.5. Over all, moderate and mild drought were observed in this region for shorter and longer term under RCP 2.6, 4.5, and 8.5 future scenarios.
These findings are useful for water resources manager decision makers and government’s institutions to emphasis on preparedness and mitigation to overcome these natural hazards. Moreover, there is a need for interdisciplinary cooperation, appropriate strategies, and joint effort with policy makers at all levels. They can mitigate through proper and efficient utilization of water resources in the urban and agriculture sector in order to control the drought.
Author Contributions
Data curation, M.I.K.; Formal analysis, M.I.K. and X.Z.; Investigation, Q.S., M.I.K.; Methodology, M.I.K. and M.S. (Muhammad Saifullah), Conceptualization, Y.N.; Writing—original draft, M.I.K. and Q.S.; Writing—review & editing, X.J., M.S. (Muhammad Sajid) and M.S. (Muhammad Saifullah). All authors have read and agreed to the published version of the manuscript.
Funding
A Project funded by the priority academic program development of Jiangsu University higher education institutions (No. PAPD-2018-87), and Jiangsu Key Laboratory for Information Agriculture.
Institutional Review Board Statement
There is no effect on human and animal.
Informed Consent Statement
Not Applicable.
Data Availability Statement
Precipitation and temperature data were downscaled by using MarkSim generator. MarkSim is a 3rd order Markov precipitation generator. The raw data is available at following website: http://gismap.ciat.cgiar.org/MarkSimGCM/.
Acknowledgments
Project funded by the priority academic program development of Jiangsu University higher education institutions (No. PAPD-2018-87). The project of New Agricultural Machinery in Jiangsu Province No. NJ2016-11, and Jiangsu Key Laboratory for Information Agriculture.
Conflicts of Interest
No conflict of interest.
References
- Wilhite, D.A. Drought as a Natural Hazard: Concepts and Definitions; Routledge: London, UK, 2000; Volume 1, pp. 3–18. [Google Scholar]
- Wilhite, D.A.; Glantz, M.H. Understanding: The drought phenomenon: The role of definitions. Water Int. 1985, 10, 111–120. [Google Scholar] [CrossRef] [Green Version]
- Dingman, S.L. Chapter 6, Water in soils: Infiltration and redistribution. In Physical Hydrology, 2nd ed.; Prentice-Hall: Hoboken, NJ, USA, 2002; p. 646. [Google Scholar]
- Shiau, J.T. Fitting drought duration and severity with two-dimensional copulas. Water Resour. Manag. 2006, 20, 795–815. [Google Scholar] [CrossRef]
- Dupuis, D.J. Statistical modeling of the monthly Palmer drought severity index. J. Hydrol. Eng. 2010, 15, 796–807. [Google Scholar] [CrossRef]
- Pashiardis, S.; Michaelides, S. Implementation of the standardized precipitation index (SPI) and the reconnaissance drought index (RDI) for regional drought assessment: A case study for Cyprus. Eur. Water 2008, 23, 57–65. [Google Scholar]
- Borg, D.S. An application of drought indices in Malta, case study. Eur. Water 2009, 25, 25–38. [Google Scholar]
- Dracup, J.A.; Lee, K.S.; Paulson, E.G., Jr. On the definition of droughts. Water Resour. Res. 1980, 16, 297–302. [Google Scholar] [CrossRef]
- Smakhtin, V.U. Low flow hydrology: A review. J. Hydrol. 2001, 240, 147–186. [Google Scholar] [CrossRef]
- Nalbantis, I. Evaluation of a hydrological drought index. Eur. Water 2008, 23, 67–77. [Google Scholar]
- Shukla, S.; Wood, A.W. Use of a standardized runoff index for characterizing hydrologic drought. Geophys. Res. Lett. 2008, 35. [Google Scholar] [CrossRef] [Green Version]
- Fleig, A.K.; Tallaksen, L.M.; Hisdal, H.; Hannah, D.M. Regional hydrological drought in north-western Europe: Linking a new Regional Drought Area Index with weather types. Hydrol. Processes 2011, 25, 1163–1179. [Google Scholar] [CrossRef]
- Gurwin, J. Long-term monitoring and GIS based determination of groundwater drought propagation, the Lower Silesia region, SW Poland. Episodes 2014, 37, 172–181. [Google Scholar] [CrossRef]
- IPCC. Climate Change 2007: The Scientific Basis. Contribution of Working Group I to the Fourth Assessment Report of the Inter-Governmental Panel on Climate Change; Cambridge University Press: Cambridge, UK, 2007. [Google Scholar]
- Gocic, M.; Trajkovic, S. Drought characterization based on water surplus variability index. Water Resour. Manag. 2014, 28, 3179–3191. [Google Scholar] [CrossRef]
- Zargar, A.; Sadiq, R.; Naser, B.; Khan, F.I. A review of drought indices. Environ. Rev. 2011, 19, 333–349. [Google Scholar] [CrossRef]
- Moghimi, M.M.; Zarei, A.R.; Mahmoudi, M.R. Seasonal drought forecasting in arid regions, using different time series models and RDI index. J. Water Clim. Chang. 2020, 3, 633–654. [Google Scholar] [CrossRef]
- Hao, Z.; AghaKouchak, A. A nonparametric multivariate multi-index drought monitoring framework. J. Hydrometeorol. 2014, 15, 89–101. [Google Scholar] [CrossRef]
- Tsakiris, G.; Vangelis, H.J. Establishing a drought index incorporating evapotranspiration. Eur. Water 2005, 10, 3–11. [Google Scholar]
- Mishra, A.K.; Singh, V.P. A review of drought concepts. J. Hydrol. 2010, 391, 202–216. [Google Scholar] [CrossRef]
- Miao, C.; Ni, J.; Borthwick, A.G.; Yang, L. A preliminary estimate of human and natural contributions to the changes in water discharge and sediment load in the Yellow River. Glob. Planet. Chang. 2011, 76, 196–205. [Google Scholar] [CrossRef] [Green Version]
- Saddique, Q.; Cai, H.; Xu, J.; Ajaz, A.; He, J.; Yu, Q.; Wang, Y.; Chen, H.; Khan, M.I.; Li Liu, D.; et al. Analyzing adaptation strategies for maize production under future climate change in Guanzhong Plain, China. Mitig. Adapt. Strateg. Glob. Chang. 2020, 25, 1523–1543. [Google Scholar] [CrossRef]
- Intergovernmental Panel on Climate Change (IPCC). Climate Change 2013: The Physical Science Basis: Working Group I Contribution to the Fifth Assessment Report of the Intergovernmental Panel on Climate Change; Cambridge University Press: Cambridge, UK, 2014. [Google Scholar]
- Li, H.; Feng, L.; Zhou, T. Changes of July-August climate extremes over China under CO2 doubling scenario projected by CMIP3 models for IPCC AR4. Part I: Precipitation. Adv. Atmos. Sci. 2010, 3. [Google Scholar] [CrossRef]
- Duan, Q.; Phillips, T.J. Bayesian estimation of local signal and noise in multimodel simulations of climate change. J. Geophys. Res. Atmos. 2010, 115. [Google Scholar] [CrossRef]
- Tebaldi, C.; Knutti, R. The use of the multi-model ensemble in probabilistic climate projections. Philos. Trans. R. Soc. A Math. Phys. Eng. Sci. 2007, 365, 2053–2075. [Google Scholar] [CrossRef]
- Taylor, K.E.; Stouffer, R.J.; Meehl, G.A. An overview of CMIP5 and the experiment design. Bull. Am. Meteorol. Soc. 2012, 93, 485–498. [Google Scholar] [CrossRef] [Green Version]
- Gao, X.; Shi, Y.; Song, R.; Giorgi, F.; Wang, Y.; Zhang, D. Reduction of future monsoon precipitation over China: Comparison between a high resolution RCM simulation and the driving GCM. Meteorol. Atmos. Phys. 2008, 100, 73–86. [Google Scholar] [CrossRef]
- Meehl, G.A.; Stocker, T.F.; Collins, W.D.; Friedlingstein, P.; Gaye, T.; Gregory, J.M.; Kitoh, A.; Knutti, R.; Murphy, J.M.; Noda, A.; et al. Global Climate Projections; NOAA: Washington, DC, USA, 2007; Chapter 10; ISBN 978-0521-70596-7. [Google Scholar]
- Zong, Y.; Chen, X. The 1998 flood on the Yangtze, China. Nat. Hazards 2000, 22, 165–184. [Google Scholar] [CrossRef]
- Su, B.; Gemmer, M.; Jiang, T. Spatial and temporal variation of extreme precipitation over the Yangtze River Basin. Quat. Int. 2008, 186, 22–31. [Google Scholar] [CrossRef]
- Longjun, C.; Bo, W. Climatic type division and potential extent desertification of desertification in China. J. Desert Res. 1997, 17, 111–117. [Google Scholar]
- Zhai, P.; Zhang, X.; Wan, H.; Pan, X. Trends in total precipitation and frequency of daily precipitation extremes over China. J. Clim. 2005, 18, 1096–1108. [Google Scholar] [CrossRef]
- Dai, A.; Trenberth, K.E.; Qian, T. A global dataset of Palmer Drought Severity Index for 1870–2002: Relationship with soil moisture and effects of surface warming. J. Hydrometeorol. 2004, 5, 1117–1130. [Google Scholar] [CrossRef]
- Zhang, L.; Li, H.; Liu, D.; Fu, Q.; Li, M.; Faiz, M.A.; Khan, M.I.; Li, T. Identification and application of the most suitable entropy model for precipitation complexity measurement. Atmos. Res. 2019, 221, 88–97. [Google Scholar] [CrossRef]
- Khan, M.I.; Liu, D.; Fu, Q.; Azmat, M.; Luo, M.; Hu, Y.; Zhang, Y.; Abrar, F.M. Precipitation variability assessment of northeast China: Songhua River basin. J. Earth Syst. Sci. 2016, 125, 957–968. [Google Scholar] [CrossRef] [Green Version]
- Zhang, L.; Zhou, T. Drought over East Asia: A review. J. Clim. 2015, 28, 3375–3399. [Google Scholar] [CrossRef]
- Zhang, B.; Song, X.-F.; Zhang, Y.-H.; Han, D.-M.; Tang, C.-Y.; Yang, L.; Wang, Z.-L. The renewability and quality of shallow groundwater in Sanjiang and Songnen Plain, Northeast China. J. Integr. Agric. 2017, 16, 229–238. [Google Scholar] [CrossRef] [Green Version]
- Li, F.; Zhang, G.; Xu, Y.J. Assessing climate change impacts on water resources in the Songhua River basin. Water 2016, 8, 420. [Google Scholar] [CrossRef] [Green Version]
- Jones, P.G.; Thornton, P.K.; Díaz, W.; Wilkens, P.W.; Jones, A.L. MarkSim: A Computer Tool that Generates Simulated Weather Data for Crop Modeling and Risk Assessment: Version 1 [CD-ROM]; Centro Internacional de Agricultura Tropical: Cali, Colombia, 2002. [Google Scholar]
- Jones, P.G.; Thornton, P.K. Fitting a third-order Markov rainfall model to interpolated climate surfaces. Agric. For. Meteorol. 1999, 97, 213–231. [Google Scholar] [CrossRef]
- Jones, P.G.; Thornton, P.K. A rainfall generator for agricultural applications in the tropics. Agric. For. Meteorol. 1993, 63, 1–19. [Google Scholar] [CrossRef]
- Richardson, C.W. Stochastic simulation of daily precipitation, temperature, and solar radiation. Water Resour. Res. 1981, 17, 182–190. [Google Scholar] [CrossRef]
- Donatelli, M.; Campbell, G.S. A simple model to estimate global solar radiation. In Proceedings of the 5th European Society of Agronomy Congress, Nitra, Slovakia, 28 June 1998; Volume 2, pp. 133–134. [Google Scholar]
- Jones, P. Current availability and deficiencies in data relevant to agro-ecological studies in the geographic area covered by the IARCs. In Agricultural Environments: Proceedings of the Rome Workshop on Agro-Ecological Classification and Mapping; CABI International: Wallingford, UK, 1987. [Google Scholar]
- McKee, T.B. Drought monitoring with multiple time scales. In Proceedings of the 9th Conference on Applied Climatology, Boston, MA, USA, 15–20 January 1995. [Google Scholar]
- Loukas, A.; Vasiliades, L. Probabilistic analysis of drought spatiotemporal characteristics in Thessaly region, Greece. Nat. Hazards Earth Syst. Sci. 2004, 4, 719–731. [Google Scholar] [CrossRef]
- Wu, H.; Hayes, M.J.; Wilhite, D.A.; Svoboda, M.D. The effect of the length of record on the standardized precipitation index calculation. Int. J. Climatol. 2005, 25, 505–520. [Google Scholar] [CrossRef] [Green Version]
- Edwards, D.C. Characteristics of 20th Century Drought in the United States at Multiple Time Scales. Master’s Thesis, Defense Technical Information Center, Fort Belvoir, VA, USA, 1997. [Google Scholar]
- Gibbs, W.J.; Maher, J.V. Rainfall deciles as drought indicators, Bureau of Meteorology Bulletin no. 48. Commonw. Aust. Melb. 1967, 29, 1–33. [Google Scholar]
- Kininmonth, W.; Voice, M.; Beard, G. Australian Climate Services for Drought Management. Drought, a Global Assessment; Routledge: London, UK, 2000; pp. 210–222. [Google Scholar]
- Tigkas, D.; Vangelis, H.; Tsakiris, G. DrinC: A software for drought analysis based on drought indices. Earth Sci. Inform. 2015, 8, 697–709. [Google Scholar] [CrossRef]
- Khan, M.I.; Zhu, X.; Arshad, M.; Zaman, M.; Niaz, Y.; Ullah, I.; Anjum, M.N.; Uzair, M. Assessment of spatiotemporal characteristics of agro-meteorological drought events based on comparing Standardized Soil Moisture Index, Standardized Precipitation Index and Multivariate Standardized Drought Index. J. Water Clim. Chang. 2020, 11, 1–7. [Google Scholar] [CrossRef]
- McKee, T.B.; Doesken, N.J.; Kleist, J. The relationship of drought frequency and duration to time scales. In Proceedings of the 8th Conference on Applied Climatology, Anaheim, CA, USA, 17–22 January 1993; Volume 17, pp. 179–183. [Google Scholar]
- Tsakiris, G.; Pangalou, D.; Vangelis, H. Regional drought assessment based on the Reconnaissance Drought Index (RDI). Water Resour. Manag. 2007, 21, 821–833. [Google Scholar] [CrossRef]
- Khan, M.I.; Liu, D.; Fu, Q.; Saddique, Q.; Faiz, M.A.; Li, T.; Qamar, M.U.; Cui, S.; Cheng, C. Projected changes of future extreme drought events under numerous drought indices in the Heilongjiang Province of China. Water Resour. Manag. 2017, 31, 3921–3937. [Google Scholar] [CrossRef]
- Saifullah, M.; Liu, S.; Tahir, A.A.; Zaman, M.; Ahmad, S.; Adnan, M.; Chen, D.; Ashraf, M.; Mehmood, A. Development of threshold levels and a climate-sensitivity model of the hydrological regime of the high-altitude catchment of the Western Himalayas, Pakistan. Water 2019, 11, 1454. [Google Scholar] [CrossRef] [Green Version]
Figure 1.
Location of the study area.

Figure 2.
SPI and RDI drought trends at 3 months and 12 months under RCP 2.6.

Figure 3.
Drying pattern of Precipitation Decile (PD) under RCP 2.6, RCP4.5, and RCP 8.5.

Figure 4.
SPI and RDI drought trends at 3 months and 12 months under RCP 4.5. (a) SPI drought trends at 3 and 12 month; (c) RDI drought trends at 3 and 12 month; (b) SPI and RDI drought trends at 12 month (d) SPI and RDI drought trends at 3 month.
Figure 4.
SPI and RDI drought trends at 3 months and 12 months under RCP 4.5. (a) SPI drought trends at 3 and 12 month; (c) RDI drought trends at 3 and 12 month; (b) SPI and RDI drought trends at 12 month (d) SPI and RDI drought trends at 3 month.

Figure 5.
SPI and RDI drought trends at 3 months and 12 months under RCP 8.5. (a) SPI drought trends at 3 and 12 month; (c) RDI drought trends at 3 and 12 month; (b) SPI and RDI drought trends at 12 month; (d) SPI and RDI drought trends at 3 month.
Figure 5.
SPI and RDI drought trends at 3 months and 12 months under RCP 8.5. (a) SPI drought trends at 3 and 12 month; (c) RDI drought trends at 3 and 12 month; (b) SPI and RDI drought trends at 12 month; (d) SPI and RDI drought trends at 3 month.


Table 1.
Various MarkSim General Circulation Models (GCM).
| Model | Institution | Resolution (Lat × Long) | |
|---|---|---|---|
| 1 | BCC-CSM | Beijing Climate Centre, China Meteorological Administration | 2.81 × 2.81 |
| 2 | BCC-CSM 1.1 (m) | Beijing Climate Centre, China Meteorological Administration | 2.81 × 2.81 |
| 3 | CSIRO-MK3.6.0 | Commonwealth Scientific and Industrial Research Organization and the Queensland Climate Change Centre Of Excellence | 1.87 × 1.87 |
| 4 | FIO-ESM | First Institute of Oceanography, SOA, China | 2.81 × 2.81 |
| 5 | GFDL-CM3 | Geophysical Fluid Dynamics Laboratory, USA | 2.0 × 2.5 |
| 6 | GFDL-ESM2G | Geophysical Fluid Dynamics Laboratory, USA | 2.0 × 2.5 |
| 7 | GFDL-ESM2M | Geophysical Fluid Dynamics Laboratory, USA | 2.0 × 2.5 |
| 8 | GISS-E2-H | NASA Goddard Institute for Space Studies, USA | 2.0 × 2.5 |
| 9 | GISS-E2-R | NASA Goddard Institute for Space Studies, USA | 2.0 × 2.5 |
| 10 | HadGEM2-ES | Met Office Hadley Centre, UK | 1.24 × 1.85 |
| 11 | IPSL-CM5A-LR | Institute Pierre-Simon Laplace, France | 1.87 × 3.75 |
| 12 | IPSL-CM5A-MR | Institute Pierre-Simon Laplace, France | 1.87 × 3.75 |
| 13 | MIROC-ESM | Atmosphere and Ocean Research Institute, National Institute for Environmental Studies, and Japan | 2.81 × 2.81 |
| 14 | MIROC-ESM-CHEM | Atmosphere and Ocean Research Institute, National Institute for Environmental Studies, and Japan | 2.81 × 2.81 |
| 15 | MIROC5 | Atmosphere and Ocean Research Institute, National Institute for Environmental Studies, and Japan | 1.41 × 1.41 |
| 16 | MRI-CGCM3 | Meteorological Research Institute, Japan | 1.12 × 1.12 |
| 17 | NorESM1-M | Agency for Marine-Earth Science and Technology Norwegian Climate Centre | 1.87 × 1.87 |
Table 2.
Basic criterion for droughts.
| State | Description | Criterion |
|---|---|---|
| 1 | Mild drought | −0.50 to −0.99 |
| 2 | Moderate drought | −1.00 to −1.49 |
| 3 | Severe drought | −1.50 to −1.99 |
| 4 | Extreme drought | <−2.00 |
Table 3.
Precipitation Decile classification.
| Decile Class | Description |
|---|---|
| Decile 1–2 | Much below normal |
| Decile 3–4 | Below normal |
| Decile 5–6 | Near Normal |
| Decile 7–8 | Above Normal |
| Decile 9–10 | Much above Normal |
Table 4.
Drought duration (DD), drought severity (DS), and drought intensity (DI) under RCP 2.6.
| SPI-3 | SPI-12 | ||||
|---|---|---|---|---|---|
| DD (years) | DS | DI | DD (years) | DS | DI |
| 2021–2023(3) | −1.04 | −0.35 | 2021–2023(3) | −1.36 | −0.45 |
| 2066–2068(3) | −1.04 | −0.35 | 2027–2030(4) | −0.70 | −0.17 |
| 2073–2076(4) | −1.66 | −0.42 | 2062–2064(3) | −1.00 | −0.33 |
| 2082–2085(4) | −0.91 | −0.23 | 2087–2089(3) | −0.95 | −0.32 |
| 2097–2099(3) | −1.85 | −0.62 | 2037–2039(3) | −0.79 | −0.26 |
| RDI-3 | RDI-12 | ||||
| DD (years) | DS | DI | DD (years) | DS | DI |
| 2021–2023(3) | −1.09 | −0.36 | 2021–2023(3) | −0.86 | −0.29 |
| 2025–2027(3) | −0.75 | −0.25 | 2025–2030(6) | −0.91 | −0.15 |
| 2032–2035(4) | −0.68 | −0.17 | 2074–2076(3) | −1.37 | −0.46 |
| 2044–2048(5) | −0.84 | −0.17 | |||
| 2060–2062(3) | −0.83 | −0.28 | |||
| 2074–2077(4) | −1.01 | −0.25 |
Table 5.
Drought duration (DD), drought severity (DS), and drought intensity (DI) under RCP 4.5.
| SPI-3 | SPI-12 | ||||
|---|---|---|---|---|---|
| DD (years) | DS | DI | DD (years) | DS | DI |
| 2025–2027(3) | −1.14 | −0.38 | 2021–2024(5) | −0.70 | −0.14 |
| 2053–2056(4) | −0.91 | −0.23 | 2025–2027(3) | −1.04 | −0.35 |
| 2059–2061(3) | −0.90 | −0.30 | 2031–2034(4) | −0.85 | −0.21 |
| 2066–2068(3) | −1.72 | −0.57 | 2052–2054(3) | −0.73 | −0.24 |
| 2083–2087(5) | −1.34 | −0.27 | |||
| 2091–2093(3) | −0.80 | −0.27 | |||
| RDI-3 | RDI-12 | ||||
| DD (years) | DS | DI | DD (years) | DS | DI |
| 2045–2048(4) | −0.96 | −0.24 | 2031–2033(3) | −0.73 | −0.24 |
| 2049–2051(3) | −0.79 | −0.26 | 2052–2054(3) | −0.90 | −0.30 |
| 2056–2058(3) | −0.79 | −0.26 | 2072–2074(3) | −0.99 | −0.33 |
| 2069–2071(3) | −1.40 | −0.47 | 2076–2078(3) | −0.90 | −0.30 |
| 2077–2079(3) | −0.85 | −0.28 | 2087–2090(4) | −0.85 | −0.21 |
| 2087–2089(3) | −1.39 | −0.46 | 2093–2095(3) | −1.28 | −0.43 |
| 2090–2092(3) | −1.27 | −0.42 | 2096–2099(4) | −1.53 | −0.38 |
| 2096–2098(3) | −0.97 | −0.32 |
Table 6.
Drought duration (DD), drought severity (DS), and drought intensity (DI) under RCP 8.5.
| SPI-3 | SPI-12 | ||||
|---|---|---|---|---|---|
| DD (years) | DS | DI | DD (years) | DS | DI |
| 2025–2028(4) | −1.16 | −0.29 | 2021–2026(6) | −0.93 | −0.16 |
| 2041–2044(4) | −0.79 | −0.20 | 2027–2032(6) | −1.07 | −0.18 |
| 2046–2048(3) | −1.15 | −0.38 | 2034–2036(3) | −0.96 | −0.32 |
| 2053–2056(4) | −1.42 | −0.36 | |||
| 2071–2073(3) | −1.20 | −0.40 | |||
| 2091–2093(3) | −0.97 | −0.32 | |||
| RDI-3 | RDI-12 | ||||
| DD (years) | DS | DI | DD (years) | DS | DI |
| 2032–2034(3) | −1.81 | −0.60 | 2055–2057(3) | −0.69 | −0.23 |
| 2084–2086(3) | −0.64 | −0.21 | 2065–2067(3) | −0.67 | −0.22 |
| 2088–2090(3) | −0.83 | −0.28 | 2071–2077(7) | −1.04 | −0.15 |
| 2093–2095(3) | −1.35 | −0.45 | 2084–2088(5) | −1.54 | −0.31 |
| 2097–2099(3) | −1.51 | −0.50 | 2093–2099(7) | −1.50 | −0.21 |
Publisher’s Note: MDPI stays neutral with regard to jurisdictional claims in published maps and institutional affiliations. |
© 2021 by the authors. Licensee MDPI, Basel, Switzerland. This article is an open access article distributed under the terms and conditions of the Creative Commons Attribution (CC BY) license (https://creativecommons.org/licenses/by/4.0/).
Share and Cite
MDPI and ACS Style
Khan, M.I.; Zhu, X.; Jiang, X.; Saddique, Q.; Saifullah, M.; Niaz, Y.; Sajid, M. Projection of Future Drought Characteristics under Multiple Drought Indices. Water 2021, 13, 1238. https://doi.org/10.3390/w13091238
AMA Style
Khan MI, Zhu X, Jiang X, Saddique Q, Saifullah M, Niaz Y, Sajid M. Projection of Future Drought Characteristics under Multiple Drought Indices. Water. 2021; 13(9):1238. https://doi.org/10.3390/w13091238
Chicago/Turabian StyleKhan, Muhammad Imran, Xingye Zhu, Xiaoping Jiang, Qaisar Saddique, Muhammad Saifullah, Yasir Niaz, and Muhammad Sajid. 2021. "Projection of Future Drought Characteristics under Multiple Drought Indices" Water 13, no. 9: 1238. https://doi.org/10.3390/w13091238
Note that from the first issue of 2016, this journal uses article numbers instead of page numbers. See further details here.