Article

Analysis of the Water Quality of the Ishim River within the Akmola Region (Kazakhstan) Using Hydrochemical Indicators

by
Natalya S. Salikova
1,
Javier Rodrigo-Ilarri
2,*,
Kulyash K. Alimova
3 and
María-Elena Rodrigo-Clavero
2
1
Department of Ecology, Life Safety and Environmental Protection, Abay Myrzakhmetov Kokshetau University, Kokshetau 020000, Kazakhstan
2
Instituto de Ingeniería del Agua y del Medio Ambiente (IIAMA), Universitat Politècnica de València (UPV), 46022 Valencia, Spain
3
Department of Engineering Systems and Networks, K.I. Satbayev National Research Technical University, Almaty 050013, Kazakhstan
*
Author to whom correspondence should be addressed.
Water 2021, 13(9), 1243; https://doi.org/10.3390/w13091243
Submission received: 30 March 2021 / Revised: 23 April 2021 / Accepted: 27 April 2021 / Published: 29 April 2021
(This article belongs to the Special Issue River Water Management and Water Quality)

Abstract

:
For the first time in scientific literature, this work addresses the current situation of the Ishim River water quality in the Akmola Region (Northern Kazakhstan). This work uses environmental monitoring techniques to analyze the current state of surface waters in the river. The content of main ions, biogenic and inorganic ions, heavy metals, organic impurities in seasonal and annual dynamics have been studied. Results show that, despite the tightening of requirements for wastewater discharge into the Ishim River basin, a number of water quality indicators did not fulfill the regulatory requirements for surface water bodies during 2013–2019. It has been identified that the greatest pollution in the Ishim River is brought by enterprises of the Karaganda-Temirtau technogenic region, located in the upper reaches of the river. Future water quality monitoring is needed and should include increasing the number of sampling locations and the sampling frequency in order to characterize the spatial and temporal variability of hydrochemical parameters and allow a comprehensive monitoring of legally fixed water quality parameters/indicators.

1. Introduction

Despite the fact that the new millennium is over 20 years old, the problem of providing the population with high-quality water for household and drinking purposes not only remains relevant, but also becomes more acute for a number of countries. This problem is of particular relevance for countries with developing economies, as well as those experiencing a shortage of water resources [1,2,3]. Currently, surface waters are contaminated with an increasing diversity of anthropogenic compounds, giving rise to the presence of complex contaminant mixtures that represent a real environmental threat [4,5,6,7,8,9,10].
The imbalance between the anthropogenic load on water bodies and their ability to restore can lead to an ecological disadvantage of lakes and rivers, and insufficient funding for the needs of the water sector can cause an unsatisfactory (in places of emergency) technical condition of water facilities and a serious aggravation of the problems of supplying the population with quality water for household and drinking purposes.
One of the most important indicators of water quality is the hydrochemical composition of surface waters, which is controlled by their geochemical background, natural climatic conditions and the influence of anthropogenic sources [11].
On the scientific literature, it is generally accepted to divide all the factors influencing the formation of the quality of natural waters into groups that differ in the nature of the impact. This group of chemical factors includes pH, chemical composition and redox properties. Relief features, landscape properties and climate characteristics are combined into a group of climatic and geographical factors. Some of the direct and main factors are the composition of rocks, the geological structure of the basin and hydrological conditions. Usually, they are all combined into a group of hydrogeological factors. Biological factors include the activities of the natural environment (animals, plants, microorganisms) and anthropogenic activities [12].
At the present stage, there is a transformation of the hydrochemical composition of surface and ground waters as a result of anthropogenic stress [13,14,15,16,17,18]. The growth of anthropogenic load on water systems has been going on since the middle of the last century and continues at the present time.
Substances of natural origin (potassium (K) and sodium (Na) ions, sulfates and carbonates, metals such as lead (Pb), cadmium (Cd), copper (Cu), manganese (Mn), zinc (Zn), cobalt (Co), arsenic (As), etc.), and artificial substances alien to nature (surfactants, pesticides, phenols, drugs, etc.), enter the water bodies with industrial wastewater, washout from agricultural territories, with unorganized atmospheric flows, which increase the natural concentration of elements in water tenfold [19,20,21].
Water supply to the population and the needs of the industrial and agricultural activities is primarily provided by surface watercourses, the quality and quantity of which, on the one hand, must correspond to the needs of consumers. On the other hand, it is precisely as a result of interaction with humans that the quality of surface water deteriorates significantly, and the amount of water available to humans changes [22,23].
The anthropogenic impact on surface watercourses is diverse and manifests itself first in changes in the hydrological regime, flow volume and fluctuations in the ionic composition. The entry of pollutants into natural waters can change the gas regime of the aquatic environment (transition to the anaerobic state), redox and acid-base conditions. In addition to the combined action of these factors, the migration ability of ions changes significantly, and the salt composition of natural waters also changes. An increase in the content of suspended solids of organic and inorganic nature in the water of reservoirs, macro-and microions of anthropogenic origin disrupt the natural processes of self-purification, worsening the vital activity of hydrobionts. Many of the ions present in watercourses in increased quantities can cause serious illnesses and health problems in humans.
Numerous scientific works have established the effect of the flow of organic substances on a decrease in the concentration of dissolved oxygen, an increase in the oxidation of a reservoir and a change in the biological and hydrochemical parameters of the aquatic environment. Toxic compounds (such as biphenyls, organochlorine compounds, pesticides, polycyclic aromatic hydrocarbons and sulfur compounds) in surface waters reduce the biological activity of aquatic organisms [24,25,26].
Several studies have been focused on researching current water resource systems in Kazakhstan and Central Asia [27], including anthropogenic impacts on water resources, the impact of climate change on water availability, water availability and the quality of water supply, as well as water management and its impact on ecosystems quality. Regarding water quality, research has been carried out only in a few rivers in Kazakhstan [28,29,30,31,32].
For the first time in scientific literature, this work addresses the current situation of the Ishim River water quality in the Akmola Region (Northern Kazakhstan). This work uses environmental monitoring techniques to analyze the current state of the river water.
Therefore, the objective of this study is performing an assessment of the Ishim River water quality through the systematic analysis of its main hydrochemical parameters.

2. Materials and Methods

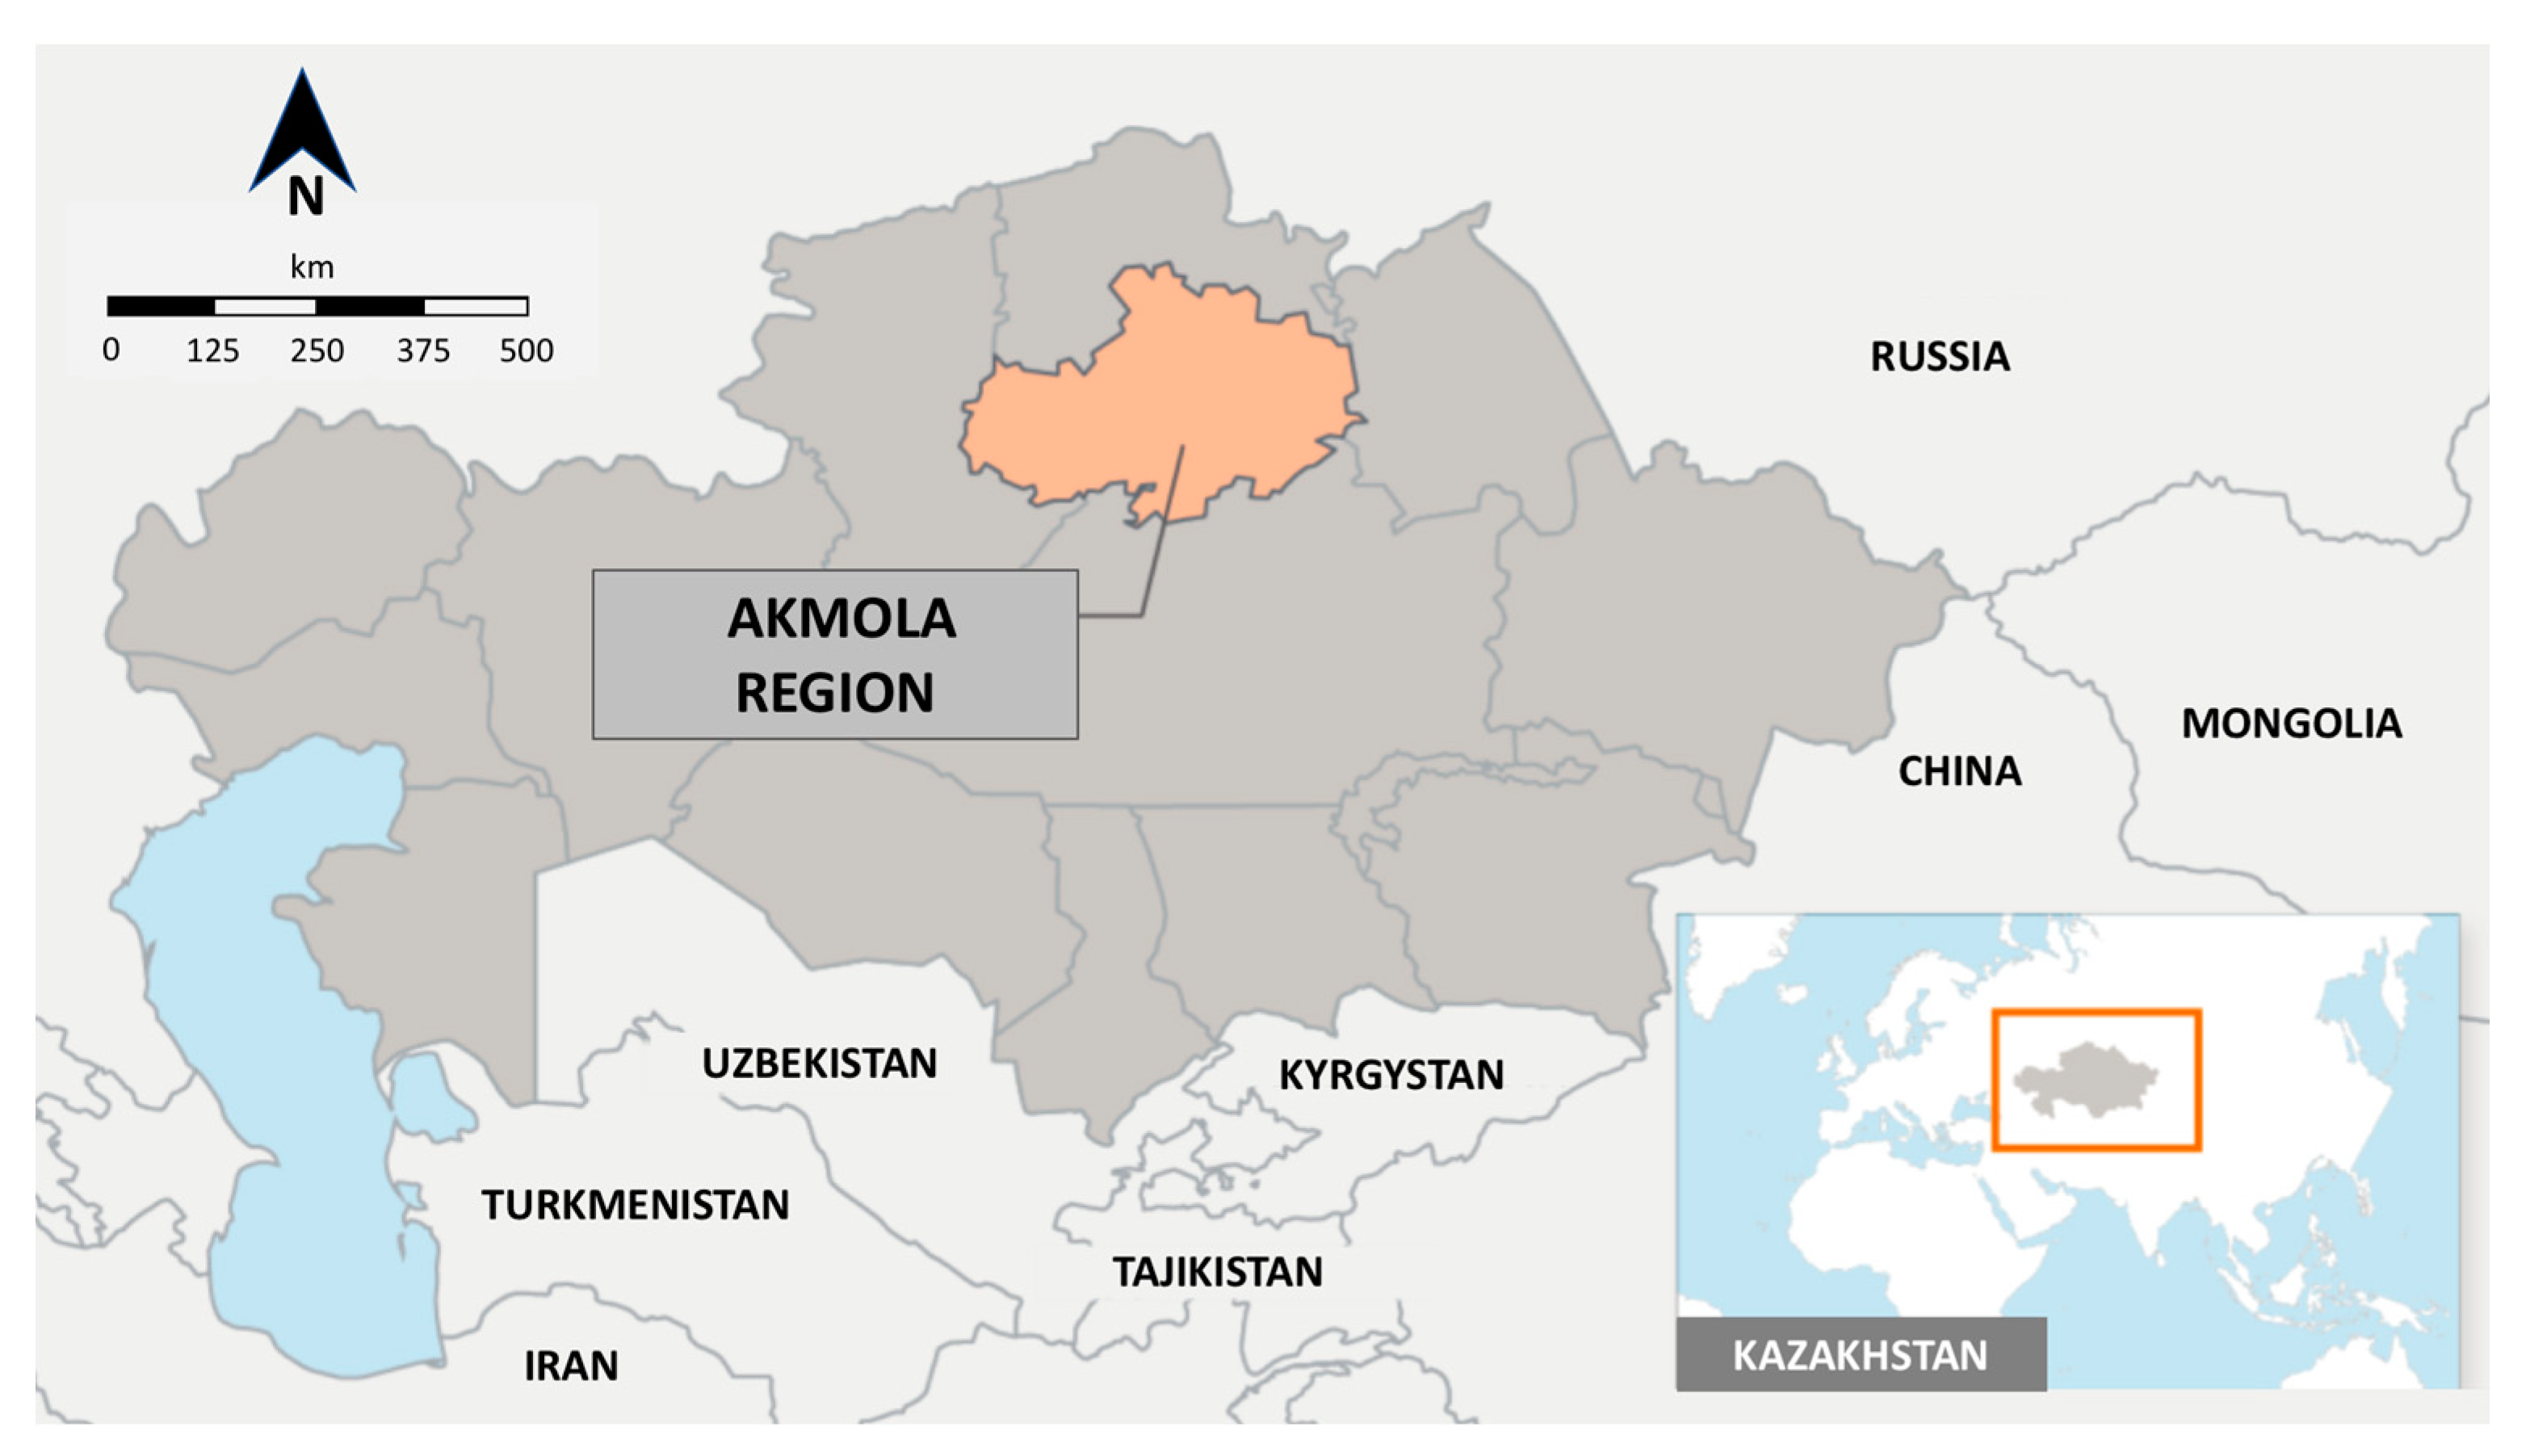
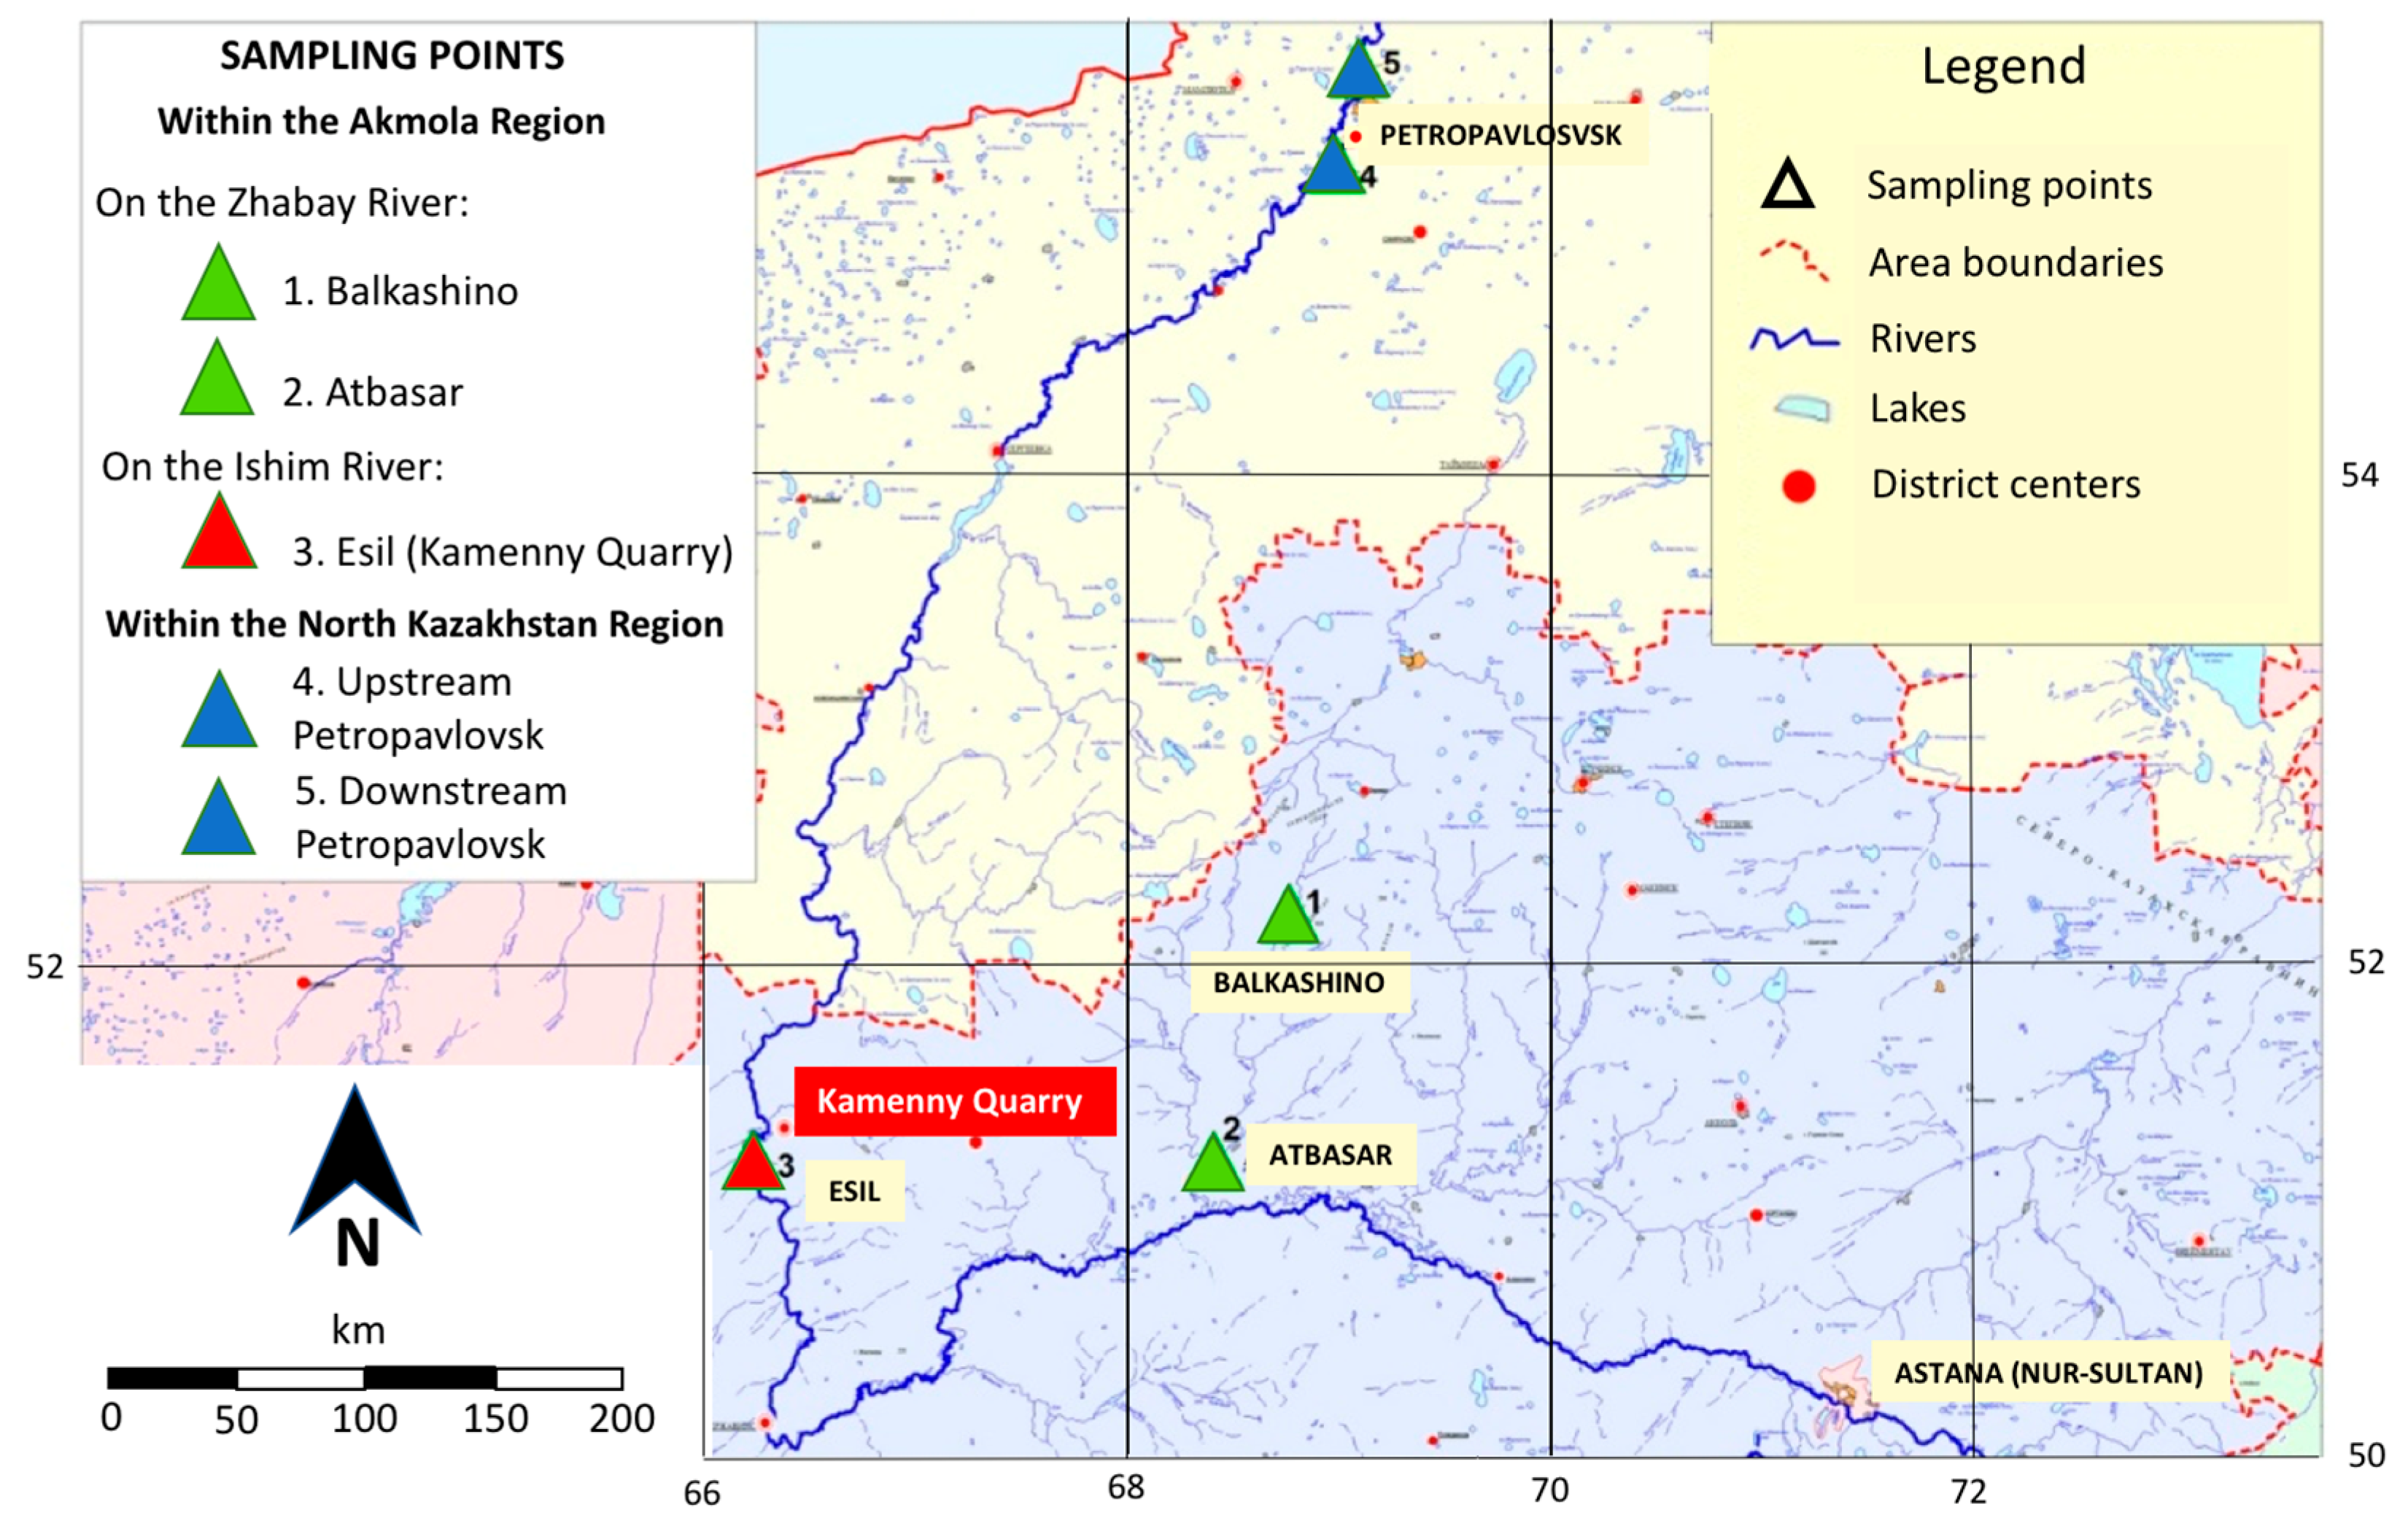
2.1. Description of the Study Area

Kazakhstan belongs to the group of countries with a large deficit of water resources and occupies one of the last places among the Commonwealth of Independent States (CIS) countries in terms of water availability (37,000 m3/km2). Water resources are distributed over the territory of Kazakhstan extremely unevenly. According to the State Program for Water Resources Management of Kazakhstan, more than 8% of settlements use drinking water that does not meet quality standards. Salinity concentrations are generally above 1.5 g/L, reaching even higher values in 176 settlements where the salt content is between 2–3 g/L. About 85% of surface water bodies cannot be classified as “clean”. The classification of surface water quality in Kazakhstan into “quality classes” until 2015 was carried out on the basis of calculating the integral assessment of the Water Pollution Index (WPI) in accordance with [33]. The quality class “clean” was assigned to waters with WPI equal to 0.3–1.0 units. The calculation of WPI was carried out according to six strictly limited indicators, regardless of whether they have an excess over the maximum permissible concentration (MPC) or not, among which the content of dissolved oxygen and biological oxygen demand (BOD5) is mandatory.
Since 2015, the assignment of a specific surface water quality class has been carried out based on the calculation of the Integrated Water Pollution Index (ICWI) in accordance with the Rules PR RK 52.5.06-03 of the Republic of Kazakhstan [34]. According to these rules, the quality class “normatively clean” is assigned to waters with ICWI < 1.0. All pollutants exceeding the maximum permissible concentration are taken into account in the calculation of ICWI, broken down into groups: generalized and organoleptic indicators, main ions, organic and inorganic pollutants.
In addition, the analysis of statistical data shows the absence of a stable positive dynamics of purification for most of the Kazakhstan Republic’s water bodies. Surface water bodies of the country are intensively polluted by wastewater from mining, metallurgical and chemical industries and agriculture activities. About half of all industrial effluents in the country are discharged into surface water bodies without any treatment.
Accordingly, the quality of drinking water in Kazakhstan lags behind the indicators of developed countries. In 2014, it was found that approximately 1% of all deaths in Kazakhstan are due to poor water quality. The rate of mortality and illness from poor water quality could probably have been higher if deep scientific studies were conducted on the correlation between water quality and biological effect.
The situation is aggravated by the lack of control over areal flushing into water bodies and watercourses from the territories of settlements, from agricultural fields, from the territories where various wastes are placed (dumps of overburden, ash dumps). These negative changes in watercourses are aggravated against the background of climate drying and intensification of soil erosion processes [35,36].
Studies on the largest rivers in Russia and Kazakhstan have revealed the deterioration of aquatic ecosystems as a result of human activities. The results show a significant contribution of the anthropogenic component to the change in the hydrochemical composition of rivers (from 5% for calcium ions to 39% for chlorine ions) [37,38,39].
Figure 1 shows the location of the Akmola Region inside the Republic of Kazakhstan. This region is located inside Northern Kazakhstan, with the city of Kokshetau being the administrative center and one of the most dynamically developing regions of Kazakhstan in recent years. It is characterized by an increasing population and employment in both agricultural and industrial production. Water resources to fulfill the needs of the region’s economy are provided by the Ishim River and its tributaries, the most significant of which, in terms of length and water content, are the Kolotun, Zhabay, Iman-Burluk, Akan-Burluk and Tersakkan rivers [40].
The semi-arid climate and geological and structural features of Northern Kazakhstan and the Akmola Region, in particular, to a greater extent in comparison with other regions of Kazakhstan, induce unfavorable conditions for the formation of significant resources of both surface and groundwater suitable for domestic drinking water supply. In addition, at the present stage of intensive industrial and agricultural growth, the aquatic ecosystems of Northern Kazakhstan are also receiving a significant anthropogenic load associated with an increase in the influx of heavy metals and biogenic elements that change the natural hydrochemical regime and the quality of surface water courses [41,42,43].
A limited number of publications devoted to the study of the hydrochemical composition of surface waters in Northern Kazakhstan have been identified in scientific literature [38,44,45,46]. These existing few scientific studies of surface waters are focused mainly on the Ishim River, the most detailed description of the formation conditions of which was carried out in the 20th century [47,48]. Modern studies of the river basin are limited to the study of the Ishim River itself, discarding the study of its tributaries. The analysis of the state of surface water quality in the region by hydrochemical indicators has not been undertaken by previous scientific works in recent years. Therefore, the importance of this study is even more relevant considering the effects of the increase of the population in the cities of North Kazakhstan which leads to an annual increase in the technogenic load on the river basin. Under these circumstances, the assessment of the water quality of surface water bodies on this region is even more relevant.
The economic development of the area affects environmental pollution and induces changes in water quality. The main sources of pollution of the basin along the entire course of the river are municipal wastewater, untreated wastewater from industrial enterprises, as well as ore wastewater from mining enterprises. Most of the surface water pollution comes from wastewater from industrial plots that do not have sewage systems. The agricultural activities justify the existence of the flow of organic and mineral fertilizers and pesticides into the surface waters from agricultural fields located inside the catchment areas [49].
The most typical pollutants of the river basin are organic pollutants (such as phenols and derivates) that have been identified by chemical oxidation methods. The river basin is also polluted by other toxic substances: mercury, organochlorine compounds, waste from mining industries and heavy and non-ferrous metals [50].
Industrialized regions such as the North Kazakhstan region, with the administrative center in the city of Petropavlovsk, bring oil products, phenols and sulfates to the hydrochemical composition of the Ishim River, as well as toxic metals—molybdenum and copper [51].
A decrease in the water discharge of the river worsened its water quality. Therefore, in high-discharge years the water quality was assessed as “slightly polluted”, while in years of average water discharge it was assessed as “polluted” and in dry years (periods of drought) the water quality was assessed as “very dirty” [52].
Another important factor of anthropogenic impact over the Ishim River Basin is water consumption associated with population growth and the development of human economic activity. The following types of water consumption in agriculture are typical for agrarian development in Northern Kazakhstan: watering of pastures and hayfields, regular and estuary irrigation and direct water supply to agriculture. The housing and utilities sector and industry also extract water but to a lesser extent than agriculture.
The highest water consumption occurred in the 1970s and was associated with the construction of reservoirs, the creation of a network of main water pipelines led, at that time, to an increase in water consumption in the communal housing sector. The growth in agricultural production also significantly increased the region’s water consumption.
Further changes in the volume and structure of water consumption are associated with the economic decline after the collapse of the USSR in the1990s and the resumption of economic development in Northern Kazakhstan after 2000. An important role in the growth of water consumption in the housing and communal sector during this period is played by population growth in connection with the construction of the capital (Nur-Sultan) [53].
The amount of untreated wastewater and water withdrawal in the basin during the period 2014–2018 is shown in Table 1 [54,55].
Thus, under conditions of anthropogenic pressure on aquatic ecosystems, it becomes increasingly difficult to solve the problem of ensuring the required water quality. In order to effectively manage water resources, systemic monitoring of the quality of natural waters and performing regular analysis of hydrochemical indicators in seasonal and long-term dynamics are required. This will make it possible to timely identify negative manifestations of the action of natural and anthropogenic factors in changing the ionic composition of surface waters, to preserve human health [56].

2.2. General Characteristics of the Water Quality of the Ishim River Basin

The Ishim River Basin occupies an area of 245,000 km2 in the Republic of Kazakhstan. The river originates in the Niyaz mountain range in the Karaganda region and is the only modern waterway of the Akmola Region. The river crosses the region from the south-east to the north-west and then flows north, through the North Kazakhstan Region, to the Russian Federation, where it flows into the Irtysh River. Thus, the Ishim River has a pronounced transboundary character. Within the region, the river length is 2017 km [57]. Within the city of Kamenny Quarry, the velocity of the river flow is 0.4–0.6 m/s.
Sampling was tied to gauging stations as shown in Figure 2. This study shows results obtained at the Kamenny Quarry gauging station, located on the Ishim River which is installed 0.5 km of North of Esil city. The Kamenny Quarry sampling station is the only one which is available on the Ishim River within the area. Two more stations are located on the Zhabay River (Balkashino and Atbasar) and other two sampling stations are located within the North Kazakhstan Region, upstream and downstream of Petropavlovsk city.
The river catchment area is located within the Kazakh Uplands, where the river receives waters from its largest tributaries: Koluton, Dzhabai, Tersakkan, etc. Right-bank tributaries—Koluton, Dzhabai—collect water from the southern slopes of the Kokchetav Upland, left-bank tributary Tersakkan from the northern slopes of the Dzhaksy-Arganaty mountains. The Ishim River recurrently shows pronounced flooding and long dry seasons. Flood duration is 1.5–2 months and increases downstream to 2–3 months. Floods account for 85–90% of the annual runoff. Melt water formed from snow melting is the main source of the river’s discharge [58].
Water supply within the boundaries of the region is quite enough to maintain a constant water flow during summer and winter low-water periods. The river does not dry out and does not freeze. Summer precipitation does not imply noticeable effects on the water regime of the Ishim River and summer floods are not observed.
The beginning of spring marks the start of the flooding period. Water levels rise around 10–12 April, reaching a peak by the end of April. The decline in high water usually ends at the end of May in the southern reaches and at the end of June in the northern reaches of the river [47].
Summer and autumn correspond to the low-water period, starting in June and lasting until the end of October or mid-November. The flat relief of the catchment area with many lake depressions and small slopes of the river contribute to stabilizing water levels during the summer-autumn low-water period. As water reserves in the basin are depleted, they decrease by the end of the low-water season. The lowest winter levels are usually observed at the beginning of freeze-up [59].
One of the features of the Ishim River is the irregularity of the runoff both in the seasonal and long-term sections. In the years characterized by low runoff, the runoff value is 6–10 times less than the average according to long-term observations. In high-water periods the runoff values are 2–3 times higher than the average values. The cycle of high-water years is between 3 and 4 years, while for low-water years it is between 8 and 11 years. The average annual volume of natural river runoff is shown in Figure 3. This value varies from 0.186 km3/year in the section of the dam of the Astana reservoir above Astana city, 2.11 km3/year in Petropavlovsk city, 2.23 km3/year in Ilyinka village at the border of the Russian Federation and Kazakhstan and 3.22 km3/year at the mouth of the river.
The coefficient of variation is quite high and reaches its highest values of 0.7–0.75 in the middle reaches of the Ishim [52].
The share of groundwater supply in the total runoff of river within the Akmola Region is about 14%, but in especially dry years it sharply increases [60].
River waters within the region are characterized by an increased salt content, the total mineralization recorded over a number of years decreases downstream, decreasing from 1500 mg/L near the town of Kamenny Quarry to 450 mg/L at the river mouth. The hydroclimatic conditions of the basin, characterized by a sharp predominance of evaporation over the amount of precipitation, are primarily responsible for the increased mineralization of water. The moisture coefficient of the basin area, taken as the ratio of the precipitation to the evaporation, is about 0.5, which reflects the natural discrepancy between the heat and moisture resources. The aridity of the territory leads to the accumulation of mineral salts in the soils and in the landscape as a whole. The runoff of melting water inside the catchment area also leads to an increased supply of these salts to the waters of the Ishim River and its tributaries [52]. This arid climate also justifies a significant mineralization of groundwater.
The hydrochemical composition of the river changes depending on the river discharge of every specific year and season. However, a certain regular pattern is observed: in the southern course calcium cations predominate while hydrocarbonates predominate among anions. Downstream the city of Astana, the chloride-hydrocarbonate composition is noted (the latter during the flood period), among the cations while calcium ions are also predominant. In the area of the Sergeevskoye reservoir and up to the outlet section of the village of Dolmatovo the hydrocarbonate class of the calcium or sodium group is dominant.
Water hardness indicators vary within 2.95–3.88 mg/eq. (in spring flood), within 4–5.6 mg/eq. (in summer–autumn low-water period) and within 6.0–8.4 mg/eq. in winter. The oxygen regime throughout the river has been repeatedly noted as satisfactory. The minimum oxygen content is observed during the freeze-up period. On average, the dissolved oxygen concentration at saturation is 88% [52].
Industrial and domestic wastewaters have a noticeable effect on the chemistry of the river water. A distinctive feature of the hydrochemical regime of the Ishim River is a well-defined seasonality of water salinity. Previous studies have shown that the salinity in the study area, depending on the river discharge of the year, ranged from 717 mg/L to 953 mg/L. The flood period naturally dilutes the salt content with snow water, the value of the total mineralization decreases to 286–350 mg/L, the ice coverage of the river surface and the introduction of mineral salts by brackish groundwater increases the total mineralization to 1032–1326 mg/L [61].
According to Zatenatskaya [62], river waters come mainly from alluvial deposits of the river valley. They are classified as fresh and slightly saline with a total mineralization of 0.5–3.0 g/L. Moreover, strongly brackish and salty waters with a total amount of salts from 3.0 to 27 g/L were identified. Mineralization of groundwater in alluvial deposits varies with depth and depending on the lithological composition of water-bearing rocks. Fresh groundwater is usually confined to fine and uneven-grained sands, slightly saline- to loam and sandy loam, saline- to heavy loam and sandy clays. The waters of the alluvial deposits of the Ishim valley are very diverse: hydrocarbonate–calcium–magnesium, hydrocarbonate–sodium, sulfate–sodium and chloride–magnesium–sodium.
An analysis has been also performed about the variability of the river’s salinity within the city of Astana in March (the month of the maximum content of dissolved substances). The maximum mineralization period was found between 1951–1960 when the average value reached 1728 mg/L. The minimum value of 940 mg/L was recorded in the decade 1971–1980.

2.3. Collection of Samples and Laboratory Treatment

Sampling of surface water was carried out in accordance with the standards of the Republic of Kazakhstan (ST RK) and specifically the state compulsory standard (GOST R) 51592-2003 “Water. General requirements for sampling”. Sampling was tied to gauging stations. The only gauging station on the Ishim River in this area is installed above 0.5 km of the city of Kamenny Quarry.
The number and frequency of water sampling for surface sources taken at the points of water intake is regulated by Appendix 4 of the Sanitary and Epidemiological Requirements for Water Sources. These requirements recommend monitoring organoleptic, generalized indicators, as well as organic and inorganic substances at least four times a year, distributed by season. In this study, monthly water samples were taken in an amount sufficient for all analytical measurements. In total, 12 samples were taken per year, 84 samples were taken for the period 2013–2019. All measurements were performed in accordance with the metrological requirements of the State Standard RK ST RK GOST R 51232-2003 [63]. Measurement results are considered reliable with the number of measurements performed (at least three parallel measurements in one sample) if the determination error does not exceed the norms established by the interstate standard GOST 27384-02. “Water. Rates of measurement error of characteristics of composition and properties” for each measurement. Measurements with an error not exceeding the standard value are ensured by the use of measuring instruments entered in the state register of approved types of measuring instrument and verified, as well as by the use of standardized methods for measuring water quality indicators. When studying surface waters, 47 physicochemical quality indicators were determined in the water samples: temperature, suspended solids, color, transparency, dissolved oxygen, hydrogen index (pH), biological oxygen demand for 5 days (BOD5), chemical oxygen demand (COD), the main ions of the salt composition, biogenic elements, organic substances (oil products, phenols), heavy metals for 2013–2019 in seasonal and annual dynamics. The analysis of water quality indicators was carried out using standard methods included in the state register of measurement methods of the Republic of Kazakhstan in accordance with the standards in force in Kazakhstan (ST RK) Guiding Documents (GD). According to GD 52.24.496-2005, temperature was determined with a thermometer directly in the reservoir, transparency was determined visually by the Secchi disk and smell was established by the organoleptic method. The smell was evaluated by the intensity and nature of the smell at room temperature (20 °C) and when heated up to 60 °C.
The photometric method was used to analyze water quality in terms of color (GD 52.24.497-2005) using a simulation scale based on potassium chloroplatinate and cobalt chloride in various ratios.
Photometric methods have also been used to analyze ions capable of forming colored complexes under certain conditions: total iron (GD 52.24.358-2006), total content of manganese ions (GD 52.24.467-2008), chromium (IV) ions (ST RK ISO 18412-2008), nitrates (GD 52.24.380-2006), nitrites (GD 52.24.381-2006), ammonium ions (GD 52.24.486-2009). The volumetric titrimetric method was used to determine the content of chlorides (GD 52.24.407-2006), sulfates (GD 52.24.401-2006), total hardness (GD 52.24.395-2007), calcium ions (GD 52.24.403-2007), hydrocarbonates (GD 52.24.493-2006), dissolved oxygen (GD 52.24. 419-2005), total oxidizability (GD 52.24.421-2012).
The biological oxygen demand (BOD5) was determined by the flask method based on the oxygen consumption for the oxidation of organic substances present in natural water samples. The oxygen content was determined by the titrimetric method by titrating a water sample with potassium iodide on the day of sampling and by keeping (incubating) water without access to light and air for 5 days (GD 52.24.420-2006).
Synthetic surfactants were determined by the extraction-photometric method (GD 52.24.368-2006). In the first stage, the complexes of the surfactant with bis (ethylenediamine) copper were extracted with chloroform and the further displacement of the bis (ethylenediamine) copper cation by the azure cation, which forms a colored complex with the surfactant, quantitatively identified by the photometric method.
The atomic absorption method (GD 52.24.377-95) was used to analyze the water quality by the content of ions Al, Ag, Be, Cd, Co, Cr, Cu, Mo, Ni, Pb, V, Zn, etc. This method is based on the determination of the atomic absorption of metals, for which they are dried and ashed in graphite tubes with a transmitted electric current. As a result of the atomization of metals, the value of their absorption was determined by spectral lines.
The list of the main measured indicators, applied measurement methods and detection limits of analytical methods are shown in Table 2. According to the metrological requirements of ST RK GOST R 51232-2003, all applied control methods have the lower limit of the range of determined contents of not more than 0.5 MPC.
In accordance with national legislation in Kazakhstan, the assessment of the compliance of natural waters with sanitary and hygienic standards was carried out on the basis of Appendices 1–3, 9 of the Sanitary Regulations “Sanitary and Epidemiological Requirements for Water Sources, Water Intake Points for Household and Drinking Purposes, Household and Drinking Water Supply, water use and safety of water bodies”.
In order to ensure the standard water quality for different water use objects in Kazakhstan, a water quality assessment system is being introduced, based on the values of the MPC of chemicals in water.
In this regard, the results of the quantitative analysis of water for each indicator were compared with the maximum permissible concentrations in surface water bodies (MPCsw), when the content of an ion or substance is compared with the maximum permissible concentration of the corresponding ion or substance in the water of water bodies for household, drinking and cultural purposes (MPCw) and with the maximum permissible concentration in water bodies for fishery purposes (MPCfw) [64,65]. At the same time as MPCsw, more stringent standards were established from the corresponding MPCw and MPCfw.
Average annual concentrations of all quality indicators were used to assess the temporal dynamics of water quality. Average annual relative values were obtained as the annual average of the ratios of pollutant concentrations to the corresponding MPC.

3. Results

This section shows the results found when analyzing the hydrochemical indicators of the Ishim River at the gauging station of the city of Kamenny Quarry. These indicators were obtained in the surface water monitoring system of the Republican State Enterprise “Kazhydromet” with the author’s participation. As a result of scientific research, the physical and chemical indicators for 2013–2019 were analyzed in seasonal and interannual dynamics.
Table 3 and Table 4 show the 2013–2019 average of the organoleptic and generalized indicators of the river waters and their monthly dynamics respectively. Table 5 shows the seasonal change in the total salinity of the Ishim River in the same period.
The dynamics of changes in the main ions (hydrocarbonates, sodium, potassium ions and total mineralization) was studied in seasonal dynamics according to the 2019 data.
Figure 4 shows results obtained in 2019 about the seasonal dynamics of macroions in the water of the Ishim River. Figure 5 shows the seasonal changes in biogenic and inorganic ions in the water of the Ishim River within the Akmola Region in 2019.
The content of microelements in water is an important indicator of its quality. Microelements are of great biological importance, but their excess can lead to undesirable physiological consequences in the human body and aquatic organisms and can worsen the general sanitary state of water bodies. Table 5 shows the content of microelements in the river waters, for which, in different years, the maximum permissible concentrations (MPCsw) for surface waters are exceeded.
An important hydrochemical indicator of surface waters is mineralization, including the content of calcium and magnesium ions (determining the hardness of water) and the content of sulfates, chlorides and hydrocarbons, which determine the ionic composition of water. Moreover, the average content of heavy and rare earth metals—Pb, Cd, Co, Al and Ni have also been obtained. Results show that MPCsw values for Ni and Co are generally exceeded at the Kamenny Quarry gauging station. The values of all these indicators are shown in Table 6. Table 7 shows the seasonal dynamics of the content of main ions, microelements and heavy metals.

4. Discussion

Results obtained show that the greatest pollution in the Ishim River is brought by enterprises of the Karaganda-Temirtau technogenic region, located in the upper reaches of the river. Thus, comparing with the MPC, the content of mercury in the early 2000s was recorded at 72 MPC. The decrease in the content of phenols occurred downstream of the river from 50 MPC within the city of Nur-Sultan to 4.7 MPC within the city of Kamenny Quarry [66].
In the 2000–2015 period, high concentrations of particularly persistent pollutants and pesticides (hexachlorocyclohexane and DDT) were also detected in the river along its entire length. The content of these particularly toxic substances varied from 0.001 μg/L to 0.03 μg/L. High concentrations in fresh waters of oil products (up to 6 MPC), manganese (up to 20 MPC) and copper (6–7 MPC) were recorded.
Modern regulation of water quality in Kazakhstan is based on the principle of priority of ensuring human safety and is based on sanitary and hygienic standards, taking into account the concentration of pollutants in a dissolved state in the aquatic environment (Table 6 and Table 7).
In terms of organoleptic and generalized indicators, the requirements for surface waters are met: pH value is within the normal range (average pH = 8.15), oxygen saturation is at least 82% with a regular decrease to 52% in winter low-water periods; average indicators of chromaticity (24 degrees), transparency (25 cm), odor (0 points) as shown in Table 3 and Table 4. Analysis of generalized and organoleptic indicators for compliance with sanitary requirements for drinking water shows that additional purification of water from organic pollutants is required before using it for drinking needs.
Besides, the river in the study area belongs to brackish waters with a salinity exceeding this indicator downstream in the area of the Petropavlovsk city, where the average value of the total mineralization usually did not exceed 820 mg/L [51]. If for surface waters this indicator is not standardized, then the maximum permissible concentration for drinking water is 1000 mg/L, exceeded in the autumn-winter period by 1.1–1.86 times (Table 6). Due to the arid climate, the excess of evaporation over precipitation leads to salinity of groundwater, feeding the river during the freeze-up period and increasing the total content of salts in them, including magnesium and calcium ions (Table 6). Analysis of seasonal dynamics (for 2013–2019) showed that during the freeze-up period, due to the groundwater supply to the river, salinity increases to 1433–1802 mg/L, decreasing in the summer period to 315–561 mg/L.
Similar seasonal dynamics were noted for the rest of the main ions (Figure 4). For example, due to the melting of the ice cover and an increase in the ambient temperature the content of bicarbonate ions decreases from 362–496 mg/L in January to 112–216 mg/L in May, which is associated with a decrease in the solubility of carbon dioxide in warm periods.
The seasonal dynamics of the main ions and the total mineralization content allows us to conclude that natural geomorphological and climatic factors are decisive in the formation of the water hydrochemical composition of the river for the main ions. The content of the main ions in the river water naturally increases during the freeze-up period due to the influx of more brackish groundwater, the value of the total mineralization during this period has a maximum value (Figure 4).
Since the catchment area of the studied river is a zone of active farming, a zone of intensive agricultural production, the content of biogenic ions, and primarily nitrogen and phosphorus compounds, in the river water will be observed in all seasons (Figure 4).
The greatest values of biogenic elements are observed during the flood period, in March (for nitrogen compounds), as well as in the summer–autumn period, when the organic matter of water bodies decays. The content of Fe ions passes through a maximum in June (2.82 MPCsw), according to the average annual value not exceeding 0.9 MPCsw. In terms of nutrients, the river complies with the standards for surface water bodies and for water for household and drinking purposes, and there is no excess of MPCw in all observed years.
Results shown in Figure 4 and Table 6 demonstrate that the Ishim River meets the requirements for drinking water for the content of iron ions; however, the requirements of surface water bodies for this indicator are not met.
The analysis of results shown in Table 6 and Table 7 shows that, in terms of the content of heavy and rare earth metals, the river meets the requirements for drinking water, and does not meet the requirements for surface waters exceeding the legal content of Cu, Zn and Mn.
These high concentrations of Fe ions, as well as Cu, Zn and Mn are due to both the anthropogenic influence of the capital, whose intensive industrial development has been observed in recent years, and natural processes. The catchment area of the river is located in the zones of ore occurrences of Mn, Cu–Au and Pb ores, confined to intrusive rocks of various compositions, participating in the formation of the chemical composition of surface waters. The entry of microelements into the water is also possible during weathering, as a result of which cations of Cu, Zn, Mn, etc. are released and enter the surface water [50,67].
Analysis of the content of toxic ions (cyanides, Hg, synthetic surfactants, oil products, phenols, Cr (+VI)) showed that during the entire analyzed time period (2013–2019), an excess of sanitary standards in relation to the MPCw and MPCsw was not found.

5. Conclusions

The hydrochemical composition of the water of the Ishim River within the Akmola Region in Kazakhstan is controlled by a complex combination of geological and geomorphological conditions as well as natural hydroclimatic and anthropogenic processes occurring in the catchment of the river. It has been found that in the formation of the main hydrochemical indicators, the prevailing role belongs to natural factors. The arid climate of the basin and the peculiarities of the river catchment area lead to seasonal patterns in the dynamics of the salt composition of water (total mineralization, Ca and Mg ions, Na ions, chlorides and hydrocarbonates).
Results obtained show that the greatest pollution in the Ishim River is brought by enterprises of the Karaganda-Temirtau technogenic region, located in the upper reaches of the river. In order to ensure the standard water quality for different water-use objects, a water quality assessment system is being introduced, based on the values of the maximum permissible concentration (MPC) of chemicals in water, physical ingredients (mineral particles, radioactive contamination, heat and cold) and microorganisms (coli index, titer, etc.), as well as complex indicators of contamination.
The river waters belong to the hydrocarbonate type with a predominance of calcium ions. During the freeze-up period, waters are enriched with sodium, chlorine, and hydrocarbonates. During the flood period, the total mineralization of the water decreases. The greatest values of biogenic elements are observed during the flood period, in March (for nitrogen compounds), as well as in the summer–autumn period, when the organic matter of water bodies decays.
Despite the tightening of requirements for wastewater discharge into the Ishim River basin, a number of water quality indicators did not fulfill the regulatory requirements for surface water bodies during 2013–2019. The river along the alignment of the Kamenny Quarry city is assessed as “normatively clean” in terms of generalized and main ions, biogenic elements, organic and toxic substances, most heavy and rare earth metals. There is a lack of compliance with the sanitary requirements for drinking water in terms of oxidizability and total mineralization. It has been noted that sanitary standards for surface waters are exceeded in terms of the content of sulfates, Cu, Zn and Mn ions. The development of occurrences of Mn, Cu-Au and Pb ores confined to intrusive rocks of various compositions in the Ishim River Basin leads to increased concentrations of sulfate, Cu, Zn and Mn ions.
Future water quality monitoring is needed and should include increasing the number of sampling locations and the sampling frequency [68], in order to characterize the spatial and temporal variability of hydrochemical parameters and allow a comprehensive monitoring of legally fixed water quality parameters/indicators.

Author Contributions

Conceptualization, N.S.S. and J.R.-I.; methodology, N.S.S. and K.K.A.; software, J.R.-I. and M.-E.R.-C.; validation, N.S.S. and K.K.A.; formal analysis, N.S.S. and J.R.-I.; investigation, N.S.S. and K.K.A.; resources, N.S.S. and K.K.A.; data curation, J.R.-I. and M.-E.R.-C.; writing—original draft preparation, N.S.S. and K.K.A.; writing—review and editing, J.R.-I. and M.-E.R.-C.; visualization, J.R.-I. and M.-E.R.-C.; supervision, N.S.S. and J.R.-I.; project administration, N.S.S.; funding acquisition, N.S.S. All authors have read and agreed to the published version of the manuscript.

Funding

This research received no external funding.

Informed Consent Statement

Not applicable.

Data Availability Statement

Data used in this study were obtained from the surface water monitoring system of the Republican State Enterprise “Kazhydromet” with the author’s participation.

Conflicts of Interest

The authors declare no conflict of interest.

References

  1. Kannel, P.R.; Lee, S.; Lee, Y.S.; Kanel, S.R.; Khan, S.P. Application of water quality indices and dissolved oxygen as indicators for river water classification and urban impact assessment. Environ. Monit. Assess. 2007, 132, 93–110. [Google Scholar] [CrossRef]
  2. Debels, P.; Figueroa, R.; Urrutia, R.; Barra, R.; Niell, X. Evaluation of water quality in the Chillán River (Central Chile) using physicochemical parameters and a modified Water Quality Index. Environ. Monit. Assess. 2005, 110, 301–322. [Google Scholar] [CrossRef] [PubMed]
  3. Thotagamuwa, H.T.B.N.; Weerasinghe, V.P.A. Surface water quality assessment for the management of hydrological regimes: Kalu Oya and Mudun Ela catchment in Sri Lanka. Environ. Nanotechnol. Monit. Manag. 2021, 15, 100402. [Google Scholar] [CrossRef]
  4. De Baat, M.L.; Van der Oost, R.; Van de Lee, G.H.; Wieringa, N.; Hamers, T.; Verdonschot, P.F.M.; De Voogt, P.; Kraak, M.H.S. Advancements in effect-based surface water quality assessment. Water Res. 2020, 183, 116017. [Google Scholar] [CrossRef]
  5. Vörösmarty, C.J.; McIntyre, P.B.; Gessner, M.O.; Dudgeon, D.; Prusevich, A.; Green, P.; Glidden, S.; Bunn, S.E.; Sullivan, C.A.; Liermann, C.R.; et al. Global threats to human water security and river biodiversity. Nature 2010, 467, 555–561. [Google Scholar] [CrossRef] [PubMed]
  6. Bernhardt, E.S.; Rosi, E.J.; Gessner, M.O. Synthetic chemicals as agents of global change. Front. Ecol. Environ. 2017, 15, 84–90. [Google Scholar] [CrossRef]
  7. Evans, A.E.V.; Hanjra, M.A.; Jiang, Y.; Qadir, M.; Drechsel, P. Water Quality: Assessment of the Current Situation in Asia. Int. J. Water Resour. Dev. 2012, 28, 195–216. [Google Scholar] [CrossRef]
  8. Mustapha, A.; Aris, A.Z.; Juahir, H.; Ramli, M.F. Surface water quality contamination source assessment and physico-chemical characterization at the upper section of the Jakara Basin, Nigeria. Arab. J. Geosci. 2013, 6, 4903–4915. [Google Scholar] [CrossRef]
  9. Walker, D.B.; Baumgartner, D.J.; Gerba, C.P.; Fitzsimmons, K. Surface Water Pollution. In Environmental and Pollution Science; Brusseau, M.L., Pepper, I.L., Gerba, C.P., Eds.; Academic Press: London, UK, 2019; pp. 261–292. [Google Scholar]
  10. EEA. Chemicals in European Water—Knowledge Developments; European Environmental Agency: Copenhagen, Denmark, 2018; No 18/2018. [Google Scholar]
  11. Batheria, R.; Jain, D. Water quality assessment of lake water: A review. Sustain. Water Resour. Manag. 2016, 2, 161–173. [Google Scholar] [CrossRef] [Green Version]
  12. Nikanorov, A.M. Hydrochemistry; Gidrometeoizdat: St. Petersburg, Russia, 2001. [Google Scholar]
  13. Wu, N.; Liu, S.M.; Zhang, G.L.; Zhang, H.M. Anthropogenic impacts on nutrient variability in the lower Yellow River. Sci. Total Environ. 2021, 755, 142488. [Google Scholar] [CrossRef]
  14. Arenas-Sánchez, A.; Dolédec, S.; Vighi, M.; Rico, A. Effects of anthropogenic pollution and hydrological variation on macroinvertebrates in Mediterranean rivers: A case-study in the upper Tagus river basin (Spain). Sci. Total Environ. 2021, 766, 144044. [Google Scholar] [CrossRef] [PubMed]
  15. Ghazaryan, K.; Movsesyan, H.; Gevorgyan, A.; Minkina, T.; Sushkova, S.; Rajput, V.; Mandzhieva, S. Comparative hydrochemical assessment of groundwater quality from different aquifers for irrigation purposes using IWQI: A case-study from Masis province in Armenia. Groundw. Sustain. Dev. 2020, 11, 100459. [Google Scholar] [CrossRef]
  16. Gesels, J.; Dollé, F.; Leclercq, J.; Jurado, A.; Brouyère, S. Groundwater quality changes in peri-urban areas of the Walloon region of Belgium. J. Contam. Hydrol. 2021, 240, 103780. [Google Scholar] [CrossRef]
  17. Alshehri, F.; Almadani, S.; El-Sorogy, A.S.; Alwaqdani, E.; Alfaifi, H.J.; Alharbi, T. Influence of seawater intrusion and heavy metals contamination on groundwater quality, Red Sea coast, Saudi Arabia. Mar. Pollut. Bull. 2021, 165, 112094. [Google Scholar] [CrossRef]
  18. Zakaria, N.; Anornu, G.; Adomako, D.; Owusu-Nimo, F.; Gibrilla, A. Evolution of groundwater hydrogeochemistry and assessment of groundwater quality in the Anayari catchment. Groundw. Sustain. Dev. 2021, 12, 100489. [Google Scholar] [CrossRef]
  19. Nikanorov, A.M.; Khoruzhaya, T.A. Intra-water body processes in large reservoirs in the south of Russia (pollution, eutrophication, toxification). Geogr. Nat. Resour. 2014, 35, 135–142. [Google Scholar] [CrossRef]
  20. Nikanorov, A.M. Selective response of water ecosystems to the anthropogenic effect. Dokl. Earth Sci. 2015, 459, 1573–1575. [Google Scholar] [CrossRef]
  21. Kokhanistaya, E.V. Phytoplankton as an indicator of the state of aquatic ecosystems of the Proletarsky and Veselovsky reservoirs. Nat. Sci. Bull. Higer Educ. Inst. North Cauc. Reg. 2014, 5, 78–83. [Google Scholar]
  22. Peters, N.E.; Meybeck, M. Water Quality Degradation Effects on Freshwater Availability: Impacts of Human Activities. Water Int. 2000, 25, 185–193. [Google Scholar] [CrossRef]
  23. Parfenova, G.K. Anthropogenic Changes in Hydrochemical Indicators of Water Quality; Agraf Press: Tomsk, Russia, 2010. [Google Scholar]
  24. Buser, H.-R. Atrazine and Other s-Triazine Herbicides in Lakes and in Rain in Switzerland. Environ. Sci. Technol. 1990, 4, 1049–1058. [Google Scholar] [CrossRef]
  25. Kozhova, O.M. Microbiological characteristics of the Angara reservoirs and assessment of the quality of their waters. Nat. Resour. Ecol. Soc. Environ. Cisbaikalia 1995, 2, 50–55. [Google Scholar]
  26. Aktymbaeva, A.S. Modeling changes in dissolved oxygen and BOD5 in Alakol lake conditions. In Proceedings of the VI All-Russia Hydrological Congress, St. Petersburg, Russia, 28 September–1 October 2004; pp. 19–21. [Google Scholar]
  27. Karatayev, M.; Kapsalyamova, Z.; Spankulova, L.; Skakova, A.; Movkebayeva, G.; Kongyrbay, A. Priorities and challenges for a sustainable management of water resources in Kazakhstan. Sustain. Water Qual. Ecol. 2017, 9–10, 115–135. [Google Scholar] [CrossRef]
  28. Huang, W.; Duan, W.; Nover, D.; Sahu, N.; Chen, Y. An integrated assessment of surface water dynamics in the Irtysh River Basin during 1990–2019 and exploratory factor analyses. J. Hydrol. 2021, 593, 125905. [Google Scholar] [CrossRef]
  29. Snow, D.D.; Chakraborty, P.; Uralbekov, B.; Satybaldiev, B.; Sallach, J.B.; Thornton Hampton, L.M.; Jeffries, M.; Kolok, A.S.; Bartelt-Hunt, S.B. Legacy and current pesticide residues in Syr Darya, Kazakhstan: Contamination status, seasonal variation and preliminary ecological risk assessment. Water Res. 2020, 184, 116141. [Google Scholar] [CrossRef] [PubMed]
  30. Ullrich, S.M.; Ilyushchenko, M.A.; Uskov, G.A.; Tanton, T.W. Mercury distribution and transport in a contaminated river system in Kazakhstan and associated impacts on aquatic biota. Appl. Geochem. 2007, 22, 2706–2734. [Google Scholar] [CrossRef]
  31. Rzymski, P.; Klimaszyk, P.; Niedzielski, P.; Marszelewski, W.; Borowiak, D.; Nowiński, K.; Baikenzheyeva, A.; Kurmanbayev, R.; Aladin, N. Pollution with trace elements and rare-earth metals in the lower course of Syr Darya River and Small Aral Sea, Kazakhstan. Chemosphere 2019, 234, 81–88. [Google Scholar] [CrossRef]
  32. Lovinskaya, A.; Kolumbayeva, S.; Begimbetova, D.; Suvorova, M.; Bekmagambetova, N.; Abilev, S. Toxic and genotoxic activity of river waters of Kazakhstan. Acta Ecol. Sin. 2021, in press. [Google Scholar] [CrossRef]
  33. State Committee for Hydrometeorological Monitoring. Guidelines for a Formalized Comprehensive Assessment of the Quality of Surface and Sea Waters by Hydrochemical Indicators; State Committee for Hydrometeorological Monitoring: Moscow, Russia, 1998. [Google Scholar]
  34. Kazakhstan Government. Environmental Monitoring Rules. Procedural Guidelines for Performing of Integrated Surveys of Environmental Pollution in the Areas Subjected to Intensive Anthropogenic Effect; PR RK 52.5.06-03; Ministry of Environment of the Republic of Kazakhstan: Astana, Kazakhstan, 2003.
  35. Georgiyevsky, V.Y.; Yezhov, A.V.; Shalygin, A.L.; Shiklomanov, A.I.; Shiklomanov, I.A. Evaluation of possible climate change impact on hydrological regime and water resources of the former USSR rivers. Russ. Meteorol. Hydrol. 1996, 11, 89–99. [Google Scholar]
  36. Skakun, V.A. Fishery in the basin of the Esil River. In Modern Problems of the Ishim Basin; Gylym: Almaty, Kazakhstan, 2007. [Google Scholar]
  37. Aytzhanova, D.A. Ecological and economic problems of water use in Kazakhstan. Ecol. Ind. Kazakhstan 2005, 3, 64–67. [Google Scholar]
  38. Doskaev, D.R.; Rakhmankulova, K.K. Status of monitoring surface water quality in the river basin Ishim. Bull. Al-FarabiKazNU.-Ecol. Ser. 2007, 1, 13–20. [Google Scholar]
  39. Ishkulova, N.P. Sustainable management of water resources of Kazakhstan. Ecol. Ind. Kazakhstan 2004, 3, 64–65. [Google Scholar]
  40. Tyumenev, S.D. Water Resources and Water Supply of the Territory of Kazakhstan; KazNTU: Almaty, Kazakhstan, 2008. [Google Scholar]
  41. Romanova, S.; Ryskaliveva, R. Hydrochemical regime and water quality of rivers and reservoirs of basins of Shu, Esyl, Tobol, Sirdariya rivers for long-term cycle. Chem. Bull. Kazakh Natl. Univ. 2012, 68, 182–188. [Google Scholar] [CrossRef] [Green Version]
  42. Salikova, N.S.; Seidakhmetova, G.I.; Zhaparova, S.B.; Bayazitova, Z.E.; Kapbasova, G.A. Assessment of the conformity of the quality of decentralized sources of water supply to the sanitary and hygienic requirements for household and drinking purposes. Bull. Kazakh Natl. Res. Univ. 2020, 6, 109–113. [Google Scholar]
  43. Salikova, N.S.; Uralbaeva, A.A. Monitoring of hydrochemical indicators of surface water bodies of the Akmola region. Actual Probl. Humanit. Nat. Sci. 2016, 2, 185–188. [Google Scholar]
  44. Nor, P.E.; Fitisova, M. Assessment of the ecological state of the Ishim river basin. Young Sci. 2014, 5, 183–185. [Google Scholar]
  45. Mogilyuk, S.V. Geoecological Aspects of Water Management in the Basin of Transboundary Rivers. Master’s Thesis, Tomksiy State University, Tomsk, Russia, 2004. [Google Scholar]
  46. Puzanov, A.V.; Baboshkina, S.V. The peculiarities of macro- and microelemental composition of drinking water in the North Kazakhstan Oblast as an environmental factor affecting human health. In Proceedings of the Regional Workshop. Strengthening the Collaboration between the AASA Clean Water Program and the IAP Water Program, Barnaul, Russia, 20–23 October 2009; pp. 71–75. [Google Scholar]
  47. Klushev, S.L.; Arefieva, V.A.; Zatenatskaya, T.I.; Isachenko, N.P.; Pachikina, Y.I.; Rubinshtein, L.I.; Feldman, M.I. Brief information about natural conditions and knowledge of the Kokchetav region. In Natural Zoning of Northern Kazakhstan; AN SSSR: Moscow-Leningrad, Russia, 1960. [Google Scholar]
  48. Kaimirasov, M.G. Physical and Geographical Conditions and Their Influence on the Water Regime of the Kokchetav Region; C.M. Kirov Kazakh State University: Almaty, Kazakhstan, 1975. [Google Scholar]
  49. Kazgiprovodkhoz Institute (Production Cooperative). General Scheme of Integrated Use and Protection of Water Resources of the Republic of Kazakhstan. T II. Book 3; Kazakhstan State Institute of Water Management Design: Almaty, Kazakhstan, 2010. [Google Scholar]
  50. Kobetaeva, N.K. Monitoring of the Hydroecosystem on the Example of the Ishim River of the Republic of Kazakhstan. Bachelor’s Thesis, Krasnoyarsk State Agrarian University, Krasnoyarsk, Russia, 2012. [Google Scholar]
  51. Likhodumova, I.N.; Salikova, N.S. The influence of natural and anthropogenic factors on the quality of surface waters of the North Kazakhstan region. Water Chem. Ecol. 2015, 5, 9–14. [Google Scholar]
  52. Frolova, N.L.; Ivanovskaya, V.V. Peculiarities of water use inconditions of water resources deficit (on the example of the Ishim river. Water Manag. Russ. Probl. Technol. Manag. 2015, 2, 4–19. [Google Scholar]
  53. UNECE. Targets to the Protocol on Water and Health to the Convention on the Protection and Use of Transboundary Watercourses and International Lakes (Republic of Kazakhstan). 2017. Available online: https://unece.org/fileadmin/DAM/env/water/meetings/Water_Convention/2016/Projects_in_Central_Asia/Baseline_study_and_target_indicators_to_the_Protocol_on_Water_and_Health_May_2017_RUS.pdf (accessed on 28 March 2021).
  54. Kazakhstan Government. Official Statistics of the Bureau of National Statistics of the Agency for Strategic Planning and Reforms of the Republic of Kazakhstan. Available online: https://stat.gov.kz/ecologic/polluted_non_treat (accessed on 28 March 2021).
  55. Kazakhstan Government. Environmental Protection in the Republic of Kazakhstan. Statistical Collection in Kazakh and Russian Languages (2015–2020); Bureau of National Statistics of the Agency for Strategic Planning and Reforms of the Republic of Kazakhstan: Nur-Sultan, Kazakhstan, 2020.
  56. UNDP. Water Resources of Kazakhstan in the New Millennium; United Nations Development Programme: New York, NY, USA, 2004. [Google Scholar]
  57. Dolatova, L.A. Features of the hydrochemical composition of the middle reaches of the river. Ishim and the lakes of its basin. World Sci. Cult. Educ. 2011, 1, 347–351. [Google Scholar]
  58. Berkaliev, Z.T. Hydrological Regime of Rivers in Central, Northern, and Western Kazakhstan; Akad. Nauk KazSSR: Alma-Ata, Kazakhstan, 1959. [Google Scholar]
  59. Bazhieva, A.M.; Burlibaev, M.Z.; Tursunov, E.A. Suggestions and comments on methods for assessing surface water pollution by hydrochemical indicators. Hydrometeorol. Ecol. 2009, 1, 76–84. [Google Scholar]
  60. Voskresensky, K.P. Rate and Variability of the Annual Flow of Rivers in the Soviet Union; Gidrometeoizdat: St. Petersburg, Russia, 1962. [Google Scholar]
  61. Likhodumova, I.N.; Salikova, N.S. Features of the Formation of the Elemental Composition of Groundwater in the Kokshetau Hydrogeological Region within the North Kazakhstan Region; 8th Biogeochemical School Biogeochemistry and Biochemistry in the Conditions of Technogenesis of the Biosphere: Grodno-Moscow, Russia, 2013; pp. 123–129. [Google Scholar]
  62. Zatenatskaya, N.P. Pore Waters of Clay Rocks and Their Role in the Formation of Groundwater; AN SSSR: Moscow, Russia, 1963. [Google Scholar]
  63. Kazakhstan Government. Drinking Water General Requirements for the Organization and Methods of Quality Control; ST RK GOST R 51232; Committee for Standardization, Metrology and Certification: Astana, Kazakhstan, 2003.
  64. Minister of National Economy of the Republic of Kazakhstan, Order of the Minister of National Economy of the Republic of Kazakhstan No. 209 ‘On Approval of the Sanitary Rules’ Sanitary and Epidemiological Requirements for Water Sources, Water Intake Points for Domestic and Drinking Purposes, Domestic and Drinking. 2015. Available online: http://adilet.zan.kz/rus/docs/V1500010774 (accessed on 20 January 2021).
  65. Ministry of Fisheries of the USSR. A Generalized List of Maximum Permissible Concentrations (MPC) and Tentatively Safe Exposure Levels (TSEL) of Harmful Substances for the Water of Fishery Reservoirs; Ministry of Fisheries of the USSR: Moscow, Russia, 1990.
  66. Dmitriev, L.N.; Tverdovsky, A.I. General characteristics of the ecological state of the Ishim river basin. In Modern Problems of the Ishim Basin; Gylym: Almaty, Kazakhstan, 2007. [Google Scholar]
  67. Dudareva, I.A.; Alimova, G.S.; Tokareva, A.Y. Manganese in water and bottom sediments of the lower current of the Irtysh river. Adv. Mod. Nat. Sci. 2017, 8, 70–74. [Google Scholar]
  68. Sambito, M.; Freni, G. Strategies for Improving Optimal Positioning of Quality Sensors in Urban Drainage Systems for Non-Conservative Contaminants. Water 2021, 13, 934. [Google Scholar] [CrossRef]
Figure 1. Location of the Akmola Region inside the Republic of Kazakhstan.
Water 13 01243 g001
Figure 2. Location of the Kamenny Quarry sampling station inside the Ishim River basin within the Akmola Region.
Water 13 01243 g002
Figure 3. Annual runoff of the Ishim River within Northern Kazakhstan (Mm3).
Water 13 01243 g003
Figure 4. Seasonal dynamics of macroions in the water of the Ishim River in 2019 (mg/L).
Water 13 01243 g004
Figure 5. Seasonal changes in biogenic and inorganic ions in the water of the Ishim River within the Akmola Region in 2019 (mg/L)
Water 13 01243 g005
Table 1. Wastewater discharge into the Ishim River Basin.
Wastewater Discharge (Mm3/Year)
Discharge Type20142015201620172018
Water intake from natural surface water sources22,21521,47223,57224,24724,076
Total volume of untreated wastewater discharged into water bodies62055935520555025408
Table 2. Main measured water quality indicators, methods for their determination and detection limits.
IndicatorMeasurement MethodDetection Limit
TemperatureThermometric (GD 52.24.96-2018)0.2 °C
pHPotentiometric (GD 52.24.495-2005)0.1 units
Color degreePhotometric (GD 52.24.497-2005) 1 degree
TransparencyWater column (GD 52.24.496-2018)0.5 cm
Dissolved oxygenVolumetric titrimetric (GD 52.24. 419-2005)0.01 mg/L
Biological oxygen demandTitrimetric (GD 52.24.420-2006)0.1 mg/L
Total oxidizability
(Chemical consumption of oxygen)
Volumetric titrimetric (GD 52.24.421-2012)0.1 mg/L
HydrocarbonatesVolumetric titrimetric (GD 52.24.493-2006)1 mg/L
NitratesPhotometric (GD 52.24.380-2006)0.001 mg/L
NitritesPhotometric (GD 52.24.381-2006)2 μg/L
Ammonium ionsPhotometric (GD 52.24.486-2009)0.001 mg/L
ChloridesVolumetric titrimetric (GD 52.24.407-2006)2 mg/L
SulfatesVolumetric titrimetric (GD 52.24.401-2006)10 mg/L
Calcium ionsVolumetric titrimetric (GD 52.24.403-2007)0.1 mg/L
Magnesium ionsVolumetric titrimetric (GD 52.24.395-2007)0.1 mg/L
MineralizationGravimetric (GD 14.1:2:4.261-2010)1 mg/L
Phosphate ionsPhotometric (GD 52.24.382-2006)0.002 mg/L
Sum of sodium and potassium ionsCalculated (52.24.514-2002)1 mg/L
Iron totalPhotometric (GD 52.24.358-2006)0.001 mg/L
Manganese ionsPhotometric (GD 52.24.467-2008)0.001 mg/L
Chromium (IV) ionsPhotometric (ST RK ISO 18412-2008)1 μg/L
Synthetic surfactantsExtraction-photometric (GD 52.24.368-2006)6 μg/L
Cu, Ni, Cd, Al, Pb, Co, ZnAtomic absorption method (GD 52.24.377-95)0.1 μg/L
Table 3. Organoleptic, generalized and biogenic elements of the Ishim River (2013–2019).
IndexMPCsw/MPCwYear
2013201420152016201720182019
Temperature, °C-/- *** 0 23.4 9.6 0 22.4 11.2 0 23.2 8.0 0 20.0 8.8 0 23.0 8.8 0 21.2 7.6 0 22.0 8.4
pH value-/(6–9) 7.2 8.1 7.7 7.1 8.5 7.8 7.7 8.4 8.2 7.2 8.6 7.7 8.0 8.9 8.4 8.0 8.9 8.4 7.8 8.7 8.2
Smell, points-/2 0 0 0 0 0 0 0 0 0 0 0 0 0 0 0 0 0 0 0 0 0
Color degree-/20 15 25 22 10 25 18 10 40 24 10 40 23 10 30 20 5 30 16 15 43 29
Transparency, cm-/30 3.0 25.5 21.5 14.5 25.0 20.0 15.5 40.0 24.5 8.5 25.0 23.5 6.0 25.5 22.0 11.0 25.5 23.0 9.5 25.0 22.0
Dissolved oxygen, mg/L4/4 6.28 9.62 7.84 4.48 14.0 9.24 5.02 10.2 8.24 5.28 11.2 8.36 5.32 12.54 8.24 5.66 11.64 8.56 6.28 11.62 9.28
BOD5, mg O₂/dm33/3 0.52 1.52   * 0.92   * * 0.32 3.58 1.96 0.8 2.24 1.42 0.16 2.6 1.48 0.50 3.56 1.44 0.40 2.58 1.30 0.50 1.62 1.02
Permanganate oxidation, mg/L-/5 24.1 60.2 40.2 9.3 27.5 17.9 19.4 36.0 27.1 31.4 67.2 44.1 9.6 96.0 51.0 19.2 124.8 73.6 28.8 76.8 45.5
Mineralization, mg/L-/1000 486 1802 119 561 1765 1220 353 1856 1240 489 1598 1043 320 1635 1142 315 1489 1087 435 1433 1099
Ammonium salts, mg/L0.5/2 0.031 0.302 0.103 0.018 0.547 0.283 0.078 0.478 0.280 0.117 0.371 0 , 245 0.089 0.977 0.366 0.041 0.609 0.288 0.087 1.962 0.213
Nitrate ions, mg/L9.1/45 0.210 1.931 0.930 0.056 0.525 0.291 0.023 0.569 0.203 0.034 0.947 0.347 0.017 0.790 0.283 0.022 0.962 0.257 0.003 0.607 0.213
Nitrite ions, mg/L0.2/3.3 0.000 0.034 0.010 0.001 0.022 0.012 0.001 0.006 0.010 0.001 0.026 0.009 0.002 0.025 0.010 0.001 0.038 0.013 0.002 0.108 0.017
Phosphate ions, mg/L0.2/3.5 0.002 0.458 0.076 0.002 0.090 0.046 0.004 0.148 0.050 0.011 0.049 0.028 0.003 0.080 0.033 0.002 0.062 0.012 0.002 0.019 0.006
* numerator shows ranges of fluctuations of the indicators from minimum to maximum during the year; ** denominator is the average of the indicator values over 12 months; *** not standardized.
Table 4. Seasonal dynamics of the content of organoleptic, generalized and biogenic elements in the water of the Ishim River for 2013–2019.
IndexMPCsw/MPCwMonthly Values
(Minimum–Maximum)
1–34–67–910–12
Temperature, °C-/- *00.4–21.014.2–23.40–10.0
pH value-/(6-9)7.1–8.77.9–8.48.1–8.98.2–8.5
Smell, points-/20000
Color degree-/2010–2010–4315–4010–20
Transparency, cm-/3024.0–25.03.0–25.023.0–24.022.0–25.5
BOD5, mg O₂/dm33/30.79–3.040.92–3.570.32–2.121.21–3.12
Dissolved oxygen, mg/L4/44.47–10.858.06–12.205.49–10.208.44–13.16
Permanganate oxidation, mg/L-/519.4–124.818.5–56.717.9–67.814.5–40.8
Mineralization, mg/L-/10001326–1856315–1623648–1197852–1367
Ammonium salts0.5/20.041–0.3660.078–0.9770.207–0.6730.018–1.962
Nitrate ions9.1/450.105–1.9310.023–0.7430.017–0.2120.003–0.132
Nitrite ions0.2/3.30.000–0.0380.003–0.0220.000–0.0090.001–0.108
Phosphate ions0.2/3.50.002–0.0370.003–0.4580.003–0.1480.003–0.054
* not standardized.
Table 5. Seasonal changes in the total salinity of water in the Ishim River within the Akmola Region between 2013–2018 (mg/L).
YearQuarter of the Year
January–MarchApril–JuneJuly–SeptemberOctober–December
201315004007401033
201413923388371178
201518483534721178
201615524897011134
201716353209001180
201814893159181021
Table 6. Content of main ions, microelements and heavy metals in the Ishim River 2013–2019 (mg/L).
IndexMPCsw
/MPCw (*,**)
Year
2013201420152016201720182019
Ca2+180/- *** 44.7 180.1 85.4 33.6 115.3 74.6 34.7 150.2 82.7 69.1 132.3 99.7 33.4 147.4 92.5 36.4 130.0 86.1 28.4 130.0 86.1
Mg2+40/- 15.2 68.1 33.9 10.7 86.2 48.5 17.8 96.8 41.4 5.5 45.6 29.8 9.4 58.6 38.1 8.8 53.8 47.3 14.8 47.2 48.6
  H C O 3 -/- 123 411 233 146 426 286 144 496 333 26 427 252 147 367 297 126 389 281 216 362 341
Cl300/350 700 408 240 42 330 1865 57 420 266 129 369 266 41 470 269 47 351 251 63 350 226
  S O 4 2 100/500 60 360 180 60 350 200 60 410 250 70 290 190 40 380 220 50 280 220 60 270 200
Na+ + K+170/- 50 321 166 44 331 188 65 298 171 55 310 174 43 380 228 23 313 209 47 307 199
Cu0.001/1.0 0.0032 0.0077 0.0043 0.0007 0.0054 0.0031 0.0023 0.0093 0.0044 0.0008 0.0073 0.0019 0.0006 0.0012 0.0010 0.0001 0.0028 0.0010 0.0004 0.0018 0.0009
Zn0.01/5.0 0.0029 0.0252 0.0178 0.0054 0.0241 0.0157 0.0004 0.0216 0.0146 0.0007 0.0690 0.0204 0.0002 0.0437 0.0096 0.0014 0.0184 0.0066 0.0009 0.0356 0.0112
Mn0.01/0.1 0.012 0.081 0.033 0.028 0.329 0.179 0.63 0.129 0.097 0.065 0.187 0.108 0.043 0.412 0.128 0.017 0.114 0.055 0.046 0.185 0.079
Fe total0.1/0.3 0.040 0.080 0.060 0.010 0.260 0.140 0.014 0.282 0.095 0.040 0.153 0.058 0.030 0.860 0.190 0.030 0.190 0.130 0.050 0.160 0.070
Cd0.01/0.001 0.0001 0.0002 0.0001 0.0000 0.0002 0.0001 0.0001 0.0002 0.0002 0.0001 0.0002 0.0002 0.0000 0.0006 0.0001 0.0000 0.0005 0.0001 0.0000 0.0005 0.0001
Pb0.1/0.03 0.0012 0.0076 0.0025 0.0005 0.0011 0.0008 0.0004 0.0034 0.0010 0.0001 0.0036 0.0020 0.0003 0.0012 0.0006 0.0004 0.0016 0.0010 0.0006 0.0015 0.0010
Ni0.01/0.1 0.0023 0.0082 0.0060 0.0014 0.0102 0.0054 0.0019 0.0086 0.0042 0.0007 0.0041 0.0019 0.0011 0.0089 0.0027 0.0004 0.0057 0.0025 0.0012 0.0035 0.0022
Co0.01/0.1 0.0003 0.0012 0.0007 0.0004 0.0026 0.0023 0.0001 0.0014 0.0008 0.0002 0.0007 0.0005 0.0003 0.0009 0.0005 0.0002 0.0015 0.0009 0.0002 0.0018 0.0010
Al0.5/0.5 0.0388 0.3820 0.2258 0.1714 0.3717 0.2716 0.0339 0.1172 0.0594 0.0080 0.1770 0.0867 0.0253 0.1518 0.0814 0.0037 0.1996 0.0927 0.0479 0.2010 0.1031
* numerator shows ranges of fluctuations of the indicators from minimum to maximum during the year; ** denominator is the average of the indicator values over 12 months; *** not standardized.
Table 7. Seasonal dynamics of the content of main ions, microelements and heavy metals in the water of the Ishim River 2013–2019 (mg/L).
IndexMPCsw/
MPCw
Monthly Values
(Minimum–Maximum)
1–34–67–910–12
Ca2+180/- *42.4–180.133.6–104.028.4–90.734.0–102.0
Mg2+40/-10.7–86.25.5–96.813.8–77.227.2–69.0
H C O 3 -/-304–496123–38026–329123–458
Cl300/350321–47041–374111–27071–408
S O 4 2 100/500251–38041–331106–329164–426
Na++ K+170/-247–38043–193126–331171–306
Cu0.001/1.00.0006–0.00540.0006–0.00930.0001–0.00530.0004–0.0044
Zn0.01/5.00.0004–0.02410.0002–0.04630.0024–0.06900.0007–0.0204
Mn0.01/0.10.033–0.1680.016–0.4120.017–0.1110.012–0.081
Fe total0.1/0.30.021–0.4680.023–0.8600.010–0.1430.028–0.094
Cd0.01/0.0010.0000–0.00120.0000–0.00020.0000–0.00010.0000–0.0006
Pb0.1/0.030.0001–0.00200.0006–0.00760.0003–0.00150.0003–0.0016
Ni0.01/0.10.0004–0.00420.0010–0.00890.0007–0.000860.0013–0.0056
Co0.01/0.10.001–0.00260.0002–0.00150.0003–0.00120.0004–0.0013
Al0.5/0.50.0338–0.29750.0610–0.38200.0073–0.22100.0339–0.2535
* not standardized.
Publisher’s Note: MDPI stays neutral with regard to jurisdictional claims in published maps and institutional affiliations.

