
Impact of Future Land-Use/Cover Change on Streamflow and Sediment Load in the Be River Basin, Vietnam


1
Faculty of Environment, University of Science, Ho Chi Minh City 700000, Vietnam
2
Vietnam National University Ho Chi Minh City, Ho Chi Minh City 700000, Vietnam
3
Institute for Computational Science and Technology, Ho Chi Minh City 700000, Vietnam
*
Author to whom correspondence should be addressed.
Water 2021, 13(9), 1244; https://doi.org/10.3390/w13091244
Submission received: 3 March 2021
/
Revised: 19 April 2021
/
Accepted: 20 April 2021
/
Published: 29 April 2021
(This article belongs to the Special Issue Sediment Transport and River Morphology)
Abstract
:Evaluation of the influence of land-use/cover (LUC) change on water and sediment fluxes from river basins is essential for proposing adaptation and mitigation strategies, but as of yet little information is available, especially in the tropics. For this motivation, the objective of this study was to assess the impact of scenarios of LUC change on streamflow and sediment load in the Be River Basin using the Dynamic Conversion of Land-Use and its Effects (Dyna-CLUE) model and the Soil and Water Assessment Tool (SWAT) model. The Dyna-CLUE and SWAT models were calibrated and validated against observed data in the period of 1980–2010. Three future LUC scenarios in 2030, 2050, and 2070 were generated utilizing the calibrated Dyna-CLUE model based on the historical conversion of forest land to agricultural land and urban area in the study region. Subsequently, the calibrated SWAT model was used to simulate the changes in streamflow and sediment load under these three future LUC scenarios. Results indicated that the annual streamflow and sediment load were estimated to be approximately 287.35 m3/s and 101.23 × 10³ ton/month for the baseline period. Under the influence of future LUC scenarios, the annual streamflow and sediment load would experience increases of 0.19% to 0.45% and 0.22% to 0.68%, respectively. In addition, the 5th and 95th percentile values of streamflow and sediment load are predicted to rise in the context of future LUC change. The results achieved from the present study will support the managers and policy makers proposing appropriate solutions for sustainable water resources management and sediment control in the context of LUC change.
1. Introduction
Rapid population growth, urbanization, and economic development result in increases in water, energy, and food demands, which accelerate pressures on land and water resources across the globe [1]. Recently, many regions around the world have evidently undergone considerable land-use/cover (LUC) changes, especially in developing countries. These LUC changes have significant influences on various hydrological components such as evapotranspiration, soil infiltration, groundwater recharge, surface runoff generation, and sediment generation [2]. As such, LUC is taken into consideration as an important input in many applications related to water resources assessment as well as soil erosion and degradation assessment [3]. In the context of LUC change, understanding and evaluating the responses of hydrology and sediment yield are indispensable for sustainable management of land and water resources of a river basin. Effective management and conservation of water and soils under changing LUC scenarios can be attainable through reliable estimations of runoff and sediment generation in a river basin.
A number of studies have been carried out to make estimations of the influence of LUC change on streamflow and nutrient yields in many regions of the world [4,5,6]. For instance, Marhaento et al. implemented an investigation to evaluate the influence of past LUC change on river discharge in a tropical basin in Indonesia using the Soil and Water Assessment Tool (SWAT) and revealed that a 16.9 to 48.7% reduction in forest land and a 39.2 to 45.4% rise in agricultural land were the cause of a 35.7 to 44.6% increase in runoff in the past period of 1994–2013 [7]. Wang et al. implemented an evaluation of the influence of future LUC change on phosphorus loadings utilizing a combination of the SWAT model and the Dynamic Conversion of Land-Use and its Effects (Dyna-CLUE) model and reported that the transformation of agriculture land and dryland into forest land would result in reductions in phosphorus loadings in the Xiangxi River Basin in China [8]. In another investigation, Gong et al. applied the SWAT model and the Cellular Automata (CA) LUC model to estimate the effects of past and future LUC change on nutrient loadings in the Dongliao River Basin in China and indicated that reductions in nutrient loadings are predicted to occur in the year 2025 under an expansion of paddy field and a contraction of forest land [9]. Overall, these studies indicated that the LUC change will have a pronounced influence on hydrology and nutrient yields. Thus, it is requisite to conduct research into responses of streamflow and nutrient yield to changing LUC for sustainable water resources management.
The widespread approach of evaluating the influence of LUC change on streamflow and nutrient yields is hydrological modeling. As a broadly used hydrological model, SWAT is sufficiently good for simulating the streamflow and nutrient yield under the influence of environmental changes, including climate and LUC change at a basin scale, especially in the Southeast Asia region [10]. Concerning the LUC scenarios, they are normally collected from global LUC database or they are produced based on satellite images using remote sensing techniques. However, these data are only available for the past and recent time periods. In order to generate the future LUC scenarios, LUC change models such as the Dyna-CLUE model are preferable because they can create practical projections of LUC change based on geographical and socio-economic driving forces of LUC types [11]. The Dyna-CLUE model is extensively applied to develop future LUC change scenarios in many regions [8,12,13].
In recent years, studies on the influence of LUC change on streamflow and sediment yield have acquired plenty of attentions in Vietnam [14,15,16,17,18]. For instance, Quyen et al. applied the SWAT model to simulate the impact of LUC change on streamflow in the Central Highland of Vietnam in the period of 2000–2010 and showed that changes in streamflow were insignificant in the study period [14]. Ngo et al. assessed the influence of LUC change on streamflow and sediment load in the Da River Basin in Northwest Vietnam in the period of 1995–2010 using the SWAT model. Their results presented that increases in streamflow and sediment yield were observed in the period 1995–2005 due to conversions of forest land to crop land and urban area and reductions in streamflow and sediment load were observed during the period 2005–2010 due to reforestation [18]. Recently, Ngo and Nguyen conducted a similar study in the Nam Rom River Basin and reported that the reforestation reduced sediment yield during the period 1992–2015 [19]. In general, these studies have mainly focused on the influence of past LUC change and very few studies have conducted an inquiry into how future LUC change will affect streamflow and sediment load, which is essential for a robust understanding of the potential influences of LUC change on land and water resources in the region.
The aim of the present study is to examine the annual and seasonal responses of streamflow and sediment load to changing LUC scenarios in the years 2030, 2050, and 2070 in the Be River Basin (BRB) in Vietnam. Additionally, the responses of the streamflow and sediment extremes are considered in the present study. This study is expected to provide information to managers and policy makers for sustainable management of water and soils.
2. The Case Study
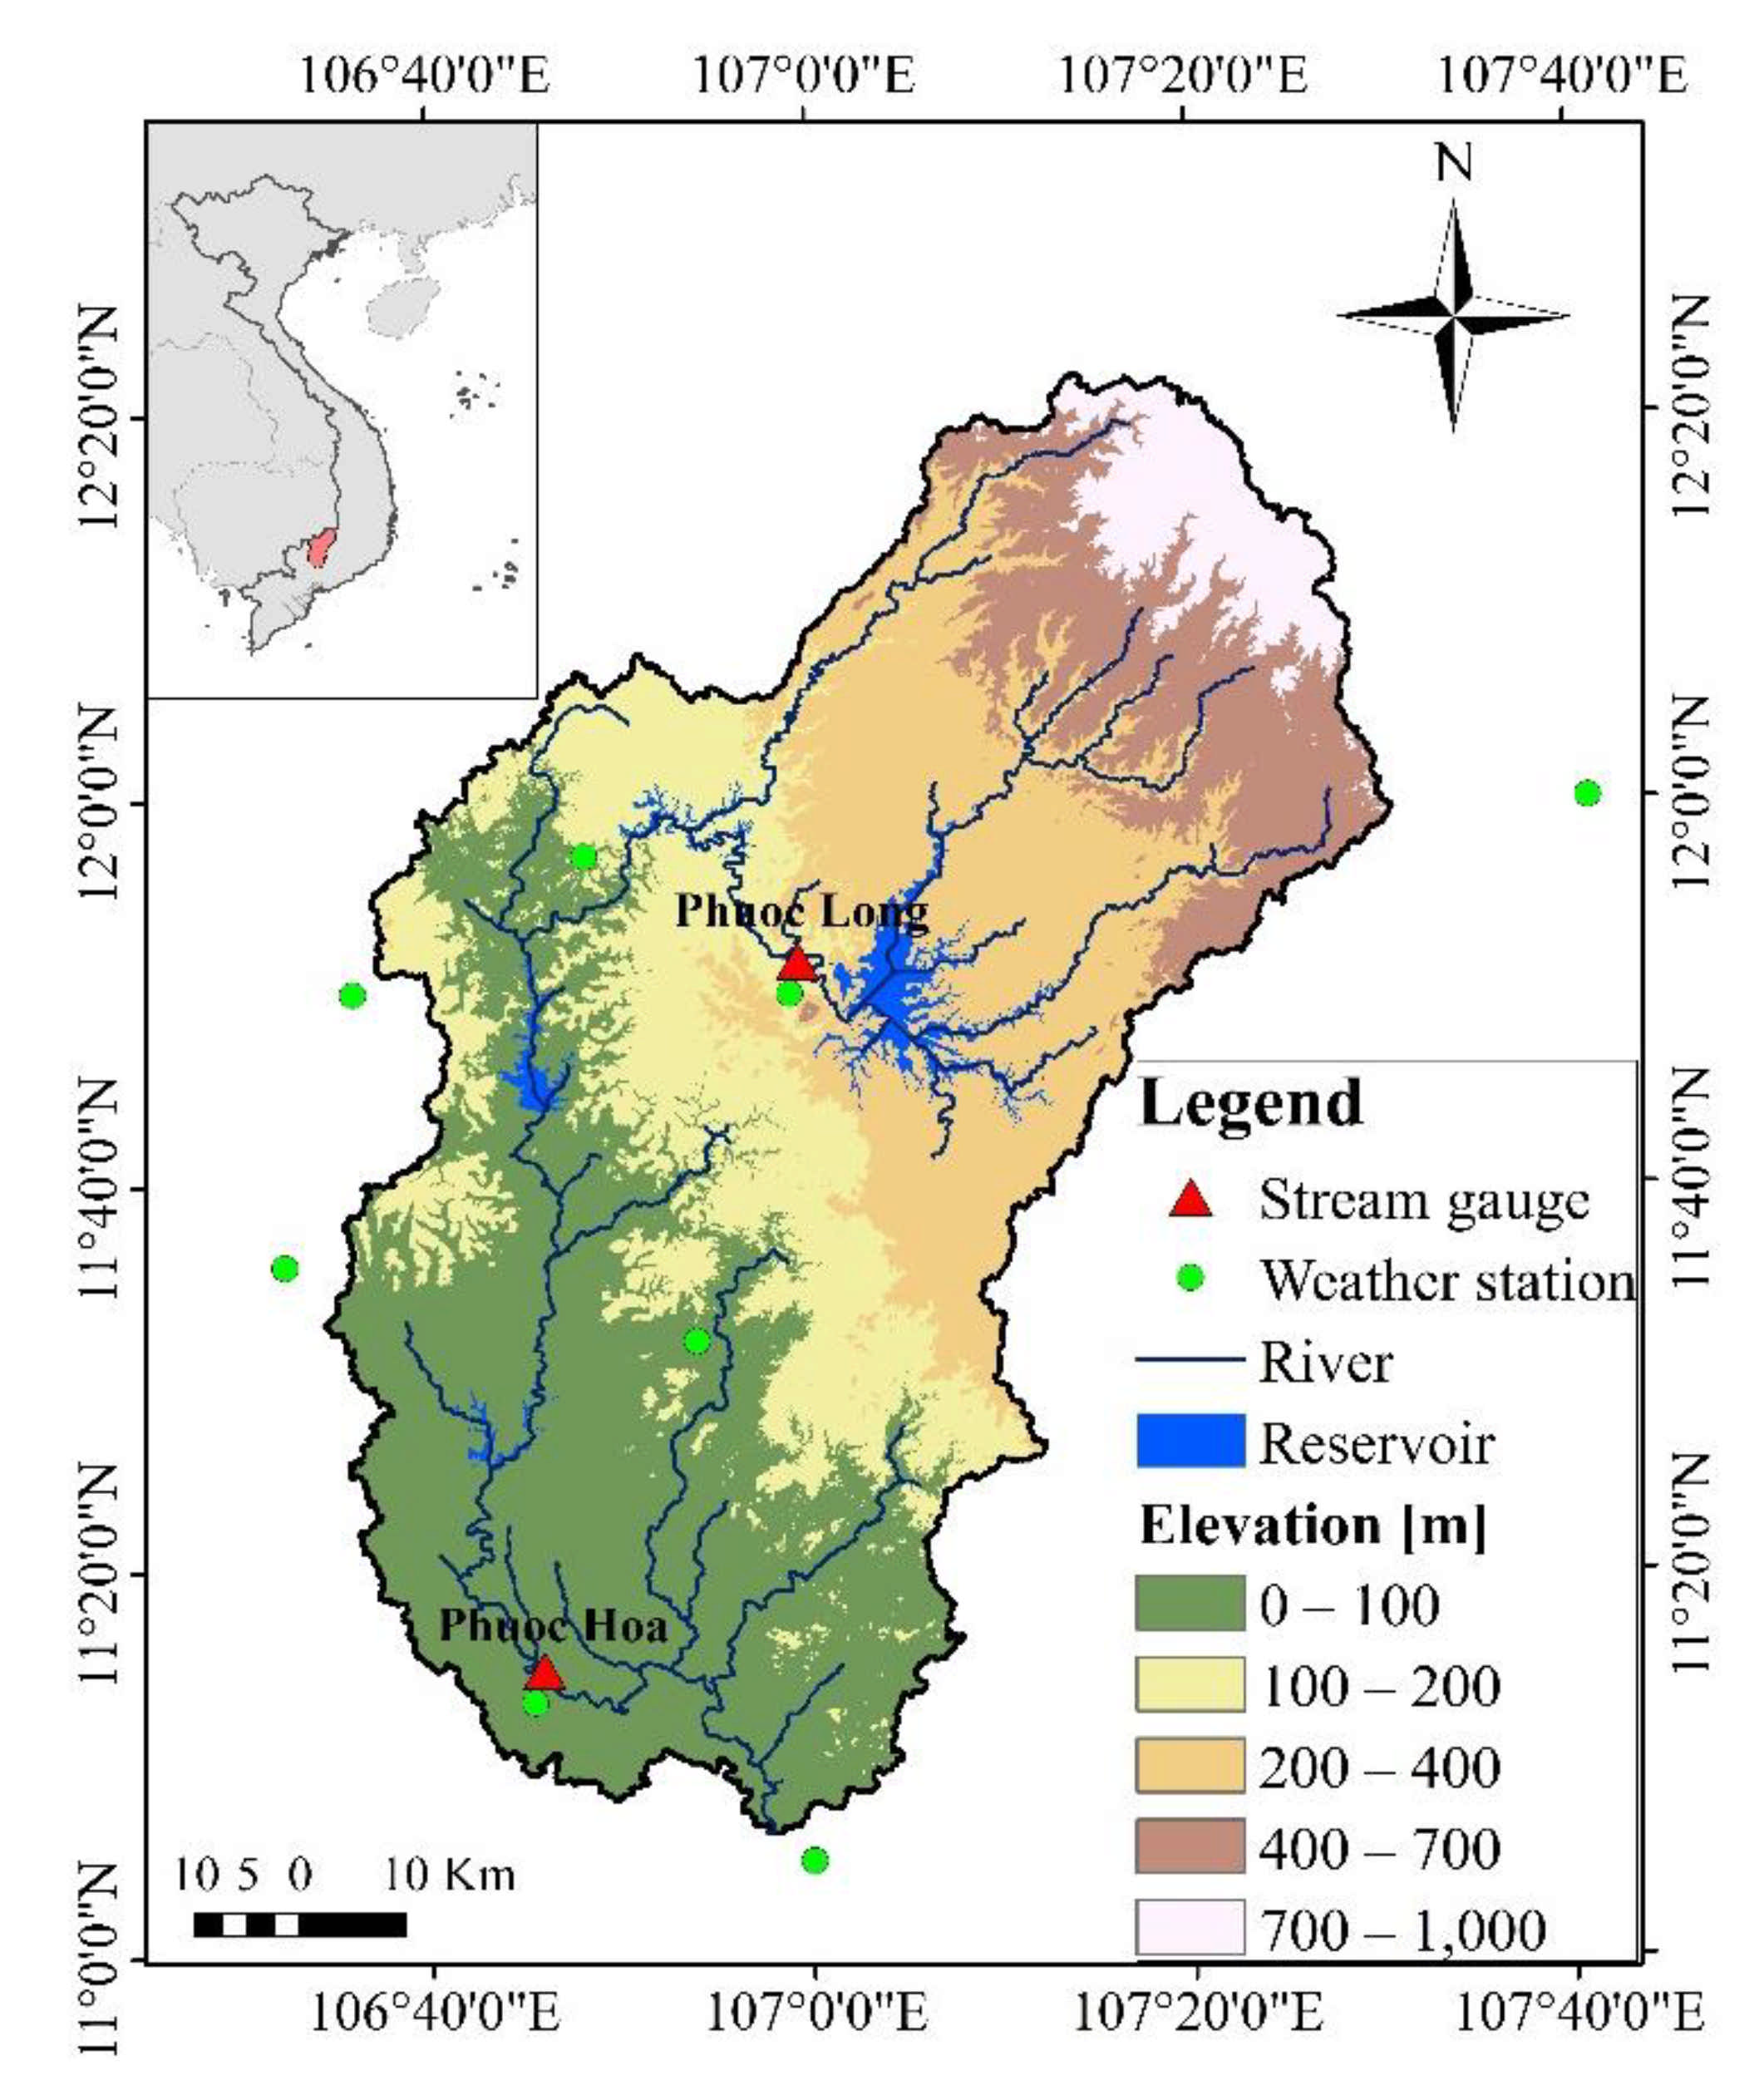
The Be River Basin (BRB), a leaf-shaped basin, lies in the middle of longitudes 106°35′–107°30′ E and latitudes 11°05′–12°25′ N (Figure 1). The Be River flows nearly 330 km with a total drainage area of approximately 7840 km2. The topography of the basin is distinguished by highland region with slope lands in the northeast and flat lands to the south. The surface elevation varies from 10 m to 1000 m above the mean sea level. This basin has an overall tropical climate with mean annual rainfall ranging from 1585 to 3050 mm in the period of 1980–2017. The climate is characterized by a dry season from November to April and a wet season from May to October (accounting for about 85% of the total annual rainfall). The temperature in the region is quite high with a mean annual temperature varying from 25.6 °C to 27.3 °C. Above 70% of the basin area is covered by Rhodic Ferralsols (basaltic soil). The main LUC types are forest land and agricultural land.
3. Data and Methods
3.1. Land Use/Cover Change Modeling Using the Dyna-CLUE Model
3.1.1. The Dyna-CLUE Model–a
The Dynamic Conversion of Land-Use and its Effects (Dyna-CLUE) model was established by the Institute for Environmental Studies in Vrije University of Amsterdam (Netherland), to predict the spatial patterns of LUC change under various scenarios of socio-economic development and population growth. The Dyna-CLUE model is composed of two separate modules, namely a demand module and a spatial allocation module. The first module estimates the area demands for all LUC classes based on historical trends of LUC types or LUC planning scenarios. Meanwhile, the second module translates the spatial LUC demands within the study region [20]. Full details on the theoretical approach of the Dyna-CLUE model could be referred in Verburg et al. [21] and Verburg and Overmars [20].
3.1.2. Dyna-CLUE Model Set-Up
In the present study, the data used for the Dyna-CLUE modelling consisted of topographical data, LUC data, soil data, meteorological data, basic geographical data, and related socio-economic data. The LUC data in 2005, 2010, and 2015 with a spatial resolution of 300 m were collected from the European Space Agency (ESA). The LUC data were categorized into five types: forest land, agriculture, urban, grassland, and water. The topographical data were gathered from Shuttle Radar Topography Mission (SRTM) with a spatial resolution of 30 m, and elevation and slope information were estimated from the topographical data. The soil data with a spatial resolution of 10 km were acquired from the Food and Agriculture Organization (FAO) of the United Nations. Additionally, the rainfall data in the period 1980–2017 were collected from the Hydro-Meteorological Centre of Southern Vietnam and the future rainfall data in the future period of 2020–2080 were collected from Thang et al. [22]. The basic geographical data, including administrative centers at the city and district levels, roads, national parks, river networks, were achieved from Department of Natural Resources and Environment of provinces located in the study area. Population data were obtained from Vietnam Statistical Yearbooks at provincial and district levels in the period of 2005–2015 collected from General Statistics Office of Vietnam.
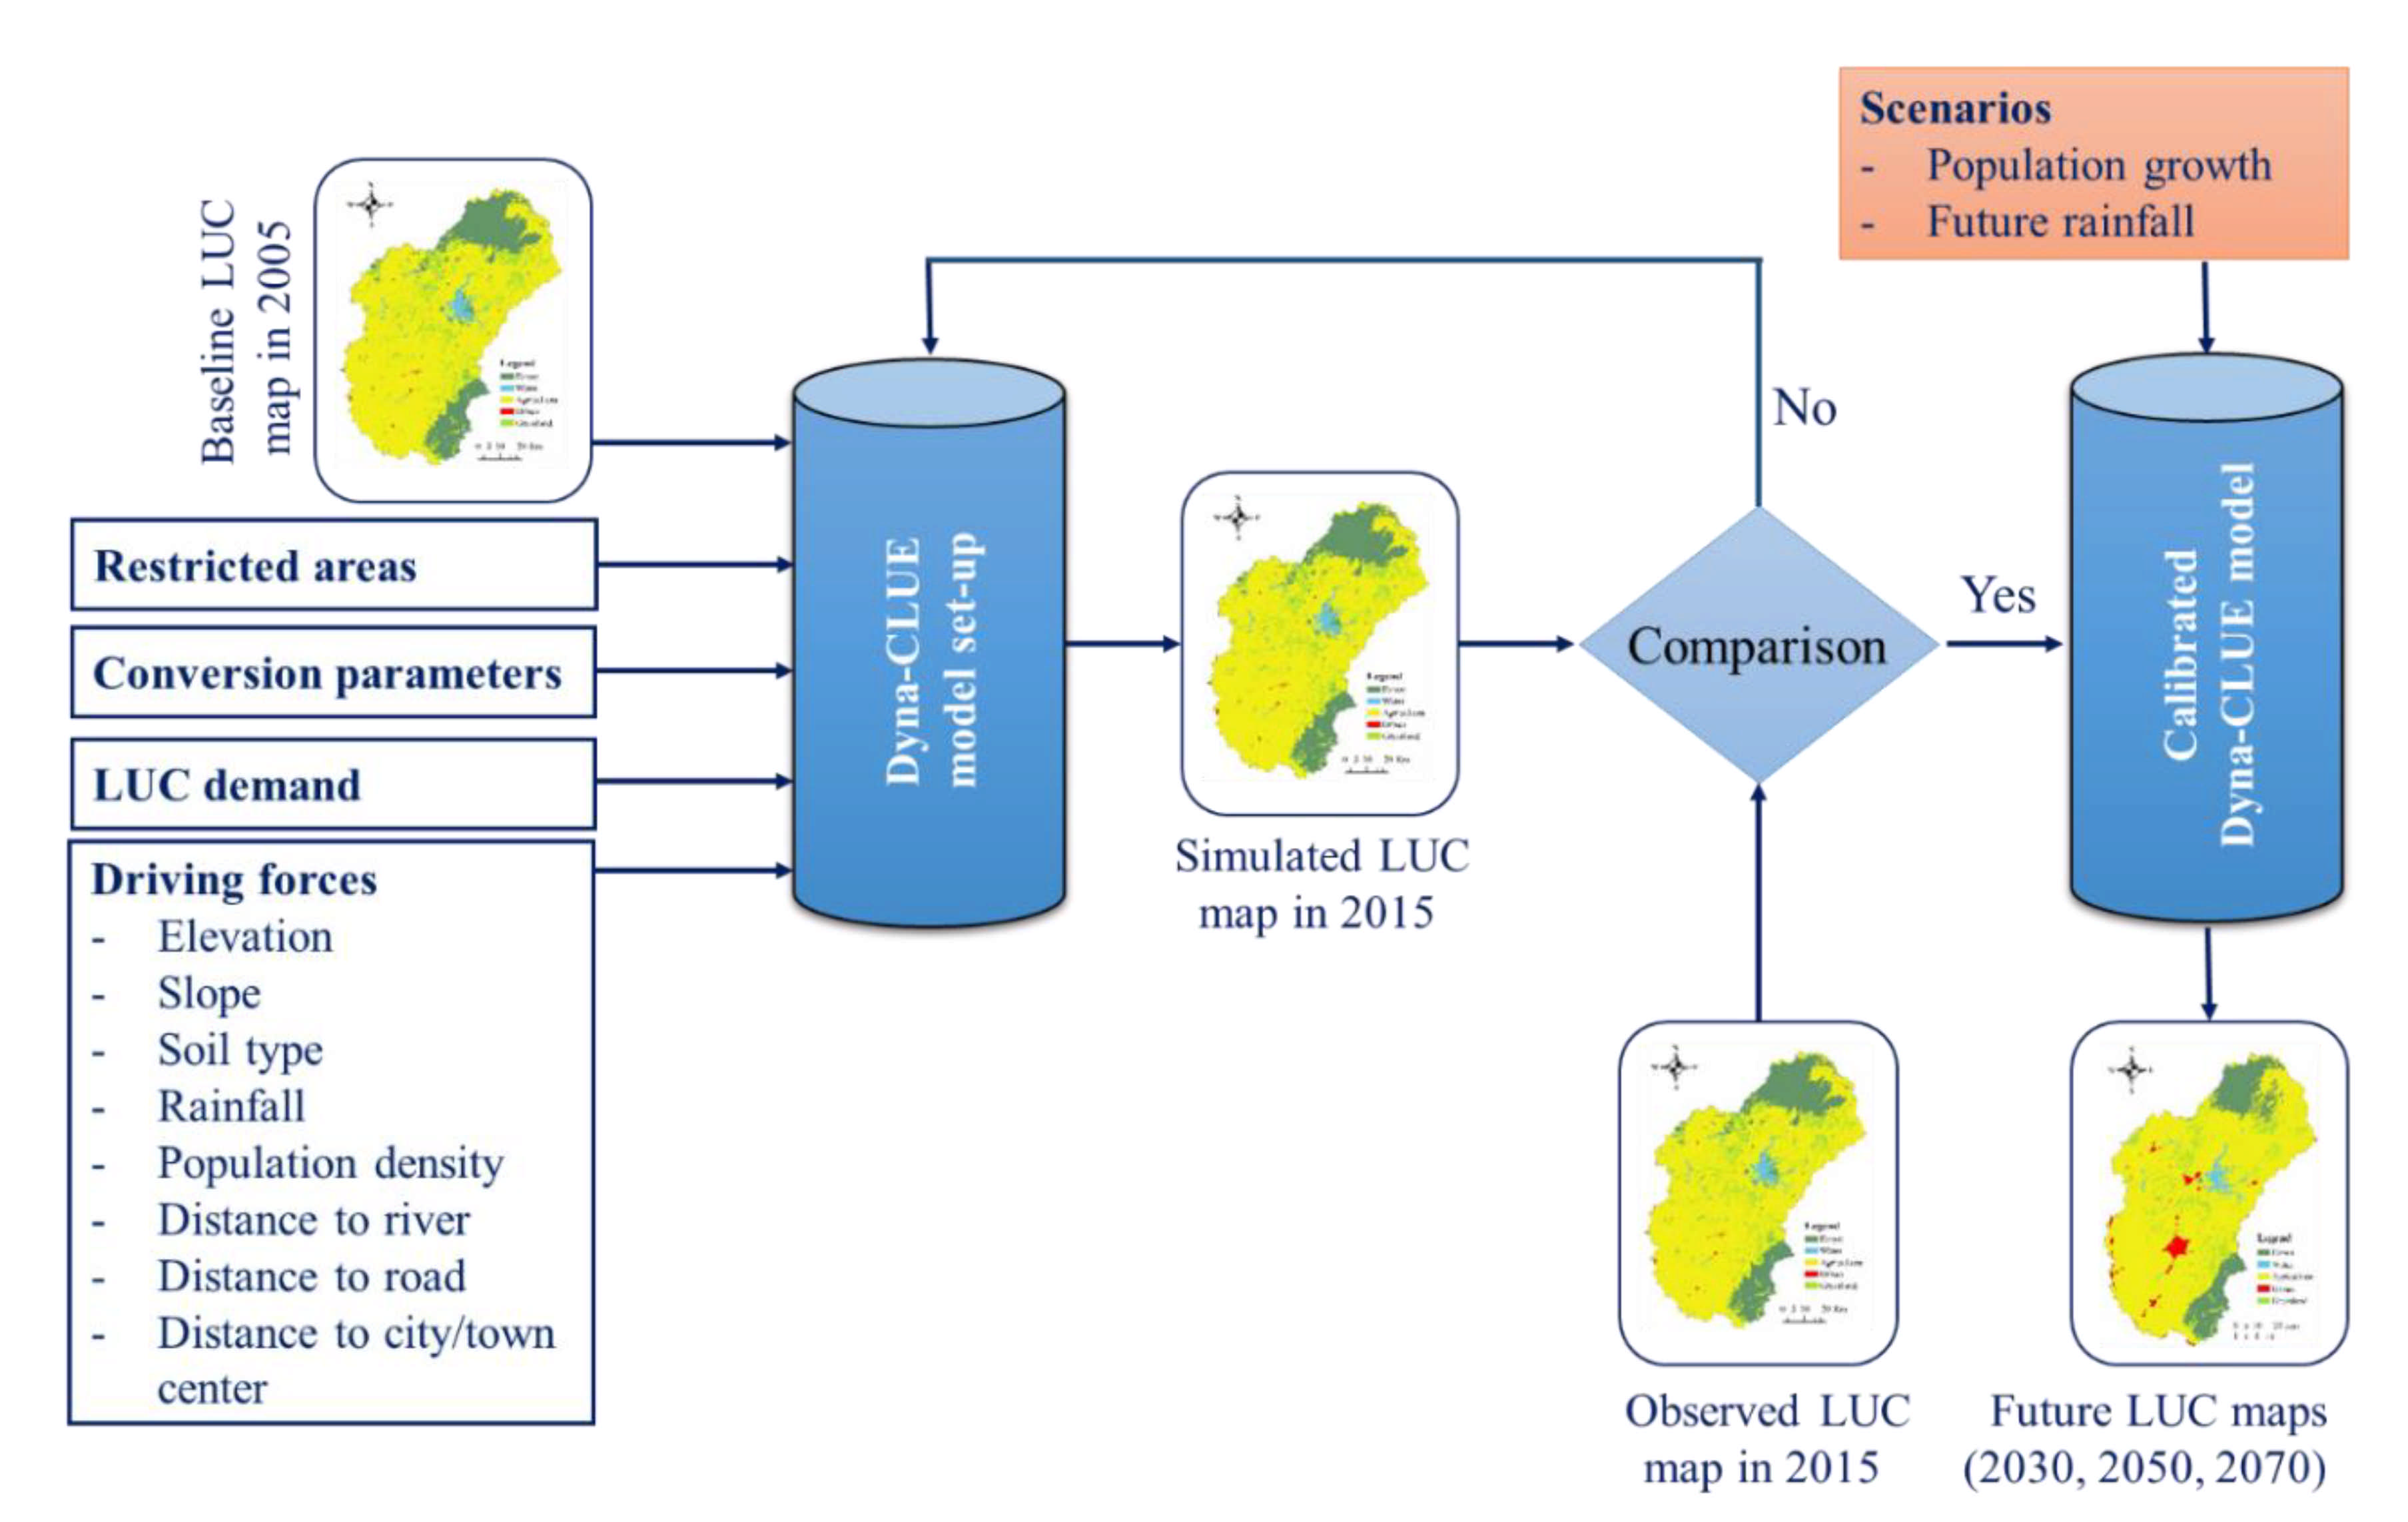
The Dyna-CLUE model setup demands the following four inputs: (1) restricted areas, (2) conversion parameters between LUC types, (3) LUC demands, and (4) location suitability. In the BRB, the restricted regions include Bu Gia Map National Park, Ba Ra Nature Reserve, and a small part of Nam Cat Tien National Park, which accounts for approximately 10.6% of the study region. These restricted regions were not permitted to be changed to other LUC types in this study. The conversion parameters, including the conversion flexibility and conversion matrix, determine the regulations of conversion between LUC types. The conversion flexibility of a LUC type presents the possibility of a specific LUC type converting to other LUC types. The values of the conversion elasticity vary from 0 (no possibility of conversion) to 1 (highest possibility of conversion) [21]. The values of conversion parameters of 0.6, 0.4, 0.95, 0.4, and 0.9 were assigned to forest land, agricultural land, urban, grassland, and water, respectively, by using the trial and error method [13]. The conversion matrix comprises two values, namely 0 (no conversion) and 1 (possible conversion). The values of the conversion matrix for the BRB are presented in Table 1.
In the present study, the LUC demands were estimated using a simple extrapolation technique based on annual historical changes in area of each LUC type. Regarding the location suitability, the demands were calculated by logistic regression models derived from the spatial relationship of each LUC type with a set of driving forces of LUC change. The driving forces used in the present study comprised of physical, natural, and socioeconomic factors, including elevation, slope, soil type, rainfall, population density, and distances to road, river, and town or city center (Table 2). These driving forces were selected based on literature review of the similar studies [8,12,13] and data availability. The fitting of the regression model was evaluated using relative (or receiver) operating characteristic (ROC). The ROC value varies from 0.5 to 1, with a ROC value above 0.7 indicating a good explanatory of the selected driving forces for the specific LUC type [23].
The scheme of LUC modelling for the study region is illustrated in Figure 2. The LUC data in 2005 were used as the referenced period and the LUC data in 2015 were used for Dyna-CLUE calibration. Kappa coefficient (K) is standardly applied in reliability assessment of LUC simulations. According to Gong et al. (2019), a K value above 0.81 indicates a reliable result of simulated LUC data. In the present study, future LUC maps in 2030, 2050, and 2070 of the BRB were generated based on the historical trends of LUC types in the period of 2005–2015 in combination with the future population growth and rainfall.
3.2. Hydrological Modelling Using the Soil and Water Assessment Tool (SWAT) Model
The SWAT model is a physically semi-distributed model used to project the long-term influence of management practices on streamflow and sediment yield in agricultural basins [24,25,26]. In the SWAT model, the hydrological processes are simulated by the water balance equation of soil water. Additionally, the sediment yield is simulated by the Modified Universal Soil Loss Equation. Full details of the SWAT theoretical description can be referred in Neitsch et al. [26].
Regarding the SWAT hydrological modelling (Figure 3), the input data comprise of topography, LUC, soil, and meteorological data. The sources of these data were mentioned in the Section 3.1.2. Additionally, the streamflow and sediment data (1980–2010) at the two stream gauges (Phuoc Long and Phuoc Hoa) (Figure 1) were gathered from the Hydro-Meteorological Centre of Southern Vietnam. The SWAT model for the BRB was calibrated and validated using daily streamflow data in the period of 1980–1993 for the Phuoc Long station and 1980–2010 for the Phuoc Hoa station. The first 10-year observed streamflow data were applied for the model calibration and the remaining data were applied for the model validation. After calibration and validation for the streamflow simulation, the SWAT model was further calibrated and validated for daily sediment load data at the Phuoc Hoa station during 1999–2010. The model calibration and validation were executed using the Sequential Uncertainty Fitting (SUFI-2) algorithm incorporated in the SWAT Calibration and Uncertainty Program (SWAT-CUP) [27].
The performance of the SWAT model was evaluated using two statistical indicators introduced by Moriasi et al. [28], including Nash-Sutcliffe efficiency (ENS) and percent bias (PBIAS). The ENS value varies from −∞ to 1, with the value close to 1 indicating a good conformity between observed and simulated values. Regarding the PBIAS, the positive value represents underestimation and the negative value represents overestimation of simulated values in comparison with observed values.
4. Results and Discussion
4.1. Historical LUC Change
The LUC map categorizes the study region into five LUC types, including forest land, agricultural land, urban, grassland, and water. The LUC map in 2005 was selected as the reference map. Table 3 represents the total area of each LUC type in the years of 2005, 2010, and 2015. It demonstrates the enlargement of agricultural and urban areas and the reduction in forest area in the period of 2005–2015. In the year 2005, the forest land, agricultural land, and urban area covered 1591 km2, 5392 km2, and 3 km2, respectively. In the year 2010, the agricultural land and urban area expanded at the rates of 3% and 88% and forest land reduced at the rate of 11% in comparison to those in 2005. In the year 2015, the agricultural land and urban area rose at the rates of 4% and 460% and the forest land reduced at the rate of 13%, in comparison with those in 2005. These changes in LUC types are associated with population growth, which caused the enlargement of settlement and agriculture areas that resulted in uncontrolled forest exploitation. The population of the basin was 1.88 million inhabitants in the year 2015 and 1.66 million inhabitants in the year 2010, which represents an increase of approximately 13%. Other reasons for the LUC changes can be attributed to ineffectiveness and overlapping responsibilities in forest management practices [29]. In the present study, the trend of LUC change in the period of 2005–2010 was applied for the simulation of LUC map in 2015 supporting to calibration of the Dyna-CLUE model and the LUC trend from 2005 to 2015 was applied for the simulation of future LUC map in 2030, 2050, and 2070.
4.2. Projected LUC Change
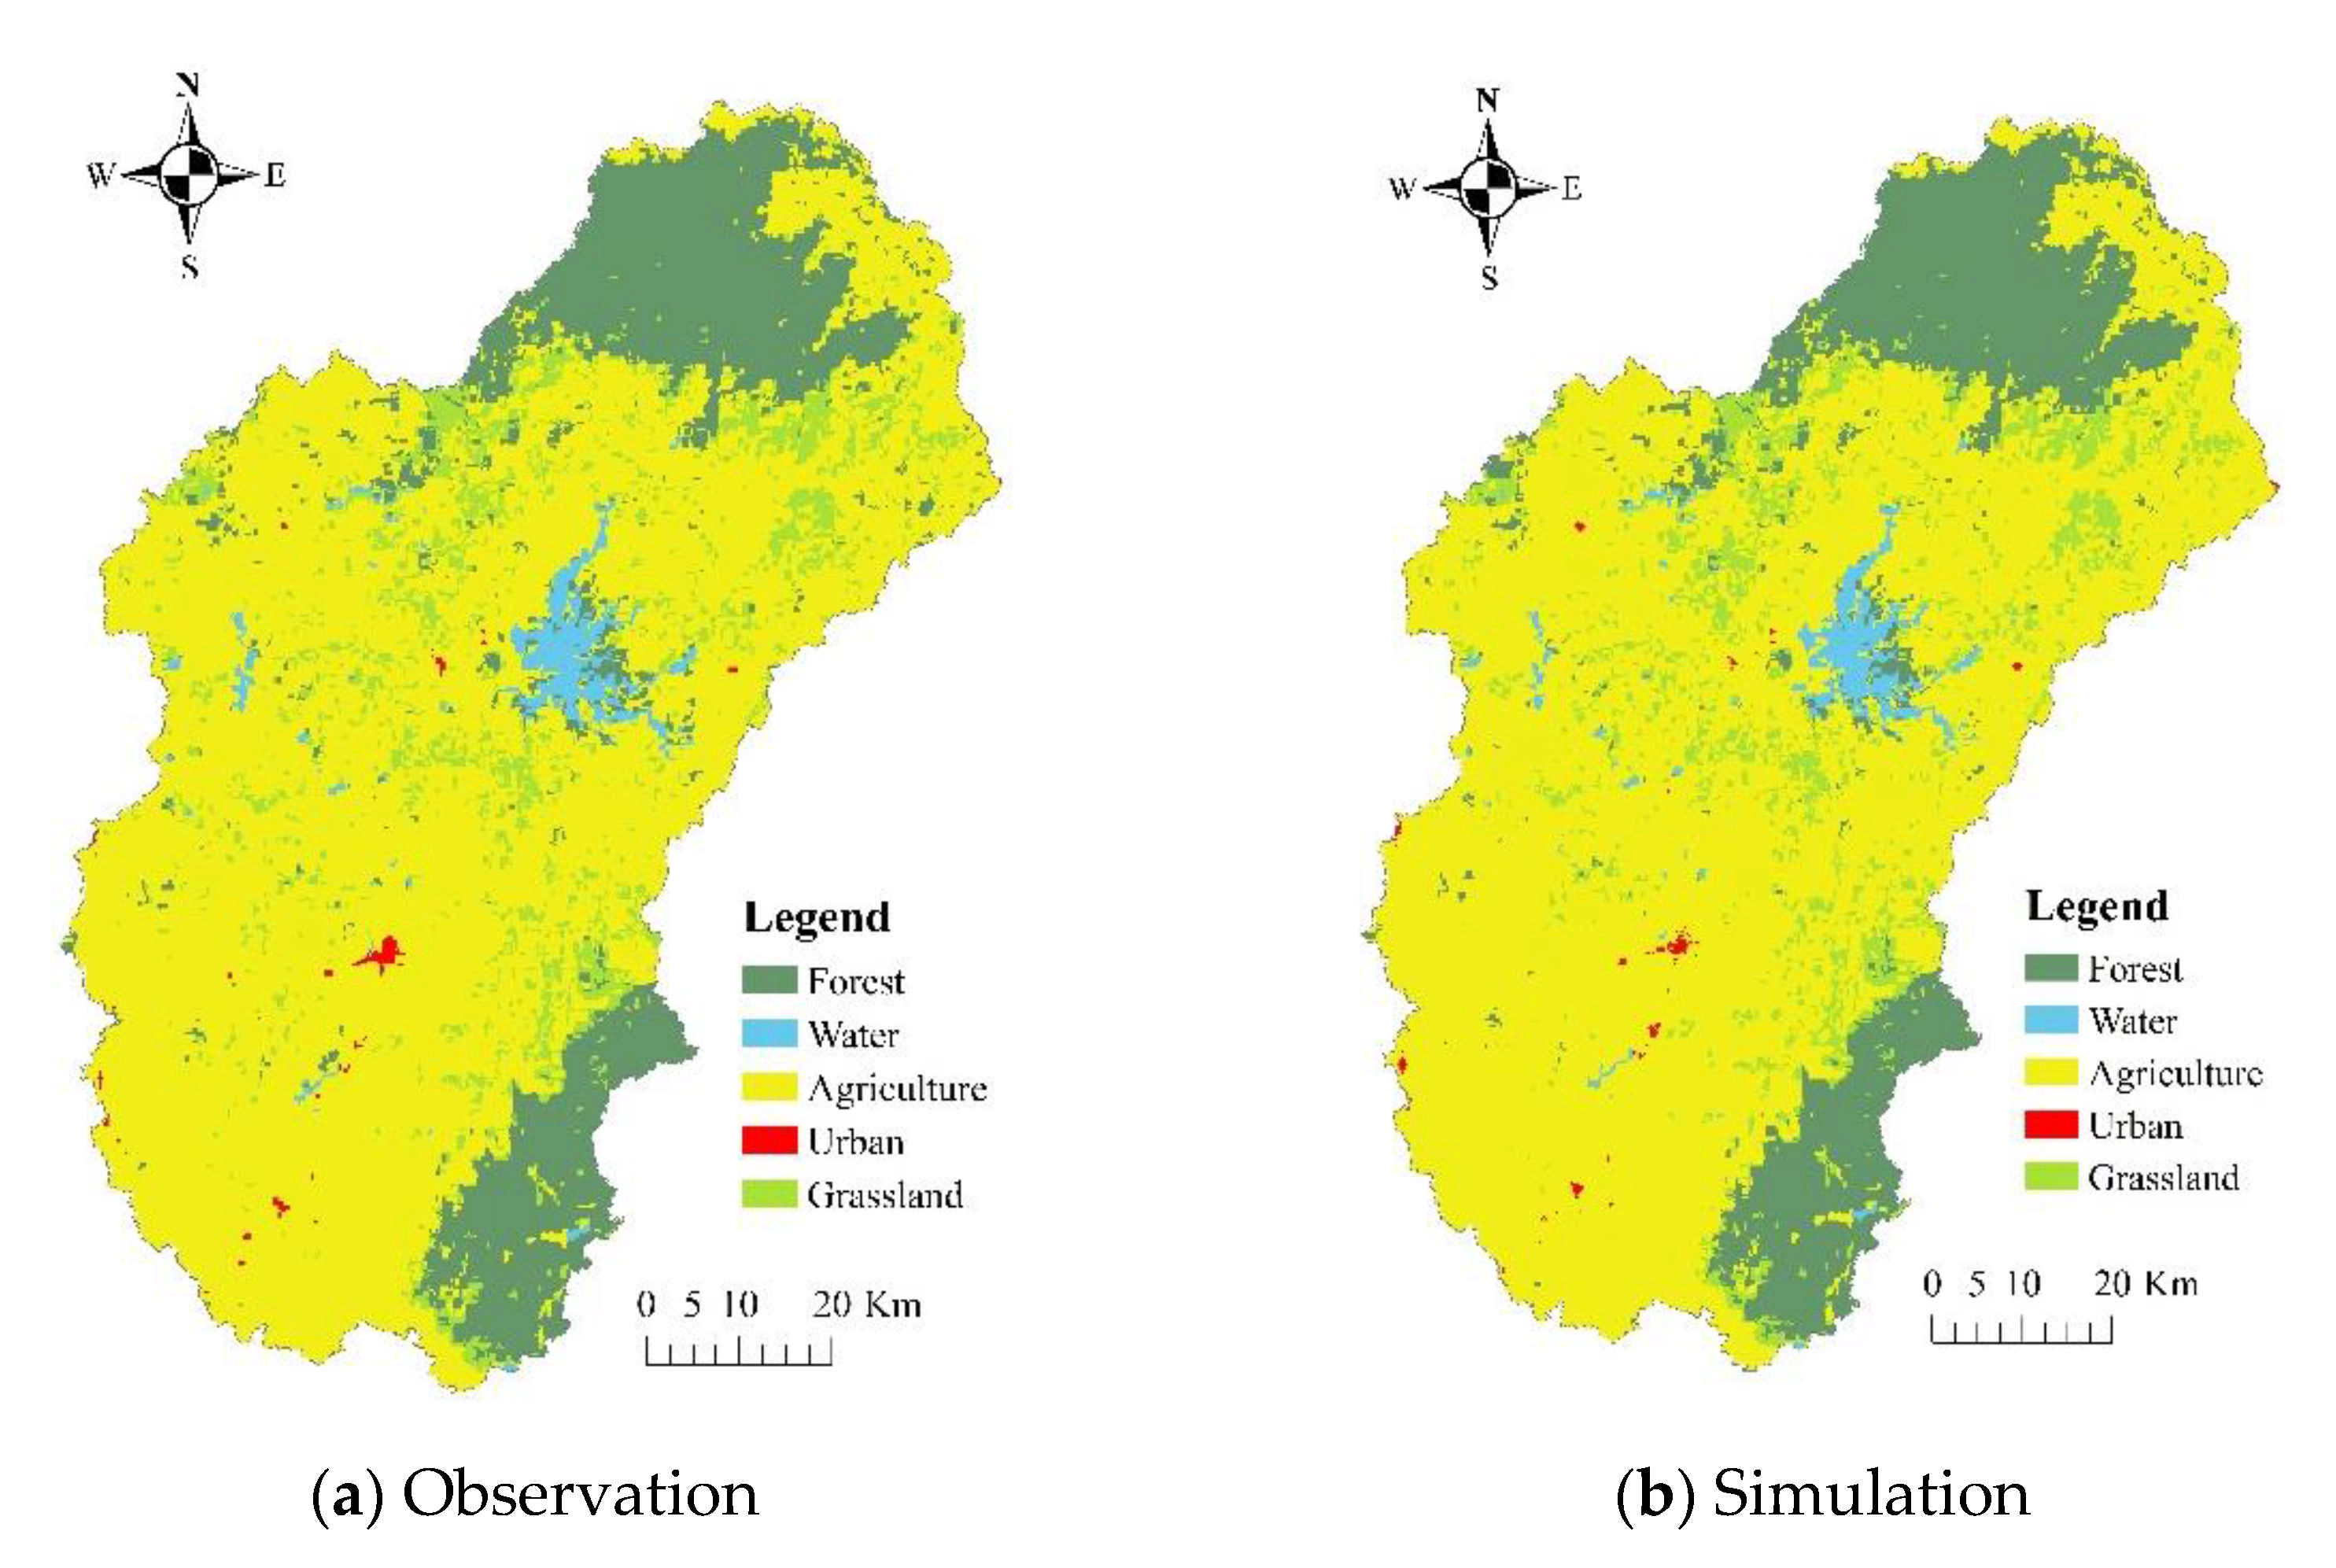
As illustrated in Figure 4, the simulated LUC map was visually compared against the observed LUC map in the year 2015. It shows a good agreement between the observed and simulated LUC maps. The agreement was also confirmed by a Kappa value of 0.82. Therefore, the calibrated Dyna-CLUE model is acceptable for simulations of future LUC changes in the BRB.
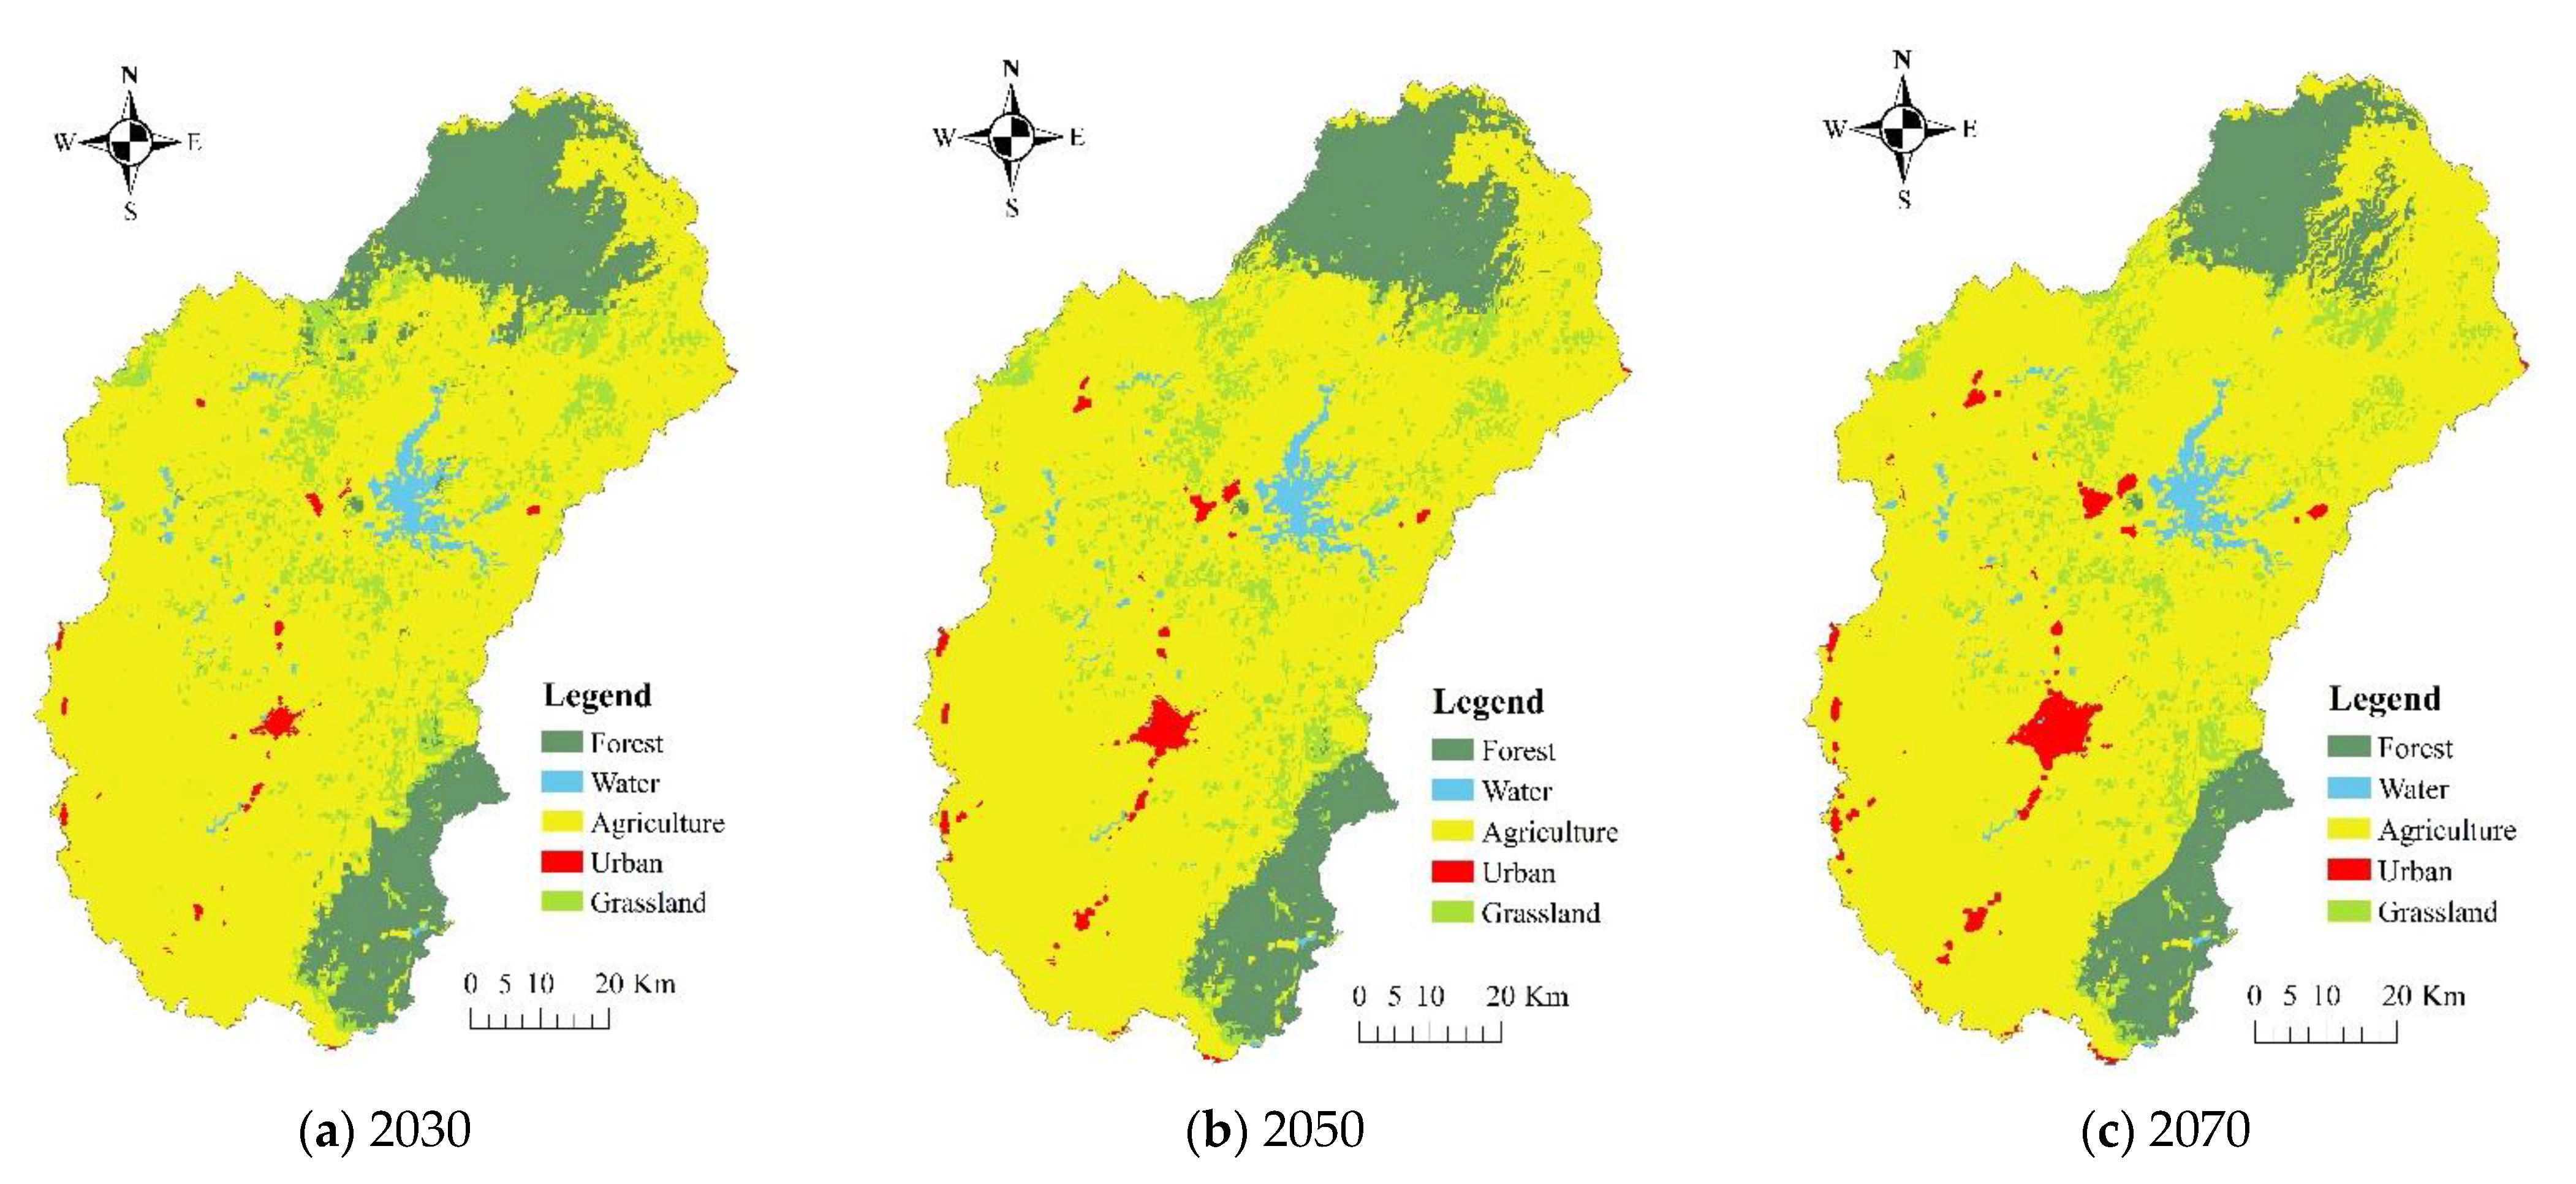
The historical trend of LUC changes is supposed to be kept the same for the future. Additionally, the population growth and change in annual rainfall in the future period of 2020–2070 were regarded as the driving forces on LUC change. The future LUC projections for the years of 2030, 2050, and 2070 are illustrated in Figure 5. For the whole basin, the agricultural land and water surface will experience increases of 5.4 to 11.4% and 4.8 to 12.0%, whereas the forest land and grassland will be faced with decreases of 18.9 to 37.5% and 6.4 to 26.2, respectively, in comparison to those in 2005. Regarding the urban area, it is envisaged to increase by 46 km2 in 2030, 89 km2 in 2050, and 155 km2 in 2070 when compared to that in 2005. On the whole, the future LUC changes of the BRB are expansion of agricultural land, urban area, and water surface, and contraction of forest land and grassland. The decrease in forest land and increase in agricultural land are predicted to mainly occur in the highland northeast part of the study region, while the urban expansion is projected to happen in the flat south part of the study region.
4.3. Performance Evaluation of the SWAT Model
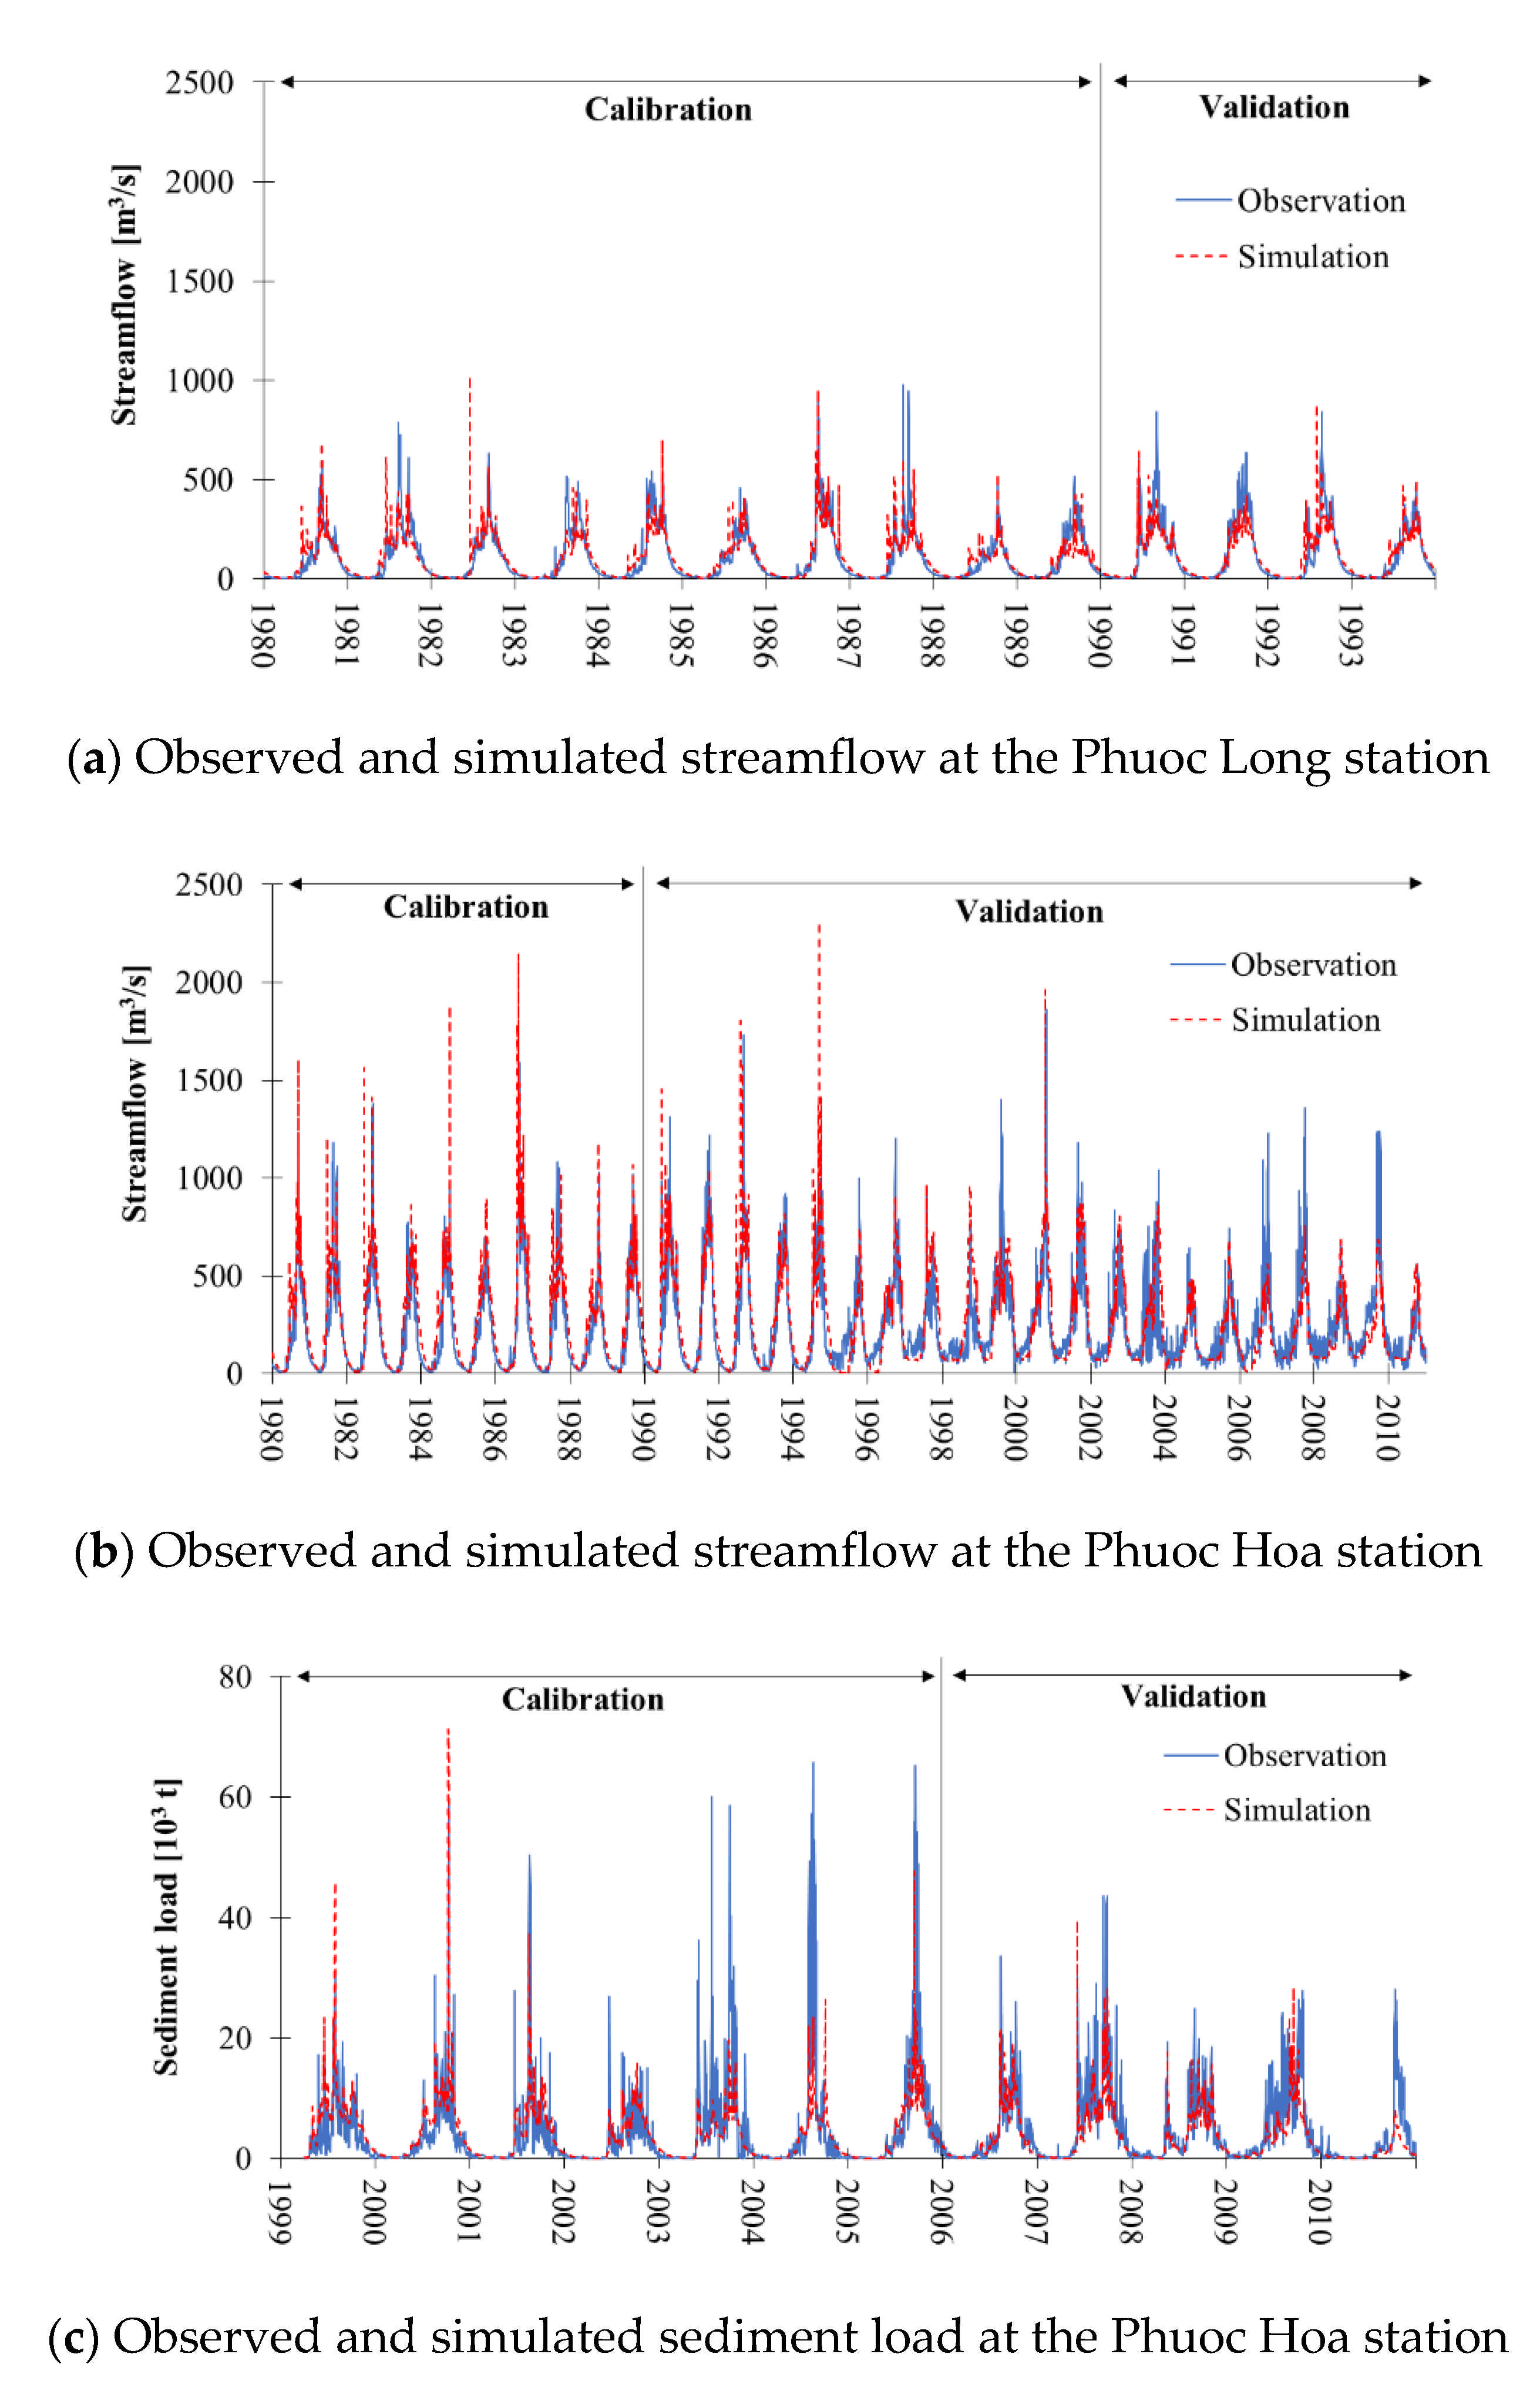
The capability of the SWAT model in reproducing hydrological processes of the BRB was assessed by comparing the observed and simulated streamflow and sediment load at two hydrological stations, namely Phuoc Long and Phuoc Hoa in the period of 1980–2010. Because of the temporal inconsistency of observed data, the calibration and validation time periods were different for the simulations of streamflow and sediment load. The comparison graphs of daily observed and simulated streamflow and sediment load during the calibration and validation time periods are illustrated in Figure 6. The figure shows that the variability and timing of streamflow and sediment load were quite compatible with observed values at the two hydrological stations, except for some cases of the some peaks of streamflow and sediment load. This could be associated with spatially heterogeneous distribution of rainfall data, uncounted presence of some dams in the study area, and simplified assumptions of the SWAT model.
The model performance statistics of streamflow and sediment load values over the calibration and validation steps are presented in Table 4. Regarding the daily streamflow simulation, the ENS and PBIAS values ranged from 0.60 to 0.78 and −24 to 6% for the calibration step; and 0.71 to 0.95 and −24 to 6% for the validation step. In cases of the daily sediment simulation, the ENS and PBIAS values were within the range of 0.47 to 0.51 and 4 to 28% for the calibration step; and 0.60 to 0.73 and 4 to 28% for the validation step. In general terms, the ENS and PBIAS values as shown in Table 4 are implied to a reasonable conformity of the simulated streamflow and sediment load to their observed values according to the criteria of model performance suggested by Moriasi et al. [28]. Based on the results of the graphical comparisons and performance statistics, the calibrated SWAT model could be applied to explore the influence of LUC change scenarios on streamflow and sediment load in the BRB.
4.4. Projected Resposes of Streamflow and Sediment Load to Changing LUC Scenarios
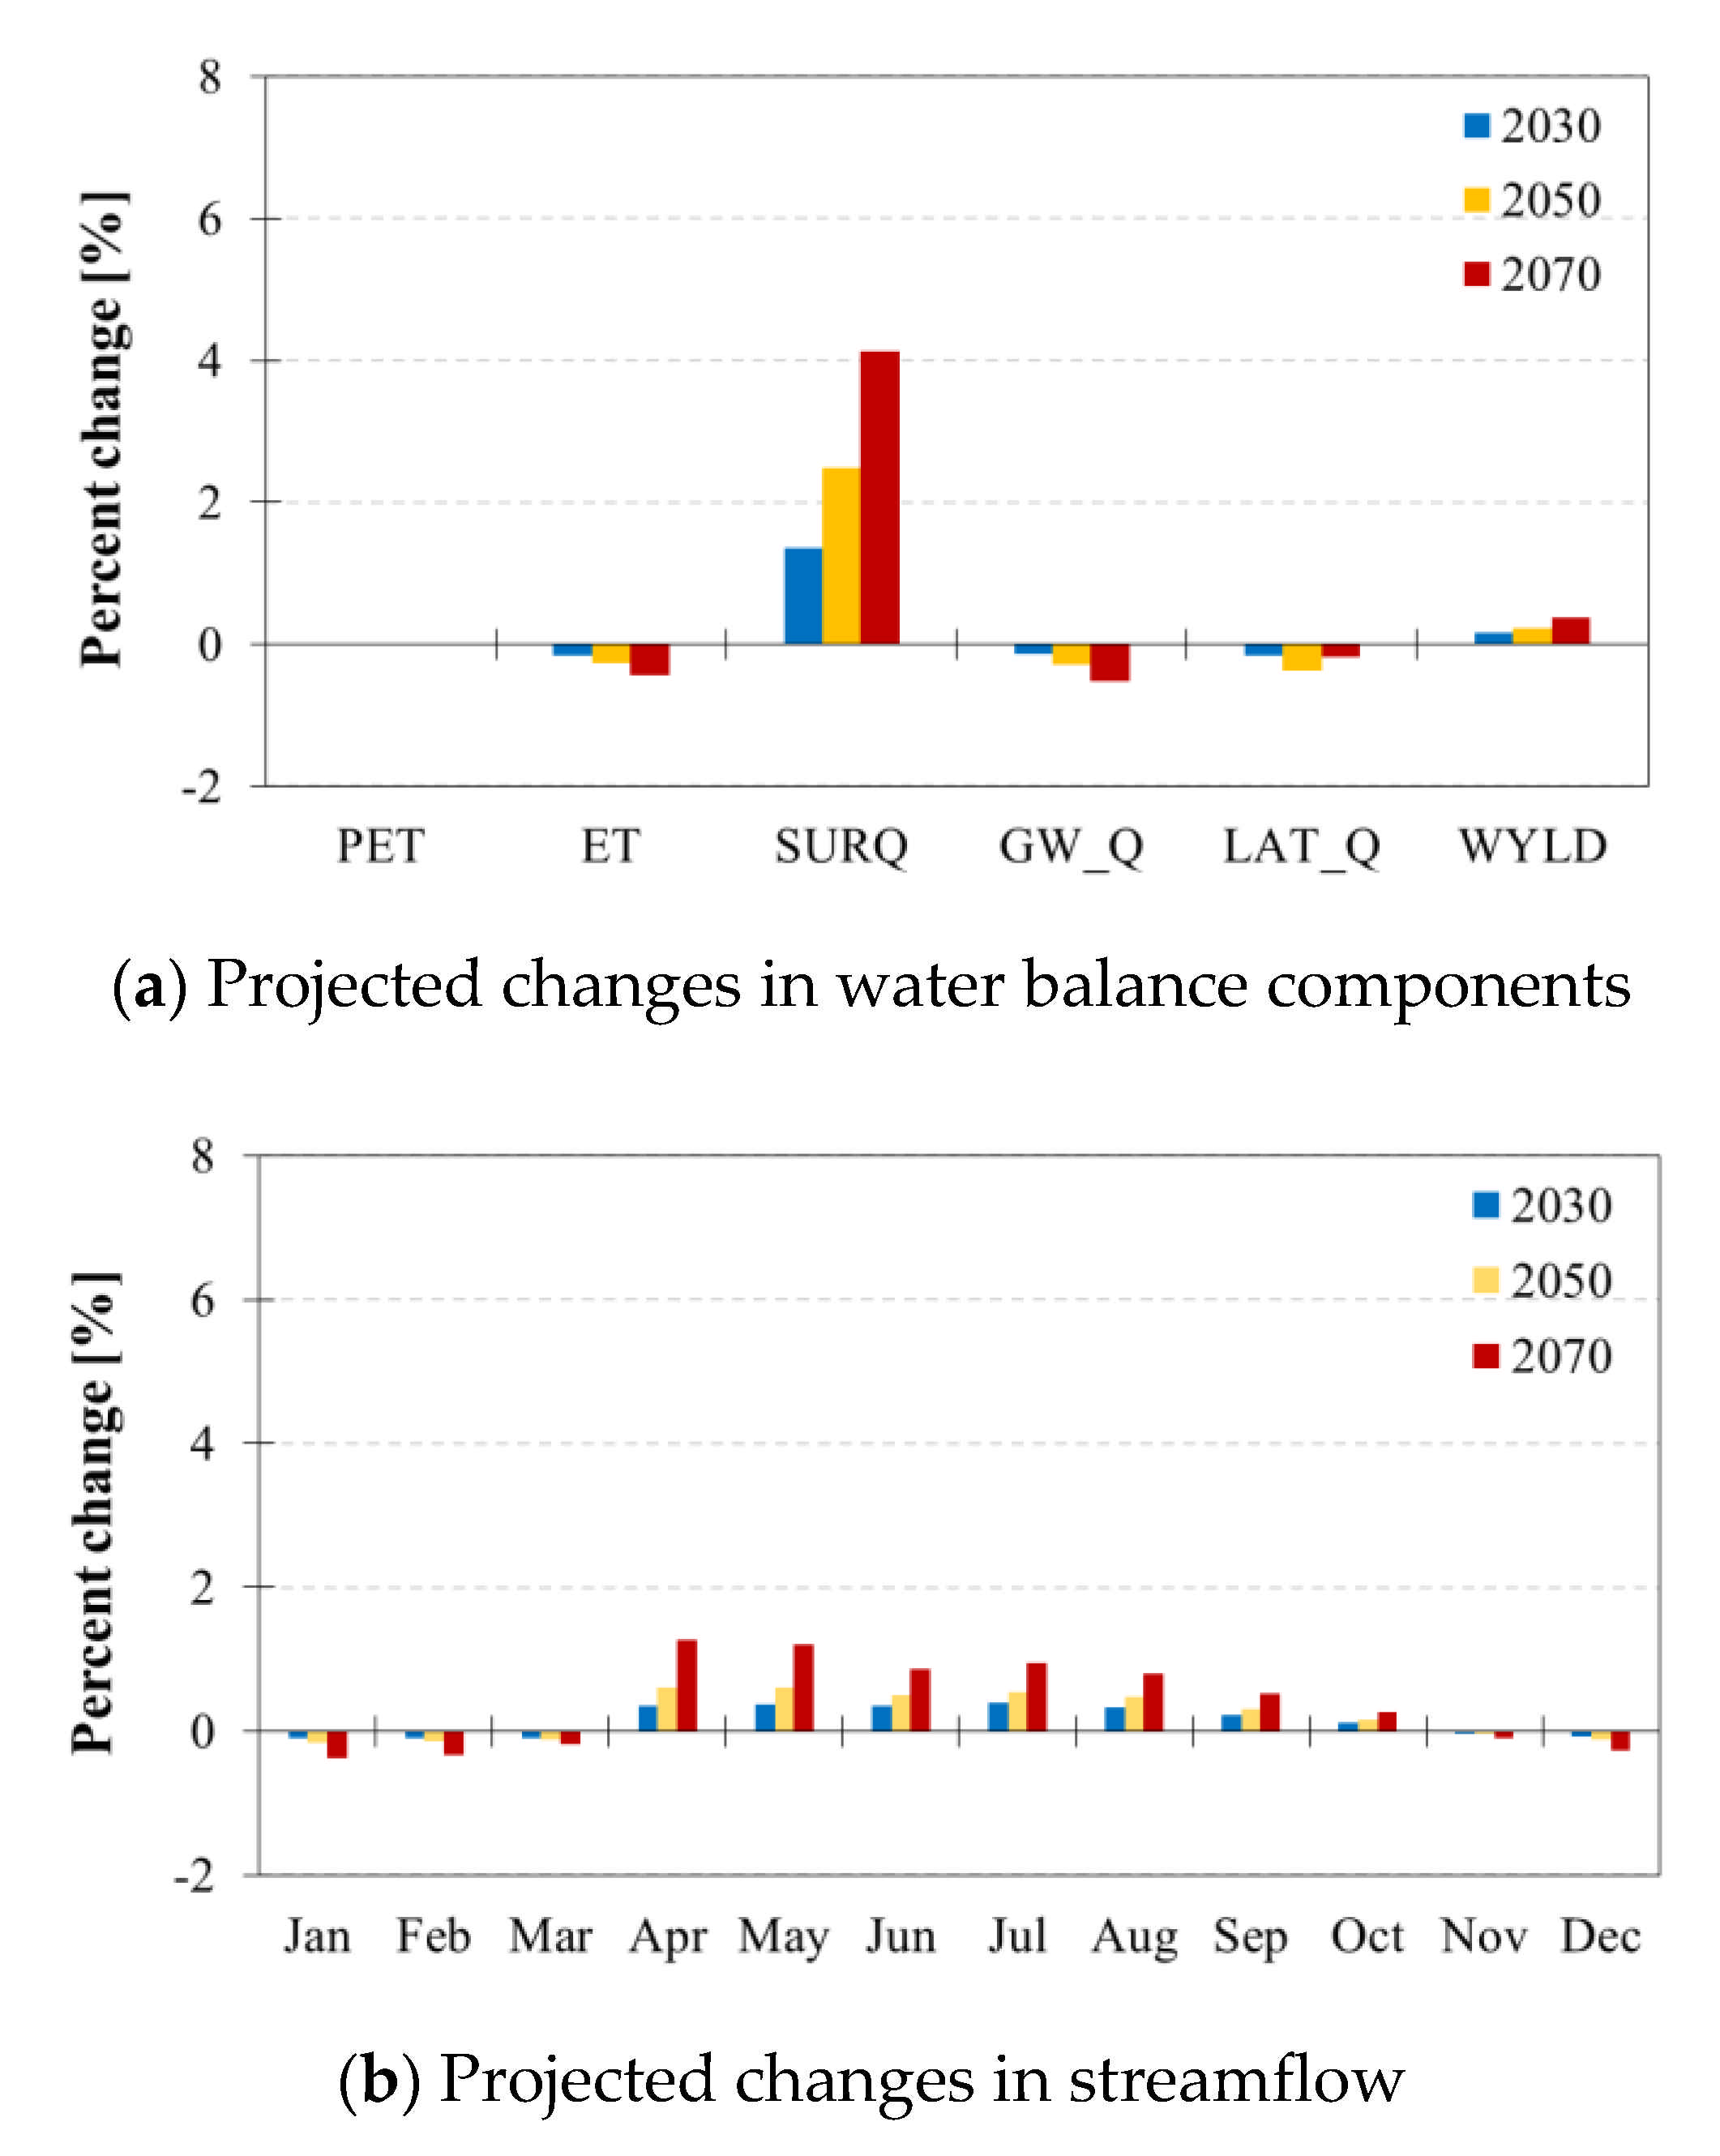
Results of projected changes in water balance components, streamflow, and sediment load under the influences of the three future LUC scenarios in the years of 2030, 2050, and 2070 are shown in Figure 7. Under the influences of changing LUC scenarios, the projected surface runoff (SURQ) and water yield (WYLD) increase by 1.35 to 4.4% and 0.16 to 0.37%, whereas the projected actual evapotranspiration (ET), groundwater flow (GW_Q), and lateral flow (LAT_Q) decrease by 0.17 to 0.44, 0.14 to 0.53%, and 0.15 to 0.37%, respectively, in the future. A conceivable justification for the changes in water balance components is the conversion of forest land to agricultural land, which is the cause of lower soil infiltration rates and less water captured by plant canopies [30].
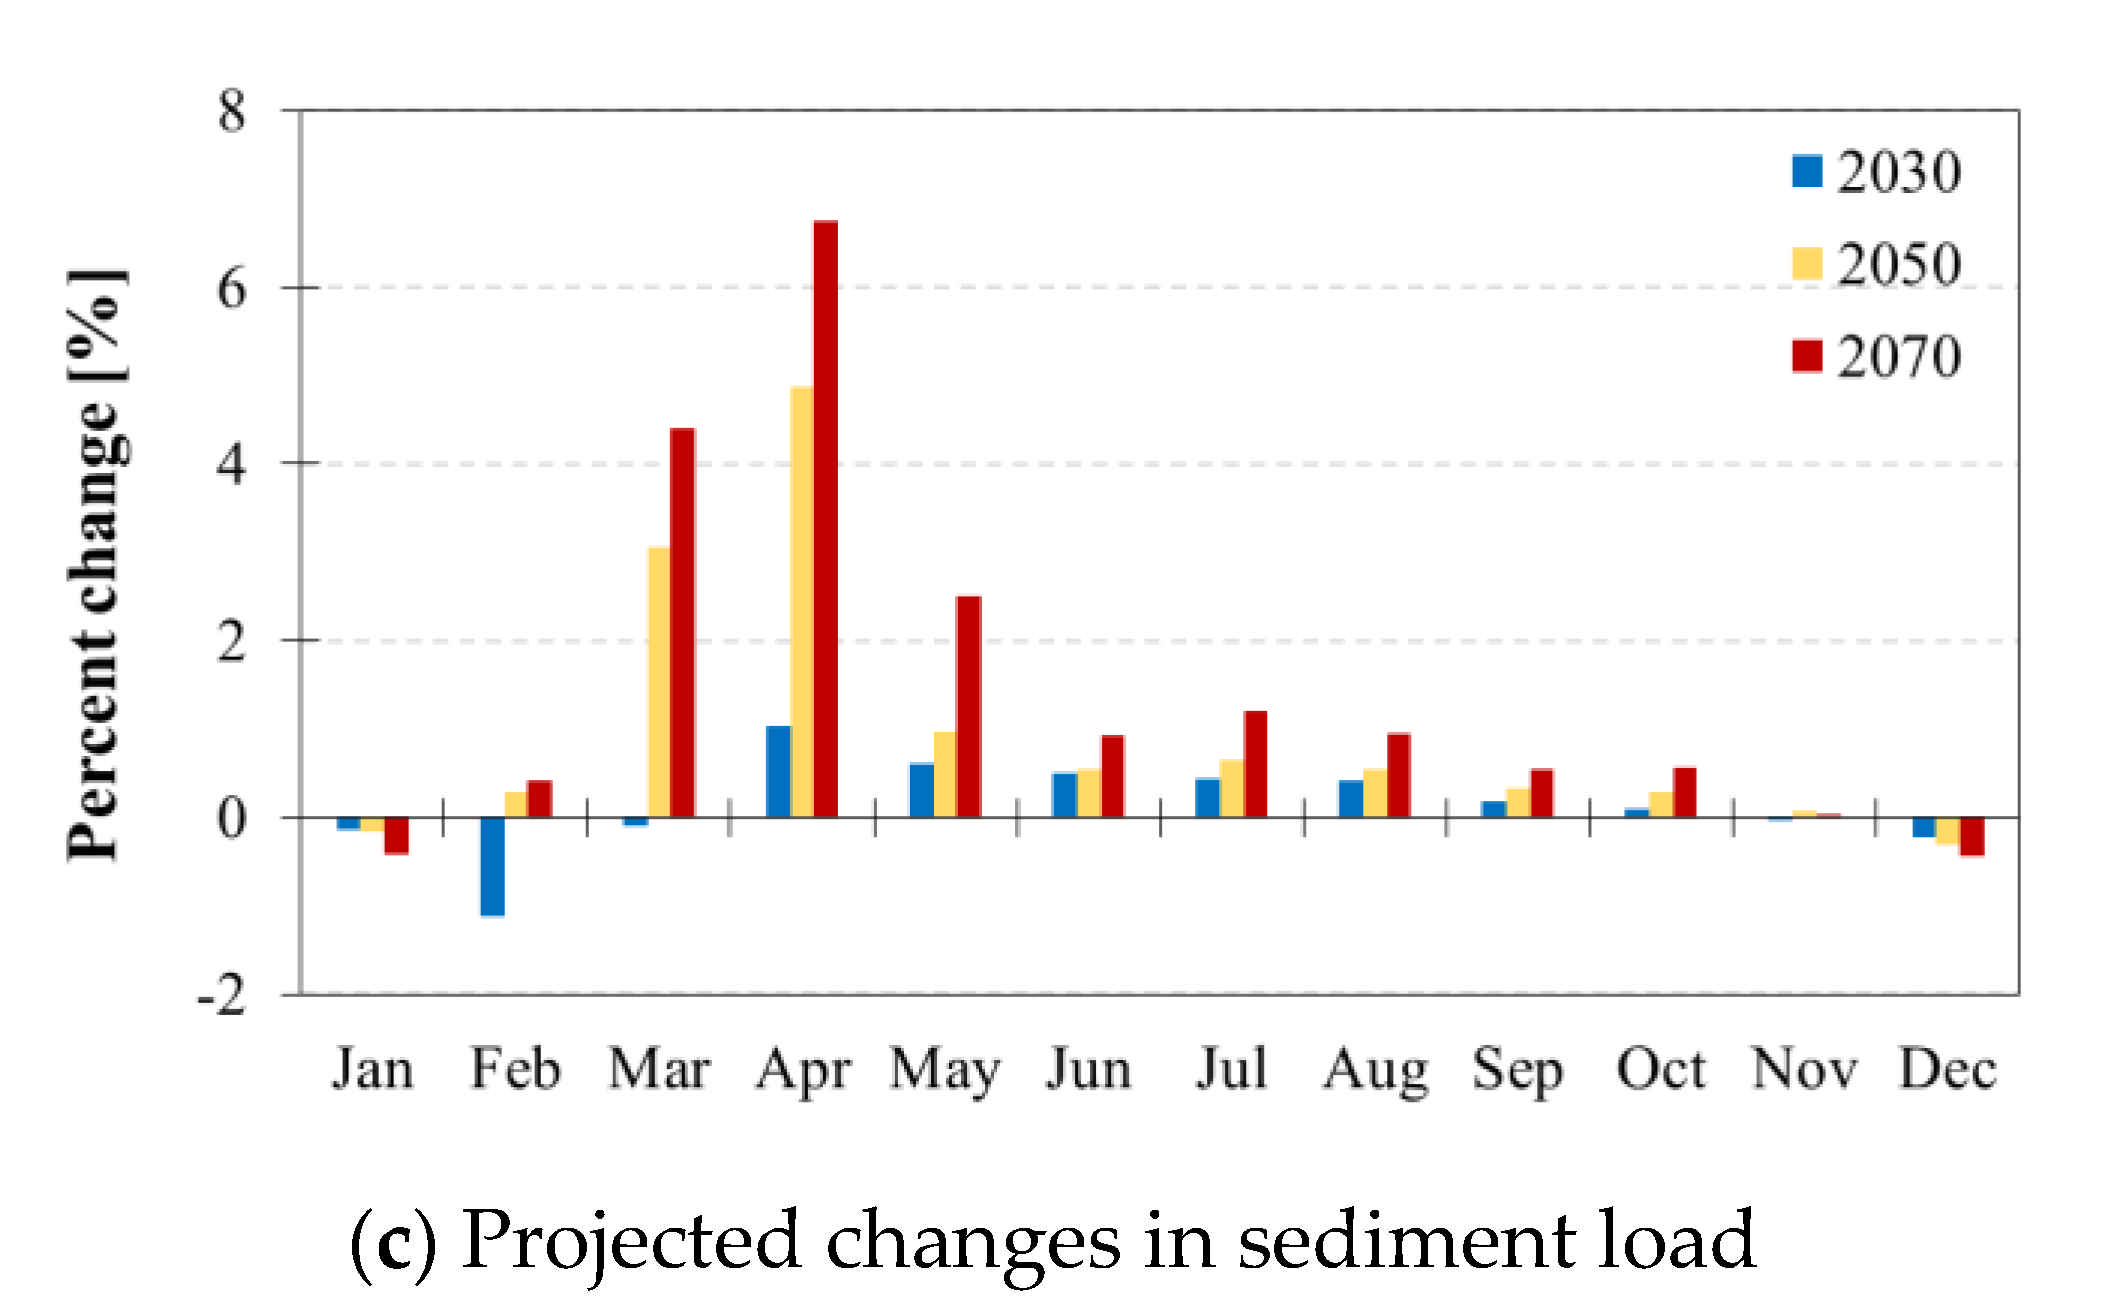
The projected streamflow and sediment load may have upward trends in the future when compared to those in the reference time period, which corresponds to the projected increases in agricultural land and urban area and the projected decreases in forest land and grassland. Specifically, the annual streamflow and sediment load were estimated to be approximately 287.35 m3/s and 101.23 × 10³ ton/month for the referenced time period. Under the influence of LUC changing scenarios, the annual streamflow may increase by 0.19%, 0.27%, and 0.45% and the annual sediment load may increase by 0.22%, 0.38%, and 0.68% for the years 2030, 2050, and 2070, respectively. With regard to seasonal changes, the dry-seasonal streamflow and sediment load are likely to undergo increases of 0.11 to 0.15% and 0.25 to 0.57% and the wet-seasonal streamflow and sediment load will experience increases of 0.23 to 0.53% and 0.24 to 0.69%, respectively. In addition, Table 5 exhibits the percentage changes in the 5th and 95th percentile values of monthly streamflow and sediment load. Q5 and Q95 indicate the values of monthly streamflow at the 5th and 95th percentiles, and W5 and W95 indicate the values of monthly sediment load at the 5th and 95th percentiles. As shown in Table 5, Q5, Q95, W5, and W95 show upward trends of 0.12 to 1.02%, 0.33 to 0.72%, 0.23 to 12.2%, and 0.02 to 0.18%, respectively, under the scenarios of LUC change for the years 2030, 2050, and 2070. Generally, the values of increases in Q5 and W5 are larger than those of Q95 and W95.
The influence of LUC changes on streamflow and sediment yield have been investigated in some regions of Vietnam. In particular, Ranzi et al. [31] reported a 28% increase in sediment yield due to the transformation of 35% of forest land to 20% of shrub land and 15% of agricultural land in the Lo River Basin in Northern Vietnam. Ngo et al. [18] documented an 88% increase in SURQ and a 47% increase in sediment yield caused by deforestation and agricultural expansion in the period of 1995–2005 in the Da River Basin in Northwest Vietnam. A study carried out by Truong et al. [32] also came to the conclusion that the transformation of forest land to agricultural land in the period of 1994–2005 resulted in an increase in the river discharge in the Ta Lai River Basin. General speaking, our findings are in accordance with the findings of the studies of Ranzi et al. [31], Ngo et al. [18], and Truong et al. [32].
Another finding of the present study is that the influences of LUC change on annual streamflow and sediment load are slight. Many published studies also reported insignificant influences of LUC changes on hydrological processes on the basin scale [1,33]. In Vietnam, the similar finding is also found in the studies conducted by Khoi and Suetsugi [30] and Khoi and Thom [15]. Furthermore, monthly responses of streamflow and sediment load of the study region are more easily affected by the LUC change than the annual responses. These findings agree with those stated by the study of Wang et al. [34].
The projected rises in annual and seasonal streamflow and sediment load, especially the rises in the 5th and 95th percentile values, in the context of LUC change present important implications for future water resources management and sediment control in the BRB. The upward trends of Q5 could improve water scarcity in the dry season in the future. Further, upward trends of Q95 and W95 will raise concerns regarding the flood risk and soil erosion during the wet season in study region. Generally, the deforestation and agricultural expansion may lead to rises in streamflow and sediment load. LUC is identified as one of the main controlling factors in the runoff and sediment generation, including linear erosion [35]. Therefore, controlling LUC change is important for implementing soil and water conservation practices.
5. Conclusions
The purpose of this study was to examine the responses of streamflow and sediment load to changing LUC scenarios in the BRB utilizing the Dyna-CLUE and SWAT hydrological models. The Dyna-CLUE model was calibrated using the observed LUC data in 2015 and the SWAT model was calibrated and validated using the observed daily streamflow and sediment loads in the period of 1980–2010 at two hydrological stations. The results demonstrated that the calibrated Dyna-CLUE and SWAT models could be used to predict the influence of future LUC changes on streamflow and sediment load in the BRB. From the results of this study, there are two main aspects that can be summarized as follows: (1) the future LUC changes of the study region are the enlargement of agricultural land (5.4 to 11.4%), urban area (46 to 155 km2), and water surface (4.8 to 12.0%), and reductions of forest land (18.9 to 37.5%) and grassland (6.4 to 26.2%); (2) under the influences of LUC change, the annual streamflow will undergo increases of 0.19% to 0.45% and the annual sediment load will experience increases of 0.22% to 0.68%. Additionally, the 5th and 95th percentile values of streamflow and sediment load are predicted to rise under the changing LUC impacts. Furthermore, the LUC change has small influences on annual streamflow and sediment load. In addition, the monthly responses of streamflow and sediment load are more sensitive to LUC change than the annual responses. The results achieved from the present study are expected to have considerable implications for future water resources management and sediment control in the BRB.
Author Contributions
Conceptualization, D.N.K.; data accusation, P.T.L. and T.T.S.; formal analysis, P.T.L. and T.T.S.; funding acquisition, D.N.K.; investigation, D.N.K., P.T.L. and T.T.S.; methodology, D.N.K.; software, P.T.L. and T.T.S.; supervision, D.N.K. All authors have read and agreed to the published version of the manuscript.
Funding
This research is funded by Vietnam National University HoChiMinh City (VNU-HCM) under grant number B2019-18-07.
Institutional Review Board Statement
Not applicable.
Informed Consent Statement
Not applicable.
Data Availability Statement
Not applicable.
Acknowledgments
This research is funded by Vietnam National University Ho Chi Minh City (VNU-HCM) under grant number B2019-18-07.
Conflicts of Interest
The authors declare no conflict of interest.
References
- Aghsaei, H.; Mobarghaee Dinan, N.; Moridi, A.; Asadolahi, Z.; Delavar, M.; Fohrer, N.; Wagner, P.D. Effects of dynamic land use/land cover change on water resources and sediment yield in the Anzali wetland catchment, Gilan, Iran. Sci. Total Environ. 2020, 712, 136449. [Google Scholar] [CrossRef] [PubMed]
- Öztürk, M.; Copty, N.K.; Saysel, A.K. Modeling the impact of land use change on the hydrology of a rural watershed. J. Hydrol. 2013, 497, 97–109. [Google Scholar] [CrossRef]
- DeFries, R.; Eshleman, K.N. Land-use change and hydrologic processes: A major focus for the future. Hydrol. Process. 2004, 18, 2183–2186. [Google Scholar] [CrossRef]
- Ni, X.; Parajuli, P.B.; Ouyang, Y.; Dash, P.; Siegert, C. Assessing land use change impact on stream discharge and stream water quality in an agricultural watershed. CATENA 2021, 198, 105055. [Google Scholar] [CrossRef]
- Zare, M.; Nazari Samani, A.A.; Mohammady, M.; Salmani, H.; Bazrafshan, J. Investigating effects of land use change scenarios on soil erosion using CLUE-s and RUSLE models. Int. J. Environ. Sci. Technol. 2017, 14, 1905–1918. [Google Scholar] [CrossRef]
- Shirmohammadi, B.; Malekian, A.; Salajegheh, A.; Taheri, B.; Azarnivand, H.; Malek, Z.; Verburg, P.H. Scenario analysis for integrated water resources management under future land use change in the Urmia Lake region, Iran. Land Use Policy 2020, 90, 104299. [Google Scholar] [CrossRef]
- Marhaento, H.; Booij, M.J.; Rientjes, T.H.M.; Hoekstra, A.Y. Attribution of changes in the water balance of a tropical catchment to land use change using the SWAT model. Hydrol. Process. 2017, 31, 2029–2040. [Google Scholar] [CrossRef]
- Wang, Q.; Liu, R.; Men, C.; Guo, L. Application of genetic algorithm to land use optimization for non-point source pollution control based on CLUE-S and SWAT. J. Hydrol. 2018, 560, 86–96. [Google Scholar] [CrossRef]
- Gong, X.; Bian, J.; Wang, Y.; Jia, Z.; Wan, H. Evaluating and Predicting the Effects of Land Use Changes on Water Quality Using SWAT and CA–Markov Models. Water Resour. Manag. 2019, 33, 4923–4938. [Google Scholar] [CrossRef]
- Tan, M.L.; Gassman, P.W.; Srinivasan, R.; Arnold, J.G.; Yang, X. A Review of SWAT Studies in Southeast Asia: Applications, Challenges and Future Directions. Water 2019, 11, 914. [Google Scholar] [CrossRef] [Green Version]
- Kim, J.; Choi, J.; Choi, C.; Park, S. Impacts of changes in climate and land use/land cover under IPCC RCP scenarios on streamflow in the Hoeya River Basin, Korea. Sci. Total Environ. 2013, 452–453, 181–195. [Google Scholar] [CrossRef]
- Shrestha, M.; Acharya, S.C. Assessment of historical and future land-use–land-cover changes and their impact on valuation of ecosystem services in Kathmandu Valley, Nepal. Land Degrad. Dev. 2020. ldr.3837. [Google Scholar] [CrossRef]
- Lü, D.; Gao, G.; Lü, Y.; Ren, Y.; Fu, B. An effective accuracy assessment indicator for credible land use change modelling: Insights from hypothetical and real landscape analyses. Ecol. Indic. 2020, 117, 106552. [Google Scholar] [CrossRef]
- Quyen, N.T.N.; Liem, N.D.; Loi, N.K. Effect of land use change on water discharge in Srepok watershed, Central Highland, Vietnam. Int. Soil Water Conserv. Res. 2014, 2, 74–86. [Google Scholar] [CrossRef] [Green Version]
- Khoi, D.N.; Thom, V.T. Impacts of climate variability and land-use change on hydrology in the period 1981-2009 in the central highlands of vietnam. Glob. Nest J. 2015, 17, 870–881. [Google Scholar]
- Khoi, D.N.; Nguyen, V.; Sam, T.T.; Nhi, P. Evaluation on Effects of Climate and Land-Use Changes on Streamflow and Water Quality in the La Buong River Basin, Southern Vietnam. Sustainability 2019, 11, 7221. [Google Scholar] [CrossRef] [Green Version]
- Ngo, T.S.; Nguyen, D.B. Predicting Land Use and Climate Changes Scenarios Impacts on Runoff and Soil Erosion: A Case Study in Hoa Binh Province, Lower Da River Basin, Northwest Vietnam. Environ. Asia 2020, 13, 62–77. [Google Scholar]
- Ngo, T.S.; Nguyen, D.B.; Rajendra, P.S. Effect of land use change on runoff and sediment yield in Da River Basin of Hoa Binh province, Northwest Vietnam. J. Mt. Sci. 2015, 12, 1051–1064. [Google Scholar] [CrossRef]
- Le Huong, H.; Thanh Son, N. Response of Streamflow and Soil Erosion to Climate Change and Human Activities in Nam Rom River Basin, Northwest of Vietnam. Environ. Nat. Resour. J. 2020, 18, 411–423. [Google Scholar] [CrossRef]
- Verburg, P.H.; Overmars, K.P. Combining top-down and bottom-up dynamics in land use modeling: Exploring the future of abandoned farmlands in Europe with the Dyna-CLUE model. Landsc. Ecol. 2009, 24, 1167–1181. [Google Scholar] [CrossRef]
- Verburg, P.H.; Soepboer, W.; Veldkamp, A.; Limpiada, R.; Espaldon, V.; Mastura, S.S.A. Modeling the Spatial Dynamics of Regional Land Use: The CLUE-S Model. Environ. Manag. 2002, 30, 391–405. [Google Scholar] [CrossRef]
- Thang, L.V.; Khoi, D.N.; Phi, H.L. Impact of climate change on streamflow and water quality in the upper Dong Nai river basin, Vietnam. La Houille Blanche 2018, 2018, 70–79. [Google Scholar] [CrossRef]
- Luo, G.; Yin, C.; Chen, X.; Xu, W.; Lu, L. Combining system dynamic model and CLUE-S model to improve land use scenario analyses at regional scale: A case study of Sangong watershed in Xinjiang, China. Ecol. Complex. 2010, 7, 198–207. [Google Scholar] [CrossRef]
- Nazari-Sharabian, M.; Taheriyoun, M.; Ahmad, S.; Karakouzian, M.; Ahmadi, A. Water Quality Modeling of Mahabad Dam Watershed–Reservoir System under Climate Change Conditions, Using SWAT and System Dynamics. Water 2019, 11, 394. [Google Scholar] [CrossRef] [Green Version]
- Babaei, H.; Nazari-Sharabian, M.; Karakouzian, M.; Ahmad, S. Identification of Critical Source Areas (CSAs) and Evaluation of Best Management Practices (BMPs) in Controlling Eutrophication in the Dez River Basin. Environments 2019, 6, 20. [Google Scholar] [CrossRef] [Green Version]
- Neitsch, A.L.; Arnold, J.G.; Kiniry, J.R.; Williams, J.R. Soil and Water Assessment Tool Theoretical Documentation Version 2009; Texas A&M University: College Station, TX, USA, 2011. [Google Scholar]
- Abbaspour, K.C. SWAT-CUP: SWAT Calibration and Uncertainty Programs-A User Manual; Swiss Federal Institute of Aquatic Science and Technology: Dubendorf, Switzerland, 2015. [Google Scholar]
- Moriasi, D.N.; Arnold, J.G.; Van Liew, M.W.; Bingner, R.L.; Harmel, R.D.; Veith, T.L. Model Evaluation Guidelines for Systematic Quantification of Accuracy in Watershed Simulations. Trans. ASABE 2007, 50, 885–900. [Google Scholar] [CrossRef]
- Tuan, D.A. Drivers of Forest Change in the Greater Mekong Subregion: Vietnam Country Report; USAID Lowering Emissions in Asia’s Forest (LEAF): Washington, DC, USA, 2015. [Google Scholar]
- Khoi, D.N.; Suetsugi, T. The responses of hydrological processes and sediment yield to land-use and climate change in the Be River Catchment, Vietnam. Hydrol. Process. 2014, 28, 640–652. [Google Scholar] [CrossRef]
- Ranzi, R.; Le, T.H.; Rulli, M.C. A RUSLE approach to model suspended sediment load in the Lo river (Vietnam): Effects of reservoirs and land use changes. J. Hydrol. 2012, 422–423, 17–29. [Google Scholar] [CrossRef]
- Truong, N.; Nguyen, H.; Kondoh, A. Land Use and Land Cover Changes and Their Effect on the Flow Regime in the Upstream Dong Nai River Basin, Vietnam. Water 2018, 10, 1206. [Google Scholar] [CrossRef] [Green Version]
- Wagner, P.D.; Bhallamudi, S.M.; Narasimhan, B.; Kantakumar, L.N.; Sudheer, K.P.; Kumar, S.; Schneider, K.; Fiener, P. Dynamic integration of land use changes in a hydrologic assessment of a rapidly developing Indian catchment. Sci. Total Environ. 2016, 539, 153–164. [Google Scholar] [CrossRef]
- Wang, Q.; Liu, R.; Men, C.; Guo, L.; Miao, Y. Effects of dynamic land use inputs on improvement of SWAT model performance and uncertainty analysis of outputs. J. Hydrol. 2018, 563, 874–886. [Google Scholar] [CrossRef]
- Chaplot, V.; Coadou le Brozec, E.; Silvera, N.; Valentin, C. Spatial and temporal assessment of linear erosion in catchments under sloping lands of northern Laos. CATENA 2005, 63, 167–184. [Google Scholar] [CrossRef]
Figure 1.
Map of the study area.

Figure 2.
Framework of LUC modelling for the BRB.

Figure 3.
Framework of the hydrological modelling for the BRB.

Figure 4.
Observed (a) and simulated (b) LUC maps in 2015 for the study region.

Figure 5.
Projected LUC maps in (a) 2030, (b) 2050, and (c) 2070 for the study region.

Figure 6.
Comparison graphs of observed and simulated values of (a) streamflow at the Phuoc Long station, (b) streamflow at the Phuoc Hoa station, and (c) sediment load at the Phuoc Hoa station for the calibration and validation time periods.
Figure 6.
Comparison graphs of observed and simulated values of (a) streamflow at the Phuoc Long station, (b) streamflow at the Phuoc Hoa station, and (c) sediment load at the Phuoc Hoa station for the calibration and validation time periods.

Figure 7.
Projected changes in (a) water balance components, (b) streamflow, and (c) sediment load under the influences of changing LUC scenarios.
Figure 7.
Projected changes in (a) water balance components, (b) streamflow, and (c) sediment load under the influences of changing LUC scenarios.


Table 1.
Conversion matrix for the Dyna-CLUE model in the BRB.
| Forest Land | Agriculture | Urban | Grassland | Water | |
|---|---|---|---|---|---|
| Forest land | 1 | 1 | 0 | 1 | 1 |
| Agriculture | 1 | 1 | 1 | 1 | 0 |
| Urban | 0 | 0 | 1 | 0 | 0 |
| Grassland | 1 | 1 | 1 | 1 | 1 |
| Water | 0 | 0 | 0 | 0 | 1 |
Table 2.
Regression coefficients of the driving forces for different LUC types in the study region.
| Forest Land | Agriculture | Urban | Grassland | Water | |
|---|---|---|---|---|---|
| Elevation | −0.00329 | 0.0021 | −0.00178 | −0.00088 | |
| Slope | 0.03275 | −0.0292 | −0.0243 | −0.229 | |
| Precipitation | −0.0064 | −0.0016 | |||
| Soil type | 0.00005 | 0.00007 | 0.00006 | −0.000097 | |
| Population density | −0.0094 | 0.008 | 0.00124 | −0.0067 | |
| Distance from road | 0.000007 | −0.00003 | −0.0012 | ||
| Distance from river | −0.0001 | −0.383 | −0.00011 | ||
| Distance from town/city center | 0.00015 | −0.00009 | −0.0033 | ||
| Constant | 10.87 | 1.96 | −1.148 | −2.192 | 1.595 |
| ROC | 0.792 | 0.764 | 0.984 | 0.663 | 0.803 |
Table 3.
LUC area of the BRB in the years of 2005, 2010, and 2015.
| LUC Type | Area in 2005 | Area in 2010 | Area in 2015 | |||
|---|---|---|---|---|---|---|
| km2 | % | km2 | % | km2 | % | |
| Forest land | 1591 | 20.30 | 1409 | 17.98 | 1379 | 17.59 |
| Agriculture | 5392 | 68.78 | 5554 | 70.85 | 5588 | 71.28 |
| Urban | 3 | 0.03 | 6 | 0.07 | 17 | 0.22 |
| Grassland | 706 | 9.01 | 722 | 9.21 | 705 | 8.99 |
| Water | 147 | 1.89 | 148 | 1.88 | 151 | 1.93 |
| Total | 7839 | 100 | 7839 | 100 | 7839 | 100 |
Table 4.
SWAT performance statistics for the simulations of streamflow and sediment load at the daily and monthly time-steps.
Table 4.
SWAT performance statistics for the simulations of streamflow and sediment load at the daily and monthly time-steps.
| Station | Simulation Type | Time Period | Daily Time-Step | Monthly Time-Step | ||
|---|---|---|---|---|---|---|
| ENS | PBIAS | ENS | PBIAS | |||
| Phuoc Long | Streamflow | Calibration: 1980–1990 | 0.74 | 6% | 0.86 | 6% |
| Validation: 1991–1993 | 0.78 | 3% | 0.95 | 3% | ||
| Phuoc Hoa | Streamflow | Calibration: 1980–1990 | 0.73 | −24% | 0.86 | −24% |
| Validation: 1991–2010 | 0.60 | −5% | 0.71 | −5% | ||
| Sediment | Calibration: 1999–2005 | 0.47 | 4% | 0.60 | 4% | |
| Validation: 2006–2010 | 0.51 | 28% | 0.73 | 28% | ||
Table 5.
Percentage changes in monthly streamflow and sediment load at the 5th and 95th percentiles under the influences of changing LUC scenarios.
Table 5.
Percentage changes in monthly streamflow and sediment load at the 5th and 95th percentiles under the influences of changing LUC scenarios.
| Streamflow | Sediment Load | |||||
|---|---|---|---|---|---|---|
| 2030 | 2050 | 2070 | 2030 | 2050 | 2070 | |
| 5th percentile | 0.12 | 0.41 | 1.02 | 0.23 | 6.21 | 12.2 |
| 95th percentile | 0.33 | 0.47 | 0.72 | 0.02 | 0.07 | 0.18 |
Publisher’s Note: MDPI stays neutral with regard to jurisdictional claims in published maps and institutional affiliations. |
© 2021 by the authors. Licensee MDPI, Basel, Switzerland. This article is an open access article distributed under the terms and conditions of the Creative Commons Attribution (CC BY) license (https://creativecommons.org/licenses/by/4.0/).
Share and Cite
MDPI and ACS Style
Khoi, D.N.; Loi, P.T.; Sam, T.T. Impact of Future Land-Use/Cover Change on Streamflow and Sediment Load in the Be River Basin, Vietnam. Water 2021, 13, 1244. https://doi.org/10.3390/w13091244
AMA Style
Khoi DN, Loi PT, Sam TT. Impact of Future Land-Use/Cover Change on Streamflow and Sediment Load in the Be River Basin, Vietnam. Water. 2021; 13(9):1244. https://doi.org/10.3390/w13091244
Chicago/Turabian StyleKhoi, Dao Nguyen, Pham Thi Loi, and Truong Thao Sam. 2021. "Impact of Future Land-Use/Cover Change on Streamflow and Sediment Load in the Be River Basin, Vietnam" Water 13, no. 9: 1244. https://doi.org/10.3390/w13091244
Note that from the first issue of 2016, this journal uses article numbers instead of page numbers. See further details here.