
Combining Process Modelling and LCA to Assess the Environmental Impacts of Wastewater Treatment Innovations


1
Department of Environmental Chemistry, Faculty of Environmental Technology, University of Chemistry and Technology Prague, Technická 5, 160 00 Prague, Czech Republic
2
Department of Water Technology and Environmental Engineering, Faculty of Environmental Technology, University of Chemistry and Technology Prague, Technická 5, 160 00 Prague, Czech Republic
*
Author to whom correspondence should be addressed.
Water 2021, 13(9), 1246; https://doi.org/10.3390/w13091246
Submission received: 3 April 2021
/
Revised: 22 April 2021
/
Accepted: 27 April 2021
/
Published: 29 April 2021
(This article belongs to the Special Issue Advances in Life Cycle Assessment in Wastewater Treatment)
Abstract
:Alternative wastewater treatment (WWT) technologies with lower environmental impacts seem to be the way forward in the pursuit of sustainable wastewater treatment plants (WWTPs). Process modelling of material and energy flows together with life-cycle assessment (LCA) can help to better understand these impacts and show the right direction for their development. Here, we apply this combined approach to three scenarios: conventional WWT; conventional WWT + chemically enhanced primary treatment (CEPT); conventional WWT + CEPT + side stream partial nitritation/anammox (PN/A). For each scenario, equations were developed to calculate chemical oxygen demand and nitrogen flow (solid and dissolved form) through the WWTP and to estimate the energy demands of its unit operations. LCA showed that the main environmental impact categories for all scenarios were global warming potential (GWP), eutrophication potential (EP) and marine aquatic eco-toxicity potential (MAETP). Compared with conventional WWT, CEPT and CEPT combined with PN/A resulted in a higher sum of normalized and weighed environmental indicators, by 19.5% and 16.4%, respectively (20.0% and 18.3% including biogenic carbon). Interestingly, the environmentally positive features of the alternative scenarios were often traded-off against other increased negative impacts. This suggests that further development is needed to consider these technologies a sustainable alternative.

1. Introduction
Sustainability, as a concept is the necessary response to today’s crises resulting from the current approach to continued economic growth. Good water quality is an integral part of the modern world and, for urban systems, wastewater treatment plants (WWTPs) are of vital significance [1,2]. Current methods of wastewater treatment (WWT) are very efficient in pollutant removal from sewage, thus generating water fit for reuse. However, WWT itself generates emissions and concentrates pollutants into sewage sludge, an unavoidable by-product [3]. Environmentally important are also the emissions of greenhouse gases (GHGs) that are produced both directly at WWTPs and indirectly during the production of energy needed to run the plant [4].
When developing new WWT technologies, in addition to process efficiency and economic benefits, the environmental performance of these technologies, i.e., the sum of all environmental impacts, must be considered to ensure the sustainability of these technologies in the future. To analyze environmental performance, it is necessary to choose a tool that can comprehensively describe all environmental impacts associated with the process, including all inputs and outputs. Life-cycle assessment (LCA) is such a tool, as it can assess the environmental impacts of processes, products and services throughout their entire life cycle and then quantify and summarize them into several environmental impact categories. It is currently the only method capable of comprehensively addressing the issue. This method evaluates all emissions that have a secondary or tertiary relationship to a given product. Thus, it can outline the space for possible improvement [5,6].
Most LCA studies assessing WWTPs focus on indirect and direct GHG emissions (CO2, CH4 and N2O), the emissions of phosphorus and nitrogen compounds in the effluent, and the amount of sludge produced at the plant [7,8,9,10,11]. As a result, eutrophication potential, toxicity-related impact categories and global warming potential are the main environmental impact categories connected to WWTP’s operation [12]. Reducing these impacts is crucial for operating an environmentally sustainable WWTP.
There are many new WWT technologies that are frequently considered environmentally friendly due to their particularly positive impact on the environment, e.g., reduced energy consumption. An example of this approach is the addition of coagulant for chemically enhanced primary treatment (CEPT), which is widely used in current WWTPs. The particular positive aspect of CEPT is the increased production of primary sludge, and consequent greater production of energy, when coupled with anaerobic digestion and cogeneration [13]. Another example is the partial nitritation—anammox (PN/A) technology, which, compared to today’s traditional activation process, shows a reduction in electricity consumption of up to 63% [14].
Assessing how the implementation of a new technology or a change in the process configuration affects the overall environmental balance through affecting the individual unit processes is crucial for implementing innovations in wastewater treatment. Holistic LCA studies of CEPT and PN/A have been published already based on real WWTPs’ operation [15,16,17]. While the results of case studies may be biased by case-specific disturbing factors, theoretical studies based on complex mathematical models of material and energy flows in the entire WWTP can produce more exact information on the environmental impacts of particular process modification.
This work assesses all environmental impacts of conventional WWT and compares them with two alternative treatment scenarios. Alternative scenarios assessed were the additional use of coagulants for CEPT and the implementation of PN/A of reject water from anaerobic digestion of sewage sludge.
2. Materials and Methods
This study consists of two phases. The first phase is the creation of a mass and energy balance model. Since the life-cycle assessment requires data that change every time the system configuration changes, we created an interactive model based on mathematical equations for mass and energy balance. This model served as the base for subsequent environmental impact assessment using LCA. We have created three configurations of this model, representing the three scenarios set by this study.
2.1. Scenario Definition
- Scenario 1: Conventional WWT
- Scenario 2: Conventional WWT + CEPT
- Scenario 3: Conventional WWT + CEPT + PN/A of reject water
Scenario 1 represents conventional WWT. It involves the stages of primary clarification, an activated sludge system containing the denitrification and nitrification process, secondary clarification, sludge treatment by anaerobic sludge digestion, sludge dewatering, biogas cogeneration, and lastly sludge disposal. Mechanical pre-treatment by coarse and fine screens and sand traps were not included in the assessment. Comparison of the environmental performance of different configurations of WWT does not need to include a mechanical pre-treatment step, because it is necessary for all these variations, whichever technology is later used for the treatment of the wastewater. For sludge disposal, we have assessed the average impacts by the percentual distribution of the most used sludge disposal practices in the Czech Republic: agriculture use (48%), composting (35%), landfill (10%) and incineration (7%) [18].
Scenario 2 is based on Scenario 1 enriched by chemically enhanced primary treatment (CEPT), a primary clarification process enhanced by the addition of a coagulant in form of iron (III) sulfate.
Scenario 3 is based on Scenario 2 enriched by partial nitritation—anammox of reject water from anaerobic digestion of sewage sludge.
Unit processes of all three scenarios are shown in Figure 1.
2.2. Mass and Energy Balance Model
The advantage of this model is that, as the main input parameters change, the input data for LCA are instantaneously calculated. These main parameters included: Volume of influent wastewater (m3), concentration of CODdissolved and CODsolid in influent wastewater (kg/m3), and concentration of total nitrogen (Ntotal,dissolved and Ntotal,solid) in influent wastewater (kg/m3). There are four types of balances, according to four flows of COD and Ntotal (both in dissolved and solid form). These input values were taken either from the relevant literature or calculated. All mass flows were expressed in kg/d.
An extensive collection of input data was needed to create a functional interactive WWT model. Considering the scope of this study, it was necessary to simplify many of the processes taking place during WWT (e.g., further fractionation of COD of sludge to inert, biodegradable, autotrophic and heterotrophic biomass, and endogenous residue). Screenshots of the model configuration schemes in MS Excel and tables with all the detailed data inputs (parameters of wastewater, sludge streams and individual processes) are included in the Supplementary Material (Figures S1–S3, Table S1).
Influent Wastewater Parameters
In this study, we have used influent wastewater parameters based on a full scale WWTP (410,000 PE) with known electricity consumption data: volume of 65,600 m3/d, 19,680 kg/d of CODdissolved, 29,520 kg/d of CODsolid, 3038 kg/d of Ntotal,dissolved and 857 kg/d of Ntotal,solid. These parameters well represent a medium–large city of Central Europe’s WWTP.
2.3. Life-Cycle Assessment
LCA is a standardized method. According to ISO 14040 and ISO 14044, we performed LCA in four main phases: (1) Goal and scope definition, (2) Inventory analysis, (3) Impact assessment and (4) Interpretation [6,19].
2.3.1. Goal and Scope Definition
The objective of the LCA phase of this study was to assess the environmental impacts of a conventional WWT process and to assess the impacts of including CEPT and PN/A of reject water to this process.
The most used functional unit of WWTPs LCA studies is the volume unit of treated wastewater (e.g., m3) [12]. However, this functional unit does not represent the quality of the wastewater and does not reflect the removal efficiency of WWTPs processes. Therefore, the functional unit used in this study is population equivalent (1 PE), defined as Person Load of 120 g of COD per day [20]. All materials, emissions, costs, and energy consumptions are referred with to this functional unit.
The system boundaries of assessed scenarios are shown in Figure 1. The only access to the system outside its boundary is mechanically pre-treated wastewater. Each of the components within is assessed through its entire life cycle. Mechanical pre-treatment by coarse and fine screens, and sand traps is not included in the overall assessment since it was identical for each WWT scenario under study. However, when assessing the environmental impacts of the whole integrated water system, this step should be included, along with the wastewater distribution infrastructure. Additional environmental impacts are associated with these phases of the system [21].
2.3.2. Inventory Analysis and Impact Assessment
Inventory analysis was performed for the unit processes (described in Section 2.1) using data drawn from the mass and energy balance model for each scenario configuration. These data include electricity consumption of unit processes, electricity yield from cogeneration, effluent COD, total nitrogen (Ntotal) and total phosphorus (Ptotal), produced amount of stabilized sludge, emissions of gases (CO2, CH4, N2O, N2) from every process and dosage of chemicals (coagulant). Thermal energy yield was not used as part of the input data of WWT systems, since at most WWTPs that include cogeneration, this generated thermal energy is used for the heating of anaerobic digestion units and the total yield and consumption of thermal energy cancel each other out in the overall assessment. As these data are the result of the first phase of this work, i.e., the creation of the mass and energy balance model, their detailed list with specific values is given in the Results and Discussion.
Impact assessment was done both including and excluding biogenic carbon, so we can better understand how the inclusion of biogenic carbon into the assessment affects the overall environmental performance. All the mentioned data were drawn either from the mass and energy balance model results or from the GaBi thinkstep database. GaBi 8 software by thinkstep was used for modelling in this study. Evaluation of the environmental impacts was then performed using the CML 2001 methodology [22]. This methodology was chosen because it is the most used methodology among the WWT LCA studies and thus best serves comparison with other studies [12]. Impact categories included in this methodology are summarized in Table 1. For the conversion to a single unit and better comparison of these impact categories, a normalization methodology was used. Weighting methodology was also applied to express the significance of the impact categories with respect to economic and social aspects. Normalization and weighing were done in two variants, one including and one excluding biogenic carbon. Their full name is “CML2001 - Jan. 2016, EU25+3, year 2000, incl (excl) biogenic carbon (region equivalents)” and “thinkstep LCIA Survey 2012, Europe, CML 2016, incl (excl) biogenic carbon (region equivalents weighted)”.
3. Results and Discussion
3.1. Results from Mass and Energy Balance Model Scenarios
Results from mass and energy balance model for each scenario are shown in Table 2. The results were related to the functional unit 1 PE described in Section 2.3.1 and their source for mass balance equations is shown in the Supplementary Material (Table S1). These values served as input data for the next LCA phase.
Looking at energy flows, there are small differences between the individual scenarios, as shown in Figure 2. The increase in the yield of electricity from the cogeneration process corresponds to a larger amount of digested sludge. In Scenario 3, part of electricity consumption is transferred to PN/A, which corresponds to the amount of dissolved nitrogen treated by this process.
For material flows, the biggest difference between Scenario 1 on the one hand and Scenarios 2 and 3 on the other hand is the amount of primary sludge generated (Figure 3). The total increased amount of sludge by CEPT corresponds to the amount of stabilized and dewatered sludge produced. Given that we considered the same ability to meet the effluent wastewater emission limits for all described scenarios, composition of treated water leaving the WWTP remains the same among all scenarios.
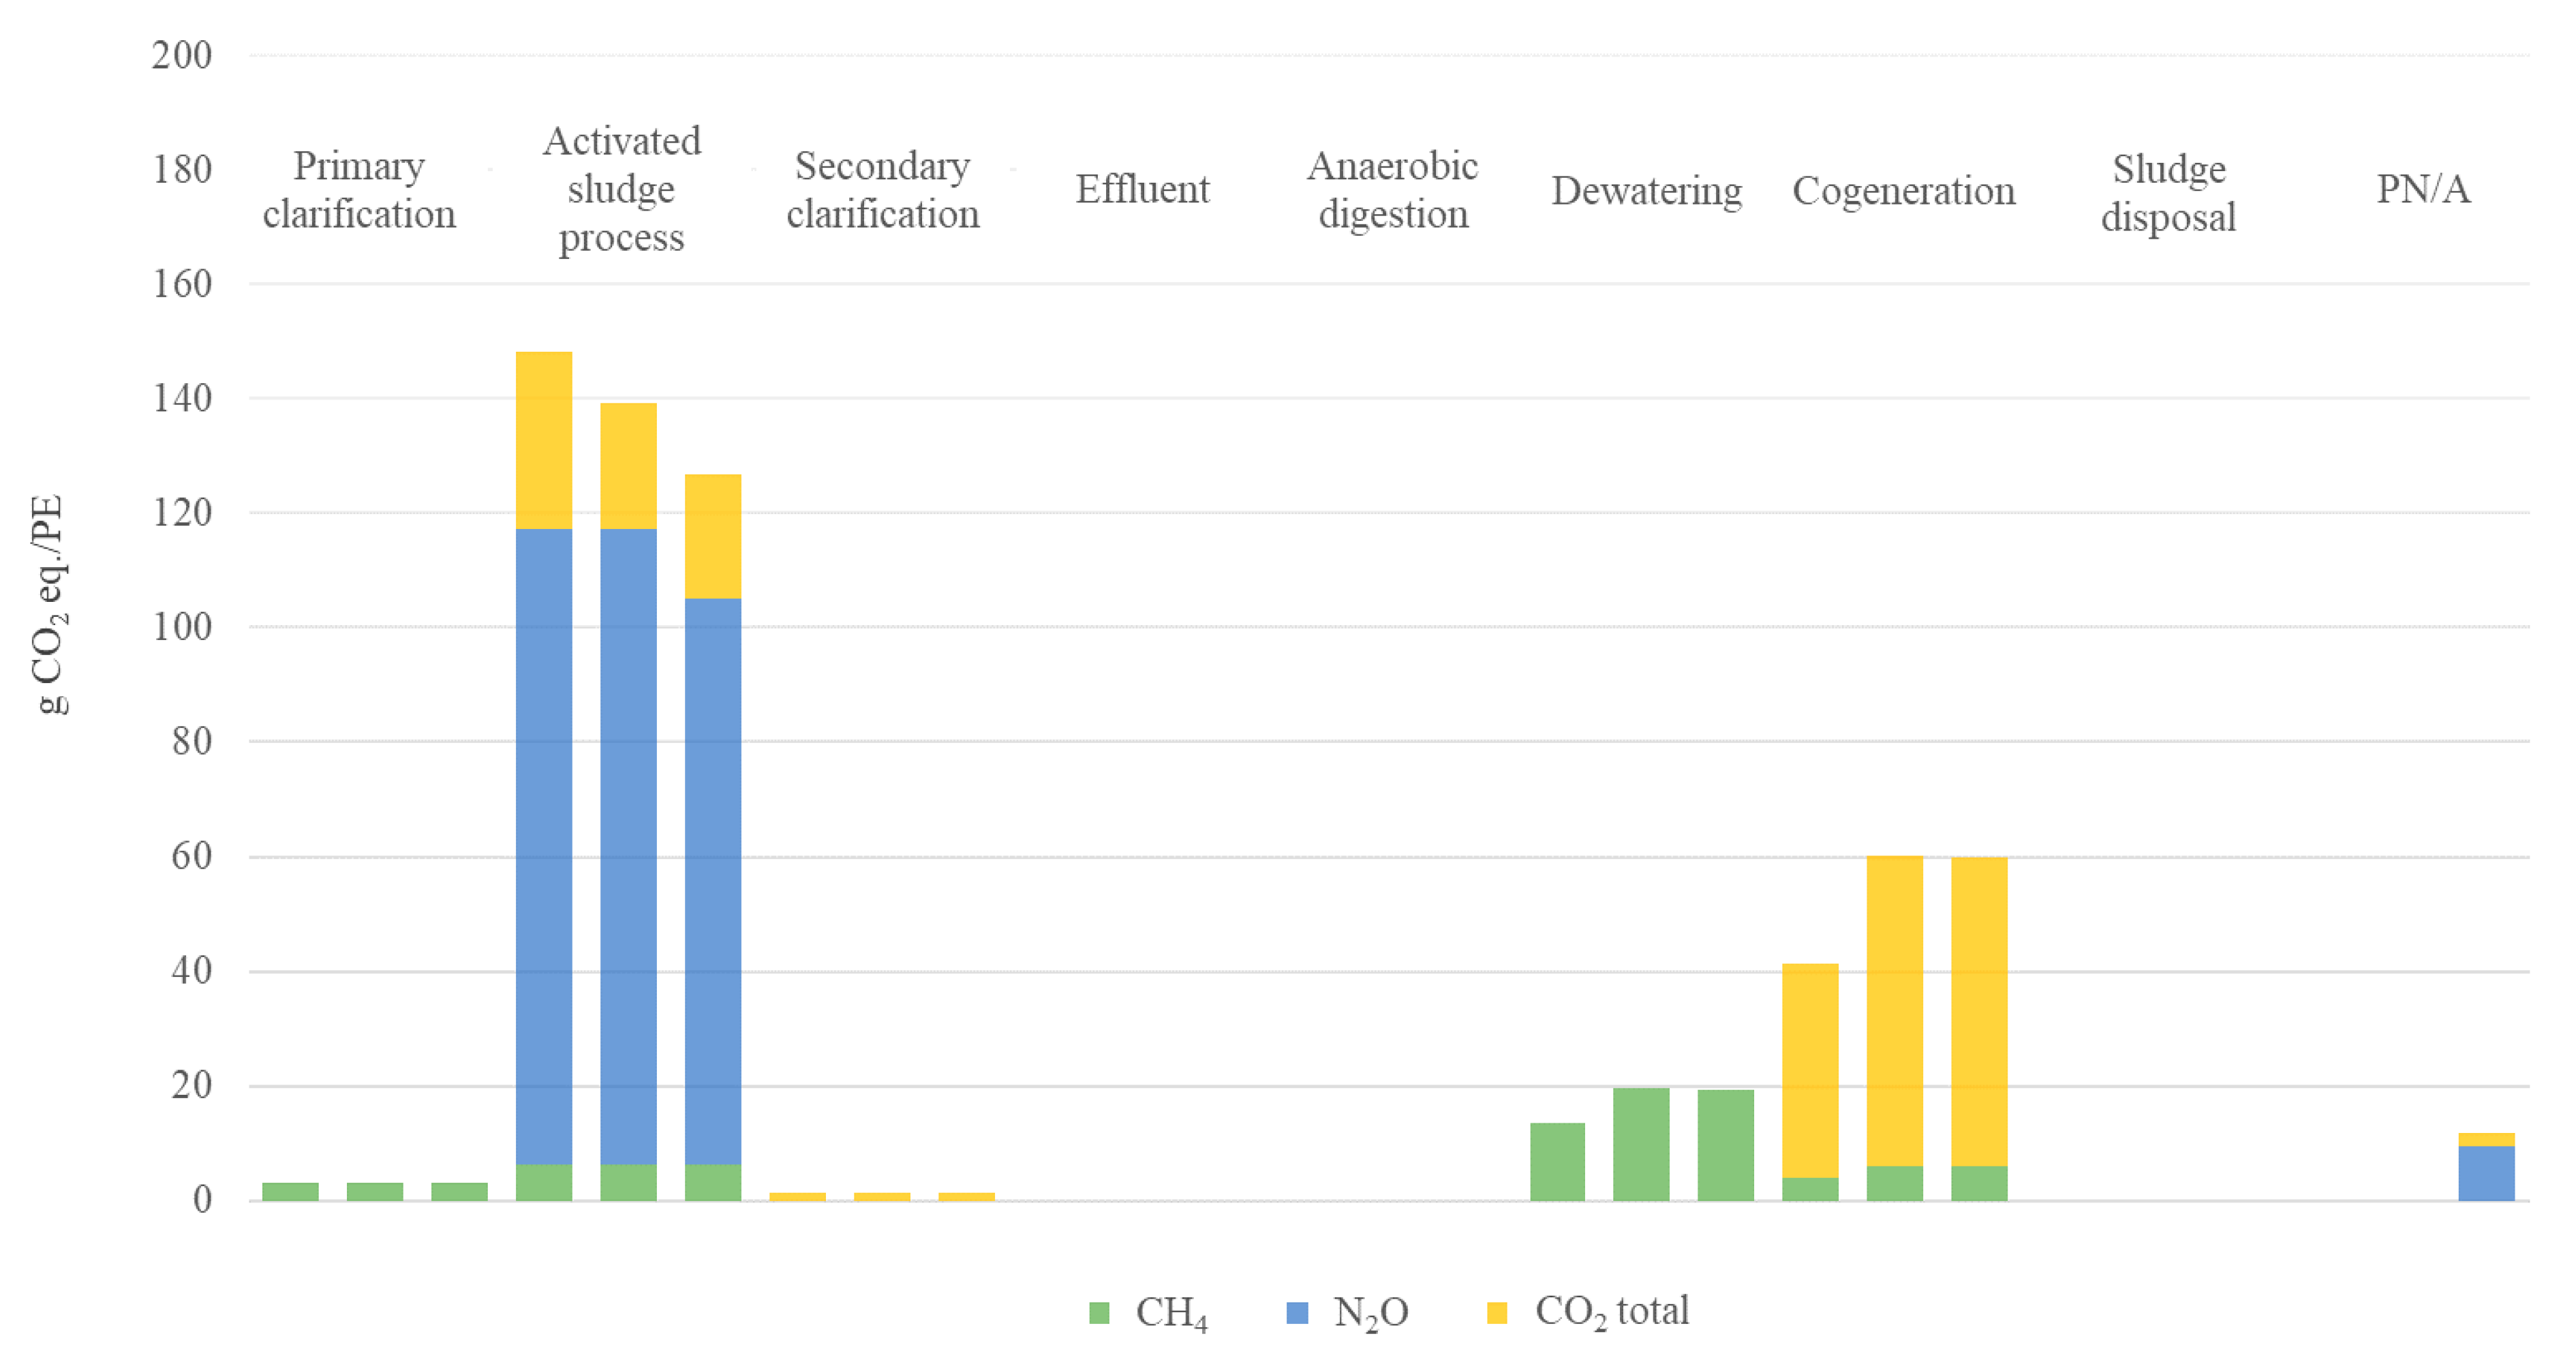
More noticeable differences can be observed when comparing direct GHG emissions from individual processes expressed in CO2 equivalents (Figure 4). The activated sludge process has the highest GHG emissions of all the processes described, particularly N2O, which is a major GHG with a global warming potential of 265 CO2 eq. over a 100-year horizon [23]. Emissions of N2O account for 77% of GHG emissions of the activated sludge process expressed in CO2 eq. Increasing the amount of primary sludge produced in Scenarios 2 and 3 avoids some of the GHG emissions from the activated sludge process, but meanwhile increases CH4 emissions from sludge dewatering and CO2 emissions from cogeneration to biogas. Similarly, in Scenario 3, GHG emissions of the PN/A process make up for the emissions avoided in the activated sludge process. Indirect GHG emissions according to LCA results are compared with direct emissions and further discussed in Section 3.3.1.
3.2. Comparing the Environmental Impacts of the Unit Processes
As shown in Figure 5, the activated sludge process is the most impactful WWT process, with the largest impact on global warming potential and toxicity-related impact categories (TETP, MAETP, HTTP and FAETP). This is because it has the largest electricity consumption and emissions of N2O. Due to these emissions, activated sludge process also partly contributes to eutrophication.
When comparing scenarios, differences can be seen mainly for cogeneration, primary clarification, and sludge disposal. The positive impact of cogeneration in Scenarios 2 and 3 relates to the increased amount of produced energy from biogas. The downside of this is the use of coagulant and therefore the greater contribution of primary clarification to the overall environmental balance. The impacts of primary clarification increase almost nine times in total when the impact of the coagulant life cycle is included. The increased amount of produced sludge also causes greater toxicity-related impacts. It is therefore clear that the implementation of CEPT brings some positive environmental impacts (greater biogas yield, reduced direct GHG emissions of activated sludge process), which are, however, offset by various negative environmental impacts (impact of coagulant production, increased impact of sludge disposal, increased direct GHG emissions of dewatering and cogeneration).
3.3. Comparing The Environmental Impacts of the Scenarios
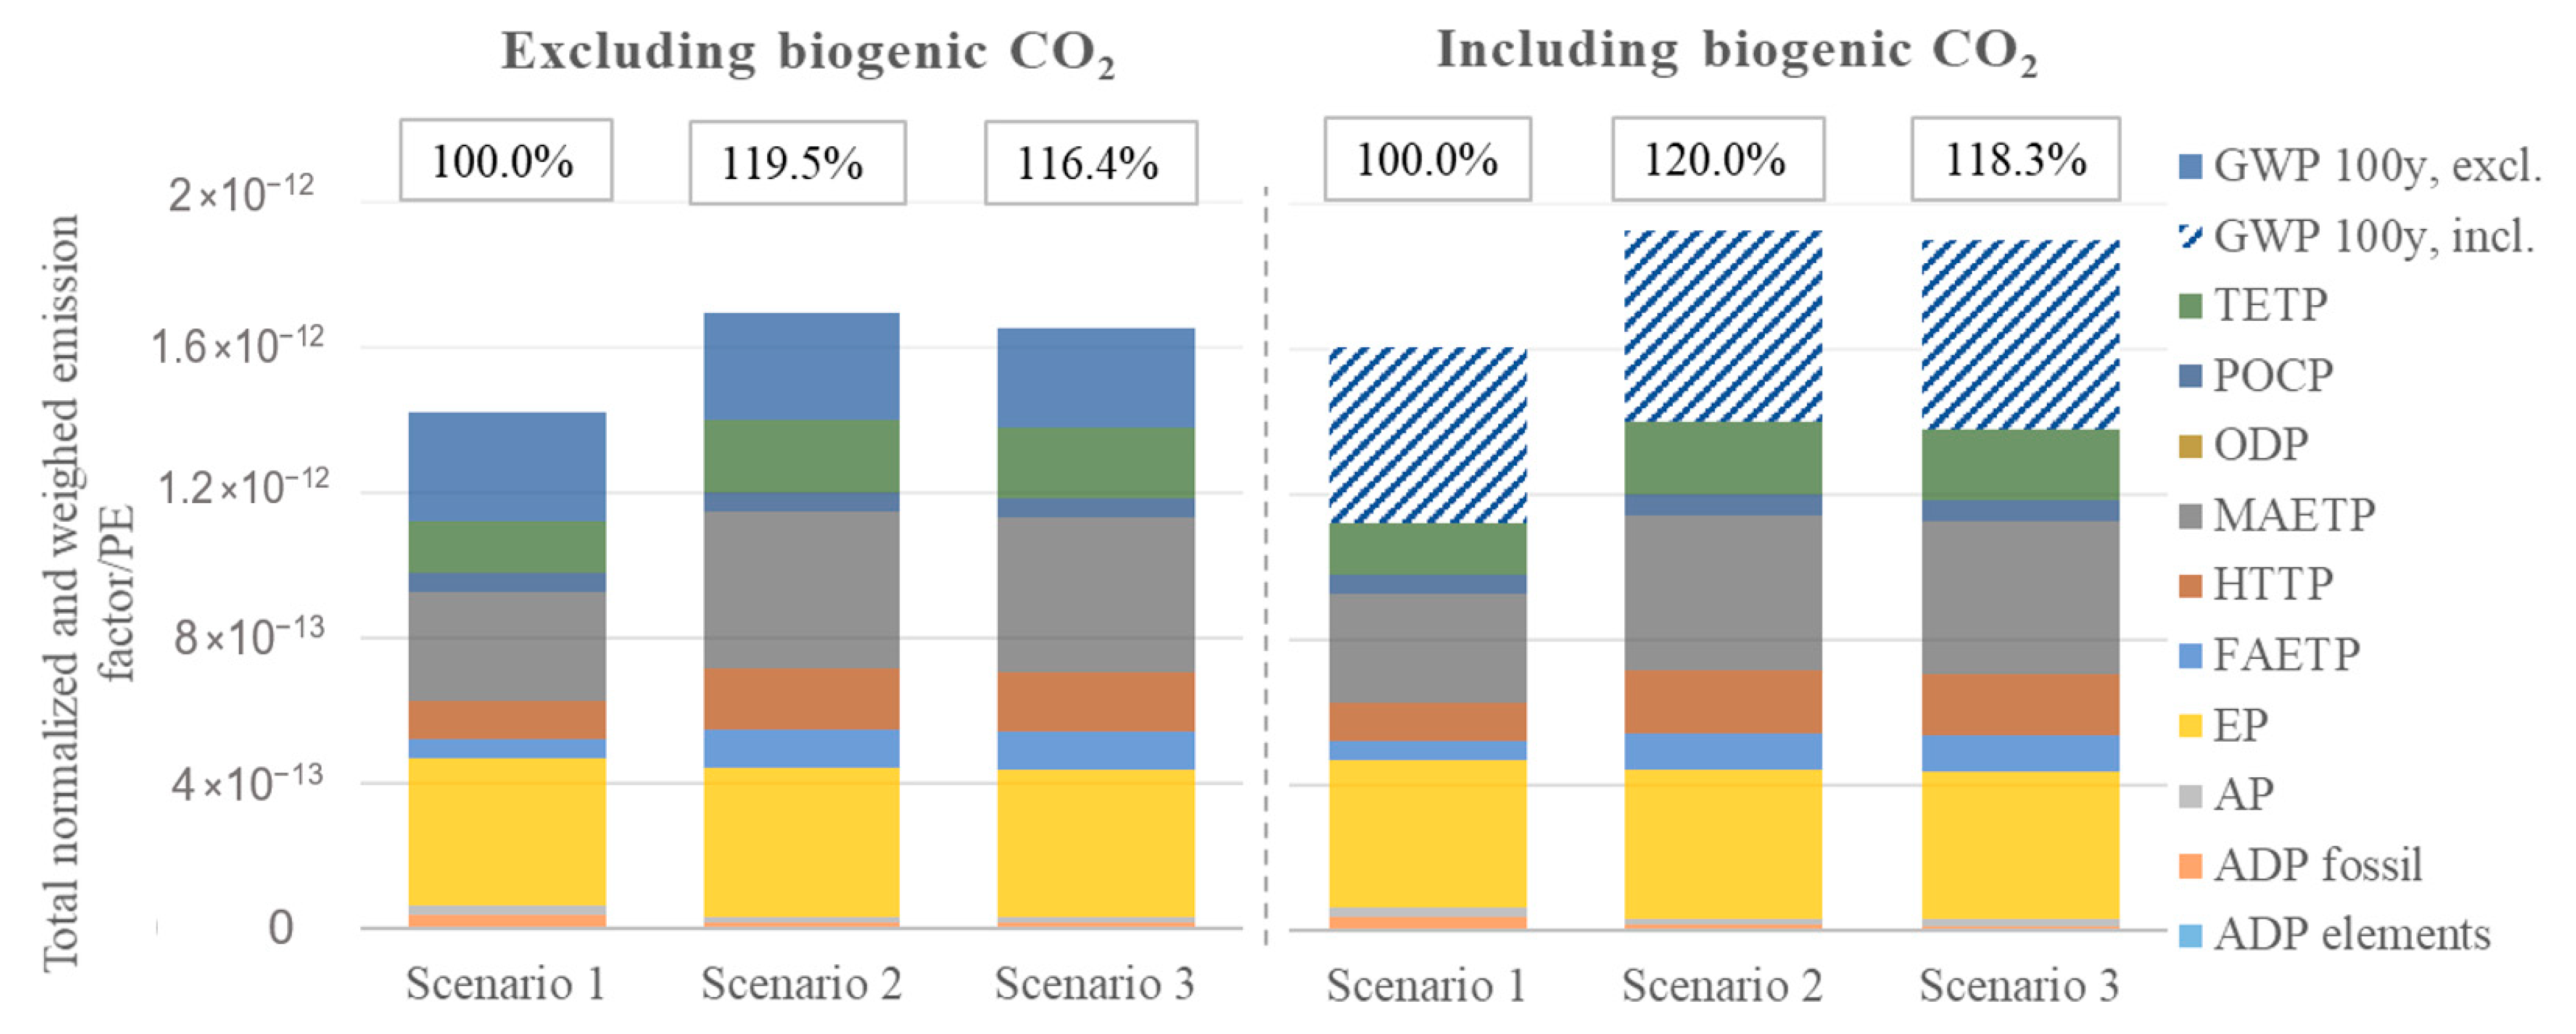
The results for the most important impact categories (Figure 6) are in agreement with the work of Corominas, Foley, Guest, Hospido, Larsen, Morera and Shaw [12], who reviewed LCA applied to WWT throughout 45 different studies and concluded that the most important impact categories are global warming potential, toxicity-related impact categories and eutrophication potential.
3.3.1. Global Warming Potential
One of the most dominant impact categories described by this study is global warming potential with 18% of total impact (28% including biogenic carbon). The cause of global warming is the production of GHG, in WWTPs either directly or indirectly produced. Although directly produced CO2 is a GHG, it is usually not included, as it is predominantly of biogenic origin (short-cycle CO2) and therefore climate neutral [24]. However, Law et al. [25] evaluated the presence of fossil organic carbon in wastewater and its fate in WWTPs. They showed that around 4–14% of influent total organic carbon (TOC) is of fossil origin. It was suggested that the current assumption, that all CO2 emissions from WWT are of biogenic origin, might be an underestimation. In this study, we considered 9% of all direct CO2 emissions to be of fossil origin and the assessment was done both including and excluding biogenic carbon for better understanding of how the inclusion of biogenic carbon affects the results. As can be seen in Figure 6, when including biogenic carbon, global warming potential becomes about 77% more impactful on average, which greatly influences the total environmental performance. Inclusion or exclusion of biogenic carbon in WWT LCA studies should be therefore always carefully considered and appropriately commented.
The overall emissions of GHG (direct and indirect) of the three scenarios considered in this study (Figure 7) are similar, with 0.167–0.173 kg CO2 eq./PE (0.276–0.296 kg CO2 eq./PE including biogenic carbon). When excluding biogenic carbon in Scenario 1, around 16% of all GHG emissions were related indirectly to electricity consumption. The rest was directly produced at the plant. For Scenarios 2 and 3, the percentual distribution of indirect emissions was even lower, 9 and 8%, respectively. The results in Figure 7 show, that when expressed in kg CO2 eq./PE, emissions of N2O are the largest among all scenarios (66–68%), with less CH4 emissions (18–23%) and fossil CO2 emissions (9–16%). These results are comparable with the work of Daelman, van Voorthuizen, van Dongen, Volcke and van Loosdrecht [7]. Their study accounted for around 78.4% of overall emissions to N2O, but only 8.1% to indirect and direct CO2. Higher CO2 emissions in this study are caused by the inclusion of 9% of all direct CO2 emissions that are regarded as fossil origin to the balance [25]. Another reason might be greater electricity consumption of the wastewater plant proposed by this study, but this is only an assumption since the actual electricity consumption of Kralingseveer WWTP evaluated by the study was not described [7].
3.3.2. Toxicity Related Impact Categories
Another dominant impact category is marine aquatic eco-toxicity with 24% of the total impact (21% including biogenic carbon). For Scenario 1, this impact category is affected 32% by emissions to air, that are created by the production of electricity (and subsequently deposited to water bodies), mainly of nuclear and lignite origin (electricity grid mix of the Czech Republic 2015) and 61% by emissions of heavy metals to agricultural soil (subsequently washed away to water bodies), caused solely by sludge disposal. However, this changes for Scenario 2, where the overall impact of MAETP increases by 42%, due to increased amount of produced sludge and due to emissions to fresh water caused by the production of iron (III) sulfate used for coagulation. This increase in the MAETP category for CEPT is comparable to the study of Alvarado, Hsu, Lam and Lee [15] and has an impact on the overall environmental performance of WWT using CEPT.
Sludge disposal and its emissions of heavy metals to agricultural soil also almost solely contributes to the environmental impact categories of terrestrial eco-toxicity, freshwater aquatic eco-toxicity, and human toxicity.
3.3.3. Eutrophication
Eutrophication presented 26% of total impact (23% including biogenic carbon). The impact of eutrophication in this study is, in the case of Scenario 2, caused 89% by direct emissions to aquatic systems, more accurately, 43% by phosphorus compounds, 42% by nitrogen compounds and 4% by COD. The remaining 11% is attributed to emissions of N2O into atmosphere. The eutrophication impact can be decreased by implementing technologies of enhanced nutrient removal. However, the decrease in eutrophication impact usually means an increase in another environmental impact category. Lately, researchers have been turning to the possibility of nutrient recovery in a form that can be further used and thus recycled [26]. Among these possible technologies are the recovery of nutrients in the form of struvite (MgNH4PO4 × 6H2O) [27] or land application of biosolids [28].
3.3.4. Other Impact Categories
Abiotic depletion of fossil fuels was, in this study, solely caused by electricity consumption and coagulant use. These non-renewable resources include lignite, natural gas, crude oil, and hard coal. Photochemical ozone creation is, in the case of Scenario 2, caused 52% by the direct emissions of CH4 into the atmosphere, 37% by non-CH4 volatile organic compounds generated mainly by sludge disposal and electricity use and 11% by emissions of inorganic compounds like sulfur dioxide (SO2), nitrogen oxides (NOx) and CO2, all in indirect emissions to the atmosphere by electricity consumption. The impact of acidification originates completely from electricity consumption and coagulant use. It is influenced mainly by the indirect emissions of SO2, NH3 and NOx.
3.3.5. Total Environmental Performance: Comparing Scenarios
The total environmental performance comparison in Figure 8 shows that alternative WWT scenarios are more impactful than the conventional WWT described by this study. Scenario 2 results in a 19.5% (20.0% including biogenic carbon) higher sum of normalized and weighed environmental indicators and Scenario 3 results in a 16.4% (18.3% including biogenic carbon) higher sum of normalized and weighed environmental indicators in comparison with the conventional treatment system. The reason for this increased impact of Scenario 2 and 3 is that, even though CEPT produces more energy via cogeneration, the positive impact of generated energy does not equal the negative impacts associated with the disposal of the increased amount of sludge and for the impacts of coagulant life cycle. As explained by Arnell, Rahmberg, Oliveira and Jeppsson [16], the overall impact of CEPT implementation may be even further increased if an external carbon source (e.g., methanol) is needed to prevent organic carbon deficiency in the denitrification process due to extensive pre-precipitation.
However, more interesting may be the decrease between Scenarios 2 and 3. Since the PN/A process proposed by this study only treats reject water (about 11% of incoming nitrogen load), the total environmental impact of the whole process might decrease with more intensive treatment of nitrogen by implementing mainstream PN/A. Additionally, as the main contributor to the environmental impacts of PN/A are N2O emissions, it is recommended by this study that the formations of these emissions are further explored. As N2O formation is related to the intensity of aeration, it would be beneficial to find the highest nitrogen removal rate from wastewater under which N2O emissions can remain at acceptable levels. Total replacement of activated sludge process with PN/A unit and the reduction in N2O emissions might play an important role in the overall environmental impact of WWTPs.
Finally, it should be noted, that since one of the most dominant impact categories was eutrophication, the development and assessment of alternative technologies that reduce the discharge of nutrients to aquatic systems may also be of interest.
3.4. Evaluation of Methodology Used
This study presents a unique approach to assessing the environmental impacts of WWT technologies. Before using the LCA tool, we created an interactive model simulating the processes taking place in WWT. We believe that creating such a model has many advantages. By connecting the individual processes with mathematical equations, it is possible to calculate how any change in the parameters describing the processes affects the output values for the LCA. The interactivity of the model allows the subsequent quick evaluation of any process configuration. To quickly receive the information on the environmental performance of various technologies is crucial in their development and helps to identify their potential weaknesses and strengths. Finally, it should be noted that the environmental burden of the initial investment (i.e., material for building the reactors that derives from their size) has not been implemented in the assessment. Still, including it might play an important role in the overall environmental comparison.
4. Conclusions
When comparing the environmental performance of different scenarios, the scenario with CEPT resulted in a 19.5% (20.0% including biogenic carbon) higher sum of normalized and weighed environmental indicators than the conventional treatment. This was caused by the increased impact of toxicity-related categories resulting from the increased amount of treated sludge and by the impact of used coagulant life cycle. The trade-off for this was the positive impact of the increased amount of electricity produced via biogas cogeneration.
The scenario with PN/A treating reject water resulted in a 16.4% (18.3% including biogenic carbon) higher sum of normalized and weighed environmental indicators than conventional WWT, but lower than the CEPT scenario from which it was derived. This correlated with decreased electricity consumption and GHG production. As side stream PN/A treating reject water reduces overall environmental impact, the implementation of mainstream PN/A in the water line and fully substituting activated sludge process may even further reduce overall environmental impacts of WWT. We recommend that especially the formation of N2O emissions in PN/A is further explored, as they are the main contributor to its environmental impacts.
The LCA showed that the most dominant environmental impact categories of WWT (excluding mechanical pre-treatment by coarse and fine screens, and sand traps) were global warming with 18% of the total impact (28% including biogenic carbon), eutrophication with 26% of the total impact (23% including biogenic carbon) and marine aquatic eco-toxicity with 24% of the total impact (21% including biogenic carbon). Amongst the evaluated unit processes, most impactful is the activated sludge process due to its high electricity consumption and N2O emission rate.
Additionally, the results suggest that the key options for operating a more environmentally friendly WWTP are to reduce total GHG emissions (especially direct N2O), reduce nutrient discharges to aquatic systems and reduce overall electricity consumption. All developing innovative technologies in WWT should be assessed as part of the whole WWTP, to reveal undesirable trade-offs among different environmental impact categories.
Finally, we would like to highlight the approach presented by this study. Combining process modelling with LCA helps to identify potential weaknesses and strengths of WWT technologies as well as producing more exact information on the environmental impacts of particular process modification compared to case studies. Thus, we believe that our results may prove to be a valuable contribution to the current literature dealing with the sustainability of WWT technologies.
Supplementary Materials
The following are available online at https://www.mdpi.com/article/10.3390/w13091246/s1, Table S1: Data inputs for mass and energy balance model, Table S2: Additional life-cycle assessment data, Figure S1: Screenshot of the mass and energy balance model scheme for Scenario 1 in MS Excel software, Figure S2: Screenshot of the mass and energy balance model scheme for Scenario 2 in MS Excel software, Figure S3: Screenshot of the mass and energy balance model scheme for Scenario 3 in MS Excel software.
Author Contributions
Conceptualization, J.B. and V.K.; funding acquisition, V.K.; investigation, A.P.; methodology, A.P. and M.Š.; resources, V.K.; supervision, J.B. and V.K.; validation, M.Š.; visualization, A.P.; writing—original draft, A.P.; writing—review and editing, J.B. and V.K. All authors have read and agreed to the published version of the manuscript.
Funding
This research was supported by the institutional support of University of Chemistry and Technology, Prague and with a project Innovative and additive manufacturing technology—New technological solutions for 3D printing of metals and composite materials, reg. no. CZ.02.1.01/0.0/0.0/17_049/0008407 financed by Structural Funds of Europe Union.
Institutional Review Board Statement
Not applicable.
Informed Consent Statement
Not applicable.
Data Availability Statement
The data presented in this study are available in the Supplementary material.
Conflicts of Interest
The authors declare no conflict of interest.
Abbreviations
ADPelements (Abiotic elements depletion potential), ADPfossil (Abiotic fossil fuels depletion potential), Anammox (Anaerobic ammonia oxidation), AP (Acidification potential), CEPT (Chemically enhanced primary treatment), COD (Chemical oxygen demand), DCB (1,2-Dichlorobenzene), EP (Eutrophication potential), FAETP (Freshwater aquatic eco-toxicity), GHG (Greenhouse gas), GWP100y, incl. (Global warming potential over a 100-year horizon, including biogenic carbon), GWP100y,excl. (Global warming potential over a 100-year horizon, excluding biogenic carbon), HTTP (Human toxicity potential), ISO (International Organization for Standardization), LCA (Life-cycle assessment), MAETP (Marine aquatic eco-toxicity potential), ODP (Ozone depletion potential), PE (Population equivalent), PN/A (Partial nitritation—anammox), POCP (Photochemical ozone creation potential), R11 (Trichlorofluoromethane), TETP (Terrestrial eco-toxicity potential), WWT (Wastewater treatment), WWTP (Wastewater treatment plant).
References
- Buonocore, E.; Mellino, S.; De Angelis, G.; Liu, G.; Ulgiati, S. Life cycle assessment indicators of urban wastewater and sewage sludge treatment. Ecol. Indic. 2018, 94, 13–23. [Google Scholar] [CrossRef] [Green Version]
- Perdan, S. The Concept of Sustainable Development and its Practical Implications. In Sustainable Development in Practice: Case Studies for Engineers and Scientists; Wiley-Blackwell: Hoboken, NJ, USA, 2010; pp. 3–25. [Google Scholar]
- Shao, L.; Chen, G.Q.; Hayat, T.; Alsaedi, A. Systems ecological accounting for wastewater treatment engineering: Method, indicator and application. Ecol. Indic. 2014, 47, 32–42. [Google Scholar] [CrossRef]
- Mannina, G.; Ekama, G.; Caniani, D.; Cosenza, A.; Esposito, G.; Gori, R.; Garrido-Baserba, M.; Rosso, D.; Olsson, G. Greenhouse gases from wastewater treatment—A review of modelling tools. Sci. Total Environ. 2016, 551–552, 254–270. [Google Scholar] [CrossRef] [PubMed]
- Guinée, J.B. Main characteristics of LCA. In Handbook on Life Cycle Assessment: Operational Guide to the ISO Standards; Springer: Dordrecht, The Netherlands, 2002; pp. 5–10. [Google Scholar]
- ISO 14044: Environmental Management—Life Cycle Assessment—Requirements and Guidelines. Available online: https://www.iso.org/standard/38498.html (accessed on 17 January 2019).
- Daelman, M.R.J.; van Voorthuizen, E.M.; van Dongen, U.G.J.M.; Volcke, E.I.P.; van Loosdrecht, M.C.M. Methane and nitrous oxide emissions from municipal wastewater treatment—results from a long-term study. Water Sci. Technol. 2013, 67, 2350–2355. [Google Scholar] [CrossRef] [PubMed]
- Emmerson, R.H.C.; Morse, G.K.; Lester, J.N.; Edge, D.R. The Life-Cycle Analysis of Small-Scale Sewage-Treatment Processes. Water Environ. J. 1995, 9, 317–325. [Google Scholar] [CrossRef]
- Kampschreur, M.J.; Temmink, H.; Kleerebezem, R.; Jetten, M.S.M.; van Loosdrecht, M.C.M. Nitrous oxide emission during wastewater treatment. Water Res. 2009, 43, 4093–4103. [Google Scholar] [CrossRef] [PubMed]
- Rodriguez-Garcia, G.; Frison, N.; Vázquez-Padín, J.R.; Hospido, A.; Garrido, J.M.; Fatone, F.; Bolzonella, D.; Moreira, M.T.; Feijoo, G. Life cycle assessment of nutrient removal technologies for the treatment of anaerobic digestion supernatant and its integration in a wastewater treatment plant. Sci. Total Environ. 2014, 490, 871–879. [Google Scholar] [CrossRef] [PubMed]
- Roeleveld, P.J.; Klapwijk, A.; Eggels, P.G.; Rulkens, W.H.; van Starkenburg, W. Sustainability of municipal waste water treatment. Water Sci. Technol. 1997, 35, 221–228. [Google Scholar] [CrossRef]
- Corominas, L.; Foley, J.; Guest, J.S.; Hospido, A.; Larsen, H.F.; Morera, S.; Shaw, A. Life cycle assessment applied to wastewater treatment: State of the art. Water Res. 2013, 47, 5480–5492. [Google Scholar] [CrossRef] [PubMed]
- Morelli, B.; Cashman, S.; Ma, X.; Garland, J.; Turgeon, J.; Fillmore, L.; Bless, D.; Nye, M. Effect of nutrient removal and resource recovery on life cycle cost and environmental impacts of a small scale water resource recovery facility. Sustainability 2018, 10, 3546. [Google Scholar] [CrossRef] [PubMed] [Green Version]
- Castro-Barros, C.M.; Daelman, M.R.J.; Mampaey, K.E.; van Loosdrecht, M.C.M.; Volcke, E.I.P. Effect of aeration regime on N2O emission from partial nitritation-anammox in a full-scale granular sludge reactor. Water Res. 2015, 68, 793–803. [Google Scholar] [CrossRef] [PubMed]
- Alvarado, V.I.; Hsu, S.-C.; Lam, C.-M.; Lee, P.-H. Beyond Energy Balance: Environmental Trade-Offs of Organics Capture and Low Carbon-to-Nitrogen Ratio Sewage Treatment Systems. Environ. Sci. Technol. 2020, 54, 4746–4757. [Google Scholar] [CrossRef] [PubMed] [Green Version]
- Arnell, M.; Rahmberg, M.; Oliveira, F.; Jeppsson, U. Multi-objective performance assessment of wastewater treatment plants combining plant-wide process models and life cycle assessment. J. Water Clim. Chang. 2017, 8, 715–729. [Google Scholar] [CrossRef]
- Schaubroeck, T.; De Clippeleir, H.; Weissenbacher, N.; Dewulf, J.; Boeckx, P.; Vlaeminck, S.E.; Wett, B. Environmental sustainability of an energy self-sufficient sewage treatment plant: Improvements through DEMON and co-digestion. Water Res. 2015, 74, 166–179. [Google Scholar] [CrossRef]
- Eurostat: Sewage Sludge Production and Disposal from Urban Wastewater (in Dry Substance (d.s)). Available online: https://ec.europa.eu/eurostat/web/products-datasets/-/ten00030 (accessed on 25 April 2019).
- ISO 14040: Environmental Management—Life Cycle Assessment—Principles and Framework. Available online: https://www.iso.org/standard/37456.html (accessed on 17 January 2019).
- Henze, M.; Comeau, Y. Wastewater Characterization. In Biological Wastewater Treatment: Principles, Modelling and Design; IWA Publishing: London, UK, 2008; pp. 33–52. [Google Scholar]
- Sambito, M.; Freni, G. LCA Methodology for the Quantification of the Carbon Footprint of the Integrated Urban Water System. Water 2017, 9, 395. [Google Scholar] [CrossRef] [Green Version]
- CML—Department of Industrial Ecology: CML-IA Characterisation Factors. Available online: https://www.universiteitleiden.nl/en/research/research-output/science/cml-ia-characterisation-factors (accessed on 5 May 2019).
- Intergovernmental Panel on Climate Change (IPCC). Fifth Assessment Report (AR5) Observed Climate Change Impacts Database; Version 2.01; NASA Socioeconomic Data and Applications Center (SEDAC): Palisades, NY, USA, 2017; p. 151. [Google Scholar]
- Parravicini, V.; Svardal, K.; Krampe, J. Greenhouse Gas Emissions from Wastewater Treatment Plants. Energy Procedia 2016, 97, 246–253. [Google Scholar] [CrossRef] [Green Version]
- Law, Y.; Jacobsen, G.E.; Smith, A.M.; Yuan, Z.; Lant, P. Fossil organic carbon in wastewater and its fate in treatment plants. Water Res. 2013, 47, 5270–5281. [Google Scholar] [CrossRef] [PubMed]
- Zang, Y.; Li, Y.; Wang, C.; Zhang, W.; Xiong, W. Towards more accurate life cycle assessment of biological wastewater treatment plants: A review. J. Clean. Prod. 2015, 107, 676–692. [Google Scholar] [CrossRef]
- De-Bashan, L.E.; Bashan, Y. Recent advances in removing phosphorus from wastewater and its future use as fertilizer (1997–2003). Water Res. 2004, 38, 4222–4246. [Google Scholar] [CrossRef]
- Mo, W.; Zhang, Q. Energy–nutrients–water nexus: Integrated resource recovery in municipal wastewater treatment plants. J. Environ. Manag. 2013, 127, 255–267. [Google Scholar] [CrossRef]
Figure 1.
System boundary of conventional wastewater treatment process with added chemically enhanced primary clarification in Scenarios 2 + 3 and partial nitritation—anammox of reject water in Scenario 3. E = Electricity consumption.
Figure 1.
System boundary of conventional wastewater treatment process with added chemically enhanced primary clarification in Scenarios 2 + 3 and partial nitritation—anammox of reject water in Scenario 3. E = Electricity consumption.

Figure 2.
Electricity consumption and yield of individual unit processes for all scenarios.

Figure 3.
Amount of stabilized and dewatered sludge produced in individual scenarios.

Figure 4.
Direct greenhouse gas emissions of individual unit processes expressed in CO2 equivalents for all scenarios. Each trinity of columns represents one unit process in each scenario. Left column = Scenario 1. Middle column = Scenario 2. Right column = Scenario 3.
Figure 4.
Direct greenhouse gas emissions of individual unit processes expressed in CO2 equivalents for all scenarios. Each trinity of columns represents one unit process in each scenario. Left column = Scenario 1. Middle column = Scenario 2. Right column = Scenario 3.

Figure 5.
Normalized and weighed emission factor per functional unit for each assessed impact category, compared among all unit processes for all scenarios. Each trinity of columns represents one unit process in each scenario. Left column = Scenario 1. Middle column = Scenario 2. Right column = Scenario 3.

Figure 6.
Normalized and weighed emission factors per functional unit for each impact category assessed, compared for individual scenarios. The patterned columns correspond to the inclusion of biogenic CO2 in the assessment of GWP impact category.
Figure 6.
Normalized and weighed emission factors per functional unit for each impact category assessed, compared for individual scenarios. The patterned columns correspond to the inclusion of biogenic CO2 in the assessment of GWP impact category.

Figure 7.
Direct and indirect greenhouse gas emissions of studied scenarios expressed in kg of CO2 equivalents per functional unit. The patterned columns correspond to the inclusion of biogenic CO2 in the assessment.
Figure 7.
Direct and indirect greenhouse gas emissions of studied scenarios expressed in kg of CO2 equivalents per functional unit. The patterned columns correspond to the inclusion of biogenic CO2 in the assessment.

Figure 8.
Comparison of wastewater treatment scenarios: total environmental performance in two variants, with Scenario 1 set as 100% in both variants. The patterned columns correspond to the inclusion of biogenic CO2 in the assessment of GWP impact category.
Figure 8.
Comparison of wastewater treatment scenarios: total environmental performance in two variants, with Scenario 1 set as 100% in both variants. The patterned columns correspond to the inclusion of biogenic CO2 in the assessment of GWP impact category.


Table 1.
Impact categories used by CML 2001 (January 2016) impact assessment methodology with units regarding appropriate chemical equivalents [22].
Table 1.
Impact categories used by CML 2001 (January 2016) impact assessment methodology with units regarding appropriate chemical equivalents [22].
| Impact Category | Category Indicator Unit | Characterization Factor |
|---|---|---|
| Abiotic Depletion | (kg Sb eq.) | ADPelements |
| Abiotic Depletion | (MJ) | ADPfossil |
| Acidification Potential | (kg SO2 eq.) | AP |
| Eutrophication Potential | (kg PO4− eq.) | EP |
| Freshwater Aquatic Eco-toxicity Potential | (kg DCB eq.) | FAETP |
| Global Warming Potential (100 years, including biogenic carbon) | (kg CO2 eq.) | GWP100y, incl. |
| Global Warming Potential (100 years, excluding biogenic carbon) | (kg CO2 eq.) | GWP100y, excl. |
| Human Toxicity Potential | (kg DCB eq.) | HTTP |
| Marine Aquatic Eco-toxicity Potential | (kg DCB eq.) | MAETP |
| Ozone Layer Depletion Potential | (kg R11 eq.) | ODP |
| Photochemical Ozone Creation Potential | (kg C2H4 eq.) | POCP |
| Terrestrial Eco-toxicity Potential | (kg DCB eq.) | TETP |
Table 2.
Results from mass and energy balance model scenarios used as input data for life-cycle assessment.
Table 2.
Results from mass and energy balance model scenarios used as input data for life-cycle assessment.
| Parameter | Scenario 1 | Scenario 2 | Scenario 3 | Unit |
|---|---|---|---|---|
| Primary clarification | ||||
| Emissions of CH4 | 0.114 | 0.114 | 0.114 | (g/PE) |
| Iron (III) sulfate (coagulant) dose | 6.237 | 6.237 | (g/PE) | |
| Electricity consumption | 0.003 | 0.003 | 0.003 | (kWh/PE) |
| Activated sludge process | ||||
| Emissions of CO2 | 31.045 | 22.140 | 21.624 | (g/PE) |
| Emissions of CH4 | 0.227 | 0.227 | 0.222 | (g/PE) |
| Emissions of N2O | 0.418 | 0.418 | 0.373 | (g/PE) |
| Emissions of N2 | 5.977 | 5.216 | 4.745 | (g/PE) |
| Electricity consumption | 0.035 | 0.035 | 0.033 | (kWh/PE) |
| Secondary clarification | ||||
| Emissions of CO2 | 1.452 | 1.452 | 1.452 | (g/PE) |
| Effluent | ||||
| Discharge of CODex | 2.172 | 2.172 | 2.172 | (g/PE) |
| Discharge of Ntotal,ex | 1.145 | 1.145 | 1.146 | (g/PE) |
| Discharge of Ptotal,ex | 0.160 | 0.160 | 0.160 | (g/PE) |
| Anaerobic digestion | ||||
| Electricity consumption | 0.011 | 0.011 | 0.011 | (kWh/PE) |
| Cogeneration unit | ||||
| Emissions of CO2 | 37.392 | 54.169 | 53.924 | (g/PE) |
| Emissions of CH4 | 0.145 | 0.210 | 0.209 | (g/PE) |
| Electricity yield | 0.040 | 0.058 | 0.058 | (kWh/PE) |
| Dewatering | ||||
| Emissions of CH4 | 0.481 | 0.697 | 0.694 | (g/PE) |
| Electricity consumption | 0.030 | 0.030 | 0.030 | (kWh/PE) |
| Sludge disposal | ||||
| Amount of stabilized sludge for disposal | 8.909 | 12.563 | 12.342 | (g/PE) |
| PN/A process | ||||
| Emissions of CO2 | - | - | 2.235 | (g/PE) |
| Emissions of N2O | - | - | 0.036 | (g/PE) |
| Emissions of N2 | - | - | 1.030 | (g/PE) |
| Electricity consumption | - | - | 0.00043 | (kWh/PE) |
Publisher’s Note: MDPI stays neutral with regard to jurisdictional claims in published maps and institutional affiliations. |
© 2021 by the authors. Licensee MDPI, Basel, Switzerland. This article is an open access article distributed under the terms and conditions of the Creative Commons Attribution (CC BY) license (https://creativecommons.org/licenses/by/4.0/).
Share and Cite
MDPI and ACS Style
Paulu, A.; Bartáček, J.; Šerešová, M.; Kočí, V. Combining Process Modelling and LCA to Assess the Environmental Impacts of Wastewater Treatment Innovations. Water 2021, 13, 1246. https://doi.org/10.3390/w13091246
AMA Style
Paulu A, Bartáček J, Šerešová M, Kočí V. Combining Process Modelling and LCA to Assess the Environmental Impacts of Wastewater Treatment Innovations. Water. 2021; 13(9):1246. https://doi.org/10.3390/w13091246
Chicago/Turabian StylePaulu, Aleš, Jan Bartáček, Markéta Šerešová, and Vladimír Kočí. 2021. "Combining Process Modelling and LCA to Assess the Environmental Impacts of Wastewater Treatment Innovations" Water 13, no. 9: 1246. https://doi.org/10.3390/w13091246
Note that from the first issue of 2016, this journal uses article numbers instead of page numbers. See further details here.