
Construction of Ecological Network Based on Multi-Scale Conversion and Nesting
by
 ,
,
Haoran Yu
1 ,
,
Yongzheng Wang
1,2,*,
Chan Eme
3,
Xin Fan
3,
Yuejing Rong
4,5,
Qiang Zhang
1 and
Zhe Liang
1 1
School of Architecture and Planning, Anhui Jianzhu University, Hefei 230022, China
2
Anhui Urbanization Development Research Center, Hefei 230022, China
3
School of Public Administration, China University of Geosciences (Wuhan), Wuhan 430074, China
4
State Key Laboratory of Urban and Regional Ecology, Research Center for Eco-Environmental Sciences, Chinese Academy of Sciences, Beijing 100085, China
5
University of Chinese Academy of Sciences, Beijing 100049, China
*
Author to whom correspondence should be addressed.
Water 2021, 13(9), 1278; https://doi.org/10.3390/w13091278
Submission received: 27 March 2021
/
Revised: 23 April 2021
/
Accepted: 28 April 2021
/
Published: 30 April 2021
(This article belongs to the Special Issue Optimal Utilization and Management of Natural Resources)
Abstract
:Ecological protection and the restoration of full-array ecosystems is an important part of ecological civilization construction, which is a powerful measure to implement the concept of green development and help bridge the gap between the respective inevitable requirements of the current ecological environment and economic development. To solve this problem, a multi-scale index system was constructed to identify ecological sources comprehensively. The minimum-cost path method, the circuit theory, and the cyclic window search method were adopted to quantitatively identify the important ecological sources and corridors in scale nesting and pinch points and barrier points that affect multi-level connectivity. Furthermore, the specific optimization layout strategy of the ecological network structure of the Hefei metropolitan area was proposed. According to the results, if ecological sources and corridors at two scales are overlaid, the coincident area of ecological sources at two scales is 1719.95 km2. As important ecological sources, Chaohu Lake Basin, Niuwangzhai, and Wuding Mountain, which are important areas to maintain the ecological network, need to be protected. Ten overlapping ecological corridors, which are mainly distributed in Changfeng County, are easily damaged long term. As a result, ecological nodes should be set up as temporary habitats for species transfer. In addition, based on the circuit theory and the cyclic window search method, calculating areas of pinch points at two scales yields 1637.75 km2 and 434.22 km2, respectively, and for areas of barrier points yields 2182.75 km2 and 126.97 km2, respectively. The ecological pinch points at two overlapping scales among them are important areas for future protection. Due to the small and fragmented spatial distribution in the urban area, pinch points with an average size of 0.58 km2 are easy to be restored and will greatly improve the connectivity of the ecological network after restoration. Furthermore, through the quantitative identification of ecological network elements of two scales, the paper puts forward an optimization strategy for an ecological network in the Hefei metropolitan area from three aspects of “point-line-polygon.” The research results can reference decision-making concerning the delineation of urban growth boundary, regional ecological security pattern, land space renovation, and ecosystem restoration.
1. Introduction
The rapid development of urbanization caused an increasingly intense contradiction between economic development and ecological conservation. Ecological systems like forests, waters, and wetlands were destroyed, causing habitat quality to deteriorate and biodiversity decline. On the other hand, people have higher needs for life due to economic development and new demands for ecosystem services. The ecological security pattern, the bridge between ecosystem services and societal development, is regarded as a crucial strategic tool to guarantee regional ecological security and increase well-being [1,2]. The planning of ecological security pattern (ESP) has become a key point for Chinese governments at all levels to ensure the sustainable development of the regional economy and coordinate the relationship between ecosystems and economic society. Moreover, it is regarded as a fundamental and crucial method to achieve regional ecological security and one of the strategic modes for national land development and protection [2,3]. Ecological protection and the restoration of full-array ecosystems is an important part of ecological civilization construction, which is a powerful measure to implement the concept of green development and could also solve the current ecological environment and economic development between the inevitable requirements.
In recent years, domestic and foreign scholars have constructed multi-scale ecological networks in local areas, cities, and even regions by MCR (minimum cumulative resistance), MSPA (morphological spatial pattern analysis), the circuit theory, and other methods or models from the perspective of urban planning, urban ecology, geography, landscape ecology [4,5,6,7,8,9,10]. Relatively, a large number of studies have provided mature methods and planning models for the construction of ecological networks, which are regarded as an important basis for constructing the ecological security pattern and the strategic deployment of ecological planning [9]. However, only a single scale was taken in most of the existing studies as the research perspective and the research units were relatively closed. As a result, some problems and deficiencies remained [7,9,10,11]. For example: (1) The single-scale ecological network rarely involves extraterritorial effects of “pattern–process” mutual feedback, which will ignore the interaction between ecosystem services of different scales [3,4,10]; (2) There is a lack of exploration and discussion on the characteristics of network nesting patterns, scale conversion rules, and interaction relationships among multi-scales [11]. In the hierarchical theory of landscape ecology, system process and property belonging to a certain scale are subject to such scales, and it is difficult for research results to be transferred between the different scales [11,12]. Only when the scale selection is consistent with the structure and function of the ecosystem can the “pattern–process” law be revealed correctly, and ecological problems can therefore be addressed effectively [12,13]. In the process of transformation from the large to medium or small scale, the proportion of natural components of the ecological network will decrease, and the proportion of artificial composition will increase accordingly. Based on this trend, we can judge and understand structural network patterns of different scales and correctly grasp the connection model between the main structure of the upper and lower levels in scale nesting. By organizing the connection elements between scales to construct the ecological network system, we cannot only maintain the pattern characteristics of the ecological network within each limited scale, but also ensure the effective connection of the ecological network between scales, so that the ecological network has greater stability and resilience [14]. The construction of a traditional ecological network constructs the ecological network locally, ignoring the structure of scale nesting, the ecological network structure is therefore dislocated in the scale connection of upper and lower levels [15]. As a result, it makes it impossible to use scale deduction for hierarchical linkage to solve the ecological problems at a lower level. On the other hand, it is not conducive for scale generalization to promote regional ecological security [16,17,18]. Therefore, according to the differences in the characteristics and mechanisms of ecological problems in different characteristic scales, a multi-level ecological network is constructed in a targeted manner, and the continuity points and barrier points of the ecological network in the conversion of different scales are found through overlay analysis. The safety pattern is regarded as the framework, practice plan, and restoration strategy are implemented and adjusted at a small scale, the hierarchical nesting structure of the ecological network is therefore optimized, and the organic coupling of structure–process–function for landscape ecology is achieved [15,19,20,21,22,23,24,25].
The Hefei Metropolitan Area is not only a high-level, multi-functional and international opening platform in Anhui Province, and even the central region, but also an important asset for the country to participate in global competition. At present, the natural ecosystem is affected by the rapid expansion of urban construction based on traditional growth, causing its ecological continuity and integrity to be damaged to a certain extent. Various ecological crisis risk factors have increased significantly, and ecological security is still facing threats and challenges. Since the current development context is different from that of the past, it is necessary to ensure high-quality economic development and ecological protection. Therefore, the construction of a two-scale ecological network of the “metropolitan area–city area” to protect the regional ecological security pattern is to ensure its order—and is a necessary condition for development. Based on this, this article takes the Hefei metropolitan area as an example and: (1) Attempts to evaluate the ecological importance of the study area and identify the ecological source from two aspects—the importance of ecosystem services and ecological sensitivity; (2) Uses NPP-VIIRS(NPP-Visible infrared Imaging Radiometer) night light data, the impervious surface and topographical level index modify the landscape resistance surface and use the circuit theory and the moving window search method to quantitatively identify the important transition nodes in the scale nesting, the pinch points, and obstacles that affect the multi-level connection, to build a multi-scale ecological network; (3) Proposes relevant strategies to provide a scientific reference for protecting the ecological safety of the Hefei metropolitan area and promote its sustainable development.
2. Materials and Methods
2.1. The Study Area and Data
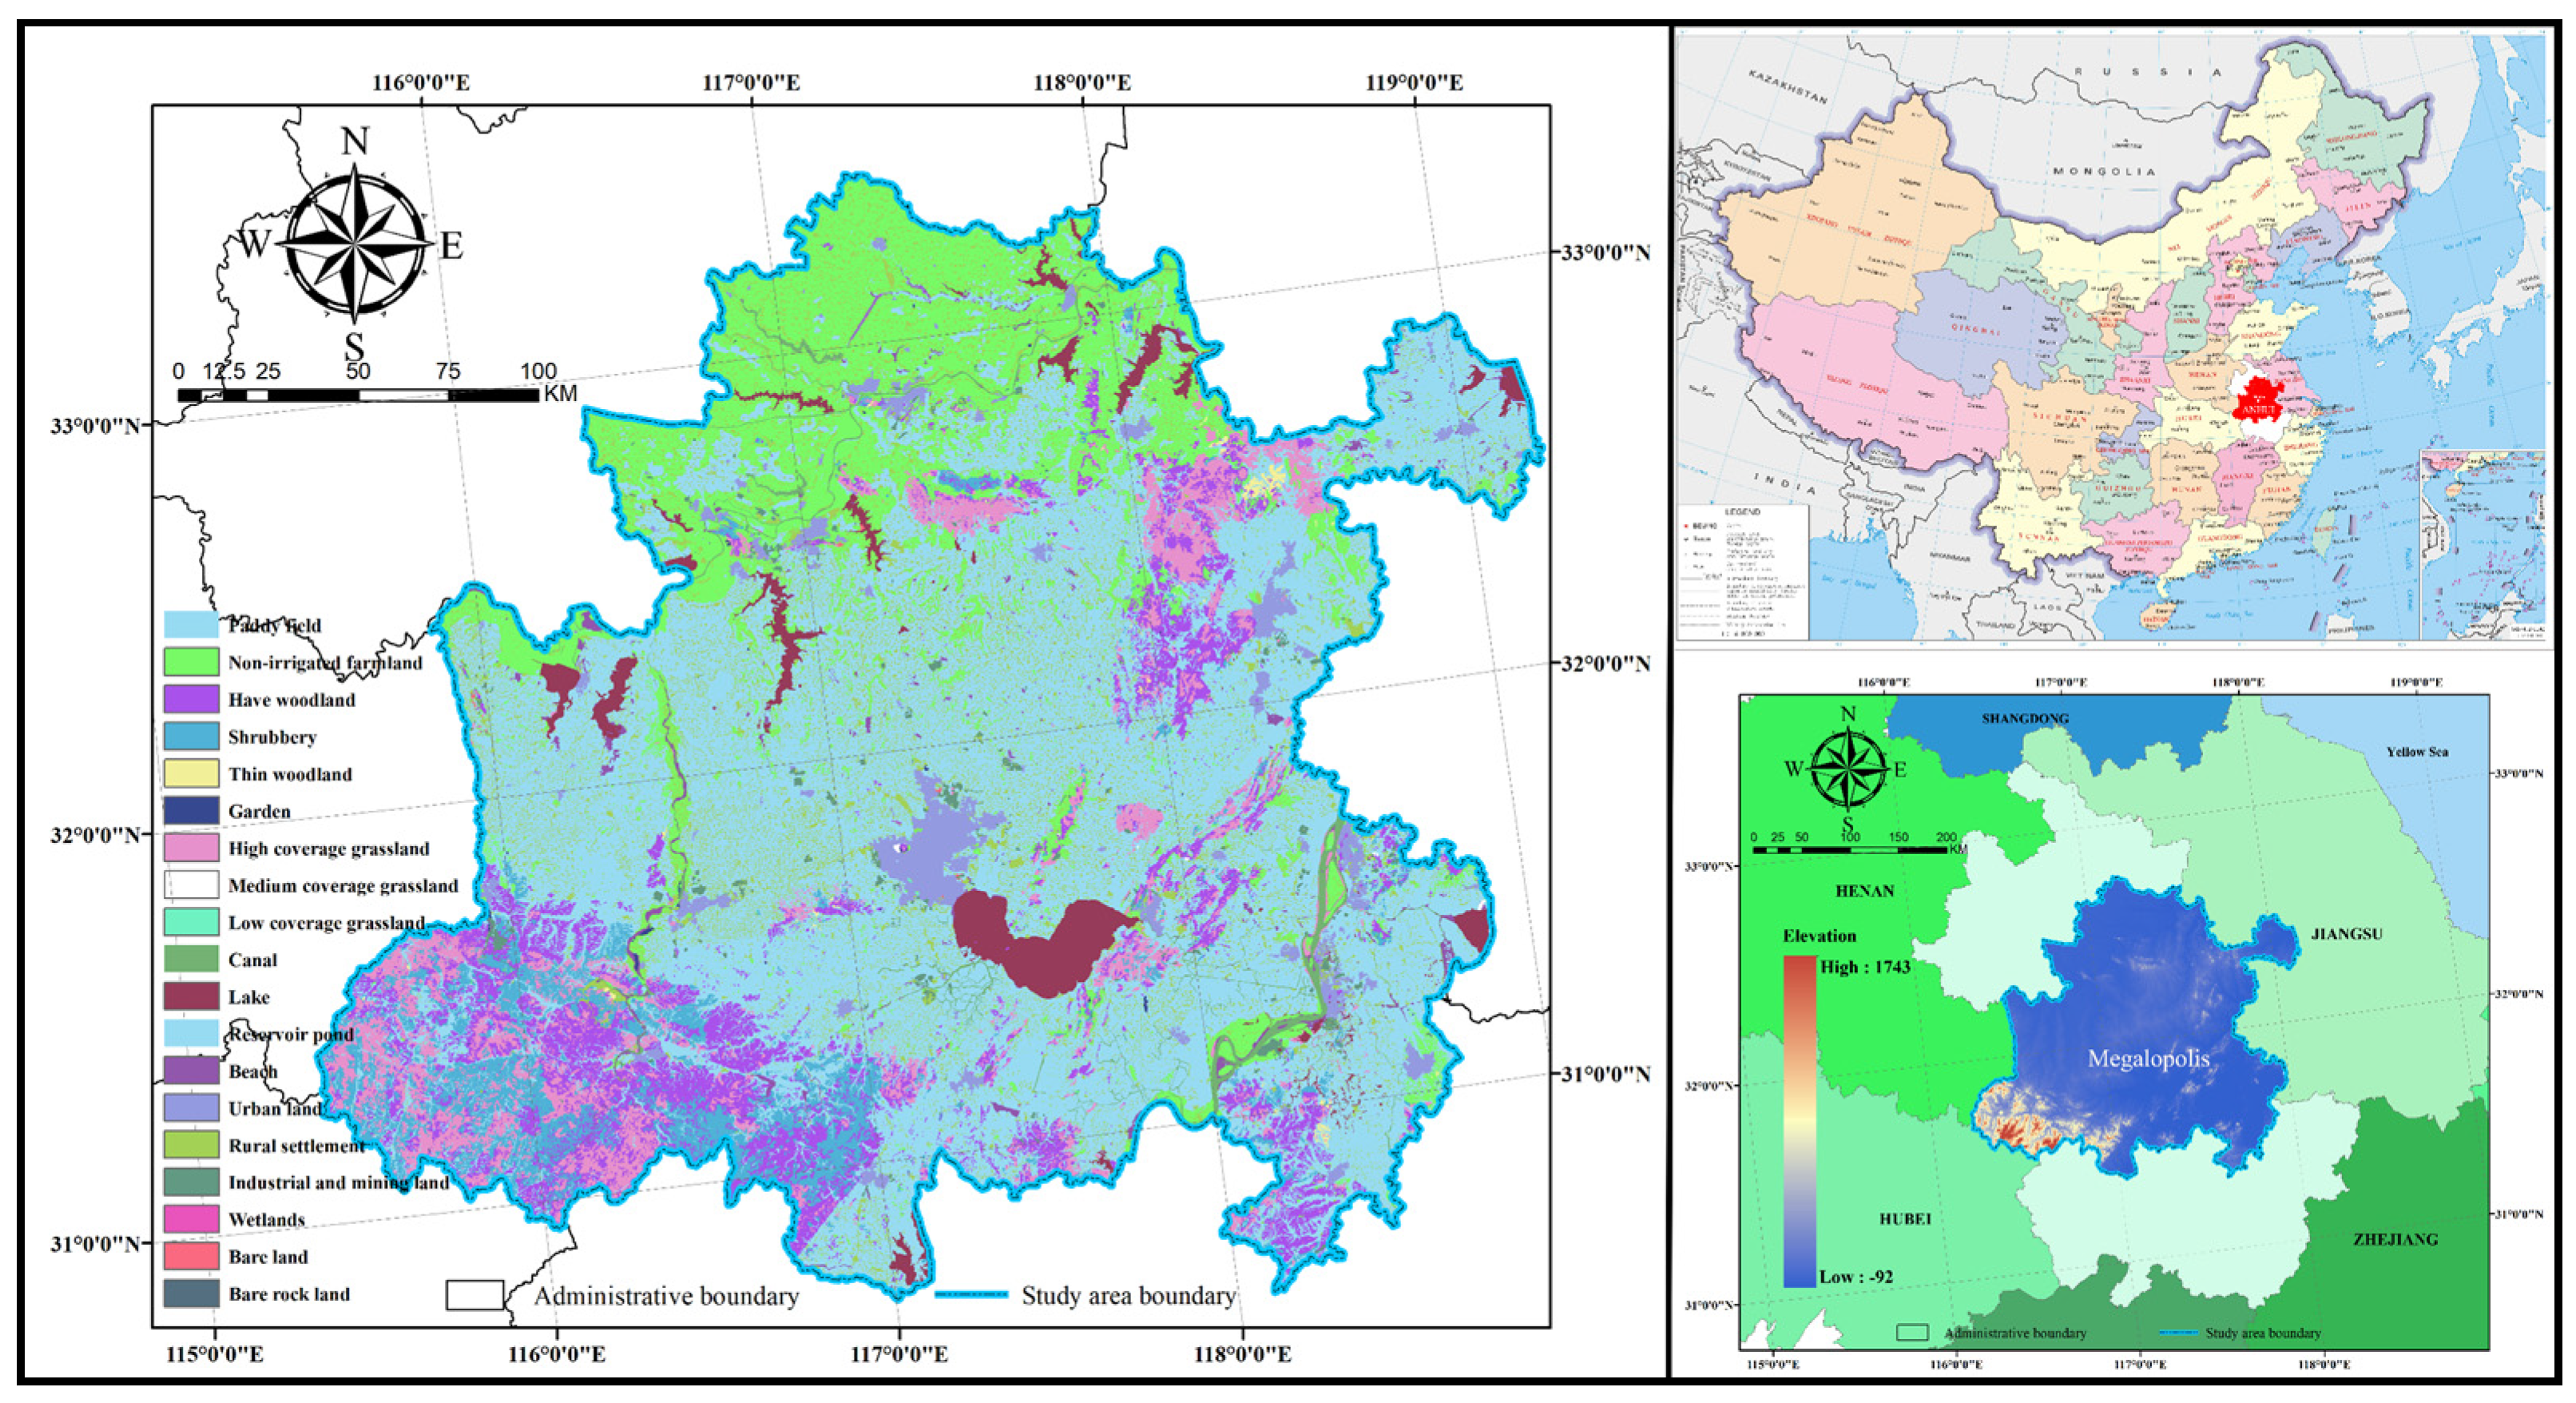
Hefei metropolitan area is located at the western end of the Yangtze River Delta along the middle and lower reaches of the Yangtze River. The land area and the population account for 40.6% and 43.2%, respectively, of the whole province, and the total economy accounts for nearly 59% of the whole province. It is one of the five metropolitan areas in the urban agglomerations of the Yangtze River Delta. Hefei metropolitan area is planned to be an international metropolitan area with strong influence and a core growth pole that supports the development of the whole province. The Dabie mountainous area, as the source of many small and medium-sized rivers in the Yangtze River, in addition to the Huaihe River, Xin’an River systems, and the reservoir water conservation area, as the source of many small and medium-sized rivers and reservoirs of the Yangtze, Huai, and Xin’an River systems, as well as a key area for biodiversity conservation in China, are currently facing serious soil erosion problems. Due to lake reclamation, environmental pollution, infrastructure construction, and urbanization, the biodiversity maintenance and flood regulation functions of many wetlands have been weakened. It is an urgent problem to solve how the issue of maintaining and improving the ecological service capacity of the Hefei metropolitan area to ensure regional ecological security; however, the multi-scale ecological network planning has provided an effective solution. Therefore, it has a certain degree of representativeness to take the Hefei metropolitan area as a research area and has demonstrative significance for urban sustainable construction and ecological space optimization in other areas with a damaged ecological environment. The geographical location and elevation of the study area are shown in Figure 1.
The data used in this study mainly include land use data with a resolution of 30 m and NDVI(Normalized Difference Vegetation Index) data with a resolution of 1 km in the study area in 2018, were obtained the Resource and Environmental Science Data Center of the Chinese Academy of Sciences (http://www.resdc.cn/, accessed on 20 May 2020). Elevation data (DEM) were obtained from the website of Geospatial Data Cloud (http://www.gscloud.cn/, accessed on 20 October 2018). The meteorological data, such as rainfall and temperature in the study area from 1980 to 2017, were obtained from Anhui Surface Climate Data Monthly Value Data Set of the website of China Meteorological Data Network (http://data.cma.cn/, accessed on 20 May 2020). The actual evapotranspiration data, with 30 m precision through ArcGIS10.6 (Esri, https://www.esri.com/en-us/home) Kriging interpolation of the Hefei metropolitan area, were quoted from the National Qinghai–Tibet Plateau Scientific Data Center (http://data.tpdc.ac.cn/zh-hans/, accessed on 20 May 2020). The relevant soil data of the Hefei metropolitan area is quoted from China Soil Data Collection (1: 1 million) of the World Soil Database (HWSD), which can be found in the International Food and Agriculture Organization (FAO) (http://www.fao.org/, accessed on 13 July 2019). The night light data in 2018 and the national terrestrial ecosystem classification were, respectively, obtained from the National Oceanic and Atmospheric Administration and the China Terrestrial Ecosystem Database (http://www.ecosystem.csdb.cn/, accessed on 13 July 2019). Relevant planning texts and other data of the research area were obtained from government departments. With the support of ArcGIS 10.2 software, all spatial data were unified into Albers Conic Equal Area (Albers Conic Equal Area) and then resampled into 30 m × 30 m grid unit size for calculation. Detailed descriptions of the research data are shown in Table 1.
2.2. Research Method
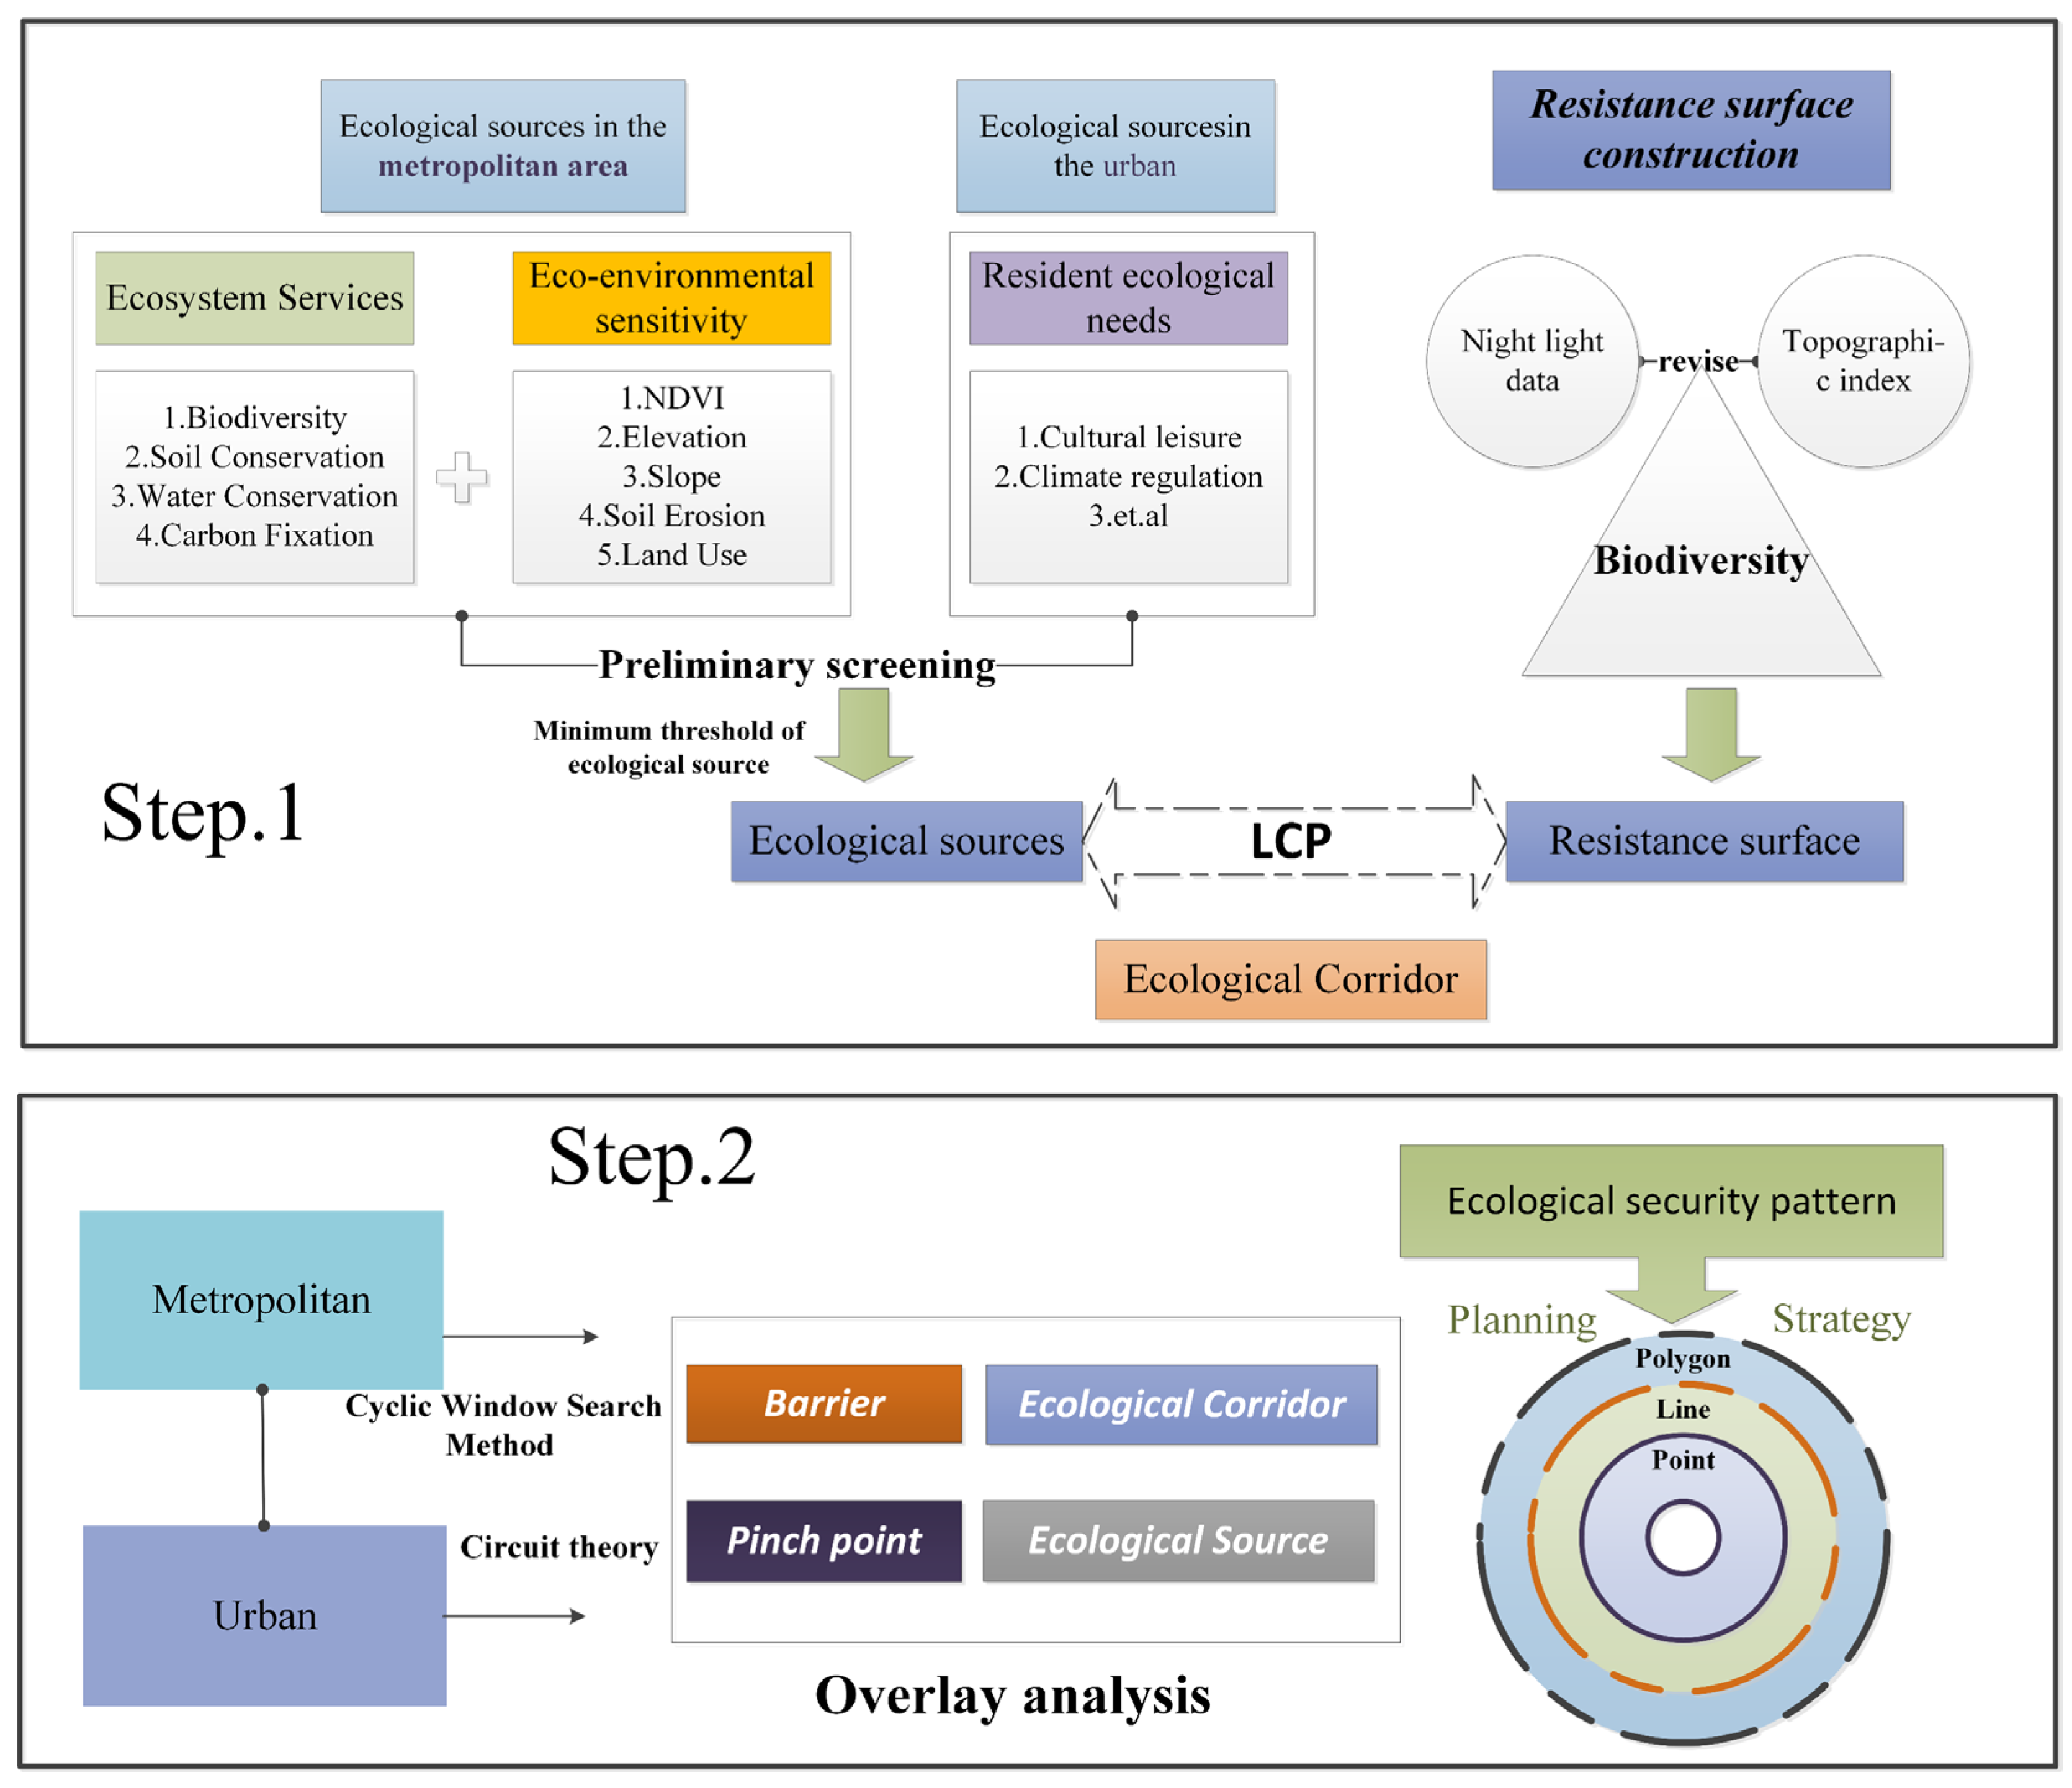
Ecological security patterns of different scales do not exist independently but are connected and influenced by each other, and certain scale feature boundaries for some ecosystem services are relatively obscure [17]. For example, ecosystem services, such as water conservation and biodiversity, may have similar spatial scale features and ecosystem structures, and function at both the metropolitan and urban scales [18]. Therefore, it is necessary to select the ecological sources of the Hefei metropolitan area and urban area based on the actual situation of the study area and considering its functional positioning at different scales. Then, according to different scales, the corresponding identification methods of ecological sources were constructed to provide favorable spatial support for the ecological process behind the stable network pattern [19]. The research method consists of three parts: the comprehensive identification of ecological sources; the ecological network construction; and the nesting optimization of a multi-scale ecological network. The technical roadmap is shown in Figure 2.
2.2.1. The Comprehensive Identification of Ecological Sources
On the scale of the metropolitan area, the construction of an ecological network should be combined with the actual situation of the region and the ecological service functions to select appropriate ecological source evaluation indicators. According to related studies [16,17,18] and the function positioning of ecological service for the Hefei, Metropolitan Area clarified in the Guidelines for Delineation of Ecological Protection Red Lines in Anhui Province, four types of ecosystem service functions including water conservation, biodiversity maintenance, water and soil conservation, carbon fixation and oxygen release, as well as water and ecological environment-sensitive evaluation factors such as soil erosion and plant cover, are regarded as ecological source selection indicators. After using ArcGIS 10.2 tools, the extremely important ecosystem service functions and the extremely sensitive ecological environment were superimposed and the ecological source was extracted. By comparing and analyzing the contribution of ecological sources, the minimum threshold for selecting the area of ecological sources was determined and then checked with various protected land to obtain the ecological sources of the Hefei metropolitan area. The specific index selection and calculation formula are shown in Table 2 and Table 3.
In terms of the Hefei urban area, the main consideration is the urban climate regulation, cultural leisure, and improvement of the living environment, and other ecosystem service functions. Based on the macro-scale ecological evaluation, natural reserves, large reservoirs, forest parks, and wetlands in the urban area are included in the source selection set, combined with the Hefei City Ecological Network Planning, and the ecological sources at the scale of the urban area are obtained after revision.
2.2.2. Construction of Ecological Network
(1) Construction and Optimization of Landscape Resistance Surface
The difficulty of species movement in patches of different habitats is reflected by the setting of resistance surfaces, which describe the impact of landscape heterogeneity on the flow of ecological processes [25]. The resistance value is not only related to the distance between ecological sources but is also related to land use and human disturbance. For example, human activities may harm the material circulation and the energy exchange between different landscape patches. Therefore, the traditional resistance surfaces cannot accurately simulate the distribution of resistance surfaces, because they mainly simulate the ecological resistance of patches based on land use. Generally speaking, the higher the habitat quality in the area, the more complex the biodiversity and the smoother the migration of species in the area [26,27]. Referring to the related studies [10,28,29,30] and taking the actual situation of the Hefei metropolitan area into account, this paper simultaneously uses luminous data and the terrain location index as correction factors to construct the resistance surface of the Hefei metropolitan area through the reciprocal of the quality of human settlements. Luminous data can indicate the intensity of human activity. The influence of topography on land use changes is the result of the full effects of different topography factors, while a single topography factor cannot fully reflect the impact of topography. The topographic index, combining elevation and slope to analyze the impact of terrain gradient on land use, is currently a widely used method. Considering that the value may appear to be zero, the data are processed into non-zero values without affecting the composition of actual resistance surfaces:
In the formula, represents the resistance value after the calibration of each grid in the study area. represents the initial resistance value constructed based on the reciprocity habitat quality. represents the night light index. represents the topographic position index. and , respectively, represent the elevation value of any grid and the average elevation value of the study area. and , respectively, represent the gradient value of any grid and the average gradient value of the study area.
(2) Identification of Ecological Network and Key node based on Circuit Theory
The connectivity model of the circuit theory defines the movement behavior of the species based on the random walk theory. According to the model, there is a lack of foreknowledge about the landscape traversed for the species. Therefore, the optimal path may not be chosen because there are multiple paths to choose from, and the random walk hypothesis may be more in line with the behavioral characteristics of the organism [31,32,33]. Based on the LCP(least-cost path) method, the Linkage Mapper Tool, (https://circuitscape.org/linkagemapper/) is utilized to extract corridors of least resistance for species migration and diffusion on ArcGIS 10.2. The width of ecological corridors and the potential ecological corridors is set as 5000 weighted-cost distance and 20,000 weighted-cost distance, respectively.
According to the circuit theory model, the higher the current density is, the greater the possibility for species to pass through [31,32,33]. Pinch points are important areas that affect regional connectivity; once damaged, they may cause the failure of species migration. By using the Pinchpoint Mapper module in the plug-in of Circuitscape and selecting “All to One” mode and “Pairwise” mode to perform iterative calculations, respectively, the ecological pinch points can be obtained by combining and processing the highest level of the two results according to three categories of Nature Breaks. Barrier points indicate areas with greater resistance to species movement between ecological sources. After removing such areas, it will increase the possibility of connectivity between ecologically important areas. The Barrier Mapper module of the Circuitscape plug-in is used to identify ecological barriers. Through superimposing with the current situation of land use, the intersection condition of land use and infrastructure of the barrier points can be determined.
(3) Construction and Optimization of Multi-scale Ecological Network Nesting Pattern
With the integral and dynamic feature, ecosystem services are generated based on specific ecosystem structures, processes, and functions. Different ecosystem services involve ecological processes of different scales [34,35]. Ecological networks of different scales may form a “multi-scale spatial nesting body” through organic connections [36], which cannot only maintain the dominant regulation of large-scale to small-scale but also transmit ecological efficiency through cross-scale shared key elements [37].
According to the overlay analysis of ecological sources, ecological corridors, pinch points, and barrier points in the multi-scale ecological networks, the nesting relationships and structural characteristics of ecological networks at different scales are determined and explained. The ratio of common ecological elements to higher-level ecological elements is used as the basis for judging the continuation of small-scale versus large-scale functional structures. The higher the proportion of common elements in the structural elements of the higher-level ecological network, the better the functional conductivity of the small-scale to the large-scale ecological network structure, and the greater the support for the regional ecological pattern, and correspondingly, the stronger the improvement effect of small-scale ecological network optimization on a large-scale ecological network. Taking the large-scale ecological network as the framework and carrying out the targeted protection of the ecological elements with a high proportion at a small scale, the optimization and reorganization strategy of the ecological spatial structure elements is proposed from the “point-line-polygon” level to, respectively, promote the construction of a multi-level, complex and networked ecological spatial structure system of the metropolitan area.
3. Results
3.1. The Spatial Distribution Pattern of Ecosystem Services and Ecological Sensitivity Evaluations
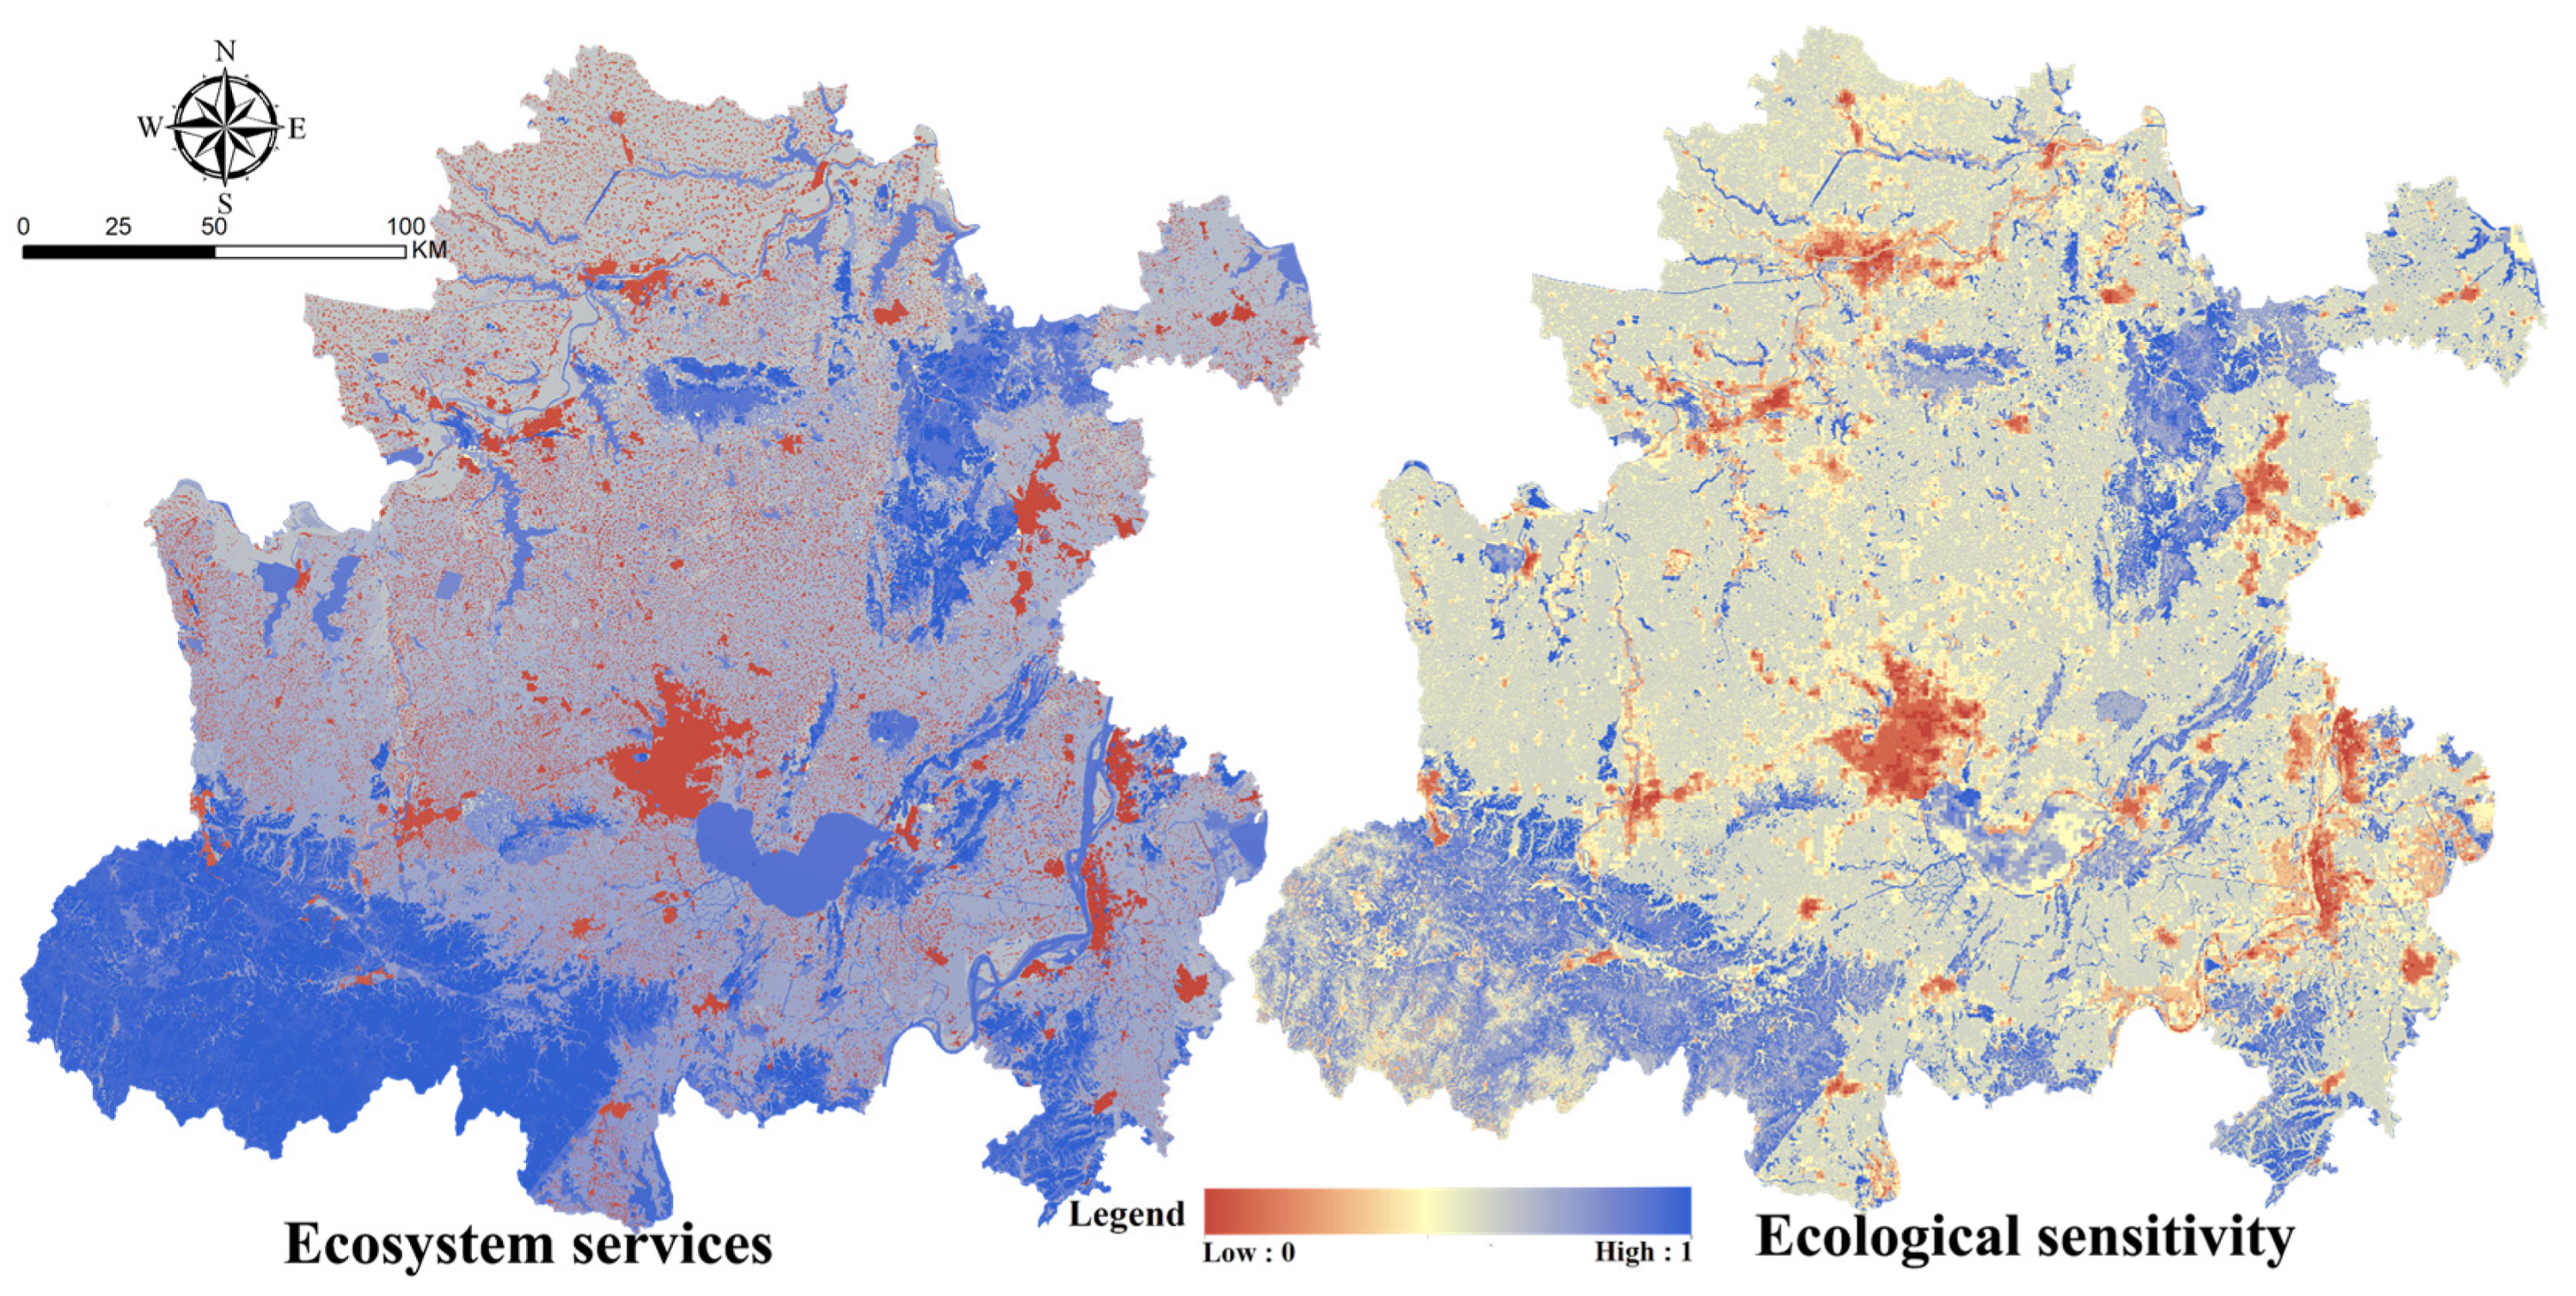
According to the calculation and evaluation of related models, it was found that the ecosystem services and ecological environment sensitivity of the Hefei metropolitan area showed strong spatial heterogeneity in 2018 (Figure 3). The places with high scores for ecosystem services are mainly distributed in Dabie Mountains in the southwest, Chaohu Lake in the middle, and Langya Mountain–Huangfu Mountain in the northeast, most of which are woodland and water area. Ecologically sensitive areas are mainly distributed in the mountains and waters around the mountain–plain interlaced zone in the southwest and the mountainous areas around the urban built-up area.
3.2. Extraction and Verification of Ecological Sources in Metropolitan Areas and Their Distribution
As an important support for the regional ecological security pattern, the ecological network of the metropolitan area is particularly significant for the reliability in determining its ecological sources [31,32,33,34]. Based on the evaluation of the importance of ecological service functions and ecological sensitivity, according to the natural breakpoint classification method of the ArcGIS 10.2 software, it is divided into three categories: unimportant, important, and extremely important. The areas with extremely important ecological service functions and extremely sensitive ecological environments are extracted, superimposed, and combined. It can be found that from the cumulative proportion of ecological element patches of both metropolitan area and urban area to the total area of ecological sources, there are 9010 patches less than 10 km2 in the metropolitan area, accounting for less than 12% of the area of ecological sources. There are 1328 patches less than 5 km2 within the ecological sources of the urban area, with the contribution to the area of the ecological source less than 15%. The size of the area has a decisive effect on the habitat heterogeneity and species carrying capacity, while the scattered and small patches only have a limited impact on maintaining regional ecological security and fulfilling ecosystem functions. Based on the analysis above, the sizes of 10 km2 and 5 km2 were selected as the smallest areas for ecological sources in the metropolitan area and the urban area, respectively, to determine the composition of ecological sources for two scales with the fragmented patches eliminated.
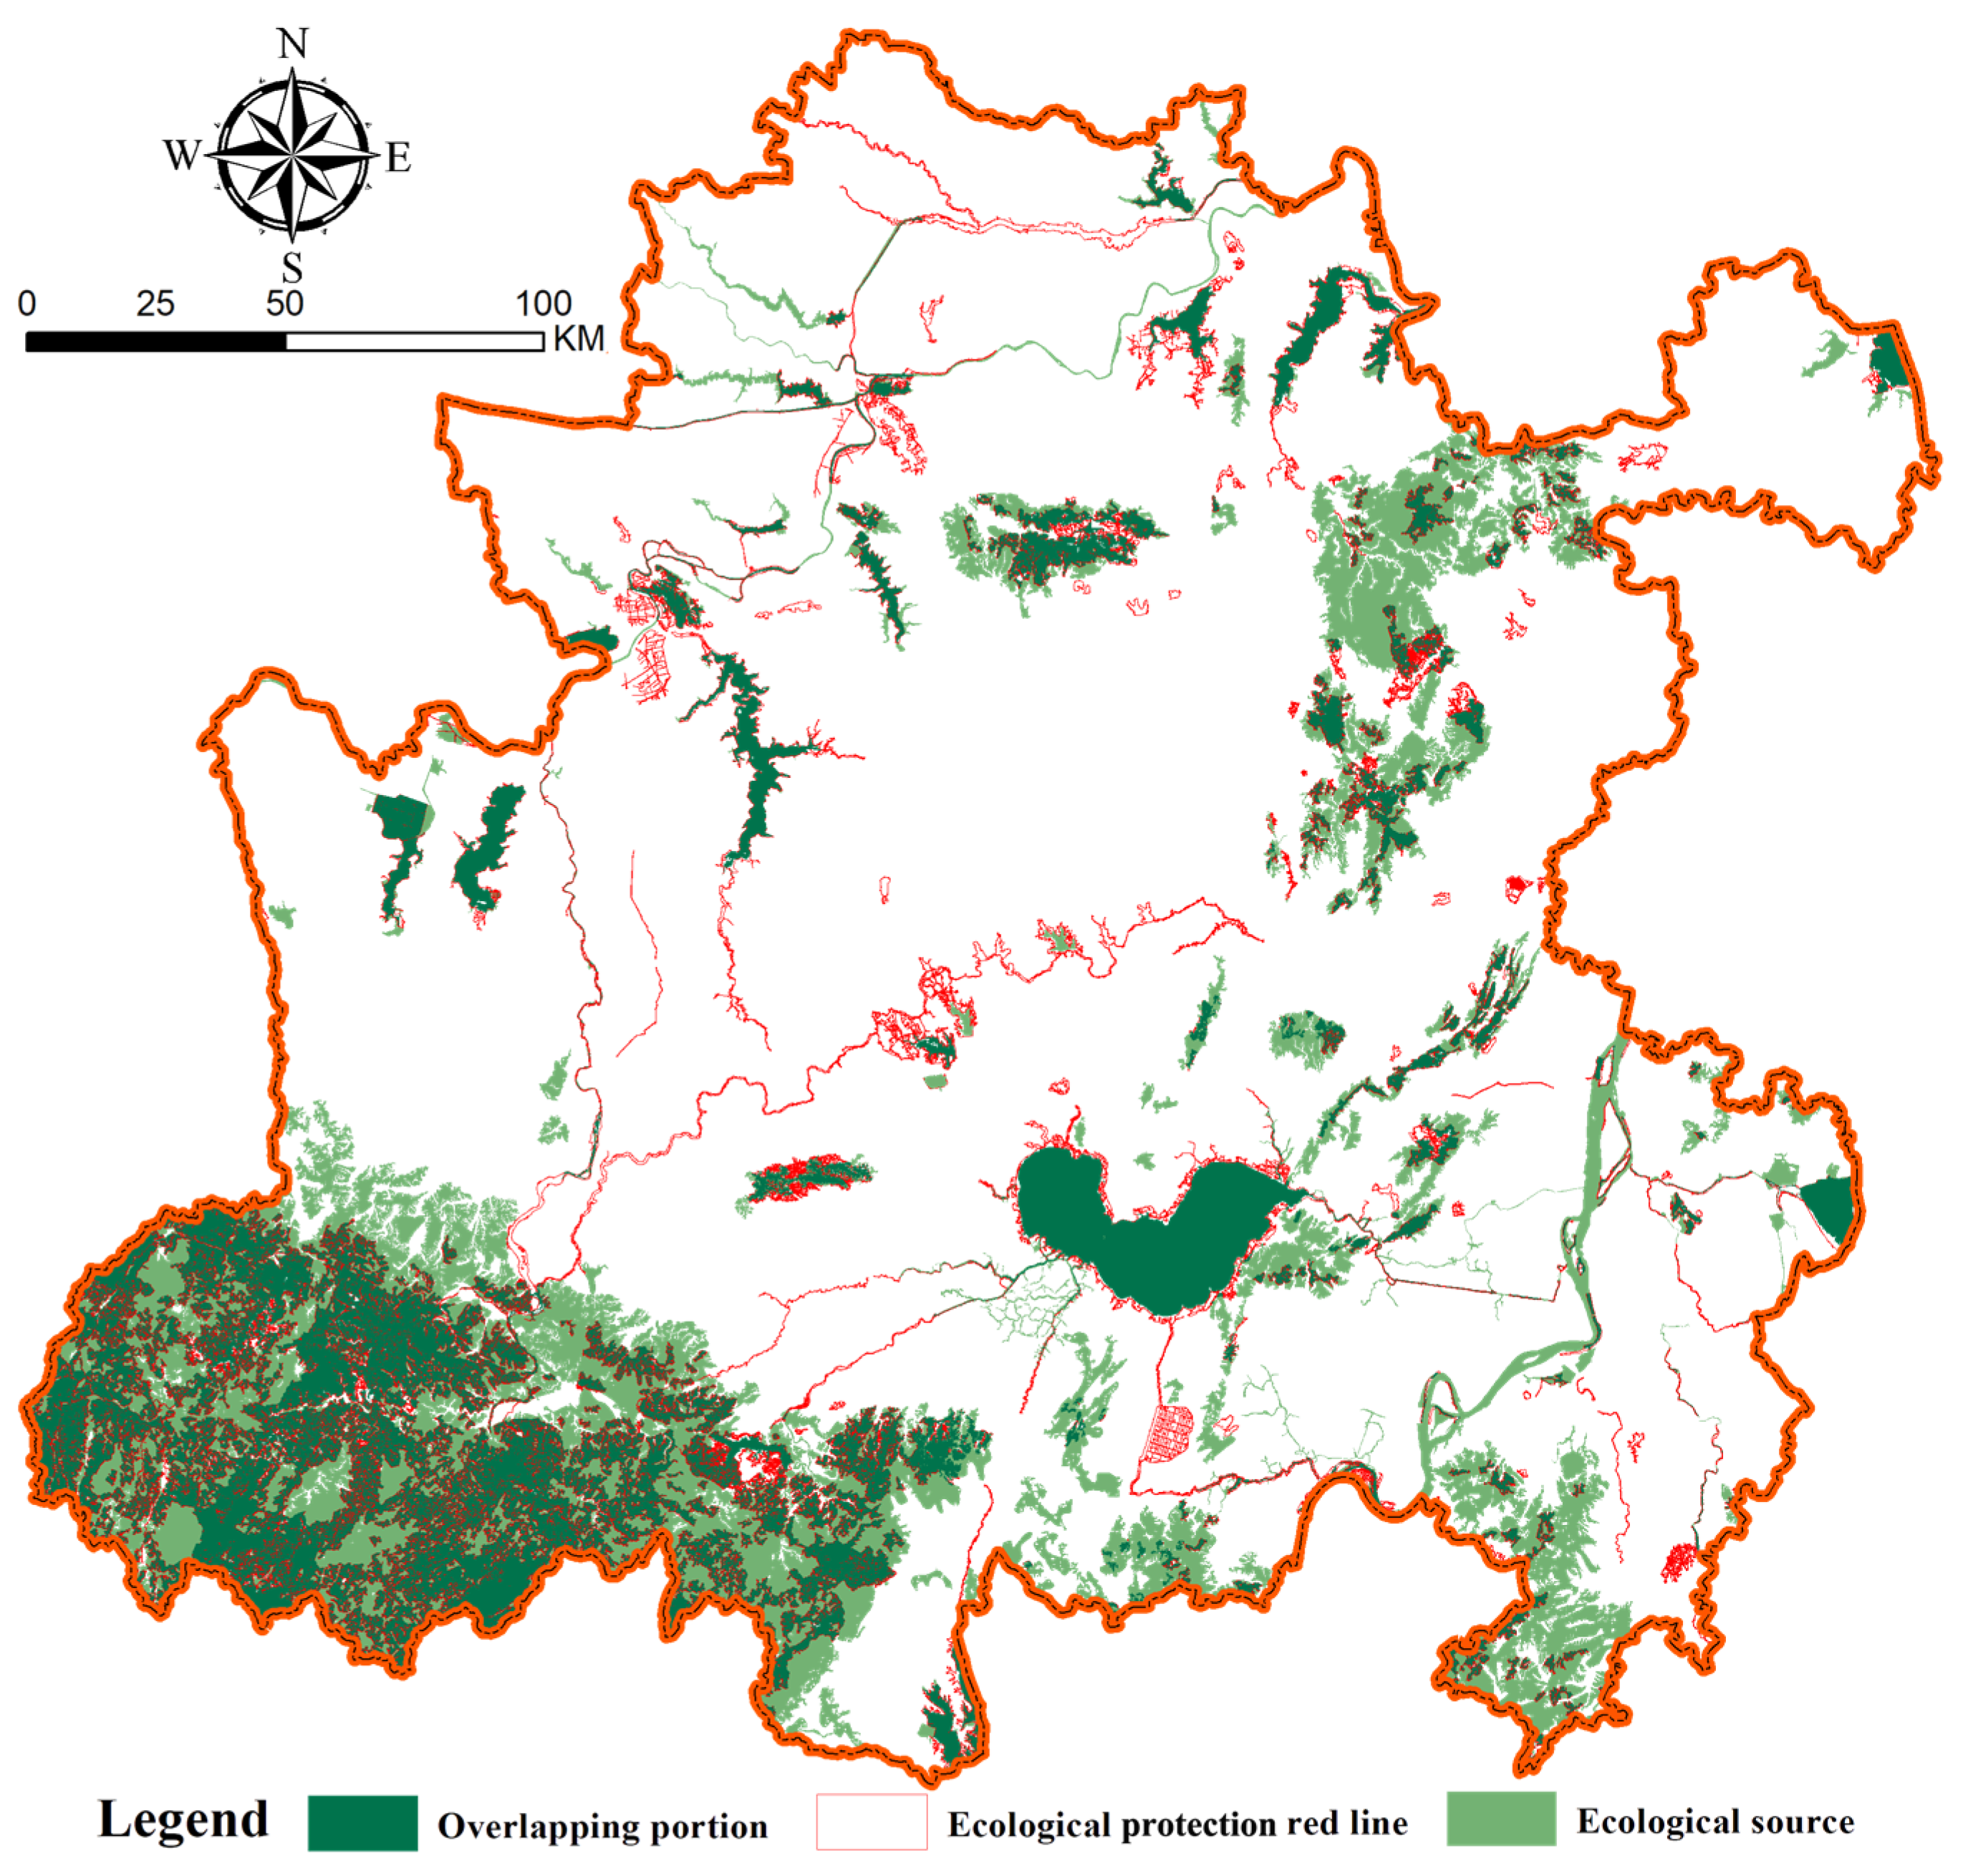
The Ecological Protection Red Line (EPRL) includes the Ecological Red Lines of prohibited development zones, important ecological function areas, sensitive areas, and vulnerable areas. Within such areas, industrialization and urbanization are prohibited to effectively protect the rare, endangered animal and plant species and ecosystems of the country, and to maintain the leading functions of important regional ecosystems. It is an important strategic measure for the Chinese government to build ecological civilization and is of great significance for the sustainable development of territorial space. To verify the scientificity and rationality of the ecological source extraction, the final ecological source was verified with the EPRL in the urban area of Hefei, as shown in Figure 4. The total area of the EPRL and the ecological sources in the Hefei metropolitan area is 8189.2 km2 and 15,538.74 km2, respectively. According to the spatial overlay analysis of the two areas, the overlapping part is 7094.86 km2, accounting for 86.6% of the total area of the EPRL. It can be seen that the mining of ecological sources is scientific and practical, which plays an important role in maintaining regional ecological security.
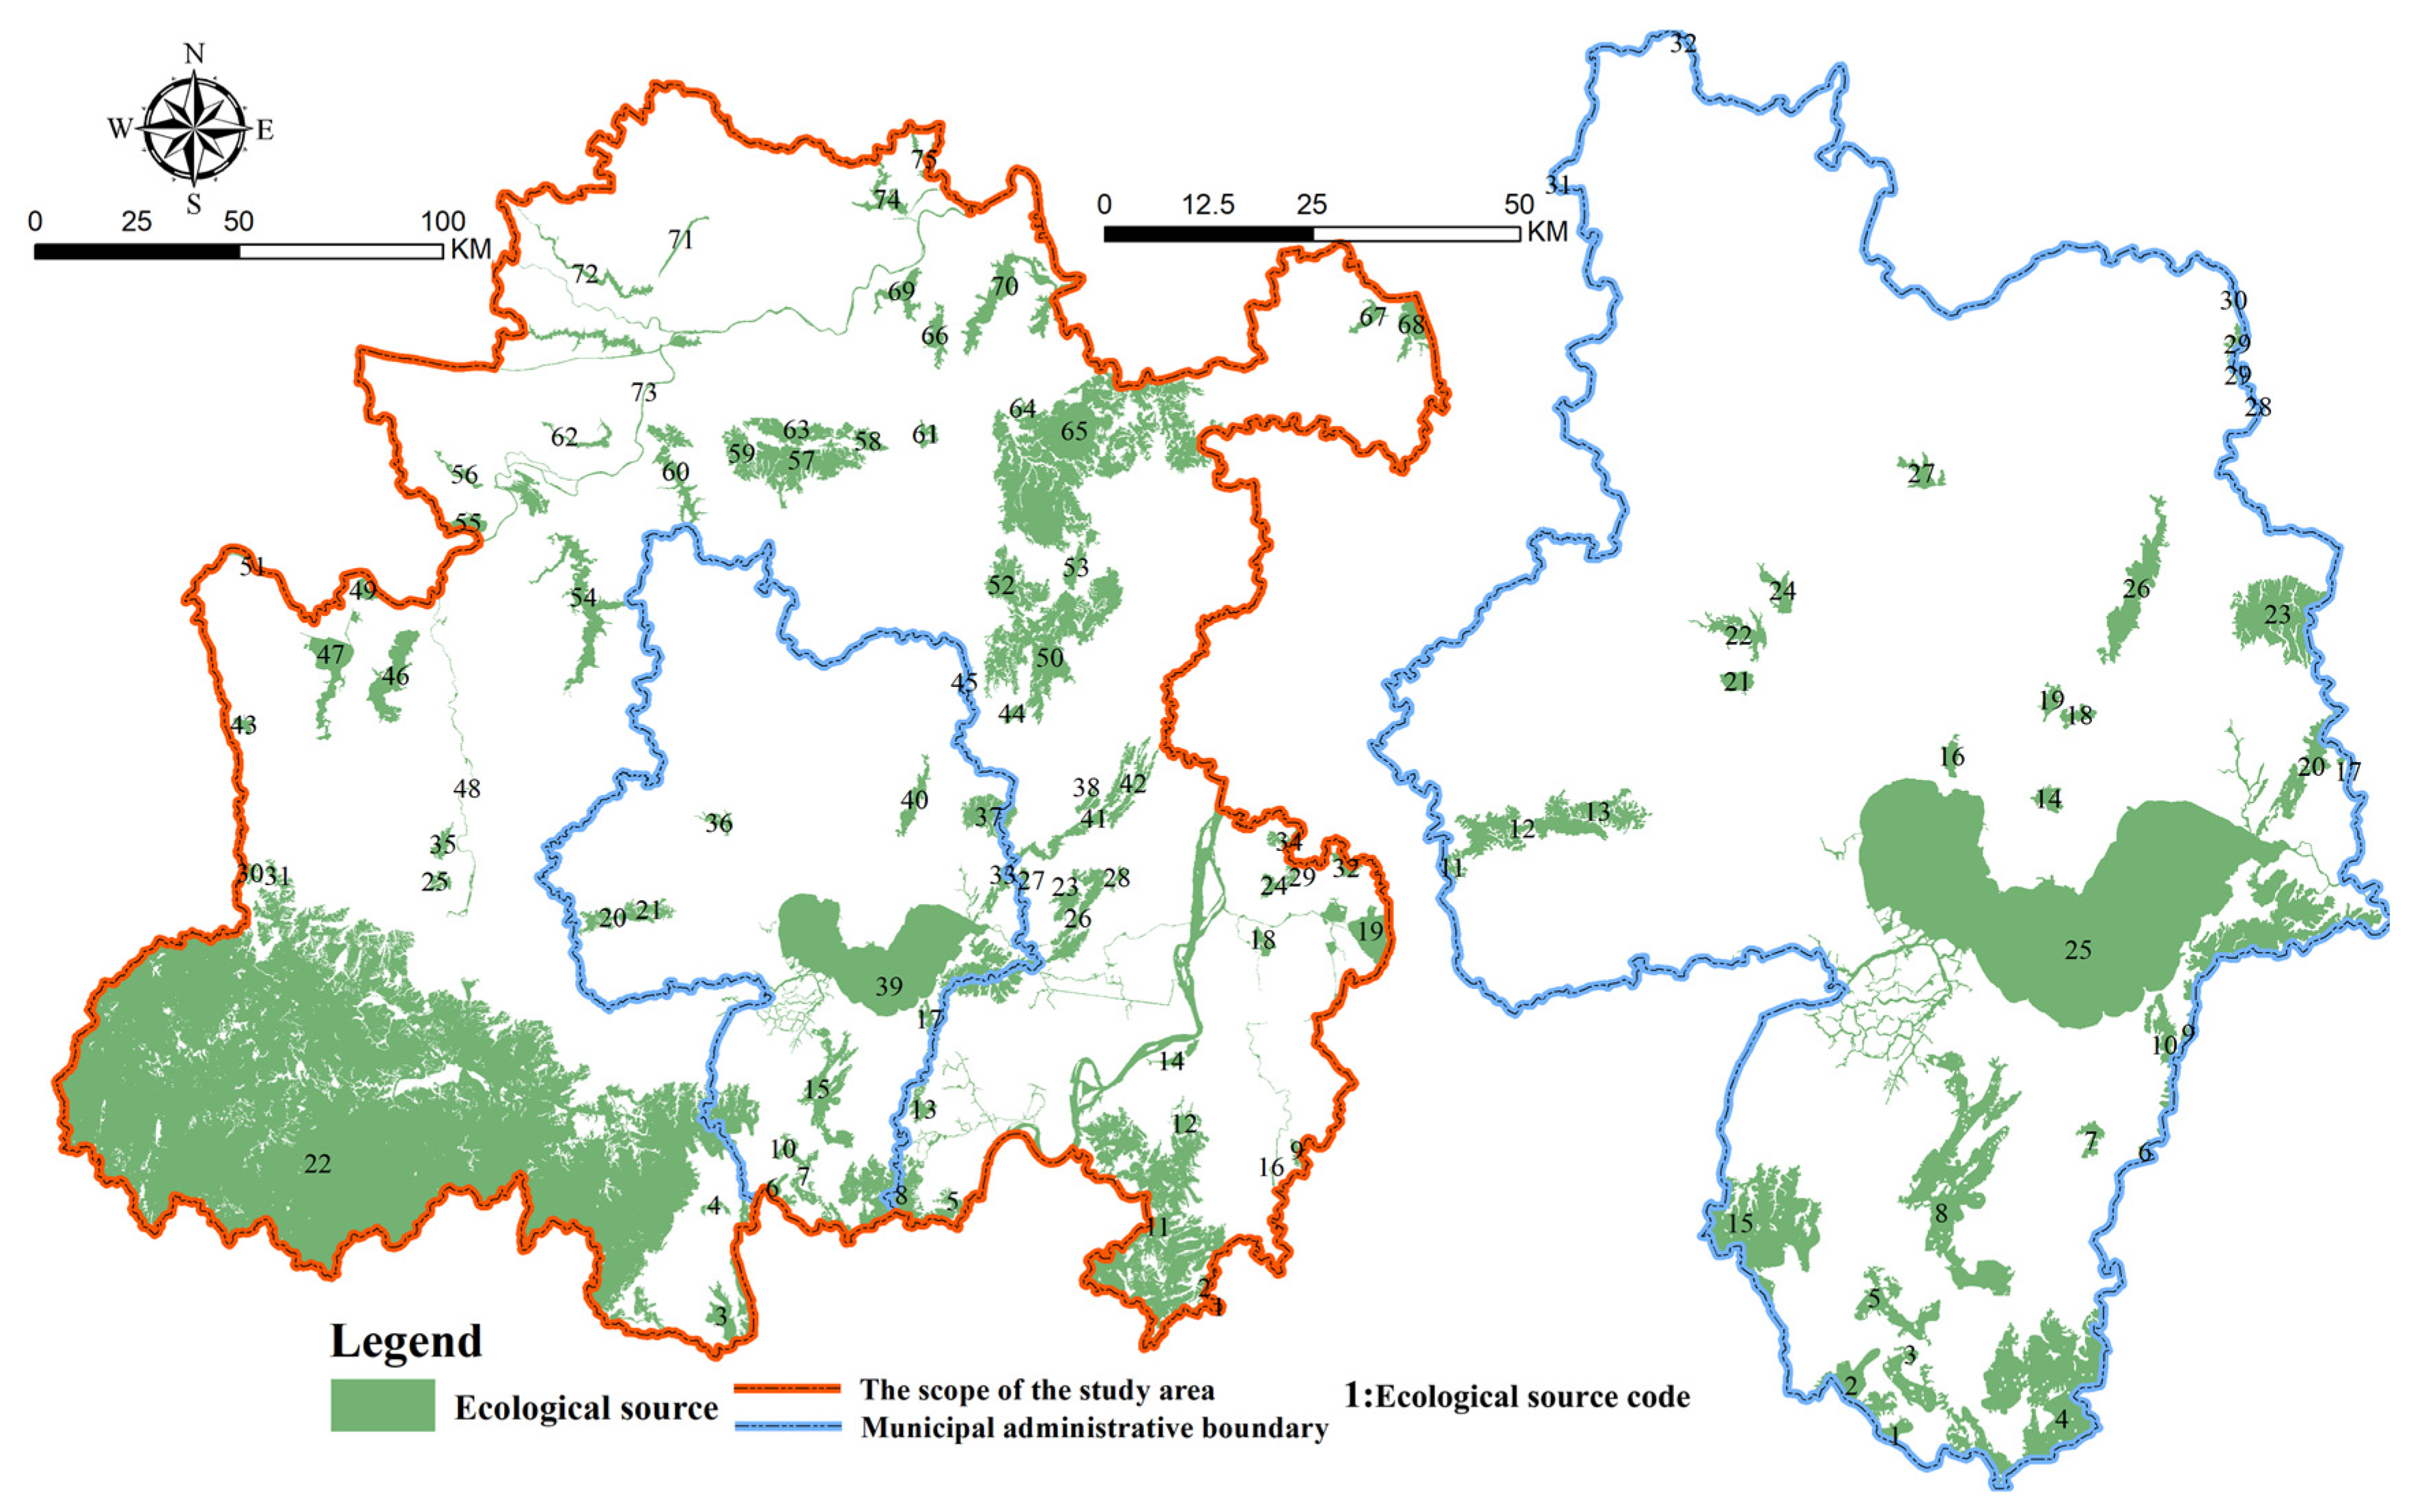
Based on the selection criteria of the ecological sources in the metropolitan area, combined with the ecological network planning of the Hefei urban area, sources larger than 5 km2 are selected as the ecological sources in this study. Except for the Chaohu Lake, the patches in the urban area are all small and scattered, forming a patch distribution centered on Chaohu Lake. From the perspective of administrative divisions, Chaohu City at the county level occupies most of the water area of Chaohu Lake, making it the administrative unit with the largest ecological source area in the city—followed by Lujiang County, with Chaohu Lake in the north, Yefu Mountain and Huangpi Lake in the middle, Niuwangzhai in the west, and Wuding Mountain in the south. Within the area, the mountains and rivers are criss-crossed and the ecosystem is stable. However, within the urban area, Changfeng County has the most deficient ecological sources due to its development orientation designed early by Hefei city, namely, the heavy industry and high energy-consuming industry. It urgently requires environmental improvement and ecological restoration. The distribution pattern of ecological sources in metropolitan areas and urban areas is shown in Figure 5.
3.3. Establishment of the Minimum Cumulative Landscape Resistance Surface
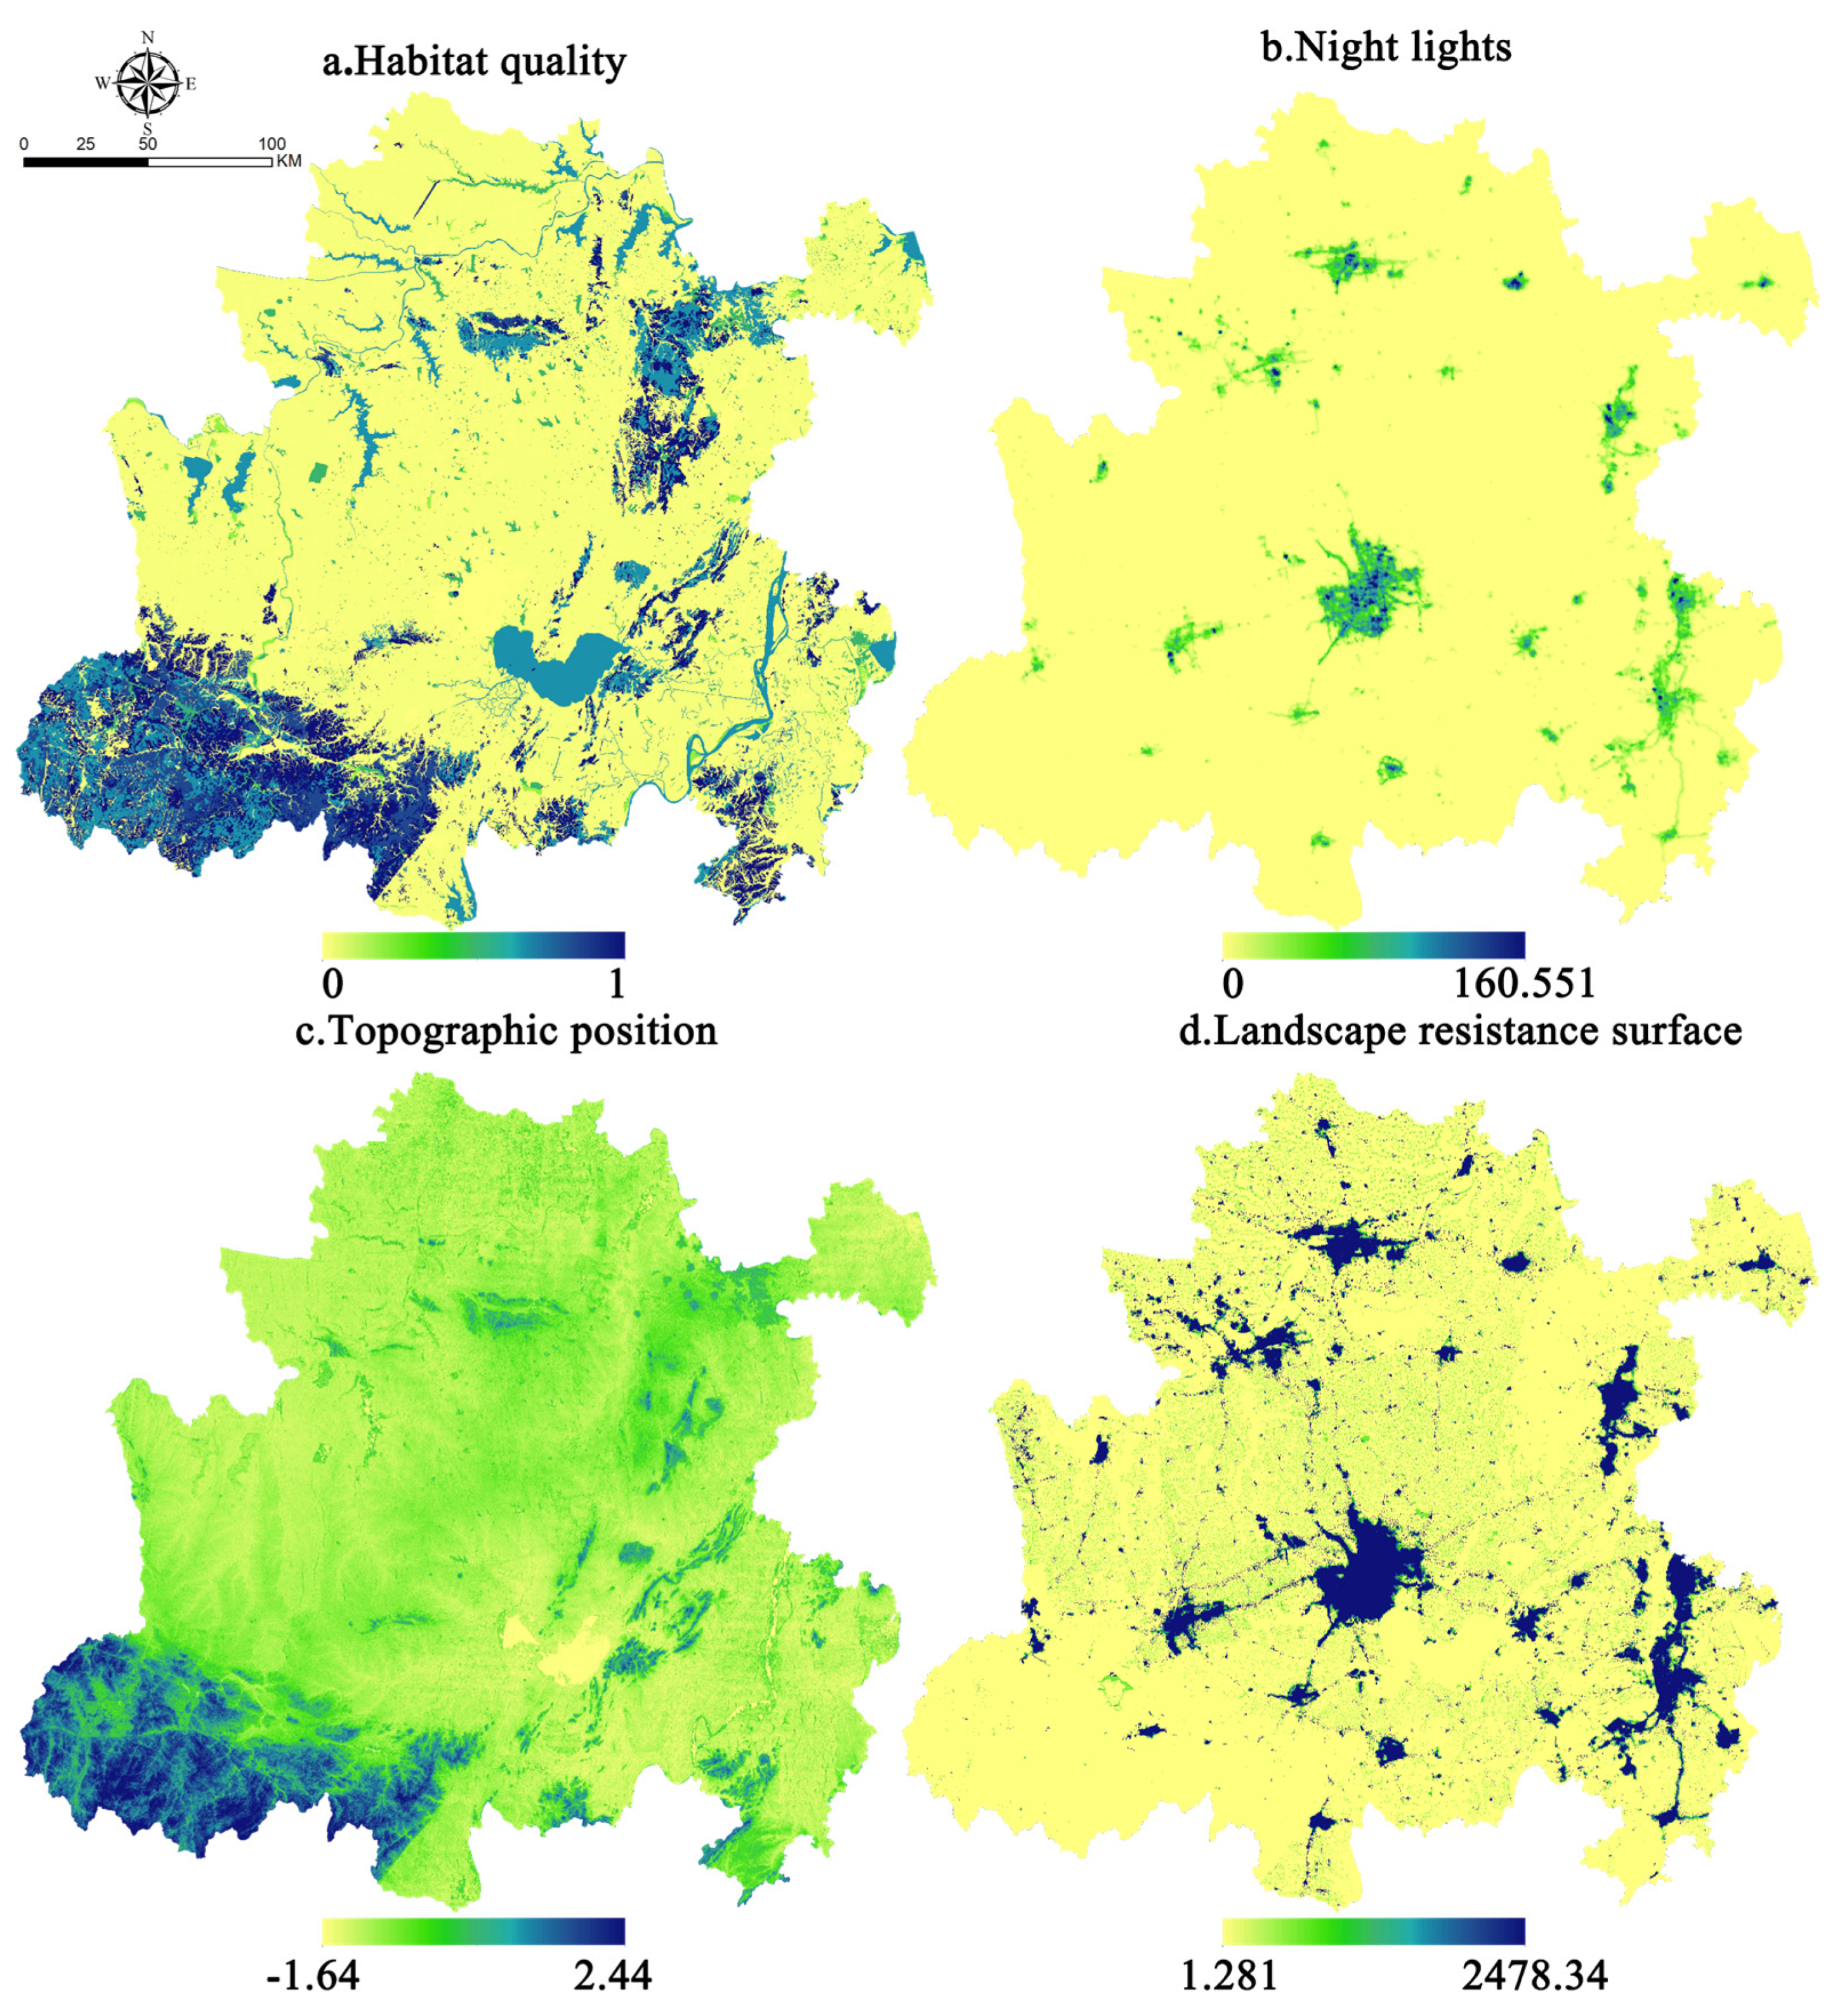
The minimum cumulative resistance surfaces for the expansion of ecological sources are shown in Figure 6d. The areas with larger resistance values in the minimum cumulative resistance surface are mainly manifested in the central urban areas and built-up areas of subordinate counties. The southwestern part of the Hefei metropolitan area is high in terrain and mostly woodland, which makes the area’s habitat quality high (Figure 6a), human activities have less impact on it. Correspondingly, the minimum cumulative resistance value is low, which has a positive impact on the spread of surrounding species and is conducive to ecological flow. The data of night lights can comprehensively reflect the urban expansion and urbanization level in the region. According to Figure 6b, the night light brightness value of the central urban area in Hefei city is the highest, that is to say, the urbanization level is the highest and it spreads around. The topographic level index reflects the degree of topographical undulations. According to Figure 6c, the Dabie Mountains and Langya Mountain–Huangfu Mountain of Chuzhou in the western Anhui province have large topographical undulations, where the range of general human activities will be restricted. This may also affect the choice of migration paths for other species to a certain extent.
3.4. Construction of Ecological Networks under Multi-Scale Nesting
3.4.1. Ecological Corridor Construction of the Metropolitan Area and the Urban Area
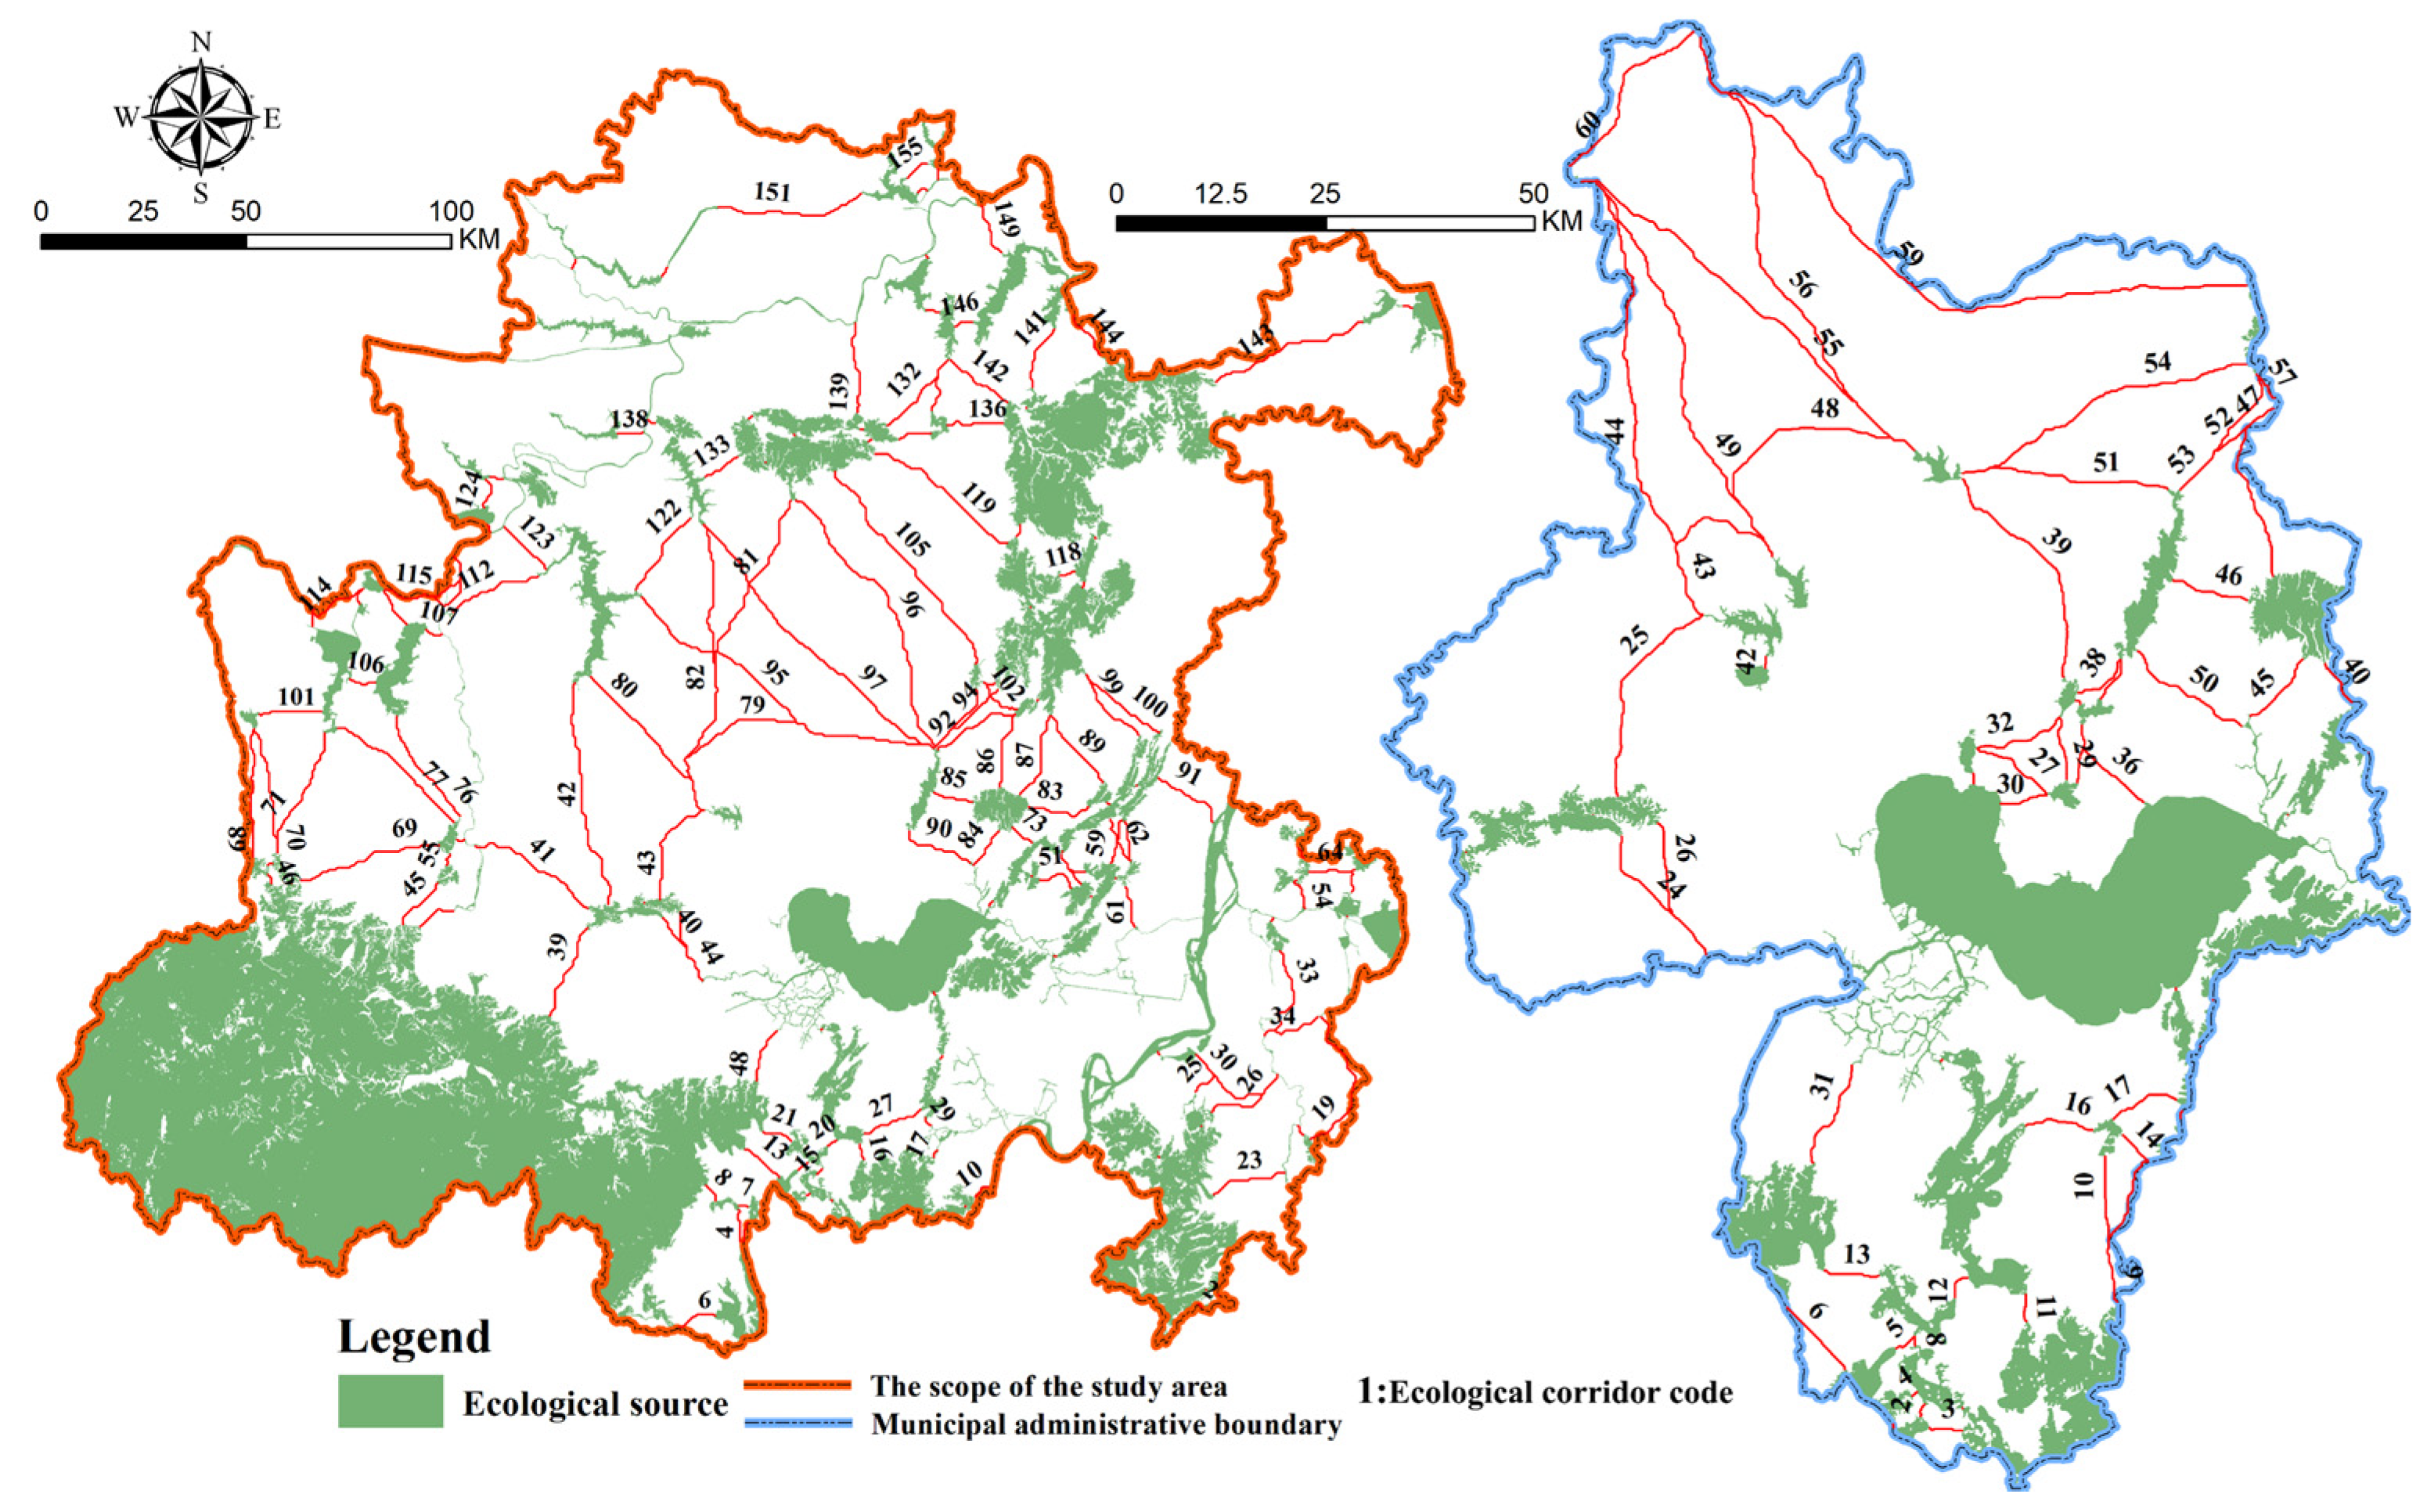
The value of ecological corridors is to connect gardens, grasslands, areas, etc., to form a more complete ecosystem and improve its spatial service value. It is mainly responsible for the basic functions such as transmission channels for species migration and habitats for biological survival and reproduction, as well as ecological restoration functions such as windproof, filtration, and ecological landscape construction. According to the GIS tool, Linkage Mapper, the LCP could be created through the vector map of the ecological sources and the grid map of the resistance surfaces, which is regarded as the ecological corridors between the ecological sources. The results are shown in Figure 7.
According to statistics, there are 155 ecological corridors in the Hefei metropolitan area, with a total length of 2272.12 km, the longest of which is 87.75 km and the average length of which is 14.65 km. There are 60 ecological corridors in the Hefei urban area, with a total length of 867.64 km. The longest corridor is 85.76 km and the average length is 14.46 km. The ecological corridor in the middle of the Hefei metropolitan area is relatively long and lacks transit stations for species transfer. Once affected by human activities, the species transfer corridors may disappear. However, they are important areas for maintaining the structures and functions of the ecological networks in the future and need to be rehabilitated by appropriate measures.
3.4.2. Space Characteristics of Pinch Points and Barrier Points
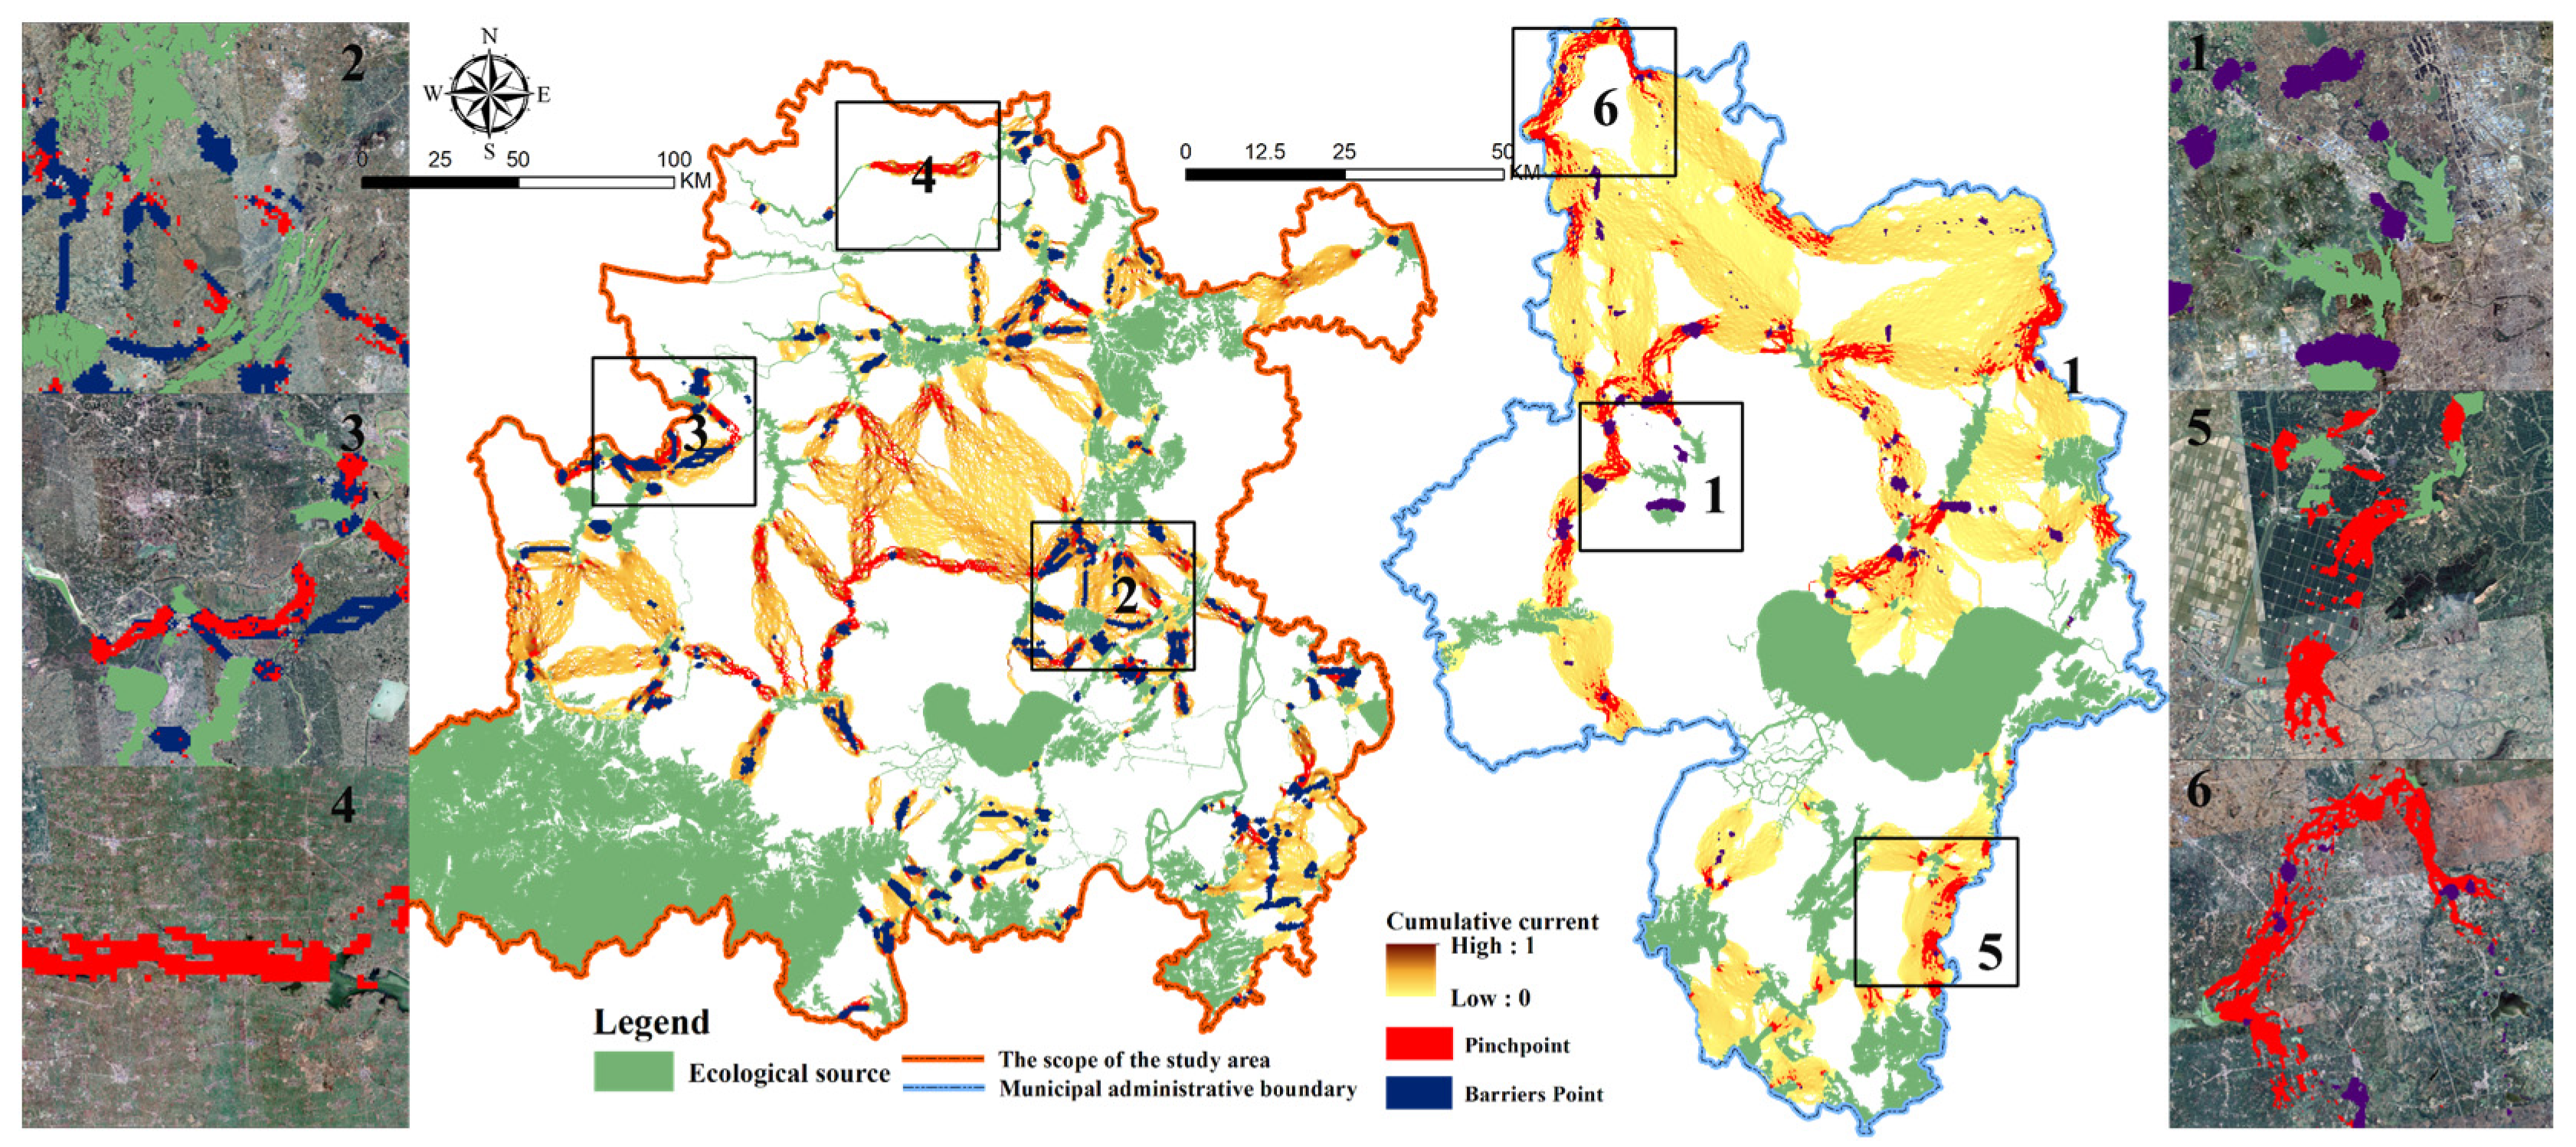
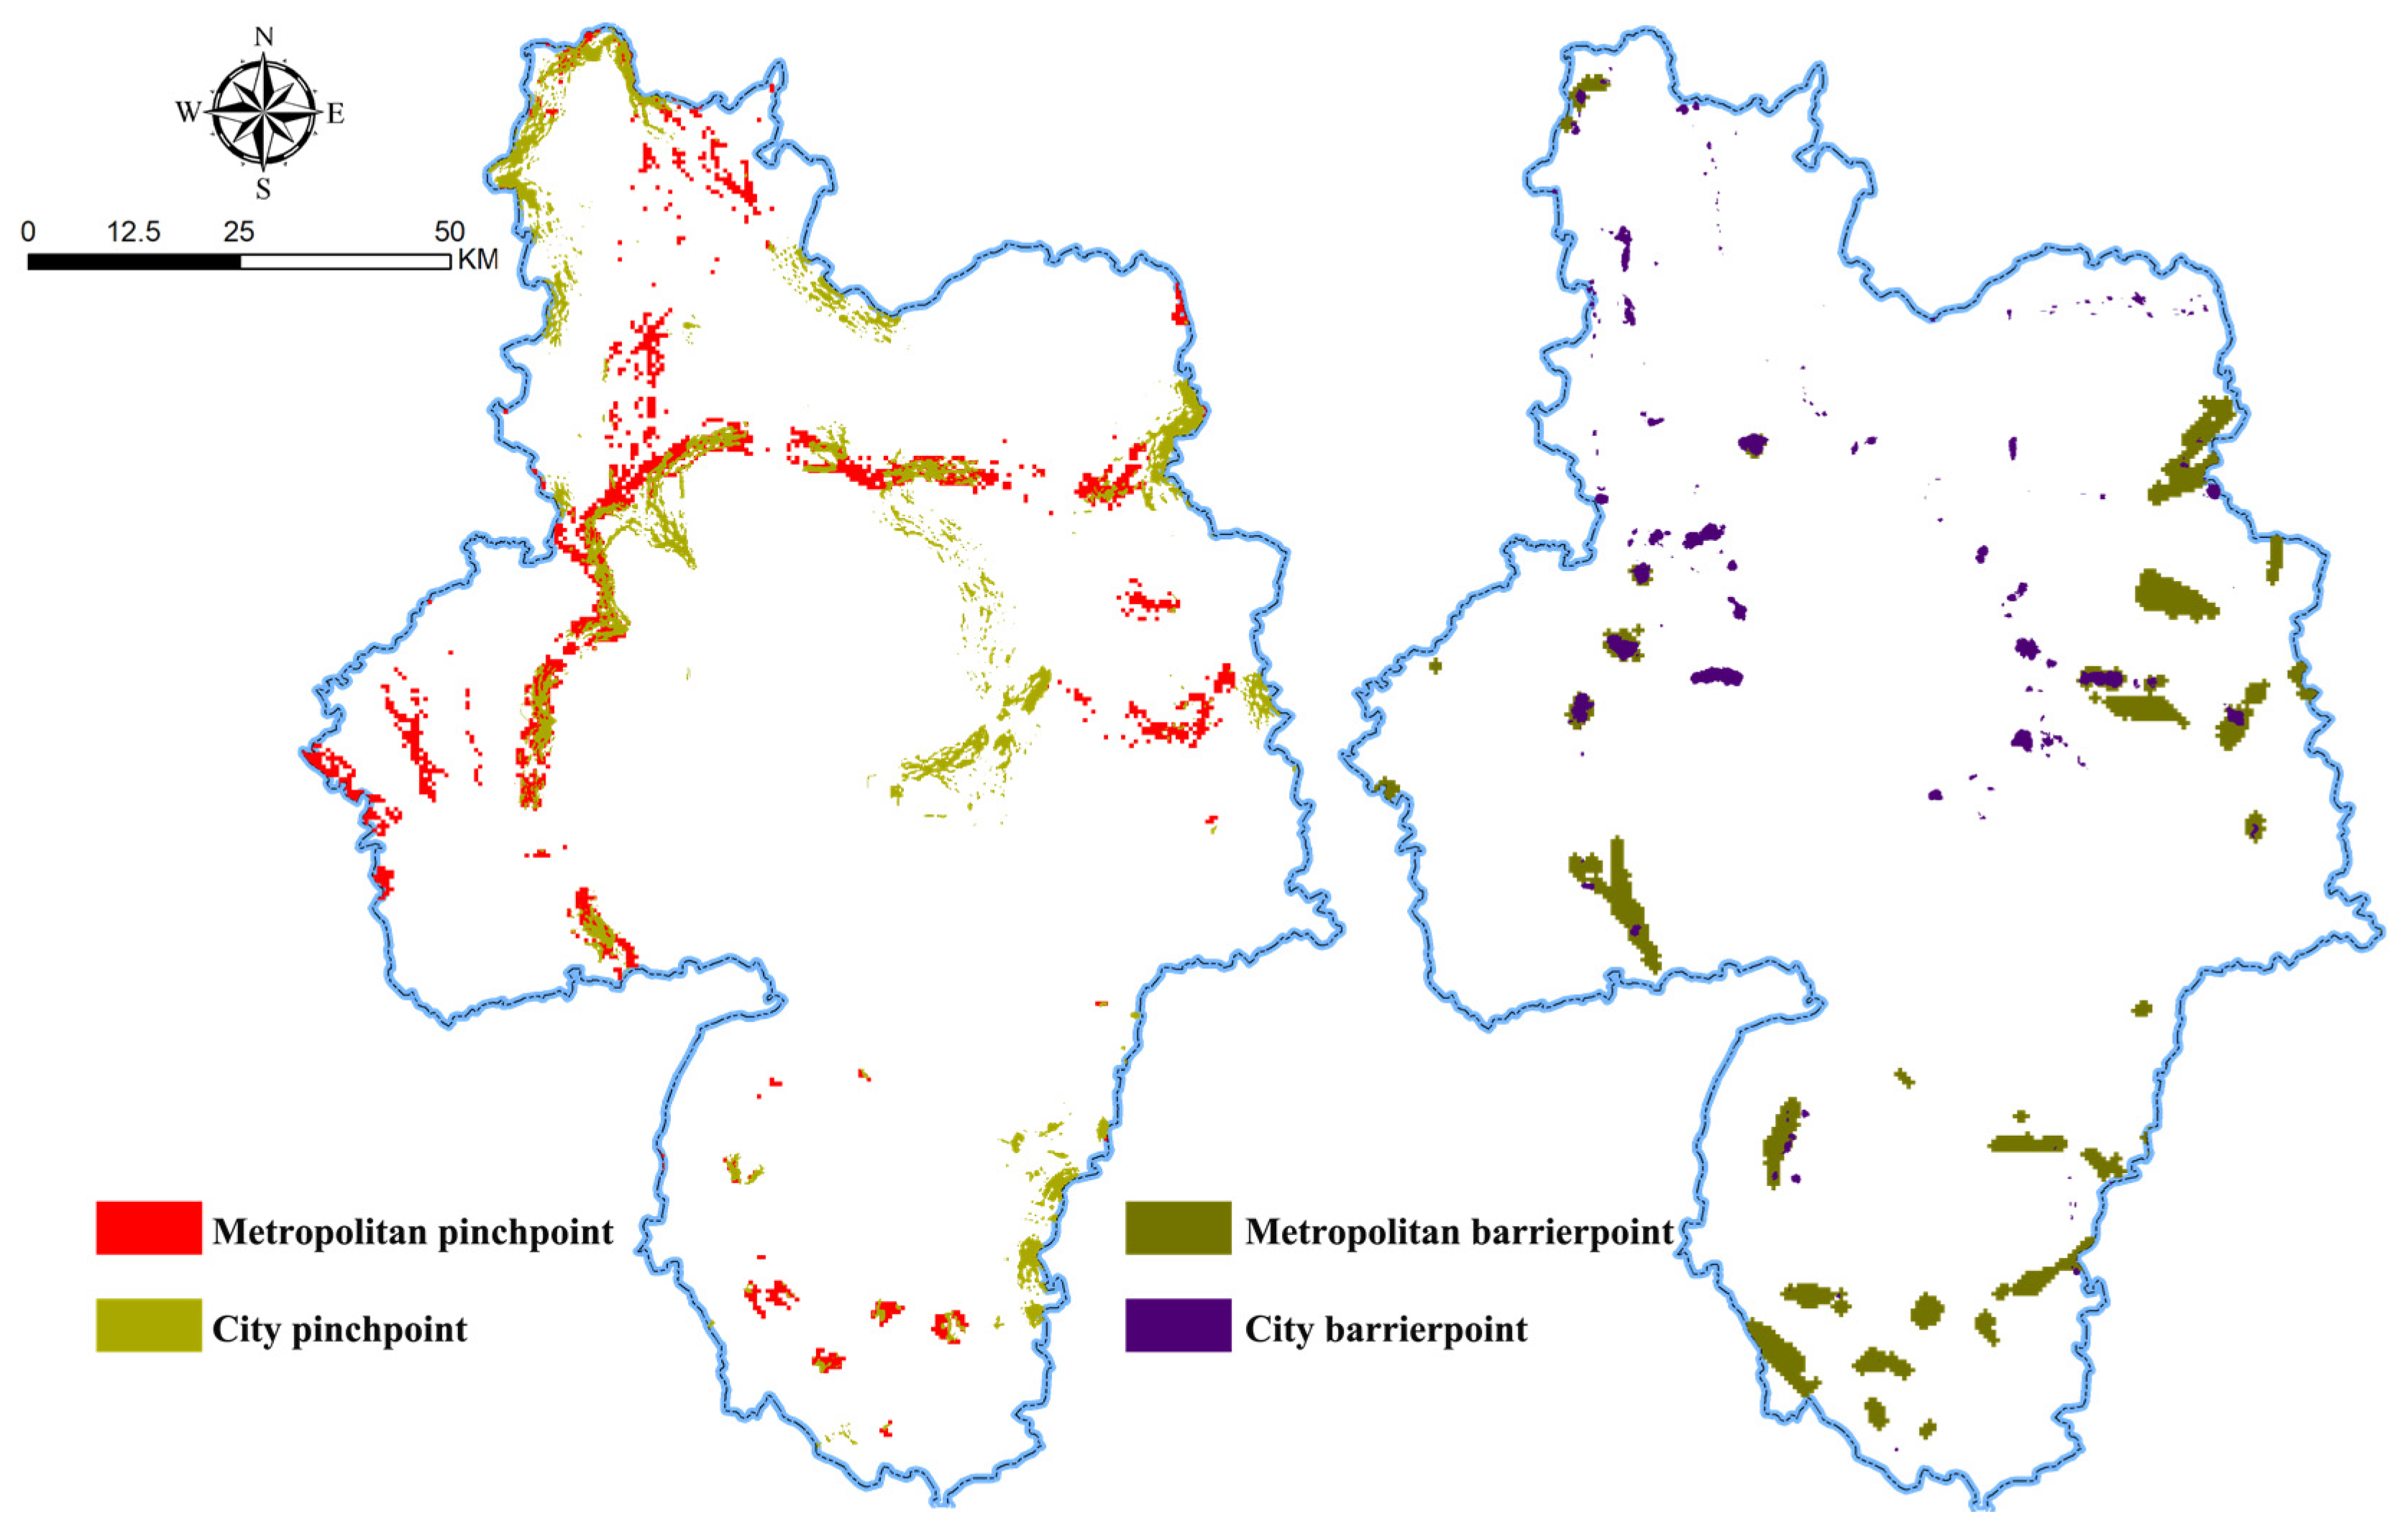
With the help of the Circuit Theory Model, 247 ecological pinch points were identified within the Hefei metropolitan area, with a total area of 1637.75 km2, accounting for 2.5% of the study area. The largest and average pinch area is 187 km2 and 6.63 km2, respectively. There are 44 pinch points with an area larger than the average size, which are important areas for maintaining regional connectivity in the future. One hundred and eighty-nine ecological barrier points were identified within the Hefei metropolitan area, the total area of which is 2182.75 km2, accounting for 3.4% of the study area. Forty-eight ecological pinch points and 218 barrier points are identified within the Hefei urban area, with a total area of 434.22 km2 and 126.97 km2, respectively. The average area of barrier points in the urban area is 0.58 km2, and there are 177 barrier points smaller than the average patch area.
Cultivated lands and water areas constitute most of the ecological pinch points of both metropolitan areas and urban areas. The barrier points are mostly distributed on the edge of ecological sources or in ecological corridors. According to the image map of Figure 8, most of the barrier points are construction lands and road lands, with several appearing on the edge of mountains. For example, some small barrier points can be found around Dashu Mountain. In addition, it can be found that some ecological pinch points are overlapped with barrier points.
At the same time, it can be found that larger barriers mostly appear in areas where natural and artificial ecosystems converge, while relatively small barriers mostly appear in areas with frequent human activities, most of which are construction lands for urban residents. The ecological corridors within such areas are relatively short and narrow, which may directly cut off the ecological corridor with the increase in the resistance value of the barrier point. Therefore, the improvement and restoration of barrier points is the key to optimizing ecological networks.
3.5. Nesting Analysis and Optimization of Ecological Network between Scales
3.5.1. Nesting Analysis of Ecological Sources and Ecological Corridors
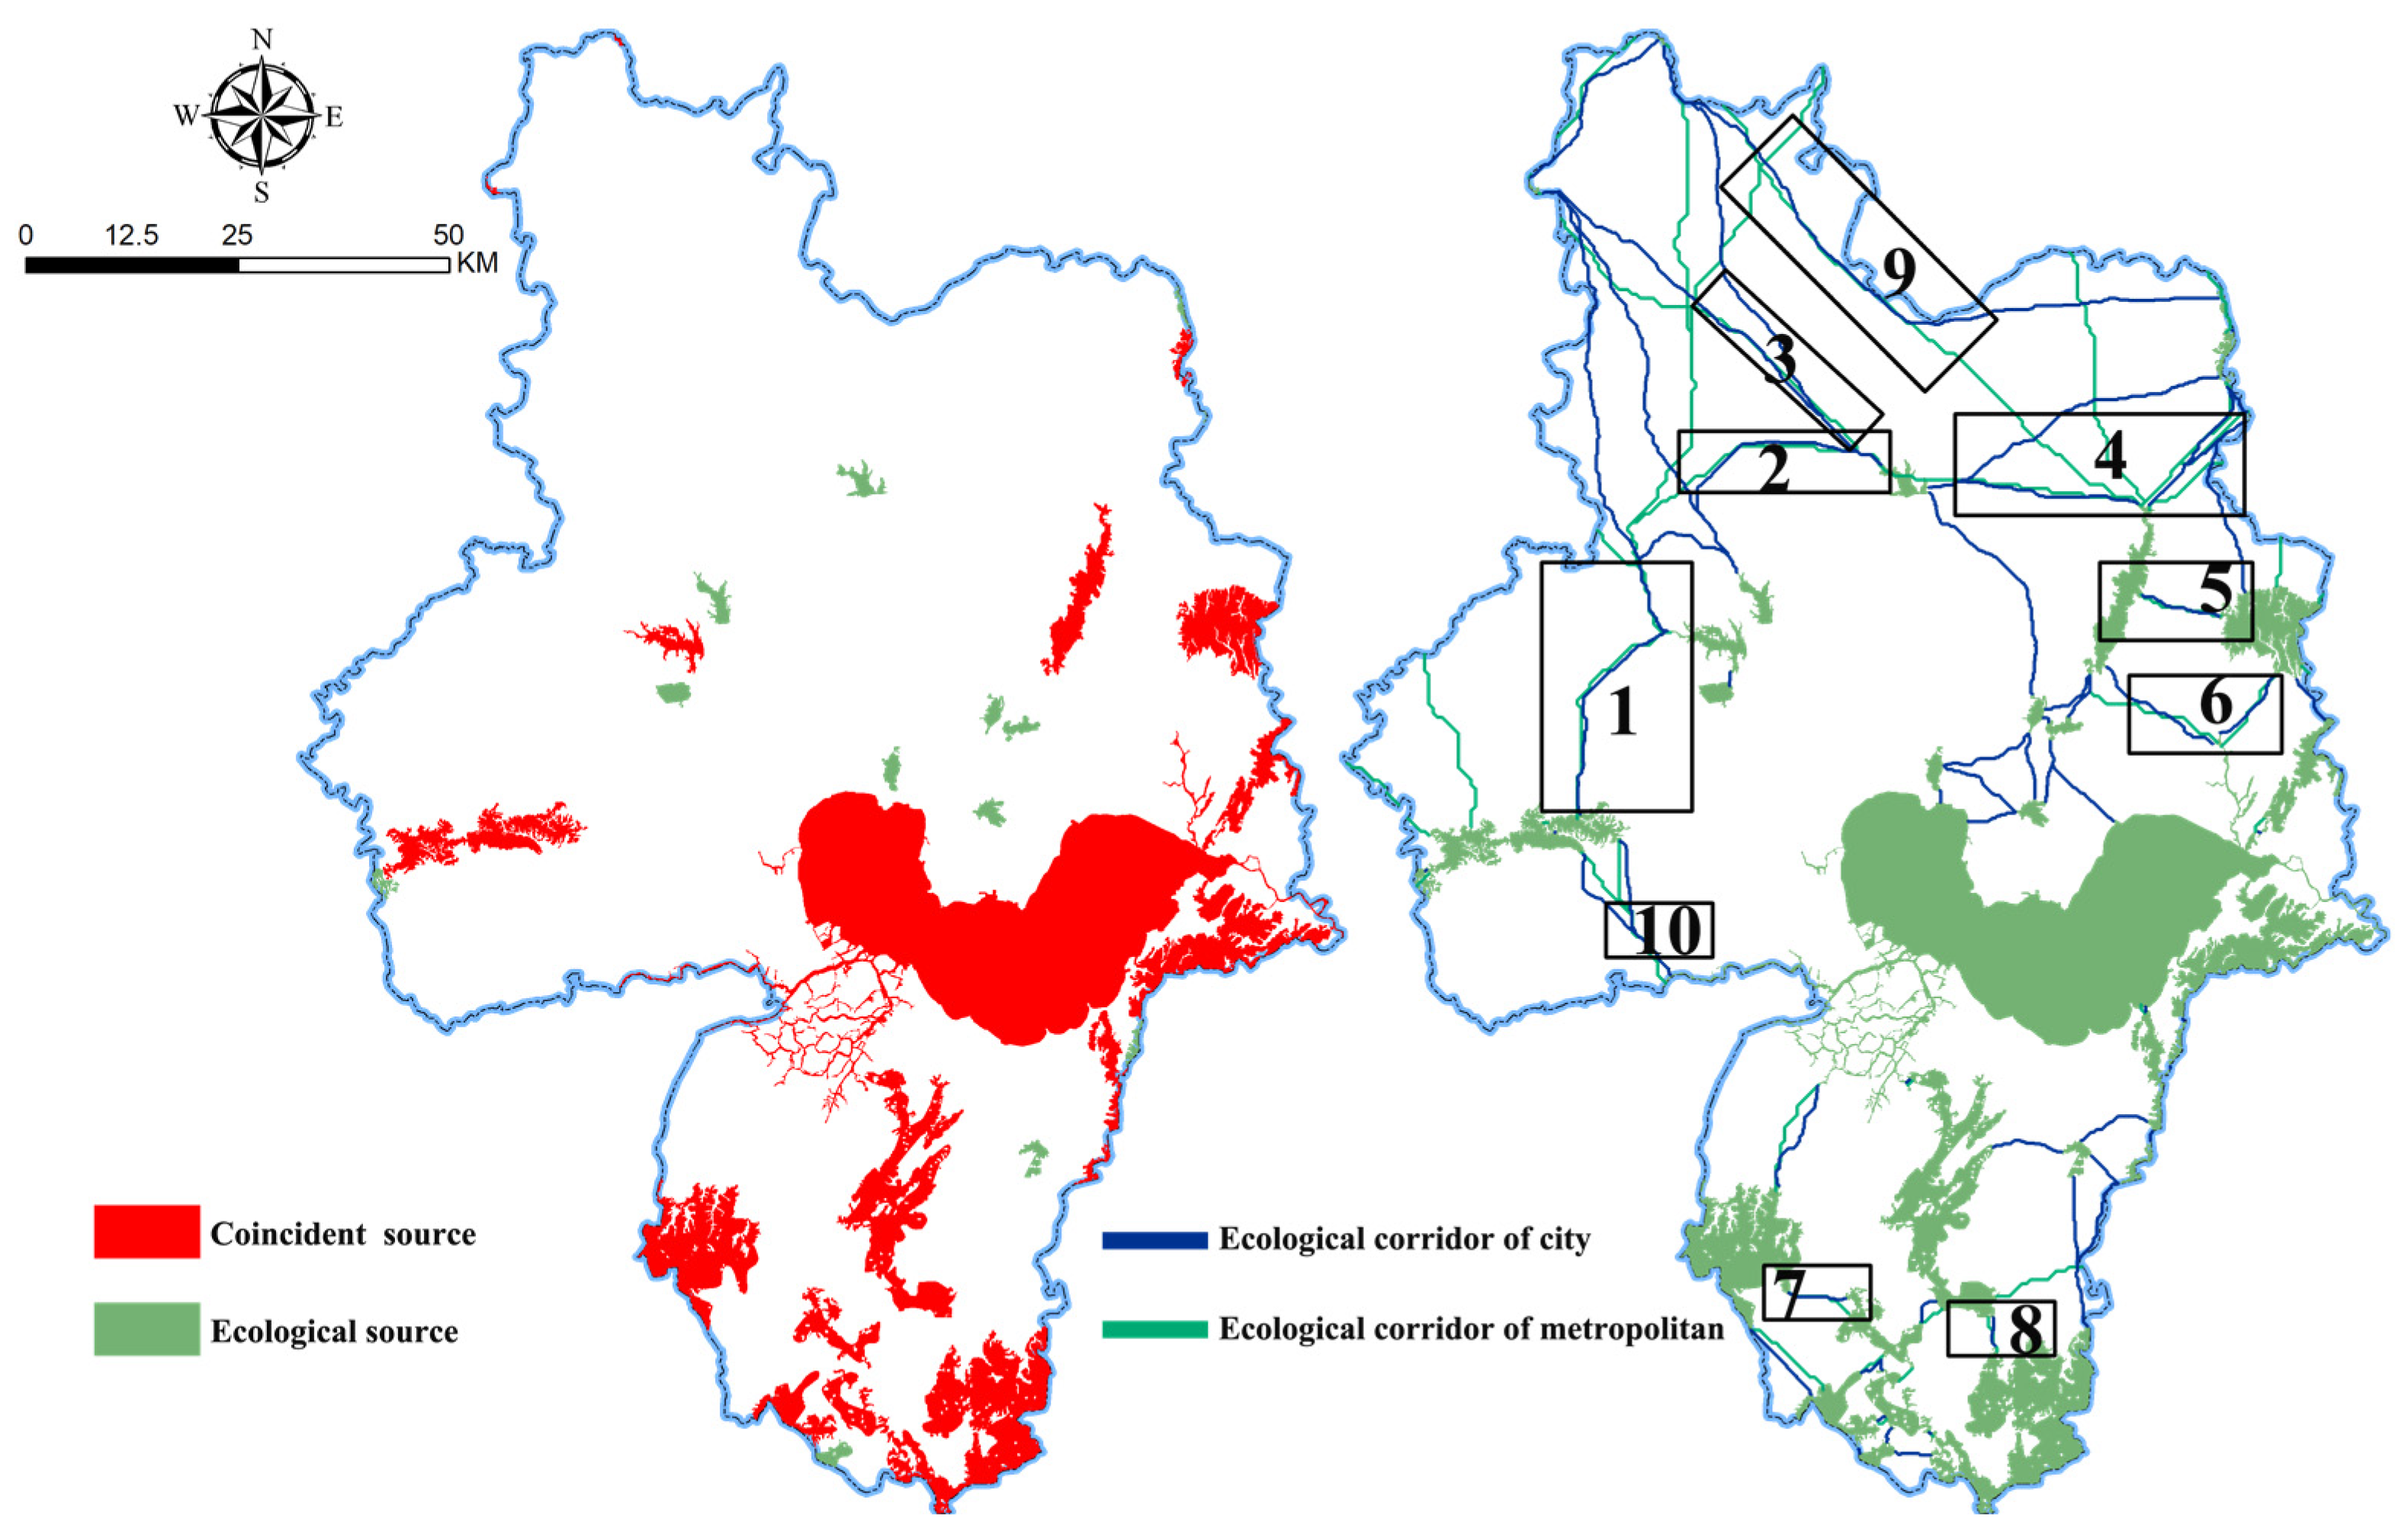
After superimposing the ecological corridors of the Hefei metropolitan area and urban area (Figure 9), it can be seen that there are 19 ecological sources with an area of 1719.95 km2 shared by two scales. In addition, the largest ecological source where the two scales overlap is the Chaohu Lake Basin. The Chaohu Lake Basin is not only a key development zone but also an important ecological function zone defined in the National Plan for Major Functional Zones and National Ecological Function Zoning. It is the area with the most prominent contradictions in the spatial allocation of land resources. In recent years, while rapid urbanization and industrialization have promoted social and economic development, human activities have strongly interfered with the land use and landscape pattern of the watershed, resulting in significant impacts on the function of the ecosystem. The ecological vulnerability of the landscape has been fluctuating towards a downwards trend since 1970. As the most important ecological source in Hefei urban area, it is not only a place for people to relax and be entertained, but also a key to maintaining the stability of the regional ecosystem. Therefore, in the future, attention should be paid to the restoration of the wetland ecosystem around Chaohu Lake and the water resources environment. As an important ecological connection between the two scales, Niuwangzhai and Wuding Mountain are important sources connecting the Dabie Mountains and the Yangtze River Wetland in the urban area, and they are also of great significance to the mutual influence of the two scales of ecological networks.
3.5.2. Nesting Analysis of Ecological Pinch Points and Barrier Points
By superimposing two scales of ecological pinch points and barrier points, it can be seen that (Figure 10) there are 39 overlapping ecological pinch points with an area of 134.8 km2, accounting for 31% of the area of the urban pinch points. There are 17 overlapping barrier points with an area of 40.7 km2, accounting for 32.1% of the area of urban barrier points.
The ecological pinch points located in the northwest and north of the Hefei urban area are highly overlapped with the scale of the metropolitan area, showing the consistency of the ecological characteristics of the nested network structure, and the ecological processes between the two scales are significantly related. To solve the ecological problems of the metropolitan area and the exchange of material and energy of the regional ecosystem, it requires support from the urban area, and the protection for key pinch points and the restoration for barrier points in the urban area plays an important role in ensuring the connection and connectivity of the overall ecological network. Through utilizing the superposition of multi-scale ecological networks to analyze key nodes, we will play an important role at both scales and we can effectively guide the scientific investment of ecological protection and restoration funds, not to mention that providing prior restoration to such key areas can significantly improve the ecological service functions of the ecological networks.
3.6. Suggestions for Optimizing the Ecological Network of Hefei Metropolitan Area
Concerning the self-design theory and artificial design theory in the principles of restoration ecology, we considered restoring and rebuilding the ecosystem, repairing the diversity and dynamic process of the original ecosystem damaged by humans, or rebuilding a completely different or even a brand-new ecosystem. The following specific suggestions for the restoration of the ecological networks of the Hefei metropolitan area are proposed from “point–line–polygon” levels, respectively:
Level of “point”: to take the lead in repairing the overlapping areas between the ecological pinch points and barrier points of the urban area and the metropolitan area, adjust the local ecological process, and drive the optimization of the regional landscape pattern. Considering the ecological problems existing in the land use mode of Hefei urban area, the surrounding protection of the traffic fields and stations and the constructions of landscape green space should be strengthened, and scattered habitat patches within the large land should be connected by the green spaces along the street. It is also necessary to pay attention to the protection and quality improvement of existing ecological sources, the control of the internal disturbance caused by human activities to large-scale sources, enriching the structure of vegetation communities, as well as improving the habitat quality of small patches.
Level of “line”: It is necessary to delineate the control range of important ecological corridors, strictly control the intensity of land construction and development methods in the ecological corridors that overlap between the metropolitan area and the urban area. Moreover, according to the quality and construction conditions of the ecological corridor, it is important to cultivate the potential ecological corridor and strengthen the ecological corridor without a clear path. As for fragile points or places that are prone to breakage of the long corridors, “stepping stones” such as pocket parks and wetland waters should be considered to improve the stability of the source structure and strengthen to improve the overall structure of the ecological networks.
Level of “surface”: taking the regional ecological network structure as the framework, can effectively guide the structural layout and element adjustment of the urban ecological network to ensure that the regional landscape pattern and ecological functions are effectively continued and exerted at the central city level through scale conversion and scale deduction. At the municipal level, it is necessary to improve the connectivity of the source, guarantee and support the realization of regional ecological process, and protect and optimize the key areas while repairing the problem areas.
4. Discussion
Affected by the scale effect, the interaction between the landscape pattern and the ecological process produces variability with the change of the scale, and the structures and functions of the ecological network constructed at different scales are different [38,39,40,41]. At present, most of the constructions and simulations of ecological networks are based on a single scale, so the difference and cohesion of ecological network structures between different scales are not well considered. The incoordination and dislocation of the network structures between scales will reduce the support of the local network to the regional network. The investment of capital and technology to manage, control and restore the corridors and important nodes in the local ecological network may have a limited effect on the overall optimization of the region. This paper constructs a “source–corridor–point” ecological network structure, based on a comprehensive source identification framework. With the goal of multi-scale ecological network nesting and overall optimization, it also puts forward the ecological strategy that ecological sources and ecological corridors that overlap between the scales, as well as areas where the ecological pinch points and barriers overlap, should be given priority to be protected and restored. It can not only provide a scientific basis and technical support for the determination of control boundaries of urban development, the delineation of the EPRL, the identification, protection, and restoration of important ecological spaces in the land and space planning, but also promote the rational construction and optimization of the multi-scale ecological network nesting structure.
The regional ecological network runs through ecological space, production space, and living space. The main functions carried by different spatial locations are different, so the functions required of the ecological network are significantly different. This paper currently constructs an ecological network from the perspective of regional ecological security and stability at the regional scale and considers the composite functions of recreational activities, humanistic aesthetics as well as economic development at an urban scale. However, at a smaller scale, questions such as how to connect the ecological environment in the urban built-up areas with the higher-level network have not yet been discussed. In the construction of urban and regional ecological networks in the future, LID (low impact development) facilities such as green roofs, permeable ground, rainwater gardens, and grass ditches in urban built-up areas should be integrated into the ecological network structure to meet people’s diversified needs, such as ecological improvement, economic development, and social justice. As a result, the construction of a composite ecological network can be promoted.
At present, the concept of the life community of mountains, rivers, forests, fields, lakes, and grasses and its system governance is one of the core pillars of China’s ecological civilization construction. There are two realistic paths to promote the management of landscape, forest, field, lake, and grass systems: Firstly, in the context of global climate and environmental changes, coordinated governance focusing on watershed management and ecological environment restoration, to restore and improve various natural ecological subsystems as well as service functions and enhance its climate adaptability; Secondly, in the context of new urbanization and green development transformation, a coordinated plan focusing on natural capital and green infrastructure investment to cultivate ecological dividends and realize ecological economy.
5. Conclusions
Taking the Hefei metropolitan area as an example, this paper emphasizes multi-scale collaborative planning and multi-disciplinary integration, building an ecological network of two scales of “metropolitan area–urban area”. Based on the LCP, the circuit theory, and the cyclic window search method, the important transfer nodes in the scale nesting, the pinch points, and barrier points that affect multi-level connectivity are quantitatively identified. The specific optimization layout plan for the ecological network structure of the Hefei metropolitan area is further proposed. The main conclusions are as follows:
(1) In the two-scale ecological network of the metropolitan area and the urban area constructed based on the “source–corridor–key point” paradigm, the overlapping area of ecological sources is 1719.95 km2, and 10 ecological corridors overlap with each other. Longer ecological corridors should be protected to prevent the corridor from breaking and affecting the normal progress of ecological processes. The overlapping area of the two scales needs special protection because it is a key area to realize the stability of the overall ecological security pattern and the continuity of biological processes of the region.
(2) Ecological pinch points and barrier points are respective areas where species easily migrate from source to source and movement is strongly hindered, so protection and restoration should be given priority: 247 and 48 pinch points were, respectively, identified in the metropolitan area and the urban area, and 39 of them overlapped. Moreover, there were 189 and 218 barrier points in the two areas, respectively, 17 of which overlapped. It is more important to prioritize the restoration of pinch points or barrier points that overlap between the two regions for maintaining regional ecological stability. Furthermore, building a multi-level ecological structure and function nesting, and formulating a corresponding optimization as well as a coordination plan for the cross-scale pattern can effectively deal with ecological problems.
Author Contributions
Conceptualization, H.Y., and Y.W.; methodology, H.Y., and Q.Z. and Z.L.; software, H.Y., and Q.Z.; writing—original draft preparation, H.Y., X.F. and Y.R.; writing—review and editing, H.Y., C.E. All authors have read and agreed to the published version of the manuscript.
Funding
This research was funded by the National Natural Science Foundation of China (Grant No. 51778002).
Institutional Review Board Statement
Not applicable.
Informed Consent Statement
Not applicable.
Data Availability Statement
Data sharing is not applicable to this article.
Conflicts of Interest
The authors declare no conflict of interest.
References
- Dong, Y.; Jin, G.; Deng, X.; Wu, F. Multidimensional measurement of poverty and its spatio-temporal dynamics in China from the perspective of development geography. J. Geogr. Sci. 2021, 31, 130–148. [Google Scholar] [CrossRef]
- Jin, G.; Shi, X.; Zhang, L.; Hu, S. Measuring the SCCs of different Chinese regions under future scenarios. Renew. Sustain. Energy Rev. 2020, 130, 109949. [Google Scholar] [CrossRef]
- Elmqvist, T.; Andersson, E.; Mcphearson, T.; Bai, X.; Leeuw, S. Urbanization in and for the Anthropocene. NPJ Urban Sustain. 2021, 1, 7. [Google Scholar] [CrossRef]
- Piao, S.; Ciais, P.; Huang, Y.; Shen, Z.; Peng, S.; Li, J.; Zhou, L.; Liu, H.; Ma, Y.; Ding, Y.; et al. The impacts of climate change on water resources and agriculture in china. Nature 2010, 467, 43–51. [Google Scholar] [CrossRef] [PubMed]
- Bennett, A.F. Habitat corridors and the conservation of small mammals in a fragmented forest environment. Landsc. Ecol. 1990, 4, 109–122. [Google Scholar] [CrossRef]
- Cunha, N.S.; Magalhaes, M.R. Methodology for mapping the national ecological network to mainland portugal: A planning tool towards a green infrastructure. Ecol. Indic. 2019, 104, 802–818. [Google Scholar] [CrossRef]
- Zhang, J.; Jiang, F.; Cai, Z.; Dai, Y.; Liu, D.; Song, P.; Hou, Y.; Gao, H.; Zhang, T. Resistance-Based Connectivity Model to Construct Corridors of the Przewalski’s Gazelle (Procapra Przewalskii) in Fragmented Landscape. Sustainability 2021, 13, 1656. [Google Scholar] [CrossRef]
- Rohr, R.P.; Saavedra, S.; Bascompte, J. On the structural stability of mutualistic systems. Science 2014, 345, 1253497. [Google Scholar] [CrossRef] [Green Version]
- Peng, J.; Zhao, H.J.; Liu, Y.X.; Wu, J.S. Research progress and prospect on regional ecological security pattern construction. Geogr. Res. 2017, 36, 407–419. [Google Scholar]
- Jin, G.; Deng, X.; Zhao, X.; Guo, B.; Yang, J. Spatiotemporal patterns in urbanization efficiency within the Yangtze River Economic Belt between 2005 and 2014. J. Geogr. Sci. 2018, 28, 1113–1126. [Google Scholar] [CrossRef] [Green Version]
- Wu, J.S.; Zhang, L.Q.; Peng, J.; Feng, Z.; Liu, H.M.; He, S.B. The integrated recognition of the source area of the urban ecological security pattern in Shenzhen. Acta Ecol. Sin. 2013, 33, 4125–4133. [Google Scholar]
- Liu, J.; Yin, H.W.; Kong, F.H.; Li, M.H. Structure optimization of circuit theory-based green infrastructure in Nanjing. China. Acta Ecol. Sin. 2018, 38, 4363–4372. [Google Scholar]
- Li, H.; Yi, N.; Yao, W.J.; Wang, S.Q.; Li, Z.Y.; Yang S, H. Shangri-La county ecological land use planning based on landscape security pattern. Acta Ecol. Sin. 2011, 31, 5928–5936. [Google Scholar]
- Zhang, Z.; Chen, Y.; Wang, P.; Zhang, S.; Tao, F.; Liu, X. Spatial and temporal changes of agro-meteorological disasters affecting maize production in china since 1990. Nat. Hazards 2014, 71, 2087–2100. [Google Scholar] [CrossRef]
- Peng, J.; LYU, D.N.; Dong, J.Q.; Liu, Y.X.; Liu, Q.Y.; Li, B. Processes coupling and spatial integration: Characterizing ecological restoration of territorial space in view of landscape ecology. J. Nat. Resour. 2020, 35, 3–13. [Google Scholar]
- Wu, J.G. Landscape Ecology: Pattern; Process; Scale and Hierarchy; Higher Education Press: Beijing, China, 2007. [Google Scholar]
- Li, Y.; Wang, X.; Dong, X. Delineating an Integrated Ecological and Cultural Corridor Network: A Case Study in Beijing, China. Sustainability 2021, 13, 412. [Google Scholar] [CrossRef]
- Ouyang, X.; Wang, Z.; Zhu, X. Construction of the Ecological Security Pattern of Urban Agglomeration under the Framework of Supply and Demand of Ecosystem Services Using Bayesian Network Machine Learning: Case Study of the Changsha–Zhuzhou–Xiangtan Urban Agglomeration, China. Sustainability 2019, 11, 6416. [Google Scholar] [CrossRef] [Green Version]
- Yue, B.R.; Liu, Z.Y. From ecological scale to spatial scale: Application of scale effect in landscape architecture planning and design. Chin. Landsc. Archit. 2017, 33, 77–81. [Google Scholar]
- Huber, P.R.; Greco, S.E.; Thorne, J.H. Spatial scale effects on conservation network design: Trade-offs and omissions in regional versus local scale planning. Landsc. Ecol. 2010, 25, 683–695. [Google Scholar] [CrossRef]
- Liu, Y.H.; Fu, B.J. Ecological scale and scaling. Acta Ecol. Sin. 2000, 21, 2096–2105. [Google Scholar]
- Hoppert, M.; Bahn, B.; Bergmeier, E.; Deutsch, M.; Epperlein, K.; Hallmann, C.; Müller, A.; Platz, T.V.; Reeh, T.; Stück, H.; et al. The Saale-Unstrut cultural landscape corridor. Environ. Earth Sci. 2018, 77, 1–12. [Google Scholar] [CrossRef]
- Cabeza, M.; Moilanen, A. Design of reserve networks and the persistence of biodiversity. Trends Ecol. Evol. 2001, 16, 242–248. [Google Scholar] [CrossRef]
- Parent, J.R.; Volin, J.C. Validating Landsat-based landscape metrics with fine-grained land cover data. Ecol. Indic. 2016, 60, 668–677. [Google Scholar] [CrossRef]
- Jiang, C.; Guo, H.; Wei, Y.P.; Yang, Z.Y.; Wang, X.C.; Wen, M.; Yong, L.; Zhao, L.L.; Zhang, H.Y.; Zhou, P. Ecological restoration is not sufficient for reconciling the trade-off between soil retention and water yield: A contrasting study from catchment governance perspective. Sci. Total Environ. 2021, 754, 142139. [Google Scholar] [CrossRef]
- Zakeri, E.; Mousavi, S.A.; Karimzadeh, H. Scenario-based modelling of soil conservation function by rangeland vegetation cover in northeastern Iran. Environ. Earth Sci. 2020, 79, 665–675. [Google Scholar]
- Li, J.P.; IA, S.X.; Yu, X.B. Evaluation of Carbon Storage on Terrestrial Ecosystem in Hebei Province Based on InVEST Model. J. Ecol. Rural Environ. 2020, 36, 854–861. [Google Scholar]
- Wang, Y.G.; Luo, G.P.; Feng, Y.X.; Han, Q.F.; Fan, B.B.; Chen, Y.L. Effects of Land Use/Land Cover Change on Carbon Storage in Manas River Watershed over the Past 50 Years. J. Nat. Resour. 2013, 28, 994–1006. [Google Scholar]
- Huang, M.Y.; Yue, W.Z.; Feng, S.R.; Zhang, J.H. Spatial-temporal evolution of habitat quality and analysis of landscape patterns in Dabie Mountain area of west Anhui province based on InVEST model. Acta Ecol. Sin. 2020, 40, 2895–2906. [Google Scholar]
- Kong, F.H.; Yin, H.W.; Nakagoshi, N.; Zong, Y.G. Urban green space network development for biodiversity conservation: Identification based on graph theory and gravity modeling. Landsc. Urban Plan. 2010, 95, 16–27. [Google Scholar] [CrossRef]
- Zhu, J.; Su, J.; Yin, H.W.; Kong, F.H. Construction of Xuzhou ecological network based on comprehensive sources identification and multi-scale nesting. J. Nat. Resour. 2020, 35, 1986–2001. [Google Scholar]
- Linkage Mapper User Guide. Available online: https://circuitscape.org/linkagemapper/ (accessed on 20 March 2019).
- Mcrae, B.H.; Dickson, B.G.; Keitt, T.H.; Shah, V.B. Mcrae bh, dickson bg, keitt th, shah vb. using circuit theory to model connectivity in ecology, evolution, and conservation. Ecology 2008, 89, 2712–2724. [Google Scholar] [CrossRef]
- Peng, J.; Yang, Y.; Liu, Y.X.; Hu, Y.N.; Du, Y.Y.; Meersmans, J.; Qiu, S.J. Linking ecosystem services and circuit theory to identify ecological security patterns. Sci. Total Environ. 2018, 644, 781–790. [Google Scholar] [CrossRef] [PubMed] [Green Version]
- Lee, S.W.; Hwang, S.J.; Lee, S.B.; Hwang, H.S.; Sung, H.C. Landscape ecological approach to the relationships of land use patterns in watersheds to water quality characteristics. Landsc. Urban. Plan. 2009, 92, 80–89. [Google Scholar] [CrossRef]
- Nathwani, J.; Lu, X.L.; Wu, C.Y.; Fu, G.; Qin, X.N. Quantifying security and resilience of Chinese coastal urban ecosystems. Sci. Total Environ. 2019, 672, 51–60. [Google Scholar] [CrossRef] [PubMed]
- Cheng, F.Y.; Liu, S.L.; Hou, X.Y.; Dong, S.K.; Ana, C.X.X. The effects of urbanization on ecosystem services for biodiversity conservation in southernmost Yunnan Province, Southwest China. J. Geogr. Sci. 2019, 29, 1159–1178. [Google Scholar] [CrossRef] [Green Version]
- Li, J.; Xu, J.; Chu, J. The Construction of a Regional Ecological Security Pattern Based on Circuit Theory. Sustainability 2019, 11, 6343. [Google Scholar] [CrossRef] [Green Version]
- Song, L.L.; Qin, M.Z. Identification of ecological corridors and its importance by integrating circuit theory. Chin. J. Appl. Ecol. 2016, 27, 3344–3352. [Google Scholar]
- Zhao, W.W.; Fu, B.J.; Chen, L.D. Some fundamental issues in scaling. Adv. Earth Sci. 2002, 6, 905–911. [Google Scholar]
- Xu, K.P.; Wang, J.N.; Wang, J.J.; Wang, X.H.; Chi, Y.Y.; Zhang, X. Environmental function zoning for spatially differentiated environmental policies in China. J. Environ. Manag. 2020, 255, 109485. [Google Scholar] [CrossRef] [PubMed]
Figure 1.
Location and elevation of the study area.

Figure 2.
The technical roadmap.

Figure 3.
Spatial distribution pattern of ecosystem service and ecological sensitivity evaluation.

Figure 4.
Rationality verification of the extraction of ecological sources.

Figure 5.
The spatial distribution of ecological sources in metropolitan areas and urban areas.

Figure 6.
The minimum cumulative resistance surface of the Hefei metropolitan area. (a) Habitat quality; (b) Night light index; (c) Topographic index; (d) Landscape resistance surface.
Figure 6.
The minimum cumulative resistance surface of the Hefei metropolitan area. (a) Habitat quality; (b) Night light index; (c) Topographic index; (d) Landscape resistance surface.

Figure 7.
Spatial distribution of ecological corridors in the metropolitan area and urban area.

Figure 8.
Identification of pinch points and barrier points at different scales.

Figure 9.
Superposition analysis of ecological core areas and corridors of different scales.

Figure 10.
Comparative analysis of the superimposed areas of pinch points and barrier points.


Table 1.
The data sources for research.
| Data Name | Resolution | Format | Data Description |
|---|---|---|---|
| Land use | 30 m | Grid | Generated by human visual interpretation based on the Landsat 8 remote sensing image, used to calculate habitat quality |
| Annual average precipitation | 30 m | Grid | Obtained by calculating multi-year average after interpolation of data from national meteorological station, used to calculate rainfall erosivity factor and water conservation capacity |
| Soil | 1000 m | Grid | Obtained based on the soil type map (1:1,000,000) and the data of the second soil survey, used to calculate the soil erodibility factor |
| DEM | 30 m | Grid | Obtained from the STRM DEM data products, from which the LS factors are calculated |
| NDVI | 1000 m | Grid | Generated by maximum value synthesis method based on the SPOT/VEGETATION NDVI satellite remote sensing data of continuous time series |
| Actual evapotranspiration | 30 m | Grid | Cut according to the mask of the study area based on the actual land evapotranspiration data of the whole country, the 30 m precision data of the study area are obtained by using Kriging interpolation |
| National terrestrial ecosystem classification | — | Vector | Used to calculate water conservation capacity |
| Planning text | — | Paper characteristics | Obtained from the government planning department |
| Ecological Red Line of Anhui Province | — | Vector | Obtained from the government planning department |
| basic geographic data | — | Vector | Include the distribution data of administrative divisions, road traffic, river systems, etc. |
Table 2.
Ecosystem service assessment method and calculation process.
| Ecosystem Services | Principles and Methods | Calculation Process |
|---|---|---|
| Water conservation | Model of water conservation [20] | (1) In this formula, TQ represents the total water conservation (), represents rainfall (mm), represents surface runoff, represents evapotranspiration (mm), represents the area of type i ecosystem (), i represents the i-th type of ecosystem type in the study area, and represents the number of ecosystems in the study area. |
| Soil and water conservation | Model of soil and water conservation [21] | The soil and water conservation service model is modified by the revised universal soil loss equation (RUSLE) to carry out the evaluation, the formula is as follows: (2) In this formula, represents the amount of soil and water conservation, represents the potential soil erosion amount, represents the actual soil erosion amount, represents the rainfall erosivity factor (MJ·mm/(hm2·h·a)), represents the soil erodibility factor (t·hm2·h/(MJ·hm2·mm)), represents the slope length and slope factor (dimensionless), represents the vegetation cover and crop management factor (dimensionless). |
| Carbon fixation and oxygen release (NPP) | Carbon module of InVEST model, specific parameter settings are obtained from related studies [22,23] | (3) In this formula, represents the total carbon sequestration, represents the aboveground carbon sequestration, represents the soil carbon sequestration, represents the dead carbon sequestration, represents the underground carbon sequestration. |
| Habitat quality | Habitat Quality module of InVEST model, specific parameter settings are obtained from related studies [24] | (4) In this formula, represents the habitat quality index of the grid of the habitat type , represents the habitat suitability of the habitat type , represents the habitat stress level of the grid of the habitat type , represents the half-saturation constant. |
Table 3.
Classification and weighting of ecological sensitivity evaluation factors.
| Evaluation Factor/Unit | Sensitivity Assignment | Weights | ||||
|---|---|---|---|---|---|---|
| 9 | 7 | 5 | 3 | 1 | ||
| NDVI | (0.65, 0.75) | (0.65, 0.75) | (0.35, 0.50) | 0.20 | ||
| Elevation (m) | (500, 800) | (800, 1100) | (1100, 1400) | 1400 | 0.15 | |
| Slope | (5, 10) | (10, 15) | (15, 25) | 0.15 | ||
| Land use type | Forest land or waterbody | Grassland | Cropland | Construction land | Unuse land | 0.20 |
| Soil erosion intensity | Extremely strong erosion | Strong erosion | Moderate erosion | Mild erosion | Slight erosion | 0.30 |
Publisher’s Note: MDPI stays neutral with regard to jurisdictional claims in published maps and institutional affiliations. |
© 2021 by the authors. Licensee MDPI, Basel, Switzerland. This article is an open access article distributed under the terms and conditions of the Creative Commons Attribution (CC BY) license (https://creativecommons.org/licenses/by/4.0/).
Share and Cite
MDPI and ACS Style
Yu, H.; Wang, Y.; Eme, C.; Fan, X.; Rong, Y.; Zhang, Q.; Liang, Z. Construction of Ecological Network Based on Multi-Scale Conversion and Nesting. Water 2021, 13, 1278. https://doi.org/10.3390/w13091278
AMA Style
Yu H, Wang Y, Eme C, Fan X, Rong Y, Zhang Q, Liang Z. Construction of Ecological Network Based on Multi-Scale Conversion and Nesting. Water. 2021; 13(9):1278. https://doi.org/10.3390/w13091278
Chicago/Turabian StyleYu, Haoran, Yongzheng Wang, Chan Eme, Xin Fan, Yuejing Rong, Qiang Zhang, and Zhe Liang. 2021. "Construction of Ecological Network Based on Multi-Scale Conversion and Nesting" Water 13, no. 9: 1278. https://doi.org/10.3390/w13091278
Note that from the first issue of 2016, this journal uses article numbers instead of page numbers. See further details here.