
Evaluation of Porous Carbon Adsorbents Made from Rice Husks for Virus Removal in Water
by
 , ,
, ,
Vu Duc Canh
1,* ,
,
Seiichiro Tabata
2,
Shun Yamanoi
2,
Yoichi Onaka
3,
Toshiyuki Yokoi
4,
Hiroaki Furumai
5 and
Hiroyuki Katayama
1,* 1
Department of Urban Engineering, Graduate School of Engineering, University of Tokyo, Tokyo 113-8656, Japan
2
IP Incubation & Investment Department, Intellectual Property Division, Sony Group Corporation, Tokyo 108-0075, Japan
3
Activated Carbon Business Department, Osaka Gas Chemicals Co., Ltd., Osaka 550-0023, Japan
4
Institute of Innovative Research, Tokyo Institute of Technology, Tokyo 152-8550, Japan
5
Research Center for Water Environment Technology, Graduate School of Engineering, University of Tokyo, Tokyo 113-8656, Japan
*
Authors to whom correspondence should be addressed.
Water 2021, 13(9), 1280; https://doi.org/10.3390/w13091280
Submission received: 25 March 2021
/
Revised: 22 April 2021
/
Accepted: 28 April 2021
/
Published: 30 April 2021
Abstract
:Porous carbons are well-known efficient adsorbents for a variety of organic and inorganic pollutants; however, they have difficulty in virus removal. In this study, novel porous carbons (NPCs) (NPC-A, NPC-B, and NPC-C) derived from rice husks were compared with commercially available activated carbons (ACs) for their ability to remove MS2 bacteriophages (MS2) in a batch experiment. NPC-A was produced by the silica removal process. NPC-B was prepared with an additional steam activation applied to NPC-A. NPC-C was obtained with an additional acid rinse applied to NPC-B. The NPCs (particularly NPC-C) exhibited effective removal of up to 5.3 log10 of MS2, which was greater than that of less than 2.7 log10 obtained by other ACs under 10 g/L during the same contact time (60 min). The pore size distribution of the porous carbon adsorbents was found to influence their virus removal performance. The adsorbents with a larger proportion of pores ranging from 200–4500 nm in diameter were able to achieve higher virus removal rates. Thus, NPCs (particularly NPC-C), which had a larger volume of pores ranging from 200–4500 nm in size, demonstrated the potential for use as efficient adsorbents for removing viruses during water purification.
1. Introduction
Nearly 30% of the global population (2.1 billion people in 2017) lacks access to safe drinking water [1], and many more live with contaminated water; thus, waterborne diseases are critical issues worldwide, particularly in developing countries. Ensuring universal access to clean water and sanitation is one of the United Nations’ Sustainable Development Goals (Goal 6). The employment of point-of-use (POU) treatments could play an important role in meeting that goal since they are found to effectively reduce diarrheal disease, particularly in developing regions with poor hygiene and sanitation conditions [2,3]. Among waterborne pathogens, enteric viruses (e.g., norovirus and rotavirus) are widely recognized as major causes of acute diarrhea [4]. These viruses have been frequently found in water sources, including surface water and groundwater [5,6,7,8,9]. Therefore, there is a need for the development of simple, efficient, and affordable POU technologies for virus removal to provide safe water in developing countries.
Porous carbon adsorbents, typically activated carbons (ACs), are widely known as efficient adsorbents because of their large surface area, high porosity, and great adsorption capacity. Consequently, they have been widely used in water purification for the removal of organic and inorganic pollutants [10,11,12]. In addition, porous carbon adsorbents such as granular AC and powdered AC have been tested for their ability to remove viruses [13,14,15,16] because viruses display adsorptive interactions with various surface materials. However, these porous carbon adsorbents were found to have a low virus removal capacity (less 2 log10) [13,14,16]. Recently, although super-powdered AC with nanometer size ranges of 0.65–2.79 µm was found to improve virus removal, it required a long contact time (reaching a 4 log10 removal after 8 h) [17], which might not be suitable for actual water purification systems.
The electrostatic interaction between the negatively charged carboxyl groups or lactone groups on ACs and the amino groups on viruses plays an important role in virus removal [18]. However, porous carbon adsorbents also include a wide range of pore structures, which can be classified into three categories based on pore diameter: macropores (>50 nm), mesopores (2–50 nm), and micropores (<2 nm) [19]. The pore morphology, size, and distribution were found to significantly influence the properties of porous materials (surface area, selectivity, and adsorption capacity) [10,20,21,22]. Nevertheless, little is known about the contribution of pore structure for virus removal [17]. Recently, Tabata et al. [20] developed a novel fabrication process to produce novel porous carbons (NPCs) with unique pore structures derived from rice husks. These NPCs comprise a wide range of pore sizes including macropores, mesopores, and micropores on their surface, which results in multiple layers for the efficient adsorption of organic molecules in the liquid phase [20].
Thus, the present study aimed to evaluate the performance of NPCs for virus removal and to investigate the effects of pore size distribution on virus removal. A batch experiment was conducted to compare virus removal by different porous carbons using the MS2 bacteriophage (MS2) as a model virus. MS2, which belongs to the family Leviviridae, contains a single-stranded RNA and has an icosahedral shape. MS2 has been widely used as a surrogate virus in water treatment and disinfection studies since it has similar characteristics to pathogenic viruses [23,24,25].
2. Materials and Methods
2.1. Porous Carbon Materials
Eight porous carbon adsorbents were tested, including three NPCs (NPC-A, NPC-B, and NPC-C) and five commercially available types of ACs (AC-A, AC-B, AC-C, AC-D, and AC-E). Three NPCs were prepared from the same raw material of rice husks obtained from the Akita prefecture in Japan according to the method of Tabata et al. [20]. Briefly, the rice husks were carbonized under the absence of oxygen at 500 °C for 1 h in a handmade furnace, followed by silica removal via immersion in sodium hydroxide (1 M, Wako Pure Chemical Industries, Ltd., Osaka, Japan) for 5 h at approximately 100 °C. NPC-A was obtained after the silica removal. NPC-B was obtained after silica removal and steam activation with 250 mL/min of nitrogen for 3 h at 900 °C. NPC-C was obtained after silica removal, steam activation, and washing by hydrochloric acid (0.1 M). All ACs were obtained from the Osaka Gas Chemical Co., Ltd., Osaka, Japan and Kuraray Co., Ltd., Okayama, Japan. AC-A, AC-B, AC-C, and AC-D were produced from coconut husks using the steam activation method, whereas AC-E was produced from wood using the zinc chloride activation method. The detailed information of production processes for ACs was not available from the manufacturers.
2.2. Characterization of Porous Carbon Adsorbents
At first, each material (0.05 g) was dried at 200 °C for 3 h under nitrogen flow. Subsequently, the nitrogen adsorption and desorption cycles were performed using a BELSORP-mini (BEL, Osaka, Japan). The data from the nitrogen adsorption profiles were used to calculate the surface area according to the Brunauer–Emmett–Teller (BET) method and the pore size distribution according to the Mikhail–Brunauer micropore analytical (MP) and Barret–Joyner–Halenda (BJH) methods.
In addition, the pore size distribution was measured by the mercury intrusion porosimetry (MIP) method using a POREMASTER 60GT (Quantachrome Instruments, Florida, US). The MIP method is based on the injection of liquid mercury into the porous materials with increasing pressure (from 5 × 100 to 4 × 10⁶ kPa). The mercury intrusion-extrusion profile was then obtained to calculate the pore size distribution. These analysis methods allow the measurement of different ranges of pore size. In particular, micropores (<2 nm) can be measured by the MP method while mesopores and macropores (2–200 nm) can be measured by the BJH method. The MIP method can determine the widest range of pore sizes from mesopores to large macropores (3–10,000 nm). The surface morphology of the materials was observed with a scanning electron microscope (SU9000, Hitachi, Tokyo, Japan).
Zeta potential analyzer (ELSZ-2000Z model, Otsuka electronics Co., Ltd., Osaka, Japan) was used for measuring the zeta potential of the porous carbon adsorbents at the pH range from 6.0 to 7.1.
2.3. Virus Preparation and Plaque Assay
The MS2 bacteriophage was used as the model virus. MS2 was propagated in a culture of E. coli K12A/λ (F+) [26]. Propagated MS2 was centrifuged at 5000 g for 15 min and then filtered through a cellulose acetate filter (0.2 µm, DISMIC-25C, Advantec, Tokyo, Japan). The MS2 concentration was measured by the plaque assay using the same host bacteria for its propagation [27]. Briefly, 10-fold serial dilutions were prepared in a phosphate buffer solution for each sample. Then, 1 mL of the diluted samples was mixed with LB agar containing the host bacteria in the Petri dish and incubated overnight at 37 °C. All the dilution series were plated in duplicate.
2.4. Batch Experiment for Virus Removal
The batch experiment was prepared using 100 mL glass Erlenmeyer flasks. General test (GT) water was used according to the recommendations of the WHO for testing the removal of viruses in the batch experiment [28]. The water quality parameters of the prepared GT water were as follows: temperature: 20–25 °C, pH: 7.0–7.6, total organic carbon (TOC): 1.0 mg/L, electrical conductivity (EC): 17.4–19.2 mS/m, and alkalinity: 90–110 mg CaCO3/L (prepared from 1 L of deionized water containing sodium bicarbonate (205 mg, Wako), 2 M hydrochloric acid (220 µL, Wako), and tannic acid (1.85 mg, Wako)) [27]. GT water (100 mL) spiked with the MS2 stock solution (100 µL, 1011 PFU/mL) was first mixed well. Then, 1 g each of adsorbent was added, and the suspension was continuously mixed at a speed of 400 rpm using a magnetic stirrer. Samples (3 mL) were collected at 0, 20, 40, and 60 min and filtered through a membrane with a pore size of 0.45 µm (DISMIC-25HP, Advantec) to remove the materials. The virus concentration in the filtrate was measured by the plaque assay. All the experiments were performed in triplicate.
3. Results and Discussion
3.1. Characterization of Porous Carbon Adsorbents
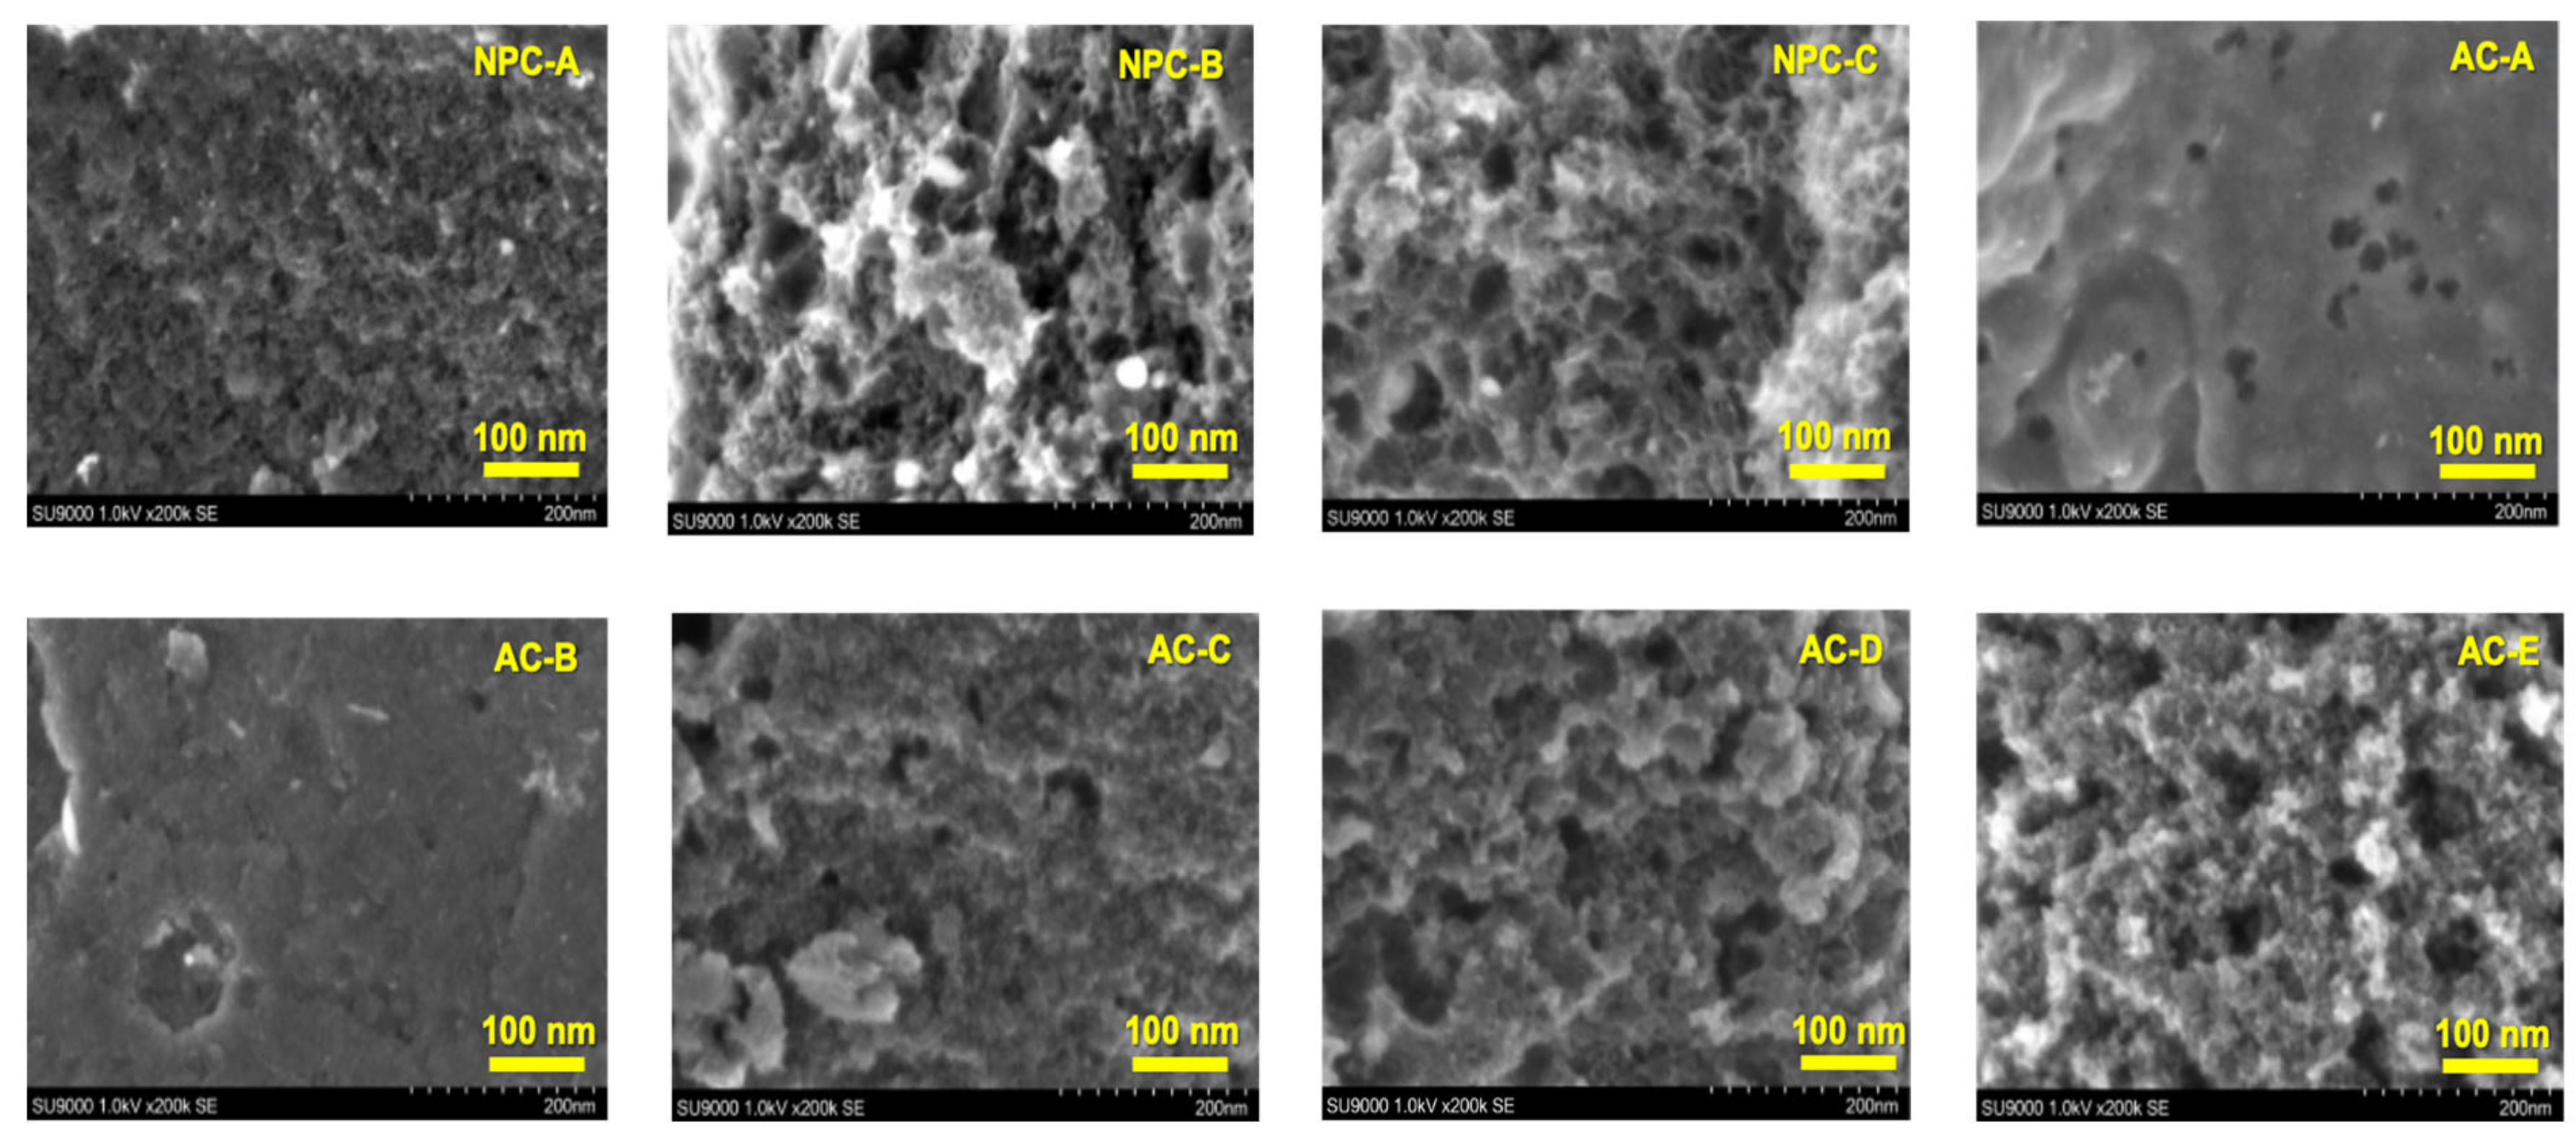
The characteristics of the porous carbon adsorbents including the three NPCs (NPC-A, NPC-B, and NPC-C) and the five ACs (AC-A, AC-B, AC-C, AC-D, and AC-E) are summarized in Table 1. All the adsorbents had a relatively similar particle size, ranging from 0.23 to 0.5 mm in diameter. The BET surface areas of the NPCs (376–960 m2/g) were less than those of the ACs (1016–1958 m2/g). The SEM images of the adsorbent surfaces at a magnification of 200k are shown in Figure 1. NPC-B, NPC-C, AC-D, and AC-E had rough surfaces whereas NPC-A, AC-A, AC-B, and AC-C had relatively smooth surfaces. Moreover, all the porous carbon adsorbents had a negative charge at the pH range from 6.0 to 7.1 (Table 1). There was no clear difference in the zeta potential between the NPCs (ranging from −13 to −34 mV) and the ACs (ranging from −6.3 to −43 mV).
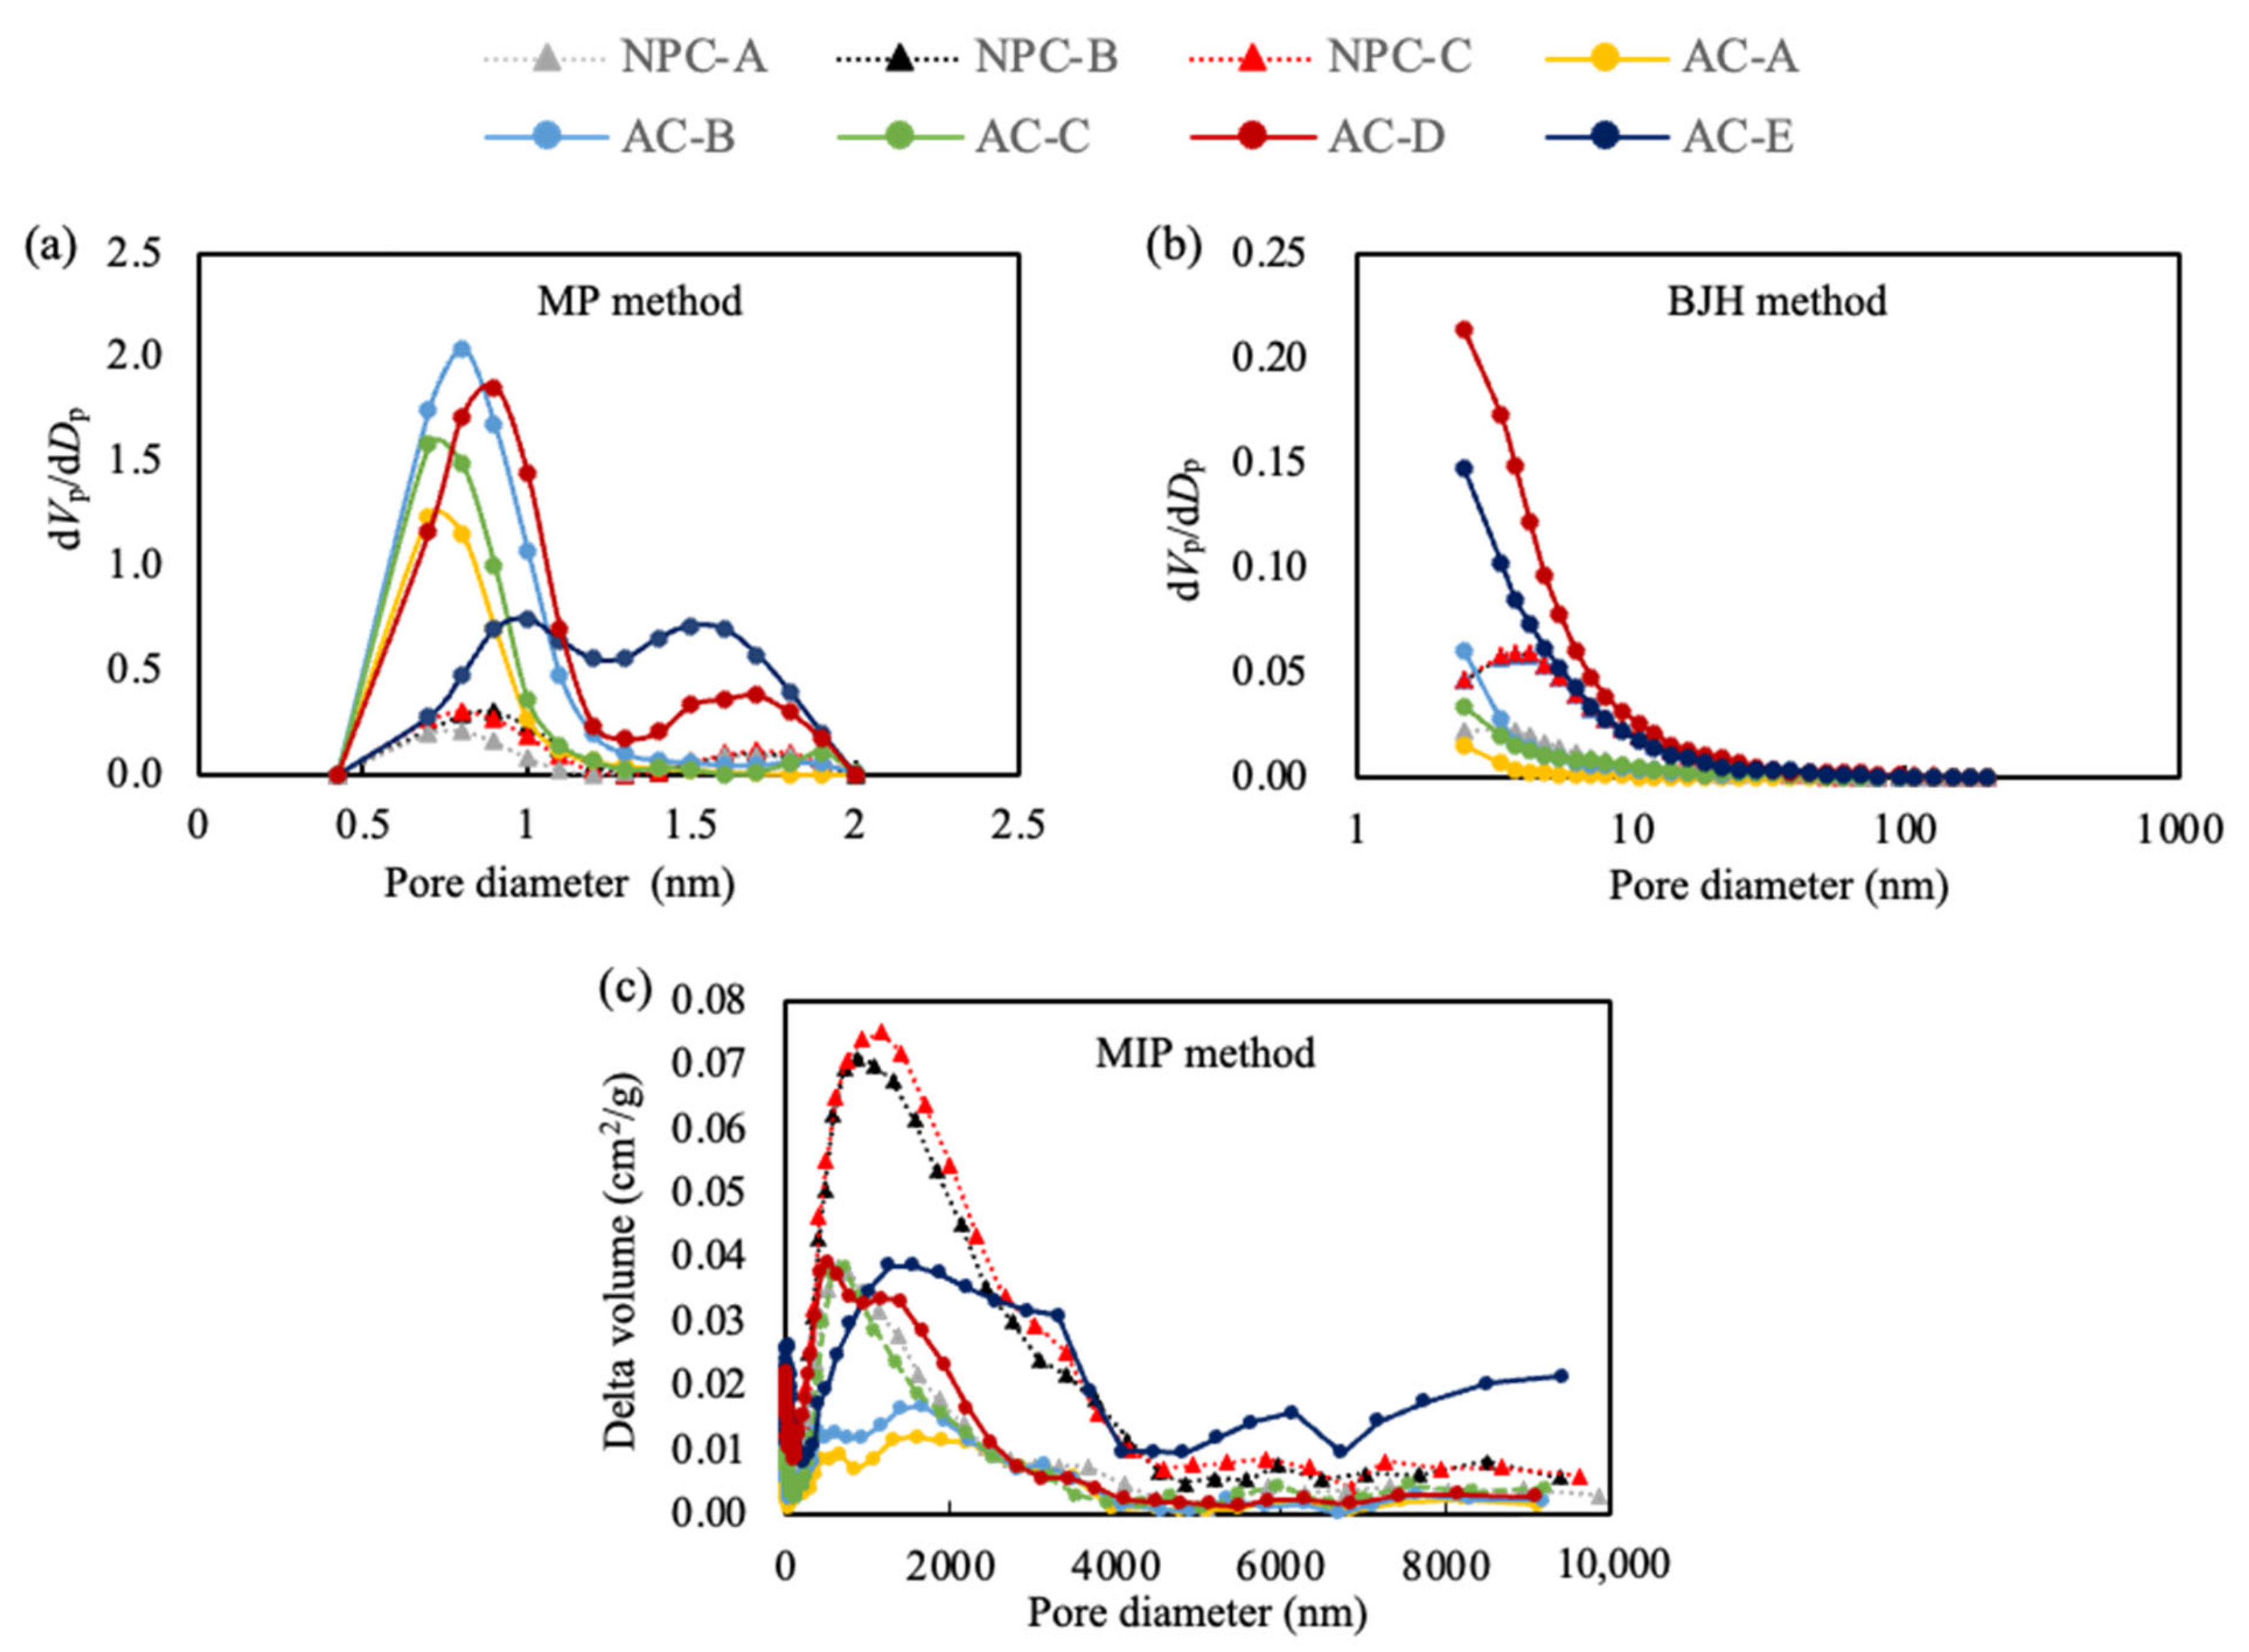
The pore size distributions of the porous carbon adsorbents were determined by different analysis methods including the MP, BJH, and MIP methods (Figure 2). All the adsorbents generally displayed three similar peaks at approximately 0.8, less than 3, and 200–4500 nm, except for AC-D and AC-E (Figure 2). AC-D had one additional peak at approximately 1.6 nm whereas AC-E had two additional peaks at approximately 1.6 and 26–100 nm. The peak heights clearly differed among the adsorbents. Unlike the ACs, which had higher peaks at small pore sizes (approximately 0.8, 1.6, and less than 3 nm), NPCs (NPC-B and NPC-C) had higher peaks at large pore sizes (200–4500 nm). More specifically, the peak for each adsorbent occurred at 1000 nm for NPC-B and NPC-C, 650 nm for NPC-A and AC-C, 1400 nm for AC-E, 650 nm and 1400 nm for AC-D, and 300–2000 nm for AC-A and AC-B.
The differences in the pore size distributions among the porous carbon adsorbents may have resulted from the raw material sources. Indeed, NPCs were produced from rice husks while ACs were obtained from coconut husks and wood (Table 1). These raw materials might contain different contents of carbon and inorganic and volatile compounds, thus possibly influencing their pore size distribution [29]. More importantly, the production processes of these materials might also affect their structures. For the NPCs, NPC-B and NPC-C were treated with steam activation after the removal of silica, whereas NPC-A was not (Table 1). Thus, it is possible that the significant proportion of large pore sizes in NPC-B and NPC-C was created/enhanced by the process of steam activation. Additionally, when compared to NPC-B, NPC-C was treated with hydrochloric acid (0.1 M) at the final step. The acid treatment was reported to significantly change the surface properties and pore structure of porous carbons [30]. For the ACs, the effects of production processes were not investigated since they were obtained from manufacturers.
3.2. Removal of MS2 by Porous Carbon Adsorbents
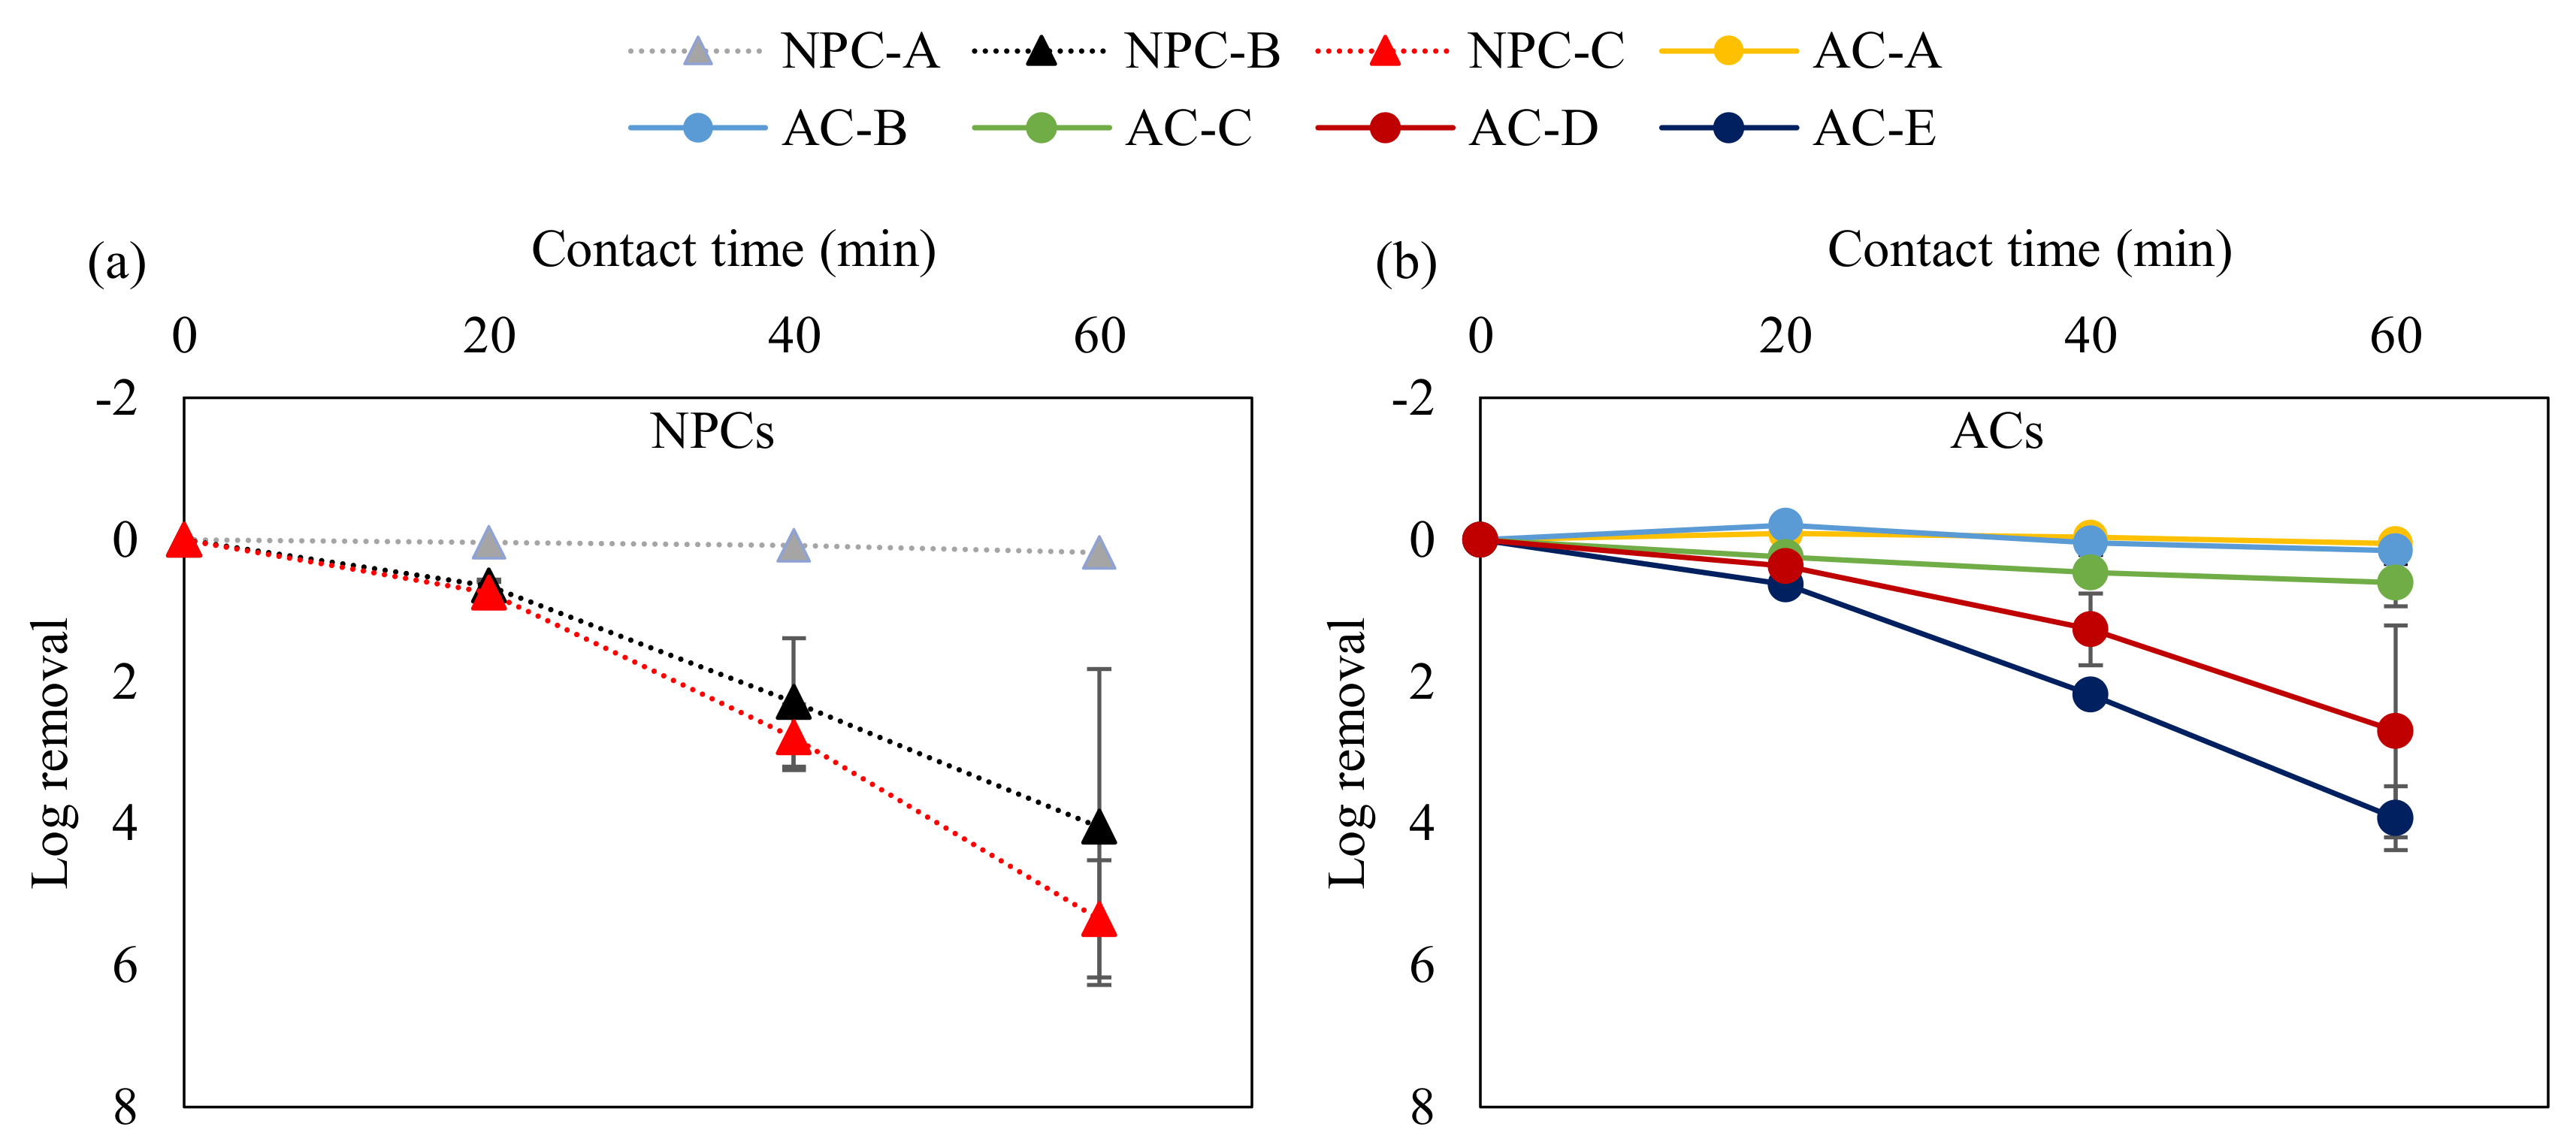
Figure 3 shows virus removal by the different porous carbon adsorbents. As the contact time increased from 0 to 60 min, NPC-A, AC-A, AC-B, and AC-C showed no virus removal, while increased virus removal was observed for NPC-B, NPC-C, AC-D, and AC-E. The greatest virus removal was shown by NPC-C (5.3 log10), followed by NPC-B and AC-E (4.0 log10) and AC-D (2.7 log10) at the contact time of 60 min. These findings indicate that NPCs (particularly NPC-C) were able to remove the virus more effectively than other porous carbon adsorbents.
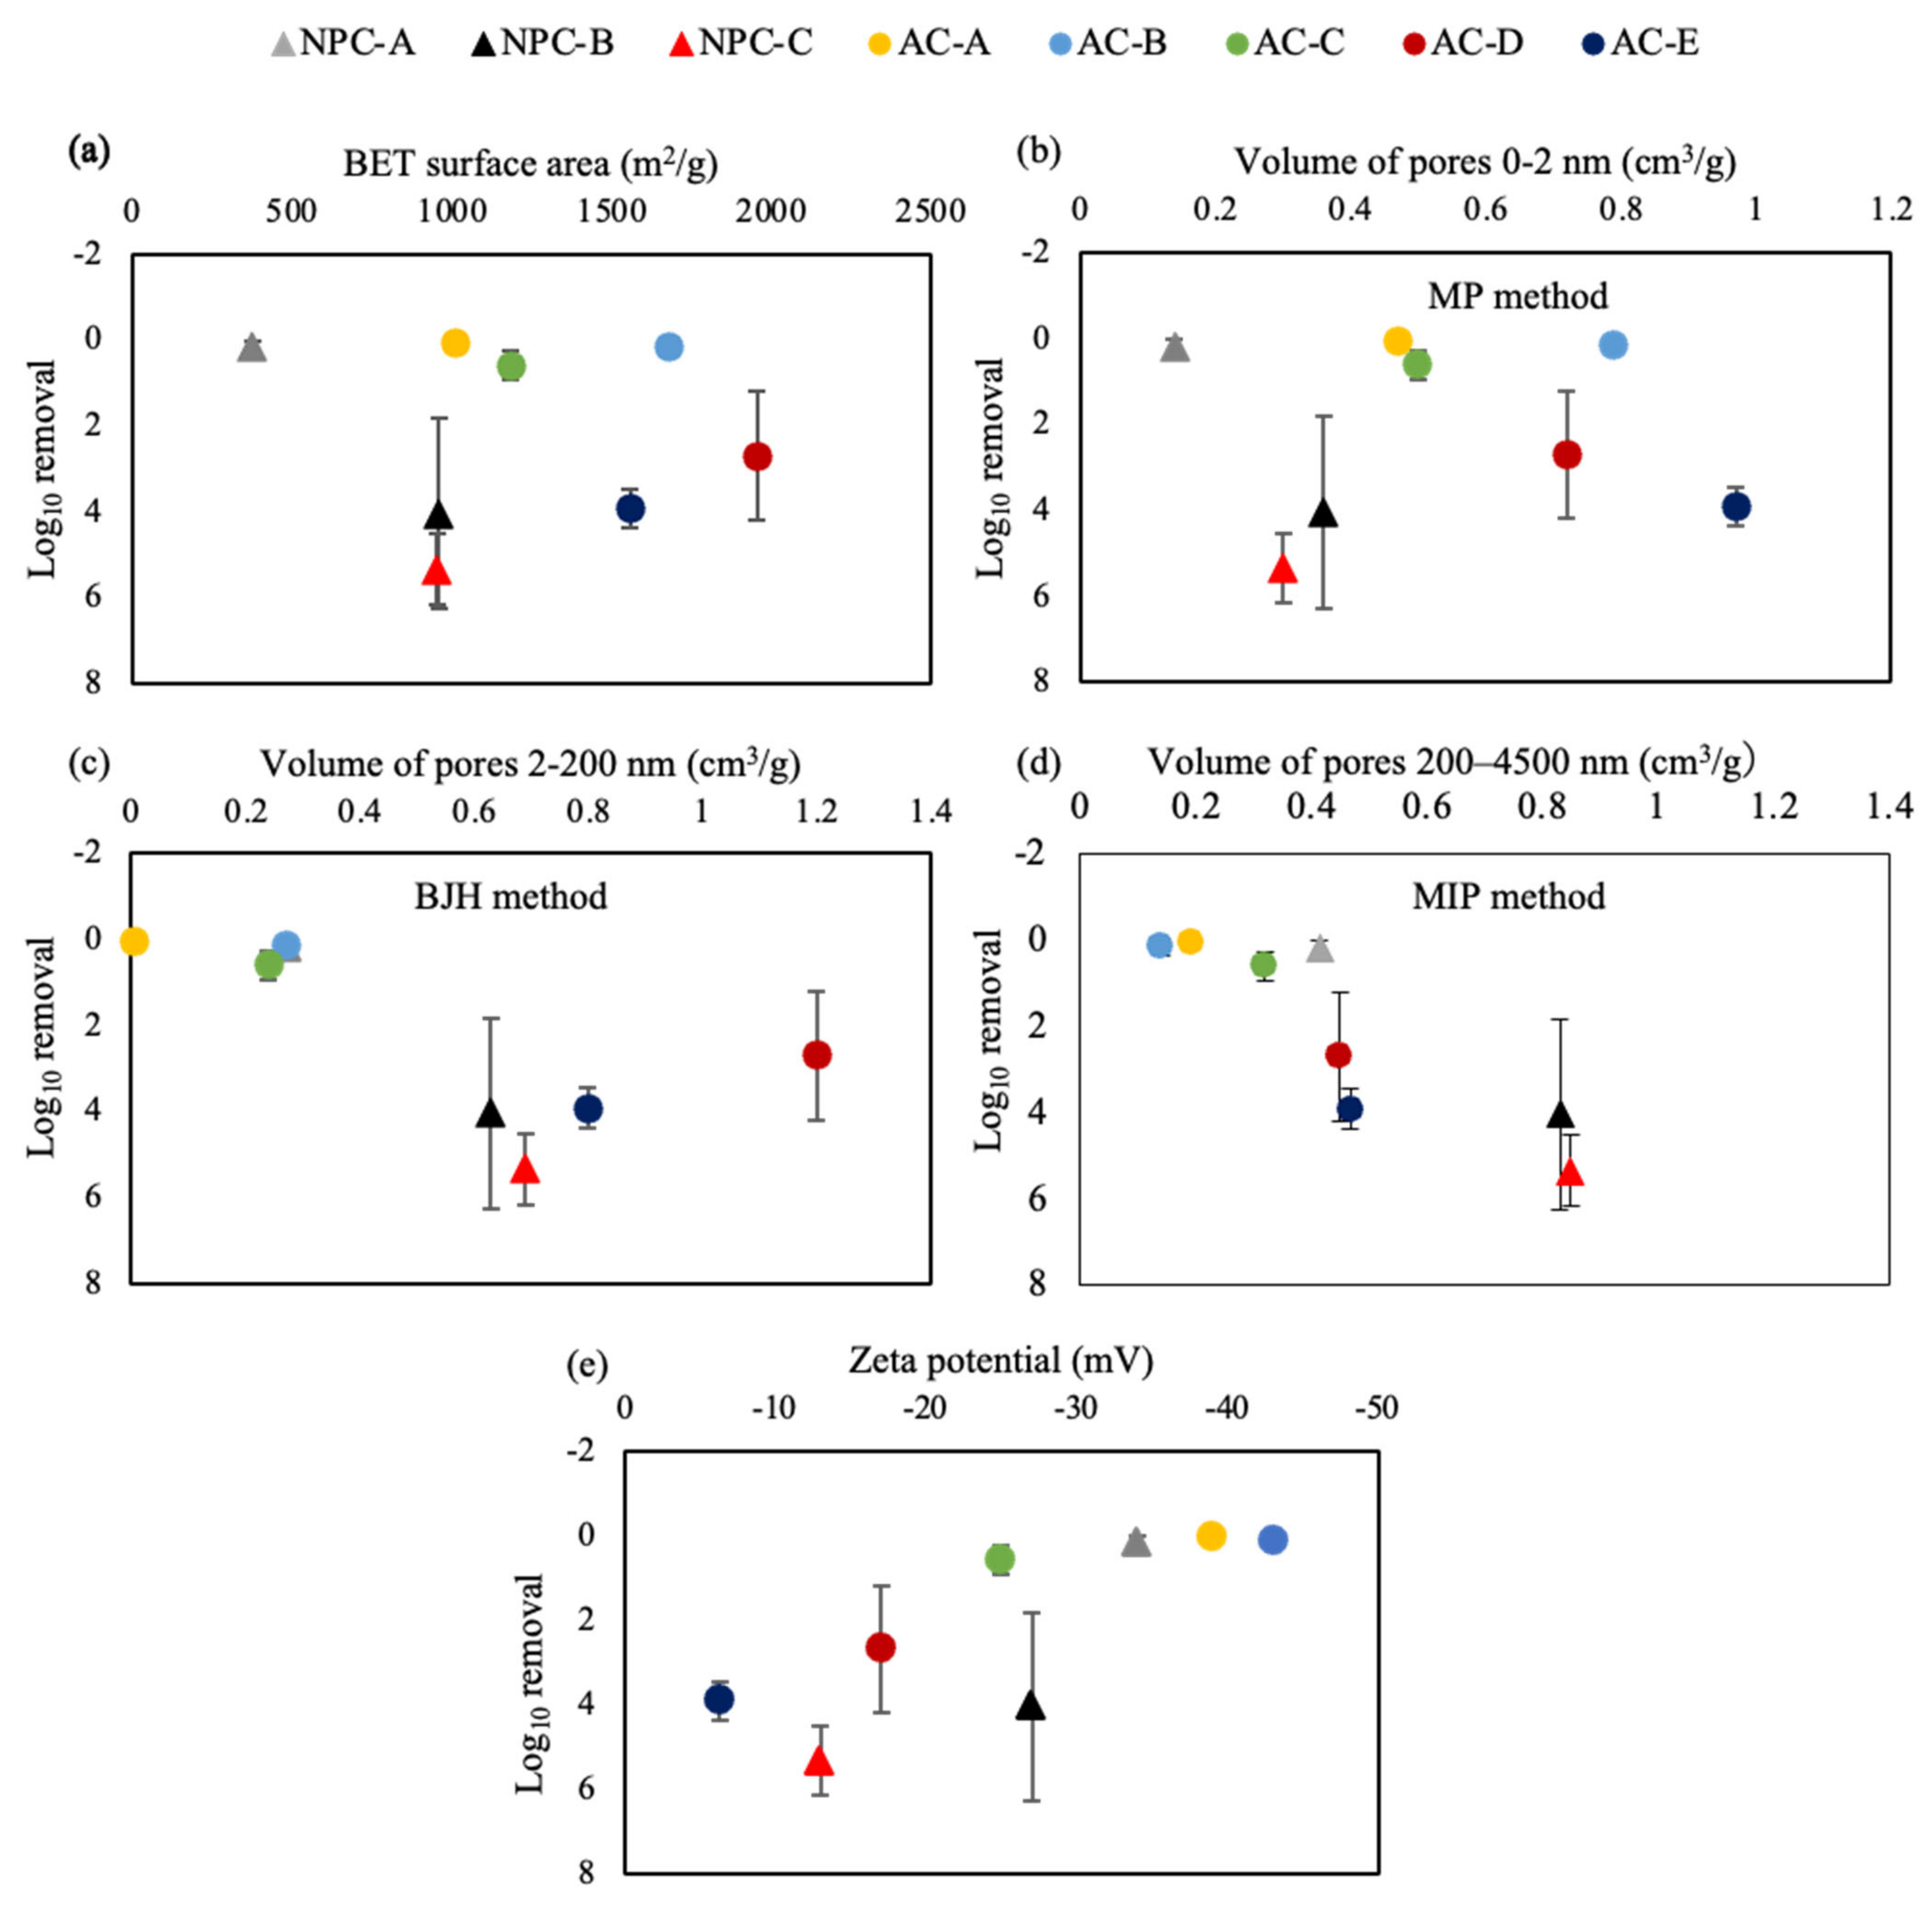
The adsorption capacity was expected to be higher with finer porous carbons due to the greater area per unit of weight material. However, a clear difference in virus removal was observed from the porous carbon materials with a similar range of particle size (0.23–0.50 mm) as that of the virus (Table 1). Moreover, although the NPCs had less BET surface areas than the ACs, they achieved a higher efficiency of virus removal (Table 1, Figure 4a). These results imply that the particle size and BET surface areas of porous carbon adsorbents might not be the dominant factors influencing the efficiency of virus removal. These findings are consistent with a previous study indicating that the particle size, specific surface area, and surface functional groups had no relationship with virus removal [17].
The adsorption of viruses on adsorbents is generally considered to be influenced by electrostatic interaction. The isoelectronic point (pI) of viruses is mostly found in a range from 3.5 to 7.0; therefore, viruses typically have a negative charge at neutral pH [31]. MS2 has the pI of 3.5 [32], indicating that MS2 has a negative charge under the experimental condition (the pH range between 7.0 and 7.6). All the porous carbon adsorbents tested in the current study also had a negative charge at neutral pH (the zeta potential ranging from −6.3 to −43 mV) (Table 1). In general, it was likely that the adsorbents with a smaller negative charge (e.g., AC-D, AC-E, and NPC-C) removed MS2 greater than those with a higher negative charge (AC-A, AC-B, and NPC-A) (Figure 4e). However, when compared between AC-C (−25 mV) and NPC-B (−27 mV) or between AC-E (−6 mV) and NPC-C (−13 mV), the adsorbents (AC-C or AC-E) with a smaller negative charge were observed to remove MS2 less than the adsorbents (NPC-B or NPC-C) with a higher negative charge (Figure 4e). Thus, it is possible that the electrostatic interaction might not be a governing factor for the viral removal. A previous study also reported that the adsorption of viruses (phage MS2, fr, GA, and Qβ) on the negatively charged surfaces (e.g., amorphous silica and carboxyl-terminated self-assembled monolayers) might result from hydrophobic or van der Waals interactions rather than the electrostatics [32].
The pore size distribution was found to highly affect the adsorption capacity of porous carbons [33]. All the porous carbon adsorbents evaluated had a relatively similar pore size distribution with an exception for macropores ranging from 200–4500 nm in size (Figure 2c). In addition, the pores ranging from 200–4500 nm in size were likely associated with MS2 removal; conversely, no relationship was observed for other pore size ranges such as the MP pores (0–2 nm) and the BHJ pores (2–200 nm) (Figure 4b–d). Indeed, the adsorbents (NPC-B, NPC-C, AC-D, and AC-E) with a larger volume of pores ranging from 200–4500 nm in size showed greater MS2 removal than the adsorbents (NPC-A, AC-A, AC-B, and AC-C) with a smaller volume of pores in this size range (Figure 4d). Since MS2 ranges in size from 24 to 26 nm [34], MS2 might not be trapped in pores smaller than 24–26 nm. Therefore, it is possible that the pores larger than MS2 (particularly those 200–4500 nm in size) could provide good locations for the virus to settle in and thus be removed. Furthermore, the SEM images of the adsorbents (before the virus adsorption) indicate that the adsorbents with increased virus removal (NPC-B, NPC-C, AC-D, and AC-E) had rough surfaces with many large pores whereas those with less virus removal (NPC-A, AC-A, AC-B, and AC-C) had relatively smooth surfaces (Figure 1). This further confirms that large pore sizes were essential for the adsorbent to remove the virus.
Conversely, NPC-C seems to remove MS2 better than NPC-B even though they were made from the same source of rice husks and have a similar volume of 200–4500 nm pores (Figure 2c and Figure 4d). This might be due to the difference in the production processes between NPC-C and NPC-B. Indeed, NPC-C was treated with hydrochloric acid solution at the final step whereas NPC-B was not. It was previously reported that this acid treatment can change the surface properties and pore structure of porous carbons [30,35]. Thus, there is a possibility that the acid treatment improved the virus adsorption of NPC-C.
When comparing NPC-A, AC-C, AC-D, and AC-E, which had relatively similar peak heights at 200–4500 nm, NPC-A and AC-C were observed to remove a significantly lower amount of the virus than AC-D and AC-E (Figure 2c and Figure 3). This may have occurred because NPC-A (−34 mV) and AC-C (−25 mV) had a higher negative charge and so resulted in an electrostatic repulsion with the net negatively charged MS2 higher than AC-D (−6.3 mV) and AC-E (−17 mV). Moreover, NPC-A and AC-C (0.74–0.98 cm3/g) contained a smaller total volume of MIP pores (3–10,000 nm) than AC-D and AC-E (1.41–1.62 cm3/g) (Table 1). Therefore, they may have a reduced capacity to remove the virus compared with AC-D and AC-E. Furthermore, AC-E made from wood had a smaller volume of 200–4500 nm pores than NPC-B made from rice husks; however, they were comparable in MS2 removal (Figure 4d). This finding may have occurred because AC-E and NPC-B had a different pore size distribution in the range of 200–4500 nm. Indeed, AC-E had a peak widening from 1000 nm to 3000 nm, whereas NPC-B had a narrow peak at around 1000 nm (Figure 2c). It is possible that AC-E, with a greater fraction of large pores (1000–3000 nm), might provide a better diffusion of viruses and so removed viruses more effectively than NPC-B with a smaller fraction of large pores (1000–3000 nm). However, as the effects of pore structure and distribution on the virus adsorption are complicated, more studies are needed to provide better insights into the contribution of pore size distribution in removing viruses.
In a previous study, a pore size of 20–50 nm (mesopore) was found to be responsible for removing viruses (MS2 and Qβ) when tested with different AC materials [17]. This result is inconsistent with the current study indicating that virus removal might mainly occur with pore sizes of 200–4500 nm. It should be noted that the largest pore size range of the materials in the previous study was 20–50 nm. Thus, pores greater than 20–50 nm may also contribute to virus removal. Moreover, the current study performed the assessments by spiking MS2 stock solution (100 µL) into GT water (100 mL) in which the MS2 culture medium was diluted 1000-fold. At this dilution factor, organic compounds from the culture medium could unintentionally introduce into GT water (1.0 mg/L TOC) and make the final TOC concentration of 6.7 mg/L (data not shown). The presence of natural organic matter (NOM) was found to decrease the removal of MS2 due to the competition for adsorption sites on carbon adsorbent [36]. It was also found that NOM can cause a pore blockage on micropores and mesopores (2–50 nm), leading to the reduced adsorption of various trace organic compounds by activated carbon [37,38,39]. Therefore, virus removal might rely on large pores (such as 200–4500 nm) in this current study.
Previous studies reported that viruses were not removed effectively by activated carbons. Particularly, activated carbon (1 g/L, 300–425 µm in size) was able to remove only 70% of bacteriophage T7 (less than 1 log) in phosphate buffer after a 2 h contact period [14]. In another study, powdered activated carbons (0.4 g/L) were found to remove only 22% and 92% of poliovirus in secondary effluent which was undiluted and diluted 10 times after a 3 h contact period, respectively. More recently, Matsushita et al. [17] compared the viral removal between normal powdered activated carbons (N-PACs) and super-powdered activated carbons (S-PACs) at the dose of 20 mg/L in buffered Milli-Q water (20 mg CaCO3/L of alkalinity). Although S-PACs were found to remove viruses more effectively than N-PACs, the highest removal of MS2 was observed at only around 3.0 log (99.9%) after a long contact period (8 h).
In comparison to previous studies, it is likely that the performance of NPCs in the current study was more effective since they could achieve a higher virus removal (up to 5.3 log) in a shorter contact period (60 min). In addition, the presence of organic compounds (6.7 mg/L TOC) in the current study might have reduced the efficiency of NPCs for viral removal. The performance of NPCs might be more efficient in clean water (e.g., phosphate buffer and Milli-Q water) used in the previous studies [14,17]. However, it should be noted that the dose of the adsorbents used in the current study (10 g/L) was also higher than that of previous studies (0.02–1.0 g/L). Therefore, more studies are needed to compare the efficiency of different adsorbents for viral removal under the same experimental conditions (e.g., the adsorbent dose, target virus, type of water, and level of organic compounds).
4. Conclusions
The performance of porous carbon adsorbents for virus removal can be affected by their pore size distribution. The pores larger than the virus (particularly 200–4500 nm) were more likely to contribute to removing MS2 than micropores (<2 nm) and mesopores (2–50 nm). Among the adsorbents tested, NPC-C, which had a greater volume of 200–4500 nm pores, was able to remove MS2 better than the other adsorbents. The significant proportion of large pores in NPC-C might result from its production processes from rice husks in which the removal of silica, steam activation, and acid rinse were applied. Thus, NPC-C displays the potential for use as an efficient adsorbent for virus removal during water purification.
Author Contributions
Conceptualization, V.D.C., S.T. and H.K.; methodology, V.D.C. and S.T.; validation, S.T., S.Y., Y.O., T.Y., H.F. and H.K.; formal analysis, V.D.C., Y.O., T.Y. and S.T.; visualization, V.D.C. and S.T.; writing—original draft preparation, V.D.C.; writing—review and editing, S.T., S.Y., Y.O., T.Y., H.F. and H.K.; supervision, H.K. All authors have read and agreed to the published version of the manuscript.
Funding
This research received no external funding.
Institutional Review Board Statement
Not applicable.
Informed Consent Statement
Not applicable.
Data Availability Statement
The data that support the findings of this study are available from the corresponding author upon reasonable request.
Acknowledgments
The authors would like to thank Shotaro Torii for his support in preparing the GT water.
Conflicts of Interest
The authors declare no conflict of interest.
References
- WHO/UNICEF. Progress on Household Drinking Water, Sanitation and Hygiene 2000–2017; WHO: Geneva, Switzerland, 2019. [Google Scholar]
- Elliott, M.A.; Stauber, C.E.; Koksal, F.; DiGiano, F.A.; Sobsey, M.D. Reductions of E. coli, echovirus type 12 and bacteriophages in an intermittently operated household-scale slow sand filter. Water Res. 2008, 42, 2662–2670. [Google Scholar] [CrossRef] [PubMed]
- Pooi, C.K.; Ng, H.Y. Review of low-cost point-of-use water treatment systems for developing communities. Clean Water 2018, 1, 11. [Google Scholar] [CrossRef]
- Fong, T.-T.; Lipp, E.K. Enteric viruses of humans and animals in aquatic environments: Health risks, detection, and potential water quality assessment tools. Microbiol. Mol. Biol. Rev. 2005, 69, 357–371. [Google Scholar] [CrossRef] [PubMed] [Green Version]
- Locas, A.; Barthe, C.; Barbeau, B.; Carrière, A.; Payment, P. Virus occurrence in municipal groundwater sources in Quebec, Canada. Can. J. Microbiol. 2007, 53, 688–694. [Google Scholar] [CrossRef]
- Chigor, V.N.; Okoh, A.I. Quantitative RT-PCR detection of hepatitis A virus, rotaviruses and enteroviruses in the Buffalo River and source water dams in the Eastern Cape Province of South Africa. Int. J. Environ. Res. Public Health 2012, 9, 4017–4032. [Google Scholar] [CrossRef] [PubMed]
- Lodder, W.J.; Van Den Berg, H.H.J.L.; Rutjes, S.A.; Husman, A.M.D.R. Presence of enteric viruses in source waters for drinking water production in The Netherlands. Appl. Environ. Microbiol. 2010, 76, 5965–5971. [Google Scholar] [CrossRef] [Green Version]
- Prevost, B.; Goulet, M.; Lucas, F.S.; Joyeux, M.; Moulin, L.; Wurtzer, S. Viral persistence in surface and drinking water: Suitability of PCR pre-treatment with intercalating dyes. Water Res. 2016, 91, 68–76. [Google Scholar] [CrossRef]
- Asami, T.; Katayama, H.; Torrey, J.R.; Visvanathan, C.; Furumai, H. Evaluation of virus removal efficiency of coagulation-sedimentation and rapid sand filtration processes in a drinking water treatment plant in Bangkok, Thailand. Water Res. 2016, 101, 84–94. [Google Scholar] [CrossRef]
- Dias, J.M.; Alvim-Ferraz, M.C.M.; Almeida, M.F.; Rivera-Utrilla, J.; Sánchez-Polo, M. Waste materials for activated carbon preparation and its use in aqueous-phase treatment: A review. J. Environ. Manag. 2007, 85, 833–846. [Google Scholar] [CrossRef] [PubMed]
- Quinlivan, P.A.; Li, L.; Knappe, D.R.U. Effects of activated carbon characteristics on the simultaneous adsorption of aqueous organic micropollutants and natural organic matter. Water Res. 2005, 39, 1663–1673. [Google Scholar] [CrossRef] [PubMed]
- Kaleta, J.; Kida, M.; Koszelnik, P.; Papciak, D.; Puszkarewicz, A.; Tchórzewska-Ciealak, B. The use of activated carbons for removing organic matter from groundwater. Arch. Environ. Prot. 2017, 43, 32–41. [Google Scholar] [CrossRef]
- Gerba, C.P.; Sobsey, M.D.; Wallis, C.; Melnick, J.L. Adsorption of poliovirus onto activated carbon in wastewater. Environ. Sci. Technol. 1975, 9, 727–731. [Google Scholar] [CrossRef]
- Oza, P.P.; Chaudhuri, M. Removal of viruses from water by sorption on coal. Water Res. 1975, 9, 707–712. [Google Scholar] [CrossRef]
- Hijnen, W.A.M.; Suylen, G.M.H.; Bahlman, J.A.; Brouwer-Hanzens, A.; Medema, G.J. GAC adsorption filters as barriers for viruses, bacteria and protozoan (oo)cysts in water treatment. Water Res. 2010, 44, 1224–1234. [Google Scholar] [CrossRef]
- Persson, F.; Långmark, J.; Heinicke, G.; Hedberg, T.; Tobiason, J.; Stenström, T.A.; Hermansson, M. Characterisation of the behaviour of particles in biofilters for pre-treatment of drinking water. Water Res. 2005, 39, 3791–3800. [Google Scholar] [CrossRef]
- Matsushita, T.; Suzuki, H.; Shirasaki, N.; Matsui, Y.; Ohno, K. Adsorptive virus removal with super-powdered activated carbon. Sep. Purif. Technol. 2013, 107, 79–84. [Google Scholar] [CrossRef]
- Cookson, J.T. Adsorption of Viruses on Activated Carbon. Adsorption of Escherichia Coli Bacteriophage T4 on Activated Carbon as a Diffused Limited. Process. Environ. Sci. Technol. 1967, 1, 157–160. [Google Scholar] [CrossRef]
- Zdravkov, B.D.; Cermak, J.J.; Sefara, M.; Janku, J. Pore classification in the characterization of porous materials: A perspective. Cent. Eur. J. Chem. 2007, 5, 385–395. [Google Scholar] [CrossRef]
- Tabata, S.; Iida, H.; Horie, T.; Yamada, S. Hierarchical porous carbon from cell assemblies of rice husk for in vivo applications. MedChemComm 2010, 1, 136–138. [Google Scholar] [CrossRef]
- Li, L.; Quinlivan, P.A.; Knappe, D.R.U. Effects of activated carbon surface chemistry and pore structure on the adsorption of organic contaminants from aqueous solution. Carbon 2002, 40, 2085–2100. [Google Scholar] [CrossRef]
- Moreno-Castilla, C. Adsorption of organic molecules from aqueous solutions on carbon materials. Carbon 2004, 42, 83–94. [Google Scholar] [CrossRef] [Green Version]
- Boudaud, N.; Machinal, C.; David, F.; Fréval-Le Bourdonnec, A.; Jossent, J.; Bakanga, F.; Arnal, C.; Jaffrezic, M.P.; Oberti, S.; Gantzer, C. Removal of MS2, Qb and GA bacteriophages during drinking water treatment at pilot scale. Water Res. 2012, 46, 2651–2664. [Google Scholar] [CrossRef]
- Elhadidy, A.M.; Peldszus, S.; Van Dyke, M.I. An evaluation of virus removal mechanisms by ultrafiltration membranes using MS2 and φx174 bacteriophage. Sep. Purif. Technol. 2013, 120, 215–223. [Google Scholar] [CrossRef]
- Gutierrez, L.; Li, X.; Wang, J.; Nangmenyi, G.; Economy, J.; Kuhlenschmidt, T.B.; Kuhlenschmidt, M.S.; Nguyen, T.H. Adsorption of rotavirus and bacteriophage MS2 using glass fiber coated with hematite nanoparticles. Water Res. 2009, 43, 5198–5208. [Google Scholar] [CrossRef]
- Furuse, K.; Sakurai, T.; Hirashima, A.; Katsuki, M.; Ando, A.; Watanabe, I. Distribution of ribonucleic acid coliphages in South and East Asia. Appl. Environ. Microbiol. 1978, 35, 995–1002. [Google Scholar] [CrossRef] [PubMed] [Green Version]
- Torii, S.; Hashimoto, T.; Do, A.T.; Furumai, H.; Katayama, H. Repeated pressurization as a potential cause of deterioration in virus removal by aged reverse osmosis membrane used in households. Sci. Total Environ. 2019, 695, 133814. [Google Scholar] [CrossRef] [PubMed]
- WHO. International Scheme to Evaluate Household Water Treatment Technologies. Harmonized Testing Protocol: Technology Non-Specific; WHO: Geneva, Switzerland, 2014. [Google Scholar]
- Tadda, M.A.; Ahsan, A.; Shitu, A.; Elsergany, M.; Arunkumar, T.; Jose, B.; Razzaque, M.A.; Daud, N.N.N. A review on activated carbon: Process, application and prospects. J. Adv. Civ. Eng. Pract. Res. 2016, 2, 7–13. [Google Scholar]
- Wang, S.; Lu, G.Q. Effects of acidic treatments on the pore and surface properties of ni catalyst supported on activated carbon. Carbon 1998, 36, 283–292. [Google Scholar] [CrossRef]
- Michen, B.; Graule, T. Isoelectric points of viruses. J. Appl. Microbiol. 2010, 109, 388–397. [Google Scholar] [CrossRef] [Green Version]
- Armanious, A.; Aeppli, M.; Jacak, R.; Refardt, D.; Sigstam, T.; Kohn, T.; Sander, M. Viruses at Solid-Water Interfaces: A systematic assessment of interactions driving adsorption. Environ. Sci. Technol. 2016, 50, 732–743. [Google Scholar] [CrossRef]
- Ilomuanya, M.O.; Nashiru, B.; Ifudu, N.D.; Igwilo, C.I. Effect of pore size and morphology of activated charcoal prepared from midribs of Elaeis guineensis on adsorption of poisons using metronidazole and Escherichia coli O157: H7 as a case study. J. Microsc. Ultrastruct. 2017, 5, 32–38. [Google Scholar] [CrossRef] [Green Version]
- Wick, C.H.; McCubbin, P.E. Characterization of purified MS2 bacteriophage by the physical counting methodology used in the integrated virus detection system (IVDS). Toxicol. Methods 1999, 9, 245–252. [Google Scholar] [CrossRef]
- Nuithitikul, K.; Srikhun, S.; Hirunpradikoon, S. Influences of pyrolysis condition and acid treatment on properties of durian peel-based activated carbon. Bioresour. Technol. 2010, 101, 426–429. [Google Scholar] [CrossRef] [PubMed]
- Jacquin, C.; Yu, D.; Sander, M.; Domagala, K.W.; Traber, J.; Morgenroth, E.; Julian, T.R. Competitive co-adsorption of bacteriophage MS2 and natural organic matter onto multiwalled carbon nanotubes. Water Res. X 2020, 9, 100058. [Google Scholar] [CrossRef] [PubMed]
- Li, Q.; Snoeyink, V.L.; Mariñas, B.J.; Campos, C. Pore blockage effect of NOM on atrazine adsorption kinetics of PAC: The roles of PAC pore size distribution and NOM molecular weight. Water Res. 2003, 37, 4863–4872. [Google Scholar] [CrossRef] [PubMed]
- Dastgheib, S.A.; Karanfil, T.; Cheng, W. Tailoring activated carbons for enhanced removal of natural organic matter from natural waters. Carbon 2004, 42, 547–557. [Google Scholar] [CrossRef]
- Ding, L.; Snoeyink, V.L.; Mariñas, B.J.; Yue, Z.; Economy, J. Effects of powdered activated carbon pore size distribution on the competitive adsorption of aqueous atrazine and natural organic matter. Environ. Sci. Technol. 2008, 42, 1227–1231. [Google Scholar] [CrossRef]
Figure 1.
SEM images of different porous carbon adsorbents (before the virus adsorption) at a magnification of 200k.
Figure 1.
SEM images of different porous carbon adsorbents (before the virus adsorption) at a magnification of 200k.

Figure 2.
The pore size distribution of different porous carbon adsorbents measured by the MP (a), BJH (b), and MIP (c) methods. Vp and Dp represent the pore volume (cm3) and pore diameter (nm), respectively.
Figure 2.
The pore size distribution of different porous carbon adsorbents measured by the MP (a), BJH (b), and MIP (c) methods. Vp and Dp represent the pore volume (cm3) and pore diameter (nm), respectively.

Figure 3.
Removal of MS2 by NPCs (a) and ACs (b) at different contact times (0, 20, 40, and 60 min). Error bars indicate the standard deviation (n = 3).
Figure 3.
Removal of MS2 by NPCs (a) and ACs (b) at different contact times (0, 20, 40, and 60 min). Error bars indicate the standard deviation (n = 3).

Figure 4.
Relationship between MS2 removal and the BET surface area (a) and the volume of MP pores ranging from 0–2 nm (b), BJH pores ranging from 2–200 nm (c), MIP pores ranging from 200–4500 nm (d), and zeta potential (e) for NPCs and ACs at the contact time of 60 min. Error bars indicate the standard deviation (n = 3).


Table 1.
Characteristics of three NPCs and five commercially available types of ACs.
| Carbon Adsorbent | Porous Carbon | Conventional Activated Carbon | ||||||
|---|---|---|---|---|---|---|---|---|
| Types of Materials | NPC-A a | NPC-B b | NPC-C c | AC-A | AC-B | AC-C | AC-D | AC-E |
| Raw materials | Rice husk | Coconut husk | Wood | |||||
| Density (g/cm3) | 0.335 | 0.216 | 0.218 | 0.531 | 0.399 | 0.341 | 0.18 | 0.165 |
| Particle size | 30/60 mesh (particle size 0.23–0.50 mm) | |||||||
| N2-BET surface area (m2/g) | 376 | 960 | 954 | 1016 | 1680 | 1187 | 1958 | 1561 |
| MP pore volume (cm3/g) (<2 nm) | 0.14 | 0.36 | 0.30 | 0.47 | 0.79 | 0.50 | 0.97 | 0.72 |
| BJH pore volume (cm3/g) (2–200 nm) | 0.27 | 0.63 | 0.69 | 0.0052 | 0.27 | 0.24 | 0.80 | 1.2 |
| MIP pore volume (cm3/g) (3–10,000 nm) | 0.89 | 1.62 | 1.71 | 0.36 | 0.59 | 0.74 | 1.41 | 1.62 |
| Zeta potential (mV) | −34 | −27 | −13 | −39 | −43 | −25 | −6.3 | −17 |
a Production process: silica removal; b production process: silica removal and steam activation; c production process: silica removal, steam activation, and washing by hydrochloric acid.
Publisher’s Note: MDPI stays neutral with regard to jurisdictional claims in published maps and institutional affiliations. |
© 2021 by the authors. Licensee MDPI, Basel, Switzerland. This article is an open access article distributed under the terms and conditions of the Creative Commons Attribution (CC BY) license (https://creativecommons.org/licenses/by/4.0/).
Share and Cite
MDPI and ACS Style
Canh, V.D.; Tabata, S.; Yamanoi, S.; Onaka, Y.; Yokoi, T.; Furumai, H.; Katayama, H. Evaluation of Porous Carbon Adsorbents Made from Rice Husks for Virus Removal in Water. Water 2021, 13, 1280. https://doi.org/10.3390/w13091280
AMA Style
Canh VD, Tabata S, Yamanoi S, Onaka Y, Yokoi T, Furumai H, Katayama H. Evaluation of Porous Carbon Adsorbents Made from Rice Husks for Virus Removal in Water. Water. 2021; 13(9):1280. https://doi.org/10.3390/w13091280
Chicago/Turabian StyleCanh, Vu Duc, Seiichiro Tabata, Shun Yamanoi, Yoichi Onaka, Toshiyuki Yokoi, Hiroaki Furumai, and Hiroyuki Katayama. 2021. "Evaluation of Porous Carbon Adsorbents Made from Rice Husks for Virus Removal in Water" Water 13, no. 9: 1280. https://doi.org/10.3390/w13091280
Note that from the first issue of 2016, this journal uses article numbers instead of page numbers. See further details here.