
Unraveling the Water-Energy-Food-Environment Nexus for Climate Change Adaptation in Iran: Urmia Lake Basin Case-Study

 ,
, 

Abstract
:
1. Introduction
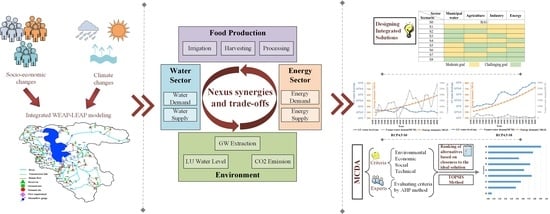
- To propose a new framework for investigating the role of different sectors in the future of Urmia Lake Basin;
- To quantify the cross-sector interlinkages and resource dependence of water, energy, and agriculture sectors and the related environmental impacts;
- To assess the impact of climate change and policy scenarios on the future of Urmia Lake Basin and evaluate the consequences of implementing each policy scenario on achieving sustainable development.
2. Materials and Methods
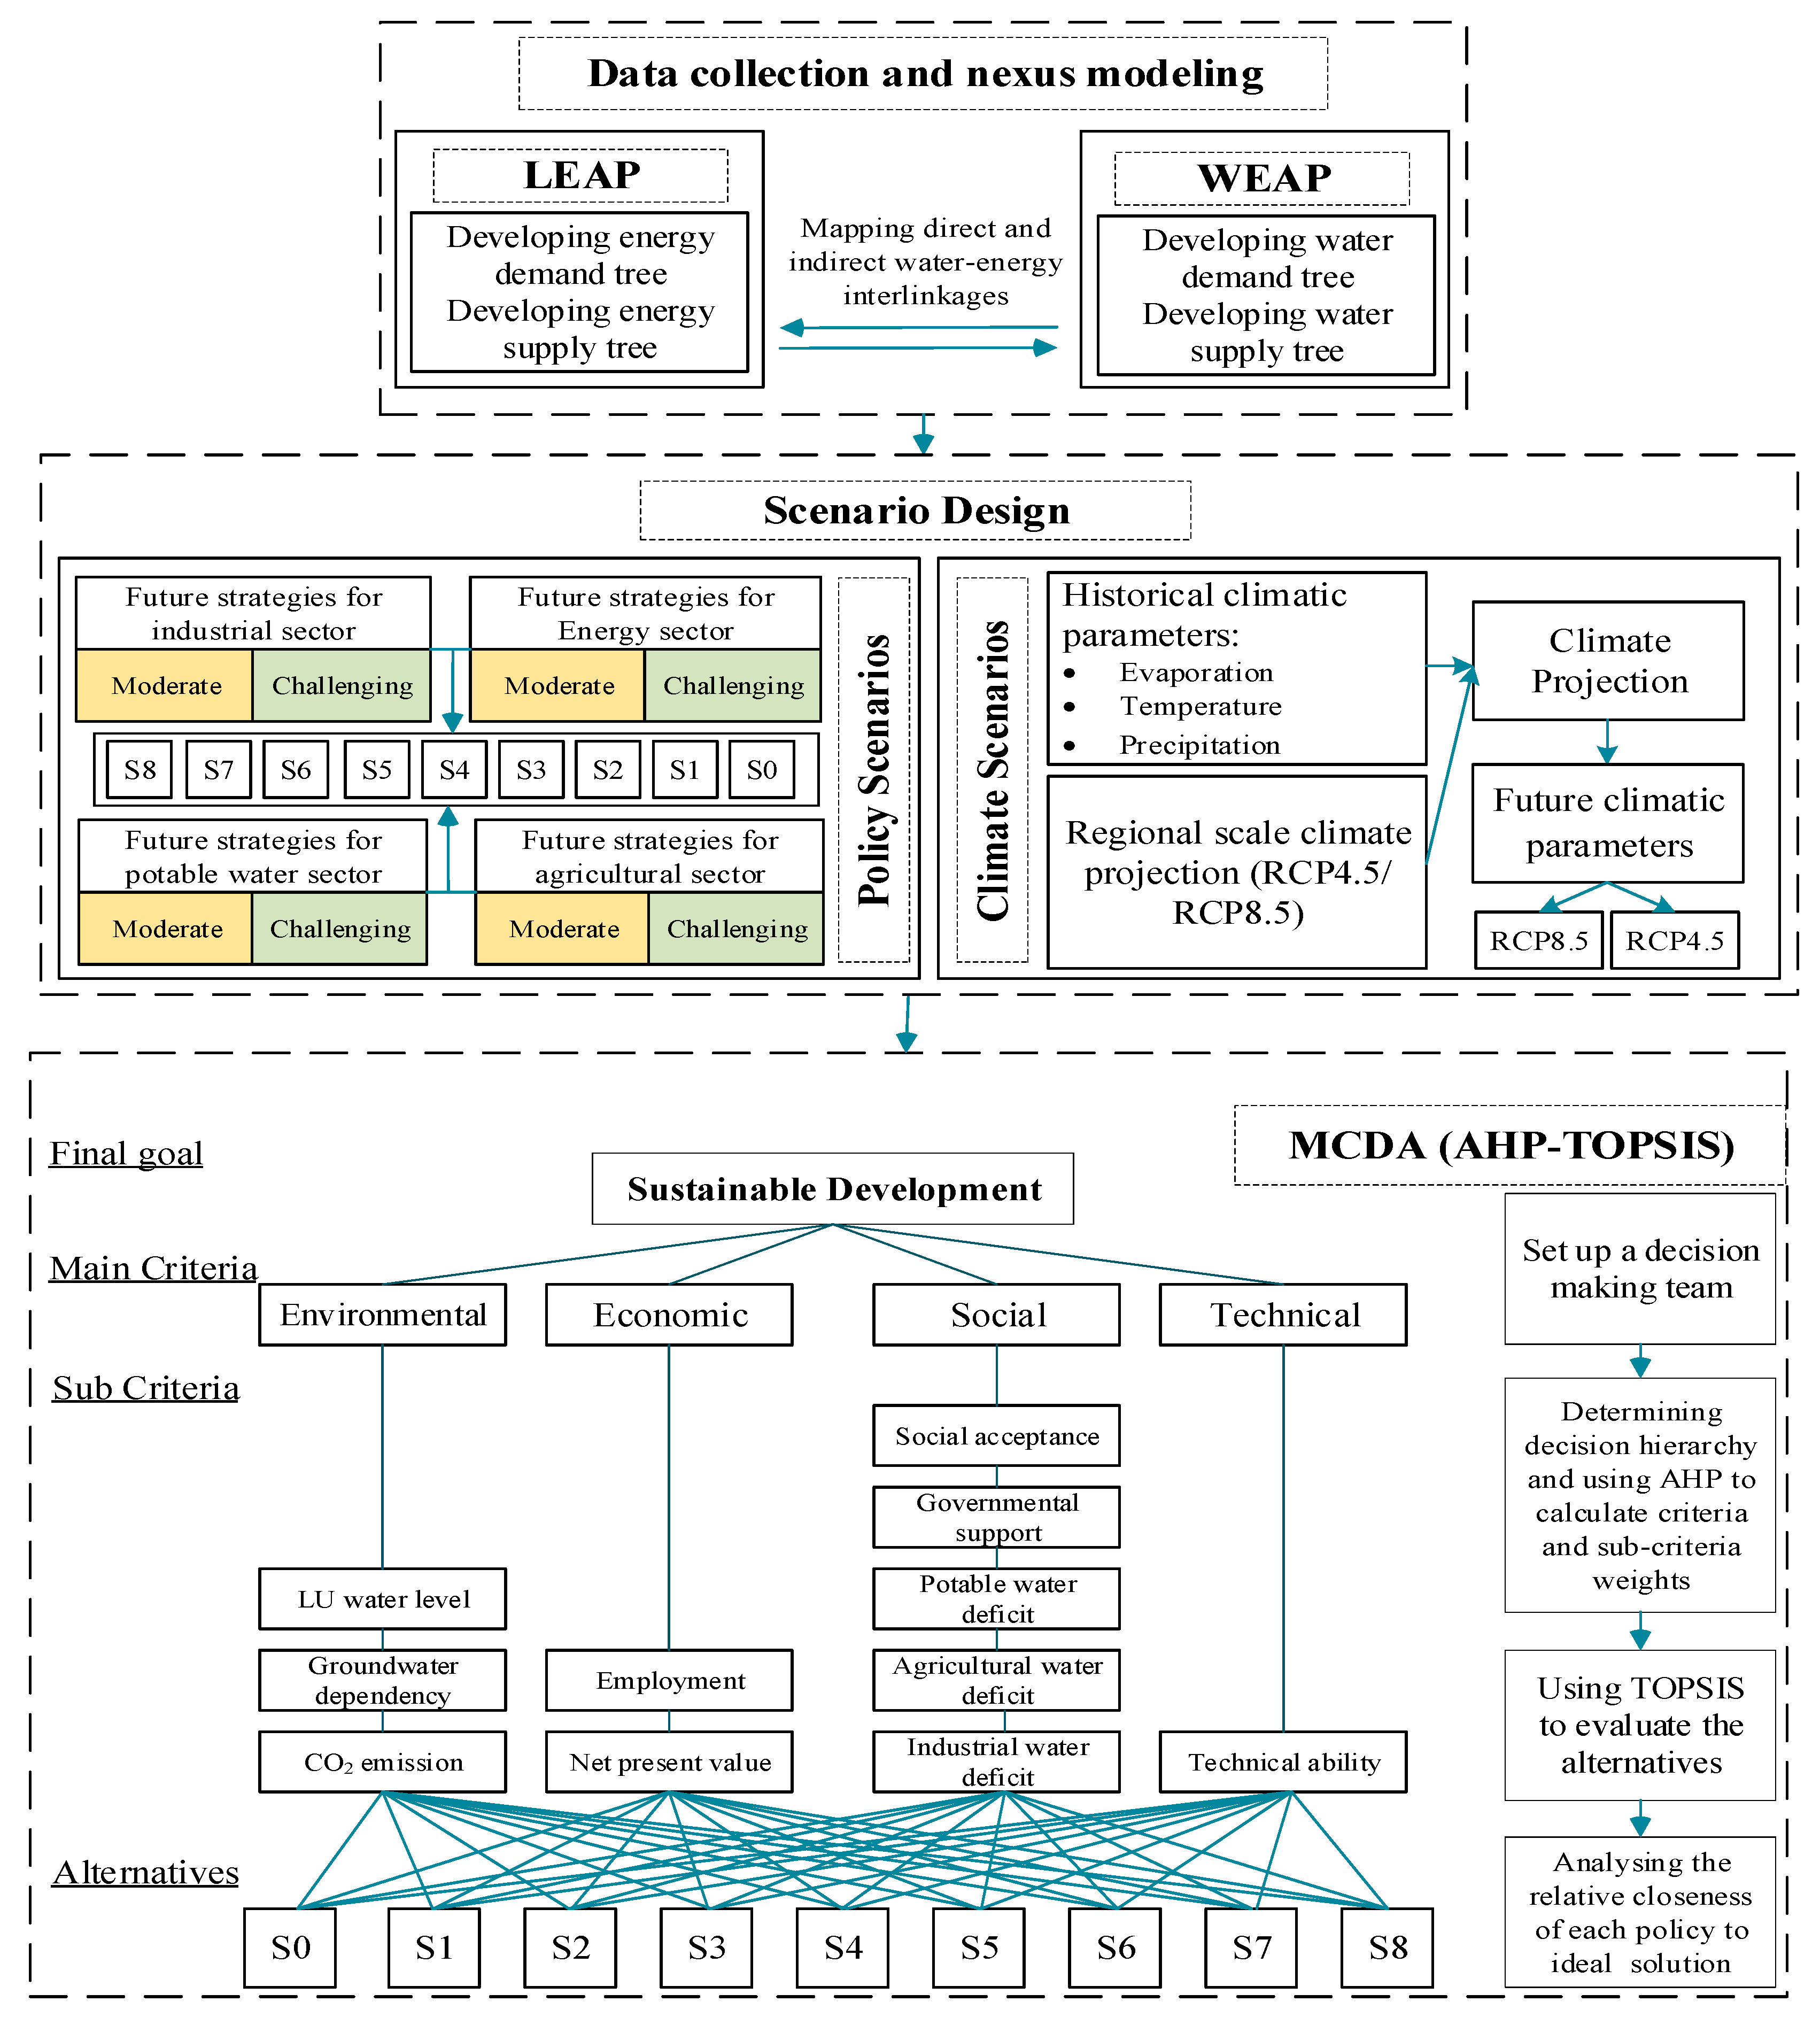
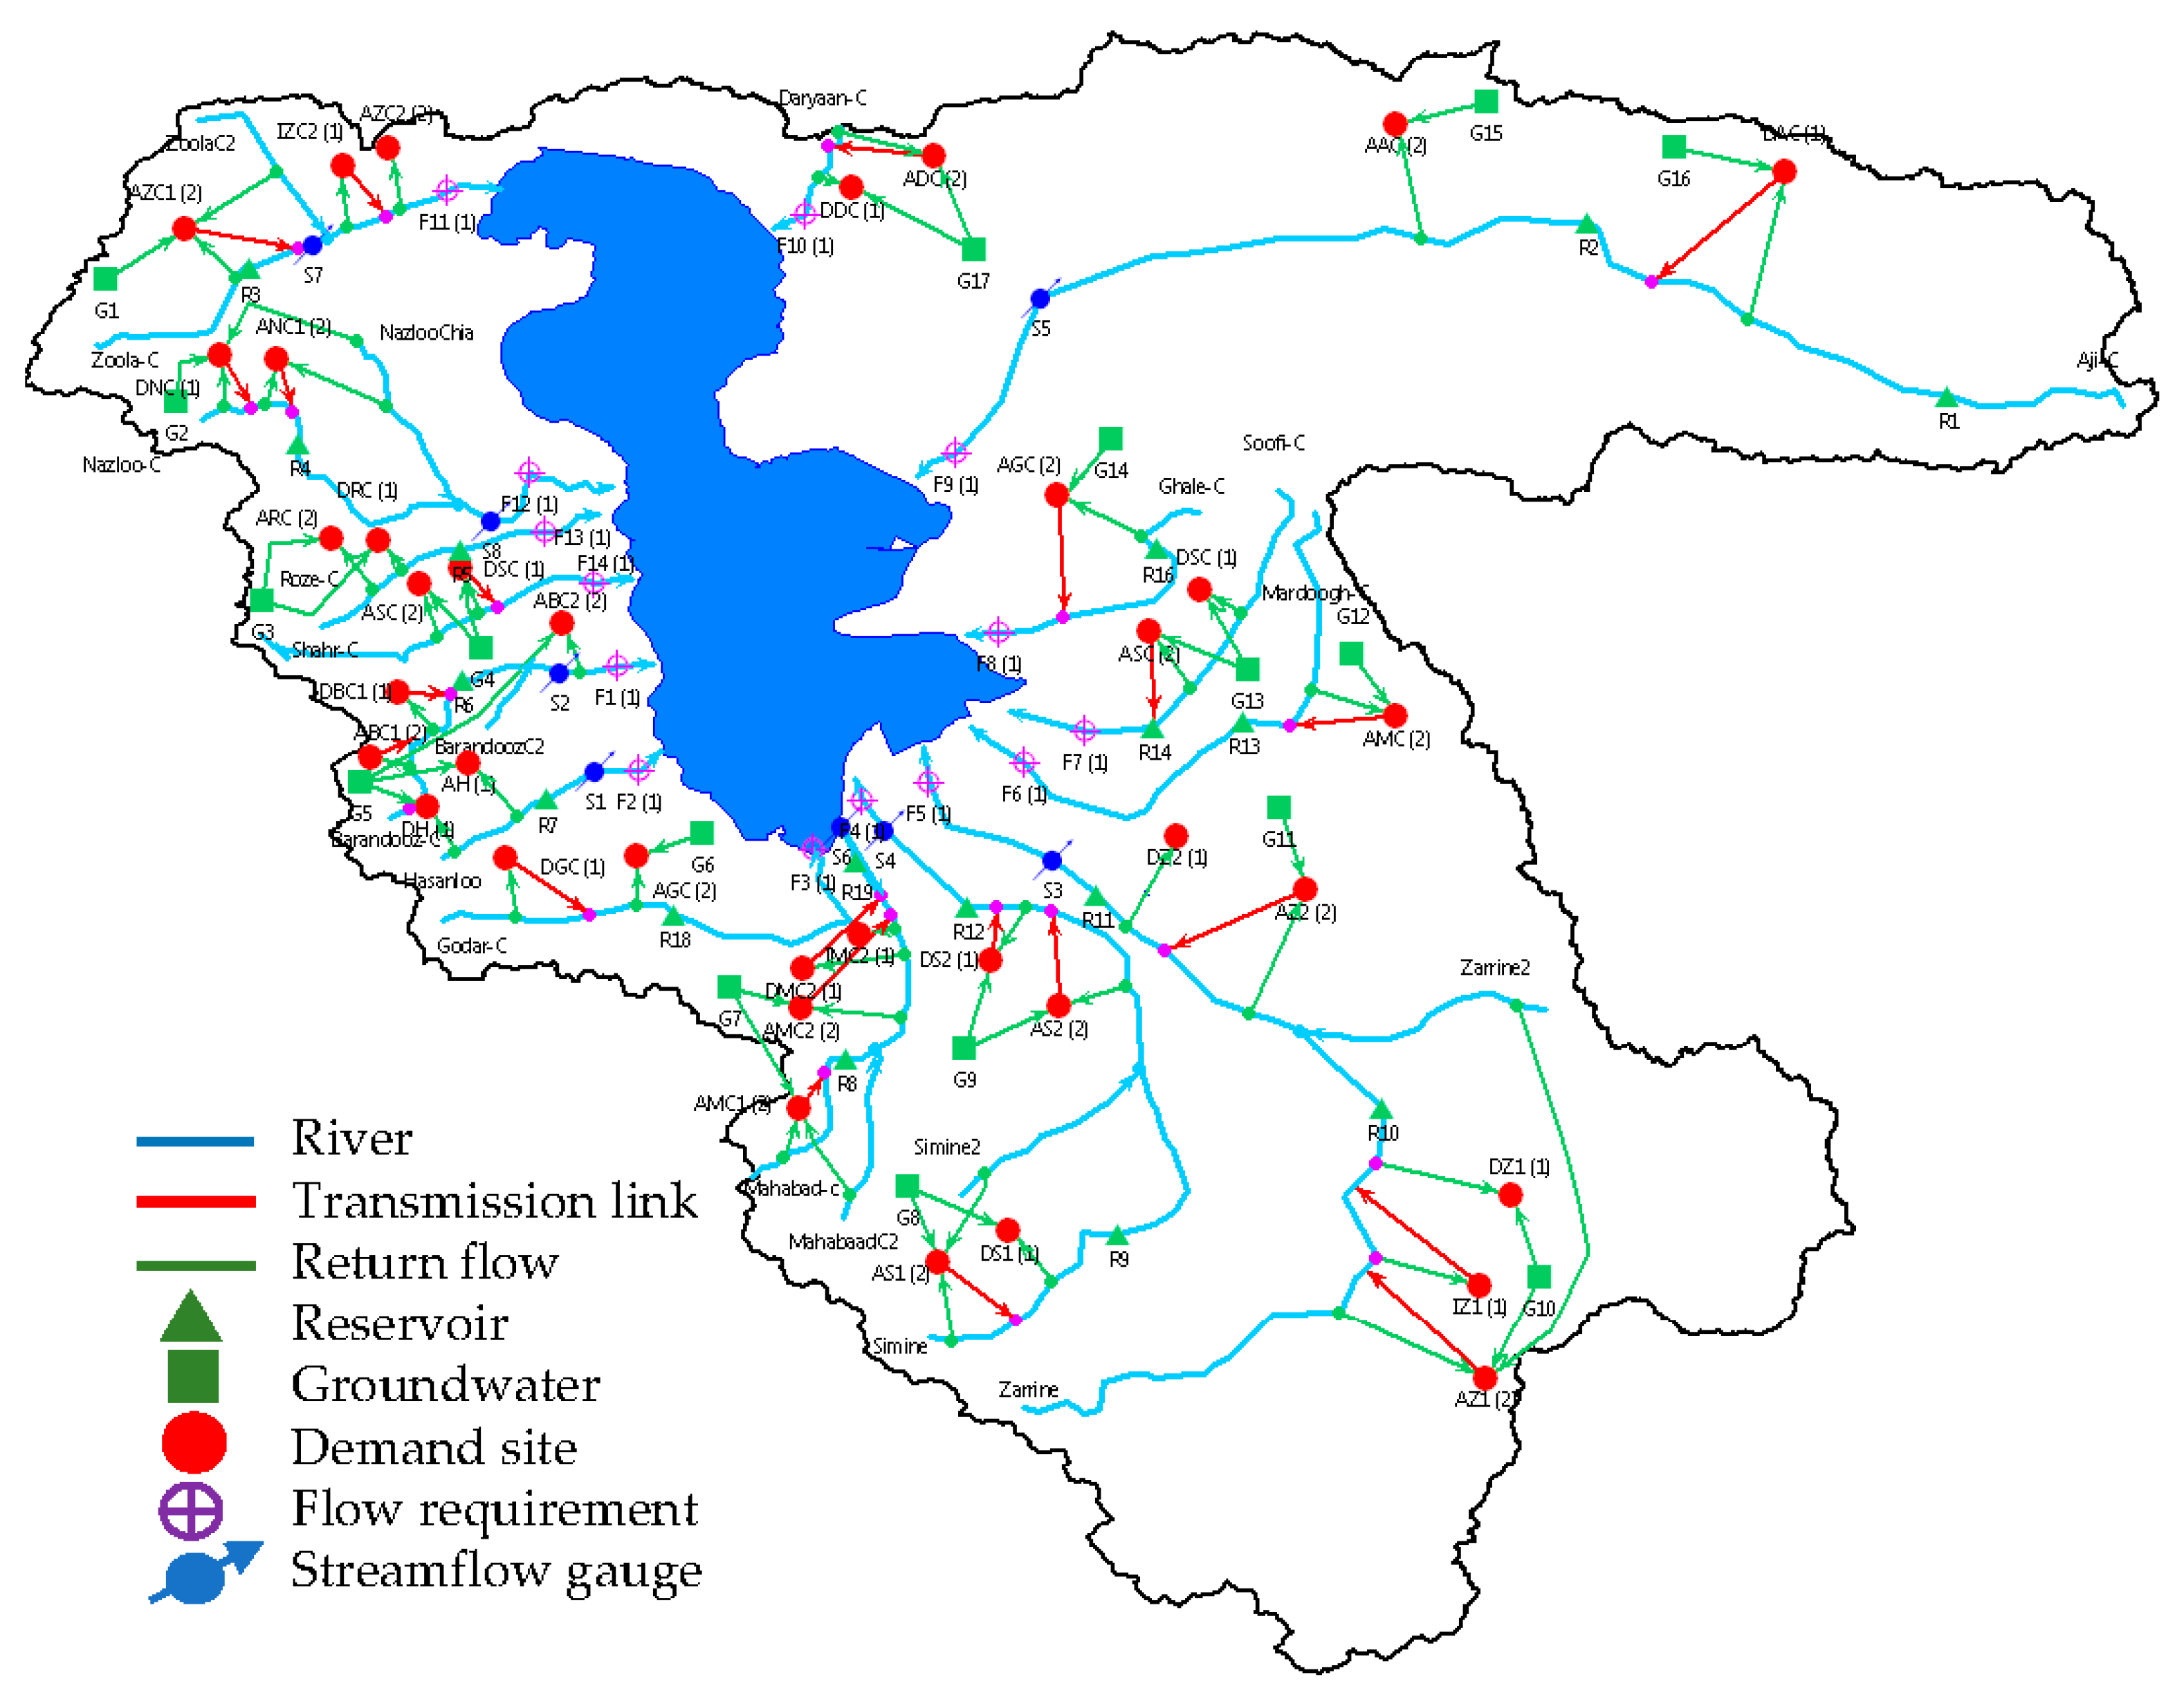
2.1. Study Area
2.2. Data
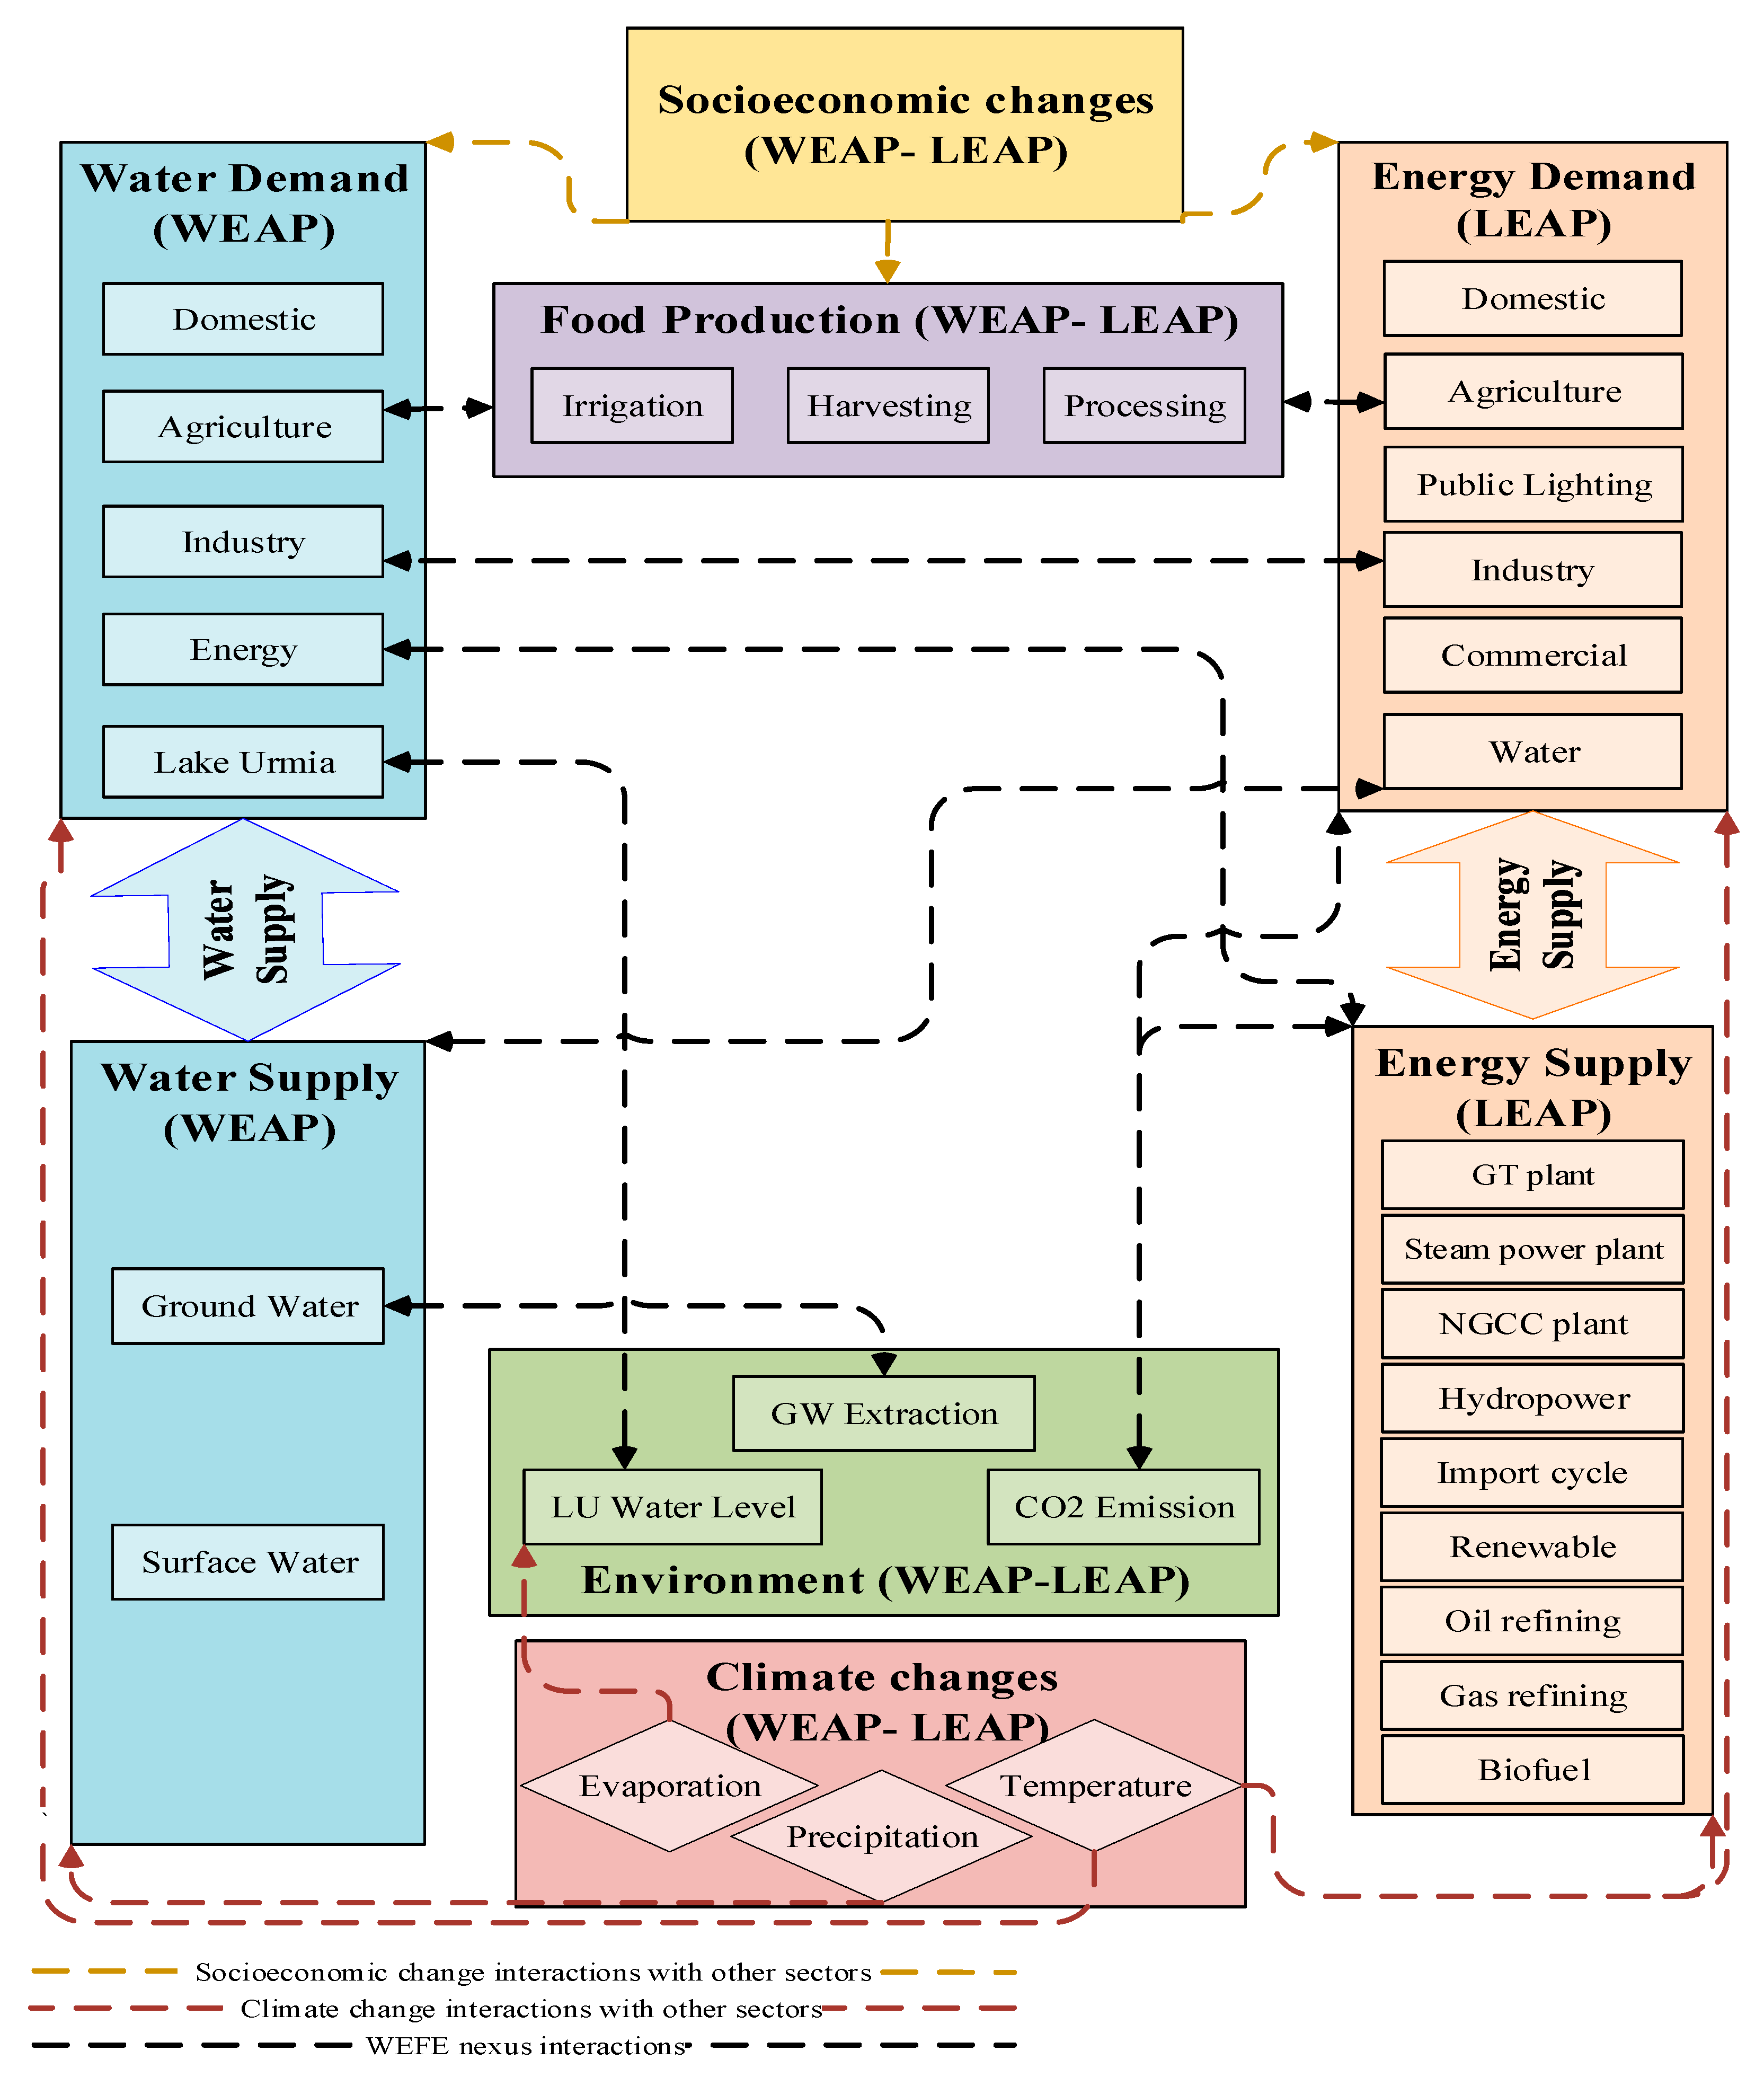
2.3. Nexus Method
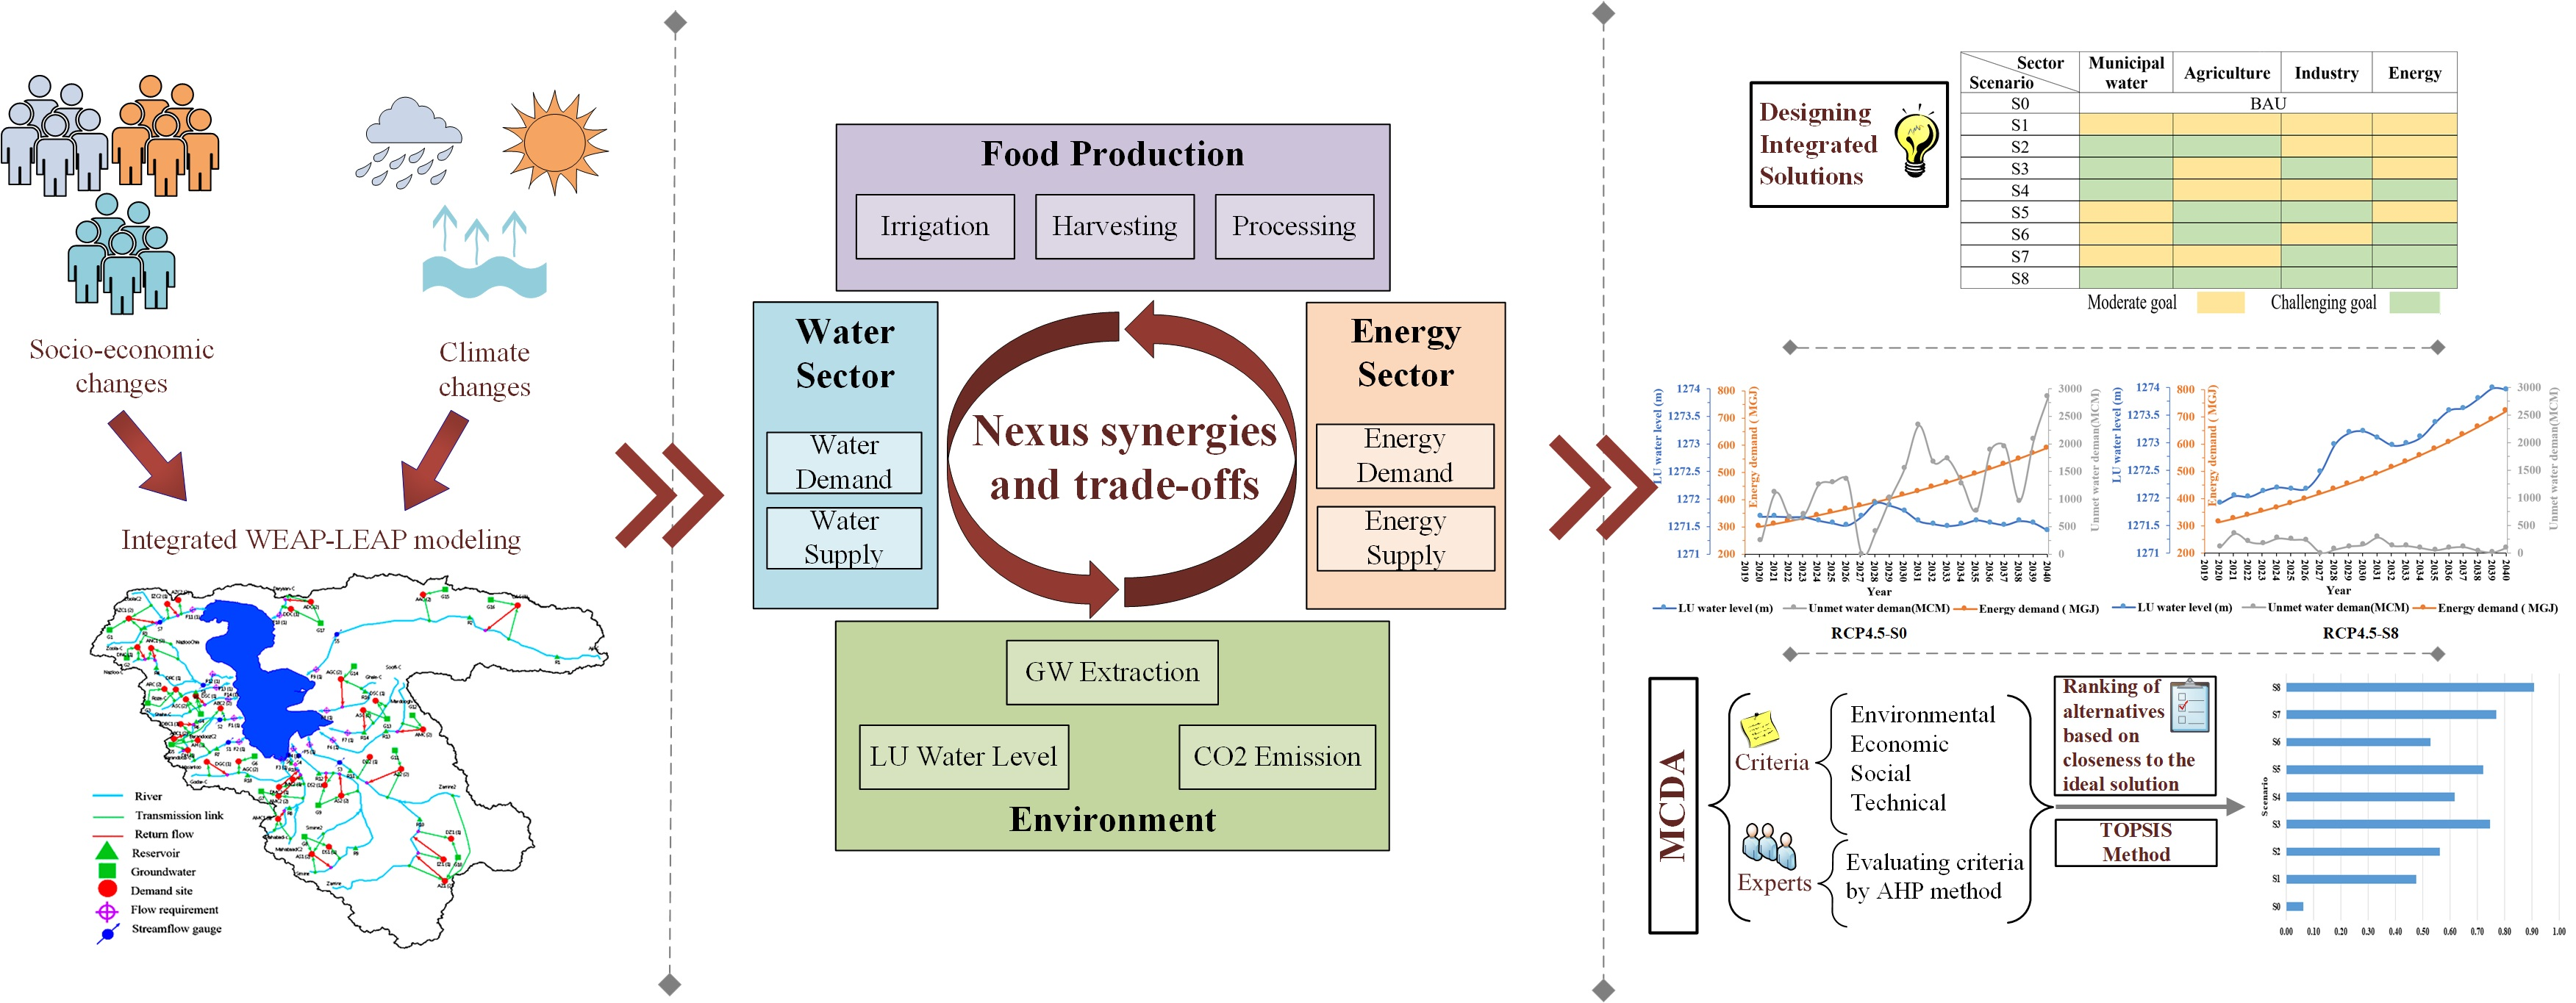
2.3.1. WEAP
2.3.2. LEAP
2.4. Scenario Design
2.4.1. Climate Change Scenarios
2.4.2. Policy Scenarios
2.5. MCDA
2.5.1. Evaluation Criteria
2.5.2. Integrated AHP-TOPSIS Method
3. Results and Discussion
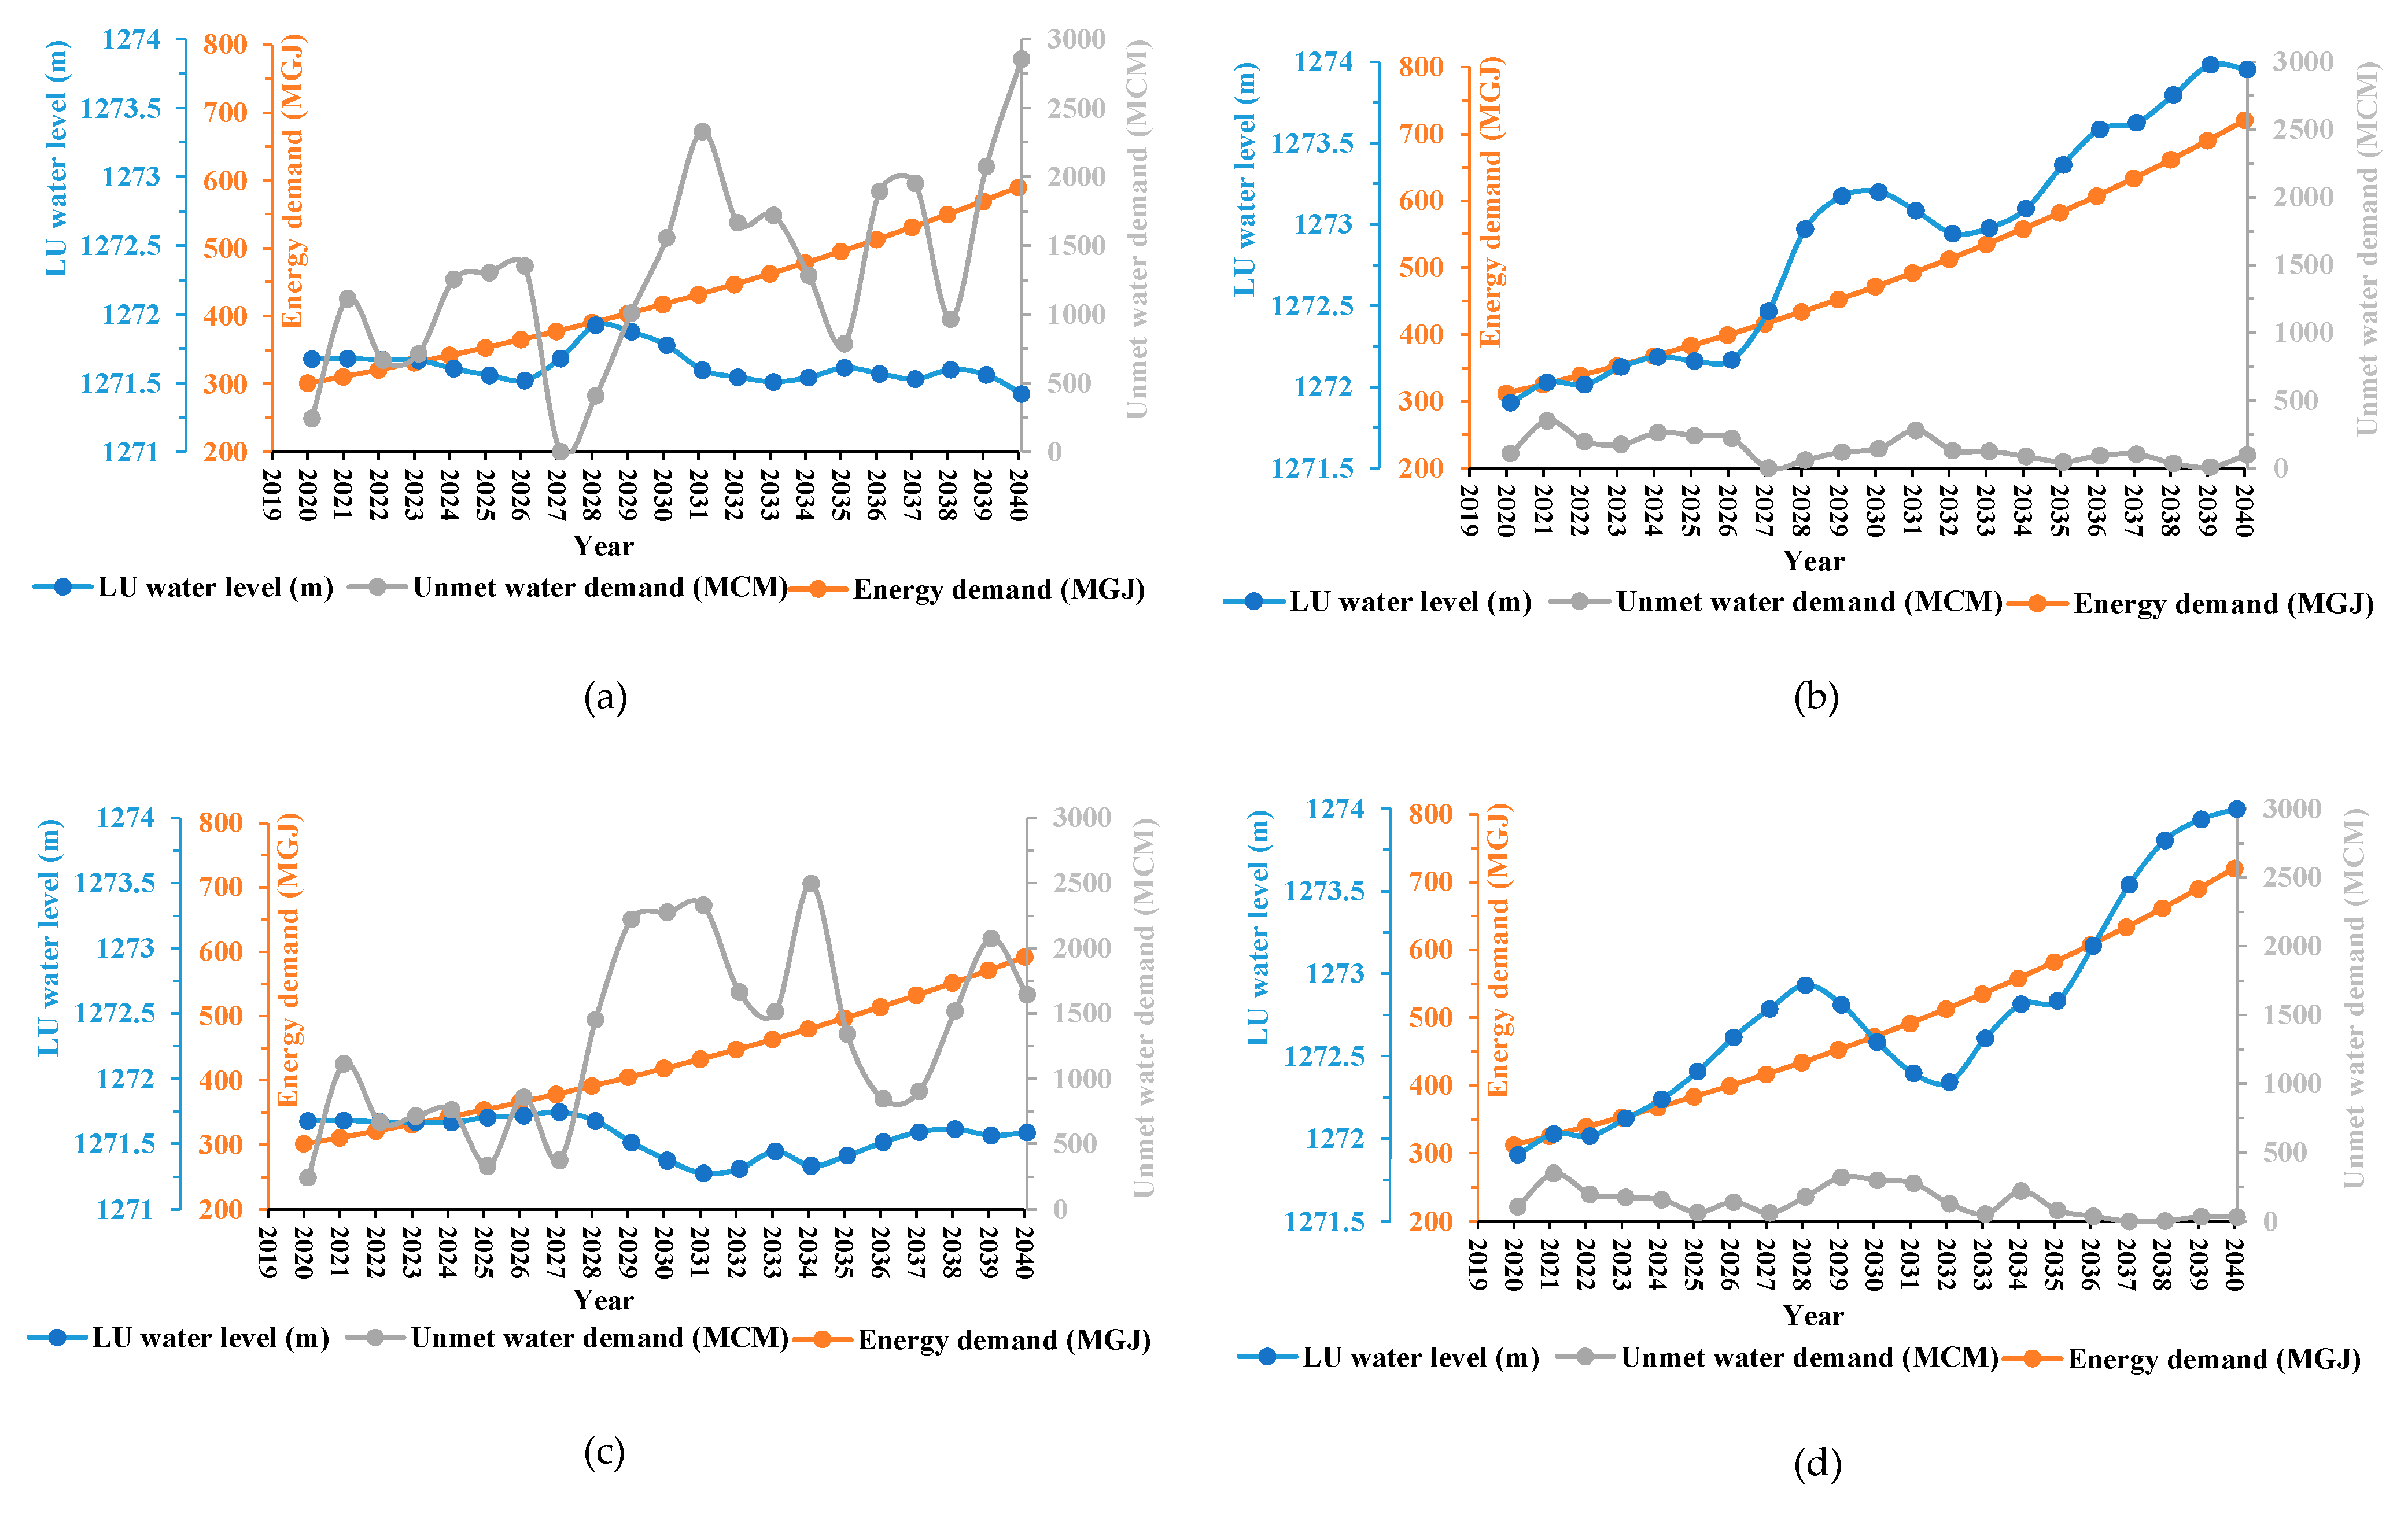
3.1. Scenario Analysis Results
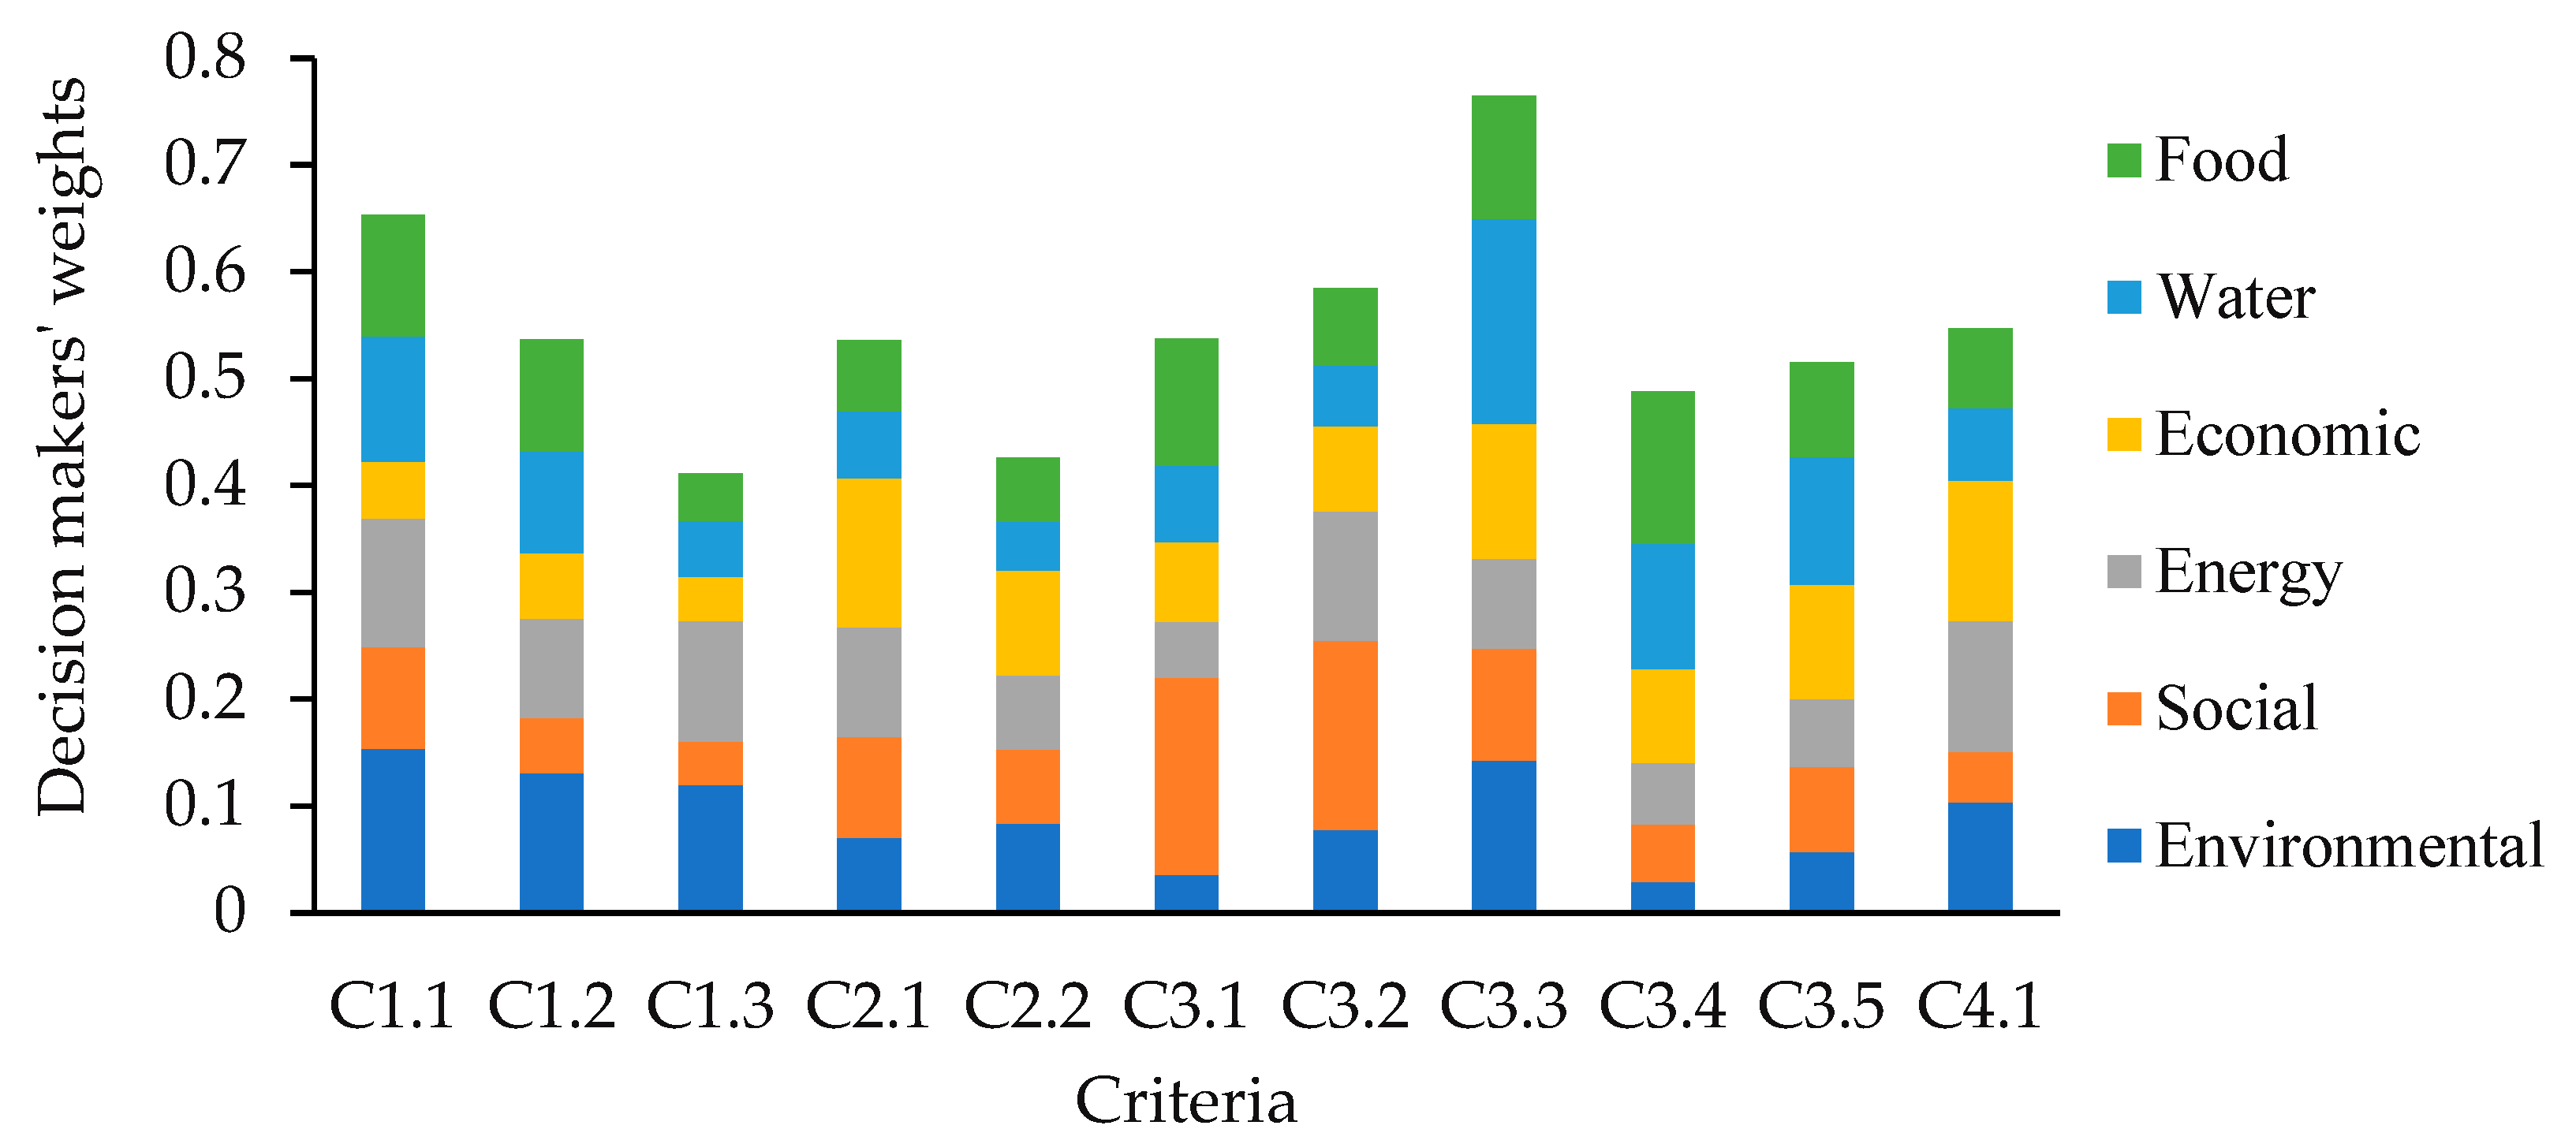
3.2. Criteria Weights
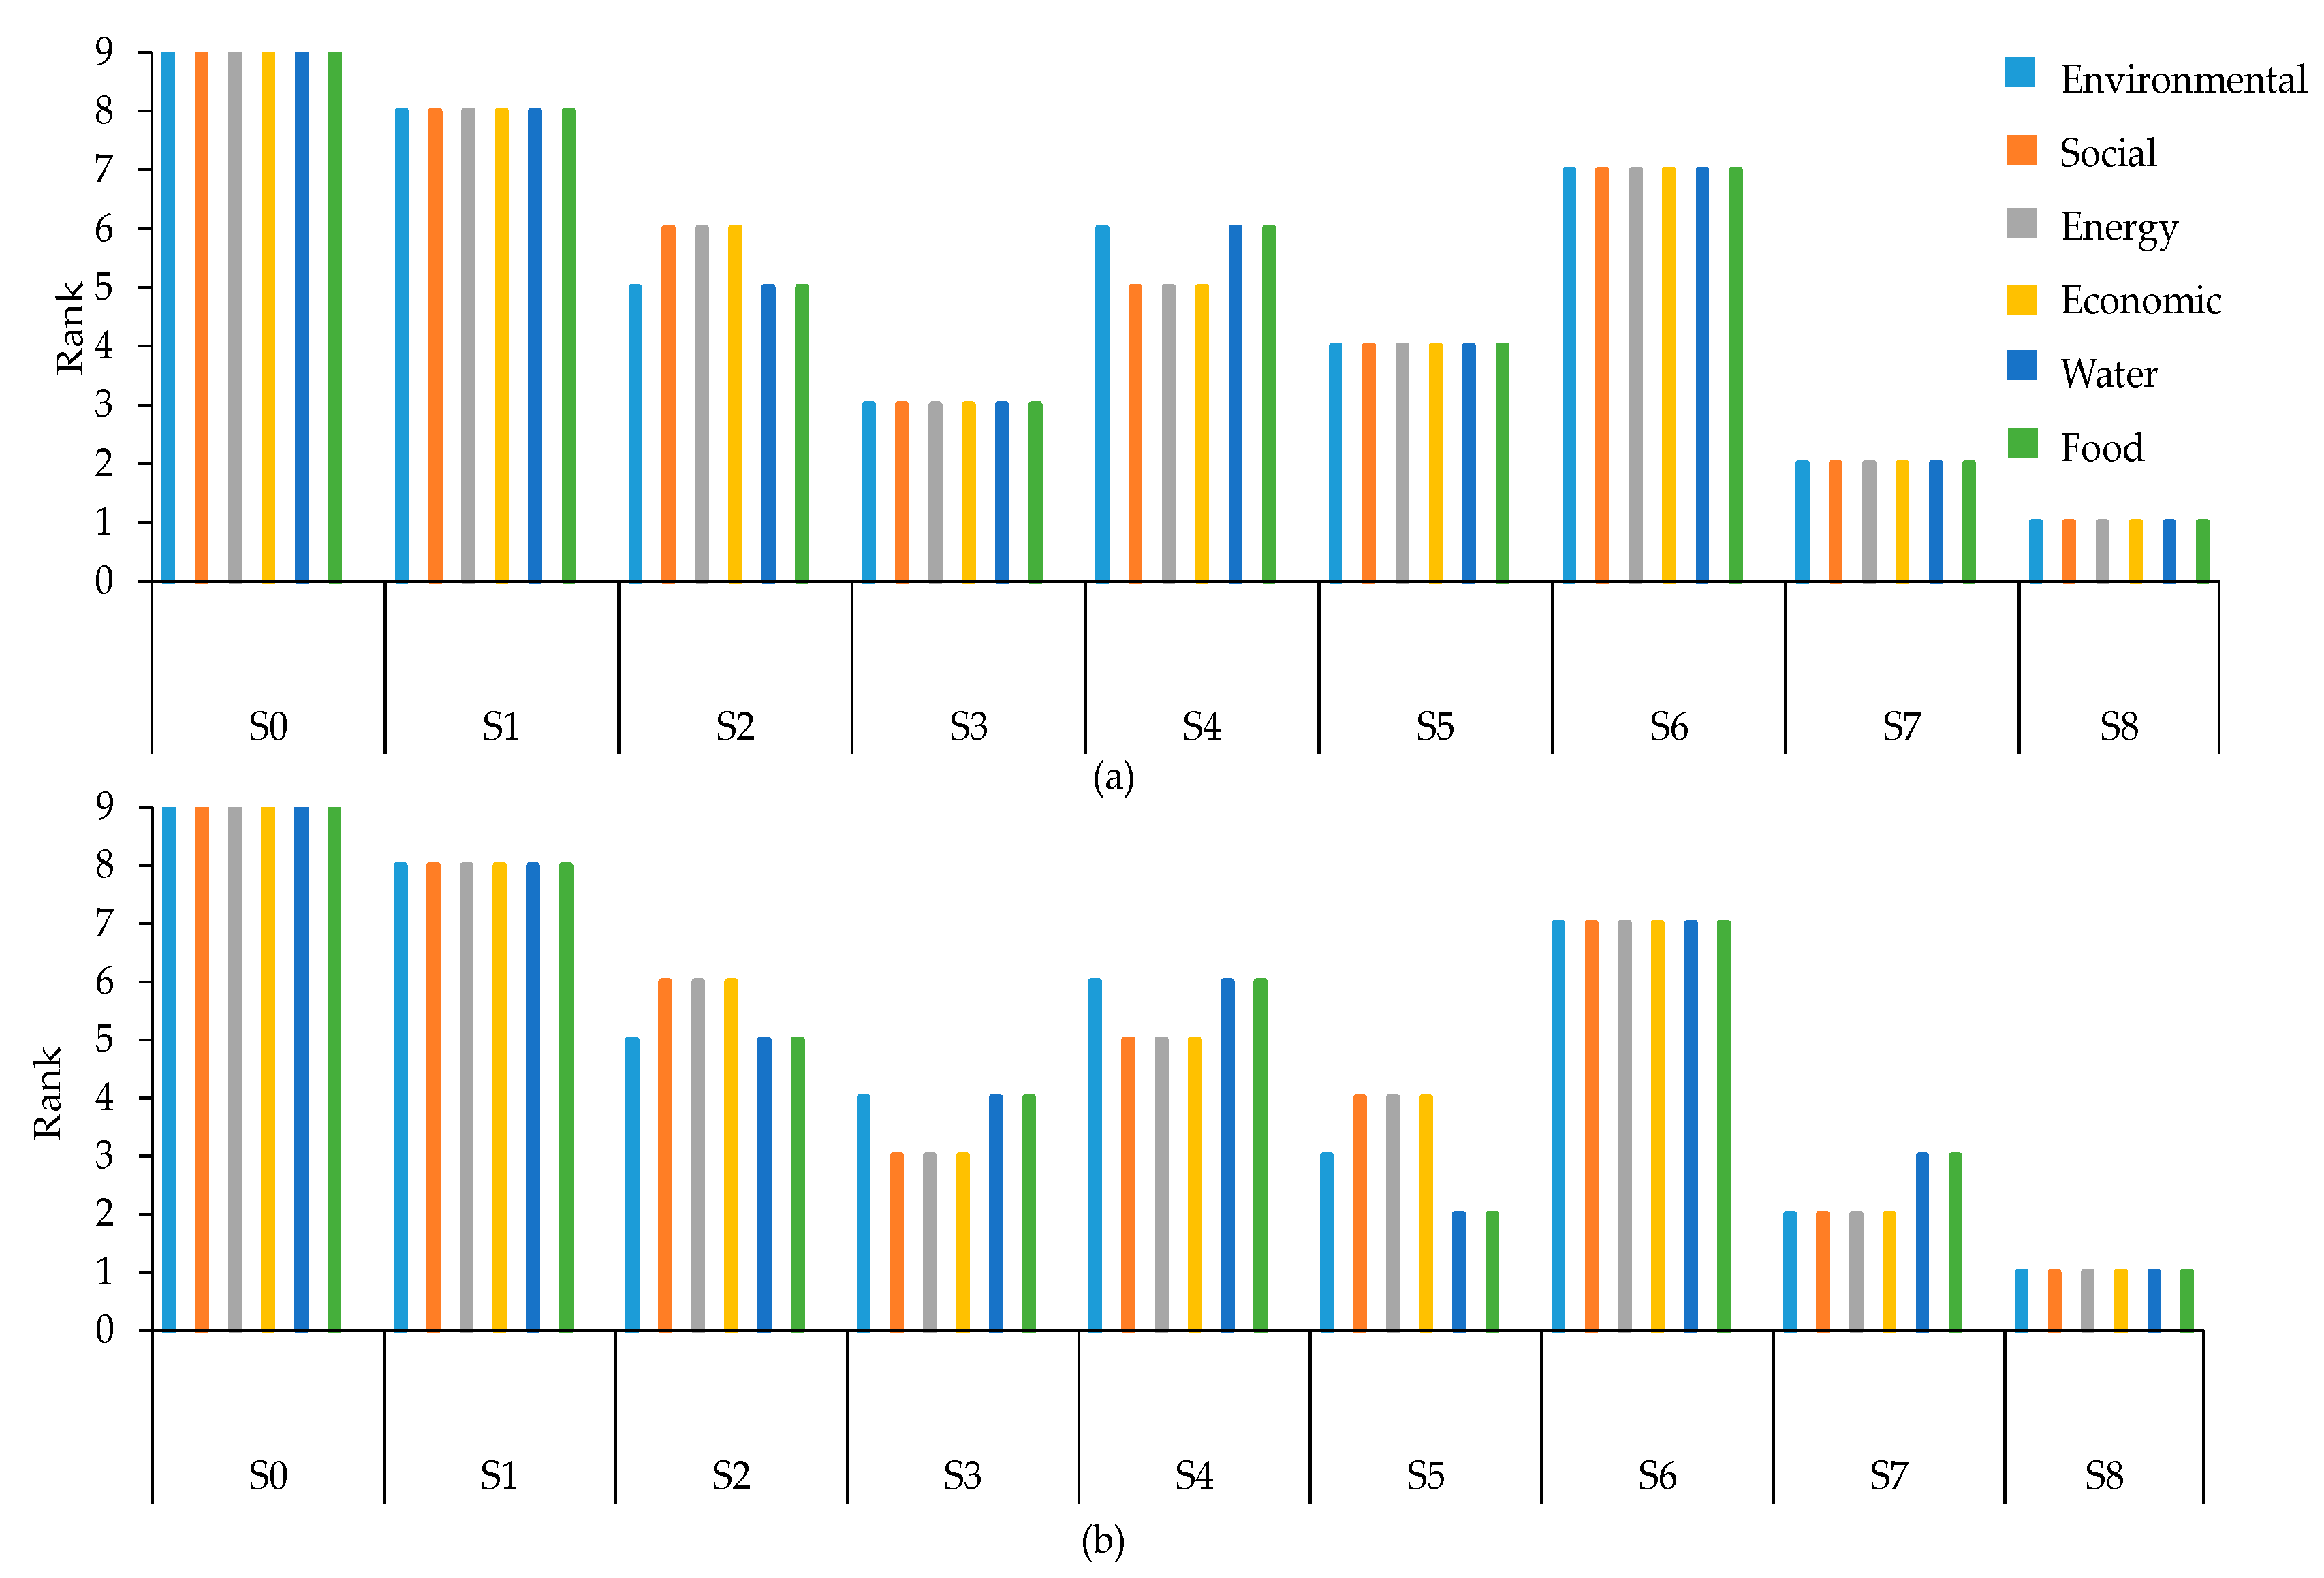
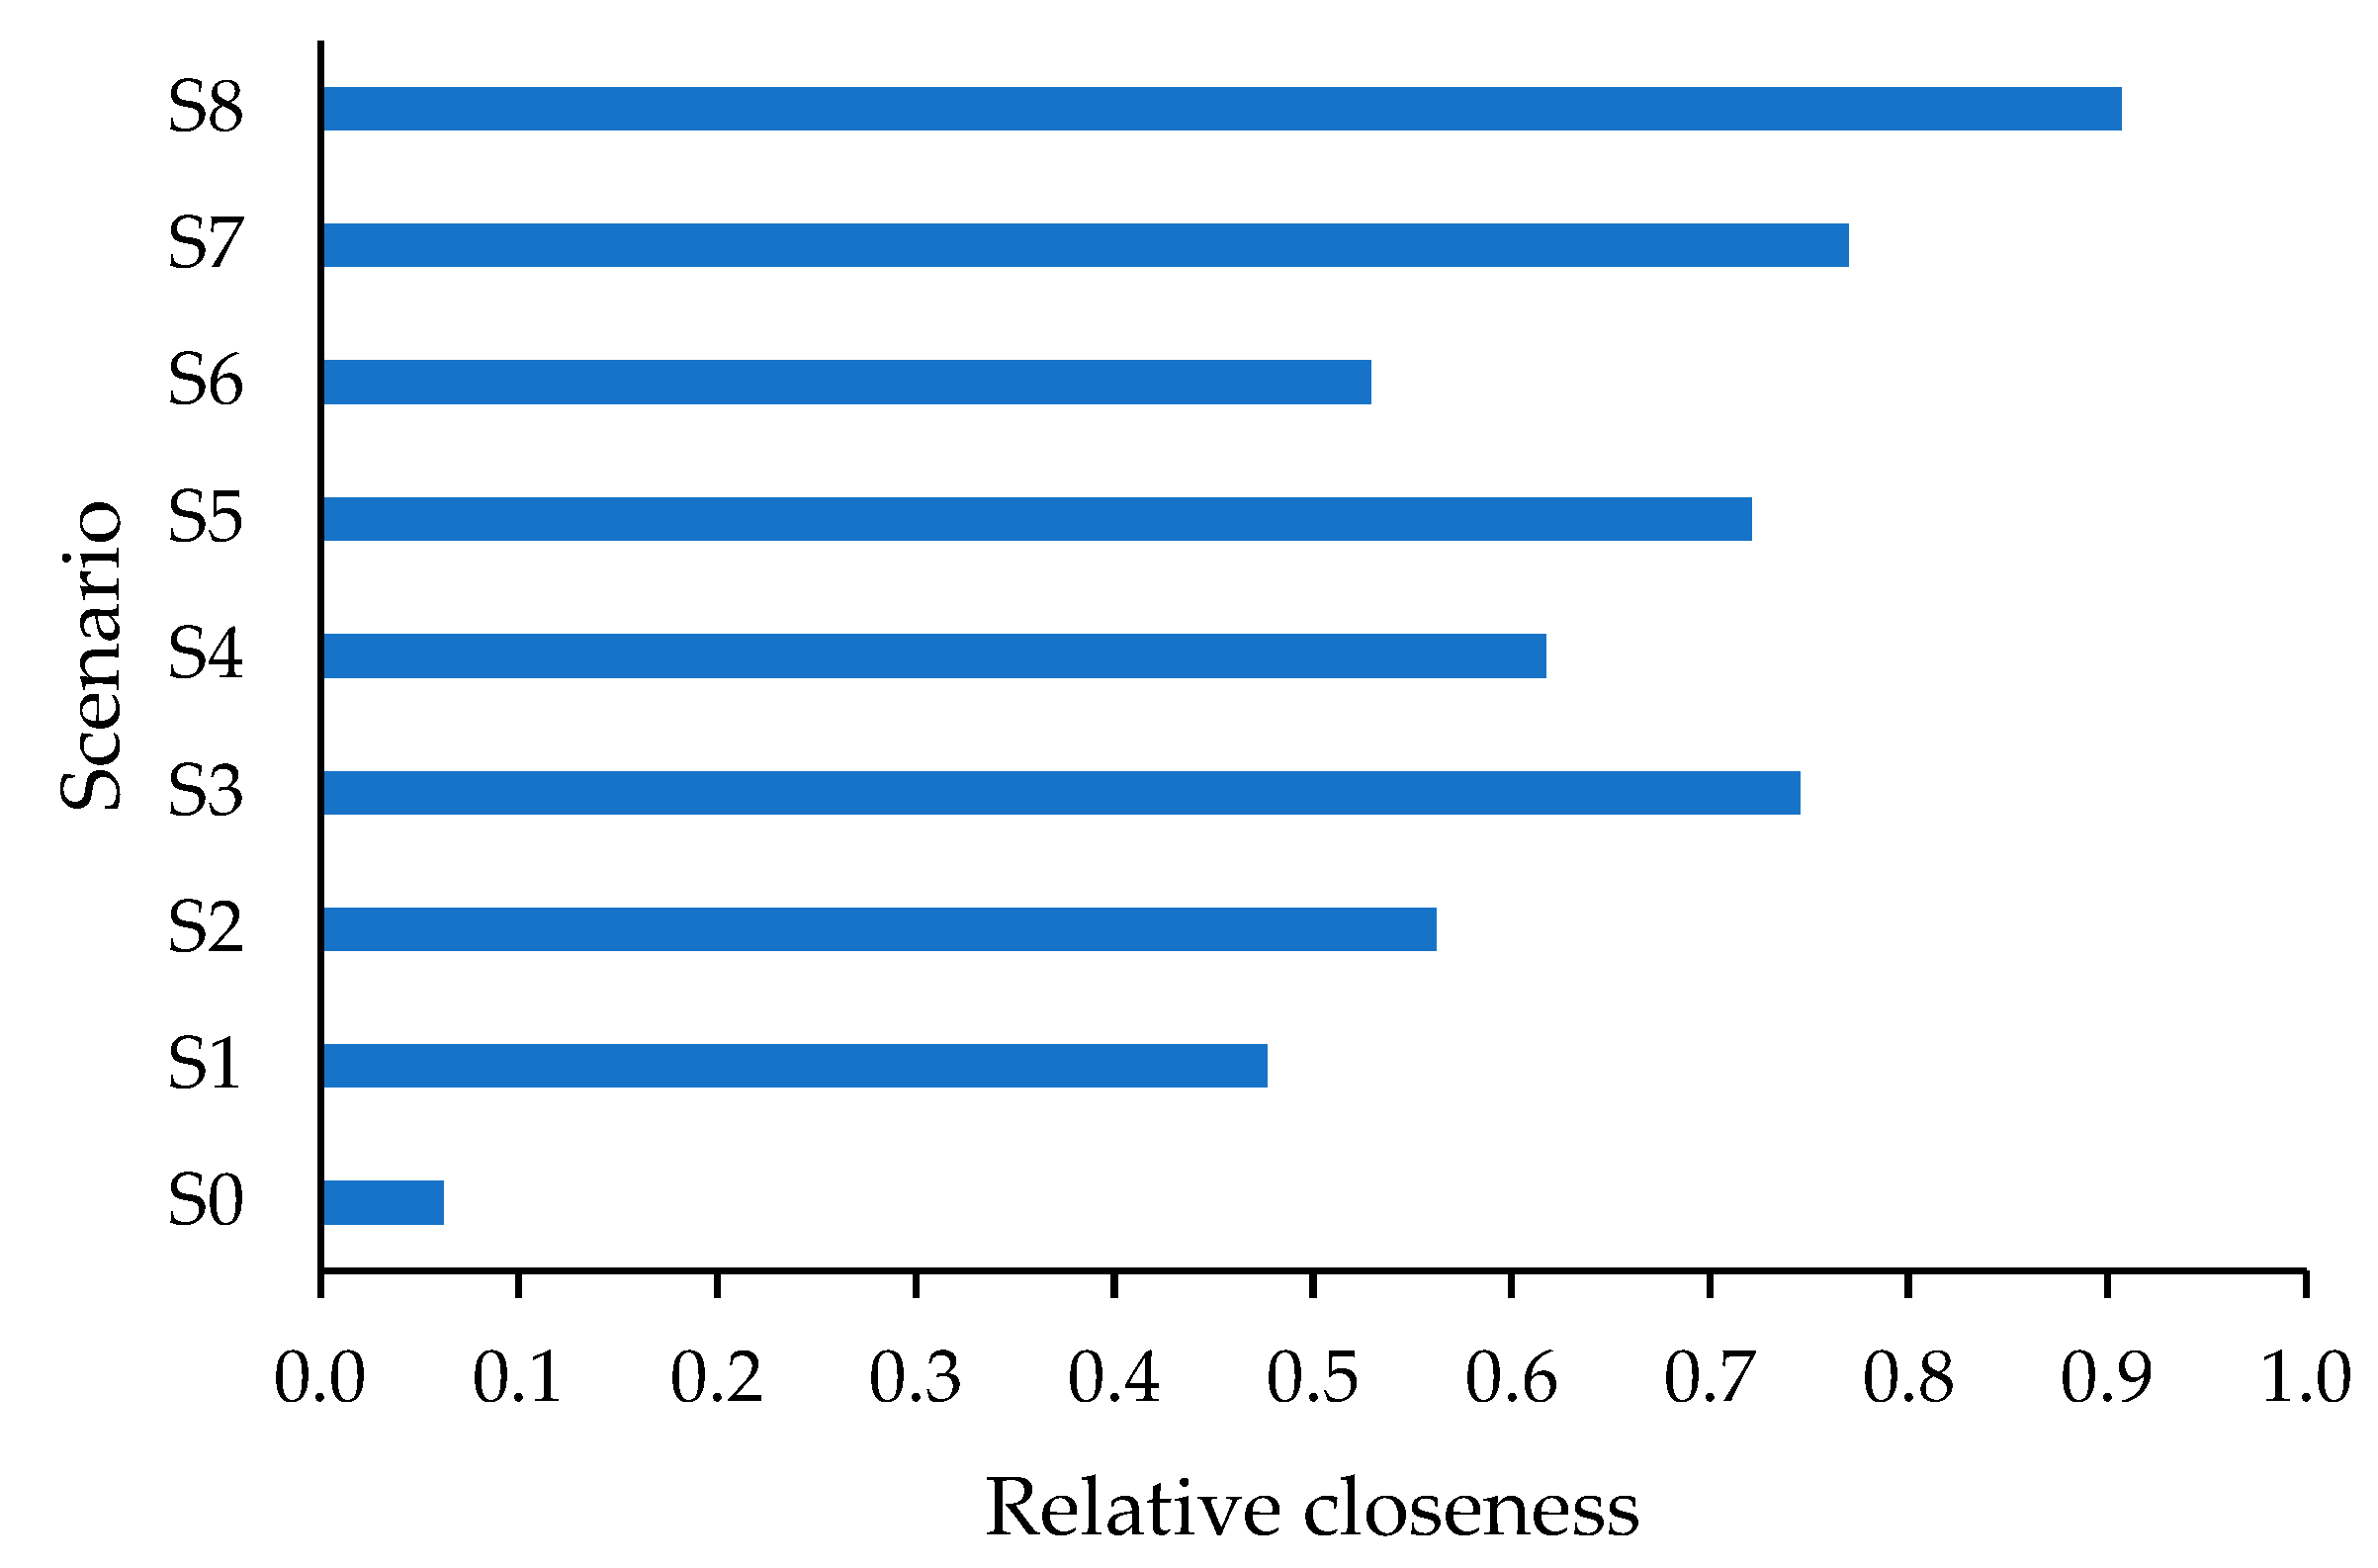
3.3. MCDA Result
4. Conclusions
- Lake Urmia’s water level is the most environmentally vulnerable measure in the Urmia Lake Basin district, and its ecological level is only achieved when challenging goals in different fields are pursued. To operationalize this target, it is necessary that the government carry out multilateral supports that will help to decrease the investment risk and increase technical ability. In addition, implementing reforms in agriculture, such as decreasing cultivated land and modifying cultivation patterns, will be faced with social resistance, which will need to be addressed.
- The main distinction between different climate scenarios is rainfall fluctuations during different years. In addition, it can be expressed that temperature and evaporation increase and a decrease in rainfall are more severe in RCP 8.5 than RCP 4.5.
- Implementing sustainable development solutions in the studied district will result in a 211% increase in energy demand in the agriculture and industry field until 2040. Consumption of this amount of energy will lead to an increase in releasing GHG in the Urmia Lake Basin. In order to prevent this pollution, realizing the potential of renewable energies is a necessity.
- After summing up the views of experts in different fields, it could be said that the most important measures for evaluating possible strategies in Urmia Lake Basin are supplying sustainable drinking water and increasing Lake Urmia’s water level.
- Because of the necessity of the holistic development of all sectors, scenarios with various combinations of each field’s targets were taken into account. According to MCDA results, the current situation’s continuity will result in severe economic, ecological, and social sufferings in the district. As expected, pursuing challenging goals in all sectors is the closest scenario to the ideal solution. However, the possibility of implementing this scenario is fragile because of the social and political challenges. Pursuing challenging goals for industry growth and industry structure adjustment will have more effectiveness compared to other sectors. Following challenging goals is of minimum importance in the agricultural sector.
Supplementary Materials
Author Contributions
Funding
Institutional Review Board Statement
Informed Consent Statement
Conflicts of Interest
Nomenclature
| Symbols | |
| A | Activity level |
| AWD | Agricultural water deficit (m3) |
| D | Demand |
| d | Discount rate |
| E | Evaporation (m3 month−1) |
| EF | Emission factor (Tones CO2-eq) |
| GSD | Groundwater supply delivered (m3) |
| I | Inlet (m3 month−1) |
| IS | Initial Storage (m3) |
| IWD | Industrial water deficit (m3) |
| LG | Loss to groundwater (m3 month−1) |
| LWL | Lake water level (m3 month−1) |
| MWD | Potable water deficit (m3) |
| n | Timespan from time now |
| NPV | Net present value (million USD) |
| P | Precipitation (m3 month−1) |
| S | Supply |
| TSD | Total supply delivered |
| WD | Water deficit (m3) |
| WSV | Water storage volume (m3) |
| Subscripts and superscripts | |
| ds | Demand site |
| g | Gas |
| m | Month |
| r | River |
| s | Site |
| t | Time |
| y | Year |
| Abbreviations | |
| AHP | Analytic hierarchy process |
| BAU | Business as usual |
| CORDEX | Coordinated regional downscaling experiment |
| GHG | Greenhouse gas |
| IPCC | Intergovernmental panel on climate change |
| LEAP | Low emissions analysis platform |
| MCDA | Multiple criteria decision analysis |
| MCM | Million cubic meters |
| MGJ | Million gigajoules |
| RCP | Representative concentration pathway |
| SDG | Sustainable development goal |
| SEI | Stockholm environmental institute |
| TED | Technology and environmental database |
| TOPSIS | Technique for order of preference by similarity to ideal solution |
| ULRP | Urmia lake restoration program |
| WEAP | Water evaluation and planning system |
| WEF | Water-energy-food |
| WEFE | Water-energy-food-environment |
References
- Kates, R.W.; Parris, T.M.; Leiserowitz, A.A. What is sustainable development? Goals, indicators, values, and practice. Environment 2005, 47, 8–21. [Google Scholar] [CrossRef]
- Mikulčić, H.; Baleta, J.; Klemeš, J.J. Sustainability through combined development of energy, water and environment systems. J. Clean. Prod. 2020, 251, 119727. [Google Scholar] [CrossRef]
- Dale, A.T.; Bilec, M.M. The Regional Energy & Water Supply Scenarios (REWSS) model, Part I: Framework, procedure, and validation. Sustain. Energy Technol. Assess. 2014, 7, 227–236. [Google Scholar] [CrossRef]
- Dale, A.T.; Bilec, M.M. The Regional Energy & Water Supply Scenarios (REWSS) model, part II: Case studies in Pennsylvania and Arizona. Sustain. Energy Technol. Assess. 2014, 7, 237–246. [Google Scholar] [CrossRef]
- Endo, A.; Tsurita, I.; Burnett, K.; Orencio, P.M. A review of the current state of research on the water, energy, and food nexus. J. Hydrol. Reg. Stud. 2017, 11, 20–30. [Google Scholar] [CrossRef] [Green Version]
- Endo, A.; Yamada, M.; Miyashita, Y.; Sugimoto, R.; Ishii, A.; Nishijima, J.; Fujii, M.; Kato, T.; Hamamoto, H.; Kimura, M.; et al. Dynamics of water–energy–food nexus methodology, methods, and tools. Curr. Opin. Environ. Sci. Health 2020, 13, 46–60. [Google Scholar] [CrossRef]
- Hoolohan, C.; McLachlan, C.; Larkin, A. ‘Aha’ moments in the water-energy-food nexus: A new morphological scenario method to accelerate sustainable transformation. Technol. Forecast. Soc. Chang. 2019, 148, 119712. [Google Scholar] [CrossRef]
- Mahlknecht, J.; González-Bravo, R.; Loge, F.J. Water-energy-food security: A Nexus perspective of the current situation in Latin America and the Caribbean. Energy 2020, 194, 116824. [Google Scholar] [CrossRef]
- Deng, H.M.; Wang, C.; Cai, W.J.; Liu, Y.; Zhang, L.X. Managing the water-energy-food nexus in China by adjusting critical final demands and supply chains: An input-output analysis. Sci. Total Environ. 2020, 720, 137635. [Google Scholar] [CrossRef]
- Chamas, Z.; Najm, M.A.; Al-Hindi, M.; Yassine, A.; Khattar, R. Sustainable Resource Optimization under Water-Energy-Food-Carbon Nexus. J. Clean. Prod. 2020, 278, 123894. [Google Scholar] [CrossRef]
- Zhang, X.; Vesselinov, V.V. Integrated modeling approach for optimal management of water, energy and food security nexus. Adv. Water Resour. 2017, 101, 1–10. [Google Scholar] [CrossRef]
- Juvonen, H.-M. Nexus for What? Challenges and Opportunities in Applying the Water-Energy-Food Nexus. Master’s Thesis, Aalto University, Espoo, Finland, 2015. [Google Scholar]
- Spalding-Fecher, R.; Joyce, B.; Winkler, H. Climate change and hydropower in the Southern African Power Pool and Zambezi River Basin: System-wide impacts and policy implications. Energy Policy 2017, 103, 84–97. [Google Scholar] [CrossRef]
- Welsch, M.; Hermann, S.; Howells, M.; Rogner, H.H.; Young, C.; Ramma, I.; Bazilian, M.; Fischer, G.; Alfstad, T.; Gielen, D.; et al. Adding value with CLEWS—Modelling the energy system and its interdependencies for Mauritius. Appl. Energy 2014, 113, 1434–1445. [Google Scholar] [CrossRef]
- Lin, J.; Kang, J.; Bai, X.; Li, H.; Lv, X.; Kou, L. Modeling the urban water-energy nexus: A case study of Xiamen, China. J. Clean. Prod. 2019, 215, 680–688. [Google Scholar] [CrossRef]
- Agrawal, N.; Ahiduzzaman, M.; Kumar, A. The development of an integrated model for the assessment of water and GHG footprints for the power generation sector. Appl. Energy 2018, 216, 558–575. [Google Scholar] [CrossRef]
- Keskinen, M.; Someth, P.; Salmivaara, A.; Kummu, M. Water-energy-food nexus in a transboundary river basin: The case of Tonle Sap Lake, Mekong River Basin. Water 2015, 7, 5416–5436. [Google Scholar] [CrossRef]
- Karlberg, L.; Hoff, H.; Amsalu, T.; Andersson, K.; Binnington, T.; Flores-López, F.; de Bruin, A.; Gebrehiwot, S.G.; Gedif, B.; zur Heide, F.; et al. Tackling complexity: Understanding the food-energy-environment nexus in Ethiopia’s lake TANA sub-basin. Water Altern. 2015, 8, 710–734. [Google Scholar]
- Bakhshianlamouki, E.; Masia, S.; Karimi, P.; van der Zaag, P.; Sušnik, J. A system dynamics model to quantify the impacts of restoration measures on the water-energy-food nexus in the Urmia lake Basin, Iran. Sci. Total Environ. 2020, 708. [Google Scholar] [CrossRef]
- Alborzi, A.; Mirchi, A.; Moftakhari, H.; Mallakpour, I.; Alian, S.; Nazemi, A.; Hassanzadeh, E.; Mazdiyasni, O.; Ashraf, S.; Madani, K.; et al. Climate-informed environmental inflows to revive a drying lake facing meteorological and anthropogenic droughts. Environ. Res. Lett. 2018, 13. [Google Scholar] [CrossRef]
- Karbassi, A.; Bidhendi, G.N.; Pejman, A.; Bidhendi, M.E. Environmental impacts of desalination on the ecology of Lake Urmia. J. Great Lakes Res. 2010, 36, 419–424. [Google Scholar] [CrossRef]
- Danesh-Yazdi, M.; Ataie-Ashtiani, B. Lake Urmia crisis and restoration plan: Planning without appropriate data and model is gambling. J. Hydrol. 2019, 576, 639–651. [Google Scholar] [CrossRef]
- Nourani, V.; Ghasemzade, M.; Mehr, A.D.; Sharghi, E. Investigating the effect of hydroclimatological variables on urmia lake water level using wavelet coherence measure. J. Water Clim. Chang. 2019, 10, 13–29. [Google Scholar] [CrossRef] [Green Version]
- Alizadeh-Choobari, O.; Ahmadi-Givi, F.; Mirzaei, N.; Owlad, E. Climate change and anthropogenic impacts on the rapid shrinkage of Lake Urmia. Int. J. Climatol. 2016, 36, 4276–4286. [Google Scholar] [CrossRef]
- Taheri, M.; Emadzadeh, M.; Gholizadeh, M.; Tajrishi, M.; Ahmadi, M.; Moradi, M. Investigating the temporal and spatial variations of water consumption in Urmia Lake River Basin considering the climate and anthropogenic effects on the agriculture in the basin. Agric. Water Manag. 2019, 213, 782–791. [Google Scholar] [CrossRef]
- Shadkam, S.; Ludwig, F.; van Oel, P.; Kirmit, Ç.; Kabat, P. Impacts of climate change and water resources development on the declining inflow into Iran’s Urmia Lake. J. Great Lakes Res. 2016, 42, 942–952. [Google Scholar] [CrossRef] [Green Version]
- Jalili, S.; Hamidi, S.A.; Ghanbari, R.N. Climate variability and anthropogenic effects on Lake Urmia water level fluctuations, northwestern Iran. Hydrol. Sci. J. 2016, 61, 1–11. [Google Scholar] [CrossRef] [Green Version]
- Alizade Govarchin Ghale, Y.; Altunkaynak, A.; Unal, A. Investigation Anthropogenic Impacts and Climate Factors on Drying up of Urmia Lake using Water Budget and Drought Analysis. Water Resour. Manag. 2018, 32, 325–337. [Google Scholar] [CrossRef]
- Arkian, F.; Nicholson, S.E.; Ziaie, B. Meteorological factors affecting the sudden decline in Lake Urmia’s water level. Theor. Appl. Climatol. 2018, 131, 641–651. [Google Scholar] [CrossRef]
- Hamzekhani, F.G.; Saghafian, B.; Araghinejad, S. Environmental management in Urmia Lake: Thresholds approach. Int. J. Water Resour. Dev. 2016, 32, 77–88. [Google Scholar] [CrossRef]
- Dehghanipour, A.H.; Schoups, G.; Zahabiyoun, B.; Babazadeh, H. Meeting agricultural and environmental water demand in endorheic irrigated river basins: A simulation-optimization approach applied to the Urmia Lake basin in Iran. Agricultural Water Management 2020, 241, 106353. [Google Scholar] [CrossRef]
- Ahmadaali, J.; Barani, G.A.; Qaderi, K.; Hessari, B. Analysis of the effects ofwater management strategies and climate change on the environmental and agricultural sustainability of Urmia Lake Basin, Iran. Water 2018, 10, 160. [Google Scholar] [CrossRef] [Green Version]
- Alao, M.A.; Ayodele, T.R.; Ogunjuyigbe, A.S.O.; Popoola, O.M. Multi-criteria decision based waste to energy technology selection using entropy-weighted TOPSIS technique: The case study of Lagos, Nigeria. Energy 2020, 201, 117675. [Google Scholar] [CrossRef]
- Pohekar, S.D.; Ramachandran, M. Application of multi-criteria decision making to sustainable energy planning—A review. Renew. Sustain. Energy Rev. 2004, 8, 365–381. [Google Scholar] [CrossRef]
- Mwambo, F.M.; Fürst, C.; Nyarko, B.K.; Borgemeister, C.; Martius, C. Maize production and environmental costs: Resource evaluation and strategic land use planning for food security in northern Ghana by means of coupled emergy and data envelopment analysis. Land Use Policy 2020, 95. [Google Scholar] [CrossRef]
- Lee, M.; Yu, C.Y.; Chiang, P.C.; Hou, C.H. Water-energy nexus for multi-criteria decision making in water resource management: A case study of Choshui river basin in Taiwan. Water 2018, 10, 1740. [Google Scholar] [CrossRef] [Green Version]
- Psomas, A.; Vryzidis, I.; Spyridakos, A.; Mimikou, M. MCDA approach for agricultural water management in the context of water–energy–land–food nexus. Oper. Res. 2021, 21, 689–723. [Google Scholar] [CrossRef]
- Stewart, T. A critical survey on the status of multiple criteria decision making theory and practice. Omega 1992, 20, 569–586. [Google Scholar] [CrossRef]
- Jozaghi, A.; Alizadeh, B.; Hatami, M.; Flood, I.; Khorrami, M.; Khodaei, N.; Tousi, E.G. A comparative study of the AHP and TOPSIS techniques for dam site selection using GIS: A case study of Sistan and Baluchestan Province, Iran. Geosciences 2018, 8, 494. [Google Scholar] [CrossRef] [Green Version]
- Campos-Guzmán, V.; García-Cáscales, M.S.; Espinosa, N.; Urbina, A. Life Cycle Analysis with Multi-Criteria Decision Making: A review of approaches for the sustainability evaluation of renewable energy technologies. Renew. Sustain. Energy Rev. 2019, 104, 343–366. [Google Scholar] [CrossRef]
- Aryanpur, V.; Atabaki, M.S.; Marzband, M.; Siano, P.; Ghayoumi, K. An overview of energy planning in Iran and transition pathways towards sustainable electricity supply sector. Renew. Sustain. Energy Rev. 2019, 112, 58–74. [Google Scholar] [CrossRef]
- Mohebzadeh, H.; Fallah, M. Quantitative analysis of water balance components in Lake Urmia, Iran using remote sensing technology. Remote Sens. Appl. Soc. Environ. 2019, 13, 389–400. [Google Scholar] [CrossRef]
- Hesami, A.; Amini, A. Changes in irrigated land and agricultural water use in the Lake Urmia basin. Lake Reserv. Manag. 2016, 32, 288–296. [Google Scholar] [CrossRef]
- Fazel, N.; Berndtsson, R.; Uvo, C.B.; Madani, K.; Kløve, B. Regionalization of precipitation characteristics in Iran’s Lake Urmia basin. Theor. Appl. Climatol. 2018, 132, 363–373. [Google Scholar] [CrossRef] [Green Version]
- Roshan, G.; Samakosh, J.M.; Orosa, J.A. The impacts of drying of Lake Urmia on changes of degree day index of the surrounding cities by meteorological modelling. Environ. Earth Sci. 2016, 75. [Google Scholar] [CrossRef]
- Ghaheri, M.; Baghal-Vayjooee, M.H.; Naziri, J. Lake Urmia, Iran: A summary review. Int. J. Salt Lake Res. 1999, 8, 19–22. [Google Scholar] [CrossRef]
- Delju, A.H.; Ceylan, A.; Piguet, E.; Rebetez, M. Observed climate variability and change in Urmia Lake Basin, Iran. Theor. Appl. Climatol. 2013, 111, 285–296. [Google Scholar] [CrossRef] [Green Version]
- Farajzadeh, J.; Fakheri Fard, A.; Lotfi, S. Modeling of monthly rainfall and runoff of Urmia lake basin using “feed-forward neural network” and “time series analysis” model. Water Resour. Ind. 2014, 7–8, 38–48. [Google Scholar] [CrossRef] [Green Version]
- Alesheikh, A.A.; Ghorbanali, A.; Nouri, N. Coastline change detection using remote sensing. Int. J. Environ. Sci. Technol. 2007, 4, 61–66. [Google Scholar] [CrossRef] [Green Version]
- Shadkam, S.; Ludwig, F.; van Vliet, M.T.H.; Pastor, A.; Kabat, P. Preserving the world second largest hypersaline lake under future irrigation and climate change. Sci. Total Environ. 2016, 559, 317–325. [Google Scholar] [CrossRef] [Green Version]
- Zoljoodi, M.; Didevarasl, A. Water-Level Fluctuations of Urmia Lake: Relationship with the Long-Term Changes of Meteorological Variables (Solutions for Water-Crisis Management in Urmia Lake Basin). Atmos. Clim. Sci. 2014, 04, 358–368. [Google Scholar] [CrossRef] [Green Version]
- Statistical Center of Iran. The Report of Population General Census in Iran; Statistical Center of Iran: Tehran, Iran, 2019. (In Persian)
- Statistical Center of Iran. Statistical Center of Iran, Metadata. 2020. Available online: https://www.amar.org.ir/english/Metadata/Classifications (accessed on 27 June 2020).
- Central Bank of the Islamic Ripublic of Iran. Econimic Statistics. 2018. Available online: https://www.cbi.ir/section/1372.aspx (accessed on 2 June 2020).
- Ministry of Energy. The Annual Report of Energy Balance in Iran; Ministry of Energy: Tehran, Iran, 2019.
- Institute for International Energy Studies. The Annual Report of Iranian Hydrocarbon Energy Balance; Institute for International Energy Studies: Tehran, Iran, 2016. [Google Scholar]
- Water and Wastewater Company of Iran. Ministry of Energy. The Annual Statistical Report of Water and Wastewater Industry: Rural Sector; Ministry of Energy: Tehran, Iran, 2017. (In Persian)
- Water and Wastewater Company of Iran. Ministry of Energy. The Annual Statistical Report of Water and Wastewater Industry: Urban Sector; Ministry of Energy: Tehran, Iran, 2017. (In Persian)
- Ministry of Energy. Iran Water Statistical Yearbook; Ministry of Energy: Tehran, Iran, 2018. (In Persian)
- Ministry of Agriculture. Statistical Yearbook; Ministry of Agriculture: Tehran, Iran, 2018.
- ULRP. Urmia Lake Water Level. 2019. Available online: http://www.ulrp.ir (accessed on 2 June 2020).
- Islamic Ripublic of Iran Meteorological Organization. The Annual Report of Meteorological Data; Islamic Ripublic of Iran Meteorological Organization: Tehran, Iran, 2019.
- Tidwell, V.C.; Malczynski, L.A.; Kobos, P.H.; Klise, G.T.; Shuster, E. Potential impacts of electric power production utilizing natural gas, renewables and carbon capture and sequestration on U.S. freshwater resources. Environ. Sci. Technol. 2013, 47, 8940–8947. [Google Scholar] [CrossRef] [PubMed]
- Sieber, J. WEAP Water Evaluation and Planning System. In Proceedings of the 3rd International Congress on Environmental Modelling and Software, Burlington, VT, USA, 9–13 July 2006. [Google Scholar]
- SEI. WEAP: Water Evaluation and Planning System (User Guide). 2019. Available online: https://www.weap21.org/index.asp?action=208 (accessed on 29 April 2020).
- Ramadan, E.M.; Shalash, O.S.; Fahmy, M.R.; Abdel-Aal, G.M. Integrated water resource management in Sharkia Governorate, East Nile Delta using numerical evaluation of water management strategies. Alex. Eng. J. 2019, 58, 757–771. [Google Scholar] [CrossRef]
- Forni, L.G.; Medellín-Azuara, J.; Tansey, M.; Young, C.; Purkey, D.; Howitt, R. Integrating complex economic and hydrologic planning models: An application for drought under climate change analysis. Water Resour. Econ. 2016, 16, 15–27. [Google Scholar] [CrossRef]
- Wang, X.J.; Zhang, J.Y.; Shahid, S.; Guan, E.H.; Wu, Y.X.; Gao, J.; He, R.M. Adaptation to climate change impacts on water demand. Mitig. Adapt. Strateg. Glob. Change 2016, 21, 81–99. [Google Scholar] [CrossRef]
- Testa, G.; Gresta, F.; Cosentino, S.L. Dry matter and qualitative characteristics of alfalfa as affected by harvest times and soil water content. Eur. J. Agron. 2011, 34, 144–152. [Google Scholar] [CrossRef]
- Woznicki, S.A.; Nejadhashemi, A.P.; Parsinejad, M. Climate change and irrigation demand: Uncertainty and adaptation. J. Hydrol. Reg. Stud. 2015, 3, 247–264. [Google Scholar] [CrossRef]
- Alamanos, A.; Sfyris, S.; Fafoutis, C.; Mylopoulos, N. Urban water demand assessment for sustainable water resources management, under climate change and socioeconomic changes. Water Sci. Technol. Water Supply 2020, 20, 679–687. [Google Scholar] [CrossRef]
- Ashoori, N.; Dzombak, D.A.; Small, M.J. Modeling the Effects of Conservation, Demographics, Price, and Climate on Urban Water Demand in Los Angeles, California. Water Resour. Manag. 2016, 30, 5247–5262. [Google Scholar] [CrossRef]
- Sun, L.; Pan, B.; Gu, A.; Lu, H.; Wang, W. Energy–water nexus analysis in the Beijing–Tianjin–Hebei region: Case of electricity sector. Renew. Sustain. Energy Rev. 2018, 93, 27–34. [Google Scholar] [CrossRef]
- Kumar, A.; Subramanyam, V.; Kabir, M. Development of Energy, Emission and Water Flow Sankey Diagrams for the Province of Alberta Through Modeling; Alberta Innovates–Energy and Environmental Solutions (AIEES): Edmonton, AB, Canada, 2011. [Google Scholar]
- SEI International. Factsheet: Integrating the WEAP and LEAP Systems to Support Planning and Analysis at the Water-Energy Nexus; Stockholm Environment Institute: Somerville, MA, USA, 2012. [Google Scholar]
- Adiprasetya, R.; Hasibi, A.; Hadi, S.P.; Widiastuti, A.N. Optimizing Geothermal Energy and Hydro Power in Capacity Expansion at the Electrical System of Java-Madura-Bali. Int. J. Eng. Comput. Sci. 2013, 13, 1–8. [Google Scholar]
- Intergovernmental Panel on Climate Change. Climate Change 2014: Mitigation of Climate Change; Cambridge University Press: Cambridge, UK, 2014. [Google Scholar]
- van Vuuren, D.P.; Edmonds, J.; Kainuma, M.; Riahi, K.; Thomson, A.; Hibbard, K.; Hurtt, G.C.; Kram, T.; Krey, V.; Lamarque, J.F.; et al. The representative concentration pathways: An overview. Clim. Chang. 2011, 109, 5–31. [Google Scholar] [CrossRef]
- Thomson, A.M.; Calvin, K.V.; Smith, S.J.; Kyle, G.P.; Volke, A.; Patel, P.; Delgado-Arias, S.; Bond-Lamberty, B.; Wise, M.A.; Clarke, L.E.; et al. RCP4.5: A pathway for stabilization of radiative forcing by 2100. Clim. Chang. 2011, 109, 77–94. [Google Scholar] [CrossRef] [Green Version]
- Riahi, K.; Rao, S.; Krey, V.; Cho, C.; Chirkov, V.; Fischer, G.; Kindermann, G.; Nakicenovic, N.; Rafaj, P. RCP 8.5-A scenario of comparatively high greenhouse gas emissions. Clim. Chang. 2011, 109, 33–57. [Google Scholar] [CrossRef] [Green Version]
- Nabavi, E. Failed policies, falling aquifers: Unpacking groundwater overabstraction in Iran. Water Altern. 2018, 11, 699–724. [Google Scholar]
- Wetekamp, W. Net present value (NPV) as a tool supporting effective project management. In Proceedings of the 6th IEEE International Conference on Intelligent Data Acquisition and Advanced Computing Systems: Technology and Applications, IDAACS’2011, Prague, Czech Republic, 15–17 September 2011; Volume 2, pp. 898–900. [Google Scholar] [CrossRef]
- Saaty, T.L. How to make a decision: The analytic hierarchy process. Eur. J. Oper. Res. 1990, 48, 9–26. [Google Scholar] [CrossRef]
- Asadi, H.H.; Sansoleimani, A.; Fatehi, M.; Carranza, E.J.M. An AHP–TOPSIS Predictive Model for District-Scale Mapping of Porphyry Cu–Au Potential: A Case Study from Salafchegan Area (Central Iran). Nat. Resour. Res. 2016, 25, 417–429. [Google Scholar] [CrossRef]
- Hwang, C.-L.; Yoon, K. Methods for Multiple Attribute Decision Making. In Multiple Attribute Decision Making; Springer: Berlin, Heidelberg, 1981; pp. 58–191. [Google Scholar] [CrossRef]
- Hwang, C.L.; Lai, Y.J.; Liu, T.Y. A new approach for multiple objective decision making. Comput. Oper. Res. 1993, 20, 889–899. [Google Scholar] [CrossRef]
- Elsayed, E.A.; Dawood, A.K.S.; Yan, K. Evaluating Alternatives through the Application of Topsis Method with Entropy Weight. Int. J. Eng. Trends Technol. 2017, 46, 60–66. [Google Scholar] [CrossRef]
- Zhang, Y. Consumer Choice Modeling: Comparing and Contrasting the MAAM, AHP, TOPSIS and AHP-TOPSIS Methodologies. M.Sc. Thesis, The University of Manitoba, Winnipeg, MB, Canada, 2014. [Google Scholar]
- Saaty, T.L. The Analytic Hierarchy Process; McGraw: New York, NY, USA, 1980. [Google Scholar]
- Saaty, T.L.; Vargas, L.G. Inconsistency and rank preservation. J. Math. Psychol. 1984, 28, 205–214. [Google Scholar] [CrossRef]


| Category | Primary Data | Sources |
|---|---|---|
| Economy and society | Population and household size | [52] |
| Gross domestic product (GDP) structure | [53] | |
| Inflation and discount ration | [54] | |
| Energy | Domestic urban and rural energy consumption of appliances based on fuel type, commercial energy consumption based on fuel type, energy consumption for thirteen main industries based on fuel type, electricity consumption of public lighting, pressurized and unpressurized energy consumption for thirteen main crops based on fuel type, energy consumption in greenhouse based on fuel type, electricity consumption for water treatment and distribution, percentage of loss for electricity transmission and distribution, information about power generation (e.g., fuel type, efficiency, availability) | [55,56] |
| Water | Domestic urban and rural water consumption, physical water loss | [57,58] |
| Information about rivers, aquifers, and dams | [59] | |
| The efficiency of different irrigation systems, pressurized and unpressurized water consumption for thirteen main crops, greenhouse water consumption, water consumption for thirteen main industries | [60] | |
| Water consumption and withdrawal in energy generation | [55,57,58] | |
| Agriculture | The area under cultivation for different crops and different irrigation systems, greenhouse area under cultivation | [60] |
| Lake Urmia | Volume, area, and level of water of Lake Urmia | [61] |
| Meteorology | Daily precipitation, maximum and minimum daily temperature, location of meteorological stations | [62] |
| Classification | Strategy Name | Moderate Goal | Challenging Goal |
|---|---|---|---|
| Agriculture | Cultivation area reduction | Decrease in cultivation area by 0.5% each year | Decrease in cultivation area by 1% each year |
| Crop pattern adjustment | Replacing the cultivation of high-water consumption crops with low-water consumption crops to reach the limitation of providing local requirement by 2040 | Banning the cultivation of high-water consumption crops and replace them with low-water consumption crops by 2040 | |
| Greenhouse cultivation development | Increasing the share of greenhouse cultivation by 2% each year | Increasing the share of greenhouse cultivation by 3% each year | |
| Irrigation efficiency improvement | Improving systems of irrigation to sprinkler and drip irrigation by 20% at the end of the time horizon | Improving systems of irrigation to sprinkler and drip irrigation by 40% at the end of the time horizon | |
| Potable water | Water loss reduction in the water distribution network | Reducing leaks and bursting to reduce real water loss by 0.5% each year | Reducing leaks and bursting to reduce real water loss by 1.2% each year |
| Water demand management | Improving water conservation technologies and decreasing water use intensity by 10% at the end of the time horizon, compared to BAU | Improving water conservation technologies and decreasing water use intensity by 20% at the end of the time horizon, compared to BAU | |
| Industry | Industry growth/industry structure adjustment to save water and energy | The industry grows by 23% over the BAU level by 2040, and the share of water-intensive industries is decreased to 16% | The industry grows by 53% over the BAU level by 2040, and the share of water-intensive industries is decreased to 8% |
| Energy | Energy-saving improvement on the demand side | Energy efficiencies are improved by 10% over BAU levels by 2040 in different sectors | Energy efficiencies are improved by 20% over BAU levels by 2040 in different sectors |
| Power generation improvement | Renewable energies capacity increases by 50% over BAU levels by 2040, replacing 50% of the capacity of gas turbine plants with natural gas combined-cycle plants | Renewable energies capacity increases by 70% over BAU levels by 2040, replacing 100% of the capacity of gas turbine plants with natural gas combined-cycle plants |
| Sector | Potable Water | Agriculture | Industry | Energy | |
|---|---|---|---|---|---|
| Scenario | |||||
| S0 | BAU | ||||
| S1 | |||||
| S2 | |||||
| S3 | |||||
| S4 | |||||
| S5 | |||||
| S6 | |||||
| S7 | |||||
| S8 | |||||
| Main Criteria | Indicator | Code | Unit | Criteria Factor |
|---|---|---|---|---|
| Environmental | Difference between Lake Urmia water level and its ecological water level | C1.1 | Million cubic meter (MCM) | Negative |
| Dependency on groundwater resources | C1.2 | MCM | Negative | |
| CO2 emission | C1.3 | Tones CO2 | Negative | |
| Economic | Employment | C2.1 | - | Positive |
| Net present value | C2.2 | Million United States dollar (USD) | Positive | |
| Social | Social acceptance | C3.1 | - | Positive |
| Governmental support | C3.2 | - | Positive | |
| Potable water deficit | C3.3 | MCM | Negative | |
| Agricultural water deficit | C3.4 | MCM | Negative | |
| Industrial water deficit | C3.5 | MCM | Negative | |
| Technical | Technical ability | C4.1 | - | Positive |
| Saaty Scale | Linguistic Variables |
|---|---|
| 1 | Equally importance |
| 3 | Weakly importance |
| 5 | Essential importance |
| 7 | Demonstrated importance |
| 9 | Absolute importance |
| 2, 4, 6, 8 | Intermittent values between the two adjacent judgments |
Publisher’s Note: MDPI stays neutral with regard to jurisdictional claims in published maps and institutional affiliations. |
© 2021 by the authors. Licensee MDPI, Basel, Switzerland. This article is an open access article distributed under the terms and conditions of the Creative Commons Attribution (CC BY) license (https://creativecommons.org/licenses/by/4.0/).
Share and Cite
Nasrollahi, H.; Shirazizadeh, R.; Shirmohammadi, R.; Pourali, O.; Amidpour, M. Unraveling the Water-Energy-Food-Environment Nexus for Climate Change Adaptation in Iran: Urmia Lake Basin Case-Study. Water 2021, 13, 1282. https://doi.org/10.3390/w13091282
Nasrollahi H, Shirazizadeh R, Shirmohammadi R, Pourali O, Amidpour M. Unraveling the Water-Energy-Food-Environment Nexus for Climate Change Adaptation in Iran: Urmia Lake Basin Case-Study. Water. 2021; 13(9):1282. https://doi.org/10.3390/w13091282
Chicago/Turabian StyleNasrollahi, Hossein, Rasool Shirazizadeh, Reza Shirmohammadi, Omid Pourali, and Majid Amidpour. 2021. "Unraveling the Water-Energy-Food-Environment Nexus for Climate Change Adaptation in Iran: Urmia Lake Basin Case-Study" Water 13, no. 9: 1282. https://doi.org/10.3390/w13091282