
Green Development Efficiency Measurement and Influencing Factors of the Paper Industry in the Yangtze River Economic Belt


1
School of Architecture and Art Design, Hunan University of Science and Technology, Xiangtan 411201, China
2
Research Center for Economic and Social Development in Central China of Nanchang University, Nanchang University, Nanchang 330031, China
3
State Key Laboratory of Estuarine and Coastal Research, East China Normal University, Shanghai 200241, China
*
Authors to whom correspondence should be addressed.
Water 2021, 13(9), 1286; https://doi.org/10.3390/w13091286
Submission received: 30 March 2021
/
Revised: 21 April 2021
/
Accepted: 29 April 2021
/
Published: 1 May 2021
Abstract
:The paper industry is a traditional industry with extensive consumption of resources and energy and more pollutant discharge. This industry is closely related to production and life activities. Under the general requirement of “to step up conservation of the Yangtze River and stop its over development”, the paper industry in the Yangtze River Economic Belt should urgently undergo green transformation and development. Based on the undesirable slack-based measure model, spatial gravity center, Kernel density function, Theil index, and panel model, this study examines the green development efficiency and its influencing factors of the paper industry in the Yangtze River Economic Belt from 2001 to 2016. Results showed the following: (1) from 2001 to 2016, the green development efficiency of the paper industry in the Yangtze River Economic Belt had been steadily improved, but the overall efficiency value is not high, which has a great potential for improvement. The green development efficiency of the paper industry in the Yangtze River Economic Belt presents the regional differentiation law of gradient increasing in the upper, middle, and lower reaches. (2) According to the gravity center trajectory, the efficiency center of the green development of the paper industry in the Yangtze River Economic Belt is located in the middle reaches of Hunan Province and Hubei Province and moves to the southwest. This case indicates that the green development efficiency of the paper industry in provinces and cities in the southwest has been improved. (3) The regional differences in the green development efficiency of the paper industry in the Yangtze River Economic Belt show the characteristics of narrowing fluctuations. The regional differences are the primary sources of the difference in the green development efficiency of the paper industry. (4) The enterprise scale, science and technology investment, and industrial structure have significant positive effects on the green development efficiency of the paper industry in the Yangtze River Economic Belt. On the contrary, environmental regulation and foreign investment intensity have significant negative effects. However, the above factors have different effects on the green development efficiency of the paper industry in the upper, middle, and lower reaches of the Yangtze River Economic Belt.
1. Introduction
Under the general requirement of “the development strategy of the Yangtze River Economic Belt to strengthen environmental protection rather than seeking rapid growth at the cost of the environment”, the industrial development in the Yangtze River Economic Belt should transform and upgrade green development. Paper and its products (hereinafter referred to as the paper industry) belong to a resource-based industry, which relies heavily on water, energy, and wood resources. Moreover, the paper industry is a traditional industry with large consumption of resources and more pollutant discharge [1]. Simultaneously, the paper industry is an important industry closely related to life and production activities. Under the current background of “Lucid waters and lush mountains are invaluable assets”, the environmental regulatory requirements and the inherent requirements of its green transformation development are very urgent. In recent years, the Ministry of Environmental Protection has significantly strengthened the environmental inspection and control in the paper industry in the Yangtze River Economic Belt. In May 2016, the Ministry of Environmental Protection took the lead in conducting the special action of environmental protection law enforcement of drinking water sources in the Yangtze River Economic Belt. A total of 490 drinking water sources were found in 126 prefecture-level cities in 11 provinces and cities along the Yangtze River. In December 2016, the Ministry of Environmental Protection issued the “notice on the implementation of the comprehensive emission plan of industrial pollution sources”, which pointed out the road map of the paper industry. In 2017, the Ministry of Environmental Protection formulated the emission standards of pollutants for the paper industry and further increased the inspection on the law enforcement of its emission permits. The pulp, papermaking, pulp, and paper joint enterprises in China generally encounter strict environmental control. At the end of 2017, China began to ban the import of mixed waste paper. The decrease in waste paper import makes obtaining a stable raw material supply difficult for small-scale papermaking enterprises. In this context, the paper industry in the upper, middle, and lower reaches of the Yangtze River Economic Belt is faced with such development difficulties. The reason is the closure of substandard enterprises, the evident shortage of raw material supply, and the sharp rise of paper cost. The paper industry in the Yangtze River Economic Belt is facing a serious situation of two-way extrusion.
The Yangtze River Economic Belt is a gathering area of the paper industry in China. In 2016, the paper industry in 11 provinces and cities of the Yangtze River Economic Belt achieved a total industrial sales of 621.094 billion Yuan, accounting for 41.87% of the national production [2]. Moreover, the production of machine-made paper and paperboard was 151.545 million tons, accounting for 41.44% of the national production. Furthermore, the production of paper products was 33.5267 million tons, accounting for 46.63% of the national production [3]. For the dilemma between environmental protection and industrial development of the paper industry in the Yangtze River Economic Belt under strict environmental regulation, the Ministry of Environmental Protection announced the “Technical policy of pollution control in Paper industry” in August 2017. The Ministry of Environmental Protection also proposed the overall requirements and policy vision of green development of the paper industry and the elimination of backward production capacity, thereby promoting the transformation of production mode and the optimization and adjustment of industrial structure. As an important raw material industry and essential industrial products supporting many sectors of the national economy [4], as mentioned above, the paper industry will inevitably affect the industrial development of the upstream and downstream industrial chains, which will also bring “opportunity” in the “danger” for the sustainable development. “Guiding opinions on strengthening the green development of industry in the Yangtze River Economic Belt”, “Ecological environment protection planning of Yangtze River Economic Belt”, and “Notice on the construction of the national transformation and upgrading demonstration development zone of the Yangtze River Economic Belt” all propose new requirements for the green transformation and development of the paper industry in the Yangtze River Economic Belt. Taking the road of green development and improving the efficiency of green development have become important ways for the paper industry in the Yangtze River Economic Belt to get rid of the current development dilemma. Therefore, under the tightening of the national environmental control, the total factor productivity and intensive utilization level of the paper industry in the Yangtze River Economic Belt should be urgently improved, including the contribution rate of green development and innovation drive to the quality and efficiency of the paper industry.
Research results on the green development efficiency of the paper industry are scarce. Scholars mainly focused on the measurement methods and the influencing factors of green development efficiency of the paper industry. In terms of measuring the green development efficiency of the paper industry, the data envelopment analysis (DEA) can be used for cross-period analysis and dimensionalization of data because this process does not need to set a specific function form. The DEA has become the mainstream method of measuring the green development efficiency of the paper industry [5,6]. Hailu and Veeman [7] studied the productivity of the Canadian paper industry. Salman Haiders et al. [8] used the slacks-based method to study the energy efficiency of the Indian paper industry from the perspective of enterprises. Javed Ahmad Bhat et al. used the slack-based measure (SBM) model to calculate the energy efficiency of the Indian paper industry and found that the pure technical efficiency and scale efficiency of India’s paper industry are unbalanced [9]. Thant and Charmondusit used pollution as an indicator of environmental input to measure the ecological efficiency of Myanmar’s paper industry [10]. Similarly, Boqian Lin et al. used the DEA model to measure the paper industry’s energy efficiency in 29 provinces in China. The research found significant differences in production technology and energy efficiency in different regions. They also noted that the eastern region was better than the central and western regions, but the gap was narrowing [11]. Xu Chang et al. calculated the total factor productivity of Chinese paper enterprises [12]. Tang Shuai et al. used the DEA–Malmquist index to study the total factor productivity of Chinese paper industry from 2000 to 2011. Moreover, they found that the change of total factor productivity had regional differences, that is, Jiangsu and Shandong grew faster, whereas Henan, Zhejiang, and Guangdong grew slower [13]. Based on the matrix DEA network model, Chen Xiang et al. found that significant regional differences exist in the circular economy efficiency of China’s papermaking and paper products industry from 2008 to 2012. Among which, the eastern region was the highest, followed by the central and western regions [14]. Chang Yu et al. used the slacks-based method and Malmquist Luenberger index to measure the ecological efficiency of the Chinese pulp and paper industry [15].
In terms of influencing factors, the impact of environmental regulation on the green development efficiency of the paper industry is a hot topic in domestic and foreign academic circles, but disputes in academic circles still exist. Yutao Wang found that strict environmental regulation can improve the ecological efficiency of the paper industry [16]. The impact of environmental regulation on the paper industry’s development efficiency is mainly realized through technological innovation. Most studies believe that environmental regulation has a positive incentive effect on the technological innovation of the paper industry, which is conducive to improving the overall efficiency of the paper industry [17,18]. However, in different periods and regulatory intensities, the impact of environmental regulation on the technological innovation of the paper industry is different due to different dominant factors [19]. The enterprise scale, foreign investment, research, and development investment are also important driving factors affecting the green development efficiency of the paper industry. Qingying Zheng et al. stated that the scale of enterprises is conducive to improving the energy efficiency of the paper industry in China. Moreover, the energy efficiency of state-owned enterprises is higher than that of non-state-owned enterprises [11]. Li Yongping et al. found that the scale and technological innovation level of papermaking enterprises in China take the primary business income of 2 billion Yuan as the critical value. Before the critical value, a strong positive correlation exists between them, and after the critical value, a weak positive correlation is found between them [20].
There are numerous researches about the industrial ecological efficiency, but the research on the green development efficiency of the paper industry is relatively rare. Although a few scholars used the DEA method to measure the total factor productivity of the paper industry, energy consumption and wastewater discharge, which are very important for paper production, were not considered in selecting indicators. Therefore, the literature cannot measure the green development efficiency of the paper industry, and it is difficult to analyze the pressure and impact of the paper industry on energy and water environment. Meanwhile, the existing research focused on analyzing the differences of the total factor productivity of paper industry among provinces, which only described the inter-provincial differences, but did not reveal the regional differences of green development efficiency of the paper industry and whether the regional differences come from inter- or intra-regions. This paper, based on the basin perspective, is aimed to analyze both the regional differences of green development efficiency of paper industry in the Yangtze River Economic Belt among the upstream, midstream, and downstream regions, and the differences between provinces with the spatial decomposition method of Theil index. Moreover, the main innovation of this paper is the contribution rate differences and influencing factors of the intra-regional and inter-regional differences of the green development efficiency can be obtained.
This study intends to carry out related research work from two aspects: (1) This study uses the SBM model based on undesired output to measure the green development efficiency of the paper industry in the Yangtze River Economic Belt by constructing a measurement system. The study then reveals the evolution law of its regional imbalance through the combination of a variety of methods. (2) From the perspective of spatial heterogeneity, this study uses a panel model to reveal the influencing factors of regional imbalance of green development efficiency of the paper industry in the upper, middle, and lower reaches of the Yangtze River Economic Belt. Then, the study proposes countermeasures and suggestions.
2. Materials and Methods
2.1. Materials
2.1.1. Study Area
The Yangtze River Economic Belt, covering 11 provinces and cities, including Shanghai, Jiangsu, Zhejiang, Anhui, Jiangxi, Hubei, Hunan, Chongqing, Sichuan, Guizhou, and Yunnan, covers an area of 205.23 × 10⁴ km2, accounting for 21.4% of the total area of the country. The population and gross domestic product (GDP) exceed 40% of the national total. To further study the differences of green development efficiency in the paper industry within and between regions of the Yangtze River Economic Belt, the regions are divided into three: upstream, midstream, and downstream (Table 1).
2.1.2. Analysis Framework of Green Development Efficiency
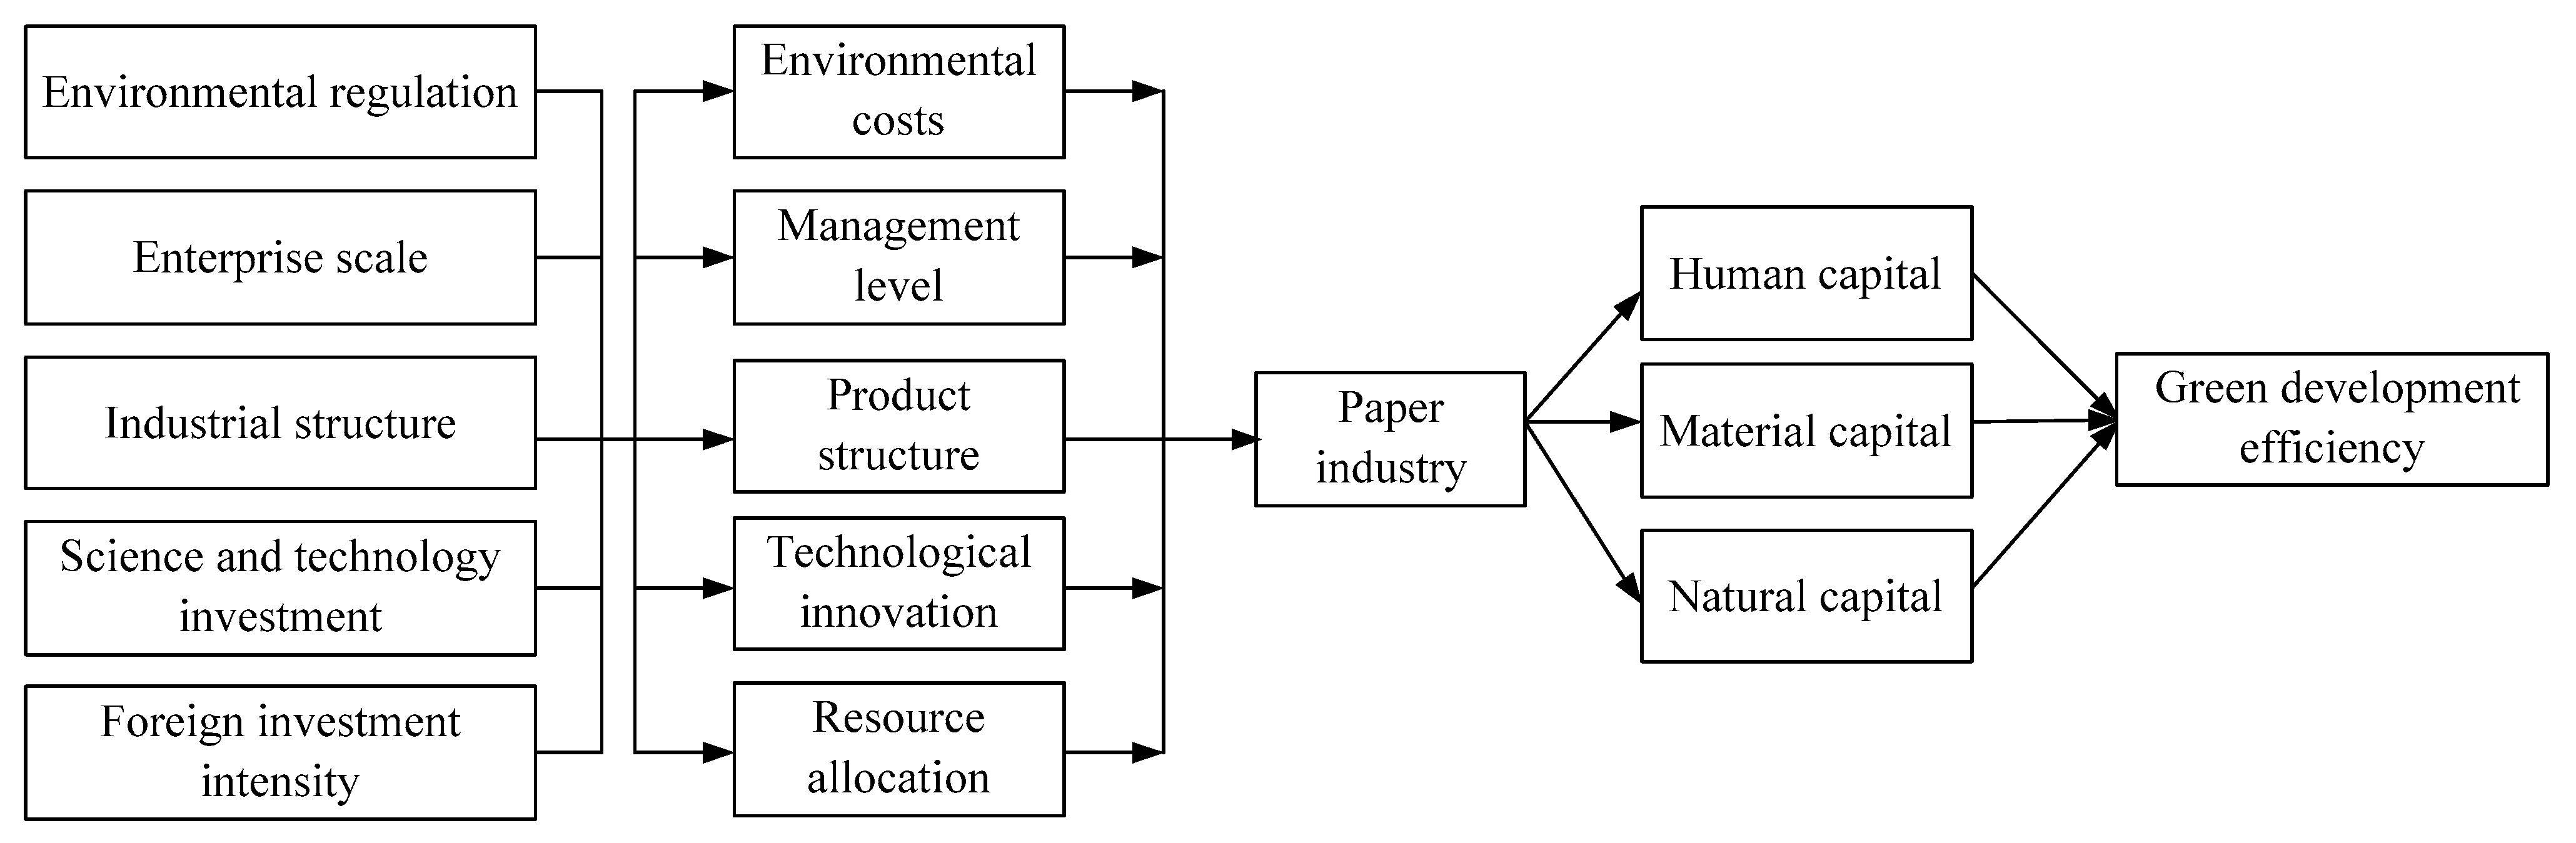
Using human, material, and natural capital builds the basic elements of chemical industry growth. Environmental regulation, enterprise scale, science and technology investment, foreign investment intensity, and industrial structure will also directly or indirectly affect the basic elements of economic growth, such as human capital, material capital, and natural capital. The papermaking enterprises rely on these elements, through environmental costs, technological innovation, product structure, management level, and resource allocation, thus affecting the green development of paper industry development efficiency [21,22]. Strict environmental regulation helps papermaking enterprises increase investment in scientific and technological innovation; improve production technology and process; and reduce raw material, energy consumption, and pollution emissions, to improve green development efficiency. However, the tightening of environmental regulations may also lead to the disappearance of “environmental dividend” of papermaking enterprises [23], the increase of environmental costs, and the narrowing of scientific and technological innovation investment [24]. On the contrary, this event leads to insufficient investment in enterprise innovation funds and inhibits enterprise technological innovation, thereby restricting the improvement of green development efficiency of the paper industry. The result is that enterprises’ innovation capital is insufficient, and the technological innovation of enterprises is restrained, thereby restricting the improvement of green development efficiency of the paper industry. Large-scale papermaking enterprises have sufficient funds, rich reserves of scientific and technological talents, technological solid innovation ability, high management level, and resource allocation ability, which can cope with the negative impact of the environmental costs’ increase. The increase of regional science and technology investment will bring additional financial support for papermaking enterprises’ innovation and enhance the research and development ability and scientific and technological output of enterprises.
Foreign investment has different effects on the green development of papermaking enterprises in different regions. That is, foreign investment may have an enormous environmental problem when entering the area with low intensity of environmental regulation. However, for the areas with strict environmental regulations, foreign investment will help to improve the level of technology and management. The adjustment of industrial structure will promote papermaking enterprises to adjust product structure, make efficient use of resources, eliminate backward production capacity, drive innovation, and improve the green development efficiency of papermaking enterprises (Figure 1).
2.1.3. Index and Data
The production process of the paper industry has desirable outputs, such as paper products and economic welfare, and undesirable ones, such as pollutants. According to the characteristics of the DEA model, combined with the industrial characteristics of large energy consumption and pollutant emission of the paper industry, and based on the easy access of data, representativeness, and operability of indicators, this study attempts to construct a measurement index system of green development efficiency of the paper industry (Table 2). According to [25], in the paper industry, the annual average number of employees is selected as the labor input, the average annual balance of the net fixed assets instead of the capital stock as the capital input, the total energy consumption as the energy input, the industrial sales value as the desirable output factor, and the wastewater discharge as the undesirable output factor.
The data are from the “China Industrial Statistical Yearbook”, “China Environmental Statistical Yearbook”, “Almanac of China Paper Industry”, “China Statistical Yearbook”, and statistical yearbooks of some provinces and cities from 2002 to 2017. For the data of energy consumption and wastewater discharge of the paper industry that is not directly given in the statistical yearbooks, the method of [14] is used for estimation. The average annual balance of net fixed capital and the output value of industrial sales are reduced to the level of 2000a with the fixed asset investment price index of corresponding provinces and the factory price index of industrial producers, respectively.
2.2. Method
2.2.1. Super Efficiency SBM Model of Undesirable Output
According to the tone’s processing method, the SBM model for measuring the green development efficiency of the paper industry is constructed as follows [26,27]:
In Equations (1) and (2), represents the number of decision-making units; represents the input of each decision-making unit; and represent the desirable and undesirable outputs, respectively; , , and represent the elements in the input, desirable output, and undesirable output matrices, respectively; is the efficiency value of green development of the paper industry.
2.2.2. GRAVITY Center Analysis Method
The gravity center concept originated from physics and is widely used in the economy, industry, population, and other fields to describe the spatial distribution of these factors. In the gravity center’s actual calculation, the coordinates of a specific area are selected as the point coordinates through which the resultant forces pass. The calculation formula is as follows [28]:
In Equation (3), and are the barycentric coordinates of attribute of geographical unit, and is the number of attributes of the geographical unit.
2.2.3. Kernel Density Estimation
Kernel density estimation belongs to density mapping [29], which is more accurate and smooth than histogram estimation. The kernel density estimated quantity is as follows:
In Equation (4), is the probability density function; is the number of study areas; is the bandwidth; is the random kernel function, and the Gaussian kernel function is selected. The estimation process is completed in Eview 10.
2.2.4. Theil Index and Its Spatial Decomposition
The calculation formula of the Theil index is as follows [30]:
In Equation (5), is the number of provinces and cities, is the green development efficiency of the paper industry in province, and is the mean value of green development efficiency of the paper industry. The Theil index can be divided into two parts, namely, intra-regional and inter-regional differences. The Theil index can be divided into two parts, that is, intra-regional and inter-regional differences. Therefore, the Theil index of green development efficiency of the paper industry can be decomposed as follows:
In Equations (6)–(8). is the difference within the upper, middle, and lower reaches; is the difference between the upper, middle, and lower reaches; , , and are the upper, middle, and lower reaches; is the number of provinces and cities; , , and are the number of provinces and cities in the upper, middle, and lower reaches; is the ratio of the green development efficiency of the paper industry of province to that of the Yangtze River Economic Belt; , , and are the ratios of the green development efficiency of the paper industry of the upper, middle, and lower reaches to that of the Yangtze River Economic Belt.
3. Results and Discussion
3.1. Spatial and Temporal Characteristics of Green Development Efficiency of the Paper Industry in Yangtze River Economic Belt
3.1.1. Time Series Evolution Characteristics
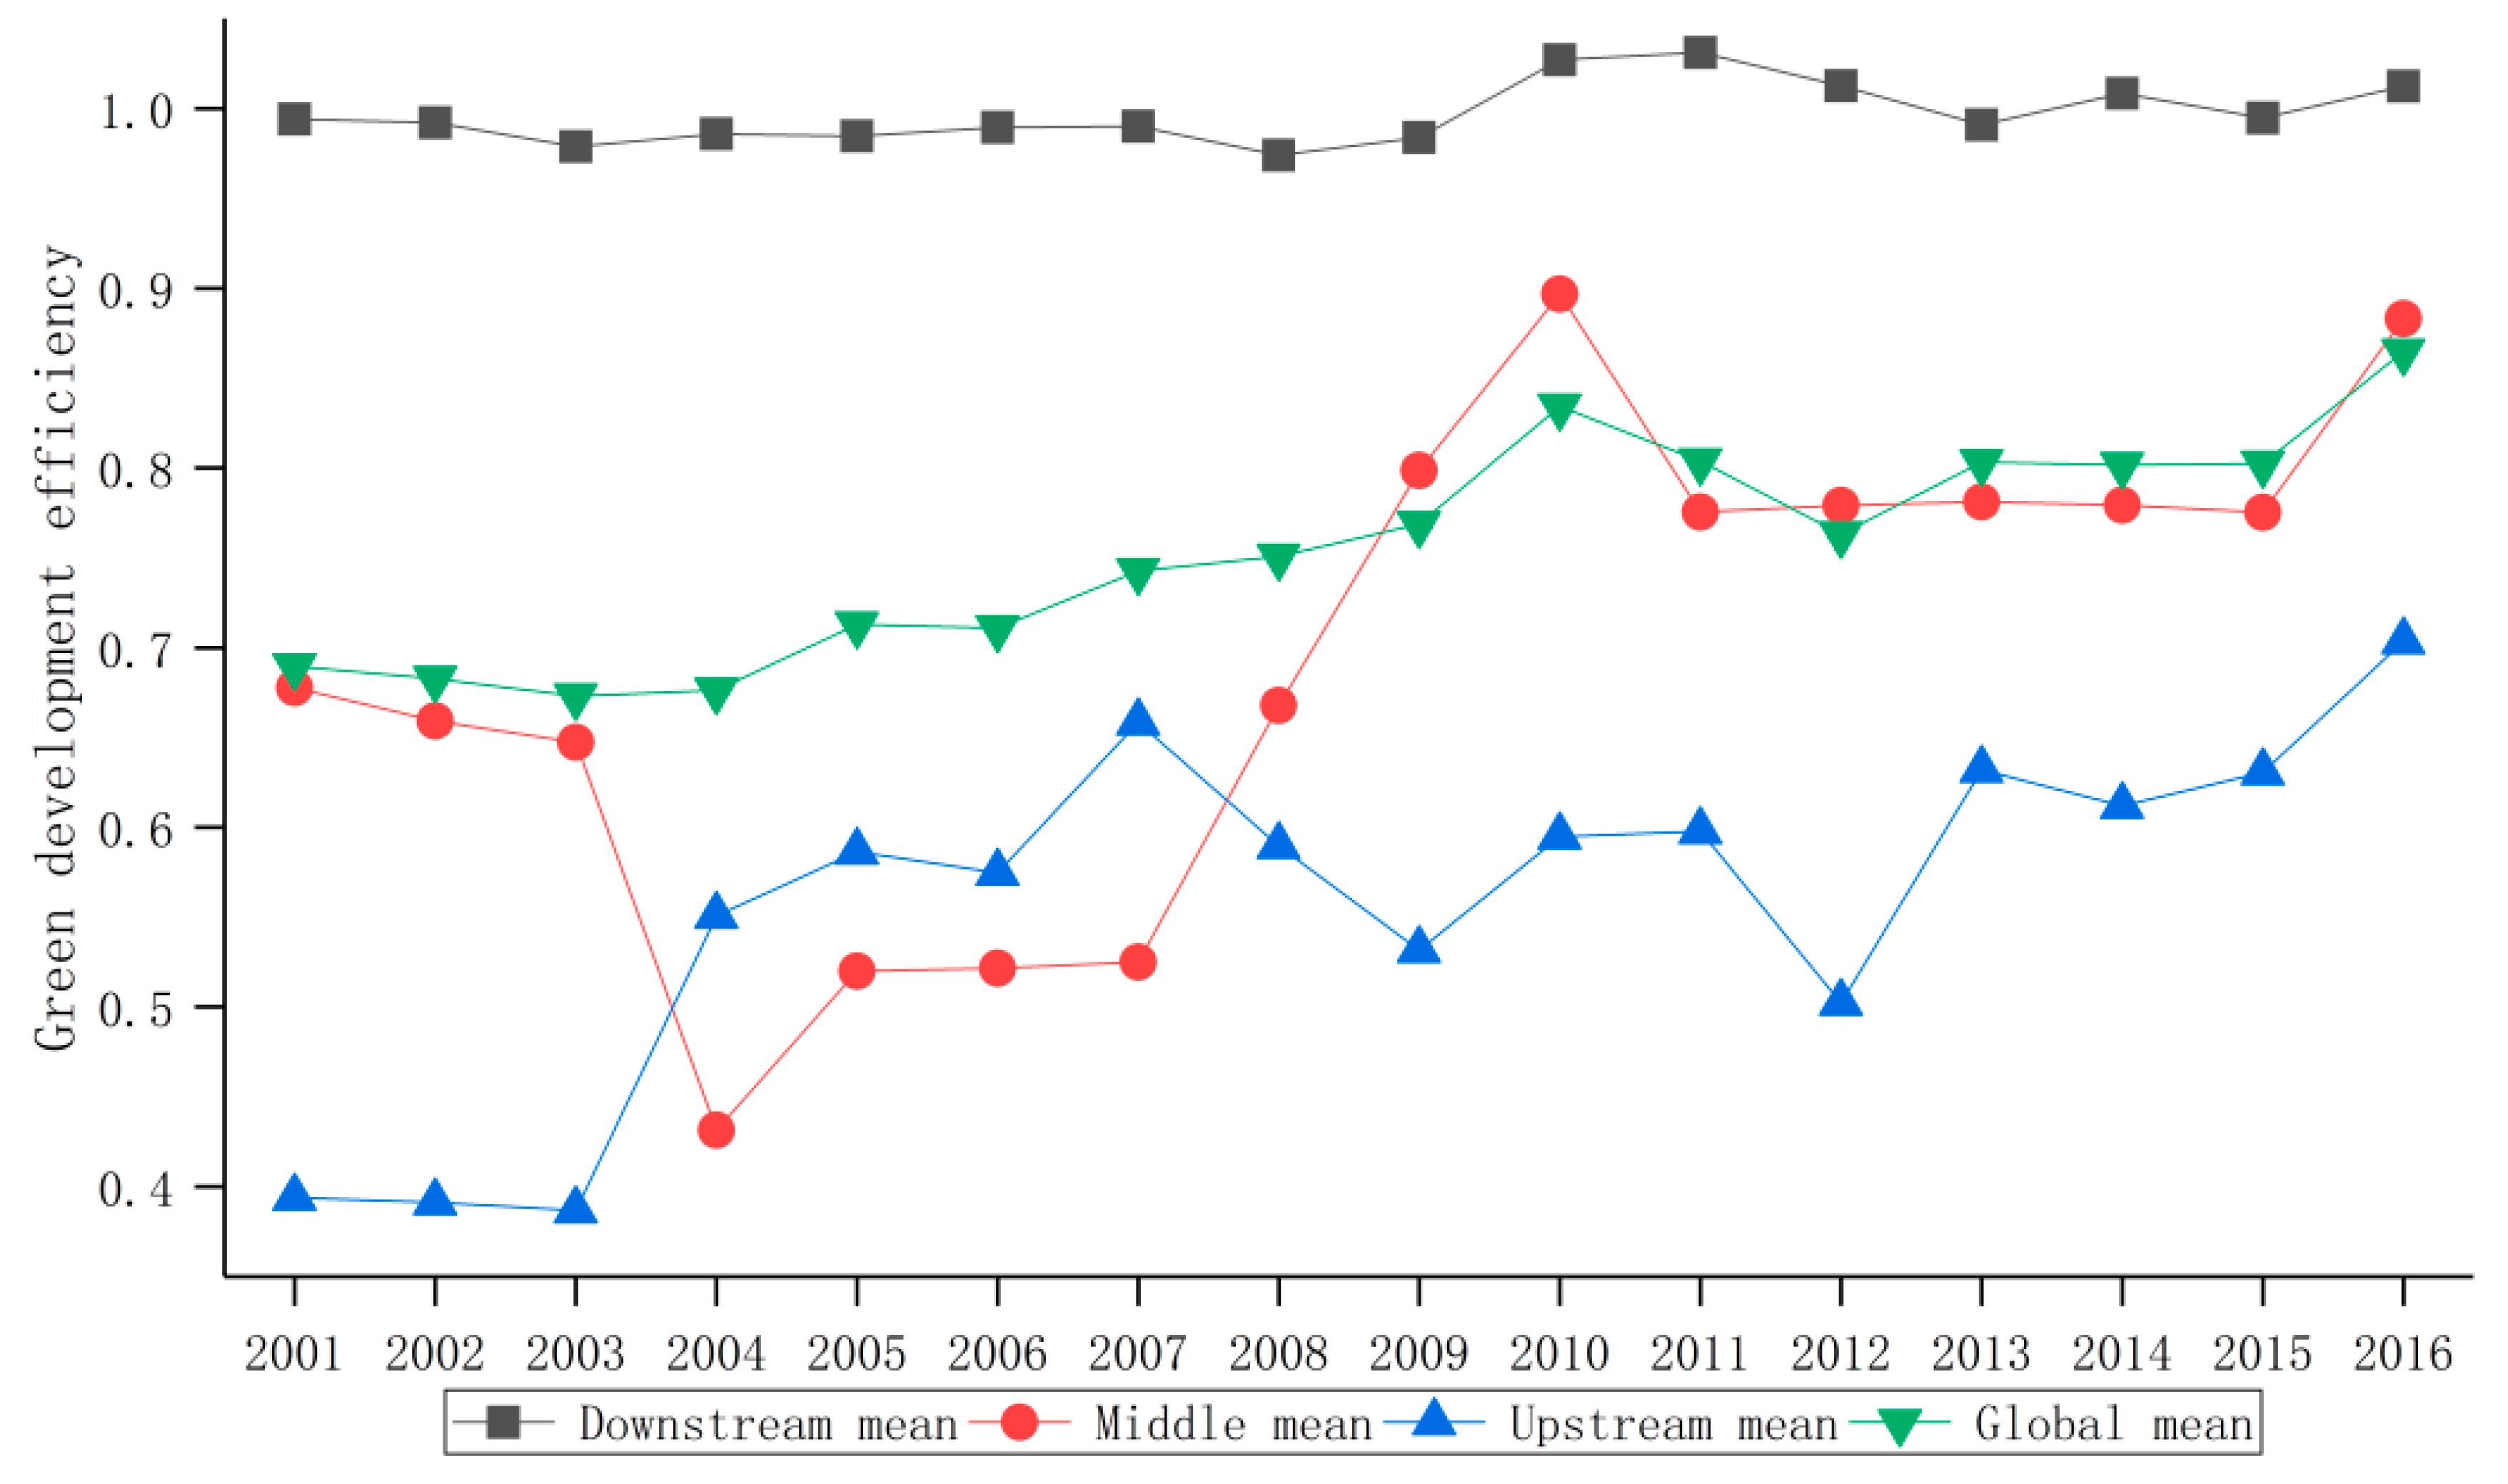
From 2001 to 2016, the overall green development efficiency of the paper industry in the Yangtze River Economic Belt showed an upward trend in fluctuations (Figure 2). The green efficiency of the paper industry increased from 0.6895 in 2001 to 0.8648 in 2016, with an increase of 0.1753. The annual average geometric growth rate was 1.70%, and the efficiency loss gap was 13.52%. The data show that although the green development efficiency of the paper industry in the Yangtze River Economic Belt has been steadily improved, the overall level is still not high, and the promotion potential is enormous.
In terms of the green development efficiency of the paper industry in the Yangtze River Economic Belt from 2001 to 2016, the efficiency value shows a fluctuating upward trend with a relatively stable development trend in lower reaches area. The development trend initially decreases and then increases with a large fluctuation range in the middle reaches area, with a fluctuating upward trend with a large fluctuation range in the upper reaches area. Overall, the efficiency values of the upper, middle, and lower reaches are increasing in gradient. The average green development efficiency of the paper industry in the downstream region is much higher than that in the middle and upper reaches. The reason is that the downstream areas of Jiangsu, Zhejiang, Shanghai, and other provinces and cities have an excellent paper industry foundation, technological solid innovation ability, and a highly comprehensive management level. For example, although the production capacity of the paper industry in Shanghai is relatively small, its existing paper enterprises mainly focus on high-end household paper and special paper with high added value, low resource and energy consumption, and limited environmental impact. Zhejiang Province has implemented several rounds of paper industry renovation. The papermaking enterprises with small scale, prominent environmental pollution, and weak technological innovation ability are transformed or shut down to eliminate the backward production capacity, thereby promoting the improvement of the green development efficiency of the paper industry. However, in provinces and cities in the middle and upper reaches, their paper industry is usually weak in foundation, small in scale, short of funds, backward in technology, lack of talents, low in research and development and management level, and lack of support and development opportunities from the central government. Therefore, they are far behind the downstream areas in an innovation environment, technology, and management level [31]. For example, the scale of papermaking enterprises in Yunnan and Guizhou is generally small, the technical equipment is backward, the comprehensive energy consumption and water consumption per ton of paper are higher than the national average level, and the CODcr of paper industry wastewater is also higher than the national average level [3]. The data in 2016 show the following: only one large-scale papermaking enterprise with an annual production capacity of more than 100 × 104 tons and two medium-sized papermaking enterprises with an annual production capacity of 30–100 × 104 tons in Jiangxi Province, two medium-sized papermaking enterprises with 30–100 × 104 tons in Hubei Province, one papermaking enterprise with 30 × 104 tons in Sichuan Province, and no papermaking enterprise with more than 30 × 104 tons in Yunnan Province [3]. To a certain extent, this case has affected the green development efficiency of the paper industry in the middle and upper reaches. To a certain extent, this case has affected the green development efficiency of the paper industry in the middle and upper reaches.
3.1.2. Evolution Analysis of Spatial Gravity Center
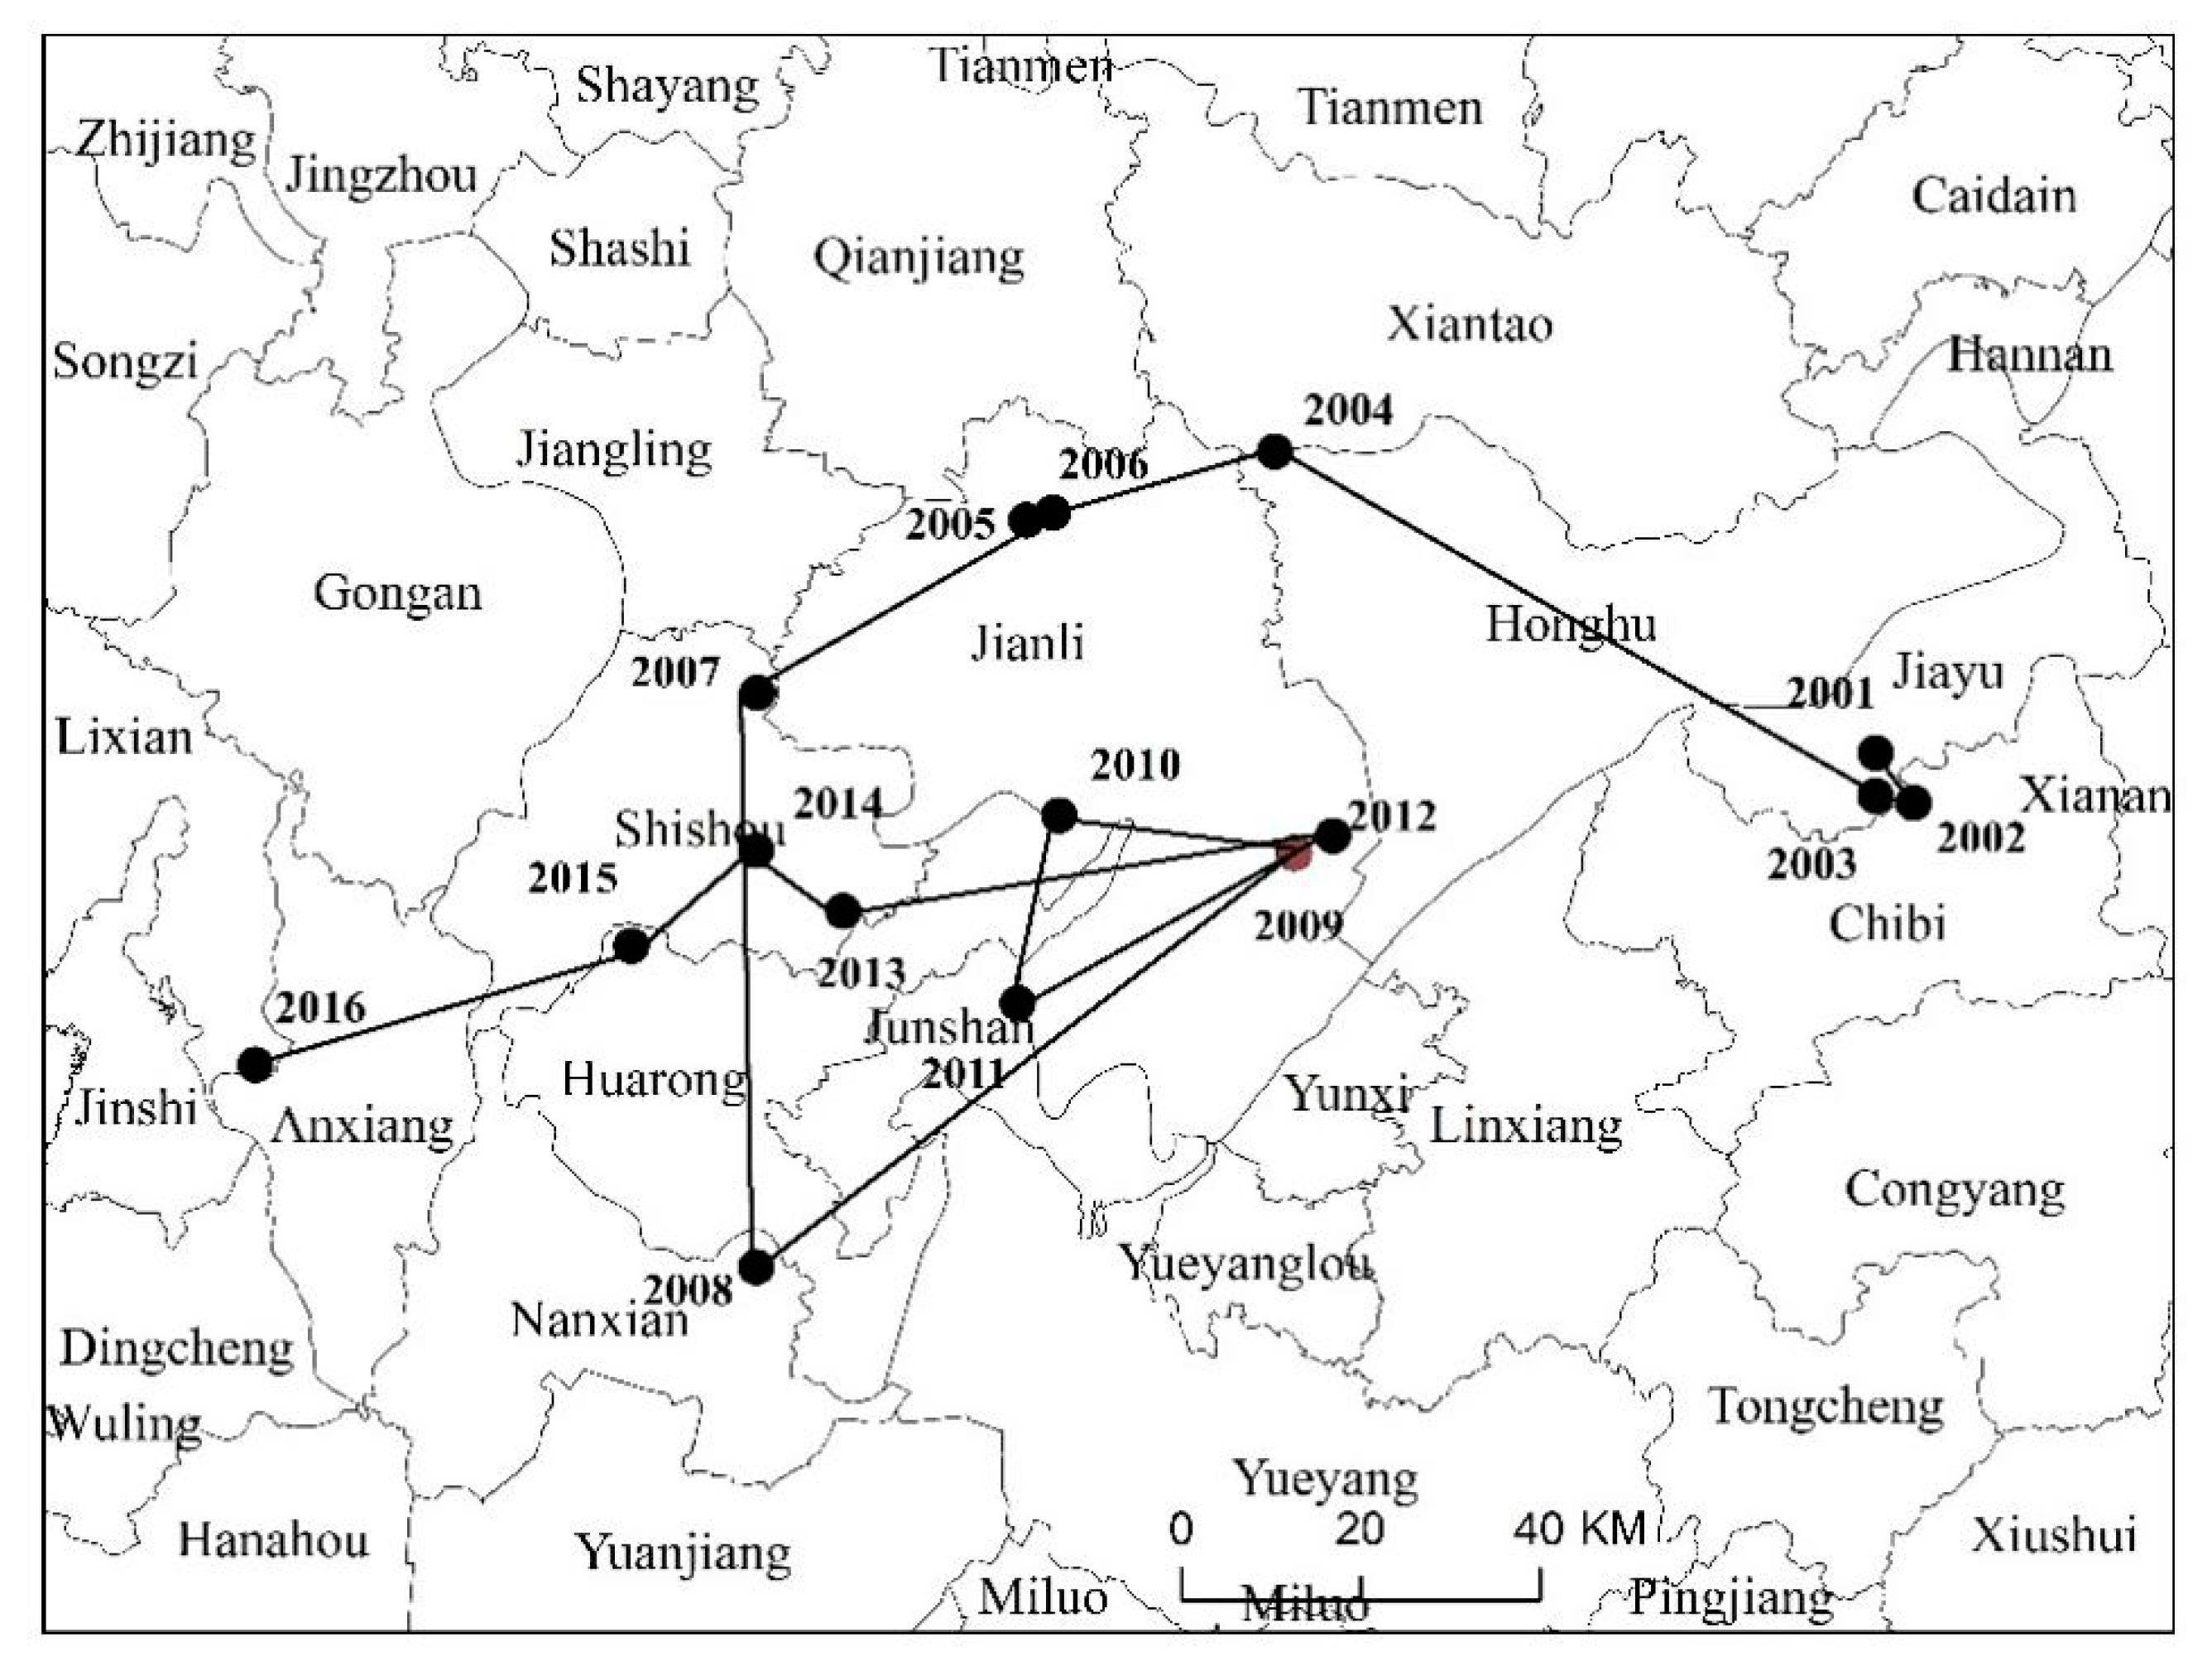
From 2001 to 2016, the green development efficiency center of the paper industry was distributed in Hunan Province and Hubei Province in the middle reaches of the Yangtze River, moving 184.17 km to the southwest, with an average annual migration distance of 11.70 km. Thus, in the study period, the paper industry’s green development efficiency in the southwest of the Yangtze River Economic Belt has been improved (Figure 3).
During the “Tenth Five Year Plan” and “Eleventh Five Year Plan”, the state requires the paper industry to eliminate backward production capacity and strengthen the construction of energy conservation and emission reduction, resulting in the overall shift of the green development efficiency center of the paper industry to the southwest from 2001 to 2008. The green development efficiency of the paper industry in Yunnan and Guizhou increased rapidly. The financial crisis in 2008 had a great impact on the paper industry in the upstream areas where small- and medium-sized enterprises exist, and the capital and technology are relatively weak. From 2008 to 2012, the gravity center moved to the northeast of the Yangtze River’s lower reaches. However, since the 18th National Congress of the Communist Party of China, the ecological civilization construction has become the consensus of all provinces and cities in the Yangtze River Economic Belt. This event has promoted the green transformation and upgrading of the paper industry, implemented cleaner production, and improved the utilization rate of paper industry resources. As the efficiency of green development of the paper industry in the middle and upper reaches has been greatly improved, the gravity center of green development efficiency moved to the southwest as a whole from 2012 to 2016.
3.1.3. Dynamic Analysis of Spatial Imbalance
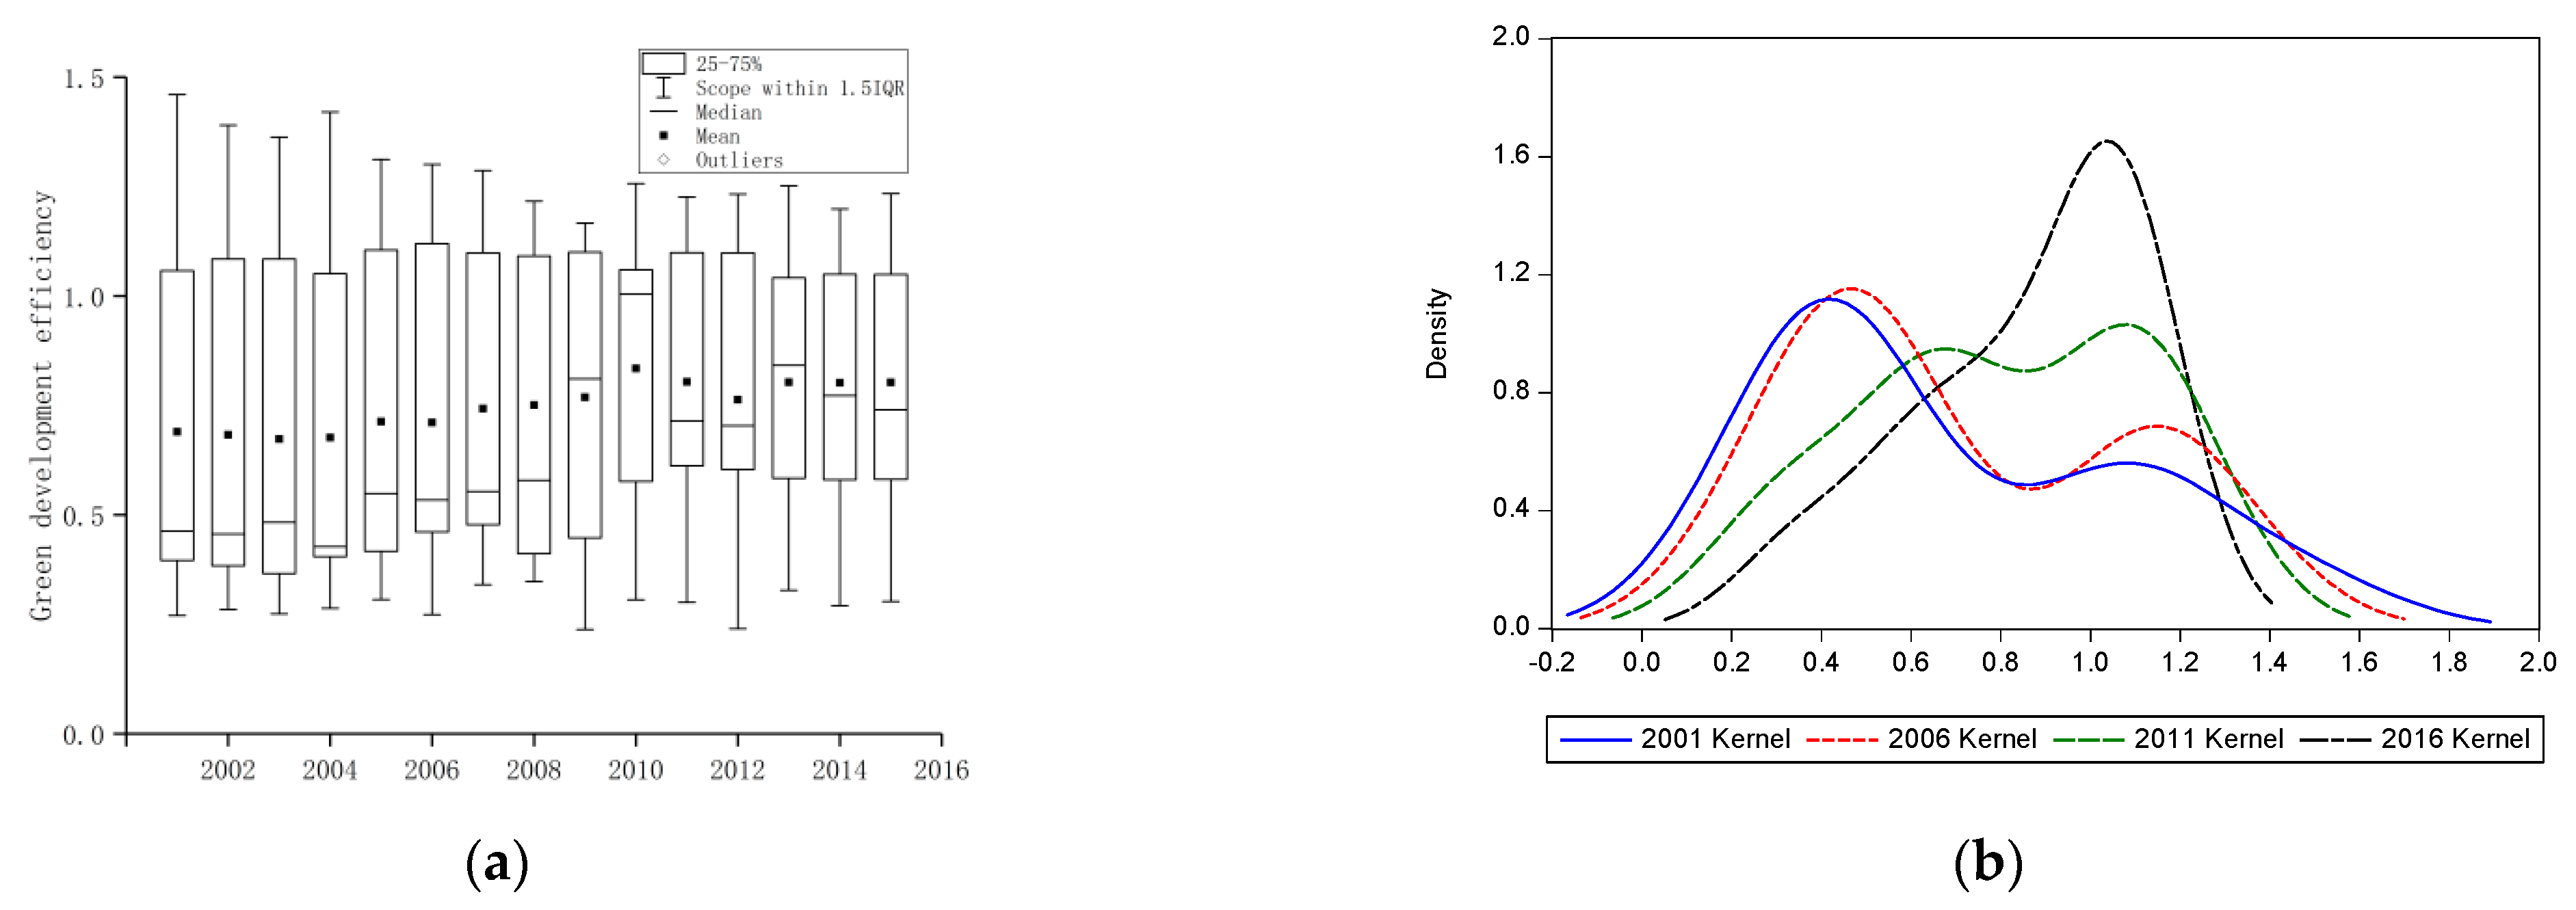
The average green development efficiency of the paper industry in the Yangtze River Economic Belt from 2001 to 2016 experienced the fluctuation of “up-down-up”, which showed a rising trend on the whole. In addition, the differences between provinces and cities were characterized by “expand-reduce” fluctuation, and the overall performance was the shrinking evolution (Figure 4a). To further reveal the dynamic characteristics of the spatial imbalance of the green development efficiency of the paper industry in the Yangtze River Economic Belt, 2001, 2006, 2011, and 2016 are selected as the observation time points to estimate the kernel density and explore the dynamic distribution of the spatial imbalance of the green development efficiency of the paper industry in the Yangtze River Economic Belt at different time points (Figure 4b).
The distribution of the average green efficiency of the paper industry in the Yangtze River Economic Belt shows a right shift trend from the low- to high-value areas, which indicates that the green efficiency value has improved over time. In 2001 and 2006, the green efficiency value of the paper industry showed a “high-low” two-peak distribution, with a high peak in the low-value area and a low peak in the high-value area. Moreover, with the change over time, the distance between the two peaks becomes smaller, the peak becomes higher, and the width becomes narrower, which indicates that the spatial imbalance becomes small and the degree of polarization is high. The spatial difference is evident. In 2011, the paper industry’s wave crest becomes lower, the width becomes wider, and the wave crest of high-value area becomes higher, which indicates that the spatial imbalance becomes large. However, in 2016, the green development efficiency value of the paper industry in the Yangtze River Economic Belt has changed from “two-peak” to “single-peak”, and the wave crest width has become narrower. Moreover, the wave crest has become sharp, showing the overall trend of promoting from low- to high-value areas. The efficiency value of green development has been improved as a whole, and the spatial imbalance of green development efficiency of the paper industry between provinces and cities has been reduced.
3.1.4. Regional Difference Decomposition
With the help of the Theil index, this study explores the regional differences of green development efficiency of the paper industry in the Yangtze River Economic Belt and its main influencing factors (Table 3).
- (1)
- The overall differences were analyzed. Based on the Theil index, the paper industry’s green development efficiency in the Yangtze River Economic Belt initially increased and then decreased from 2001 to 2016, indicating that the regional difference first expands and then narrows in the fluctuation. This result is consistent with the kernel density estimation. The Theil index’s maximum value was 0.1547 in 2003, and the minimum value was 0.0460 in 2016. Specifically, from 2001 to 2003, the Theil index of green efficiency of the paper industry increased slightly, and after 2003, the Theil index decreased. In 2006, 2008, and 2012, the Theil index increased slightly again, indicating that the regional differences of green efficiency of the paper industry in these years expanded. The Theil index of the lower reaches showed a downward trend, indicating that the regional gap was narrowing. Then, the Theil index of the middle reaches fluctuated greatly from 2001 to 2008 and rose slightly after 2009, indicating that the regional difference was expanding. Finally, the Theil index of the upper reaches showed an upward trend from 2001 to 2006 but continued to decrease after 2007, indicating that the regional difference expanded first and then narrowed.
- (2)
- By further dividing the Theil index into regional and intra-regional differences, the Theil index of the upper, middle, and lower reaches of the Yangtze River Economic Belt is greater than that of the inter-regional. Moreover, the contribution share of the difference in intra-region increases with the evolution of time. The contribution increased from 52% in 2001 to 74% in 2016 and even reached 75% in 2008 and 2013, showing that intra-regional differences are the primary source of green efficiency differences in the paper industry in the Yangtze River Economic Belt.
With the development of the social economy, the spread and diffusion of green innovation elements and management experience of the paper industry in the Yangtze River Economic Belt make the gap of the papermaking enterprises in the upper, middle, and lower reaches in management and technological innovation ability continue to narrow. Moreover, these elements also make the regional differences of green development efficiency continue to narrow. However, the differences in green innovation ability, enterprise scale, and enterprise management level of the papermaking enterprises within the region still exist objectively due to the resource endowment, economic, and technological gradient. Furthermore, the intra-region differences are more significant than those between regions. Therefore, promoting the division and cooperation among regions and narrowing the difference of the paper industry’s green development efficiency within the region are still important tasks for the green transformation and development of the paper industry in the Yangtze River Economic Belt.
3.2. Analysis on Influencing Factors of Green Development Efficiency Evolution of the Paper Industry in Yangtze River Economic Belt
Based on the relevant domestic research results, this study analyzes the influencing factors of the green development efficiency of the paper industry in the Yangtze River Economic Belt from the five aspects of enterprise scale, environmental regulation, science and technology investment, foreign investment intensity, and industrial structure [32,33,34,35]. The ratio of the sales volume to the number of enterprises in the above-scale paper industry is selected as the representative of the enterprise scale. In addition, the proportion of total environmental governance in GDP represents environmental regulation, and the proportion of science and technology expenditure in fiscal expenditure represents science and technology investment. Then, the year-end investment of foreign-funded enterprises represents the intensity of foreign investment, and the proportion of secondary industry in GDP represents the industrial structure. In this study, the green development efficiency of the paper industry is used as the dependent variable, and the five influencing factors are used as the independent variables. Furthermore, the foreign capital intensity variables are logarithmically processed to eliminate the influence of heteroscedasticity to construct the basic panel regression model.
In Equation (9), the dependent variable is the green development efficiency value of the paper industry; the independent variable is industrial scale, environmental regulation, scientific and technological input, foreign capital intensity, and industrial structure, respectively; is coefficient; is constant; is the province; is the year; is residual. Eview10.0 software is used to analyze the above panel data. The fixed effect model is adopted after the test. The results are as follows (Table 4):
- (1)
- Analysis of the Overall Empirical Estimation Results.
Overall, the effect direction of each influencing factor on the green development efficiency of the paper industry in the Yangtze River Economic Belt is in line with the expectation. Environmental regulation and foreign investment intensity have significant negative effects on green development efficiency. The enterprise scale, science and technology investment, and industrial structure have significant positive effects on green development efficiency. The specific indicators are as follows: The scale of the enterprise. The regression results show that the enterprise scale has a significant positive effect on the green development efficiency of the paper industry. Generally, large-scale enterprises have more capital, human resources, and equipment to invest in technological innovation and technological transformation, which is conducive to improving the green development efficiency of enterprises [32]. Environmental regulation. Environmental regulation has a significant negative effect on the green development efficiency of the paper industry, which hinders the improvement of the efficiency. This conclusion is similar to that of Qiu Xiaolan et al., that is, after considering environmental regulation, China’s paper industry’s average total factor productivity decreases [4]. Science and technology input. Science and technology input has a significant positive effect on the green efficiency of the paper industry and is still an important way to promote efficiency. Foreign capital intensity. The foreign capital intensity has a significant negative effect on the green efficiency of the paper industry in the Yangtze River Economic Belt. The reason may be that foreign capital’s entry threshold standards in various provinces and cities are different, which brings some environmental problems while introducing foreign investment, technology, talents, and management experience [31]. As a result, the green development efficiency of the paper industry is affected. Industrial structure. A close relationship exists between the paper industry and many industrial sectors of the national economy. The optimization of the overall regional industrial structure and the technical level improvement are conducive to improving green development efficiency. Therefore, the industrial structure has a significant positive effect on green efficiency.
- (2)
- Analysis of Empirical Estimation Results by Region.
The factors that have significant positive effects on the green development efficiency of the upstream paper industry include enterprise scale, science and technology input, and industrial structure, whereas other factors have no significant effects. Although environmental regulation and foreign capital intensity have negative effects on the green development efficiency of the paper industry in the upstream region, they are not significant. The reason may be that more small- and medium-sized enterprises in the upstream area and their innovation ability are weak. Strict environmental regulations will increase enterprises’ operating costs, thus hindering the improvement of the green development efficiency of the paper industry. Moreover, the entry of foreign investment in the upstream region has a low threshold of environmental protection due to the pressure of attracting investment, which will bring some environmental problems. The results affect the improvement of the green development efficiency of the paper industry.
The factors that have significant positive effects on the green development efficiency of the paper industry in the middle reaches also include environmental regulation, foreign capital intensity, and industrial structure. On the contrary, other factors have no significant effects. The technological innovation environment of the paper industry in the middle reaches is not good, and the technical management level is relatively backward. Hence, the technological input does not play a positive role in the efficiency of green development [34]. Therefore, the science and technology input in the middle reaches of the paper industry does not significantly improve the efficiency of green development, and a negative effect exists between the paper enterprise scale and the efficiency of green development. Moreover, although the middle reaches area has introduced relatively strict environmental regulations, some large- and medium-sized papermaking enterprises are even willing to be fined and do not comply with the regulations because of the low cost of illegal activities. They still adopt the extensive development mode in the production process, so that they consume considerable plant fiber, industrial water, and energy and emit more pollutants. Thus, the enterprise scale has no significant impact on improving green development efficiency.
The factors that have significant positive effects on the green development efficiency of the paper industry in downstream areas include science and technology input and industrial structure, whereas other factors have no significant effect. The research finds that environmental regulation has a positive effect on the improvement of green development efficiency of the paper industry in the downstream region, which indicates that the environmental regulation promotes the improvement of the green development efficiency. The result is not consistent with the direction of action of the upper and lower reaches of the Yangtze River Economic Belt. Moreover, the result shows that the effects of environmental regulations of different regions and intensities on the green development efficiency of the paper industry are not necessarily the same [19]. Therefore, in the actual management of the paper industry, differentiated environmental regulations should be formulated according to the time and place.
4. Discussion
Building the Yangtze River Economic Belt is a primary regional development strategy in China. Ecological priority and green development are the primary development principles. In China, the paper industry is widely distributed along the Yangtze River, impacting on the Yangtze River ecology and water environment. Improving the green development efficiency of the paper industry in the Yangtze River Economic Belt is the core requirement of the transformation and upgrading of the paper industry and a vital path to promote the high-quality development of the Yangtze River Economic Belt.
The green development efficiency improvement of the paper industry in the Yangtze River Economic Belt means that the transformation and upgrading of the paper industry have made some achivements. However, the Yangtze River Economic Belt is still faced with the dilemma of balance between the transformation and development of the paper industry and the protection of the ecological environment. On the one hand, the transformation and development of the paper industry can increase the local fiscal revenue, promote employment, and boost the social and economic development of the Yangtze River Economic Belt. However, it is likely to pose a threat to the safety of water, soil, and air in the Yangtze River Basin. Improving the energy efficiency and resource utilization efficiency of the paper industry in the Yangtze River economic belt, reducing waste emissions, accelerating resource conservation and environmental protection, and improving green efficiency are the key measures to realize the coordinated development of the paper industry and ecological environmental protection in the Yangtze River Economic Belt.
The inter-provincial spatial difference of paper industry in the Yangtze River Economic Belt should be paid attention to, and the gap among the three regions should not be enlarged. The paper industry green development efficiency of the Yangtze River Economic Belt is the highest in the lower reaches, followed by the middle reaches, and the lowest in the upper reaches. The results are similar to the overall research results of the references [8,10], both are related to industry’s spatial pattern of energy efficiency and total factor productivity. The Yangtze River Economic Belt is located in the east, middle, and west of China, with strong spatial heterogeneity. There are significant differences in social and economic development, industrial base, and innovation ability between the upper, middle, and lower reaches. It is not appropriate to think that the water environment problems caused by the paper industry will aggravate the green development efficiency of the paper industry in the lower reaches of the Yangtze River. Although the lower reaches of the Yangtze River are responsible for more pollutant emissions, the technological innovation level of their paper industry is higher than the other two reaches. Coupled with the advanced enterprise management system and governance mode, their green development efficiency is still high. In the future, the paper industry in the upper and middle reaches of the Yangtze River Economic Belt should focus on low-carbon green circular development through technological innovation, green transformation and upgrading, and spatial layout optimization.
Another policy implication of this paper is that when formulating the paper industry’s green transformation and upgrading strategy, the effects of environmental regulation, foreign investment intensity, industrial structure, enterprise-scale, science and technology investment, and regional heterogeneity should be taken into account. In view of the characteristics and differences of the upper, middle, and lower reaches of the paper industry, the targeted policy recommendations should be formulated. The upstream region should mainly expand the paper enterprises scale and increase the investments in science and technology and the technological research. The middle reaches of the region should indroduce strict environmental regulations, strengthen the collaborative governance of the paper industry chain and the management of foreign capital. The downstream region should further increase the brand advantage and the investment intensity in science and technology of the paper industry, strive to adjust the industrial structure and product structure of the paper industry, and improve the development quality of the paper industry.
5. Conclusions
The green development efficiency of the paper industry in 11 provinces and cities of the Yangtze River Economic Belt from 2001 to 2016 is calculated with the undesirable slack-based measure model. The spatial characteristics of the paper industry is analyzed by using the spatial gravity center, kernel density function, and Theil index. The influencing factors of the green development efficiency of the paper industry are explored by using the panel model.The main conclusions are as follows:
The results indicate that the green development efficiency of the paper industry in the Yangtze River Economic Zone from 2001 to 2016 shows an increasing trend, but the overall level is not high with obvious spatial divergence characteristics.
Inter-provincial differences in green development efficiency within the three major regions of the Yangtze River Economic Belt are the main source of its spatial imbalance. Narrowing regional differences remains one of the key tasks in the green transformation development of the paper industry in the Yangtze River Economic Belt.
Further research finds regional heterogeneity characteristics in the effects of environmental regulations, foreign investment intensity, industrial structure, enterprise size, and technology investment on the industrial green efficiency of the paper industry in upstream, midstream, and downstream regions. For the upstream region, enterprise-scale, science and technology input, and industrial structure have a significant positive effect on the basin. For the middle region, environmental regulation, foreign capital intensity, and industrial structure have a remarkable driving effect. Finally, science and technology input and industrial structure have a significant driving effect on the downstream region.
Author Contributions
Conceptualization, Y.X., S.W. and Z.D.; methodology, Y.X. and S.W.; data curation, Y.X. and Y.Z.; writing, Y.X., S.W., Z.D. and Y.Z.; supervision Z.D. and S.W.; Funding Acquisition, Y.X. and S.W. All authors have read and agreed to the published version of the manuscript.
Funding
This research was supported by regional funds of the National Natural Science Foundation of China (42061026, U2040202) and the Humanities and Social Sciences Research Project of the Ministry of Education (20 YJA 790071).
Institutional Review Board Statement
Not applicable.
Informed Consent Statement
Not applicable.
Data Availability Statement
The data presented in this study are available on request from the corresponding author.
Conflicts of Interest
The authors declare no conflict of interest.
References
- Toppinen, A.; Pätäri, S.; Tuppura, A.; Jantunen, A. The European pulp and paper industry in transition to a bio-economy: A delphi study. Futures 2017, 88, 1–14. [Google Scholar] [CrossRef]
- Department of Industrial Statistics, National Bureau of Statistics. China Industrial Statistical Yearbook (2017); Statistics Press: Beijing, China, 2017.
- China Paper Association. Almanac of China Paper Industry (2017); Light Industry Press: Beijing, China, 2017. [Google Scholar]
- Qiu, X. Analysis on Total Factor Productivity of Paper Industry in China under Environmental Regulations. J. Tech. Econ. Manag. 2015, 7, 109–113. [Google Scholar]
- Wu, C.; Yang, S.W.; Tang, P.C.; Wu, T.; Fu, S.K. Construction of the efficiency promotion model of green innovation in China’s heavy polluted industries. China Popul. Resour. Environ. 2018, 28, 40–48. [Google Scholar]
- Zheng, S.; Yu, J. Evaluation on efficiency of technology innovation in paper industry—Using DEA-Malmquist Index. Issues For. Econ. 2012, 32, 329–332. [Google Scholar]
- Hailu, A.; Veeman, T.S. Non-parametric productivity analysis with undesirable outputs: An application to the Canadian pulp and paper industry. Am Fish. Soc. Symp Am. J. Agric. Econ. 2001, 83, 605–616. [Google Scholar] [CrossRef]
- Haider, S.; Danish, M.S.; Sharma, R. Assessing energy efficiency of Indian paper industry and influencing factors: A slack-basedfirm-level analysis. Energy Econ. 2019, 81, 454–464. [Google Scholar] [CrossRef]
- Bhat, J.A.; Haider, S.; Kamaiah, B. Interstate Energy Efficiency of Indian Paper Industry: A Slack-based Non-parametric Approach. Energy. 2018, 161, 284–298. [Google Scholar] [CrossRef]
- Thant, M.M.; Charmondusit, K. Eco-efficiency assessment of pulp and paper industry in Myanmar. Clean Technol. Environ. Policy 2010, 12, 427–439. [Google Scholar] [CrossRef]
- Zheng, Q.; Lin, B. Industrial polices and improved energy efficiency in China’s paper industry. J. Clean. Prod. 2017, 161, 200–210. [Google Scholar] [CrossRef]
- Xu, C.; Cheng, B.; Li, L.; Tao, C.; Zhang, J. Effects of Export and Agglomeration on Total Factor Productivity of Chinese Paper-making Enterprises. World For. Res. 2019, 32, 40–45. [Google Scholar]
- Tang, S.; Song, W. Technical efficiency, technical progress and the increase of total factor productivity of China’s paper industry-Empirical analysis based on the DEA-Malmquist Index. Sci. Technol. Manag. Res. 2014, 16, 51–55. [Google Scholar]
- Chen, X.; Xiao, X. Study on dynamic evolution of regional differences in Chinese industrial circular economy efficiency and influence factors of efficiency—An empirical study on papermaking and paper products industry. China Soft Sci. 2015, 1, 160–171. [Google Scholar]
- Yu, C.; Shi, L.; Wang, Y.; Chang, Y.; Cheng, B. The eco-efficiency of pulp and paper industry in China: An assessment based on slacks-based measure and Malmquist–Luenberger index. J. Clean. Prod. 2016, 127, 511–521. [Google Scholar] [CrossRef]
- Wang, Y.; Liu, J.; Hansson, L.; Zhang, K.; Wang, R. Implementing stricter environmental regulation to enhance eco-efficiency and sustainability: A case study of Shandong Province’s pulp and paper industry, China. J. Clean. Prod. 2011, 19, 303–310. [Google Scholar] [CrossRef]
- Zhou, X.; Wang, X.; Tian, M. Research on impact of environmental regulation on the technological innovation of China’s paper industry. J. Beijing For. Univ. (Soc. Sci.) 2009, 8, 111–114. [Google Scholar]
- Liu, X. Comparative Research on Environment Regulation of Pulp and Paper Industry between China and USA. Master’s Thesis, Nanjing Forestry University, Nanjing, China, 2014. [Google Scholar]
- Hu, Y. Environmental Regulation, Technological Innovation and Upgrading of Industries: An Empirical Re-Examination on “Porter Hypothesis”. Master’s Thesis, Shandong University, Jinan, China, 2017. [Google Scholar]
- Li, Y.; Zou, Z.; Li, C. Firm size, market structure evolution and technological progress of China’s paper industry. Sci. Technol. Manag. Res. 2011, 15, 112–115. [Google Scholar]
- Zhang, J.; Gong, E.; Sun, Y. How will environmental regulation effect TFP of manufacturing in Yangtze River Economic Belt? Stud. Sci. Sci. 2019, 37, 1558–1669. [Google Scholar]
- Jin, Y. New idea and realization pathways of high-quality green development. J. Hebei Univ. Econ. Bus. 2018, 39, 22–30. [Google Scholar]
- Li, G.; Dong, M.J.; Sheng, J.T. The impact of intensified environmental regulations policies on China’s economic growth—An assessment based on CGE model. China Ind. Econ. 2012, 11, 5–17. [Google Scholar] [CrossRef]
- Jiang, F.X.; Wang, Z.J.; Bai, J.H. The dual effect of environmental regulations’ impact on innovation an empirical study based on dynamic panel data of Jiangsu manufacturing. China Ind. Econ. 2013, 7, 44–55. [Google Scholar]
- Liao, M.Y.; Wang, Y.L.; He, Y.Z. Analysis of Total Factor Energy Efficiency in Chinese Manufacturing Industry—A Dual Perspective from Region and Sub-sector. J. Beijing Inst. Technol. (Soc. Sci. Ed.) 2019, 21, 48–58. [Google Scholar]
- Ren, M.; Wang, X.; Liu, L.; Sun, F.; Zhang, W. Spatio-temporal Trends and Influencing Factors of Environmental Regulation in China’s Coastal Urban Agglomerations. Sci. Geogr. Sin. 2019, 39, 1119–1128. [Google Scholar]
- Tone, K. A slacks-based measure of super-efficiency in data envelopment analysis. Eur. J. Oper. Res. 2002, 143, 32–41. [Google Scholar] [CrossRef] [Green Version]
- Zhong, J.T.; Mi, W.B.; Hou, J.W.; Ma, Z.N.; Wu, X.Y. Regional Differences and Spatial Pattern since Reform and Opening Up in Ningxia—Based on the Evolutionary Character and the Coupling Relationship of Gravity Center of Population, Economic and Grain. Econ. Geogr. 2014, 34, 14–20. [Google Scholar]
- Wang, G.; Li, S.J.; Ma, Q.F. Spatial equilibrium and pattern evolution of ecological civilization construction efficiency in China. Acta Geogr. Sin. 2018, 73, 2198–2209. [Google Scholar]
- Liao, Z.; Wang, C. Regional inequality of R&D capital in China’s public research and development institutions: 2002–2015. J. Financ. Econ. Theory 2018, 3, 54–65. [Google Scholar]
- Qian, L.; Wang, W.; Xiao, R. Research on the regional disparities of China’s industrial enterprises green innovation efficiency from the perspective of shared inputs. China Popul. Resour. Environ. 2018, 28, 27–39. [Google Scholar]
- Liu, Z.; Song, D.; Gong, Y.; Luo, C. Analysis of industrial differences and its influencing factors of green technological innovation capability of Chinese manufacturing industry. J. Intell. 2017, 36, 194–200. [Google Scholar]
- Wu, C.; Huang, L.; Wen, C. Research on the Technical Innovation Efficiency and Its Influence Factors of the Yangtze Economic Belt. China Soft Sci. 2017, 5, 160–170. [Google Scholar]
- Xiao, W.; Lin, G.B. Government support, research and development management, and technological innovation efficiency: An empirical analysis based on China’s industrial industry. Manag. World 2014, 4, 71–80. [Google Scholar]
- Yin, Q.; Wu, X. Research on the Evaluation and Cause Identification of Industrial Environmental Energy Efficiency Differences in the Yangtze River Economic Belt under the Constraint of Environment. Sci. Technol. Manag. Res. 2019, 6, 240–247. [Google Scholar]
Figure 1.
Analysis framework of green development efficiency of the paper industry.

Figure 2.
Evolution trend of green development efficiency of the paper industry in Yangtze River Economic Belt.
Figure 2.
Evolution trend of green development efficiency of the paper industry in Yangtze River Economic Belt.

Figure 3.
Spatial evolution trend of green development efficiency center of the paper industry in Yangtze River Economic Belt.
Figure 3.
Spatial evolution trend of green development efficiency center of the paper industry in Yangtze River Economic Belt.

Figure 4.
Box diagram (a) and kernel density diagram (b) of green development efficiency of the paper industry.
Figure 4.
Box diagram (a) and kernel density diagram (b) of green development efficiency of the paper industry.


Table 1.
Regional division of the upper, middle, and lower reaches of Yangtze River Economic Belt.
| Region | Provinces |
|---|---|
| Upstream area | Chongqing, Sichuan, Guizhou, Yunnan |
| Middle reaches | Jiangxi, Hubei, Hunan |
| Downstream area | Shanghai, Jiangsu, Zhejiang, Anhui |
Table 2.
Measurement index of green development efficiency of the paper industry.
| Index | Variable | Variable Description | |
|---|---|---|---|
| Input index | Labor | Average number of people at the end of the year (person) | |
| Capital | Net value of fixed assets (10,000 Yuan) | ||
| Energy | Total energy consumption of paper industry (10,000 tons of standard coal) | ||
| Output index | desirable output | Economic and social | Industrial sales value (100 million Yuan) |
| undesirable output | Environmental pollutants | Wastewater discharge of Paper industry (10,000 t) | |
Table 3.
Source and contribution rate of the spatial difference of the paper industry in Yangtze River Economic Belt.
Table 3.
Source and contribution rate of the spatial difference of the paper industry in Yangtze River Economic Belt.
| Overall | Upstream | Midstream | Downstream | Intra-Regional | Inter-Regional | Contribution Rate (%) | ||
|---|---|---|---|---|---|---|---|---|
| Intra-Regional | Inter-Regional | |||||||
| 2001 | 0.1464 | 0.0422 | 0.0292 | 0.0041 | 0.0756 | 0.0708 | 51.62 | 48.38 |
| 2002 | 0.1453 | 0.0361 | 0.0339 | 0.0033 | 0.0733 | 0.0720 | 50.42 | 49.58 |
| 2003 | 0.1547 | 0.0380 | 0.0406 | 0.0043 | 0.0828 | 0.0719 | 53.51 | 46.49 |
| 2004 | 0.1451 | 0.0396 | 0.0006 | 0.0444 | 0.0846 | 0.0605 | 58.29 | 41.71 |
| 2005 | 0.1158 | 0.0306 | 0.0026 | 0.0419 | 0.0751 | 0.0407 | 64.85 | 35.15 |
| 2006 | 0.1215 | 0.0292 | 0.0008 | 0.0489 | 0.0789 | 0.0427 | 64.89 | 35.11 |
| 2007 | 0.0968 | 0.0265 | 0.0003 | 0.0364 | 0.0631 | 0.0337 | 65.15 | 34.85 |
| 2008 | 0.1002 | 0.0234 | 0.0170 | 0.0343 | 0.0747 | 0.0255 | 74.58 | 25.42 |
| 2009 | 0.0870 | 0.0160 | 0.0005 | 0.0378 | 0.0543 | 0.0327 | 62.40 | 37.60 |
| 2010 | 0.0810 | 0.0172 | 0.0046 | 0.0326 | 0.0545 | 0.0264 | 67.34 | 32.66 |
| 2011 | 0.0792 | 0.0087 | 0.0068 | 0.0371 | 0.0526 | 0.0266 | 66.37 | 33.63 |
| 2012 | 0.0869 | 0.0119 | 0.0111 | 0.0220 | 0.0451 | 0.0418 | 51.86 | 48.14 |
| 2013 | 0.0730 | 0.0154 | 0.0062 | 0.0332 | 0.0548 | 0.0182 | 75.03 | 24.97 |
| 2014 | 0.0722 | 0.0104 | 0.0066 | 0.0328 | 0.0498 | 0.0224 | 69.00 | 31.00 |
| 2015 | 0.0631 | 0.0098 | 0.0084 | 0.0260 | 0.0443 | 0.0188 | 70.15 | 29.85 |
| 2016 | 0.0460 | 0.0024 | 0.0106 | 0.0211 | 0.0341 | 0.0118 | 74.24 | 25.76 |
| Mean | 0.1009 | 0.0223 | 0.0112 | 0.0288 | 0.0624 | 0.0385 | 63.73 | 36.27 |
Table 4.
Regression results of influencing factors of green development efficiency of the paper industry in Yangtze River Economic Belt.
Table 4.
Regression results of influencing factors of green development efficiency of the paper industry in Yangtze River Economic Belt.
| Overall | Upstream Area | Midstream Area | Downstream Area | |
|---|---|---|---|---|
| Enterprise scale | 0.0805 *** (10.0463) | 0.1008 ** (2.0152) | −0.0358 (−0.6062) | 0.0157 (0.9105) |
| Environmental regulation | −0.4252 *** (−8.0149) | −0.3665 (−1.3831) | −1.1722 ** (−2.4928) | 0.0292 (0.2037) |
| Science and technology input | 2.5652 *** (11.0730) | 12.7396 ** (0.0233) | 0.1762 (0.0274) | 3.0655 *** (4.9843) |
| Foreign capital Intensity | −0.0235 *** (−3.2106) | −0.0206 (−0.6163) | 0.1103 * (1.8155) | −0.0019 (−0.1035) |
| Industrial structure | 1.2978 *** (23.0197) | 1.3543 ** (2.5035) | 1.6027 ** (2.4254) | 0.9918 *** (6.9583) |
| Constant | 0.2281 *** (4.3923) | −0.1061 (−0.3156) | −0.5213 (−1.2534) | 0.4188 ** (3.0502) |
Note: The values in brackets are Z statistics; ***, **, and * indicate the significance at 1%, 5%, and 10% levels, respectively.
Publisher’s Note: MDPI stays neutral with regard to jurisdictional claims in published maps and institutional affiliations. |
© 2021 by the authors. Licensee MDPI, Basel, Switzerland. This article is an open access article distributed under the terms and conditions of the Creative Commons Attribution (CC BY) license (https://creativecommons.org/licenses/by/4.0/).
Share and Cite
MDPI and ACS Style
Xiang, Y.; Wang, S.; Zhang, Y.; Dai, Z. Green Development Efficiency Measurement and Influencing Factors of the Paper Industry in the Yangtze River Economic Belt. Water 2021, 13, 1286. https://doi.org/10.3390/w13091286
AMA Style
Xiang Y, Wang S, Zhang Y, Dai Z. Green Development Efficiency Measurement and Influencing Factors of the Paper Industry in the Yangtze River Economic Belt. Water. 2021; 13(9):1286. https://doi.org/10.3390/w13091286
Chicago/Turabian StyleXiang, Yunbo, Shengyun Wang, Yong Zhang, and Zhijun Dai. 2021. "Green Development Efficiency Measurement and Influencing Factors of the Paper Industry in the Yangtze River Economic Belt" Water 13, no. 9: 1286. https://doi.org/10.3390/w13091286
Note that from the first issue of 2016, this journal uses article numbers instead of page numbers. See further details here.