
Food Web Responses to a Cyanobacterial Bloom in a Freshwater Eutrophic Lake


College of Fisheries, Huazhong Agricultural University, Wuhan 430070, China
*
Author to whom correspondence should be addressed.
Water 2021, 13(9), 1296; https://doi.org/10.3390/w13091296
Submission received: 7 February 2021
/
Revised: 21 April 2021
/
Accepted: 28 April 2021
/
Published: 5 May 2021
(This article belongs to the Special Issue Algae: Indices of Water and Ecological Quality)
Abstract
:The microbial food web is an important part in aquatic ecosystem, but studies on the microbial food web in freshwater ecosystem, especially in freshwater eutrophic lakes, still need further investigation. In the present study, using eutrophic Lake Nanhu as model, the community changes of phytoplankton, zooplankton, and bacteria between the bloom and non-bloom period were analyzed, and microzooplankton grazing experiments were also conducted to measure the grazing pressure and selectivity of microzooplankton on phytoplankton community. Phytoplankton community in Lake Nanhu was mainly dominated by Cyanophyta (49.44%), especially Anabaena circinalis and Microcystis flos-aquae, during bloom period. Rotifers were the main components of zooplankton in Lake Nanhu (44.15%), Brachionus calyciflorus and Moina macrocopa were the most dominant zooplankton in the non-bloom and bloom period, respectively. Bacteroidetes showed significantly higher mean proportion in bloom period than that in non-bloom period (p < 0.001). The growth rates of phytoplankton ranged from −1.00 d−1 to 1.29 d−1, while grazing rates of microzooplankton ranged from −1.15 d−1 to 1.05 d−1. Results indicated that microzooplankton could respond quickly to the increase of phytoplankton during bloom period. Meanwhile, microzooplankton showed grazing preference on Cyanophyta and Cryptophyta during bloom period and non-bloom period, respectively. The microzooplankton grazing selectivity during bloom period might depend on phytoplankton community composition.
1. Introduction
Microbial loop plays an important role in the mater circulation and energy transfer of water ecosystem, which is an effective supplement to the classic food chain [1]. The concept of microbial food web is a further extension of the microbial food loop [2]. The main components of the microbial food web include heterotrophic bacteria, phytoplankton, microzooplankton, and planktonic viruses. According to previous studies, the microbial food web was related to the classic food chain in multiple ways instead of a single “loop” [3]. At present, there are abundant researches on the structure of microbial food webs in marine ecosystems [4,5,6]. In the typical marine microbial food web, the abundance ratio of heterotrophic flagellates, bacteria and viruses is 1:103:104, and heterotrophic nanoflagellates play an important role in grazing picoplankton [7]. However, studies on the microbial food web in freshwater ecosystem, especially in freshwater eutrophic lakes, still need further investigation.
Microplankton is a general term for a kind of heterotrophic and polyculture zooplankton with a body length of less than 200 μm [8], which can serve as an important link between microbial food web and classic food web [1,9]. Previous studies have shown that microzooplankton played an important role in the grazing on phytoplankton [10,11,12]. Previous study has reported that microzooplankton could consume 49–77% of the phytoplankton primary productivity in the global waters, with the lowest percentage found in the Westerlies Southern and the highest in the Coastal Indian [12]. Therefore, microzooplankton plays a momentous role in carbon circulation and energy transfer in aquatic ecosystem. The grazing of microzooplankton can control the size of phytoplankton, and influence the reuse of nutrients and the growth of certain algae [13,14,15]. Nevertheless, the influence of microzooplankton grazing on bloom occurrence in freshwater eutrophic lakes has still not been clearly elucidates.
In aquatic ecosystem, bacteria are an important part of the microbial food web, which are mainly responsible for the mineralization and recycling of organic matter [16,17,18]. Bacteria respond rapidly to environmental changes, so the change of community structure can be used to indicate the water ecological environment [19,20]. Bacterial communities in water are affected by complex biological and abiotic processes, such as dissolved oxygen, pH, temperature, water nutritional status, and plankton interactions [21,22]. It has been found that the interaction between phytoplankton and bacteria could affect the dynamics of bacterial communities [23,24]. Bacteria can make use of secretions released by phytoplankton, as well as the debris of algal cells [23,24,25]. Phytoplankton also adversely affect bacterial communities through nutrient competition and antibiotic release [26]. In addition, previous study found that microzooplankton grazing in shallow eutrophic lakes eliminated 90–99% of the potential single-celled cyanobacteria production and 46% of the potential heterotrophic bacteria production [27]. Planktonic virus can cause the lysis of the bacteria, transforming particulate organic matter into dissolved organic matter utilized by bacteria. At the same time, as the hosts of viruses, bacteria have a great impact on the abundance of planktonic viruses [28]. Moreover, some studies have shown that some bacteria play an important role in the occurrence of eutrophic lake blooms [29,30,31]. Therefore, further studies on the changes of bacterial community structure between algal bloom and non-bloom period could help people to clarify the functional role of microbial food web in freshwater eutrophic lakes.
Lake Nanhu, located in the middle reaches of the Yangtze river, is a typical eutrophic lake with high phosphorus and chemical oxygen demand (COD) in Wuhan City, China. Due to the discharge of a large amount of domestic sewage and the introduction of aquaculture feed, the water of Lake Nanhu has long-term eutrophication, and algal blooms usually occur more than three times from May to September every year. Using Lake Nanhu as the study object, this study is intended to explore the following two questions: (1) changes in the community of phytoplankton, zooplankton, and bacteria between non-bloom and bloom period in eutrophic shallow lake; (2) variations in the grazing of phytoplankton by microzooplankton between non-bloom and bloom period. This study will help us to understand the role of microbial loop during algal blooms occurred in eutrophic lakes, and provide theoretical basis for improving water quality of eutrophic lakes according to biomanipulation and sustainable development.
2. Material and Methods
2.1. Field Observations and Sample Treatments
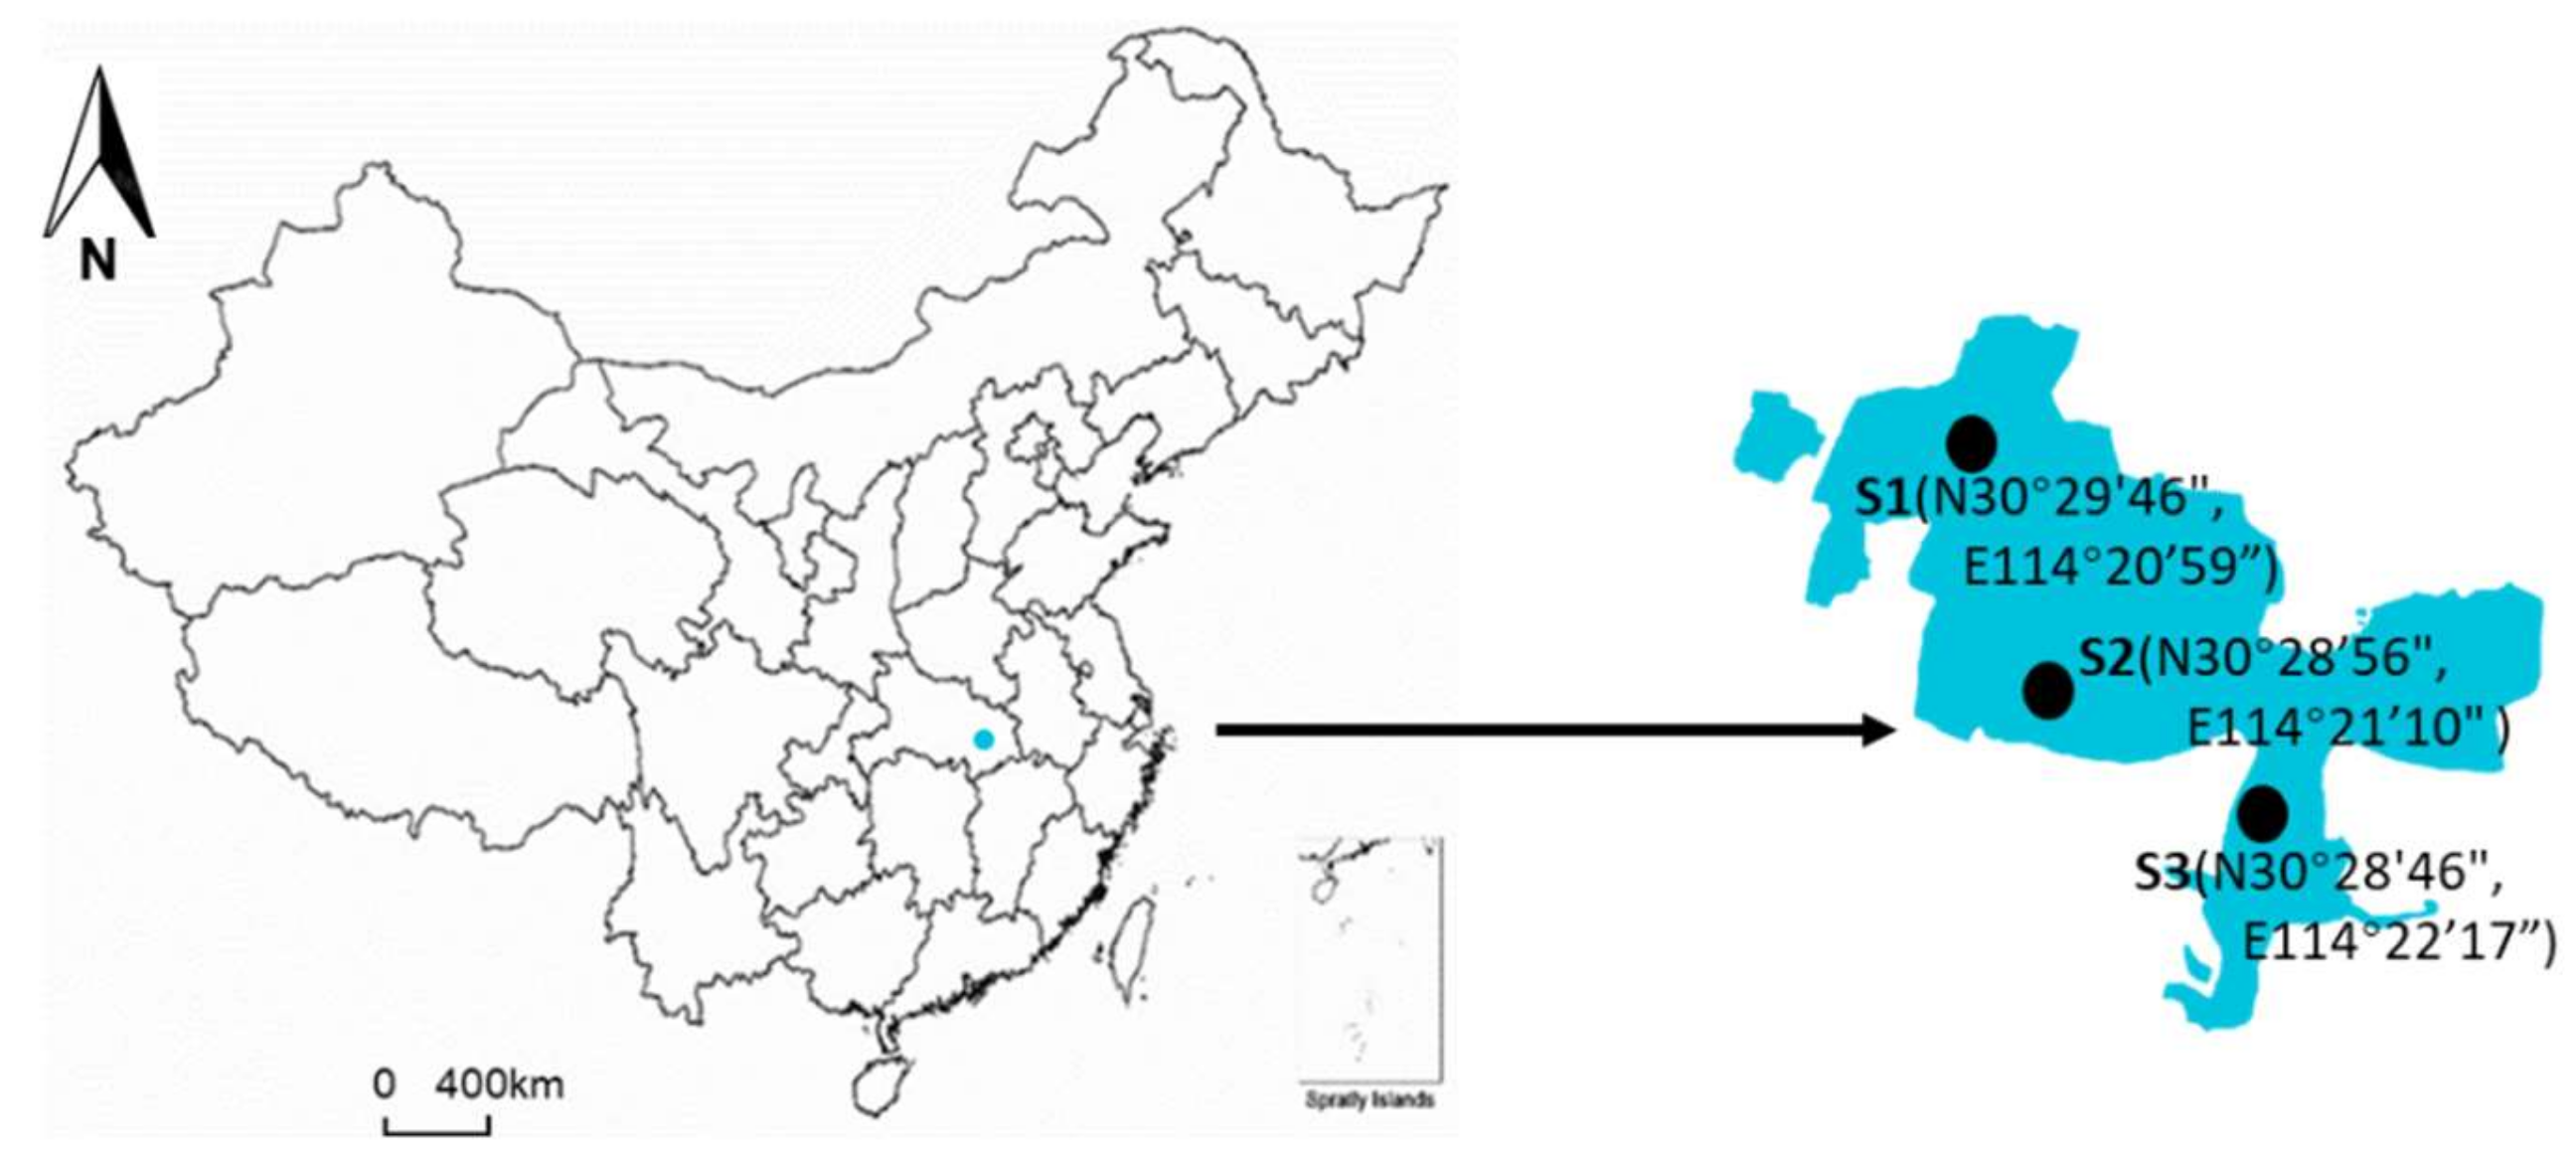
Lake Nanhu is located in Wuhan, Hubei Province, on the middle and lower reaches of the Yangtze River in China. It covers an area of 5.50 km2, with a maximum depth of 3.2 m and an average depth of 1.6 m. There are generally two views on the definition of algal bloom: (1) the cell density of algae is 0.5 × 10⁶~15 × 106 cells/L [32]; (2) some algae multiply and gather in large numbers, forming algae floating on the water surface [33]. Taken together, we define algal blooms in the Lake Nanhu as algal cell density of 15 × 106 cells/L and floating algae on the water surface. Therefore, the bloom period of Lake Nanhu is from May to September each year. From October 2016 to September 2017, field surveys and sample collections were conducted at three different sites in Lake Nanhu every month (Figure 1). Physical parameters including temperature (T), pH and dissolved oxygen (DO) were measured in situ using a multi parameter water quality analyzer (HQ40d, HACH). For the measurement of other chemical parameters (NH4+, NO3−, NO2−, PO43−, total nitrogen (TN) and total phosphorus (TP)), 1 L surface water was collected with 1 L sampler, and was then brought back to the laboratory for further determination. Samples for the identification and enumeration of phytoplankton and zooplankton were collected using a 1 L sampler every month and fixed with Lugol’s solution (2% final concentration). In addition, surface water samples for bacteria analysis were also collected during non-bloom (March and November) and bloom (May) period. Surface water for dilution experiments were collected by a plastic bucket and screened through a 200 μm mesh net to exclude larger grazers every two months. All the water samples were returned to the laboratory within 1 h.
2.2. Analysis of Plankton Community Structure
Under an optical microscope (Nikon Eclipse E100, Kobe, Japan), phytoplankton samples were identified and counted using a 0.1 mL counting chamber, and mesozooplankton and microzooplankton samples were identified and counted using a 1 mL and 0.1 mL counting chamber, respectively. The identification of phytoplankton followed the references of Hu and Wei [34]. Zooplankton was identified according to Kofoid and Campbell [35], Kofoid and Campbell [36] and Lee et al. [37]. Phytoplankton and zooplankton were identified to genus or species levels.
2.3. Analysis of Bacterial Community Structure
Water samples for bacteria community analysis were firstly filtered through a 20 µm membrane to remove impurities (Millipore, Carrigtwohill, Co, Cork, Ireland) and then filtered onto 0.22 µm polycarbonate filters (Millipore, Carrigtwohill, Co, Cork, Ireland). The 0.22 µm filters containing bacteria were placed into 2 mL sterile tubes and immediately frozen in liquid nitrogen, and transferred to a −80 °C refrigerator for storage until further procedures.
Bacterial DNA was extracted from all water samples using the E.Z.N.A.fi soil DNA Kit (Omega Bio-tek, Norcross, GA, USA) according to the manufacturer’s protocols. The final DNA concentration and purification were determined using a NanoDrop 2000 UV–vis spectrophotometer (Thermo Scientific, Wilmington, NC, USA), and the DNA quality was checked via 1% agarose gel electrophoresis. The V3–V4 hypervariable regions of the bacteria 16S rRNA gene were amplified with primers 338F (50-ACTCCTACGGGAGGCAGCAG-30) and 806R (50-GGACTACHVGGGTWTCTAAT-30) using a thermocycler PCR system (GeneAmp 9700, ABI, Foster City, CA, USA) [38]. The PCR reactions were conducted using the following program: 3 min of denaturation at 95 °C; 27 cycles of 30 s at 95 °C, 30 s for annealing at 55 °C, and 45 s for elongation at 72 °C; and a final extension at 72 °C for 10 min. PCR reactions were performed in triplicate in a 20 µL mixture containing 4 µL of 5× FastPfu Buffer 2 µL of 2.5 mM dNTPs, 0.8 µL of each primer (5 µM), 0.4 µL of FastPfu Polymerase, and 10 ng of template DNA. The PCR products were extracted from a 2% agarose gel, further purified using the AxyPrep DNA Gel Extraction Kit (Axygen Biosciences, Union City, CA, USA), and quantified using QuantiFluor™-ST (Promega, Madison, WI, USA) according to the manufacturer’s protocol. According to the standard protocols by Majorbio Bio-Pharm Technology Co. Ltd. (Shanghai, China), purified amplicons were mixed isometric and paired end sequenced (2 × 300) on Illumina MiSeq platform (Illumina, San Diego, CA, USA) [31]. The raw reads were deposited into the NCBI Sequence Read Archive (SRA) database (Accession Number: SRR12968935~SRR12968943 (9 objects)).
Raw reads were demultiplexed, quality filtered by Trimmomatic, and merged by FLASH with the following criteria: (i) The reads were truncated at any site receiving an average quality score of <20 over a 50 bp sliding window. (ii) Primers were exactly matched allowing two nucleotide mismatches, and reads containing ambiguous bases were removed. (iii) Sequences with overlap longer than 10 bp were merged according to their overlap sequence. Operational taxonomic units (OTUs) were clustered with a 97% similarity cutoff using UPARSE (version 7.1) and chimeric sequences were identified and removed using UCHIME. The taxonomy of each 16S rRNA gene sequence was analyzed using the RDP Classifier algorithm against the Silva (SSU123) 16S rRNA database using a confidence threshold of 70%. Nonparametric indicators (the Chao 1 estimator (Chao1), the Shannon estimator (Shannon), the Ace estimator (Ace) and the Good’s coverage (coverage)) were used to evaluate the relationships between bacterial community diversity characteristics and community coverage in Lake Nanhu. The prerequisites were fulfilled for a parametric test and One-way ANOVA was used to test for significant differences in bacteria structure among different months.
2.4. Microzooplankton Grazing Experiments
Microzooplankton grazing was studied by dilution experiments every two months according to Landry [39]. Before the experiment, the culture bottle (1.2 L, Whatman, Maidstone, UK) was soaked with 10% hydrochloric acid for more than 10 h, and then washed with the collected water. Subsequently, water samples were filtered with 0.22 μm (Millipore, Carrigtwohill, Co, Cork, Ireland) filter membrane to obtain particle-free water. Then the particle-free water was mixed with the water samples in four proportions of 0:1, 1:3, 1:1, 3:1, and divided into culture bottles with 3 parallel samples for each proportion. Taking care to fill each culture bottle with water and avoid air bubbles. All bottles were incubated at ambient light levels for 24 h at the surface (~0.5 m) in an experimental tank (~10 m diameter; ~2 m deep) cooled by running natural water from Lake Nanhu. To prevent settlement of phytoplankton, the bottles were moved up and down slowly every 8 h. Before and after culture, 3 × 300 mL water samples were taken from each proportion and filtered with 20 μm, 5 μm (Millipore, Carrigtwohill, Co, Cork, Ireland) and GF/F (Whatman, 0.7 µm pore size, 47 mm diameter) filtration membrane, respectively, to obtain three kinds of phytoplankton with different particle sizes (20–200 μm, 5–20 μm, and <5 μm). The filter membranes were stored in a refrigerator at −20 °C, and the concentration of chlorophyll a was measured by spectrophotometric method to obtain the biomass of phytoplankton [40]. In addition, 3 × 300 mL water samples were taken from each proportion before and after culture and filtered through 0.7 μm Whatman GF/F filters to analyze phytoplankton pigments.
2.5. HPLC Pigment Analysis
Filters containing phytoplankton from grazing experiment were stored at −80 °C refrigerator before preforming pigment extraction. The phytoplankton-containing filters were cut into small pieces under dim light and transferred to a 15 mL centrifuge tube containing 10 mL 90% acetone (HPLC grade, J.T.Baker, Phillipsburg, NJ, USA). Wrapping the centrifuge tubes with aluminum foil and treating it with sonicated for 5 min. The samples were extracted overnight at 4 °C, and centrifuged at 4000 rpm (2325× g) for 20 min at 4 °C after extraction. To remove the filter and cell debris in the extract, the supernatants were filtered through Millipore syringe filters (Hydrophobic, 0.2 μm pore size). Aliquots of the extract were analyzed by HPLC (HP Agilent 1100 Series) for pigments within 48 h. An Agilent Eclipse XDB-C18 reversed phase column with a flow rate of 1.0 mL/min was used according to the method of Wong and Wong [41]. Phytoplankton pigments were identified by comparing their retention times and online diode array absorption spectra with those of commercial authentic standards (DHI, Institute of Water and Environment, Århus, Denmark). Comparatively identified photosynthetic pigments including fucoxanthin, peridinin, 19′-hex-fucoxanthin, alloxanthin and chlorophyll b, and chlorophyll a. To ensure that all the pigments were retained, the HPLC column was run for 30 min. According to the peak areas in the chromatogram and the equation of the standard curve, the concentrations of each pigment were calculated.
2.6. Date Analysis
According to the experimental scheme proposed by Landry [39], apparent growth rate (AGR) of phytoplankton varies with dilution ratio (D):
AGR = k − gD = (1/t) ln (Pt/P0)
In the formula, “k” is phytoplankton growth rate, “g” is microzooplankton grazing rate, “Pt” is the density of phytoplankton at time “t”, and “P0” is the density of phytoplankton at the beginning of culture. Linear regression analysis was performed on the apparent growth rate and dilution factor of a series of phytoplankton, and the absolute values of the intercept and slope were corresponding to k (d−1) and g (d−1), respectively.
The grazing pressure of microzooplankton on standing stocks (Pi) and primary production (Pp) of phytoplankton can be calculated as follows Verity et al. [42]:
The grazing preference index (αi) is used to calculate grazing selectivity of microzooplankton to different pigment groups of phytoplankton [43]. The formula is as follows:
ri and ni are respectively expressed as the proportion of the i-th pigment group in food and environment, and m is the number of pigment groups. When αi > 1/m, it means that microzooplankton has grazing preference for this group of phytoplankton; when αi < 1/m, it means that microzooplankton has no grazing preference for this group of phytoplankton.
In this experiment, Excel 2019 and SPSS 19.0 software were used for data analysis. Significance levels of differences in phytoplankton growth rates, microzooplankton grazing rates, and the grazing pressure of microzooplankton on phytoplankton standing stocks and primary productivity were measured using one-way ANOVA analysis. The correlation between microplankton grazing rate and phytoplankton growth rate was tested by Spearman rank correlation. Downtrend correspondence analysis (DCA) was performed on the plankton data using Canoco 5.0, and the subsequent analysis methods of plankton and environmental factors were determined according to the sequencing axis length of the analysis results. In this study, the gradient length of the sequencing axis was less than 3.0, so redundancy analysis (RDA) was performed on environmental factors to identify the main environmental factors affecting phytoplankton community [44,45,46].
3. Results
3.1. Environmental Conditions
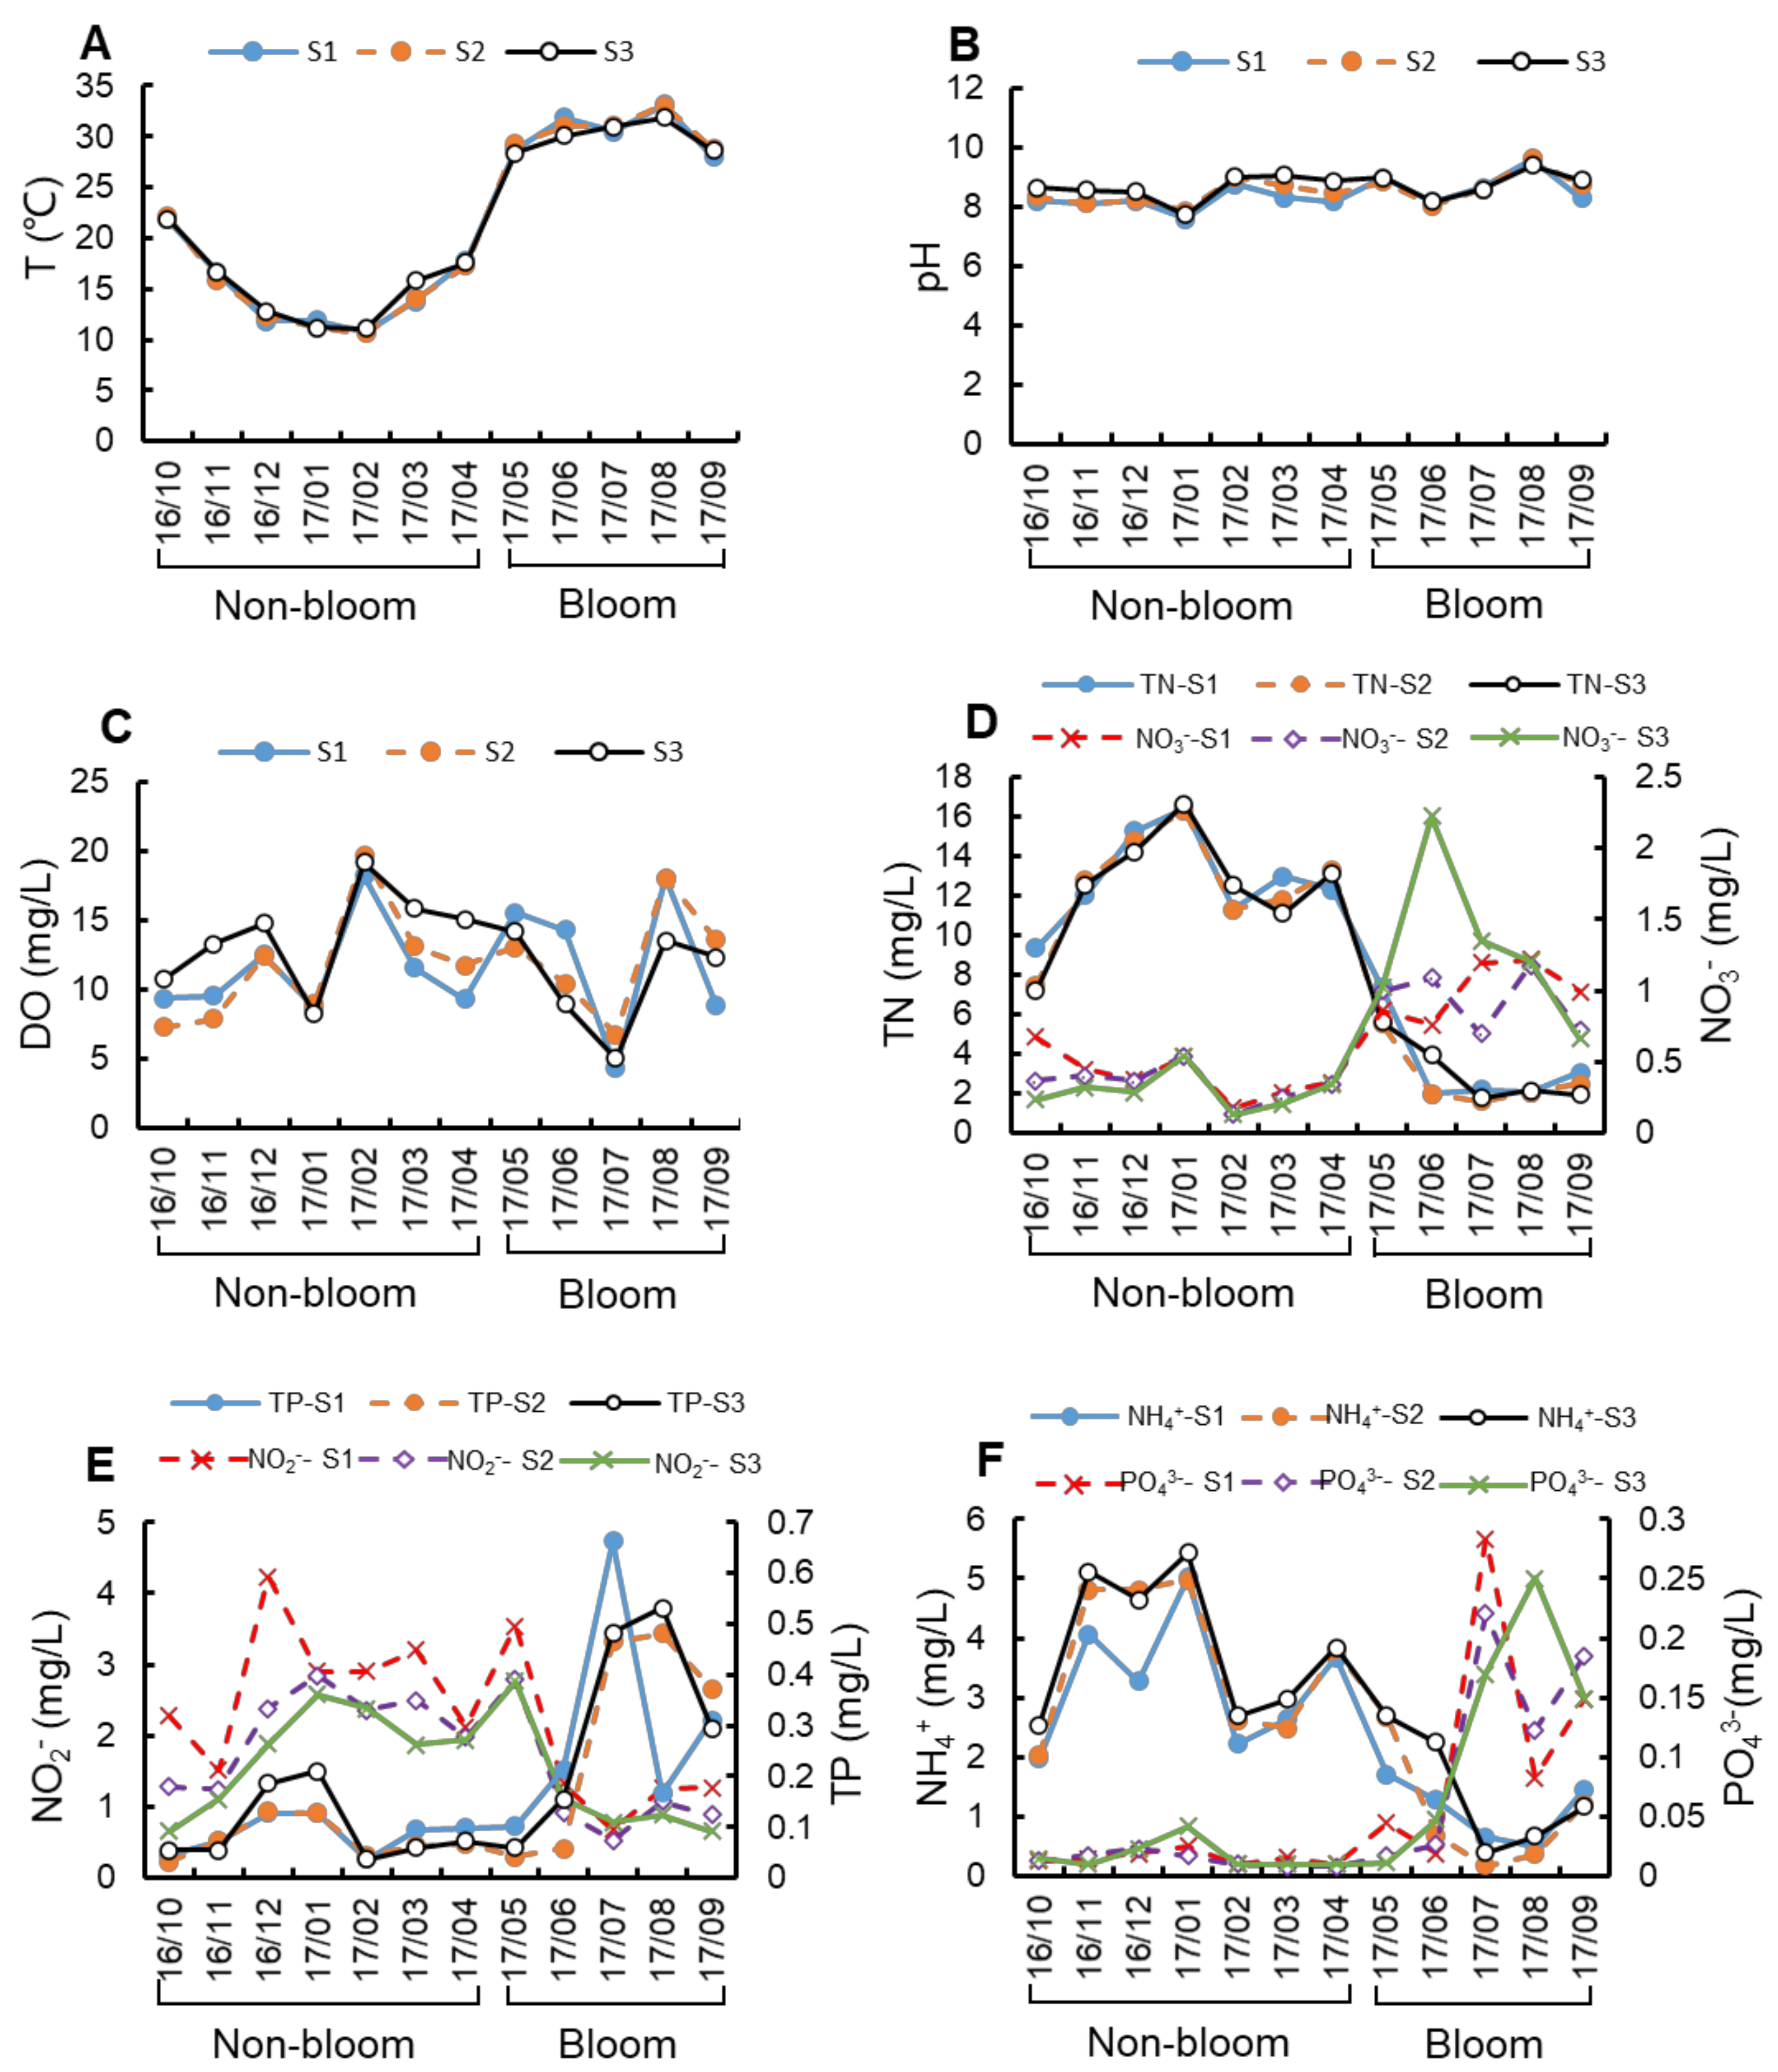
As shown in Figure 2, the surface water temperature (T) was 10.83 ± 0.20 °C in February (non-bloom period) and 32.73 ± 0.59 °C in August (bloom period), with average at 21.14 ± 8.16 °C around the whole study period (Figure 2A). The pH value is relatively stable around 8.5, reaching the highest and lowest values in bloom period (9.61) and non-bloom period (7.73), respectively (Figure 2B). The annual average value of dissolved oxygen (DO) was 12.04 ± 3.87 mg/L, and the lowest value was 5.34 ± 1.03 mg/L in July (bloom period) (Figure 2C). The concentration range of total nitrogen (TN) was 1.86–16.45 mg/L. The concentration of TN, nitrite (NO2−) and ammonia (NH4+) in non-bloom period is higher than that in bloom period, and the nitrate (NO3−) is opposite (Figure 2D–F). Moreover, the concentration of TN is significantly positively related to the concentration of NH4+ (r = 0.93). Additionally, the concentration range of total phosphorus (TN) was 0.17–0.54 mg/L. The concentrations of total phosphorus (TP) and phosphate (PO43−) were higher in bloom period than in non-bloom period (Figure 2D–F).
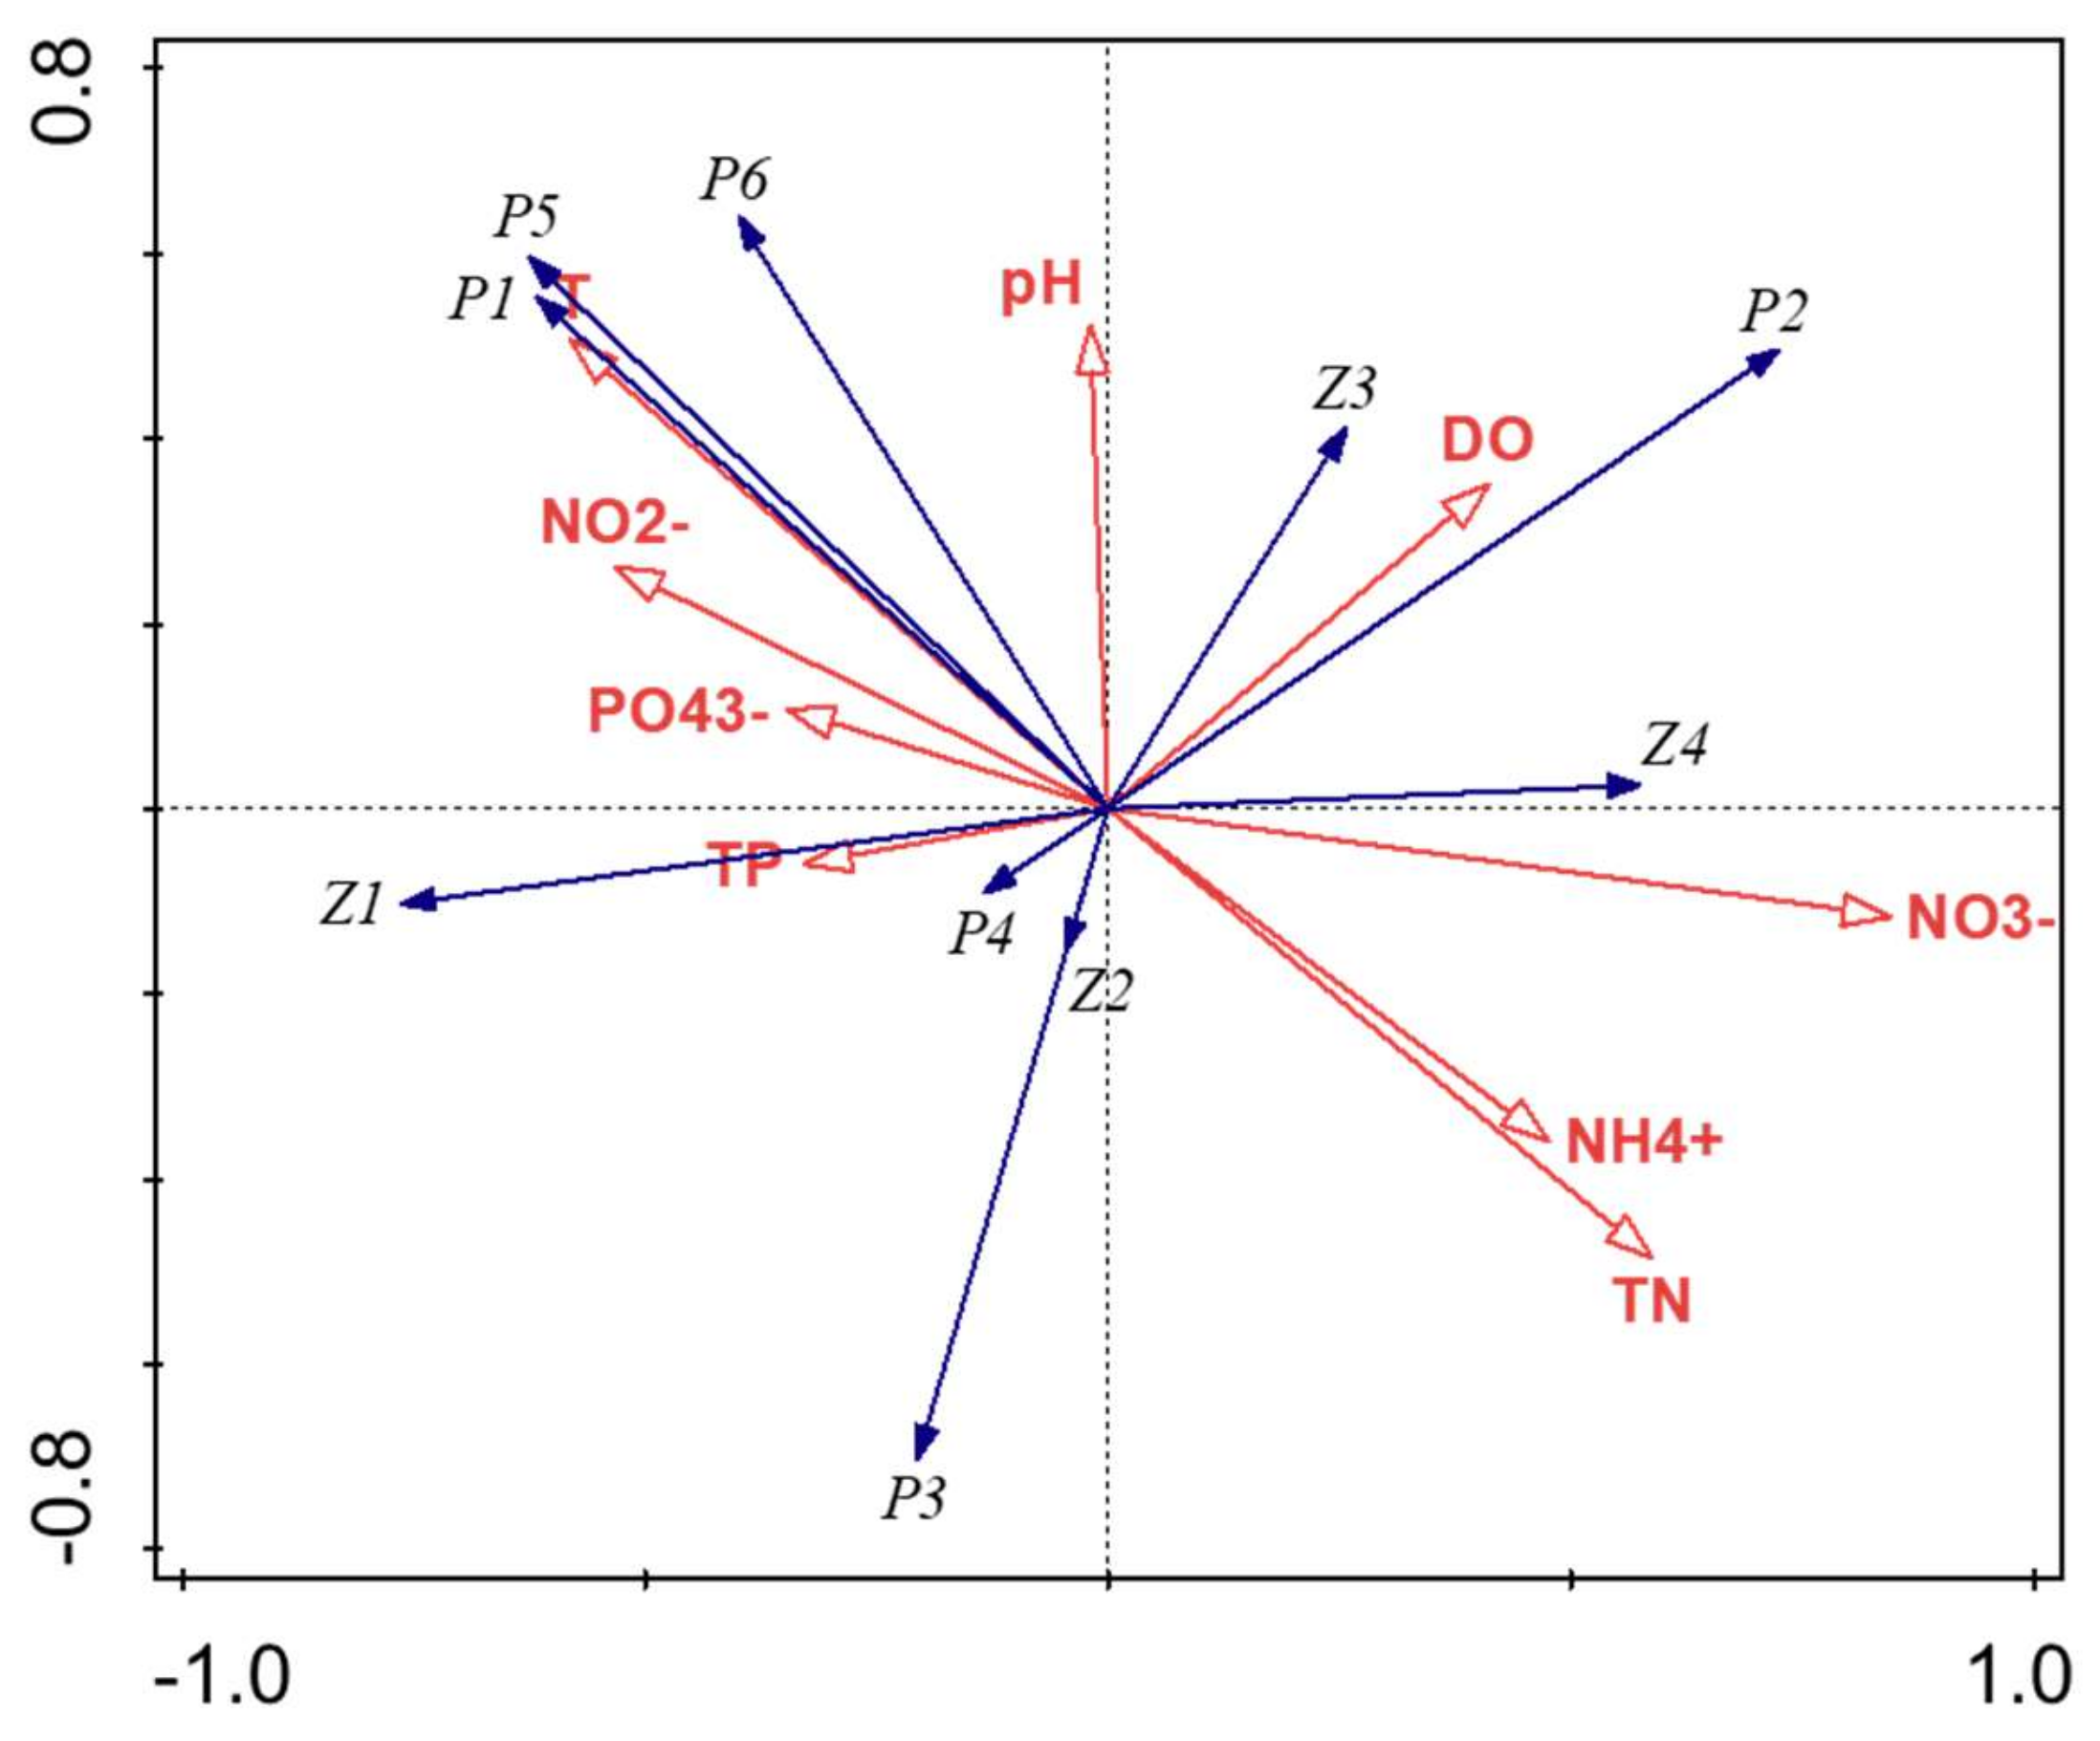
RDA analysis showed that the eigenvalues of axis I and axis II were 0.367 and 0.302, respectively, and the accumulative variation of the two axes to the species community and environmental indicators reached 86.4%. As shown in Figure 3, TN, temperature and NO3− were the main factors affecting the plankton abundance in Lake Nanhu. The abundance of Cyanophyta and Euglenophyta were positively correlated with T, NO2−, and pH, and negatively correlated with NH4+ and TN. The abundance of Cryptophyta, Bacillariophyta, and copepod (Mesocyclops leuckarti) were positively correlated with TP and negatively correlated with pH and DO, while Pyrrophyta and rotifer were positively opposite to the above three. The abundance of cladoceran was positively correlated with TP and PO43−, while the abundance of protozoan was positively correlated with NO3−.
3.2. Variation in Plankton Community Composition
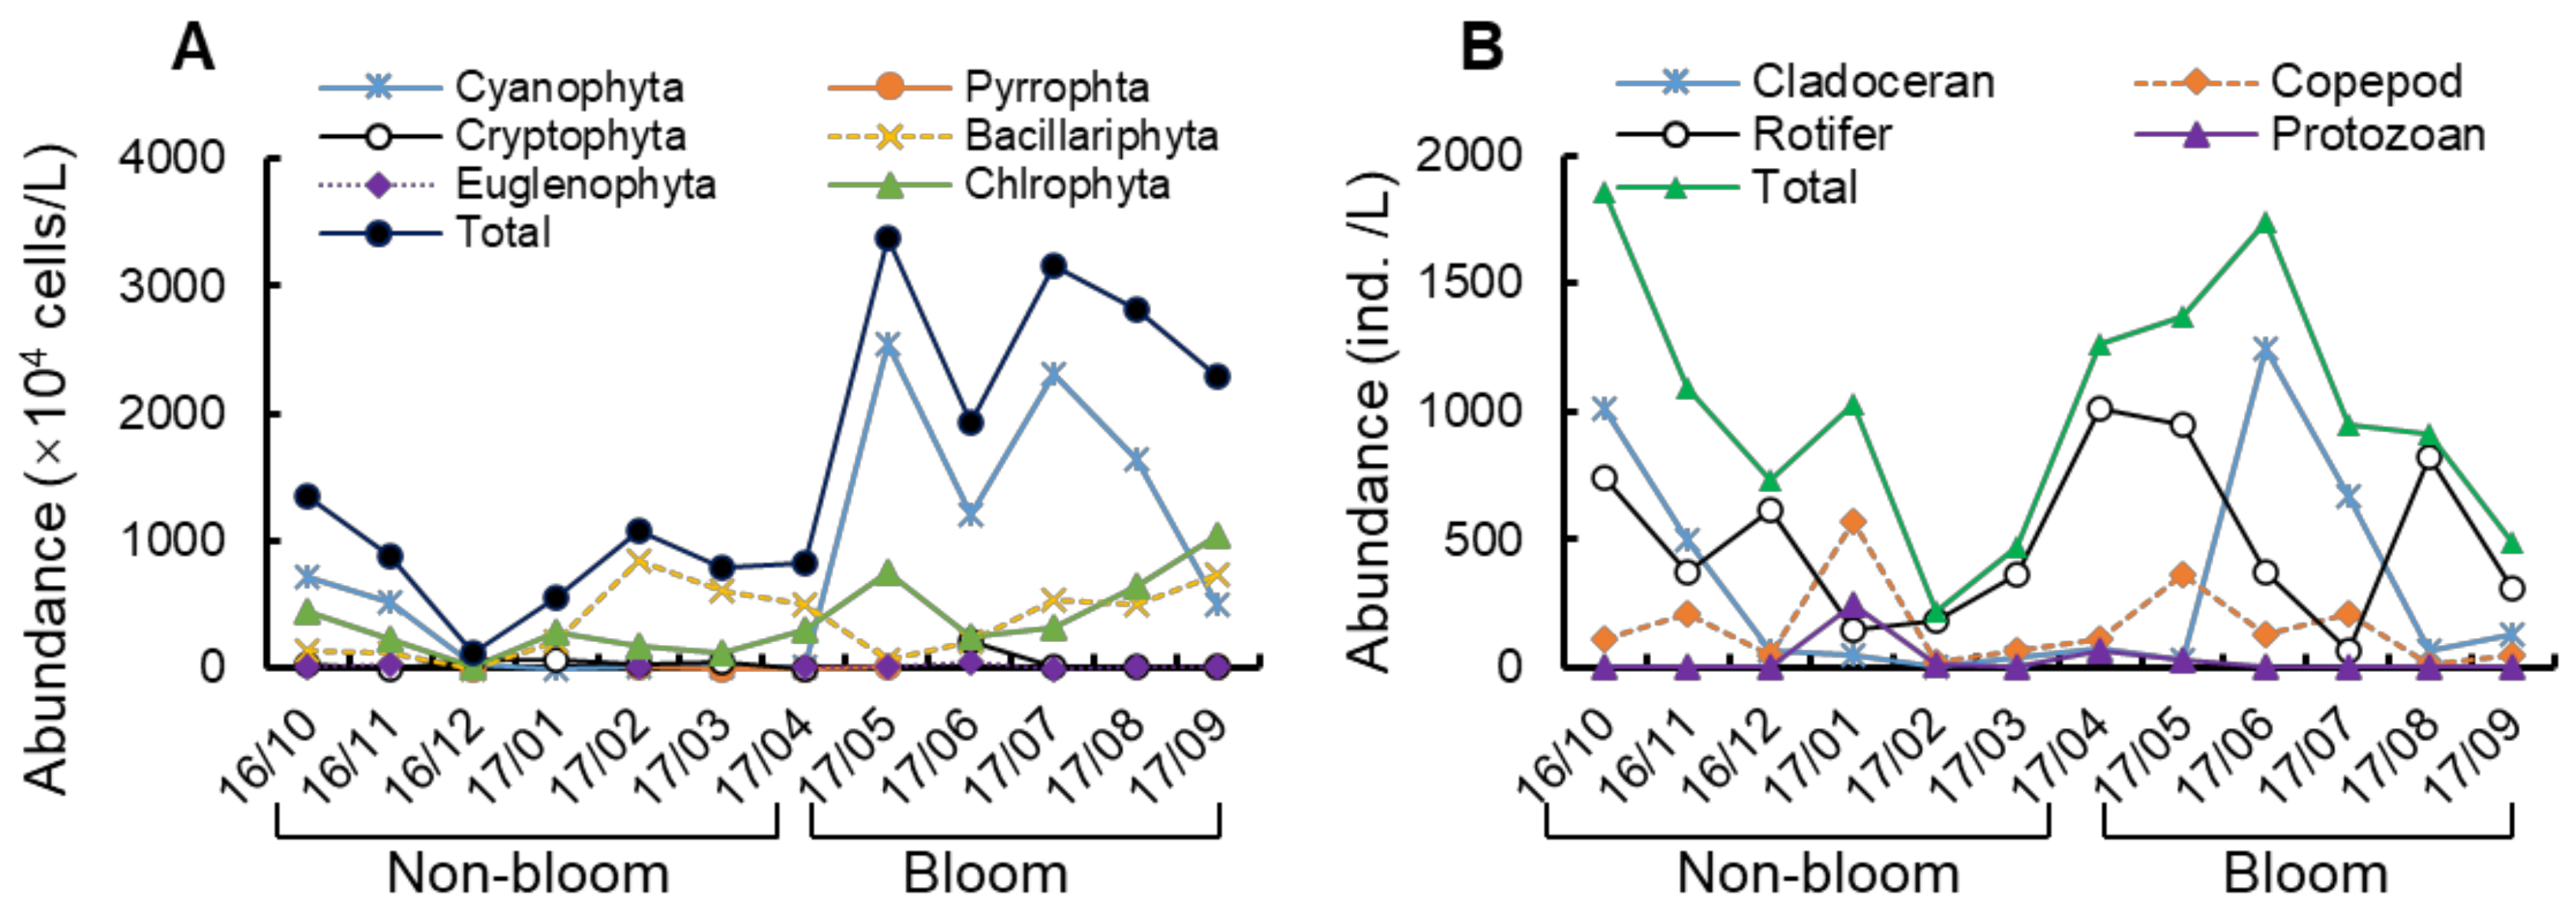
In general, microscopic observations showed that a total of 141 species of algae were identified from Lake Nanhu, in which Chlorophyta, Cyanophyta and Bacillariophyta contributed 83.21% of the species (Supplementary Table S1). The average abundance of phytoplankton during non-bloom period in Lake Nanhu was 8.01 × 10⁶ cells/L, mainly dominated by Bacillariophyta (3.47 × 10⁶ cells/L). However, the average abundance of phytoplankton during bloom period was 2.71 × 10⁷ cells/L, and mainly dominated by Cyanophyta (1.64 × 10⁷ cells/L) (Figure 4A). Moreover, the abundance of phytoplankton was highest in May (3.37 × 10⁷ cells/L) and lowest in December (1.26 × 10⁶ cells/L). A. circinalis, Microcystis flos-aquae, Pseudoanabaena sp., M. aeruginosa, Asplanchna sp., and Pandorina sp. were the main group of phytoplankton in the Lake Nanhu.
Qualitative analysis of zooplankton revealed that the main zooplankton in Lake Nanhu included protozoans (39 species), rotifers (21 species), cladocerans (8 species) and copepods (Nauplii and Mesocyclops leuckarti) (Supplementary Table S2). Quantitative analysis of microzooplankton showed that the density abundance of rotifers was higher bloom period (523.89 ind./L) than that in non-bloom period (mean of 471.27 ind./L), especially Brachionus and Polyarthra (Figure 4B). Moreover, the abundance of zooplankton was highest in October (1.86 × 10³ ind./L) and lowest in February (2.66 × 10² ind./L), both in the non-bloom period. Brachionus calyciflorus, Moina macrocopa, B. diversicornis, Asplanchna sp., and B. urceus were the main group of zooplankton in the Lake Nanhu.
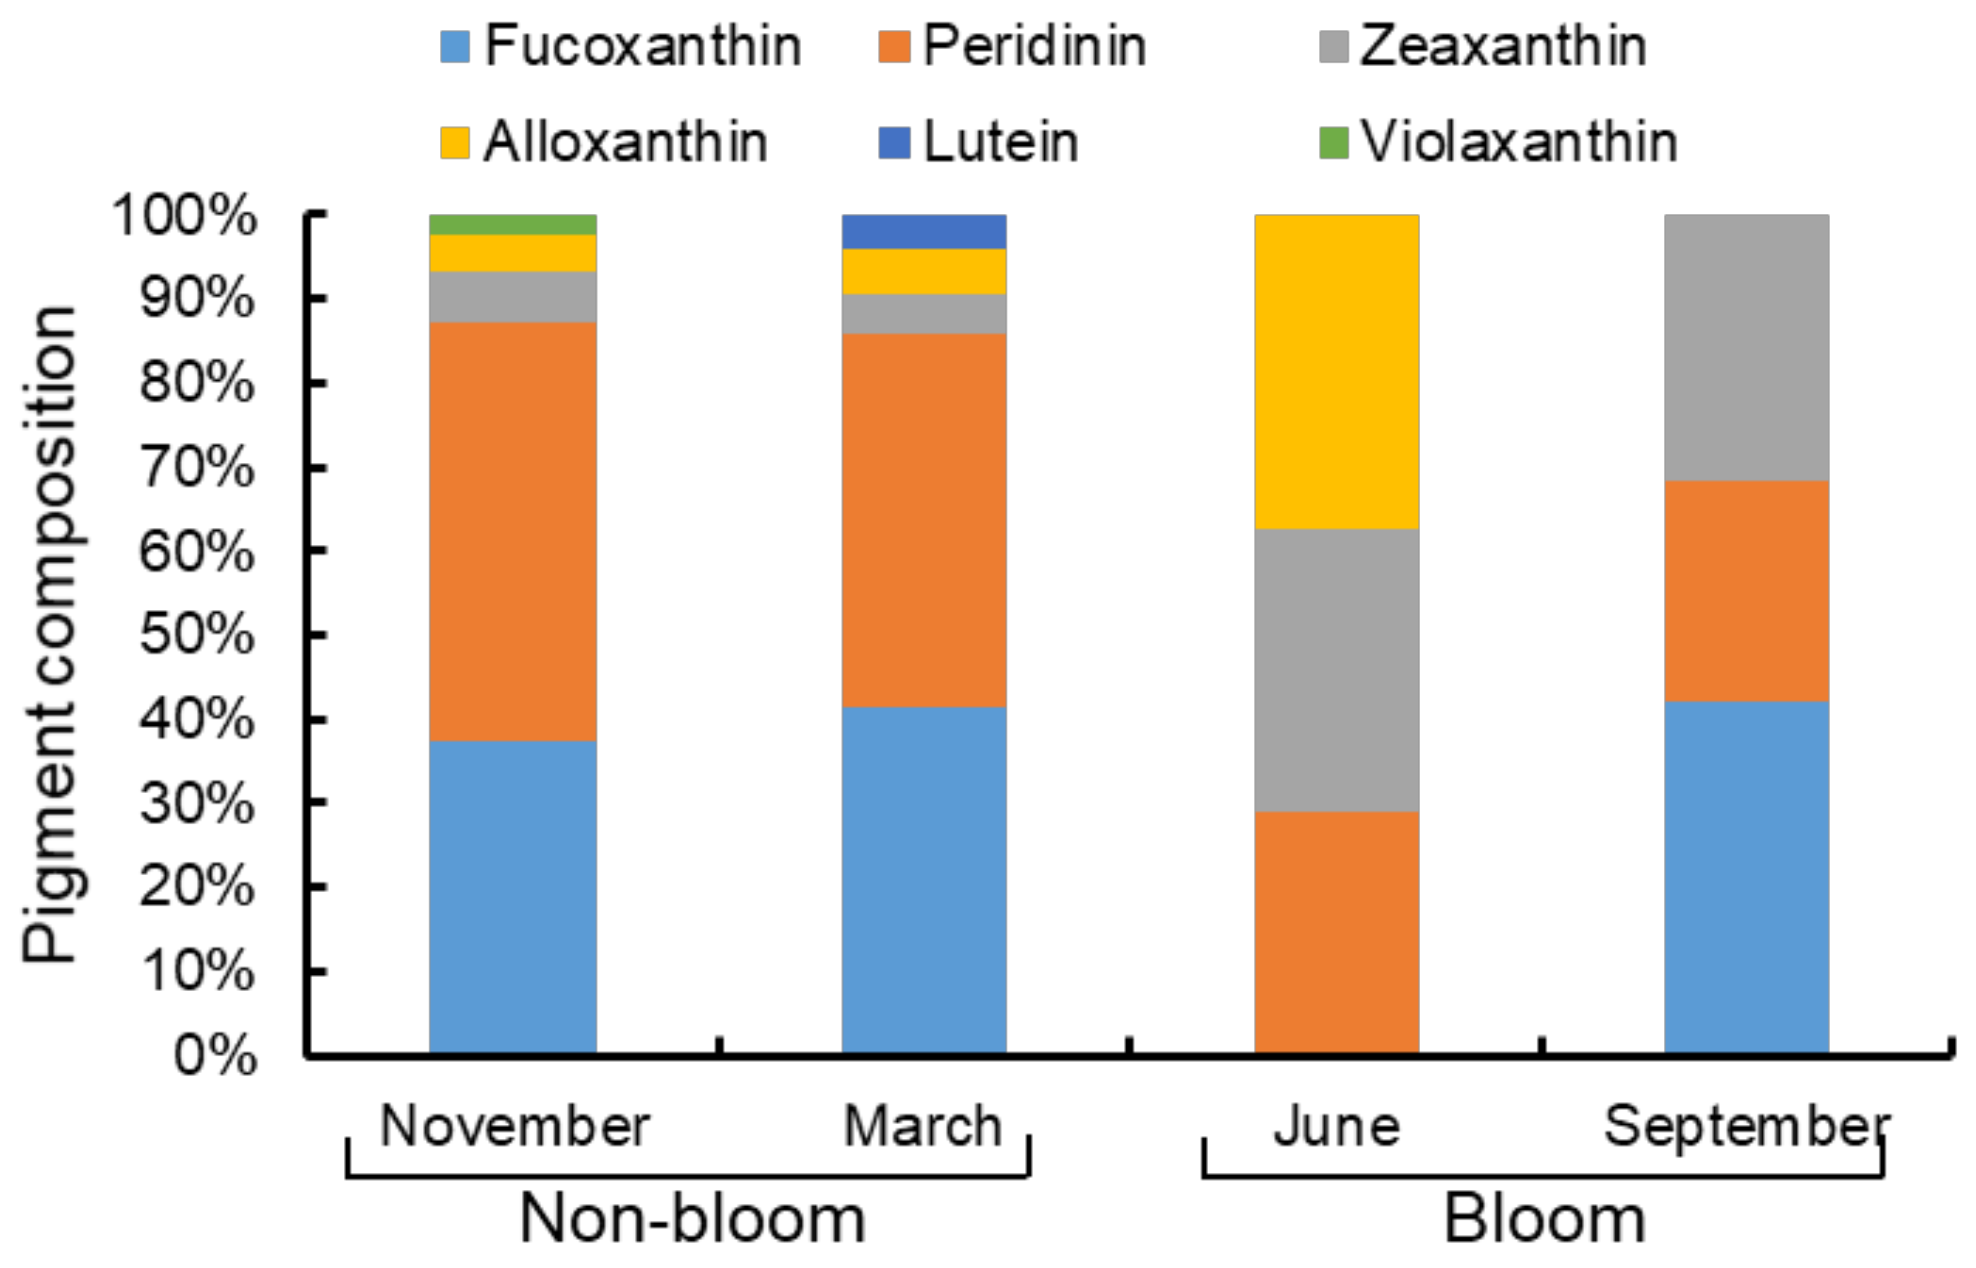
HPLC characteristic pigments (Figure 5) also showed differences of phytoplankton community composition between the non-bloom and bloom period in Lake Nanhu. In the non-bloom period (November and March), the phytoplankton pigment composition of Lake Nanhu accounted for more than 80% of fucoxanthin and peridinin. In June (bloom period), three pigments (alloxanthin, zeaxanthin and peridinin) were detected, and their proportions were all around 30%. In September (bloom period), Fucoxanthin (42.15%) account for a higher proportion. The results revealed that Bacillariophyta biomass was high both in non-bloom and bloom period (mean of 41.26% and 21.08%, respectively), while Pyrrophyta biomass was high in non-bloom period (mean of 47.12%), Cyanophyta biomass was high in bloom period (mean of 32.67%).
3.3. Variation in Bacterial Community Structure
A total of 298,585 reads were obtained from water samples of three sampling sites in Lake Nanhu in non-bloom period (March and November) and bloom period (May). The rank abundance curve showed that all sequencing depths were adequate to reflect the bacterial variety (Supplementary Figure S1). As can be seen from Table 1, good’s coverage (≥99%) showed a high degree of sequence coverage. Additionally, the bacterial community had the highest Chao1 (1548.40 on average), Shannon (6.12 on average) and Ace (1519.45 on average) values in November, while it had lowest Chao1 (752.06 on average) and Ace (715.42 on average) values in March, and lowest Shannon values (4.48 on average) in May.
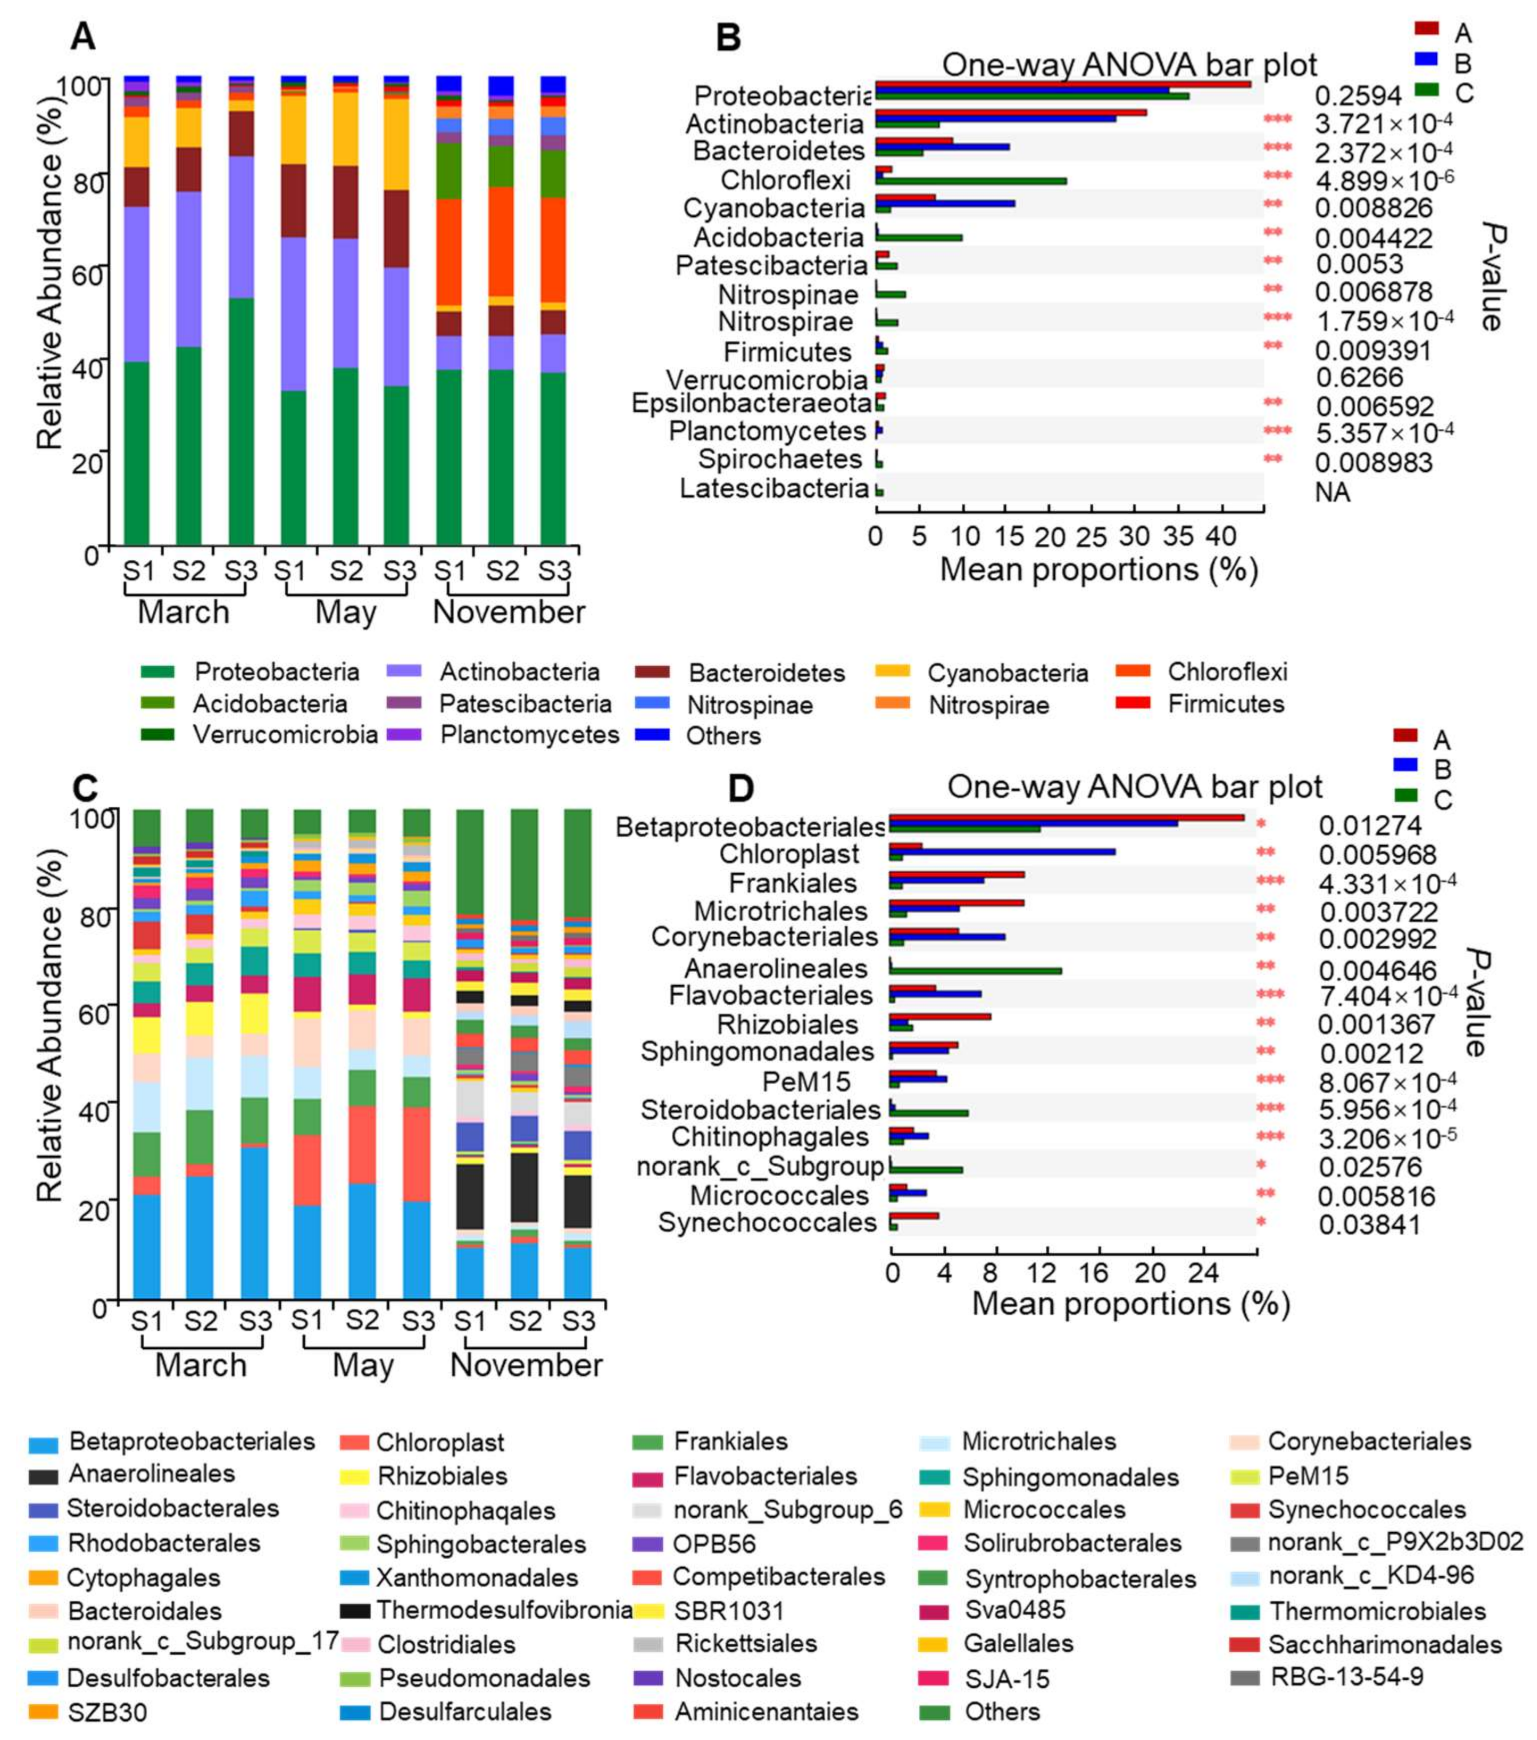
A total of 42 phyla and 232 orders were detected in the water samples from Lake Nanhu. Proteobacteria (32.97–52.78%) were the most abundant bacteria, followed by Actinobacteria (7.07–33.39%) and Bacteroidetes (5.04–16.73%) (Figure 6A). In the contrast, Nitrospinae, Firmicutes and Verrucomicrobia, only represented a minor proportion (Figure 6A). Actinobacteria was significantly more abundant in March and May (mean of 32.34% and 28.66% respectively) than those in November. The abundance level of Bacteroidetes (mean of 15.93%) and Cyanobacteria (mean of 16.58%) were higher in May than those in March and November. Moreover, Chloroflexi (mean of 22.76%) and Acidobacteria (mean of 10.26%) were more abundant in November than those in March and May (Figure 6B).
Further analysis indicated that Betaprotebacteriales, Frankiales, Microtrichales, Corynebacteriales, Flavobacteriales and Rhizobiales were all abundant in Lake Nanhu (Figure 6C). The abundance levels of Betaprotebacteriales in March and May were 25.95% and 21.07%, respectively, which were higher than that in November (11.01%). The abundance levels of Frankiales, Microtrichales and Rhizobiales (9.85%, 9.82%, and 7.39%, respectively) in March were higher than those in the other two months (Figure 6D). Meanwhile, Corynebacteriales (8.44%) and Flavobacteriales (6.68%) were more abundant in May than in March and November. Moreover, the abundance of Anaerolineale (12.57%) and Steroidobacterales (5.73%) reached highest levels in November (Figure 6D).
3.4. Microzooplankton Grazing on Size Specific Phytoplankton
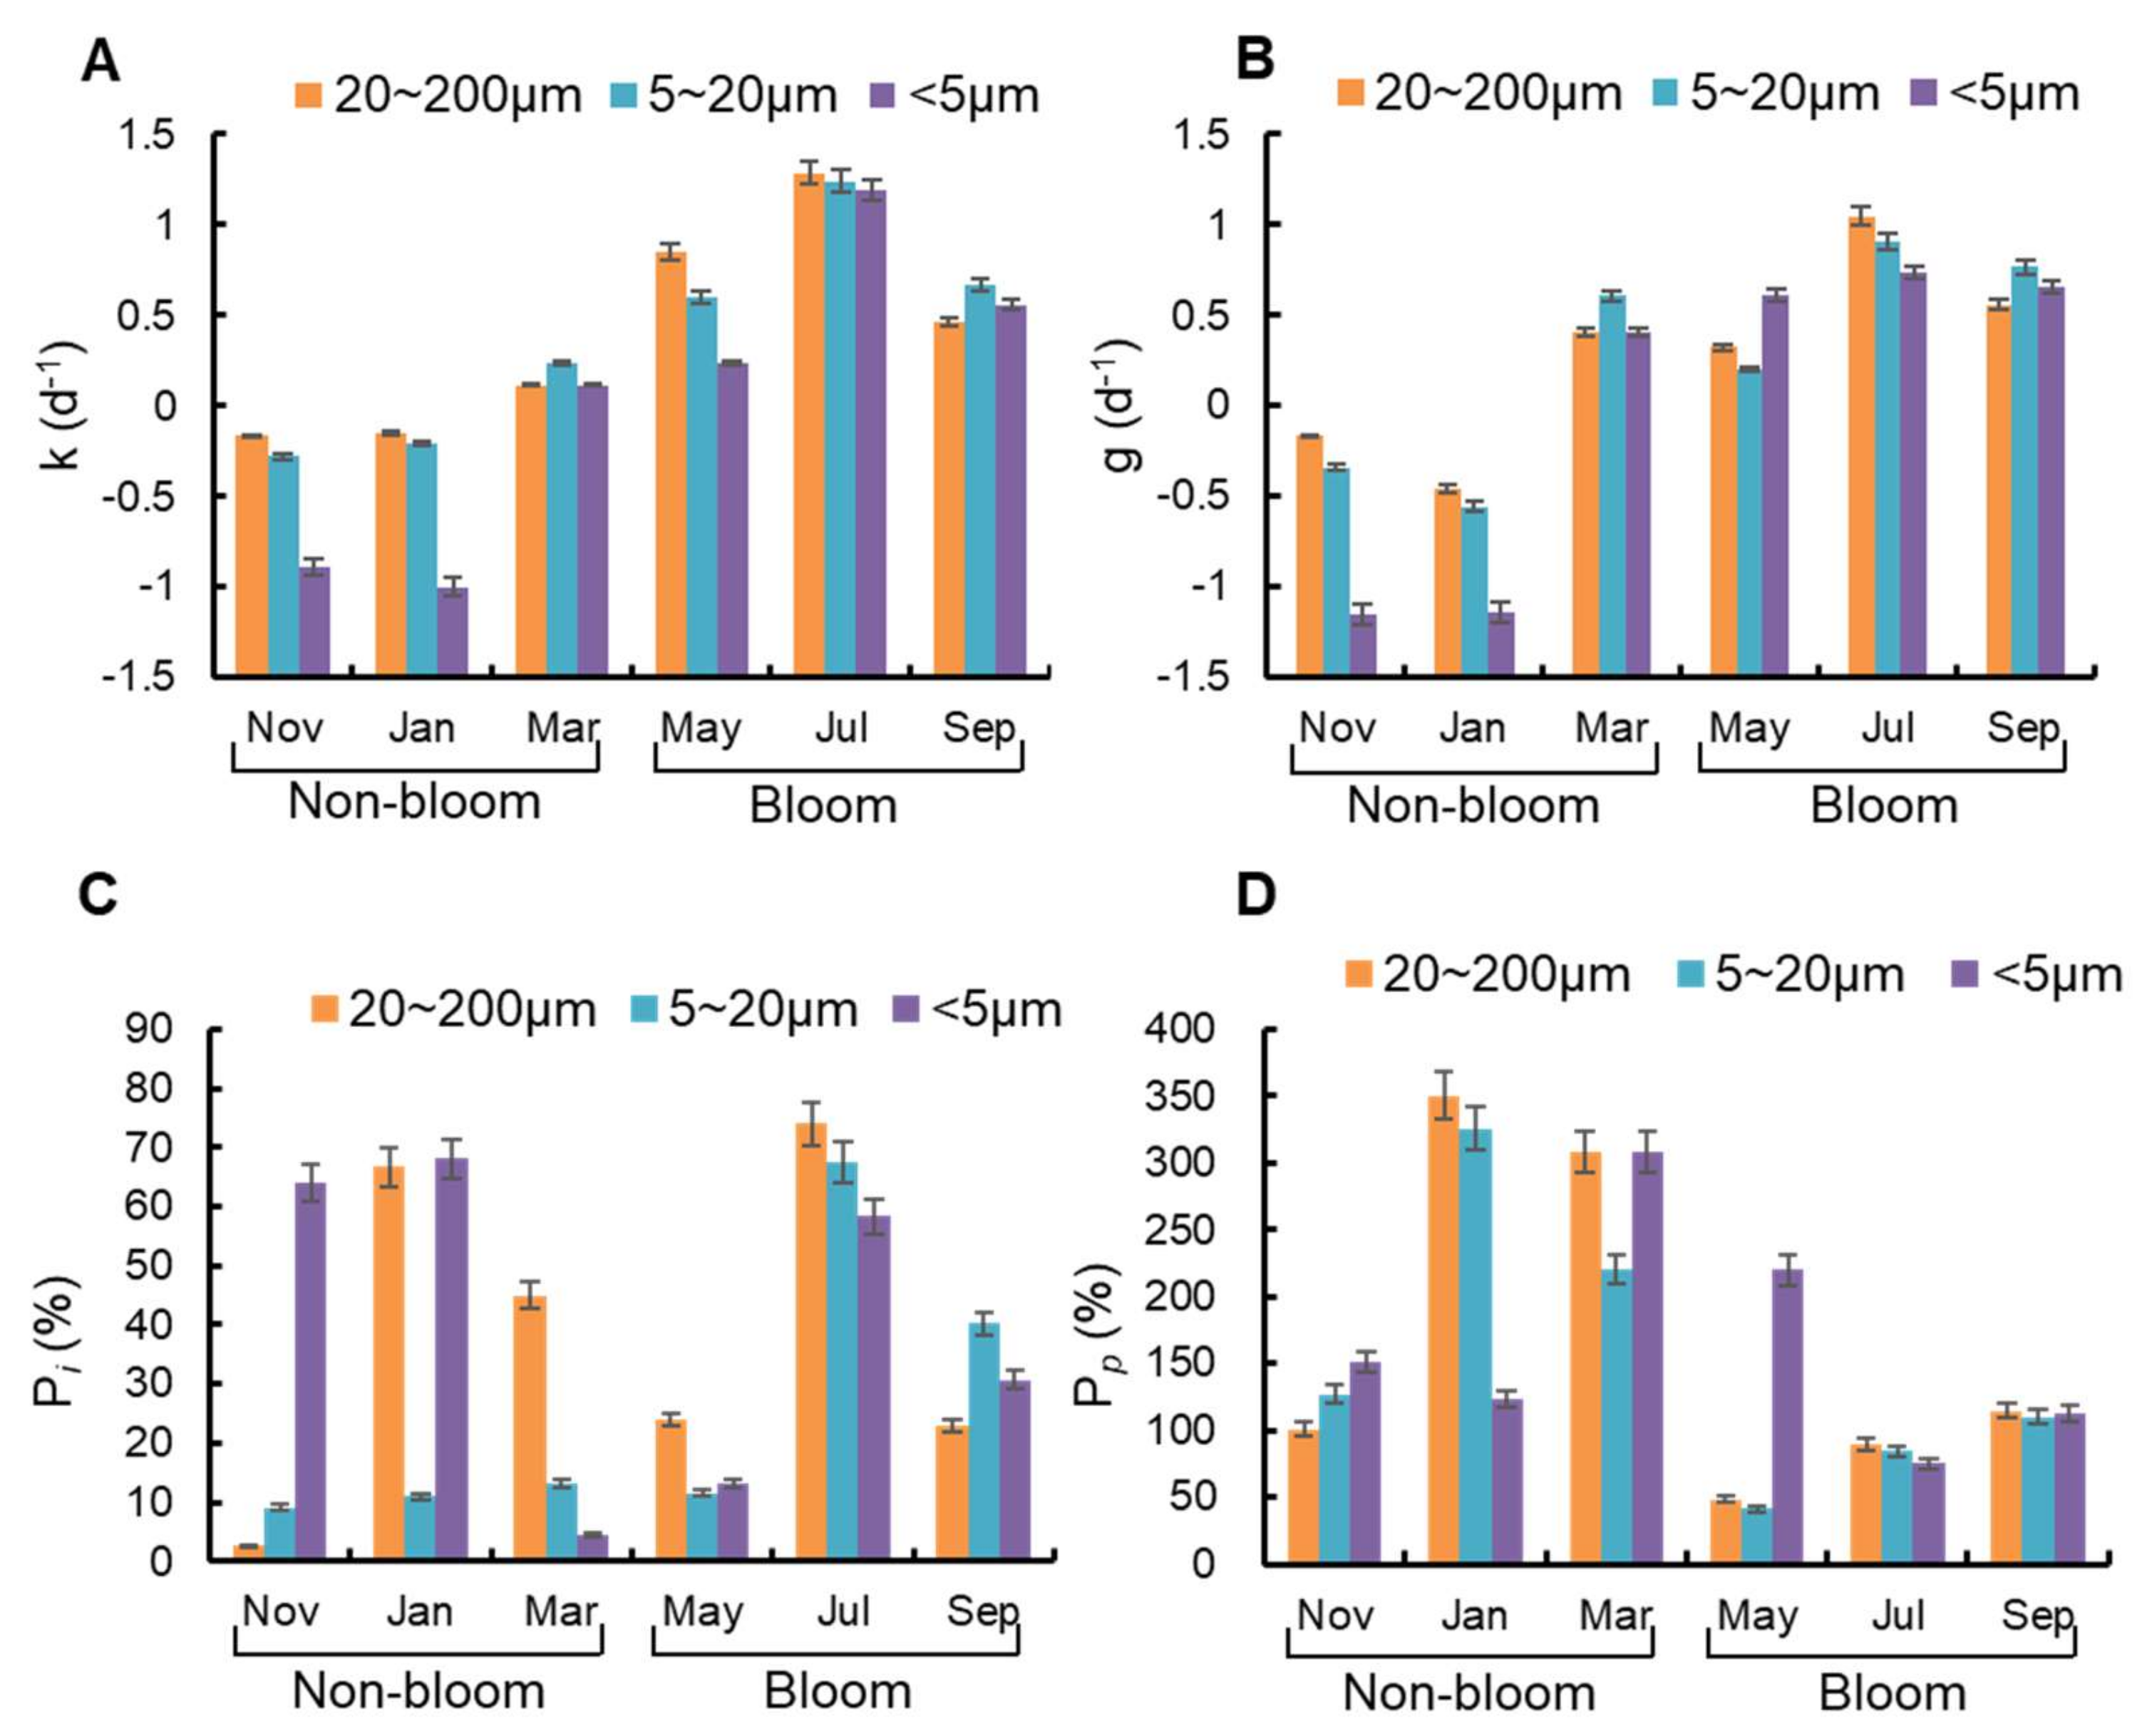
Size-specific phytoplankton growth rates (k), as determined by dilution experiments, were usually lower in non-bloom period (−1.00 d−1 to 0.25 d−1) than in bloom period (0.23 d−1–1.29 d−1) (Figure 7A). Meanwhile, the size-specific microzooplankton grazing rates (g) were also higher in bloom period (0.61 d−1–1.05 d−1) than in non-bloom period (−1.15 d−1 to −0.17 d−1) (Figure 7B), which were positively correlated with phytoplankton growth rates significantly (p = 0.03, r = 0.81). Phytoplankton growth rates and microzooplankton grazing rates for phytoplankton < 5 μm groups were both significantly lower than other groups in January and November (p = 0.03), and did not differ significantly among the three size fractions in other months (p > 0.05). In May, microzooplankton grazing rates for <5 μm groups were higher than other groups (p = 0.04), and phytoplankton growth rates were lower than other groups (p = 0.04).
The grazing pressure of microzooplankton on standing stocks (Pi) for phytoplankton in different size fraction ranged from 2.73–74.01% (Figure 7C). Pi for phytoplankton in 20–200 μm groups and 5–20 μm groups both had the highest level in July (bloom period, 74.01%, 67.56%) and the lowest level in November (non-bloom period, 2.73%, 9.18%). By comparison, Pi for phytoplankton with particle size <5 μm had the highest (68.05%) and lowest (4.49%) level both in non-bloom period. The grazing pressure of microzooplankton on primary production (Pp) for different particle size phytoplankton was 41.13–350.07% (Figure 7D). Pp for phytoplankton with particle size 20–200 μm and 5–20 μm both had the highest level in January (non-bloom period, 350.07%, 325.61%) and the lowest level in May (bloom period, 48.24%, 41.13%). In addition, Pi for phytoplankton with particle size <5 μm had the highest level in non-bloom period (307.78%) and lowest level in bloom period (74.95%).
3.5. Microzooplankton Grazing on Pigment Specific Phytoplankton
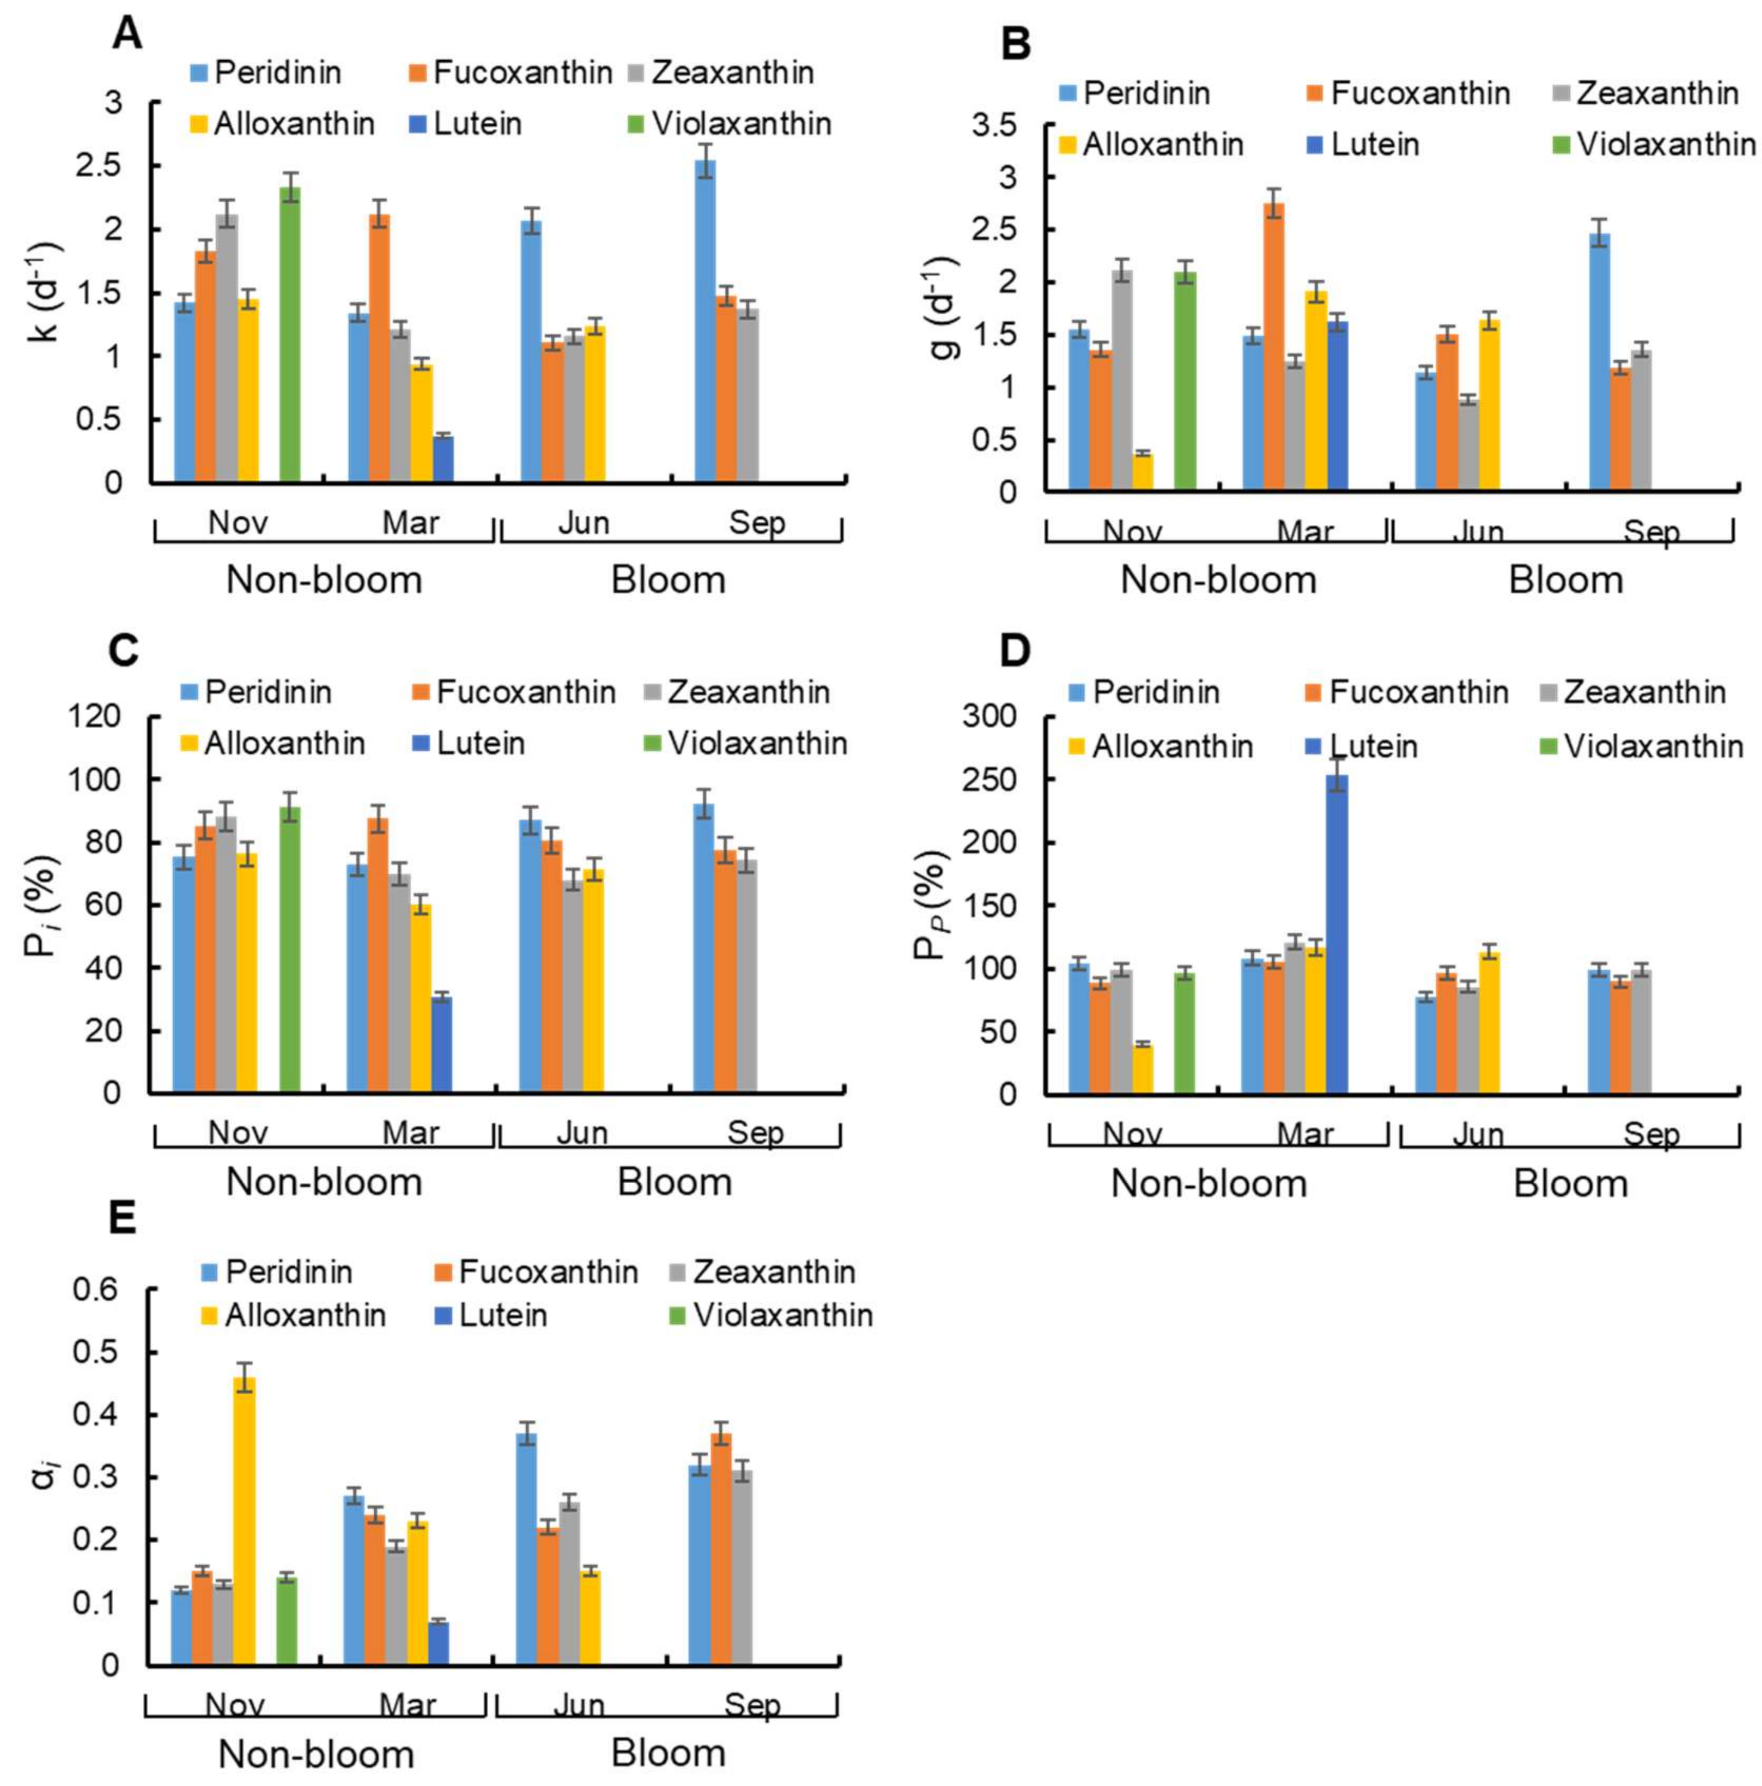
Pigment-specific phytoplankton growth rates were ranged from 0.37 d−1 to 2.54 d−1 (Figure 8A). Among them, the highest growth rate was peridinin (represented for Pyrrophyta) in September (bloom period, 2.54 d−1) and the lowest growth rate was lutein (represented for Chlorophyta) in March (non-bloom period, 0.37 d−1). According to Figure 8B, the grazing rates of microzooplankton on phytoplankton were 0.37 d−1–2.75 d−1. Microzooplankton showed highest grazing rate on fucoxanthin (represented for Bacillariophyta, 2.75 d−1) and lowest grazing rate on alloxanthin (represented for Cryptophyta, 0.37 d−1) both in non-bloom period.
The grazing pressure of microzooplankton on standing stocks (Pi) and primary production (Pp) were ranged from 30.71 to 92.48% and from 40.20 to 253.88%, respectively (Figure 8C,D). For most pigments, Pp were around 90–120%, and the maximum values of Pp were recorded in lutein (253.88%) in non-bloom period. The maximum values of Pi for zeaxanthin (represented for Cyanophyta, 88.18%), alloxanthin (76.31%), violaxanthin (represented for Chlorophyta, 91.51%), and fucoxanthin (87.69%) were recorded in non-bloom period, while the maximum values of Pi for peridinin (92.48%) were recorded in bloom period.
The grazing preference index (αi) of microzooplankton for pigment-specific phytoplankton in two periods was shown in Figure 8E. During non-bloom period, microzooplankton showed preference to Cryptophyta (αCryptophyta = 0.46 > 0.20) in November, and it showed preference to Pyrrophyta, Bacillariophyta, and Cryptophyta (αPyrrophyta = 0.27 > 0.20, αBacillariophyta = 0.24 > 0.20, αCryptophyta = 0.23 > 0.20) in March. During bloom period, microzooplankton showed preference to Pyrrophyta and Cyanophyta (αPyrrophyta = 0.37 > 0.25, αCyanophyta = 0.26 > 0.25) in June, and it showed preference to Bacillariophyta (αBacillariophyta = 0.37 > 0.33) in September.
4. Discussion
4.1. Changes in Phytoplankton Communities between Bloom and Non-Bloom Period
In Lake Nanhu, both A. circinalis and M. flos-aquae were considered to be the causative organisms in bloom period. Anabaena and Microcystis were most pervasive bloom-forming cyanobacteria in freshwater ecosystems [47,48]. Many Anabaena and Microcystis can produce algal toxins [49]. Thus, the occurrence of cyanobacteria blooms can have adverse effects on water quality, recreation, food web dynamics and human health [50,51,52]. Previous studies have often focused on a single type of bloom, while our study found that both Anabaena and Microcystis blooms occurred in freshwater eutrophic lakes. HPLC characteristic pigments also showed that Cyanophyta was the algae that caused the bloom in Lake Nanhu (Figure 5).
As a primary producer in water, phytoplankton species composition can objectively reflect the changing law of water environment and play an important indicator role. In this study, the composition of the phytoplankton community in Lake Nanhu exhibited changes between bloom and non-bloom period. Bacillariophyta and Cyanophyta were the main dominant species in non-bloom and bloom period, respectively. The result of HPLC characteristic pigments also confirmed this conclusion. There are many factors that influence the change of phytoplankton community (such as physical indicators, nutrients, grazing pressure). In this study, when the temperature increased from April to May, the abundance of Cyanophyta increased rapidly and became the dominant species in water (Figure 4A). Previous study has shown that Cyanophyta can reduce the abundance of other phytoplankton species by allelopathic mechanism [53]. Therefore, Bacillariophyta cannot continue to be dominant species in water even though their abundance increased with the increased of TP concentration. Studies have shown that Cyanophyta abundance is positively correlated with TN concentration [54,55], which is inconsistent with the results of this study. The possible explanation is that the Microcystis blooms could reduce the nitrogen in water bodies [56]. In addition, the discharge of domestic sewage and aquaculture are also important reasons for the changes in the phytoplankton community. Compared with deep lakes, shallow-water lakes are more susceptible to external changes, and the interaction between phytoplankton and its ecosystem is more significant. Therefore, the relationship between phytoplankton and environmental factors in shallow eutrophic lakes needs more in-depth research.
4.2. Changes in Zooplankton Communities between Bloom and Non-Bloom Period
Zooplankton, as the primary consumers of aquatic ecosystems, play an important role in the food chain and affect the quality of water environment. Zooplankton is an important part of the water environment and is crucial to maintaining the stability of freshwater ecosystems [50]. In this study, rotifers were the main components of zooplankton in Lake Nanhu, followed by cladocerans. The abundance of rotifers and cladocerans in bloom period was higher than that in non-bloom period. This may be due to the higher abundance of phytoplankton and water temperature during the bloom. Within the appropriate range of temperature and food density, the population density of rotifers and cladocerans increase with the increase of temperature and food density [57,58,59,60,61,62,63].
B. calyciflorus was the most dominant zooplankton in the non-blooming period, while the most dominant species in the blooming period was M. macrocopa, followed by B. calyciflorus. There are many factors influencing the relationship between rotifers and cladocerans, which are often the result of the combined action of biological and non-biological factors, such as temperature [64,65], food [66], individual size [67,68], and grazing [69,70]. When the individual size of cladocerans is less than 1200 μm, the competitive inhibitory effect of cladocerans on rotifers is much weaker, and rotifers can coexist with them at a higher density [71]. Previous studies reported that the individual size of M. macrocopa is mostly around 1200 μm [72,73]. Therefore, when M. macrocopa competes with rotifers, environmental factors such as temperature and food may have a greater effect.
Zooplankton, especially rotifers and cladocerans, are very sensitive to temperature changes in shallow lakes [74]. Many studies have shown that the quantity, quality and type of food have a significant impact on the abundance, diversity and interspecific competition outcome of zooplankton [75,76,77,78]. Previous study has shown that the cyanobacteria bloom was observed together with the high abundance of small-sized zooplankton [79]. Studies have shown that B. calyciflorus could adapt to eutrophic water by changing their life history and grazing intensity [80]. Fulton and Paerl pointed out that rotifers could consume small Microcystis groups [81]. Small cladocerans have a more obvious competitive advantage than large cladocerans at higher temperatures, which is believed to be the reason why small cladocerans have higher population abundance in warm waters [82]. Previous studies have also proposed that small cladocerans were more resistant to cyanobacteria and ingesting bacteria than large cladocerans, so they are more adaptable to algal blooms [83,84]. This may be the reason why M. macrocopa become the dominant species during bloom period of the eutrophic shallow lake Nanhu.
4.3. Changes in Bacteria Communities between Bloom and Non-Bloom Period
The composition of the plankton bacterial community in water is regulated by a variety of biological and non-biological factors such as phytoplankton, zooplankton, temperature [85], and nutrients [86]. Temperature can indirectly affect the community composition of bacteria by affecting the community structure of phytoplankton and zooplankton [87]. The organic matter produced by phytoplankton and zooplankton provides energy for the growth of bacteria [88,89,90]. In addition, zooplankton can also directly graze bacteria, which affects the number and distribution of bacteria [91]. In lake ecosystems with different nutrient levels, nutrients have different effects on bacteria. In oligotrophic lakes, nutrients can become a limiting factor for the growth of bacteria [92,93]. In mesotrophic lakes, nutrients have different limiting effects on bacteria in different seasons [94]. In eutrophic lakes, the effect of nutrients on bacteria is less than that of phytoplankton [95]. Studies have also found that during the lake bloom period, the number and species of bacteria have changed significantly, and this change could be used to predict the algal bloom [96]. Therefore, planktonic bacteria in water are regarded as important environmental indicators of water ecology.
In this study, bacteria communities were mainly dominated by Proteobacteria and Actinobacteria, which contributed more than 50% to relative abundance of bacteria in both bloom and non-bloom periods (Figure 6A). Moreover, the mean proportion of Bacteroidetes in May (bloom period) was significantly higher than that in March and November (non-bloom period) (Figure 6B). The result also supported the increase of cyanobacteria could promote the growth of Proteobacteria, Actinobacteria and Bacteroidetes [97]. Previous studies have found that the organic secretions of cyanobacteria could adsorb Bacteroidetes, and the Bacteroidetes could lyse cyanobacteria cells [98,99]. Pinhassi et al. also found that the Bacteroidetes may play a vital role in the processing of organic matter during the algal bloom [100]. Thus, it is also an effective method to remove cyanobacteria by bacterial adhesion to surface [101,102]. All in all, bacteria were believed to participate in certain important activities during algae blooms, and need to be study further.
4.4. Microzooplankton Grazing on Different Phytoplankton Groups between Bloom and Non-Bloom Period
Microzooplankton grazing rates varied similarly with the growth rates of phytoplankton in different size groups during bloom period (Figure 7A,B). The result showed that microzooplankton grazing can respond quickly to the increase in phytoplankton abundance [103]. During non-bloom period, grazing pressure of microzooplankton on the standing stocks (Pi) for phytoplankton <5 μm groups were relatively higher than that for the other two size groups. In comparison, Pi were not significantly different among those three size groups of phytoplankton during bloom period (p > 0.05), even though all the Pi values increased. This indicates that small size groups of phytoplankton could be effectively controlled by microzooplankton during non-bloom period.
Grazing pressure of zooplankton can be related to the type of food, body size, feeding mode, selectivity and tolerance to prey [104]. Copepods and cladocerans display selectivity on size of food particles and type of food, while rotifers display selectivity in regard to condition of algal cells as wells as type of food [105]. In this study, microzooplankton showed preference to Pyrrophyta and Bacillariophyta both in bloom and non-bloom periods, while they showed preference to Cryptophyta and Cyanophyta during non-bloom period and bloom period, respectively. During bloom period, phytoplankton community was dominated by Cyanophyta and microzooplankton community was dominated by rotifers. Although phytoplankton such as Anabaena and Microcystis were poor quality prey to rotifers, microzooplankton still showed preference on Cyanophyta. This indicates that grazing preference of microplankton during the bloom period was relatively mainly affected by the community composition of phytoplankton.
4.5. Ecological Restoration of Eutrophic Lakes
In the present study, microzooplankton grazing could quickly respond to phytoplankton growth. However, the improved growth conditions at the onset of a bloom allow phytoplankton to escape microzooplankton grazing pressure [106]. Therefore, the regulation of cyanobacteria blooms in Lake Nanhu requires more other methods. In the past 30 years, the main pollution sources of Lake Nanhu were the discharge of domestic sewage and the release of aquaculture feed. At present, under the management of relevant departments and policies, the sewage outlets of Lake Nanhu have been basically blocked. To further improve the water environment, more approaches need to be undertaken. Biomanipulation is an important theory first proposed by Shapiro et al. to control algae in eutrophic lakes [107]. Since then, traditional and non-traditional biomanipulation has been widely used in the prevention and control of eutrophication of water bodies in Europe, North America, and China [107,108,109]. Due to the lack or slow proliferation of original microzooplankton in the natural environment, the process of improving water quality by biomanipulation is relatively slow or inefficient [109]. In this study, it was also found that microzooplankton played little role during algal blooms occurred in freshwater eutrophic lakes. Nevertheless, this study still provides some basic information for improving water environment quality according to biomanipulation.
5. Conclusions
The community of phytoplankton, zooplankton, and bacteria changed between bloom and non-bloom periods: Firstly, Cyanophyta, especially A. circinalis and M. flos-aquae, were mainly dominant species during bloom period; secondly, B. calyciflorus and M. macrocopa were the most dominant zooplankton in the non-bloom and bloom period, respectively; thirdly, Bacteroidetes showed significantly higher mean proportion during bloom period than that in non-bloom period. Moreover, microzooplankton grazing could respond quickly to the increase in phytoplankton abundance. However, microzooplankton grazing has little effect during the outbreak period in the natural environment. This study will help us to understand the role of microbial webs during algal blooms in freshwater eutrophication lakes and provide basic data for the application of biomanipulation in the future.
Supplementary Materials
The following are available online at https://www.mdpi.com/article/10.3390/w13091296/s1, Figure S1. Rarefaction curves base on high-throughput sequencing. A: the period of pre-bloom, B: the period during algal bloom, C: the period of post-bloom., Table S1: The composition of phytoplankton species in Lake Nanhu (+++: Predominant species; ++: second dominant species; +: present)., Table S2. The composition of zooplankton species in Lake Nanhu (+++: Predominant species; ++: second dominant species; +: present).
Author Contributions
Methodology, M.H.; software, C.D.; validation, S.M.; formal analysis, C.F.; investigation, C.L.; resources, M.H.; data curation, M.H.; writing—original draft preparation, M.H.; writing—review and editing, X.L.; supervision, X.L.; funding acquisition, X.L. and Z.G. All authors have read and agreed to the published version of the manuscript.
Funding
Financial support was provided by the Fundamental Research Funds for the Central Universities to X.J.L. (2662019FW007 to X.J.L.), National Natural Science Foundation of China NSFC (32071516 for X.J.L.), Finance Special Fund of Key Laboratory of Freshwater Aquaculture genetic and breeding of Zhejiang Province (ZJK201914 to X.J.L.), and Chinese Ministry of Agriculture (Fisheries resources and environment survey in the key water areas of Tibet).
Institutional Review Board Statement
Not applicable.
Informed Consent Statement
Not applicable.
Data Availability Statement
Conflicts of Interest
The authors declare no conflict of interest.
References
- Azam, F.; Fenchel, T.; Field, J.G.; Gray, J.S. The ecological role of water-column microbes in the sea. Mar. Ecol. Prog. Ser. 1983, 10, 257–263. [Google Scholar] [CrossRef]
- Garrison, D.L.; Gowing, M.M.; Hughes, M.P.; Campbell, L.; Caron, D.A.; Dennett, M.R.; Shalapyonok, A.; Olson, R.J.; Landry, M.R.; Brown, S.L.; et al. Microbial food web structure in the Arabian Sea: A US JGOFS study. Deep-Sea Res. Pt. II 2000, 47, 1387–1422. [Google Scholar] [CrossRef]
- Riemann, B.; Christoffersen, K. Microbial trophodynamics in temperate lakes. Mar. Microb. Food Webs 1993, 7, 69–100. [Google Scholar]
- Fenchel, T. The microbial loop-25 years later. J. Exp. Mar. Biol. Ecol. 2008, 366, 99–103. [Google Scholar] [CrossRef]
- Azam, F.; Malfatti, F. Microbial structuring of marine ecosystems. Nat. Rev. Microbiol. 2007, 5, 782–791. [Google Scholar] [CrossRef]
- Leakey, R.J.G.; Burkill, P.H.; Sleigh, M.A. Planktonic ciliates in Southampton Water: Abundance, biomass, production, and role in pelagic carbon flow. Mar. Biol. 1992, 114, 67–83. [Google Scholar]
- Miki, T.; Jacquet, S. Complex interactions in the microbial world: Underexplored key links between viruses, bacteria and protozoan grazers in aquatic environments. Aquat. Microb. Ecol. 2008, 51, 195–208. [Google Scholar] [CrossRef]
- Dussart, B.H. Les différentes catégories de plancton. Hydrobiologia 1965, 26, 72–74. [Google Scholar] [CrossRef]
- Calbet, A.; Saiz, E. The ciliate-copepod link in marine ecosystems. Aquat. Microb. Ecol. 2005, 38, 157–167. [Google Scholar] [CrossRef]
- Calbet, A.; Landry, M.R. Phytoplankton growth, microzooplankton grazing, and carbon cycling in marine systems. Limnol. Oceanog. 2004, 49, 51–57. [Google Scholar] [CrossRef] [Green Version]
- Kainz, M.; Arts, M.T.; Mazumder, A. Essential fatty acids in the planktonic food web and their ecological role for higher trophic levels. Limnol. Oceanog. 2004, 49, 1784–1793. [Google Scholar] [CrossRef]
- Schmoker, C.; Hernández-León, S.; Calbet, A. Microzooplankton grazing in the oceans: Impacts, data variability, gaps of knowledge, and future directions. J. Plankton Res. 2013, 35, 691–706. [Google Scholar] [CrossRef]
- Liu, X.J.; Deng, C.H.; Wong, C.K. Microzooplankton selective feeding in subtropical coastal waters as revealed by HPLC pigment analysis. J. Sea Res. 2014, 90, 83–94. [Google Scholar] [CrossRef]
- Irigoien, X.; Flynn, K.; Harris, R.P. Phytoplankton blooms: A ‘loophole’ in microzooplankton grazing impact. J. Plankton Res. 2005, 27, 313–321. [Google Scholar] [CrossRef] [Green Version]
- Sherr, E.B.; Sherr, B.F. Heterotrophic dinoilagellates: A significant component of microzooplankton biomass and major grazers of diatoms in the sea. Mar. Ecol. Prog. Ser. 2007, 352, 187–197. [Google Scholar] [CrossRef] [Green Version]
- Huang, W.; Chen, X.; Wang, K.; Chen, J.; Zheng, B.; Jiang, X. Comparison among the microbial communities in the lake, lake wetland, and estuary sediments of a plain river network. Microbiol. Open 2019, 8, 00644. [Google Scholar] [CrossRef]
- Tandon, K.; Yang, S.H.; Wan, M.T.; Chia-Chin, Y.; Bayanmunkh, B.; Chiu-Yu, C.; Jeng-Wei, T.; Wen-Cheng, L.; Sen-Lin, T. Bacterial Community in Water and Air of Two Sub-Alpine Lakes in Taiwan. Microbes. Environ. 2018, 33, 120–126. [Google Scholar] [CrossRef] [PubMed] [Green Version]
- Tranvik, L.J. Bacterioplankton Growth on Fractions of Dissolved Organic-Carbon of Different Molecular-Weights from Humic and Clear Waters. Appl. Environ. Microbiol. 1990, 56, 1672–1677. [Google Scholar] [CrossRef] [Green Version]
- Keshri, J.; Pradeep, R.A.S.; Sime-Ngando, T. Distinctive patterns in the taxonomical resolution of bacterioplankton in the sediment and pore waters of contrasted freshwater lakes. Microb. Ecol. 2017, 75, 662–673. [Google Scholar] [CrossRef]
- Wu, L.; Yu, Y.; Zhang, T.; Feng, W.; Zhang, X.; Li, W.; Wu, L.; Yu, Y.; Zhang, T.; Feng, W. PCR-DGGE Fingerprinting Analysis of Plankton Communities and Its Relationship to Lake Trophic Status. Int. Rev. Hydrobiol. 2010, 94, 528–541. [Google Scholar] [CrossRef]
- Souffreau, C.; van der Gucht, K.; van Gremberghe, I.; Kosten, S.; Lacerot, G.; Lobão, L.M.; de Moraes Huszar, V.L.; Roland, F.; Jeppesen, E.; Vyverman, W.; et al. Environmental rather than spatial factors structure bacterioplankton communities in shallow lakes along a >6000 km latitudinal gradient in South America. Environ. Microbiol. 2015, 17, 2336–2351. [Google Scholar] [CrossRef]
- Kong, Z.Y.; Kou, W.B.; Ma, Y.T.; Yu, H.T.; Ge, G.; Wu, L. Seasonal dynamics of the bacterioplankton community in a large, shallow, highly dynamic freshwater lake. Can. J. Microbiol. 2018, 64, 786–797. [Google Scholar] [CrossRef] [PubMed]
- Sadro, S.; Nelson, C.E.; Melack, J.M. Linking diel patterns in community respiration to bacterioplankton in an oligotrophic high-elevation lake. Limnol. Oceanogr. 2001, 56, 540–550. [Google Scholar] [CrossRef]
- Schweitzer-Natan, O.; Ofek-Lalzar, M.; Sher, D.; Sukenik, A. Particle-Associated Microbial Community in a Subtropical Lake during Thermal Mixing and Phytoplankton Succession. Front. Microbiol. 2019, 10, 2142. [Google Scholar] [CrossRef]
- Paver, S.F.; Hayek, K.R.; Gano, K.A.; Fagen, J.R.; Brown, C.T.; Davis-Richardson, A.; Crabb, D.B.; Rosario-Passapera, R.; Giongo, A.; Triplett, E.; et al. Interactions between specific phytoplankton and bacteria affect lake bacterial community succession. Environ. Microbiol. 2013, 15, 2489–2504. [Google Scholar] [CrossRef]
- Nygaard, K.; Tobiesen, A. Bacterivory in Algae—A Survival Strategy during Nutrient Limitation. Limnol. Oceanogr. 1993, 38, 273–279. [Google Scholar] [CrossRef]
- Tijdens, M.; Waal, D.B.V.D.; Slovackova, H.; Hoogveld, H.L.; Gons, H.J. Estimates of bacterial and phytoplankton mortality caused by viral lysis and microzooplankton grazing in a shallow eutrophic lake. Freshwater Biol. 2008, 53, 1126–1141. [Google Scholar] [CrossRef]
- Suttle, C.A. Viruses in the sea. Nature 2005, 437, 356–361. [Google Scholar] [CrossRef]
- Jankowiak, J.G.; Gobler, C.J. The Composition and Function of Microbiomes Within Microcystis Colonies Are Significantly Different Than Native Bacterial Assemblages in Two North American Lakes. Front. Microbiol. 2020, 11, 1016. [Google Scholar] [CrossRef]
- Yang, L.; Liu, Y.; Cao, X.Y.; Zhou, Z.; Wang, S.; Xiao, J.; Song, C.; Zhou, Y. Community composition specificity and potential role of phosphorus solubilizing bacteria attached on the different bloom-forming cyanobacteria. Microbiol. Res. 2017, 12, 59–65. [Google Scholar] [CrossRef] [PubMed]
- Shi, L.; Cai, Y.; Chen, Z.; Zhou, Y.; Li, P.; Kong, F. Diversity and abundance of aerobic anoxygenic phototrophic bacteria in two cyanobacterial bloom-forming lakes in China. Ann. Limnol. Int. J. Lim. 2010, 46, 233–239. [Google Scholar] [CrossRef] [Green Version]
- Lu, D.; Liu, P.; Fan, T.; Peng, H.; Zhang, Z. The investigation of “water bloom” in the downstream of the Han River. Res. Environ. Sci. 2000, 13, 29–31. [Google Scholar]
- Zheng, J.; Zhong, C.; Deng, C. Discussion on definition of algal bloom. Water Resour. Prot. 2006, 22, 45–47. [Google Scholar]
- Hu, H.J.; Wei, Y.X. The freshwater algae of China–Systematics, Taxonomy and Ecology; Sciencep: Beijing, China, 2006. [Google Scholar]
- Kofoid, C.A.; Campbell, A.S. Aconspectus of the Marine and Fresh Water Ciliate Belonging to the Suborder Tintinnoniea, with Descriptions of New Species Principally from the Agssiz Expedition to the Eastern Tropical Pacific; University of California Press: Berkeley, CA, USA, 1929. [Google Scholar]
- Kofoid, C.A.; Campbell, A.S. The Ciliate: The Tintinnoinea; Museum of Comparative Zoology at Harvard College: Cambridge, MA, USA, 1939. [Google Scholar]
- Lee, J.J.; Hunter, S.H.; Bovee, E.C. An Illustrated Guide to the Protozoa; Society of Protozoologists Publishers: Guelph, ON, Canada, 1985; pp. 393–575. [Google Scholar]
- Feng, C.; Jia, J.; Wang, C.; Han, M.; Dong, C.; Huo, B.; Li, D.; Liu, X. Phytoplankton and Bacterial Community Structure in Two Chinese Lakes of Different Trophic Status. Microorganisms 2019, 7, 621. [Google Scholar] [CrossRef] [PubMed] [Green Version]
- Landry, M.R. Estimating rates of growth and grazing of phytoplankton by dilution method. In Handbook of Methods in Aquatic Microbial Ecology; Lewis Publishers: Ann Arbor, MI, USA, 1993; pp. 715–722. [Google Scholar]
- Burkill, P.H. Microzooplankton grazing and selectivity of phytoplankton in coastal waters. Mar. Biol. 1987, 93, 581–590. [Google Scholar] [CrossRef]
- Wong, C.K.; Wong, C.K. HPLC pigment analysis of marine phytoplankton during a red tide occurrence in Tolo Harbour, Hong Kong. Chemosphere 2003, 52, 1633–1640. [Google Scholar] [CrossRef]
- Verity, P.G.; Stoecker, D.K.; Sieracki, M.E.; Nelson, J.R. Grazing, growth and mortality of microzooplankton during the 1989 North Atlantic spring bloom at 47° N, 18° W. Deep Sea Res. I 1993, 40, 1793–1814. [Google Scholar] [CrossRef]
- Chesson, J. The estimation and analysis of preference and its relationship to foraging models. Ecology 1983, 64, 1297–1304. [Google Scholar] [CrossRef]
- Tang, C.Y.; Sun, B.; Yu, K.F.; Shi, J.T.; Liu, M.M.; Jiang, T.; Huo, Y.Z.; He, P.M. Environmental triggers of a Microcystis (Cyanophyceae) bloom in an artificial lagoon of Hangzhou Bay, China. Mar. Pollut. Bull. 2018, 135, 776–782. [Google Scholar] [CrossRef]
- Jan, L.; Perr, S. Multivariate Analysis of Ecological Data Using CANOCO; Cambridge University: London, UK, 2013. [Google Scholar]
- Jiang, Y.J.; He, W.; Liu, W.X.; Qin, N.; Ouyang, H.L.; Wang, Q.M.; Kong, X.Z.; He, Q.S.; Yang, C.; Yang, B.; et al. The seasonal and spatial variations of phytoplankton community and their correlation with environmental factors in a large eutrophic Chinese lake (Lake Chaohu). Ecol. Indic. 2014, 40, 58–67. [Google Scholar] [CrossRef]
- Harke, M.J.; Steffen, M.M.; Gobler, C.J.; Otten, T.G.; Wilhelm, S.W.; Wood, S.A.; Paerl, H.W. A review of the global ecology, genomics, and biogeography of the toxic cyanobacterium, Microcystis spp. Harmful Algae 2016, 54, 4–20. [Google Scholar] [CrossRef] [Green Version]
- Zhang, M.; Zhang, Y.; Yang, Z.; Wei, L.; Yang, W.; Chen, C.; Kong, F. Spatial and seasonal shifts in bloom-forming cyanobacteria in Lake Chaohu: Patterns and driving factors. Phycol. Res. 2016, 64, 44–55. [Google Scholar] [CrossRef]
- Watanabe, M.F. Toxic water bloom of blue-green alga: Biological and chemical characterization. Jpn. J. Limnol. 1993, 54, 225–243. [Google Scholar] [CrossRef]
- Berry, M.A.; Davis, T.W.; Cory, R.M.; Duhaime, M.B.; Johengen, T.H.; Kling, G.W.; Marino, J.A.; Den Uyl, P.A.; Gossiaux, D.; Dick, G.J.; et al. Cyanobacterial harmful algal blooms are a biological disturbance to Western Lake Erie bacterial communities. Environ. Microbiol. 2017, 19, 1149–1162. [Google Scholar] [CrossRef] [PubMed]
- Carmichael, W.W. Health effects of toxin-producing cyanobacteria: “The CyanoHABs”. Hum. Ecol. Risk Assess 2001, 7, 1393–1407. [Google Scholar] [CrossRef]
- Huisman, J.; Codd, G.A.; Paerl, H.W.; Ibelings, B.W.; Verspagen, J.M.H.; Visser, P.M. Cyanobacterial blooms. Nat. Rev. Microbiol. 2018, 16, 471–483. [Google Scholar] [CrossRef] [PubMed]
- Sarma, S.; Nandini, S. Life history strategies of cladocerans: Comparisons of tropical and temperature taxa. Hydrobiologia 2005, 542, 315–334. [Google Scholar] [CrossRef]
- Yang, Z.; Li, C.; Zhang, S.; Sun, B. Temporal and spatial distribution of chlorophyll-a concentration and the relationships with TN, TP concentrations in Lake Ulansuhai, Inner Mongolia. J. Lake Sci. 2009, 37, 403–408. [Google Scholar]
- Jin, Y.; Yu, R.; Zhang, Z.; Zhang, Q.; Li, M.; Cao, Z.; Wu, L.; Hao, Y. Spatiotemporal variability of phytoplankton functional groups in a shallow eutrophic lake from cold, arid regions. Environ. Monit. Assess. 2020, 192, 371. [Google Scholar] [CrossRef]
- Shen, Y.; Huang, Y.; Hu, J.; Li, P.; Zhang, C.; Lin, L.; Xu, P.; Zhang, J.; Chen, X. The nitrogen reduction in eutrophic water column driven by Microcystis blooms. J. Hazard. Mater. 2019, 385, 121578. [Google Scholar] [CrossRef]
- Sługocki, Ł.; Czerniawski, R. Trophic state (TSISD) and mixing type significantly influence pelagic zooplankton biodiversity in temper-ate lakes (NW Poland). PeerJ 2018, 6, e5731. [Google Scholar] [CrossRef] [PubMed] [Green Version]
- Nandini, S.; Sarma, S.S.S. Population growth of some genera of cladocerans (Cladocera) in relation to algal food (Chlorella vulgaris) levels. Hydrobiologia 2003, 491, 211–219. [Google Scholar] [CrossRef]
- Nandini, S.; Picazo-Paez, E.A.; Sarma, S.S.S. The combined effects of heavy metals (copperand zinc), temperature and food (Chlorell vulgaris) level on the demographic characters of Moina macrocopa (Crustacea: Cladocera). J. Environ. Sci. Health Part A Toxic Hazard. Subst. Environ. Eng. 2007, 42, 1433–1442. [Google Scholar] [CrossRef]
- Kauler, P.; Enesco, H.E. The effect of temperature on life history parameters and cost of reproduction in the rotifer Brachionus calyciflorus. J. Freshw. Ecol. 2011, 26, 399–408. [Google Scholar] [CrossRef] [Green Version]
- Xi, Y.L.; Ge, Y.L.; Chen, F.; Wen, X.L.; Dong, L.L. Life history characteristics of three strains of Brachionus calyciflorus (Rotifera) at different temperatures. J. Freshw. Ecol. 2005, 20, 707–713. [Google Scholar] [CrossRef]
- Wu, J.; Yan, B.; Feng, Z.; Li, Y.; Shen, X. Zooplankton ecology near the tianwan nuclear power station. Acta Ecol. Sinica. 2011, 31, 6902–6911. [Google Scholar]
- Wang, Y.; He, Z.H. Effect of temperature and salinity on intrinsic increasing rate of Moina mongolica Daddy (Cladocera: Moinidae) population. J. Appl. Ecol. 2011, 12, 91–94. [Google Scholar]
- Schalau, K.; Rinke, K.; Straile, D.; Peeters, F. Temperature is the key factor explaining interannual variability of Daphnia development in spring: A modeling study. Oecologia 2008, 157, 531–543. [Google Scholar] [CrossRef] [PubMed]
- Fernández-Araiza, M.A.; Sarma, S.S.S.; Nandini, S. Combined effects of food concentration and temperature on competition among four species of Brachionus (Rotifera). Hydrobiologia 2005, 546, 519–534. [Google Scholar] [CrossRef]
- Espinosa-Rodríguez, C.A.; Sarma, S.S.S.; Nandini, S. Interactions between the rotifer Euchlanis dilatata and the cladocerans Alona glabra and Macrothrix triserialis in relation to diet type. Limnologica 2012, 42, 50–55. [Google Scholar] [CrossRef]
- Feniova, I.Y.; Budaev, S.V.; Dgebuadze, Y.Y. Simulation of cladoceran survival strategy under conditions of food depletion. Russ. J. Ecol. 2006, 37, 28–34. [Google Scholar] [CrossRef]
- Lampert, W.; Sommer, U. Limnoecology: The Ecology of Lakes and Streams; Oxford University Press: Oxford, UK, 2007. [Google Scholar]
- Dettmers, J.M.; Wahl, D.H. Evidence for zooplankton compensation and reduced fish growth in response to increased juvenile fish density. Hydrobiologia 1999, 400, 115–121. [Google Scholar] [CrossRef]
- Romare, P.; Bergman, E.; Hansson, L.A. The impact of larval and juvenile fish on zooplankton and algal dynamics. Limnol. Oceanogr. 1999, 44, 1655–1666. [Google Scholar] [CrossRef]
- Gilbert, J.J. Suppression of rotifer populations by Daphnia: A review of the evidence, the mechanisms, and the effects on zooplankton community structure. Limnol. Oceanogr. 1988, 33, 1286–1303. [Google Scholar] [CrossRef]
- Hurtado-Bocanegra, M.D.; Nandini, S.; Sarma, S.S.S. Combined effects of food level and inoculation density on competition between Brachionus patulus (Rotifera) and the cladocerans Ceriodaphnia dubia and Moina macrocopa. Hydrobiologia 2002, 468, 13–22. [Google Scholar] [CrossRef]
- Xi, Y.L.; Hagiwara, A. Competition between the rotifer Brachionus calyciflorus and the Cladoceran Moina macrocopa in relation to algal food concentration and initial rotifer population density. J. Freshw. Ecol. 2007, 22, 421–427. [Google Scholar] [CrossRef]
- Benincà, E.; Dakos, V.; van Nes, E.H.; Huisman, J.; Scheffer, M. Resonance of plankton communities with temperature fluctuations. Am. Nat. 2011, 178, E87–E95. [Google Scholar] [CrossRef] [PubMed]
- Sterner, R.W.; Hessen, D.O. Algal nutrient limitation and the nutrition of aquatic herbivores. Annu. Rev. Ecol. S 1994, 25, 1–29. [Google Scholar] [CrossRef]
- Elser, J.J.; Hayakawa, K.; Urabe, J. Nutrient limitation reduces food quality for zooplankton: Daphnia response to seston phosphorus enrichment. Ecology 2001, 82, 898–903. [Google Scholar] [CrossRef]
- Ferrao-Filho, A.; Arcifa, M.; Fileto, C. Resource limitation and food quality for cladocerans in a tropical Brazilian lake. Hydrobiologia 2003, 491, 201–210. [Google Scholar] [CrossRef]
- Persson, J.; Vrede, T.; Holmgren, S. Responses in zooplankton populations to food quality and quantity changes after whole lake nutrient enrichment of an oligotrophic subalpine reservoir. Aquat. Sci. 2008, 70, 142–155. [Google Scholar] [CrossRef]
- Langeland, A. Biomanipulation development in Norway. Hydrobiologia 1990, 200, 535–540. [Google Scholar] [CrossRef]
- George, D.G.; Edwards, R.W. Population dynamicsand produc-tion of daphnia hyaline in a eutrophic reservoir. Freshw. Biol. 1974, 4, 445–465. [Google Scholar] [CrossRef]
- Jarvis, A.C. Zooplankton community grazing in a hyper-trophic lake (Harbeespoort Dam, South Africa). Plankton Res. 1986, 8, 1065–1078. [Google Scholar] [CrossRef]
- Moore, M.V.; Folt, C.L.; Stemberger, R.S. Consequences of elevated temperatures for zooplankton assemblages in temperate lakes. Archiv. Hydrobiol. 1996, 135, 289–319. [Google Scholar]
- Liang, Y.; Ouyang, K.; Chen, X.; Su, Y.; Yang, J. Life strategy and grazing intensity responses of Brachionus calyciflorus fed on different concentrations of microcystin-producing and microcystin-free Microcystis aeruginosa. Sci. Rep. 2017, 7, 43127. [Google Scholar] [CrossRef] [Green Version]
- Fulton, R.S., III; Paerl, H.W. Effects of colonial morphologyon zooplankton utilization of algal resources during blue-green algal (Microcystis aeruginosa) blooms. Limnol. Oceanog. 1987, 32, 634–644. [Google Scholar] [CrossRef]
- Anders, F.A.; Lasse, R.; Stefan, B. Pyrosequencing reveals contrasting seasonal dynamics of taxa within Baltic Sea bacterioplankton communities. ISME J. 2010, 4, 171–181. [Google Scholar] [CrossRef] [Green Version]
- Riemann, L.; Steward, G.F.; Azam, F. Dynamics of bacterial community composition and activity during a mesocosm diatom bloom. Appl. Environ. Microbiol. 2000, 66, 578–587. [Google Scholar] [CrossRef] [Green Version]
- Niu, Y.; Shen, H.; Chen, J.; Xie, P.; Yang, X.; Tao, M.; Ma, Z.; Qi, M. Phytoplankton community succession shaping bacterioplankton community composition in Lake Taihu, China. Water Res. 2011, 45, 4169–4182. [Google Scholar] [CrossRef] [PubMed]
- Furman, J.A.; Azam, F. Bacterioplankton secondary production estimates for coastal waters of Birth Columbia, Antarctica and Southern California. Appl. Environ. Microbiol. 1989, 39, 1085–1095. [Google Scholar] [CrossRef] [PubMed] [Green Version]
- Ducklow, H.W. Factors regulating bottom-up control of bacteria biomass in open ocean plankton communities. Areh. Hydrobiol. Beih. 1992, 37, 207–217. [Google Scholar]
- Jennifer, C.; James, A.A.E.; Ellen, T.M. Utilization and turnover of labile dissolved organic matter by bacterial heterotrophs in eastern North Pacific surface waters. Mar. Ecol. Prog. Ser. 1996, 139, 267–279. [Google Scholar]
- Larsson, U.; Hagstrom, A. Phytopldnkton exuddte release as an energy source for the growth of peldgic bacteria. Mar. Biol. 1979, 52, 199–206. [Google Scholar] [CrossRef]
- Morris, D.P.; Lewis, W.M.J. Nutrient limitation of bacterioplankton growth in Lake Dillo, Colorado. Limnol. Oceanog. 1992, 37, 1179–1192. [Google Scholar] [CrossRef] [Green Version]
- Wang, L.; Miller, T.D.; Priscu, J.C. Bacterioplankton nutrient deficiency in a eutrophic lake. Arch. Hydrobiol. 1992, 125, 423–439. [Google Scholar]
- Toolan, T.; Wehr, I.D.; Findlay, S. Inorganic phosphorus stimulation of bacterioplankton production in a meso-eutrophic lake. Appl. Environ. Microbiol. 1991, 57, 2074–2078. [Google Scholar] [CrossRef] [Green Version]
- Muylaert, K.; van der Gucht, K.; Vloemans, N.; Meester, L.D.; Gillis, M.; Vyverman, W. Relationship between bacterial community composition and bottom-up versus top-down variables in four eutrophic shallow lakes. Appl. Environ. Microbiol. 2000, 66, 4740–4750. [Google Scholar] [CrossRef] [Green Version]
- Caron, D.A.; Lim, E.L.; Sanders, R.W.; Dennett, M.R.; Berninger, U.G. Responses of bacterioplankton and phytoplankton to organic carbon and inorganic nutrient additions in contrasting oceanic ecosystems. Aquat. Microb. Ecol. 2002, 22, 175–184. [Google Scholar] [CrossRef] [Green Version]
- Ji, B.; Qin, H.; Guo, S.; Chen, W.; Zhang, X.; Liang, J. Bacterial communities of four adjacent fresh lakes at different trophic status. Ecotoxicol. Environ. Saf. 2018, 157, 388–394. [Google Scholar] [CrossRef]
- Paerl, H.W. Transfer of N2 and CO2 fixation products from Anabaena oscillarioides to associated bacteria during inorganic carbon sufficiency and deficiency. J. Phycol. 1984, 20, 600–608. [Google Scholar] [CrossRef]
- Rashidan, K.K.; Bird, D.F. Role of predatory bacteria in the termination of a cyanobacterial bloom. Microb. Ecol. 2001, 41, 97–l05. [Google Scholar] [CrossRef]
- Pinhassi, J.; Sala, M.M.; Havskum, H.; Peters, F.; Guadayol, O.; Malits, A.; Marrase, C. Changes in bacterioplankton composition under different phytoplankton regimens. Appl. Environ. Microbiol. 2004, 70, 6753–6766. [Google Scholar] [CrossRef] [Green Version]
- Bezek, K.D.; Nipič, D.; Torkar, K.G.; Oder, M.; Dražić, G.; Abram, A.; Žibert, J.; Raspor, P.; Bohinc, K. Biofouling of stainless steel surfaces by four common pathogens: The effects of glucose concentration, temperature and surface roughness. Biofouling 2019, 35, 273–283. [Google Scholar] [CrossRef] [PubMed]
- Suzuki, K.; Minami, C.; Liu, H.; Saino, T. Temporal and spatial patterns of chemotaxonomic algal pigments in the subarctic Pacific and the Bering Sea during summer 1999. Deep-Sea Res. II 2002, 49, 5685–5704. [Google Scholar] [CrossRef]
- Ger, K.A.; Hansson, L.-A.; Lürling, M. Understanding cyanobacteria-zooplankton interactions in a more eutrophic world. Freshw. Biol. 2014, 59, 1783–1798. [Google Scholar] [CrossRef] [Green Version]
- Chotiyaputta, C.; Hirayama, K. Food selectivity of the rotifer Brachionus plicatilis feeding on phytoplankton. Mar. Biol. 1978, 45, 105–111. [Google Scholar] [CrossRef]
- Löder, M.G.J.; Meunier, C.; Wiltshire, K.H.; Boersma, M.; Aberle, N. The role of ciliates, heterotrophic dinoflagellates and copepods in structuring spring plankton communities at Helgoland Roads, North Sea. Mar. Biol. 2011, 158, 1551–1580. [Google Scholar] [CrossRef] [Green Version]
- Shapiro, J.; Lamarra, V.; Lynch, M. Biomanipulation: An ecosystem approach to lake restoration. In Proceedings of a Symposium on Water Quality Management through Biological Control; Brezomik, P.L., Fox, J.L., Eds.; University of Florid: Gainesville, FL, USA, 1975; pp. 85–89. [Google Scholar]
- Xie, P.; Liu, J. Practical Success of Biomanipulation using Filter-feeding Fish to Control Cyanobacteria Blooms. Sci. World 2001, 1, 337–356. [Google Scholar]
- Benndorf, J.; Kneshke, H.; Kossatz, K.; Penz, E. Manipulation of the pelagic food web by stocking with predacious fishes. Int. Rev. Gesamten Hydrobiol. 1984, 69, 407–428. [Google Scholar] [CrossRef]
- Jurajda, P.; Adámek, Z.; Janáč, M.; Špaček, J. Use of multiple fish-removal methods during biomanipulation of a drinking water reservoir—Evaluation of the first four years. Fish. Res. 2015, 173, 101–108. [Google Scholar] [CrossRef]
Figure 1.
The location of three sampling sites in Lake Nanhu, Wuhan, China.

Figure 2.
Variation of environmental conditions in Lake Nanhu during non-bloom and bloom period. Changes in temperature (A), pH (B), dissolved oxygen (C), total nitrogen (D), total phosphorus (E), nitrate (D), nitrite (E), phosphate (F) and ammonia (F) throughout the year.
Figure 2.
Variation of environmental conditions in Lake Nanhu during non-bloom and bloom period. Changes in temperature (A), pH (B), dissolved oxygen (C), total nitrogen (D), total phosphorus (E), nitrate (D), nitrite (E), phosphate (F) and ammonia (F) throughout the year.

Figure 3.
Redundancy analysis of plankton community composition and environment factors. T: Temperature; P1: Cyanophyta; P2: Pyrrophyta; P3: Crytophyta; P4: Bacillariophyta; P5: Euglenophyta; P6: Chlorophyta; Z1: Cladoceran; Z2: Copepod (Mesocyclops leuckarti); Z3: Rotifer; Z4: Protozoan.
Figure 3.
Redundancy analysis of plankton community composition and environment factors. T: Temperature; P1: Cyanophyta; P2: Pyrrophyta; P3: Crytophyta; P4: Bacillariophyta; P5: Euglenophyta; P6: Chlorophyta; Z1: Cladoceran; Z2: Copepod (Mesocyclops leuckarti); Z3: Rotifer; Z4: Protozoan.

Figure 4.
Variation of abundance on plankton in Lake Nanhu during non-bloom and bloom period. The density on phytoplankton (A) and zooplankton (B) in Lake Nanhu.
Figure 4.
Variation of abundance on plankton in Lake Nanhu during non-bloom and bloom period. The density on phytoplankton (A) and zooplankton (B) in Lake Nanhu.

Figure 5.
The relative abundance of different accessory pigments (Fucoxanthin, Peridinin, Zeaxanthin, Alloxanthin, Lutein, and Violaxanthin) during non-bloom and bloom period in Lake Nanhu.
Figure 5.
The relative abundance of different accessory pigments (Fucoxanthin, Peridinin, Zeaxanthin, Alloxanthin, Lutein, and Violaxanthin) during non-bloom and bloom period in Lake Nanhu.

Figure 6.
Community composition and relative abundance of bacteria. Classification structure and relative abundance in each water sample from Lake Nanhu (A) at the phylum level and (C) at the order level. At the specific level, “Others” means those that account for less than 1% of the total OTUs in each sample. In the overall distribution of bacteria at the phylum level (B) and at the order level (D) in each water sample, the bar graph represents the proportion of each bacterial phylum’s or order’s abundance in the samples. The difference in bacterial abundance was significant with a p-value of <0.05. * p < 0.05; ** p < 0.01; *** p < 0.001. S1, S2, and S3: surface water samples. (A–C) represent March, May, and November respectively.

Figure 7.
Variation of microzooplankton grazing on size specific phytoplankton (20–200 μm, 5–20 μm, and <5 μm) during non-bloom and bloom period. The (A) growth rates and (B) grazing rates of the three kinds of phytoplankton with different particle sizes. The grazing pressure of microzooplankton on size specific phytoplankton (C) standing stocks (Pi) and (D) primary productivity (Pp).

Figure 8.
Variation of microzooplankton grazing on pigment specific phytoplankton (Peridinin, Fucoxanthin, Zeaxanthin, Alloxanthin, Lutein, and Violaxanthin) during non-bloom and bloom period. The (A) growth rates, (B) grazing rates and (E) grazing preference index of phytoplankton with different pigments. The grazing pressure of microzooplankton on pigment specific phytoplankton (C) standing stocks (Pi) and (D) primary productivity (Pp).


Table 1.
Bacterial abundance and diversity in the two period of South Lake.
| Sample Time | Sample ID | Assigned Reads | 97% Similarity | ||||
|---|---|---|---|---|---|---|---|
| OTUs | Shannon | Chao1 | Ace | Coverage | |||
| March | S1 | 38,094 | 584 | 4.7549 | 757.109 | 725.66 | 0.996614 |
| S2 | 32,198 | 678 | 4.7303 | 826.061 | 755.73 | 0.995341 | |
| S3 | 31,849 | 737 | 4.6504 | 673.0171 | 664.86 | 0.996326 | |
| May | S1 | 32,367 | 691 | 4.4499 | 867.581 | 858.64 | 0.994161 |
| S2 | 33,210 | 844 | 4.4581 | 970.068 | 910.42 | 0.993767 | |
| S3 | 32,352 | 939 | 4.5401 | 953.432 | 944.28 | 0.993447 | |
| November | S1 | 32,773 | 1455 | 6.0961 | 1507.468 | 1492.73 | 0.994845 |
| S2 | 29,682 | 1550 | 6.1652 | 1569.113 | 1529.79 | 0.995332 | |
| S3 | 36,060 | 1595 | 6.1025 | 1568.609 | 1535.84 | 0.995563 | |
Notes: S1, S2, and S3: surface water samples. OTUs: Operational taxonomic units, Shannon: the Shannon estimator, Chao1: the Chao 1 estimator, Ace: the Ace estimator, Coverage: the Good’s coverage.
Publisher’s Note: MDPI stays neutral with regard to jurisdictional claims in published maps and institutional affiliations. |
© 2021 by the authors. Licensee MDPI, Basel, Switzerland. This article is an open access article distributed under the terms and conditions of the Creative Commons Attribution (CC BY) license (https://creativecommons.org/licenses/by/4.0/).
Share and Cite
MDPI and ACS Style
Han, M.; Dong, C.; Ma, S.; Feng, C.; Lei, C.; Gu, Z.; Liu, X. Food Web Responses to a Cyanobacterial Bloom in a Freshwater Eutrophic Lake. Water 2021, 13, 1296. https://doi.org/10.3390/w13091296
AMA Style
Han M, Dong C, Ma S, Feng C, Lei C, Gu Z, Liu X. Food Web Responses to a Cyanobacterial Bloom in a Freshwater Eutrophic Lake. Water. 2021; 13(9):1296. https://doi.org/10.3390/w13091296
Chicago/Turabian StyleHan, Mengqi, Chenchen Dong, Siqi Ma, Cui Feng, Chengqiang Lei, Zemao Gu, and Xiangjiang Liu. 2021. "Food Web Responses to a Cyanobacterial Bloom in a Freshwater Eutrophic Lake" Water 13, no. 9: 1296. https://doi.org/10.3390/w13091296
Note that from the first issue of 2016, this journal uses article numbers instead of page numbers. See further details here.