Article

Effect of Restoration Actions on Organic Carbon Pools in the Lagoon—Delta Ciénaga Grande de Santa Marta, Colombian Caribbean

by
Laura Victoria Perdomo-Trujillo
1,*,
Jose Ernesto Mancera-Pineda
2,
Jairo Humberto Medina-Calderón
1,3,
David Alejandro Sánchez-Núñez
1 and
Marie-Luise Schnetter
4
1
Instituto de Estudios en Ciencias del Mar–CECIMAR, Universidad Nacional de Colombia, Sede Caribe, Calle 25 No. 2-55, Playa Salguero, Santa Marta 470006, Colombia
2
Departamento de Biología, Facultad de Ciencias, Universidad Nacional de Colombia, Sede Bogotá, Carrera 45 No. 26-85, Bogotá D.C. 111321, Colombia
3
Unidad de Docencia y Formación, Universidad Nacional de Colombia, Sede Caribe, Jardín Botánico de San Andrés Harmoni Hall Hill, San Andrés 880001, Colombia
4
Institut für Botanik, Justus-Liebig-Universität, c/o HHA, Senckenbergstraße 17, 35390 Giessen, Germany
*
Author to whom correspondence should be addressed.
Water 2021, 13(9), 1297; https://doi.org/10.3390/w13091297
Submission received: 11 April 2021 / Revised: 1 May 2021 / Accepted: 3 May 2021 / Published: 6 May 2021

Abstract

:
Mangroves provide multiple ecosystem services and are essential for mitigating global warming owing to their capacity to store large carbon (C) stocks. Due to widespread mangrove degradation, actions have been implemented to restore them worldwide. An important representative case in Colombia is the Ciénaga Grande de Santa Marta’s restoration plan. This management intervention focused on restoring the natural hydrological functioning after massive mangrove mortality (~25,000 ha) due to soil hyper-salinization after river water input from the Magdalena River was eliminated. A partial recovery occurred during subsequent years, and hydrological management is still being implemented today. To understand how the degradation and subsequent management have affected mangrove C stocks, we compared C stocks in stands with different intervention levels reflected in their current forest structure. We found that the total C stock (398–1160 Mg C ha−1) was within the range measured in other neotropical mangroves without vegetation deterioration. The aboveground C was significantly higher in the stands where hydraulic connectivity was restored. By contrast, the belowground C was higher in the stands with low hydraulic connectivity due to channel clogging and a lack of sufficient maintenance. Our results show that hydrological management measures influenced above- and belowground C stocks, even at a 2 m depth. In addition, a strong indirect relationship useful for estimating carbon content from organic matter content was found.

1. Introduction

Mangroves provide numerous ecosystem services, including their extraordinary capacity to store and retain carbon (C) [1,2]. These ecosystems can store up to five times the amount of C present in tropical forests [3]. Kauffman and Bhomia [4] and Bindoff et al. [5] showed that, on a global scale, mangrove C stocks vary between 50 and 2200 Mg C ha−1. Mangroves store large amounts of C owing to several mechanisms. The high productivity of mangroves is a source of autochthonous organic debris, and their ability to reduce water flow energy favors the accumulation of autochthonous and allochthonous particles by increasing sedimentation and reducing resuspension [6,7]. Additionally, their soils saturated with water remain in an anaerobic state, preventing the degradation of organic matter, and promoting its accumulation [1,8,9].
The conversion of mangrove to other uses, in addition to causing the loss of other ecosystem services, causes biomass (C) loss and changes in hydrological patterns that expose soils to the atmosphere, causing their oxidation, releasing CO2 and other greenhouse gases [1,10]. It has been estimated that mangrove deforestation generates approximately 10% of global deforestation emissions, even though they occupy only 0.7% of the tropical forest area [11]. Between 1996 and 2006, there was a net loss of more than 600,000 ha of mangroves globally, mainly due to urban expansion, aquaculture, agriculture and hydrological disturbances [12,13,14]. The global mangrove deforestation rate has declined since the 1980s, a decade when 187,000 ha of forest were lost, approximately 1.0% of cover loss per year [15]. Despite mangrove cover remaining unchanged in many countries between 2000 and 2002, the global deforestation rate remained high (0.1–0.4% per year) due to high deforestation rates in the Southeast Asia region, where half of the planet’s mangrove forests are located [16]. Threats of land use change continue to exert strong pressure on these ecosystems, reducing and fragmenting their area, putting at risk their long-term sustainability and the ecosystem services they provide [11,17].
The negative environmental, climatic and social impacts of mangrove loss have led to the development of restoration actions worldwide. In Colombia, the largest restoration effort took place in the 1990s, in the Ciénaga Grande de Santa Marta (CGSM), the largest lagoon-coastal complex in the Colombian Caribbean after the death of 24,624 ha of forest over 43 years [18]. The CGSM is recognized as one of the most productive coastal lagoons in tropical latitudes [18,19,20]. After reconnection of the mangroves with the Magdalena River, mangroves have experienced episodes of cover recovery and of cover loss. Such oscillatory behavior is mainly associated with changes in soil salinity generated by new alterations in the hydrological balance of the system and by the influence of strong ENSO events [21,22].
Evaluating the comprehensive success of mangrove restoration depends on achieving better monitoring mechanisms beyond the purely structural and functional criteria of the forests. Therefore, this study aimed to assess how past restoration actions and current management interventions in CGSM have influenced the above- and belowground C stocks of basin mangroves. In addition, the economic value of the C stored in the study sites is estimated as a tool that can be used for the management and conservation of the areas.

2. Materials and Methods
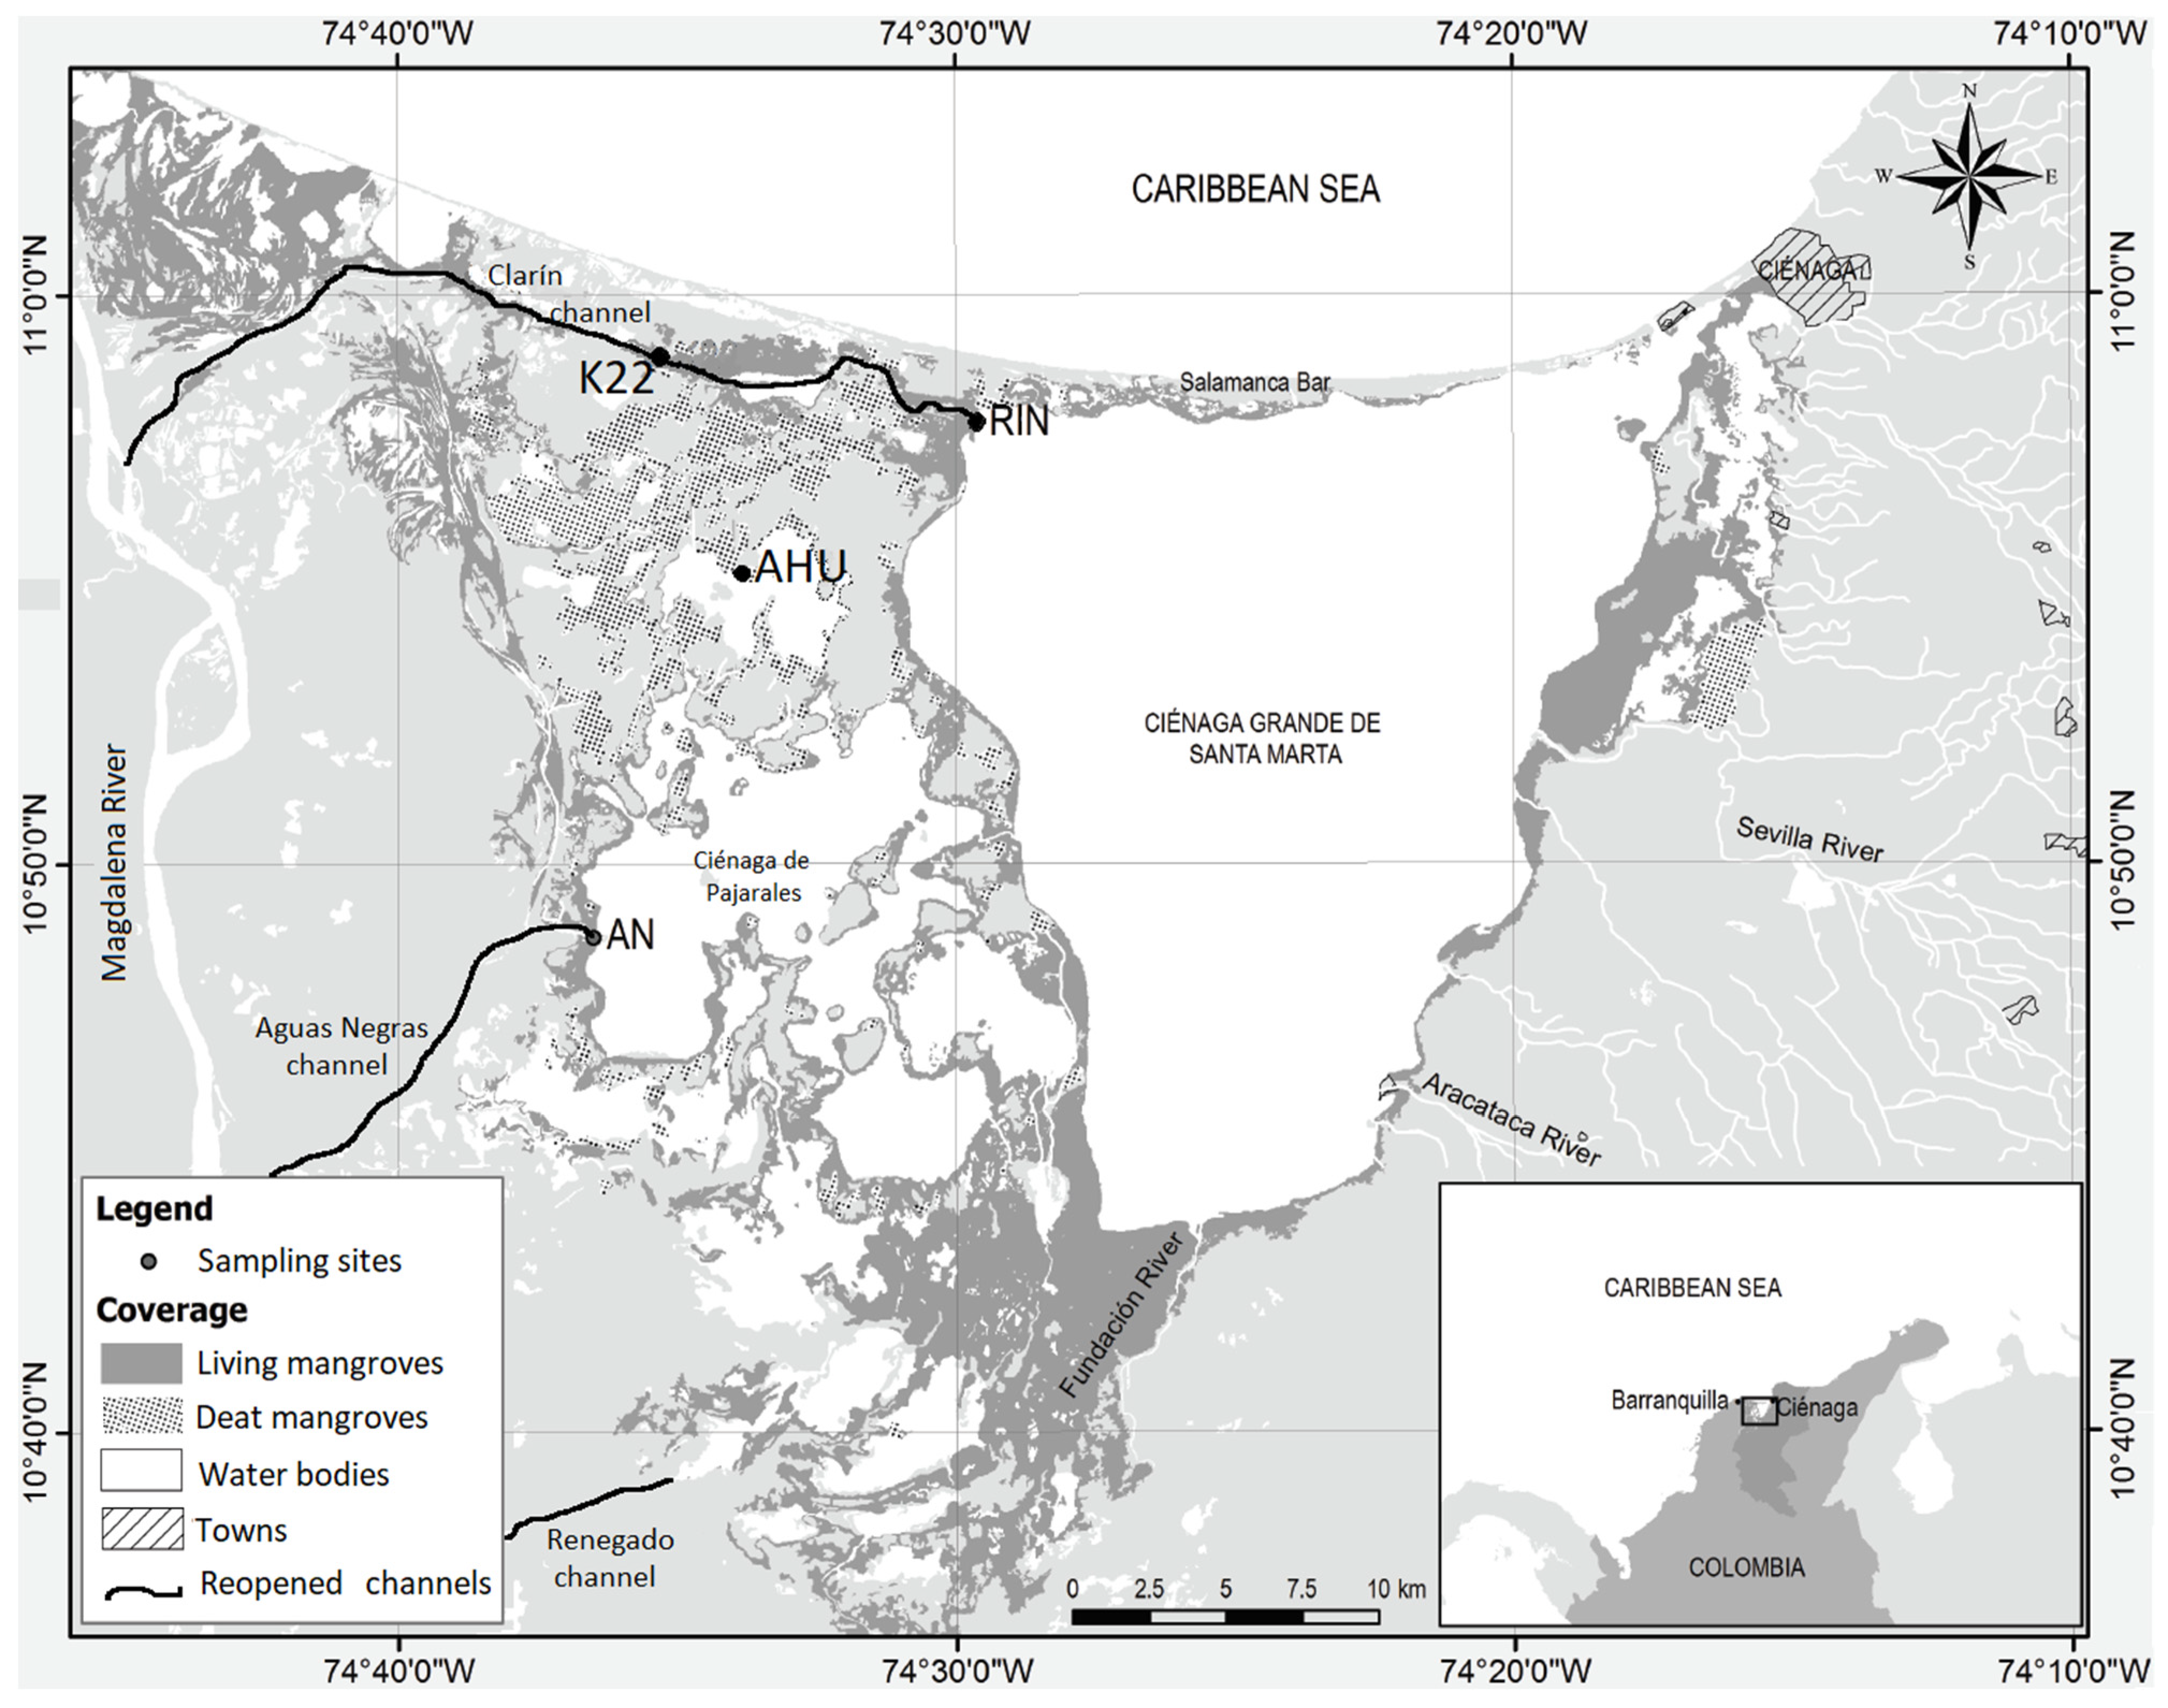
2.1. Study Area

La Ciénaga Grande de Santa Marta (CGSM) is an estuarine lagoon system located on the central Caribbean coast of Colombia (10°30′–11°15′ N, 74°15′–74°45′ W). Geomorphologically, it is part of the deltaic plain of the Magdalena River [23], the largest river in Colombia with an annual average water discharge of 7200 m3 s−1 and 144 × 106 t yr−1 of sediment [24]. Limited to the east by the Sierra Nevada de Santa Marta (the highest coastal mountain in the world), to the north by the Caribbean Sea, from which it is separated by the Salamanca barrier island, and to the west and south west by the Magdalena River floodplain [18,25,26] (Figure 1). The delta and the CGSM rests on a coastal plain, which was formed by marine and fluvial sedimentary deposition during the Holocene transgression and regression phases (beginning about 10,000 B.P.), while the surrounding formations date back to the Cenozoic era. The lagoon complex (1321 km2) comprises the Ciénaga Grande (450 km2), the Ciénaga de Pajarales (120 km2), several smaller lagoons, creeks, and channels (150 km2), and mangrove swamps [22,23].
The climate of the area is tropical semi-arid, with a dry period from December to March and a rainy period for the rest of the year, periods greatly influenced by years with El Niño or La Niña events [27]. The maximum precipitation occurs in October, and in general, during the year, the region has a water deficit due to evaporation (1953.8 mm yr−1) exceeding precipitation values (mean = 807 mm yr−1) [26,27]. Given the wide variety of environments in the delta-lagoon system covering approximately 130,000 ha [22], vegetation in the area ranges from tropical thorn bush and wetland forest stands growing near the rivers in soils that are periodically flooded, to wetland and halophytes herbaceous vegetation and mangroves; the latter considered the most important vegetation type in the area [28,29].
The CGSM, with a primary production value of 5.76 g C m−2 d−1 [19], is one of the most productive coastal lagoons in the world [20]. It is the economic support of seven fishing villages with a total population of close to 20,000 people. Due to its ecological and socioeconomic relevance, the area includes several special management zones such as the Parque Isla de Salamanca, the CGSM Fauna and Flora Sanctuary, and the Exclusive Reserve Zone (the CGSM main coastal lagoon and the Complejo de Pajarales lagoons). It was also declared a Ramsar Wetland, a Biosphere Reserve, and an area of international importance for bird conservation (IAICA) [30,31].
Mangrove forests in CGSM covered 51,150 ha until 1956, but a continuous die-off that lasted 40 years reduced the forests by approximately 24,624 ha. This massive death of mangroves was due to a series of physical alterations made worse by climatic effects. The physical alterations were caused by (1) the construction of the Barranquilla-Ciénaga highways, on the Salamanca Bar between 1956 and 1960, and Palermo-Sitio Nuevo, marginal to the Magdalena River, on the eastern bank, in the 1970s, without considering the communication between the river and the CGSM; (2) the construction of dikes and embankments to prevent the overflowing of the Magdalena River and the flow of freshwater from the river to the lagoon complex; (3) sedimentation/obstruction of the culverts coming from the Magdalena River and the mouths of the Sierra Nevada de Santa Marta (SNSM) rivers as a consequence of erosion due to deforestation in the basins; (4) a decrease in the flow of the SNSM rivers due to the collection of water for the irrigation districts; and (5) soil compaction for agriculture and livestock [32]. The main direct consequence of these physical alterations was the breakdown of the hydrological balance of the entire system due to the interruption of freshwater flows from the rivers to the lagoon system and of marine and estuarine water from and to the Caribbean Sea and the swamps across the Salamanca Bar. On the other hand, El Niño southern oscillation (ENSO) triggers lower precipitation along the Magdalena River catchment during El Niño years and higher precipitation during La Niña years that influence CGSM salinity [24,27,33,34]. The loss of hydrologic connectivity in CGSM occurred during an average neutral ENSO condition; this combination generated a high mangrove coverage loss that accumulated for many years in this dry climate region [7].
In an area as semi-arid as CGSM, where evapotranspiration far exceeds precipitation, mangrove trees with 20 m heights and 65 cm in diameters [35], indicate a freshwater subsidy. This case was mainly from the Magdalena River, on which the function of the system largely depends. The hydrological imbalance in the entire system is mainly reflected in the extreme hyper-salinization of the mangrove soils [18,26,36] and in the progressive increase in the salinity of the water bodies. Much of the soils exhibited interstitial water salinities greater than 100 for 8 months of the year. The soil hyper-salinization was identified as the main cause of the massive mortality of the mangroves, and it was shown that there is an inverse relationship between the salinity of the soil and the basal area of the mangrove in some sites [36]. The rate of mangrove loss gradually increased from 1.75 km2 yr−1 from 1956 to 1968, to 9.8 km2 yr−1 from 1968 to 1987, to 13.3 km2 yr−1 from 1987 to 1993, and to 18.4 km2 yr−1 between 1993 and 1995 [37,38]. The loss of mangroves caused dramatic consequences in the CGSM, including the loss of biodiversity associated with the forest. While in conserved mangrove areas an average of 29 species of birds, 32 species of fish and 50 species of invertebrates were recorded, in dead mangrove only 19 species of birds, 14 species of fish and 5 species of invertebrates were found [39]. In addition to extensive mangrove mortality, several fish kills caused by low oxygen concentrations and eutrophication have occurred during recent years [40].
With the intention of restoring the historical hydrological conditions, in 1992 the Project for the Rehabilitation of the CGSM (ProCiénaga) was initiated, with the reopening of 5 pre-existing channels that connected the Magdalena River with the mangrove areas, 3 of which have a direct effect on the areas of high mangrove mortality: Clarín, Renegado and Aguas Negras [18] (Figure 1). With the reestablishment of water inflows, the mangrove began to regenerate naturally, and by 2013 it was estimated that approx. 14,000 ha. had recovered [41]. After the ProCiénaga Project, the local environmental authority took over the maintenance and cleaning of canals, which has been done sporadically. Since 2014, mangrove dieback episodes have occurred due to the lack of canal maintenance and a prolonged drought associated with the strong El Niño event of 2015 and 2016 [31]. Within the measures taken to mitigate the new mangrove deterioration, a hydraulic recovery campaign was executed between 2016 and 2019 [42]. The campaign began in 2016 with the dredging of pre-existing channels, including those that had been reopened with the ProCiénga Project. In the case of the Clarín channel, the recovery included, in addition to dredging, the clearing of weeds (aquatic macrophytes) and the construction of lateral channels of the fishbone type. In 2017, channels were reopened in the northwestern sector of the Ciénaga (Caleta del Tambor, Bristol, Covado, Machetico, Covado 2); in 2018, the Clarín channel had its first two kilometers newly dredged in the area of Vía Parque Isla de Salamanca, and in 2019, maintenance was performed at the mouth of rivers that reach the eastern part of the Ciénaga Grande [42].
For this study, we selected four sites with different intervention levels located on the west side of the CGSM. RIN is in the northeastern corner of the main water body of the CGSM and close to the mouth of the Clarín channel (Figure 1). The forest here is composed of Avicennia germinans (L.) L., Laguncularia racemosa (L.) C.F. Gaertn and Rhizophora mangle L., with the former being the dominant species. RIN was not affected by the massive mangrove mortality of the 1970s. Although in this site some large trees have died, the forest structure has been relatively stable over the years, with a basal area (BA) = 34.1 m2 ha−1 [41]. K22 is located around the middle of the Clarín channel course. This site lost approximately 70% of its forest cover during the massive mortality (BA = 2 m2 ha−1 by 1990) and recovered after the opening of the freshwater channels (BA = 27.2 m2 ha−1 by 2013) [41,43]. All three common mangrove species are present. K22 has been directly influenced by the opening of the Clarín channel during the ProCiénaga project and by maintenance dredging operations. Since 2014, it has again had massive mangrove mortality. AN site is located to the southwest of CGSM system, 200 m to the south of the Aguas Negras channel mouth (Figure 1). This area, which was named AN according to the initials of the channel, lost 90% of its mangrove cover (BA = 0.1 m2 ha−1; [35]). After the ProCiénaga project, the mangrove forest recovered and by 2014 had a BA of 27.3 m2 ha−1 [41], with A. germinans, L. racemosa, and R. mangle trees. Finally, a site (AHU) located in the northern margin of the Ciénaga La Ahuyama (AHU) that experienced 100% tree mortality is indirectly influenced by the canals opened by the ProCiénaga project. No forest regeneration has been observed in AHU after the mangrove dieback [44,45].

2.2. Ecosystem C Stock

This study estimated the organic carbon (OC) stock in trees, living pneumatophores, living roots, and soil. The tree component is considered highly vulnerable, while the soil component has been described as the main carbon stock present in mangroves [46]. Direct field measurements of pneumatophores and belowground roots were also carried out because their contribution to total C stocks is usually estimated from allometric equations developed in sites with different conditions [47].

2.2.1. Carbon Stocks in Trees

In each study site, we delimited 20 × 30 m plots located 30 m from water bodies (coastal lagoons or channels). In RIN, where A. germinans predominates, we established two plots. In K22 and AN, there are stands where A. germinans or L. racemosa predominates, and therefore we established two plots in each of these stands. C in trees was not considered in AHU because it still does not have adult mangrove vegetation. In each plot, we counted and measured the stem diameter at breast height (DBH) of individuals with DBH equal to or greater than 2.5 cm during February of 2017. Based on these data, we estimated tree density and basal area (BA) according to Cintrón and Schaeffer-Novelli [48]. Aboveground biomass was estimated from the allometric equations developed for A. germinans and L. racemosa in Bahia de Cispatá and San Andres island, respectively [49,50]. The Bahia de Cispatá (Sinú River Delta) and San Andres Island are in the Colombian Caribbean. Carbon content in trees was estimated by multiplying the aboveground biomass by 0.48 as recommended by Kauffman and Donato [46].

2.2.2. Root Carbon Stocks

Root sampling was carried out during December 2016 and January 2017 in five 25 × 25 cm subplots located in the center and corners of one of the 20 × 30 m plots used to estimate the tree structures per site (RIN) or per species and site (K22 and AN). C in roots was not considered in AHU because it remains without adult mangrove vegetation. Inside subplots, pneumatophores were collected with adventitious roots attached to them (“feeding roots” according to Angeles et al. [51]). Belowground roots were collected close to each subplot using a PVC coring device [52,53,54], obtaining samples 10.2 cm in diameter and 1 m in length. Samples were stored in labeled plastic bags and transported on ice to the laboratory. Collected pneumatophores were separated into living and dead according to texture, appearance, and floatability. On the other hand, the core samples were washed through a 1 mm sieve to separate roots from sediments and other materials. Then, living and dead roots were differentiated by floatability [54], texture, and color. Living pneumatophores and belowground roots were packed separately in paper bags and then dried at 60° to constant weight [46]. Soil coring is impaired in zones where large roots are present, and therefore roots above 20 mm were not considered in the study.
Ten and fifteen samples for each root structure (pneumatophores and belowground roots) were extracted in L. racemosa and A. germinans, respectively, for the percentage of C content estimation. Samples were dried at 60 °C up to a constant weight, homogenized with a tissue pulverizer (Retsch, GmBH & Co., Haan, Germany), and processed in an elemental analyzer (Eurovector EA 3000, Pavia, Italy). C stocks (Mg C ha−1) were estimated by multiplying belowground root biomass and pneumatophore biomass by the percentage of C content of each root structure.

2.2.3. Soil Carbon Stocks

Three soil cores were extracted in one 20 × 30 m plot per site (RIN and AHU) or per species and site (K22 and AN) up to a depth of 2 m with a 5 cm-diameter Russian peat borer during December 2016 (RIN, K22 and AN) and August 2017 (AHU). Cores were extracted in opposite corners and the center of plots. The cores were divided into 10 cm segments in the first meter, while from 1 to 2 m depth, they were divided into four segments (100–115, 115–130, 130–150, and 150–200 cm). From these segments, a subsample of 10 cm was taken in the middle point of the segment. Samples were stored in labeled plastic bags and transported on ice to the laboratory for organic matter, bulk density, and carbon content estimation.
In the laboratory, samples were dried at 60 °C up to a constant weight. Bulk density was estimated by dividing the sample dry weight by the sample volume according to Kauffman and Donato [46]. Organic matter (OM) content was estimated by the combustion of 1 g of soil sample at 500 °C for two hours [55]. Soil samples were previously pulverized using a FRITSCH Analisette 3 SPARTAN-Pulverisette 0, after the removal of wood debris, rocks, and shells. C content was estimated in each of the ten segments in the first meter of soil with an elemental analyzer (Eurovector EA 3000., Pavia, Italy) using samples of 10 to 20 mg. Prior to OC analyses, samples were acidified with HCL 1 M for carbonate removal. C content analyses were carried out at Leibniz Centre for Tropical Marine Research—ZMT in Bremen-Germany. C from 1 to 2 m depth was estimated by exploring significant relationship between soil properties variables and % of C. A detailed description of these analyses is shown in the statistical analysis section. The results of % C were converted into Mg C ha−1 as recommended by Kauffman and Donato [46], using bulk density and soil segment length. C stocks in the two first meters of soil were estimated by summing C content of all soil segments. Then, C stocks per site were estimated by averaging the C stocks values of different cores extracted (RIN = 3; K22 = 6; AN = 6; AHU = 3). Soil depth in each site was measured with a stainless still rod of 0.25″ and 6 m length that was inserted into the soil four times within each plot to parent rock.
The mangrove C stocks per site were estimated according to Kauffman and Donato [46] by summing the value of each component (trees, pneumatophores, belowground roots, and soil) and by estimating the standard error of the sum.

2.3. Statistical Analyses

To estimate difference in the C stock among sites, we ran one-way ANOVAs. Data normality was verified with the Shapiro–Wilk test using ANOVA residuals, and the homoscedasticity was verified with the Bartlett test. When significant differences were found in the ANOVA test, we used the post hoc Tukey test to identify which treatment comparisons showed significant differences. The non-parametric Kruskal–Wallis test was used to compare C content between sites of belowground roots and pneumatophores owing to the violation of the homoscedasticity assumption. We used a significance level of α < 0.05. Analyzes were run with R-3.5.1 for Windows. In addition, we ran simple regression analysis between the organic matter content (%) and bulk density as predictors of the C (%) obtained from 0 to 1 m soil samples.

3. Results

3.1. Carbon Stocks in Trees

We found a mature forest in RIN, with low tree density and dominated by A. germinans with individuals up to 40 cm DBH (Table 1). This site had the highest BA (27.1 ± 0.5 m2 ha−1) and tree biomass (212.6 ± 3.8 Mg ha−1). In the restored sites of K22 and AN, tree density was higher and dominated by A. germinans or L. racemosa, and DBH was lower in comparison to RIN (up to 35 cm of DBH). Tree biomass in K22 was 94.3 ± 12.1 Mg ha−1, while in AN it was 153.2 ± 11.8 Mg ha−1. As described in the study area section, the AHU site has not recovered its mangrove coverage since the massive forest mortality of the 1970s and 1980s. The carbon stocks in trees were significantly different between sites (F = 40.9; df = 3; p < 0.05) and were between 45.2 ± 5.8 (K22) and 102.1 ± 1.8 Mg C ha−1 (RIN). RIN had the largest tree biomass and therefore the largest aboveground C stock, followed by AN, K22, and AHU (Table 1).

3.2. Root Carbon Stocks

The percentage of C in A. germinans and L. racemosa pneumatophores was 45 ± 0.6% and 43 ± 0.8%, respectively. On the other hand, belowground roots had a lower C percentage: 37 ± 1.4% for A. germinans and 42 ± 0.1% for L. racemosa. Considering these values for the percentage of C and the root biomass structure, the C content of pneumatophores was significantly higher in RIN, the conserved site, compared to restored sites (F = 7.43; df = 2; p < 0.05) (Table 2). In addition, belowground roots did not demonstrate significant differences among sites (χ2 = 5.47; df = 2; p < 0.05).

3.3. Soil Carbon Stocks

In the first meter, the average soil bulk density (BD) was between 0.18 ± 0.01 (g cm−3) in AHU and 0.57 ± 0.08 (g cm−3) in RIN. As for organic matter (OM) content, the lowest average value occurred in RIN (15.3%) and the highest occurred in AHU (47.46%). A strong and positive relationship was observed between % OM and % OC in the samples collected at the study sites in the first meter of soil (r2 = 0.96; p = 0.001; Figure 2). According to the linear model, 96.14% of OC variability can be explained by the OM content (%). On the other hand, an equally strong but negative exponential relationship was observed between BD and % OC concentration (Figure 3). Since the relationship between the OM and % OC values of the soil samples at one meter had a higher coefficient of determination than the BD vs. % OC relationship, the first relationship was used to estimate the OC concentration of the second meter of soil.
The elemental analyzer results for the first meter showed that the OC ranged between 1.6% (at a 70 cm depth in RIN) and 26% (the first 10 cm in AHU). In addition, the inorganic carbon of the soil segments was lower than 1% in all the sites. On the other hand, the estimation of the C content in the second meter of soil had values between 0.2% (at a 150–200 cm depth in RIN) and 36% (at 115–130 cm in K22). The soil OC at 0–1 m depth was significantly different among all the sites, while at 0–2 m, it was only significantly higher in K22 in relation to other sites (F = 262.9; df = 3; p < 0.05) (Table 3). The soil depth to bedrock ranged between 2.2 m in AN and 4.4 m in RIN.

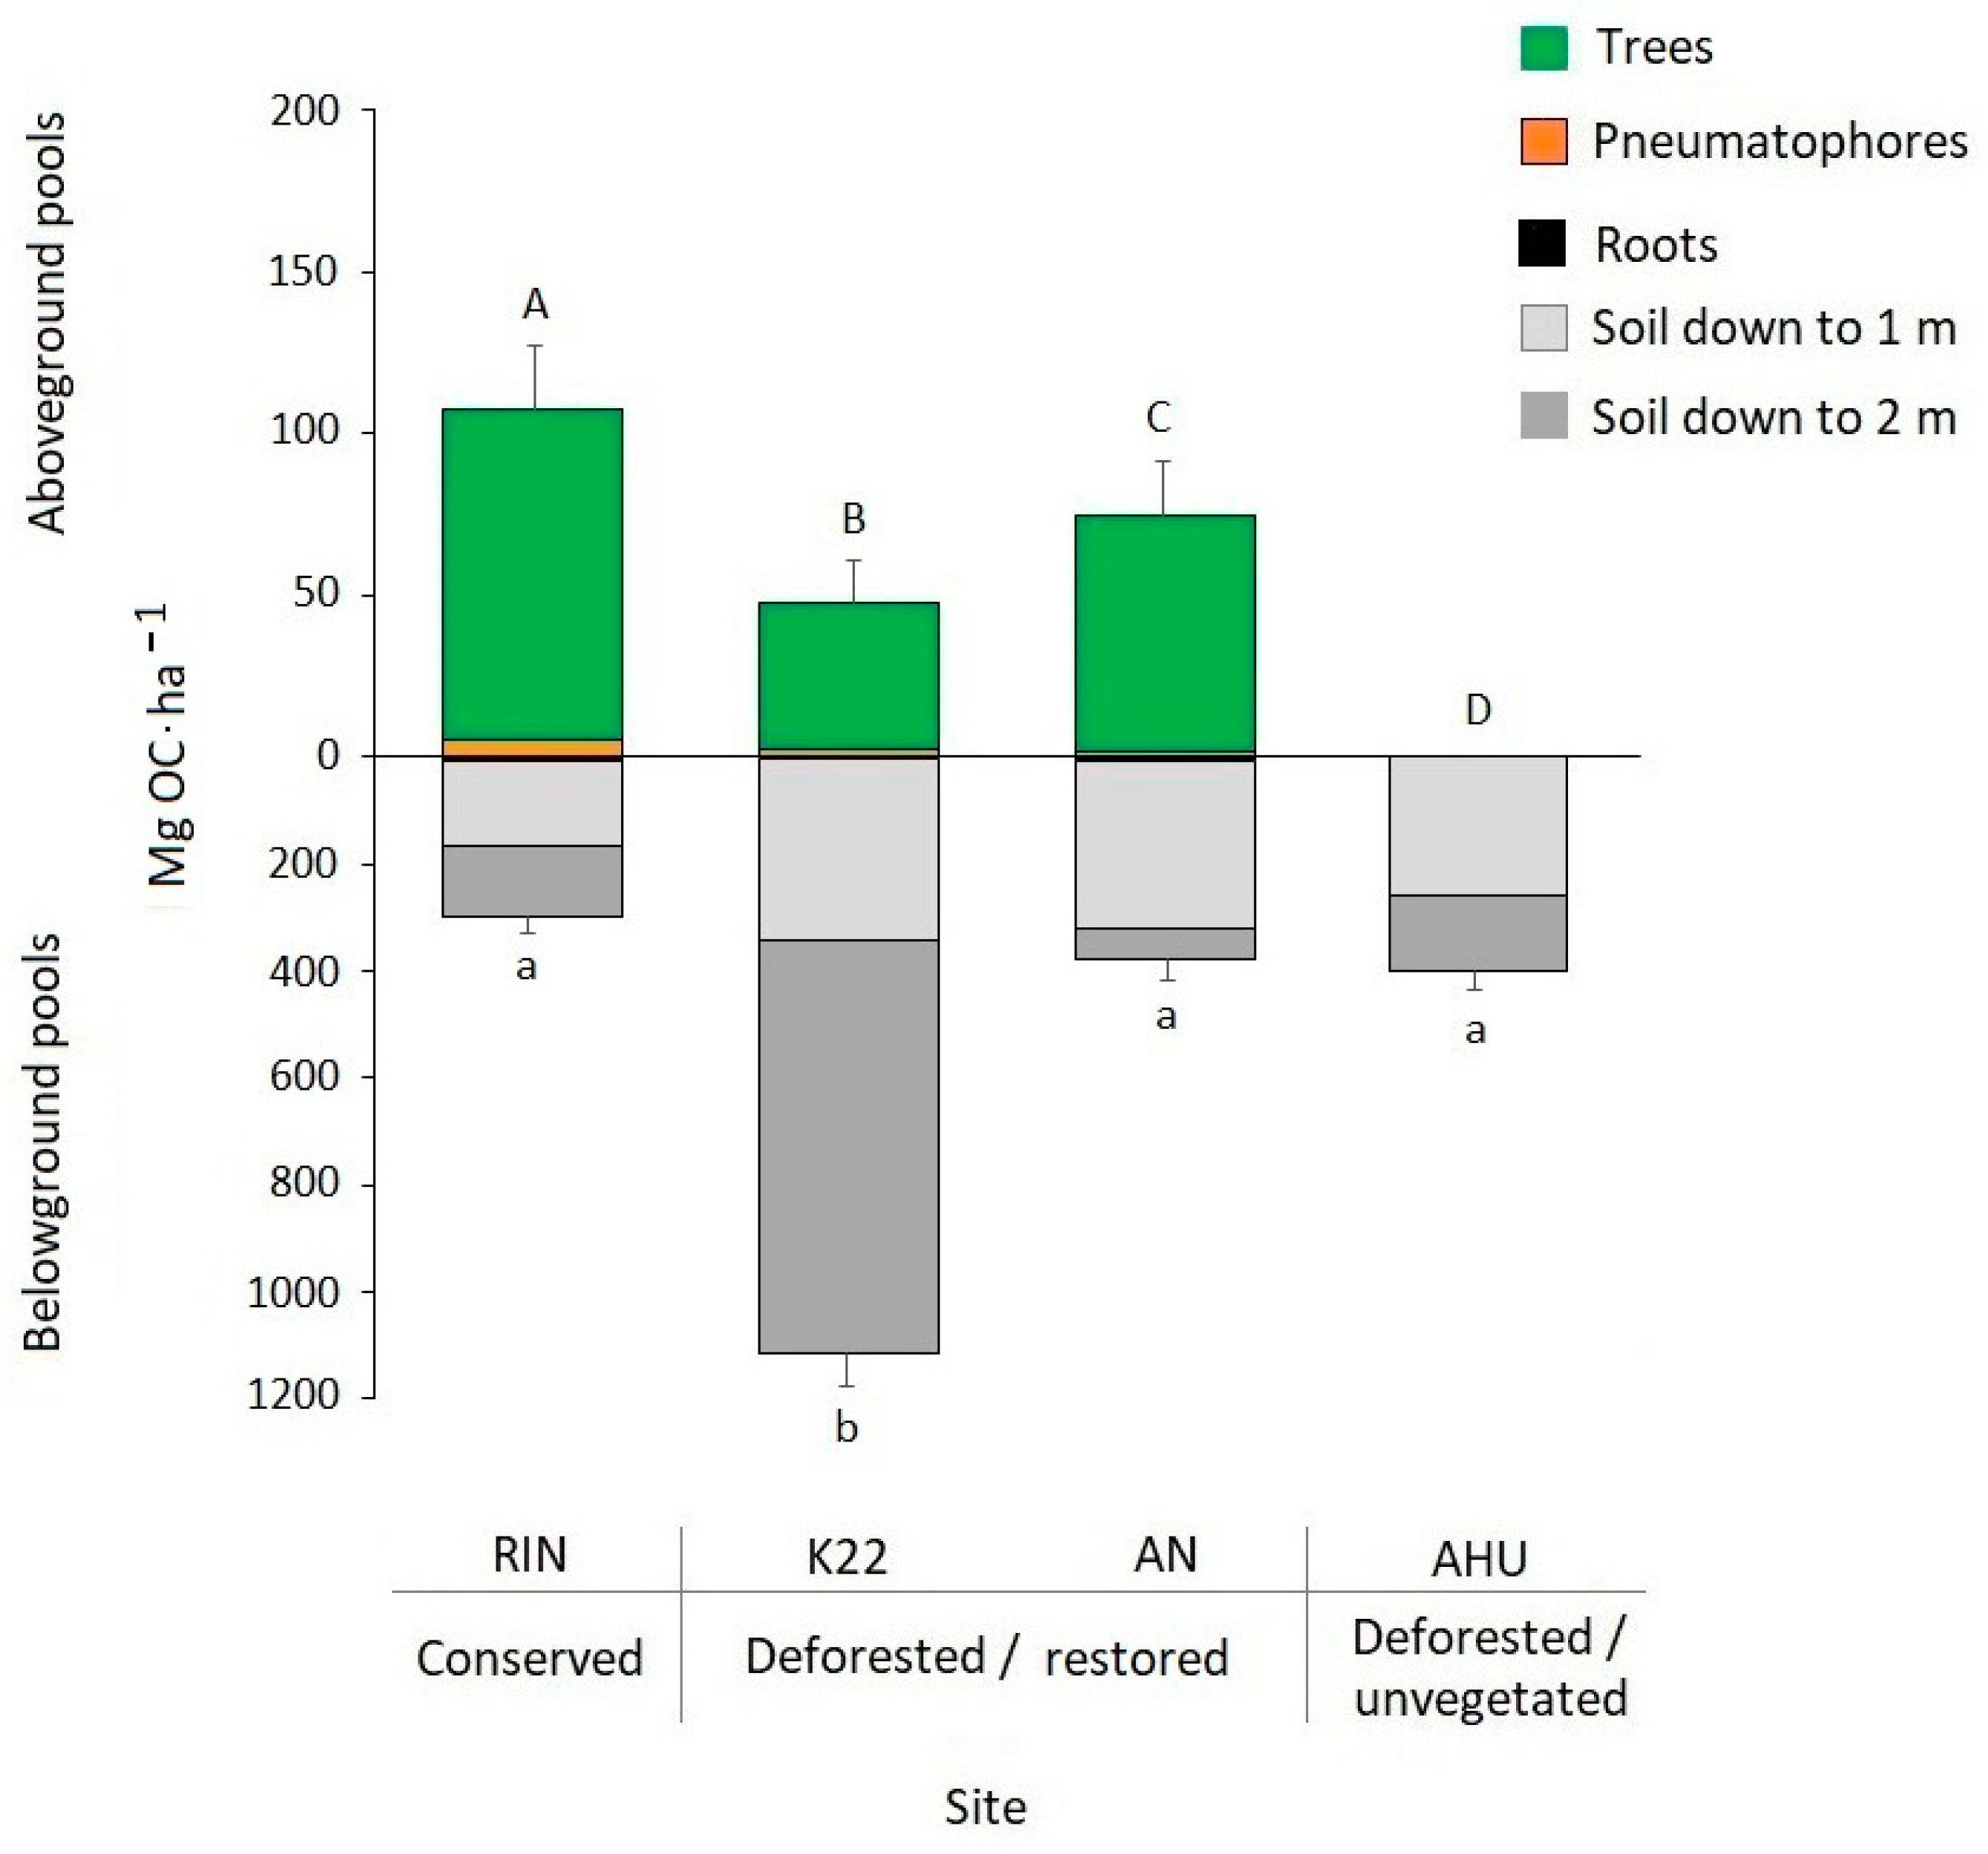
3.4. Mangrove Total Carbon

The total C stock considering trees, pneumatophores, belowground roots, and soil up to a 2 m depth ranged between 398.2 ± 76.7 and 1160.8 ± 130.9 Mg C ha−1 in AHU and K22, respectively. The aboveground C was significantly different among all the sites and ranged from 0 Mg C ha−1 in AHU, the deforested and unvegetated site, up to 102 Mg C ha−1 in RIN, the conserved site. On the other hand, the belowground C up to a 2 m depth was 2.7–3.8 times significantly higher in K22, a restored site, than the other sites (Figure 4). The largest C stocks were those of soils (0–2 m depth) that represented more than 70% of total C stocks. C stocks in trees represented 25%, 4%, and 16% of total mangrove carbon stocks in RIN, K22, and AN, respectively, and were the second-highest component in importance. Regarding the contribution of roots and pneumatophores, at all the sites, their combined contribution was less than 3%.

4. Discussion

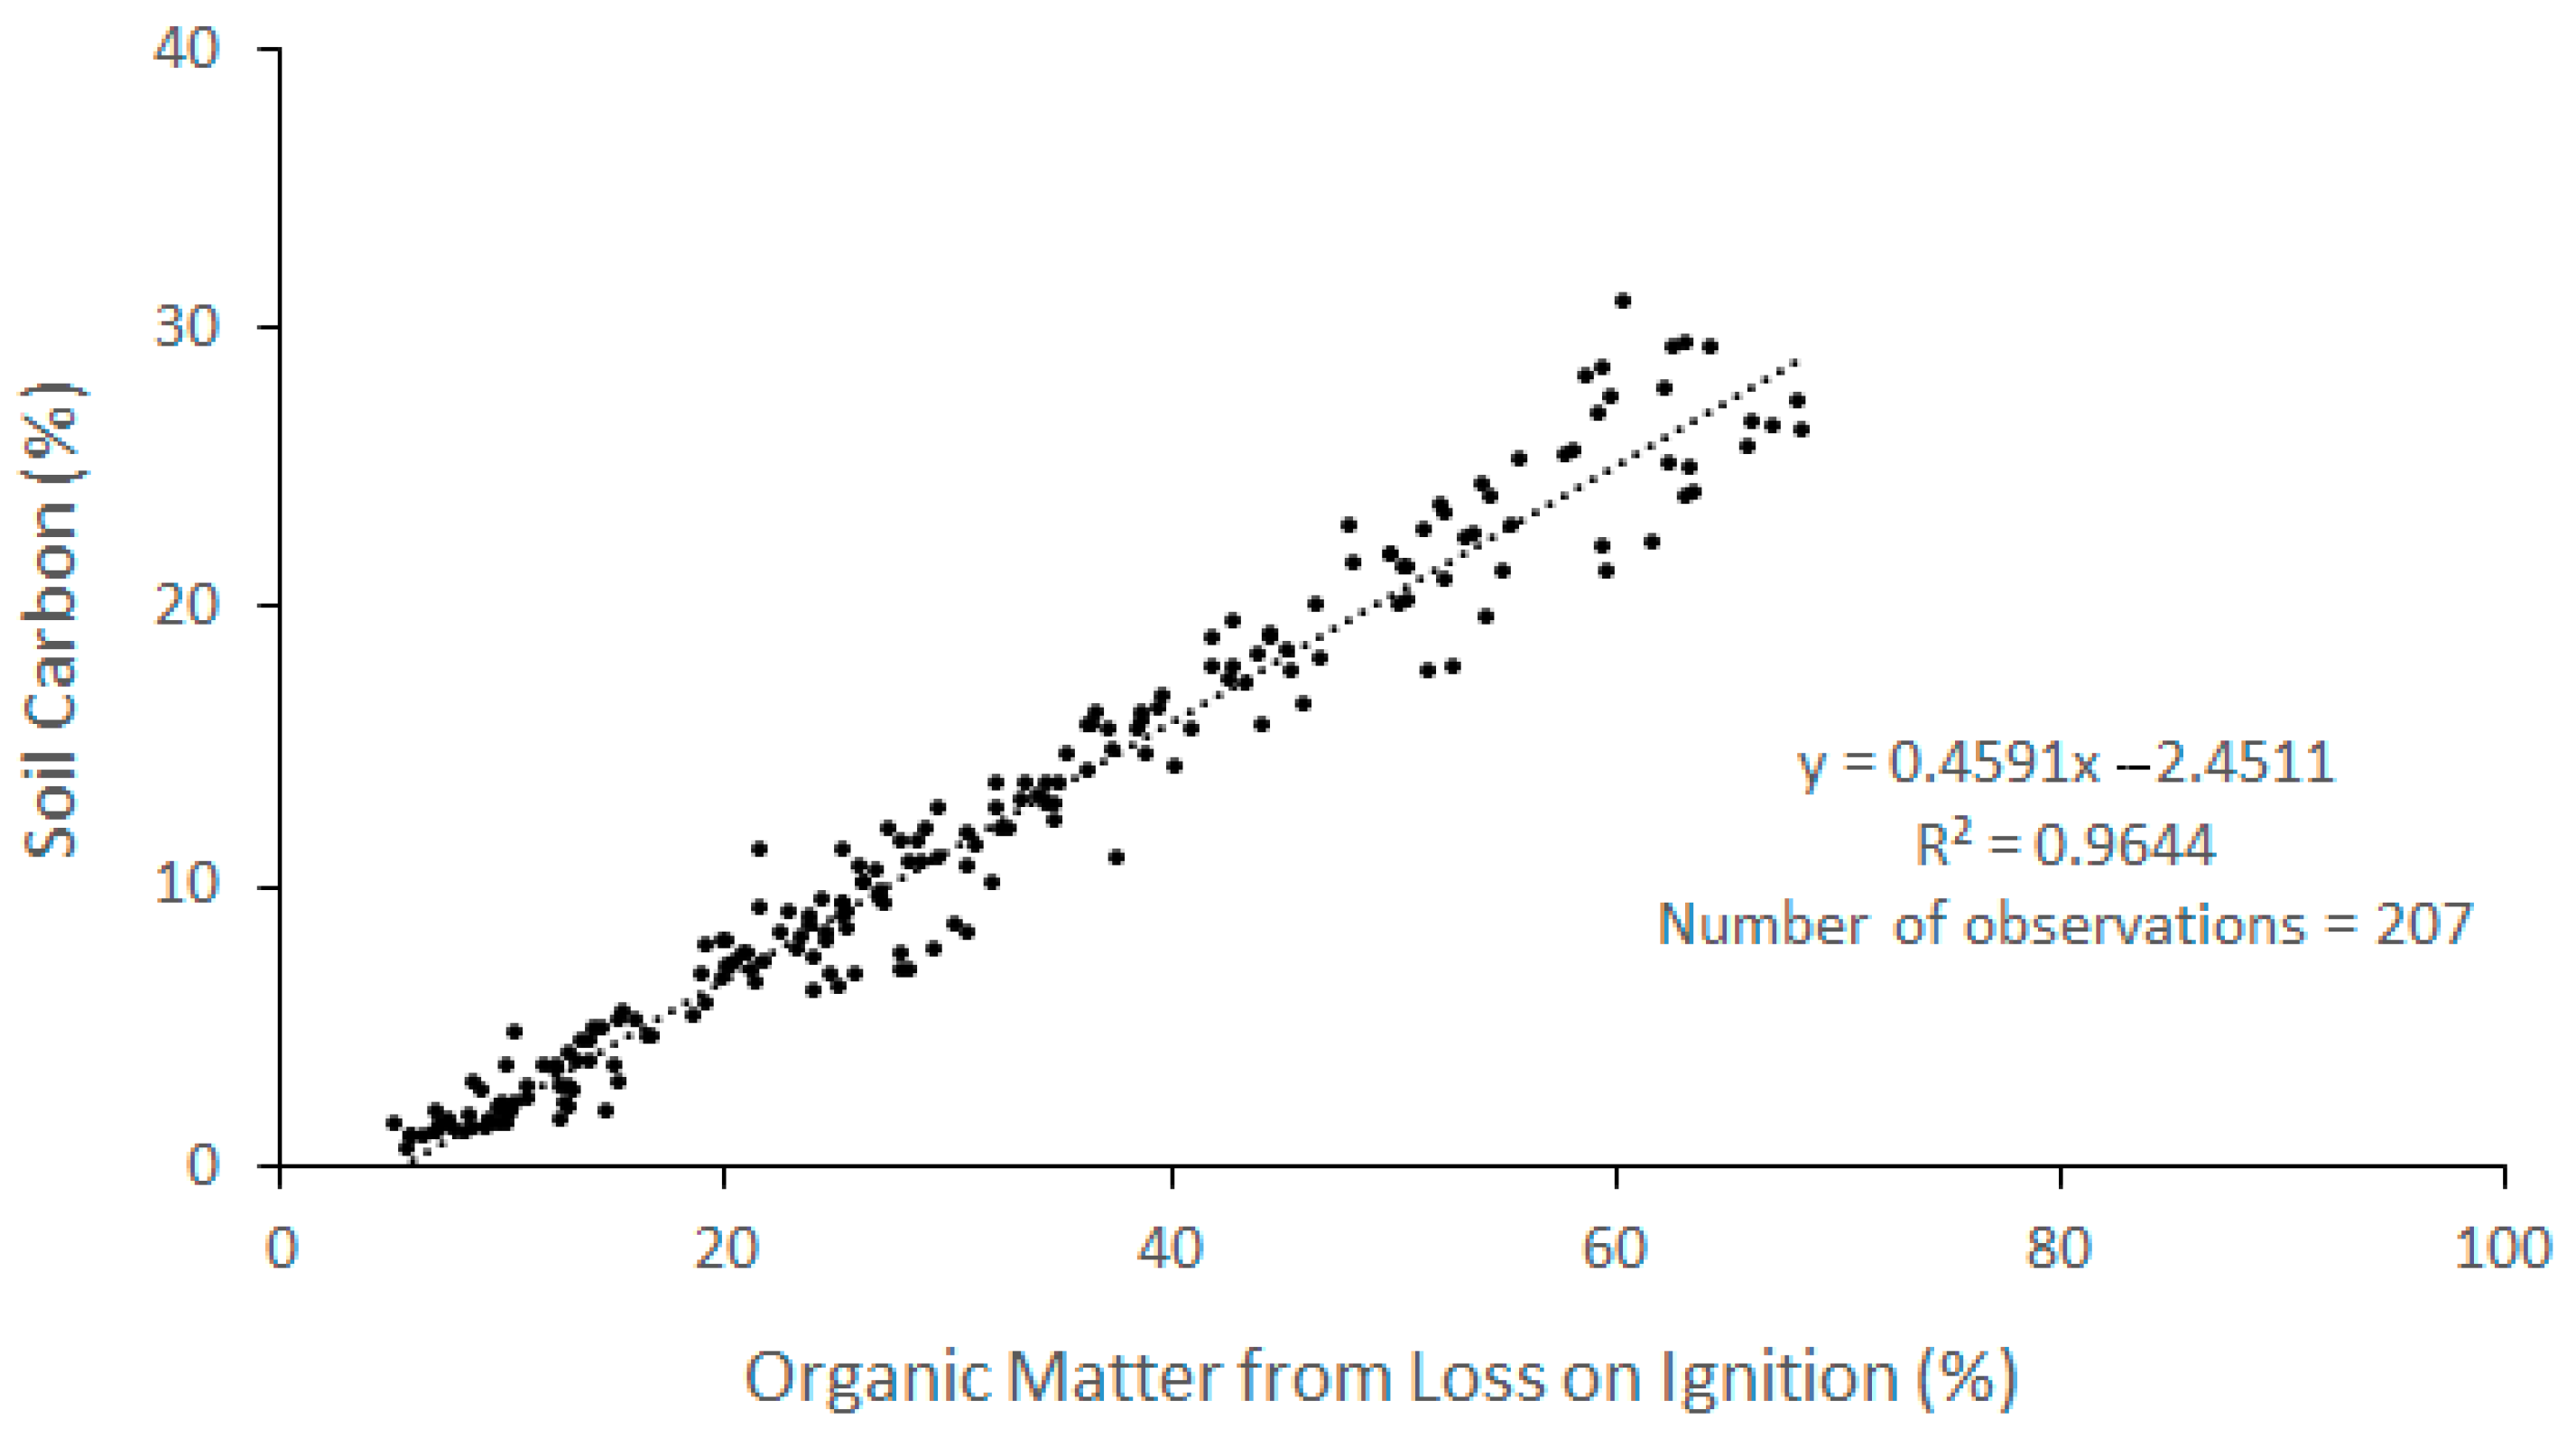
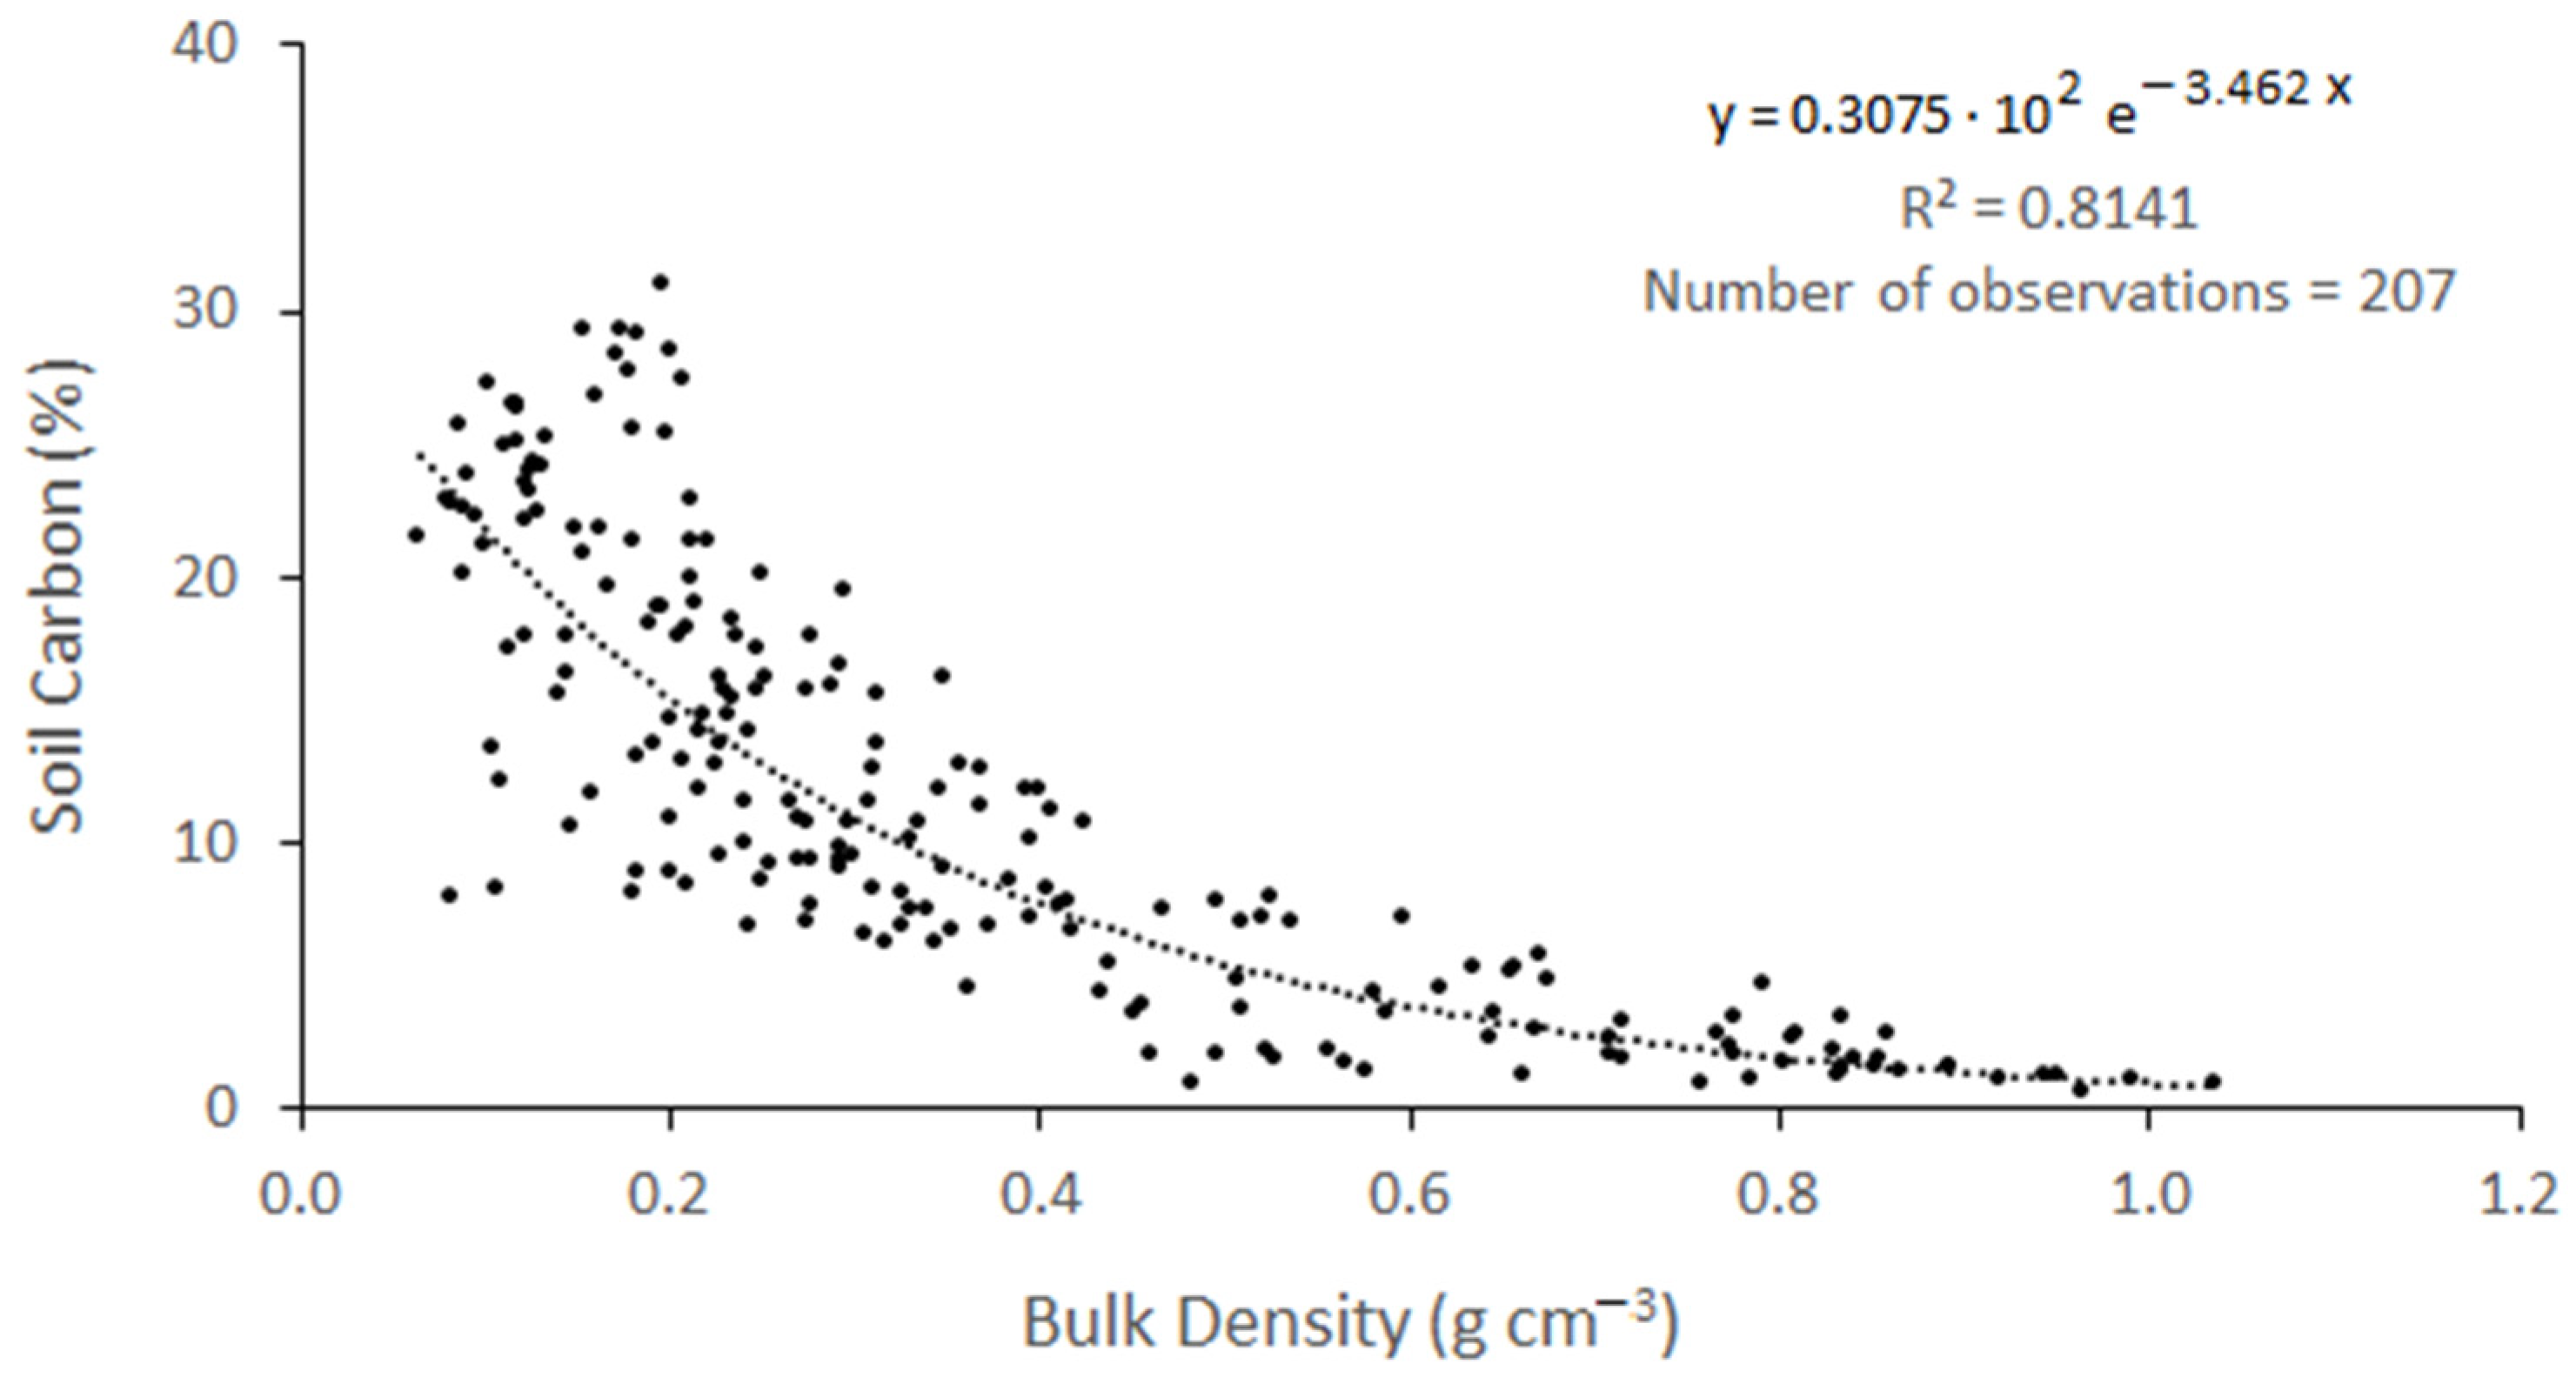
4.1. Indirect Estimations of Soil Carbon

The use of the relationship between OM, determined by the loss on ignition method (LOI), and the concentration of C (%) in soil samples from mangroves, marshes, and seagrasses, is recommended for determining the C concentration when it is not possible to access an elemental analyzer [1,46]. Kauffman and Donato [46] reported a positive association (r2 = 0.59) between these two variables in mangrove soil samples of the Republic of Palau. In the present study, we also found a positive and stronger relationship (r2 = 0.96, p = 0.00, Table 4), which can offer a cost-effective solution in future studies to predict the concentration of soil C based on the values of OM. When comparing the results between the models, the percentage of C obtained by the model of Kauffman and Donato [46] had significant differences compared with the values measured in the laboratory and with those obtained with the regression model found in this study (χ2 = 44.907, df = 2, p < 0.05). A higher relationship in the model determined in this study may be due to the fact that the soil samples in this case were acidified to remove inorganic C prior to determination in the elemental analyzer.
Bhomia et al. [57] presented another relationship that could be used to estimate the soil C content, between the bulk density of the soils and the C percentage. These authors found a strong and inverse relationship between these variables in mangroves of the Caribbean and Pacific coasts of Honduras (r2 = 0.83, p = 0.00). In CGSM soils, we observed a similar strong relationship between the two variables (r2 = 0.80, Table 5). This relationship is useful in studies where there is no elemental analyzer or muffle furnace. There were no statistically significant differences between the values calculated with these models and the % C measured in the laboratory (χ2 = 8.3894, df = 2, p < 0.05).

4.2. Mangrove Total Carbon

The carbon stocks found in the CGSM mangroves are within the range recorded for neotropical mangroves including mangroves on the Caribbean and Pacific coasts of Colombia (Table 6). However, the average (604.2 ± 180 Mg C ha−1 up to 2 m depth) is lower than the global average (738 ± 28 Mg C ha−1 up to 1 m depth) estimated by Alongi [58], but nevertheless the mangroves of the CGSM store significant C reserves, despite continued disturbances in the area.
Spatial variations in hydroperiod and physicochemical conditions drive soil biochemistry together with soil anoxia levels and mangrove regulators and resources. As a result, there is a broad variability in C stocks in different sites (Table 6). Tree structure is related to mangrove C stocks in some sites. For example, Adame et al. [65] found that tall forest had the highest C stocks in comparison to medium and dwarf forest in Mexico (987, 623, 381 Mg C ha−1, respectively). However, other authors, such as Kauffman et al. [66], Bhomia et al. [57], and Kauffman et al. [64], did not find a correlation between forest height or structure and total C stocks in mangroves of the Dominican Republic, Honduras, and Mexico, respectively. Our results agree with the findings of the latter authors, as the highest C stocks were found in K22 (deforested/restored), the site that had the lowest structural development among the three vegetated sites (Table 1). C stored in tree biomass of the CGSM sites (45–102 Mg C ha−1) is comparable to the values recorded in other mangroves of the Colombian Caribbean, such as Cispatá (65 ± 10 Mg C ha−1) and Golfo de Urabá (38–83 Mg C ha−1) [49,67]. The C stocks in trees were slightly low compared to the global average of 109.3 Mg C ha−1 [58] and were as expected: higher in the conserved site (RIN = 102 Mg C ha−1) than the sites where mangrove vegetation reestablished after the massive mangrove loss and subsequent hydrologic restoration (AN = 73.5 Mg C ha−1 and K22 = 45 Mg C ha−1).
There was a strong increase in K22 soil C stocks when the second meter of soil depth is included. This is explained by a recurrent delivery of sediments that favor large C preservation from 1 to 2 m depths. Since the ProCiénaga restoration project in 1996, the opened channels have been dredged sporadically, and the sediments extracted were deposited along the channel’s borders. Monitoring of CGSM mangroves carried out between 2014 and 2015 indicated that this approach negatively impacted the restoration process, especially around the middle of the Clarín channel’s course, where K22 was located [68]. This was due to two impacts. First, sediment disposal from channel dredging created spoil banks that functioned as dikes and limited water flux from the channels to the mangrove forest. Second, channel currents and rains during wet seasons relocated sediments from the channel borders to the forest interior or back to the channel bed. Dredged material continued to be deposited along the Clarín channel borders in the hydrodynamic recovery campaign carried out between 2016 and 2019 [42]. Soil C stock up to 2 m depth in AN and AHU (deforested/restored and deforested/unvegetated sites), compared to RIN (conserved), did not have significant differences, which shows that C loss in disturbed sites can be very slow and can take years or decades [69]. In our case, the massive forest mortality already happened 40 to 50 years ago.
The localization of the sampling sites in relation to the Magdalena River could help to explain the current situation regarding carbon concentrations in soils and vegetation. K22, being located further from the Magdalena River discharges than AN (Figure 1), receives lower nutrient inputs. Before the hydraulic disturbances, the carbon vegetation:soil ratio was probably lower in K22 than in AN. Additionally, the formation of dikes decreased the flow of the Clarín channel through the mangroves, affecting the tree’s biomass in K22. This could explain why this site has the lowest aerial biomass compared to AN, the other deforested/restored site. This situation was aggravated during 2015 and 2016, when, due to high salinities (greater than 90 in the interstitial water at 50 cm depth), a new mangrove mortality occurred at the K22 site [21]. The hyper-salinization of the soil accelerated because of the El Niño event, which in 2015 was very intense (average ONI index 1.5), and the water flow limitation by debris banks.
The soil depth to the base rock in all the study sites was greater than the 2 m depth limit used in this study to estimate C stocks directly. Thus, C stocks of study sites are greater than those shown in Figure 4 and Table 6. If C stocks found at 0–2 m are extrapolated to the total soil depth, carbon stocks would increase to 749.2 Mg C ha−1; 1738.6 Mg C ha−1; 489.8 Mg C ha−1 and 796.5 Mg C ha−1 in RIN, K22, AN, and AHU, respectively. C stocks extrapolated to the total soil depth have two important error sources: The C content variability along the soil profile and the channel maintain influence in some sites. However, the estimation of C up to base rock highlights the considerable C stocks present in CGSM, even in non-recovered sites.
Our results showing that the main C stocks of mangroves are soils (>71%) (Figure 4) agree with other studies of neotropical mangroves [57,64,65]. In contrast, pneumatophores and belowground roots had low contributions to total C stocks (<3%), a low value compared to reports in Mexico for the contribution of these structures to C stocks (1–16%) [63]. Technique differences may explain this difference. In this study, soil cores were used to estimate the belowground root biomass, while Adame et al. [63] used the general equation of Komiyama et al. [70]. While the soil core technique does not allow the sampling of coarse roots (>20 mm), because these would limit the penetration of the core into the soil, the general equation was developed from the biomass found in a trench 15.5 m long by 20 cm wide and 1 m deep, where all root sizes were sampled.
Given the sensitivity of the vegetation of the CGSM lagoon system to hydrological variability [29], conditions leading to forest dieback will have consequences on mangrove C stocks. A useful tool to raise awareness of the need to preserve or restore an ecosystem is to carry out ecosystem service valuation in sites with different degrees of degradation including preserved sites and sites where ecosystems have been lost or damaged. Although the suggested carbon value to achieve the Paris Accord goals (limit temperature rise to below 2 °C) is USD 40–80/t CO2-equivalents for 2020, an analysis by the World Bank indicates that 51% of the emissions covered by C pricing initiatives have been below USD 10/t CO2-equivalents [71]. In Colombia, C emissions had a government-regulated value of USD 5.08/t CO2-equivalents in 2017, a year of C biomass measurements in CGSM. Based on this valuation, the C in the CGSM sites, expressed as potential CO2 emissions or CO2-equivalents, would have an economic value between USD 7283 and 21,230/ha−1 (AHU and K22, respectively) (Table 7). Our estimations of the value of C in CGSM sites are higher than those reported by De la Peña et al. [72]. These authors only considered carbon stocks in trees, while we considered above and belowground C stocks. In addition, these authors used a different reference value of t CO2-equivalents, while we used the government-regulated value in Colombia.

5. Conclusions

This study showed that, although the massive mortality of the mangrove forests of CGSM occurred several decades ago, these mangrove forests have important reserves of C both in the aboveground and belowground biomass and soils. In addition, these reservoirs are constantly influenced by channel dredging and respond to these actions in a contrasting way: the ProCienaga channels open greater hydrological connectivity in some sites that favor the recovery of mangroves (AN) or have not managed to reduce the salinity of the soil and recover the mangrove vegetation in places far from its influence (AHU). At other sites (K22), inadequate canal maintenance operations have affected tree biomass and increased underground carbon stocks by reducing hydraulic connectivity and burying mangrove soils with dredging materials that are relocated from the edges of the channels towards the interior of the forest due to heavy rains and flood events. Therefore, the future management of the CGSM should increase the water connectivity of the sites away from the channels and improve the management of the dredged sediments to consolidate the mangrove recovery trend. Finally, together with data on the economic valuation of C stocks in forests, these results will be useful for decision makers when considering management actions in ecosystems where rapid environmental changes are taking place in mangrove areas.

Author Contributions

Conceptualization, L.V.P.-T., J.E.M.-P., J.H.M.-C. and M.-L.S.; Methodology, L.V.P.-T., J.E.M.-P., J.H.M.-C. and M.-L.S.; Formal Analysis, L.V.P.-T.; Investigation, L.V.P.-T., J.E.M.-P., J.H.M.-C. and M.-L.S.; Resources, J.E.M.-P., J.H.M.-C.; Data Curation, L.V.P.-T.; Writing—Original Draft Preparation, L.V.P.-T., J.H.M.-C., D.A.S.-N.; Writing—Review and Editing, J.E.M.-P., J.H.M.-C., D.A.S.-N. and M.-L.S.; Supervision, J.E.M.-P., J.H.M.-C. and M.-L.S.; Project Administration, J.E.M.-P.; Funding Acquisition, J.E.M.-P. and J.H.M.-C. All authors have read and agreed to the published version of the manuscript.

Funding

This study was funded by COLCIENCIAS (Departamento Administrativo de Ciencia, Tecnología e innovación de Colombia) within the project “Effect of the successional state of mangrove forests of the Colombian Caribbean in the processes of coastal erosion control and carbon storage -Blue Carbon” (Code 110171451047) and the Universidad Nacional de Colombia (Hermes Code 31393). The first author was supported by a COLCIENCIAS grant (call No. 647-2014), FUNCYTCA (Colombo-German Science and Technology Foundation) and Universidad Nacional de Colombia (Resolution 13 of 2017) grant and by CEMarin (Center for Excellence in Marine Sciences—Call # 12-2018). This is the CECIMAR contribution # 514.

Institutional Review Board Statement

Not applicable.

Informed Consent Statement

Not applicable.

Data Availability Statement

Not applicable.

Acknowledgments

We thank Martin Zimmer (Leibniz Centre for Tropical Marine Research—ZMT. Bremen, Germany) for supporting us in the analysis of carbon in the soil samples. We thank John W. Day for his revision of this manuscript. Thanks go to the Vía Parque Isla de Salamanca-VIPIS (Parques Nacionales Naturales de Colombia) for field support and sample collection permission. We thank to C. Carbonó (Tasajera-Ciénaga Grande de Santa Marta, Colombia) for his help during the field work. L.V.P.-T. wish to thanks to G. Contreras (Santa Marta, Colombia) for his valuable support during all the stages of the study.

Conflicts of Interest

The authors declare no conflict of interest.

References

  1. Howard, J.; Hoyt, S.; Isensee, K.; Pidgeon, E.; Telszewski, M. Coastal Blue Carbon: Methods for Assessing Carbon Stocks and Emissions Factors in Mangroves, Tidal Salt Marshes, and Seagrass Meadows; Conservation International; Intergovernmental Oceanographic Commission of UNESCO; International Union for Conservation of Nature: Arlington, VA, USA, 2014. [Google Scholar]
  2. Lovelock, C.E.; Duarte, C.M. Dimensions of blue carbon and emerging perspectives. Biol. Lett. 2019, 15, 1–5. [Google Scholar] [CrossRef] [PubMed]
  3. McLeod, E.; Chmura, G.L.; Bouillon, S.; Salm, R.; Björk, M.; Duarte, C.M.; Lovelock, C.E.; Schlesinger, W.H.; Silliman, B.R. A blueprint for blue carbon: Toward an improved understanding of the role of vegetated coastal habitats in sequestering CO2. Front. Ecol. Environ. 2011, 9, 552–560. [Google Scholar] [CrossRef] [Green Version]
  4. Boone, J.K.; Bhomia, R.K. Ecosystem carbon stocks of mangroves across broad environmental gradients in West-Central Africa: Global and regional comparisons. PLoS ONE 2017, 12, e0187749. [Google Scholar] [CrossRef] [Green Version]
  5. Bindoff, N.L.; Cheung, W.W.L.; Kairo, J.G.; Arístegui, J.; Guinder, V.A.; Hallberg, R.; Hilmi, N.J.M.; Jiao, N.; Karim, M.S.; Levin, L.; et al. Changing Ocean, Marine Ecosystems, and Dependent Communities. In IPCC Special Report on the Ocean and Cryosphere in a Changing Climate; Pörtner, H.-O., Roberts, D.C., Masson-Delmotte, V., Zhai, P., Tignor, M., Poloczanska, E., Mintenbeck, K., Alegría, A., Nicolai, M., Okem, A., et al., Eds.; Intergovernmental Panel on Climate Change: Geneva, Switzerland, 2019; pp. 477–587. [Google Scholar]
  6. Krauss, K.W.; McKee, K.L.; Lovelock, C.E.; Cahoon, D.R.; Saintilan, N.; Reef, R.; Chen, L. How mangrove forests adjust to rising sea level. New Phytol. 2014, 202, 19–34. [Google Scholar] [CrossRef] [PubMed] [Green Version]
  7. Sánchez-Núñez, D.A.; Bernal, G.; Pineda, J.E.M. The Relative Role of Mangroves on Wave Erosion Mitigation and Sediment Properties. Estuaries Coasts 2019, 42, 2124–2138. [Google Scholar] [CrossRef]
  8. Komiyama, A.; Ong, J.E.; Poungparn, S. Allometry, biomass, and productivity of mangrove forests: A review. Aquat. Bot. 2008, 89, 128–137. [Google Scholar] [CrossRef]
  9. McKee, K.L. Biophysical controls on accretion and elevation change in Caribbean mangrove ecosystems. Estuar. Coast. Shelf Sci. 2011, 91, 475–483. [Google Scholar] [CrossRef]
  10. Alongi, D.M. Present state and future of the world’s mangrove forests. Environ. Conserv. 2002, 29, 331–349. [Google Scholar] [CrossRef] [Green Version]
  11. Donato, D.C.; Kauffman, J.B.; Murdiyarso, D.; Kurnianto, S.; Stidham, M.; Kanninen, M. Mangroves among the most carbon-rich forests in the tropics. Nat. Geosci. 2011, 4, 293–297. [Google Scholar] [CrossRef]
  12. Worthington, T.; Spalding, M. Mangrove Restoration Potential A global map highlighting a critical opportunity. Geol. Surv. 2018, 36. [Google Scholar]
  13. Valiela, I.; Bowen, J.L.; York, J. Mangrove Forests: One of the World’s Threatened Major Tropical Environments. Bioscience 2001, 51, 807–815. [Google Scholar] [CrossRef] [Green Version]
  14. Giri, C.; Ochieng, E.; Tieszen, L.L.; Zhu, Z.; Singh, A.K.; Loveland, T.R.; Masek, J.G.; Duke, N.C. Status and distribution of mangrove forests of the world using earth observation satellite data. Glob. Ecol. Biogeogr. 2011, 20, 154–159. [Google Scholar] [CrossRef]
  15. Food and Agriculture Organization. The World’s Mangrove Forest 1980–2005; FAO: Rome, Italy, 2007; p. 153. [Google Scholar]
  16. Hamilton, S.E.; Casey, D. Creation of a high spatio-temporal resolution global database of continuous mangrove forest cover for the 21st century (CGMFC-21). Glob. Ecol. Biogeogr. 2016, 25, 729–738. [Google Scholar] [CrossRef]
  17. Chowdhury, R.R.; Uchida, E.; Chen, L.; Osorio, V.; Yoder, L. Anthropogenic drivers of mangrove loss: Geographic patterns and implications for livelihoods. In Mangrove Ecosystems: A Global Biogeographic Perspective; Springer: Cham, Switzerland, 2017; pp. 275–300. [Google Scholar] [CrossRef]
  18. Rivera-Monroy, V.H.; Twilley, R.R.; Mancera, J.E.; Alcantara-Eguren, A.; Castañeda-Moya, E.; Casas-Monroy, O.; Reyes, F.; Restrepo, J.; Perdomo Trujillo, L.V.; Campos, E.; et al. Aventuras Y Desventuras En Macondo: Rehabilitación De La Ciénaga Grande De Santa Marta, Colombia. Ecotropicos 2006, 19, 72–93. [Google Scholar]
  19. Gocke, K.; Pineda, J.E.M.; Vallejo, A. Heterotrophic microbial activity and organic matter degradation in coastal lagoons of Colombia. Rev. Biol. Trop. 2003, 51, 85–98. [Google Scholar]
  20. Cloern, J.E.; Jassby, A.D. Patterns and scales of phytoplankton variability in estuarine-coastal ecosystems. Estuaries Coasts 2010, 33, 230–241. [Google Scholar] [CrossRef] [Green Version]
  21. INVEMAR. Monitoreo de las Condiciones Ambientales y los Cambios Estructurales y Funcionales de las Comunidades Vegetales y de los Recursos Pesqueros Durante la Rehabilitación de la Ciénaga Grande De Santa Marta; Informe Técnico Final; INVEMAR: Santa Marta, Colombia, 2018; Volume 17. [Google Scholar]
  22. Rodríguez-Rodríguez, J.A.; Mancera, J.E.; Trujillo, L.V.P.; Rueda, M.; Ibarra-Gutiérrez, K.P. Ciénaga Grande de Santa Marta: The Largest Lagoon-Delta Ecosystem in the Colombian Caribbean. In The Wetland Book; Finlayson, C., Milton, G., Prentice, R., Davidson, N., Eds.; Springer: Dordrecht, The Netherlands, 2018; pp. 1–16. [Google Scholar]
  23. Bernal, G. Caracterizacion geomorfologica de la llanura deltaica del Rio Magdalena con enfasis en el sistema lagunar de la Cienaga Grande de Santa Marta, Colombia. Boletín de Investigaciones Marinas y Costeras 1996, 25, 19–48. [Google Scholar] [CrossRef]
  24. Restrepo, J.D.; Kjerfve, B. Magdalena river: Interannual variability (1975–1995) and revised water discharge and sediment load estimates. J. Hydrol. 2000, 235, 137–149. [Google Scholar] [CrossRef]
  25. Castaño, A.; Urrego, L.; Bernal, G. Dinámica del manglar en el complejo lagunar de Cispatá (Caribe colombiano) en los últimos 900 años. Rev. Biol. Trop. 2010, 58, 1347–1366. [Google Scholar] [CrossRef] [Green Version]
  26. Botero, L.; Salzwedel, H. Rehabilitation of the Cienaga Grande de Santa Marta, a mangrove-estuarine system in the Caribbean coast of Colombia. Ocean. Coast. Manag. 1999, 42, 243–256. [Google Scholar] [CrossRef]
  27. Blanco, J.A.; Viloria, E.A.; Narváez, J.C. ENSO and salinity changes in the Ciénaga Grande de Santa Marta coastal lagoon system, Colombian Caribbean. Estuar. Coast. Shelf Sci. 2006, 66, 157–167. [Google Scholar] [CrossRef]
  28. Álvarez-León, R.; Casas-Monroy, O.; la Hoz, E.C.; Reyes-Forero, S.P.; Troncoso-Olivo, W. La vegetación terrestre, eurihalina y dulceacuícola de la ecorregión Ciénaga Grande de Santa Marta. In Los Manglares de la Ecoregión Ciénaga Grandede Santa Marta: Pasado, Presente y Futuro; Serie de publicaciones especiales No. 11; Garay, J., Restrepo, J., Casas-Monroy, O., Solano, O.D., Newmark, F., Eds.; INVEMAR: Santa Marta, Colombia, 2004; pp. 75–96. [Google Scholar]
  29. Röderstein, M.; Perdomo, L.; Villamil, C.; Hauffe, T.; Schnetter, M.L. Long-term vegetation changes in a tropical coastal lagoon system after interventions in the hydrological conditions. Aquat. Bot. 2014, 113, 19–31. [Google Scholar] [CrossRef]
  30. Vilardy, S.; González, J.A. Repensando la Ciénaga: Nuevas Miradas y Estrategias para la Sostenibilidad en la Ciénaga Grande de Santa Marta; Universidad del Magdalena: Santa Marta, Colombia; Universidad Autonoma de Madrid: Madrid, Spain, 2011; Volume 1. [Google Scholar]
  31. INVEMAR. Monitoreo de las Condiciones Ambientales y los Cambios Estructurales y Funcionales de las Comunidades Vegetales y de los Recursos Pesqueros Durante la Rehabilitación de la Ciénaga Grande de Santa Marta; Informe Técnico Final 2018; INVEMAR: Santa Marta, Colombia, 2019. [Google Scholar]
  32. Botero, L.; Mancera-Pineda, J.E. Síntesis de los cambios de origen antrópico ocurridos en los últimos 40 años en la Ciénaga de Santa Marta (Colombia). Rev. Acad. Colomb. Cienc. 1996, 20, 465–474. [Google Scholar]
  33. Poveda, G.; Mesa, O.J. La Corriente de chorro superficial del oeste ‘del Chocó’: Climatología y Variabilidad durante las fases del ENSO. Rev. Acad. Colomb. Cienc. 1999, 23, 517–528. [Google Scholar]
  34. Giannini, A.; Kushnir, Y.; Cane, M.A. Interannual variability of Caribbean rainfall, ENSO, and the Atlantic Ocean. J. Clim. 2000, 13, 297–311. [Google Scholar] [CrossRef]
  35. Díaz, L.A.S.; Botero, L.; Cardona, P.; Mancera-Pineda, J.E. Estructura del manglar en el Delta Exterior del río Magdalena-Ciénaga Grande de Santa Marta, una zona tensionada por alteraciones del equilibrio hídrico. Boletín de Investigaciones Marinas y Costeras 1995, 24, 135–164. [Google Scholar]
  36. Cardona, P.; Botero, L. Soil Characteristics and Vegetation Structure in a Heavily Deteriorated Mangrove Forest in the Caribbean Coast of Colombia. Biotropica 1998, 30, 24–34. [Google Scholar] [CrossRef]
  37. Gónima, L.; Mancera-Pineda, J.E.; Botero, L. Aplicación de Imágenes de Satélite al Diagnóstico Ambiental de un Complejo Lagunar Estuarino Tropical: Ciénaga Grande de Santa Marta, Caribe Colombiano; INVEMAR: Santa Marta, Colombia, 1998. [Google Scholar]
  38. Simard, M.; Rivera-Monroy, V.H.; Mancera-Pineda, J.E.; Castañeda-Moya, E.; Twilley, R.R. A systematic method for 3D mapping of mangrove forests based on Shuttle Radar Topography Mission elevation data, ICEsat/GLAS waveforms and field data: Application to Ciénaga Grande de Santa Marta, Colombia. Remote Sens. Environ. 2008, 112, 2131–2144. [Google Scholar] [CrossRef]
  39. Botero, L.; Marshall, M. Biodiversity Within the Living, Dying and Dead Mangrove Forests of The Ciénaga Grande De Santa Marta; Mote Marine Laboratory Technical Report Number 366; Mote Marine Laboratory: Tallahassee, FL, USA, 1994. [Google Scholar]
  40. Mancera, J.E.; Vidal, L.A. Florecimiento De Microalgas Relacionado Con Mortandad Masiva De Peces En El Complejo Lagunar Cienaga Grande De Santa Marta, Caribe Colombiano. Bull. Mar. Coast. Res. 1994, 23. [Google Scholar] [CrossRef]
  41. Ibarra, K.P.; Gómez, M.C.; Viloria, E.A.; Arteaga, E.; Cuadrado, I.; Martínez, M.F.; Nieto, Y.; Rodríguez, J.A.; Licero, L.V.; Perdomo, L.V.; et al. Monitoreo de las Condiciones Ambientales y los Cambios Estructurales y Funcionales de las Comunidades Vegetales y de los Recursos Pesqueros Durante la Rehabilitación de la Ciénaga Grande de Santa Marta; INVEMAR: Santa Marta, Colombia, 2014. [Google Scholar]
  42. CORPAMAG. Agua Dulce para la Ciénaga Grande de Santa Marta. 2020. Available online: https://www.corpamag.gov.co/index.php/es/homepage/79-contenido-espanol/noticias/786-agua-dulce-para-la-cienaga (accessed on 10 March 2021).
  43. Cardona, P. Característica de los Suelos del Manglar del Costado Noraccidental de la Ciénaga Grande de Santa Marta (Complejo de Pajares e Isla de Salamanca) y su Relacióncon Algunos Atributos de la Vegetación. Master’s Thesis, Universidad de Antióquia, Antióquia, Colombia, 1991. [Google Scholar]
  44. Casas-Monroy, O. Patrones de Regeneración Natural del Manglar de la Region de la Ciénaga Grande de Santa Marta, Caribe Colombiano. Ph.D. Thesis, Universidad Jorge Tadeo Lozano, Bogota, Colombia, 1999. [Google Scholar]
  45. Betancourt-Portela, J.M.; Parra, J.P.; Villamil, C. Emisión de metano y óxido nitroso de los sedimentos de manglar de la ciénaga grande de santa marta, Caribe Colombiano. Boletín de Investigaciones Marinas y Costeras 2013, 42, 131–152. [Google Scholar] [CrossRef]
  46. Kauffman, J.B.; Donato, D.C. Protocols for the Measurement, Monitoring and Reporting of Structure, Biomass and Carbon Stocks in Mangrove Forests; Working Paper; CIFOR: Bogor, Indonesia, 2012; p. 86. [Google Scholar] [CrossRef]
  47. Adame, M.F.; Cherian, S.; Reef, R.; Stewart-Koster, B. Mangrove root biomass and the uncertainty of belowground carbon estimations. For. Ecol. Manag. 2017, 403, 52–60. [Google Scholar] [CrossRef]
  48. Cintrón, G.; Schaeffer-Novelli, Y. Introducción a la Ecología del Manglar; UNESCO: Montevideo, Uruguay, 1983. [Google Scholar]
  49. Yepes, A.; Zapata, M.; Bolivar, J.; Monsalve, A.; Espinosa, S.M.; Sierra-Correa, P.C.; Sierra, A. Ecuaciones alométricas de biomasa aérea para la estimación de los contenidos de carbono en manglares del Caribe Colombiano. Revista Biología Tropical 2016, 64, 913–926. [Google Scholar] [CrossRef]
  50. Medina, J.H. Estructura, Asignación de Biomasa y Producción Primaria Neta en Bosques de Manglar de un Complejo Karstico de Origen Carbonatado en una Isla Oceánica; Universidad Nacional de Colombia: Bogota, Colombia, 2016. [Google Scholar]
  51. Angeles, G.; López–Portillo, J.; Ortega-Escalona, F. Functional anatomy of the secondary xylem of roots of the mangrove Laguncularia racemosa (L.) Gaertn. (Combretaceae). Trees Struct. Funct. 2002, 16, 338–345. [Google Scholar] [CrossRef]
  52. McKee, K.L.; Faulkner, P.L. Restoration of biogeochemical function in mangrove forests. Restor. Ecol. 2000, 8, 247–259. [Google Scholar] [CrossRef]
  53. Lukac, M. Fine Root Turnover. In Measuring Roots: An Updated Approach; Mancuso, S., Ed.; Springer: Berlin/Heidelberg, Germany, 2012; pp. 363–373. [Google Scholar]
  54. Castañeda-Moya, E.; Twilley, R.R.; Rivera-Monroy, V.H.; Marx, B.D.; Coronado-Molina, C.; Ewe, S.M.L. Patterns of Root Dynamics in Mangrove Forests Along Environmental Gradients in the Florida Coastal Everglades, USA. Ecosystems 2011, 14, 1178–1195. [Google Scholar] [CrossRef]
  55. Davies, B.E. Loss-on-Ignition as an Estimate of Soil Organic Matter. Soil Sci. Soc. Am. J. 1974, 38, 150–151. [Google Scholar] [CrossRef]
  56. Torres-Duque, J. Complejidad Estructural Aérea de Bosques de Manglar y su Relación con Contenido de Carbono Azul en Suelos; Universidad Nacional de Colombia: Bogota, Colombia, 2020. [Google Scholar]
  57. Bhomia, R.K.; Kauffman, J.B.; McFadden, T.N. Ecosystem carbon stocks of mangrove forests along the Pacific and Caribbean coasts of Honduras. Wetl. Ecol. Manag. 2016, 24, 187–201. [Google Scholar] [CrossRef]
  58. Alongi, D.M. Carbon cycling in the world’s mangrove ecosystems revisited: Significance of non-steady state diagenesis and subsurface linkages between the forest floor and the coastal ocean. Forests 2020, 11, 977. [Google Scholar] [CrossRef]
  59. Bolívar, J.; Yepes, A.; Sierra-Correa, P.C.; Urrego, L.; Moreno, F.; Polanía, J.; Monsalve, A.; Espinosa, S.M.; Herrera, D.; Posada, J.; et al. Contenido de carbono en manglares del Caribe colombiano: Bahía de Cispatá, La Balsa-Tinajones y sectores aledaños del delta estuarino del río Sinú. In Proceedings of the Seminario Nacional de Ciencias y Tecnologías del Mar Libro Memorias—Libro de Memorias, Santa Maria, Colombia, 18–22 October 2015; SENALMAR: Santa Maria, Colombia, 2015; p. 220. Available online: http://www.parquesnacionales.gov.co/portal/wp-content/uploads/2013/08/Memorias-VXI-SENALMAR-COLACMAR-2015.pdf (accessed on 10 March 2021).
  60. Palacios, M.L.; Cantera, J.R.; Peña, E.J. Carbon stocks in mangrove forests of the Colombian Pacific. Estuar. Coast. Shelf Sci. 2019, 227, 106299. [Google Scholar] [CrossRef]
  61. Monsalve, A.; Ramírez, G. Caracterización de la Estructura y Contenido de Carbono de los Bosques de Manglar en el Área de Jurisdicción del Consejo Comunitario La Plata, Bahía Málaga, Valle del Cauca; Centro de Investigación en Ecosistemas y Cambio Global, Carbono & Bosques: Medellín, Colombia, 2015. [Google Scholar]
  62. Senger, D.F.; Hortua, D.A.S.; Engel, S.; Schnurawa, M.; Moosdorf, N.; Gillis, L.G. Impacts of wetland dieback on carbon dynamics: A comparison between intact and degraded mangroves. Sci. Total Environ. 2021, 753, 141817. [Google Scholar] [CrossRef] [PubMed]
  63. Adame, M.F.; Santini, N.S.; Tovilla, C.; Vázquez-Lule, A.; Castro, L.; Guevara, M. Carbon stocks and soil sequestration rates of tropical riverine wetlands. Biogeosciences 2015, 12, 3805–3818. [Google Scholar] [CrossRef] [Green Version]
  64. Kauffman, J.B.; Trejo, H.H.; Garcia, M.d.J.; Heider, C.; Contreras, W.M. Carbon stocks of mangroves and losses arising from their conversion to cattle pastures in the Pantanos de Centla, Mexico. Wetl. Ecol. Manag. 2016, 24, 203–216. [Google Scholar] [CrossRef]
  65. Adame, M.F.; Kauffman, J.B.; Medina, I.; Gamboa, J.N.; Torres, O.; Caamal, J.P.; Reza, M.; Herrera-Silveira, J.A. Carbon Stocks of Tropical Coastal Wetlands within the Karstic Landscape of the Mexican Caribbean. PLoS ONE 2013, 8, e56569. [Google Scholar] [CrossRef] [PubMed] [Green Version]
  66. Kauffman, J.B.; Heider, C.; Norfolk, J.; Payton, F. Carbon stocks of intact mangroves and carbon emissions arising from their conversion in the Dominican Republic. Ecol. Appl. 2014, 24, 518–527. [Google Scholar] [CrossRef] [PubMed]
  67. Blanco-Libreros, J.F.; Ortiz-Acevedo, L.F.; Urrego, L.E. Reservorios de biomasa aérea y de carbono en los manglares del golfo de Urabá (Caribe colombiano). Actualidades Biológicas 2015, 37, 131–141. [Google Scholar] [CrossRef]
  68. INVEMAR. Monitoreo de las Condiciones Ambientales y los Cambios Estructurales y Funcionales de las Comunidades Vegetales y de los Recursos Pesqueros Durante la Rehabilitación de la Ciénaga Grande de Santa Marta; Informe Técnico Final 2015; INVEMAR: Santa Marta, Colombia, 2016; Volume 14. [Google Scholar]
  69. Lovelock, C.E.; Fourqurean, J.W.; Morris, J.T. Modeled CO2 emissions from coastal wetland transitions to other land uses: Tidal marshes, mangrove forests, and seagrass beds. Front. Mar. Sci. 2017, 4, 1–11. [Google Scholar] [CrossRef]
  70. Komiyama, A.; Poungparn, S.; Kato, S. Common allometric equations for estimating the tree weight of mangroves. J. Trop. Ecol. 2005, 21, 471–477. [Google Scholar] [CrossRef]
  71. World Bank. State and Trends of Carbon Pricing 2019; World Bank: Washington, DC, USA, 2019. [Google Scholar]
  72. De la Peña, A.; Rojas, C.; de la Peña, M. Valoración Económica del Manglar por el Almacenamiento de Carbono, Ciénaga Grande de Santa Marta. CLIO América 2010, 4, 133–150. [Google Scholar] [CrossRef]
Figure 1. Sampling sites in the Ciénaga Grande de Santa Marta lagoon system. (Map by David Morales-Giraldo and Nicolás Castro-Perdomo).
Water 13 01297 g001
Figure 2. Relationship between organic matter (%) and the soil organic carbon concentration (%) in the mangrove soil. Samples from all sampling sites and soil depth from 1 m upwards were used.
Water 13 01297 g002
Figure 3. Relationship between bulk density (g cm−3) and the soil organic carbon concentration (%) in the mangrove soil. Samples from all sampling sites and soil depth from 1 m upwards were used.
Water 13 01297 g003
Figure 4. Carbon stocks in aboveground and belowground mangrove pools in Ciénaga Grande de Santa Marta. Note that different scales are shown for aboveground and belowground pools. Different letters represent significant differences among sites in the aboveground and belowground C pools.
Water 13 01297 g004
Table 1. Mangrove tree structure, biomass, and carbon (average ± SE). n: number of trees measured, DBH: diameter at breast height, C: carbon.
SitePredominant SpeciesnAverage
DBH (cm)
Maximum
DBH (cm)
Density
(ind. ha−1)
Basal Area *
(m2 ha−1)
Tree Biomass
(Mg ha−1)
Tree C **
(Mg C ha−1)
RINA. germinans7516.1 ± 1.240.1937.5 ± 62.527.1 ± 0.5212.6 ± 3.8102.1 ± 1.8 a
K22A. germinans L. racemosa18611.9 ± 0.429.91162.5 ± 41.515.8 ± 1.794.3 ± 12.145.2 ± 5.8 b
ANA. germinans L. racemosa36110.8 ± 0.235.02256.3 ± 386.925.6 ± 0.9153.2 ± 11.873.5 ± 5.6 c
AHUWithout vegetation----000 d
* Estimated from allometric equations (A. germinans: [49] and L. racemosa: [50]). ** Estimated using a factor of 0.48 [46]. Plots of 20 × 30 m (RIN: n = 2; K22 and AN: n = 4). Different letters represent significant differences among sites.
Table 2. Biomass (Mg ha−1) and carbon (Mg C ha−1) in pneumatophores and belowground roots (mean ± SE).
SitesPneumatophores *Belowground Roots **
Biomass
(Mg ha−1)
Carbon
(Mg C ha−1)
Biomass
(Mg ha−1)
Carbon
(Mg C ha−1)
RIN10.0 ± 2.24.8 ± 1.1 a20.4 ± 7.27.5 ± 2.6 a
K224.4 ± 1.32.0 ± 0.9 b8.4 ± 1.73.2 ± 0.9 a
AN2.3 ± 0.51.1 ± 0.3 b17.3 ± 2.56.7 ± 1.3 a
AHUWithout vegetationWithout vegetation
* Plots of 25 × 25 cm. RIN: N = 5. K22 and AN: N = 10. ** Cores of 1 m depth. RIN: N = 5. K22 and AN: N = 10. Different letters represent significant differences among sites.
Table 3. Average soil organic carbon (SOC) ± SE at 0–1 m and 0–2 m depth. Soil depth = DT.
SitioSOC1m *
(Mg ha−1)
SOC2m **
(Mg ha−1)
DT
(m)
RIN156.4 ± 15.6 a288.5 ± 14.6 a4.4 ± 0.6
K22339.2 ± 19.0 b1110.3 ± 32.1 b3.1 ± 0.4
AN312.4 ± 12.8 bc373.0 ± 13.4 a2.2 ± 0.2
AHU257.9 ± 2.0 c398.2 ± 19.0 a4.0 ± 0.2
* N = RIN: 3, K22: 6, AN: 6 and AHU: 3. ** N: 3. Estimated considering OM values between 1 and 2 m depth by Torres-Duque [56]. Different letters denote significant differences among sites (p < 0.05).
Table 4. Relationship between organic matter-OM (calculated via loss on ignition-LOI) and soil carbon concentration SC (%) (calculated via dry combustion) for mangrove soil samples. n = number of observations.
SitenCoefficient of Determination r2ModelSource
CGSM 12070.9644% SC = 0.4591 · % OM (LOI) − 2.4511This study
Republic of Palau 2*0.5916% SC = 0.415 · % OM (LOI) + 2.8857[46]
* Not specified. 1 Up 1 m depth. 2 Up 1.6 m depth.
Table 5. Relationship between bulk density-BD (g cm−3) and soil carbon SC (%) (calculated via dry combustion) for mangrove soil samples. n = number of observations.
SitenCoefficient of Determination r2ModelSource
CGSM 1207−0.80% C = 0.3075·102 e−3.462(BD)This study
Honduras Pacific and Caribbean coast 2518−0.83% C = 1.01 − 16.12 ln (BD) [57]
1 Up 1 m depth. 2 Soil between 1.2 and 2.7 m depth.
Table 6. Carbon stocks (Mg C ha−1) in neotropical mangroves. CGSM = Ciénaga Grande de Santa Marta.
SiteEcosystem Type/ForestPredominant SpeciesMg C ha−1Source
CGSM—RINBasin, conserved A. germinans403.0 ± 77.1 1Present study
CGSM—K22Basin, around 22 years of recovery A. germinans
L. racemosa
1160.8 ± 130.9 1Present study
CGSM—ANBasin, around 20 years of recoveryA. germinans
L. racemosa
454.5 ± 81.9 1Present study
CGSM—AHUBasin, without vegetation recovery -398.2 ± 76.7 1Present study
Colombia—Caribbean
Cispatá—La Balsa—Tinajones
Basin and fringeA. germinans
R. mangle
L. racemosa
521.3 2[59]
Colombia—Pacific
Bahía Málaga and Bahía de Buenaventura
Riverine and fringeRhizophora spp.
Mora oleífera
Pelliciera rhizophorae
500–710 3 *[60]
Colombia—Pacific
Bahía Málaga
Riverine and fringeRhizophora spp.
P. rhizophorae
M. oleífera
220.2 4[61]
Bonaire—CaribbeanCoastal lagoon
Degraded—Intact
R. mangle
A. germinans
L. racemosa
60–140 5[62]
Honduras,
Pacific coast, Caribbean cost and Bay Islands
Low: <3 m
medium 3−10 m
Tall: >10 m
R. mangle
L. racemosa
306–1632 6[57]
México—PacificRiverineR. mangle
A. germinans
L. racemosa
536–1114 7[63]
México—Caribbean
Pantanos de Centla
Riverine and fringeR. mangle
A. germinans
L. racemosa
C. erectus
342–2098 8[64]
México—Caribbean
Península de Yucatán
Dwarf: <1.5 m
Medium: 3−5 m
Tall >5 m
R. mangle297–1325 9[65]
Dominican Republic,
Monte Cristi
Small: <3 m
Medium: 3–10 m
Tall: >10 m
R. mangle706–1131 10[66]
1 Aboveground biomass + belowground biomass + soil up to 2 m depth. 2,4 Aboveground biomass + below ground biomass + necromass+ soil up to 0.45 m depth. 3 Aboveground biomass + belowground biomass + downed wood + litterfall + soil up to 1 m depth. 5 Aboveground biomass + belowground biomass + soil up to 0.3 m depth. 6 Aboveground biomass + downed wood + soil up to 2.7 m depth. 7 Aboveground biomass + belowground biomass + downed wood + dead trees + soil up to 1.5 m depth. 8 Aboveground biomass + belowground biomass + downed wood + dead trees + soil up to 3 m depth. 9 Aboveground biomass + belowground biomass + downed wood + soil up to depth of parent material. 10 Aboveground biomass + belowground biomass + downed wood + soil up to 2.5 m depth. * Graph estimated values.
Table 7. Carbon stocks expressed as potential CO2 emissions (Mg CO2-equivalents. ha−1) in study sites and their economic value. Data are based on aboveground biomass and soil up to 2 m depth.
SiteHistoryPotentials Emissions *
(Mg CO2-equivalents. ha−1)
Carbon Value
(USD ha−1)
RINConserved forest1451.0$7371
K22Naturally recovered site after the Clarín channel opening (1996) 4179.2$21,230
ANNaturally recovered site after the Aguas Negras channel opening (1998)1636.3$8312
AHUDegraded—Without vegetation1433.7$7283
* Obtained by multiplying C stocks by 3.67 [46].
Publisher’s Note: MDPI stays neutral with regard to jurisdictional claims in published maps and institutional affiliations.

