
Effects of Infiltration Amounts on Preferential Flow Characteristics and Solute Transport in the Protection Forest Soil of Southwestern China


1
Jinyun Forest Ecosystem Research Station, School of Soil and Water Conservation, Beijing Forestry University, Beijing 100083, China
2
Environmental Protection Research Institute of Light Industry, Research Centre for Urban Environment, Beijing Academy of Science and Technology, Beijing 100095, China
*
Author to whom correspondence should be addressed.
Water 2021, 13(9), 1301; https://doi.org/10.3390/w13091301
Submission received: 18 February 2021
/
Revised: 27 April 2021
/
Accepted: 3 May 2021
/
Published: 6 May 2021
(This article belongs to the Special Issue Soil Water Erosion)
Abstract
:Preferential flow has an important role as it strongly influences solute transport in forest soil. The quick passage of water and solutes through preferential flow paths without soil absorption results in considerable water loss and groundwater pollution. However, preferential flow and solute transport under different infiltration volumes in southwestern China remain unclear. Three plots, named P20, P40 and P60, were subjected to precipitation amounts of 20, 40 and 60 mm, respectively, to investigate preferential flow and solute transport characteristics via field multiple-tracer experiments. Stained soils were collected to measure Br− and NO3− concentrations. This study demonstrated that precipitation could promote dye tracer infiltration into deep soils. The dye tracer reached the maximum depth of 40 cm in P60. Dye coverage generally reduced with greater depth, and sharp reductions were observed at the boundary of matrix flow and preferential flow. Dye coverage peaked at the soil depth of 15 cm in P40. This result demonstrated that lateral infiltration was enhanced. The long and narrow dye coverage pattern observed in P60 indicated the occurrence of macropore flow. Br− and NO3− were found at each soil depth where preferential flow had moved. Increasing precipitation amounts increased Br− and NO3− concentration and promoted solute movement into deep soil layers. Solute concentration peaked at near the end of the preferential flow path and when preferential flow underwent lateral movement. These results indicated that the infiltration volume and transport capacity of preferential flow had important effects on the distribution of Br− and NO3− concentrations. The results of this study could help expand our understanding of the effects of preferential flow on solute transport and provide some suggestions for protection forest management in southwestern China.
1. Introduction
Preferential flow, considered as a typical soil water movement process in unsaturated soils, has an important influence on water infiltration and solute transport [1,2,3]. It is a rapid and nonequilibrium process that accounts for 11% to 54% of the entire water flow [4,5]. Preferential flow can cause water and solutes to rapidly bypass most of the soil matrix through preferential flow paths, which are formed by cracks, biological activities, root channels, erosive actions, soil shrinkage cracking and freezing–thawing phenomena [6,7,8]. Preferential flow thus drastically decreases the utilisation rate of water and nutrients and positively increases the contamination risks of groundwater [9].
Preferential flow has received considerable attention because it is an important factor that considerably influences water and nutrient transport in rainfall events. It is induced by numerous factors, including soil texture and structure; channels formed by biological activities, such as roots and earthworms; crop management; antecedent soil water; rainfall intensity and precipitation [6,10]. Soil types and structure have a complex effect on preferential flow because of their spatial heterogeneities, which can directly change the hydraulic properties, quantities and distribution of soil macropores. Soil clay content could change the soil pore structure and thus affect the type of preferential flow occurring in the soil [11]. The greater the clay content in the soil, the more obvious the macropore structure and the more favourable the formation of preferential flow [12,13]. Biological activities create complex channel systems that can serve as preferential flow paths, further influencing the lateral and vertical movements of preferential flow [14]. The role of antecedent soil water in preferential flow may differ under different soil and macropore conditions [15]. The effect of rainfall intensity on preferential flow has been well discussed, and several studies have shown that the proportion of macropore flow usually increases with the increase in rainfall intensity when it is higher than the infiltration rate [6,10]. However, preferential flow and its influence on water and solute transport under different precipitation amounts, which can affect soil moisture and soil water repellency during rainfall events, have received limited attention.
Vidon and Cuadra [10] showed that the proportion of the contribution of macropore flow to total flow flux is positively correlated with precipitation amounts. However, the spatial changes shown by preferential flow under different precipitation amounts have not been fully described and quantitatively evaluated. Such information is crucial for understanding the mechanism of preferential flow in different rainfall events. Moreover, identifying the role of preferential flow in solute transport under different precipitation volumes can help reduce groundwater pollution.
Tracing experiments are increasingly used to study preferential flow in the field and laboratory [16,17]. The food-grade dye Brilliant Blue is widely applied to describe preferential flow because of its advantages of low cost, high water solubility, limited toxicity, stability and distinct visibility [15]. However, it cannot describe solute transport during different steps of infiltration. Therefore, multiple-tracer experiments have been gradually performed to characterise preferential flow and solute transport given the similarity of their advantages with those of experiments with Brilliant Blue FCF [1,3]. In these experiments, image processing is used to describe the distribution of preferential flow, and the concentrations of tracer ions are measured to characterise solute transport during infiltration.
The Three Gorges reservoir area is located in the combination of the middle and upper reaches of the Yangtze River, with complex topography, large spatial variation of natural resources and strong anthropogenic interference. It is a sensitive ecological area and an important functional area for soil and water conservation in China. The protection forest optimisation project of nearly 270,000 ha has been implemented to solve the problems of unreasonable spatial distribution and structure of forest species, poor quality of forest stands and low ecological protection effectiveness in the Three Gorges reservoir area of the Yangtze River. However, fertilisers and pesticides are widely applied in the process of optimising the construction of protective forests, which has an impact on the quality of water resources in the Three Gorges reservoir area. High mean annual precipitation reaching 1031 mm increases groundwater contamination risks in this region [15]. More than 80% of rainfall is received during April to October, with the region receiving the highest amount of rainfall during June to August. The utilisation rate of water, fertilisers and pesticides may be seriously influenced by preferential flow during these months. In addition, groundwater contamination is promoted by the increase in the amount of solutes that infiltrate deep soil together with preferential flow. Thus, determining preferential flow characteristics and their effect on solute transport under different infiltration amounts is highly desirable. The objective of the present study was to (1) characterise the distribution of preferential flow and (2) determine solute transport with preferential flow under different infiltration amounts via multiple-tracer experiments.
2. Materials and Methods
Field Experiments
Field multiple-tracer experiments were conducted in protection forest soil in Simian Mountain (28°36′ N, 106°23′ E), Chongqing Province, Three Gorges Area, China. This area is located at the end of the Three Gorges reservoir area where it has a subtropical humid monsoon climate with 17–19 °C annual mean temperature and 1000–1250 mm mean annual precipitation received mainly from April to October. According to the Chinese soil taxonomy, the soil type of the study area is yellow earth, which belongs to the class of ferralsols, the subclass of wet-warm ferralsols. To improve the protective forest system, people have been optimising the species and spatial configuration of the protection forests in this region from 2000 to the present. Our study selected the protection forests which were mainly dominated by Cunninghamia lanceolate and Quercus acutissima, and the understory companion plant species include Itea oblonga, Eurga loquaiana, Plagiogyria distinctissima and Aster ageratoides. In the first 3 years, pest and disease control were conducted in the protection forest regularly. The pesticides (Use 0.75~1% Bordeaux, 75% chlorothalonil wettable powder, or 65% Dyson zinc) were applied during July to August once a week for 3 consecutive weeks, with 50 to 70 kg of the pesticides per mu. The type of fertiliser, the amount of fertiliser applied, and the time of fertiliser application depend on the actual forest growth.
Undisturbed soil cores with volumes of 100 cm3 and soil samples with weights of approximately 500 g were collected at the depth intervals of 0–10, 10–20, 20–30, 30–40, 40–50 and 50–60 for the measurement of soil properties, including soil texture, bulk density, total porosity and organic matter content, in the laboratory. Soil characteristics are listed in Table 1.
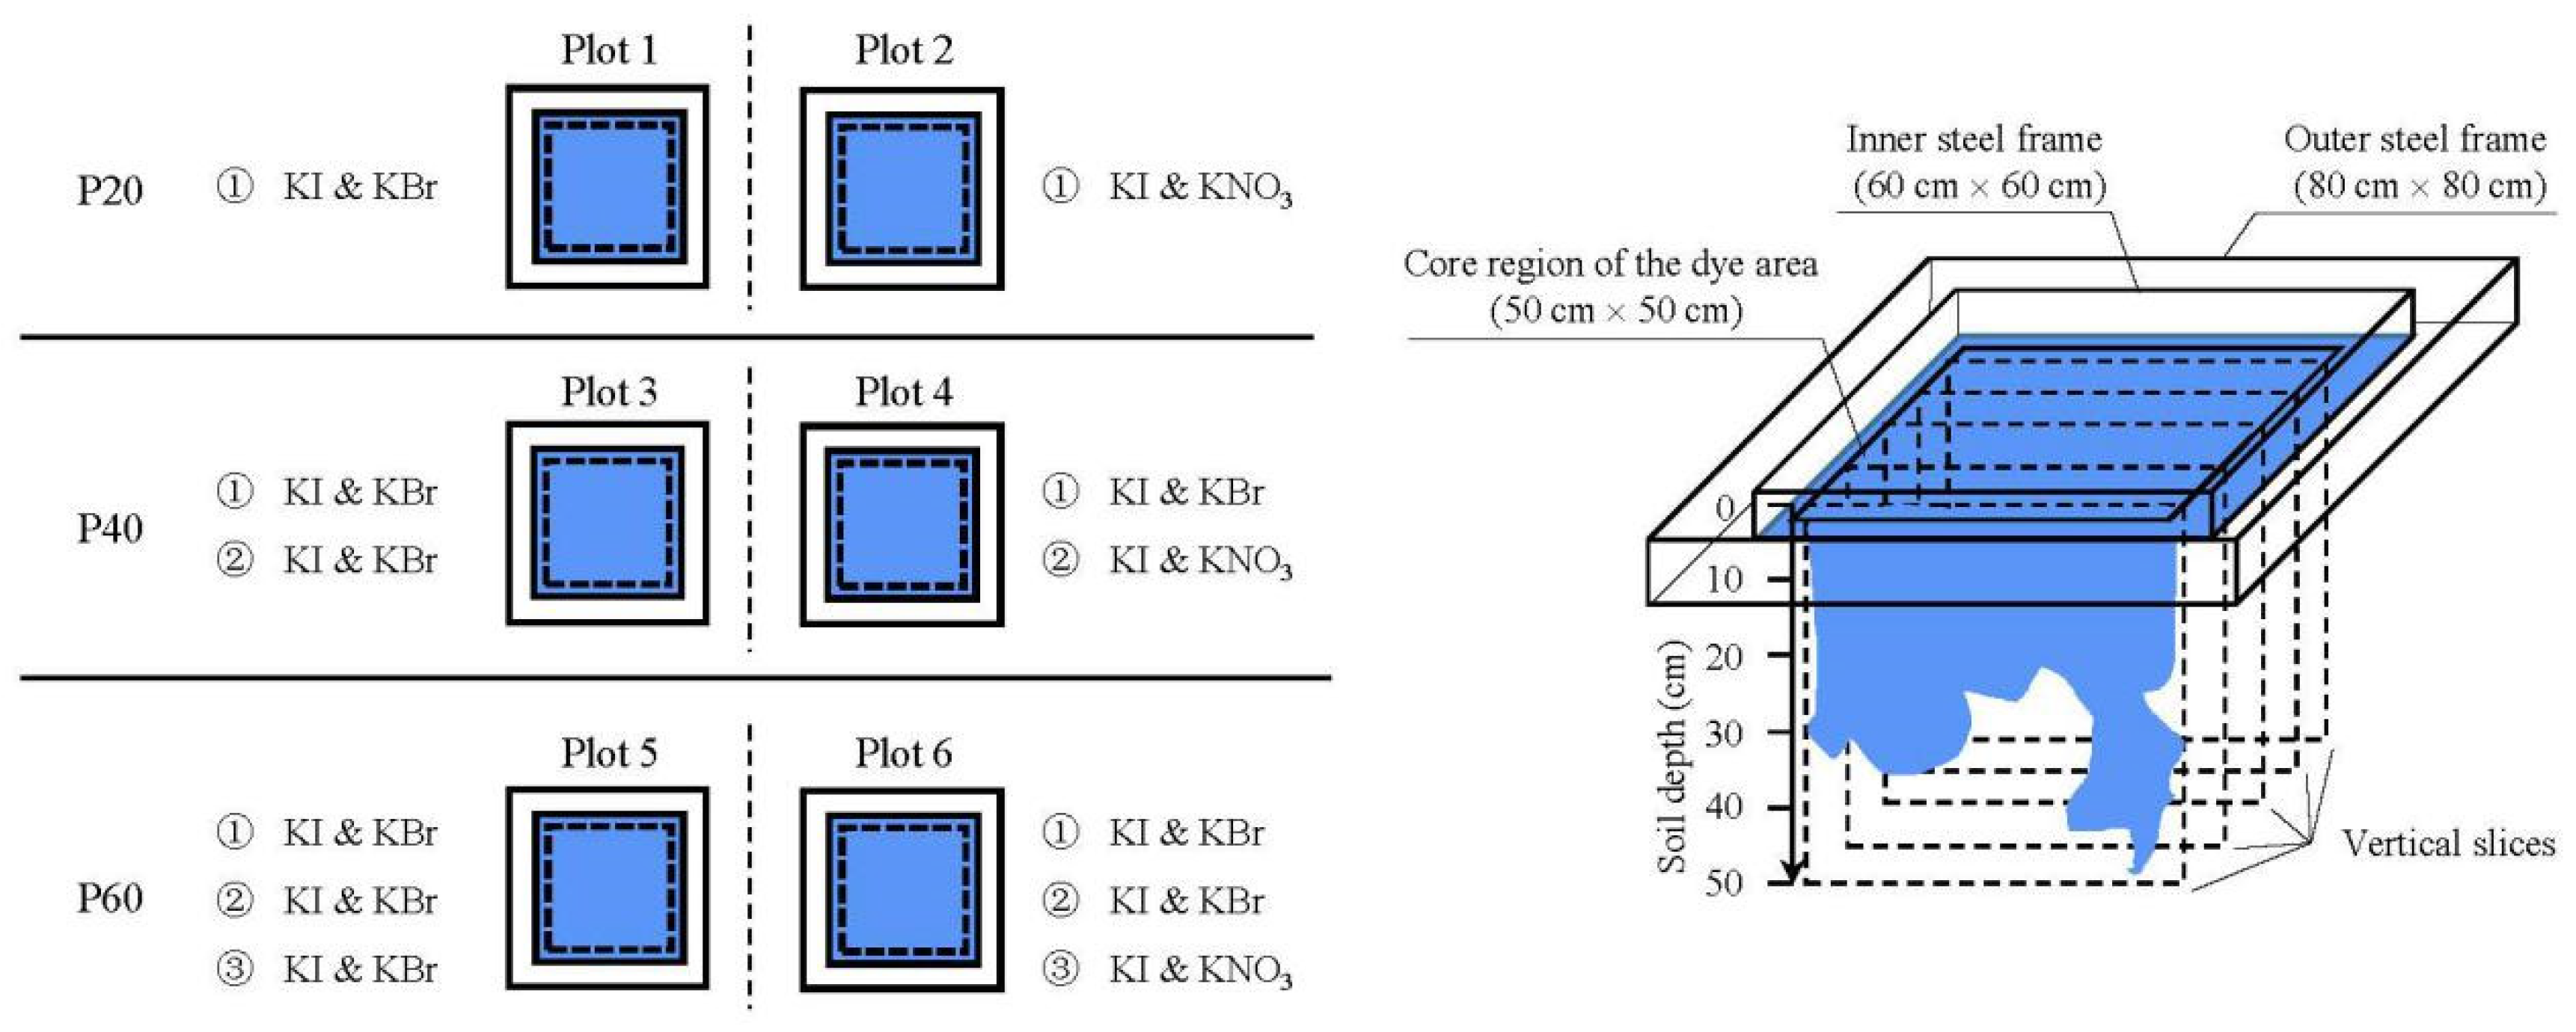
In this study, three areas with similar site conditions were selected for the replication of the field multiple-tracer experiments. In each area, three different infiltration levels of 20, 40 and 60 mm were established to simulate three different infiltration amounts, which were designated as P20, P40 and P60, respectively. Each level had two plots, which were treated with different solutions. A total of 18 plots were established for the six treatments, with each type of treatment having three replicates (3 replicates × 6 plots each = 18 plots total). For each plot, two rectangular iron frames, namely, an inner frame with dimensions of 60 cm (length) × 60 cm (width) × 50 cm (height) and an outer frame with dimensions of 80 cm × 80 cm × 50 cm, were concentrically embedded into the soil to a depth of 30 cm after the experimental surface had been cleaned and smoothed. After embedding, the soil within 5 cm was compacted by using a wooden hammer to prevent dye tracer infiltration along the frames. Due to the relatively high initial water content of the soil in the study area, the accumulation of water will rapidly form on the soil surface layer. Therefore, the solution was quickly applied to the soil surface of the inner frame to simulate instantaneous ponding infiltration. In accordance with double-ring infiltration, the same depth of freshwater was simultaneously applied to the soil surface of the outer frame at each step to force the solution to infiltrate into the inner frame fully. The details of the field multiple-tracer experiments are shown in Figure 1 and Table 2. These details include the layout of the plots, the solute of the solution, the volume of the solution and the time consumed for solution infiltration. The solution from step 2 (3) should be added only when the solution from step 1 (2) is completely infiltrated to avoid the mixing of different solutions. The plots were covered with plastic tarpaulin to prevent evaporation and rainfall. After 24 h from the beginning of the experiment, five vertical slices were excavated from the core region of the dye area to avoid excavating disturbed soil edges. Each vertical slice was spaced 10 cm apart. A fine mist of a solution of starch (50 g L−1) and Fe2(SO4)3 (20 g L−1) was uniformly sprayed onto the excavated soil surface immediately after a slice was exposed. The solution was an iodide indicator solution and showed a distinct purple colour when it encountered iodine molecules. After sufficient reaction for approximately 10 min, a digital camera (2560 × 1960) was used to photograph the dye-stained patterns of the horizontal and vertical slices. Colour images were classified as stained or unstained areas in accordance with the procedure of Yao et al. [15]. In this study, each 1 mm × 1 mm area of the original slice was represented by one pixel. After photography, soil samples weighing approximately 100 g were collected from the stained area at a site 5 mm below each excavated soil surface to remove the solution of starch and Fe2(SO4)3. These soil samples were collected to measure the concentrations of Br− and NO3−. The initial concentrations of Br− in the soil were ignored because they were significantly lower than the applied concentrations. The concentration of NO3− in plot 1 was considered as the initial concentration of NO3− in the soil.
3. Results and Discussion
3.1. Spatial Variation Characteristics of Preferential Flow
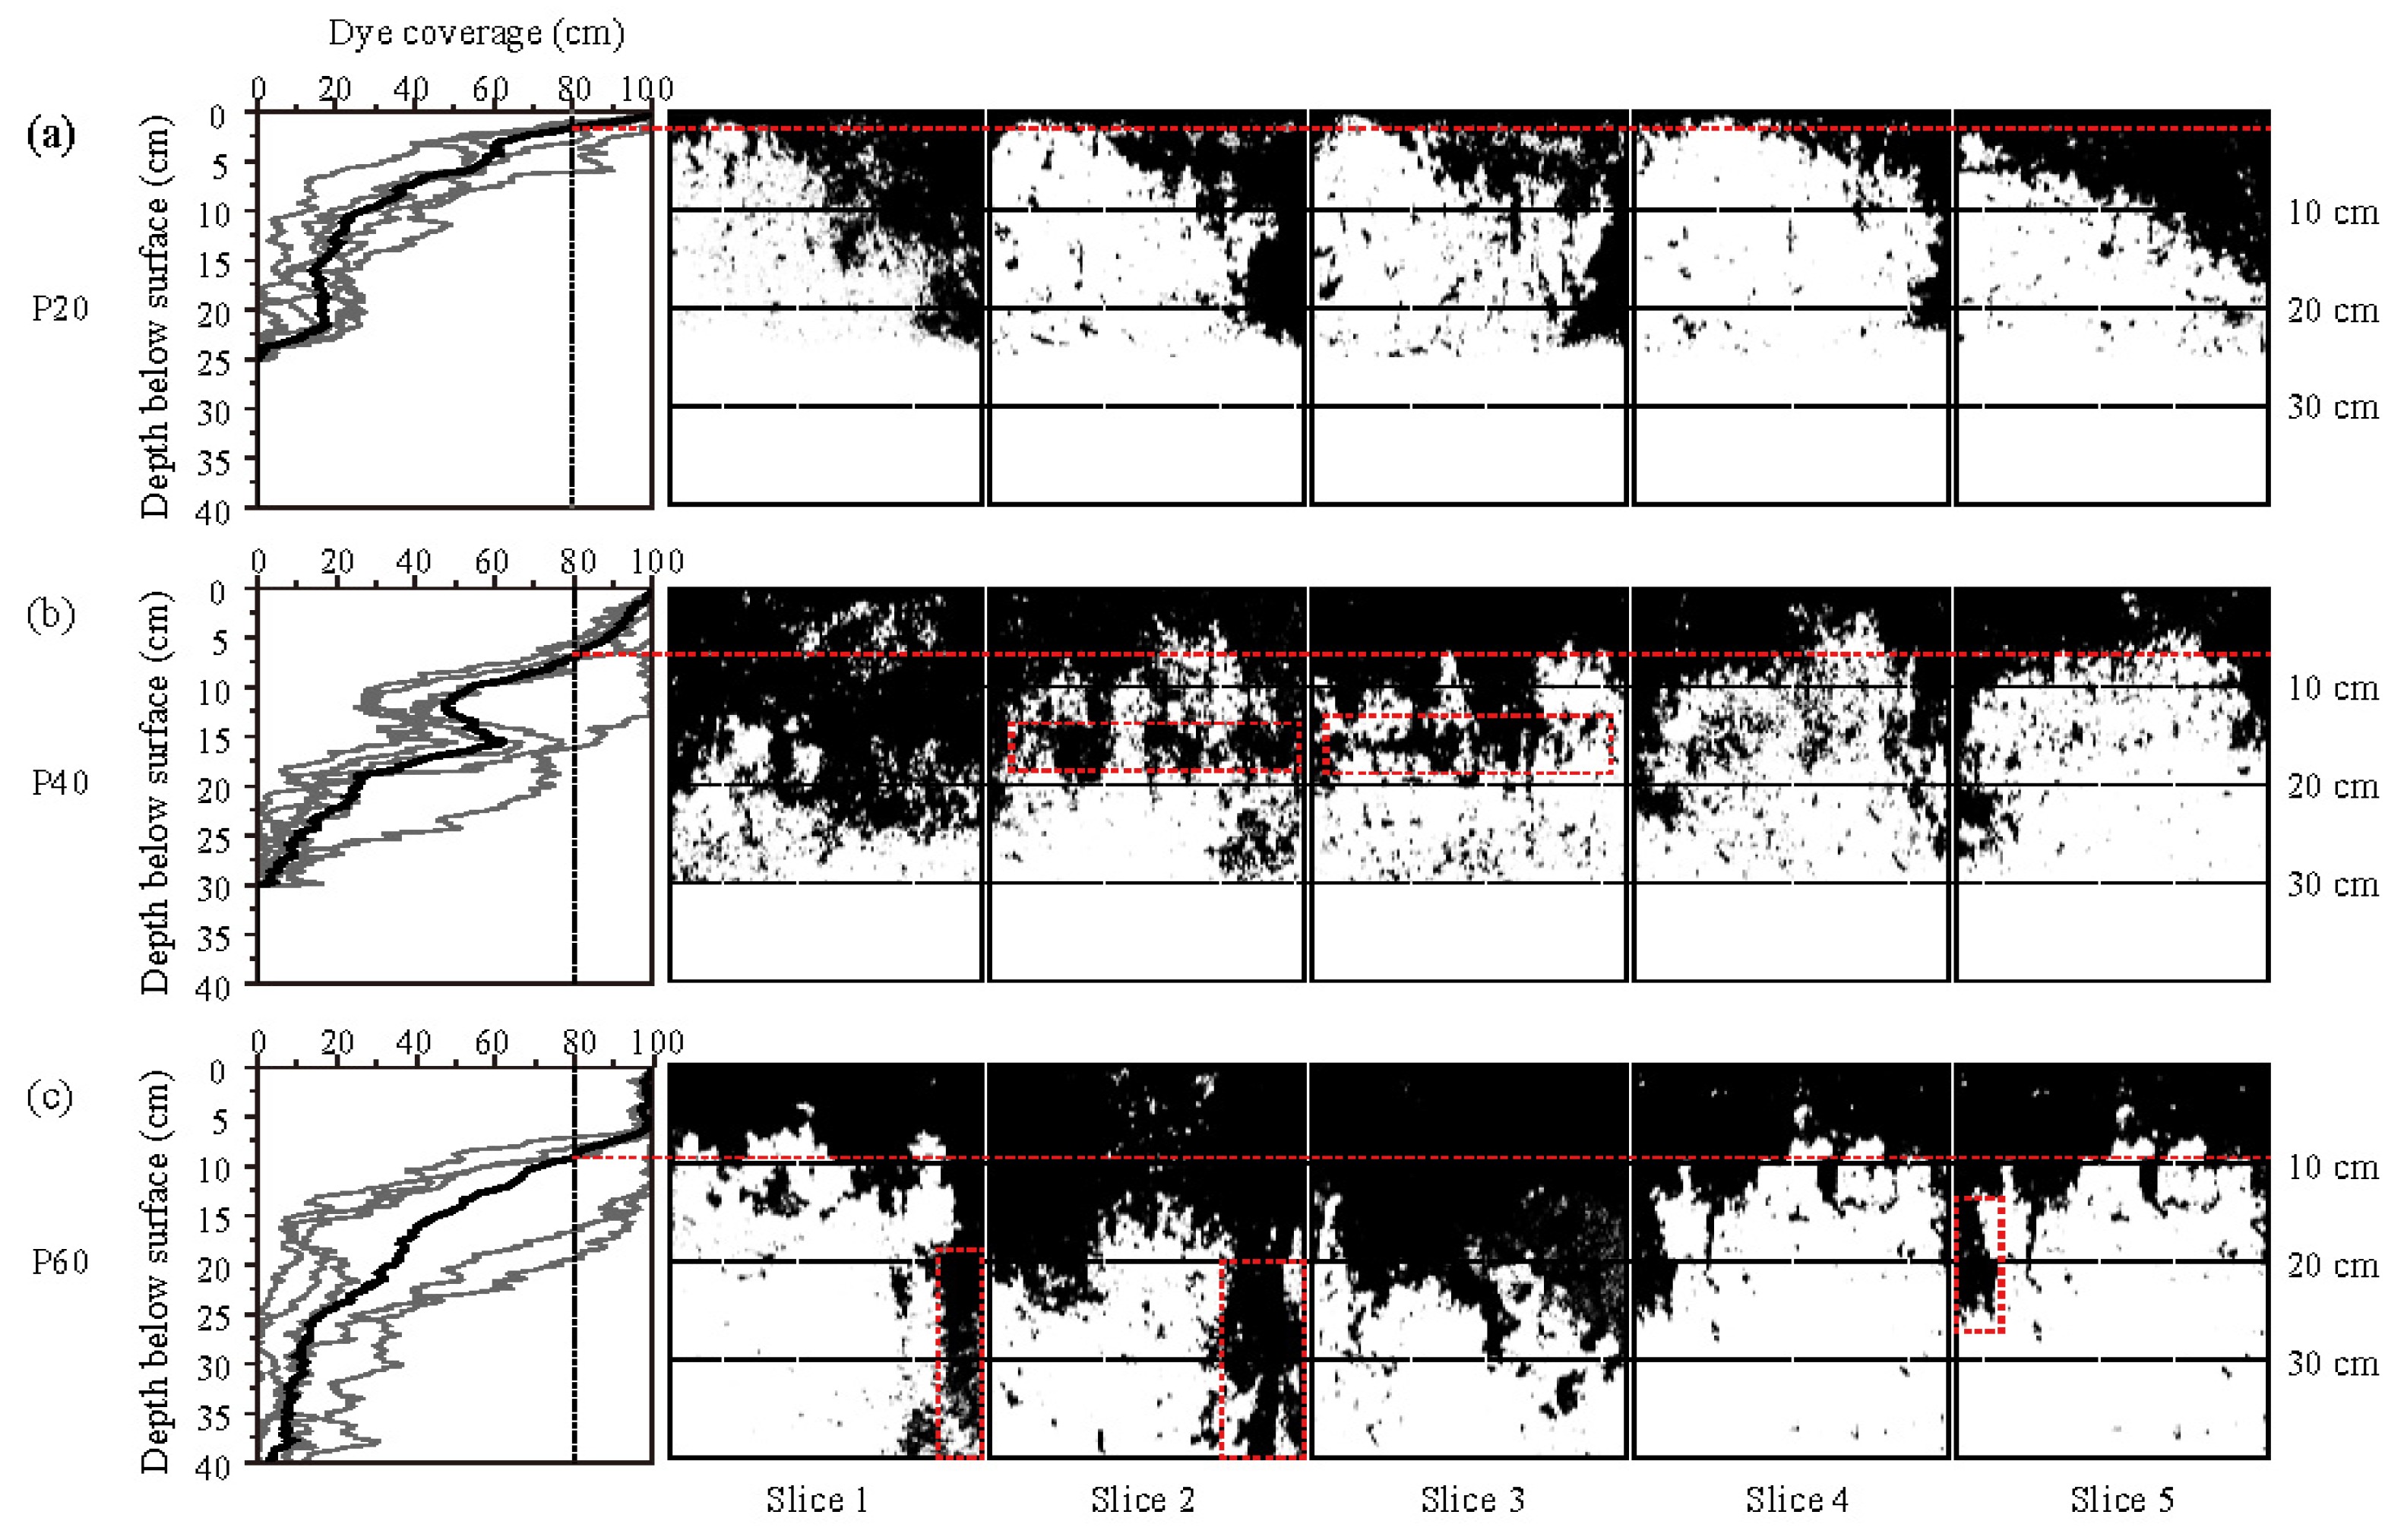
We compared and calculated the data extracted from vertical sections under different infiltration amounts. The dye coverage distributions and the images of dye flow patterns in vertical sections are shown in Figure 2. The nonuniform or dissimilar distributions of dye areas under different infiltration amounts suggested that different preferential flow patterns had developed. As shown in Figure 2, most of the vertical slices were stained with a dye coverage of more than 80% in the topsoil, indicating that the topsoil experienced matrix flow [15,18]. Meanwhile, the matrix flow depths for P20 (Figure 2a), P40 (Figure 2b) and P60 (Figure 2c) were 1.6, 7 and 9.3 cm. These results were similar to the conclusion of a study in plantation forests in the southwest karst region [19], which has shown that the depth of matrix flow increased with the increase in infiltration amounts. The increase in infiltration water corresponded to a longer rainfall period, increasing the potential energy of water supply, and the increase in water potential gradient increased the uniform infiltration of soil water. Additionally, the increase in infiltration water increased the water content in the lower soil layer, slowed down the rate of water infiltration, and promoted the lateral movement of water in the top soil layer to form matrix flow [20].
Due to the increased depth of matrix flow, it was also expected that dye would infiltrate deeper under the higher infiltration amounts. Indeed, our results showed that the maximum infiltration depths for P20, P40 and P60 were 25, 30 and 40 cm, respectively. The consistency of these results with the findings of several other researchers [20,21] indicated the extensive variation range of the movement of the water in the soil under high infiltration amounts. However, our results showed that the matrix flow depth and the maximum infiltration depth occurred in deeper soil layers compared to the study in the plantation forests in the southwest karst region. This could be due to the fact that the sand content and total soil porosity in the soils of our study area (66.33%; 60.30%) were higher than those of the above study area (27.59%; 37.91%). Previous studies have reported that water movement in clay soils was dominated by preferential flow with less matrix flow compared to loamy soils, as the clay soils were fine-textured and well-structured and were more conducive to the presence of macropores. Additionally, Yan [22] also found that the matrix flow depth was 12 cm and the maximum infiltration depth was 28 cm in sandy soils with a sand content of about 80%. Therefore, in future studies of preferential flow, the depth of occurrence of preferential flow and the maximum depth of infiltration could be predicted based on soil conditions and infiltration amounts.
In our study, infiltration amounts had a substantial effect on the spatial heterogeneities of preferential flow despite the similar properties of the three plots (Figure 2). Reductions in the patterns of dye coverage showed different trends amongst P20, P40 and P60. Compared with that in P40 and P60, which showed considerably different patterns amongst vertical slices with the reduction in depth, the pattern of decrement in P20 showed no evident change, indicating small spatial heterogeneity (Figure 2a). This result may be attributed to the small depth of matrix flow that lacked sufficient head pressure to allow the formation of preferential flow path networks. Thus, the dye tracer infiltrated into deep soil layers only through a small part of preferential flow paths under low infiltration. In P40, unexpected increases in dye coverage were detected as the soil depth increased to 15 cm in P40, demonstrating that high amounts of the dye tracer had infiltrated into these layers (Figure 2b). Therefore, lateral preferential flow became increasingly evident with the increase in infiltration amount because the infiltration amount exceeded the capacity for the vertical transport of the preferential flow to block preferential flow paths. This phenomenon could also be associated with preferential flow path characteristics, resulting in the high lateral movement of the dye tracer. Root channels are considered as primary preferential flow paths in forest soils [9,23]. An investigation into the root systems in the study area revealed that the total root length of the root with root diameter <1 mm in the 10–20 cm soil layers was greater than that in the other soil layers except topsoil (0–5 cm) (Table 3). Consequently, in this region, the large number of intricate root distributions affected the connectivity of priority flow paths and thus increased lateral preferential flow along root channels. The dye coverage distribution in P60 was consistent with that in P20. Specifically, it lacked a peak and decreased gradually with soil depth. The dye coverage in the vertical slices from P60 had large standard deviations. Three of the five dyed coverage distribution curves showed sharp reductions in the 10–15 cm soil layers and an obvious trailing phenomenon at the soil depths of 15–40 cm, indicating the existence of penetrating macropore flow (Figure 2c). This result was largely explained by the fact that the increasing amount of infiltration increased the head pressure of the preferential flow. This effect then prompted the formation of the preferential flow network and increased the connectivity of the preferential flow network. In this case, the transport patterns of preferential flow could be divided into two types under the influence of spatial heterogeneity caused by soil texture and roots and biological activities [24,25]. In one case, preferential flow paths were connected vertically to form macropores, and water was transported rapidly through macropores to deep soil layers, thus bypassing most of the soil matrix. By contrast, in the absence of macropores, the unstable wetting front continued to expand because the infiltration rate was lower than the saturated hydraulic conductivity of the soil. This result, in turn, led to the finger-like preferential flow pattern of water and solutes. At the same time, as the infiltration amount was increased, the flow pattern transformed from one dominated by preferential flow to one dominated by matrix flow. Furthermore, macropore flow and finger-like flow appeared as illustrated in Figure 2. The appearance of these flows provided support for the above explanation.
Combining these results, the soil in the study area was dominated by sandy loam, and when the infiltration was less than 60 mm, the occurrence of preferential flow could increase the connectivity of soil pores and enhance the water retention capacity of the soil. However, when the infiltration was greater than 60 mm, macropore flow might be formed, which would transport water directly to the deeper soil layers to reduce the water utilisation rate, increase the risk of groundwater contamination and possibly reduce the stability of the soil body to induce geological disasters such as landslides.
3.2. Effect of Preferential Flow on Solute Transport
The occurrence and development of preferential flow have an important effect on water and solute transport [26]. Br− and NO3− were mixed with KI separately and infiltrated at different stages to investigate the effect of different infiltration amounts on solute transport. The detailed process of this experiment was performed in accordance with reference methods. The concentration distributions of applied Br− and NO3− in P20, P40 and P60 are shown in Figure 3 and Figure 4. The infiltration depths of the Br− and NO3− solutes were almost identical with those of preferential flow and increased with the increase in infiltration water volume. These results were consistent with the findings of earlier studies showing that soil-water movement depends strongly on rain intensity [27]. However, the different distributions of Br− and NO3− concentrations after the experiment suggested that different types of preferential flows had different effects on solute transport (Figure 3 and Figure 4).
As shown in Figure 3, the concentration of Br− at 0–40 cm soil depth under different infiltration intensities followed the order of plot 5 > plot 3 > plot 1, suggesting that increases in infiltration could increase in concentration. Additionally, in these plots, Br− concentration distributions displayed small, W-shaped serrated patterns with the increase in soil depth and were highest in the topsoil layer. In other words, the Br− concentration distributions in these plots showed similar trends and decreased with soil depth but peaked in different soil layers. In plot 1, Br− concentration peaked at the soil depth of 20 cm. In plot 3, Br− concentration peaked at the soil depth of 15 cm and then again at 25 cm. In plot 5, the first peak of the Br− concentration was observed at the soil depth of 20 cm and the second at the soil depth of 35 cm. These results indicated that with the increase in infiltration amount, the peak of Br− concentration appeared in deep soil layers and at near the end of the preferential flow. The last peak of Br− concentration observed in each plot was most likely attributed to the solution reaching the end of the preferential flow paths where accumulation occurred and the wetting fronts continued to extend to the surrounding area [28]. Consequently, high Br− concentration was found at about 5 cm before the maximum infiltration soil depth. The other peaks might be attributed to the fact that when the upper infiltration water volume was increased to 40 mm and 60 mm, infiltration exceeded the capacity for the vertical transport of preferential flow, resulting in the accumulation of water and the development of lateral infiltration. Dye coverage in the layer where the peak was higher than that in other layers also supported this interpretation (Figure 2), suggesting that the distribution pattern of preferential flow was the key to influencing solute transport.
In comparison to plot 3 and plot 5, plot 4 and plot 6 used the solutions of KI and KNO3 instead of KI and KBr in the final infiltration phase. The main purpose of this measure was to analyse the effect on the Br− concentration in the soil for infiltration volumes of 20–40 mm and 40–60 mm, respectively. As shown in Figure 3, the concentration of Br− in plot 4 was similar to that in plot 3, indicating that the infiltration volume of 20–40 mm did not change the distribution of Br− concentration. The distribution of Br− concentration in plot 6 was significantly different from that in the preferential flow dyeing area. In plot 6, unexpected increases in Br− concentration were detected as the soil depth increased from 0 cm to 20, demonstrating that a large amount of Br− in the surface layer was transported to the deeper soil by the preferential flow when the infiltration volume was at 40–60 mm. These results indicated that the solution from the second stage of infiltration mixed with the solution from the first stage of infiltration in the soil and transported downward. The third stage of infiltration pushed the pre-infiltrated solution downward with little interaction (as an approximately piston flow) at depths of 0–10 cm soil layers, probably because the first two stages of infiltration made the soil water saturated.
The NO3− concentrations in plot 2, plot 4 and plot 6 represented the distribution of NO3− at 0–20 mm, 20–40 mm and 40–60 mm of infiltration water, respectively (Figure 4). The NO3− concentration shown in plot 1 was the original soil NO3− content when the NO3− -containing tracer was not added. The original NO3− concentration in the soil was low and therefore had a slight influence on the distribution of NO3− concentration in the solute transport experiments. The pattern of NO3− concentration in plot 2 was consistent with that of Br− concentration in plot 1. This result indicated the absence of a significant difference in the concentration distribution of different solutes transported with preferential flow under a 20 mm infiltration volume. This is consistent with other studies that have shown rapid downward transport of water through the native preferential flow paths at low infiltration volume [21,22]. The significantly lower concentration of NO3− than that of Br− at an infiltration of 20 mm may be attributed to the fact that NO3− is more readily available to plants and microorganisms than Br− and converted into other forms, such as N2 and NH4+. In plot 4, the highest NO3− concentration was detected in the topsoil, and NO3− concentration in other soil layer was significantly lower than that in plot 2, suggesting that the second stage solution was mainly concentrated on the soil surface and did not transport to deeper soil layers with the preferential flow. In plot 6, NO3− concentration decreased with the increase in soil layers without significant peaks. This result was consistent with previous studies indicating that increasing infiltration reduced the capillary effect of the soil layer and promoted the vertical connectivity of preferential flow paths, resulting in rapid solute transport to deep layers [1,29,30]. However, differently from previous studies, there were no peaks observed in this study and the NO3− concentration in plot 6 was significantly higher than that in plot 4, suggesting that the solute infiltration process in the third stage was accumulated and rapidly transported. This result may be due to the fact that when the amounts of infiltration volume reached a certain threshold, the formation of a penetrating macropore flow promoted the downward transport of solutes and reduced lateral infiltration.
These observations suggested that when the amount of water infiltration exceeded 40 mm, preferential flow infiltration depth and development increased, and solutes could infiltrate into deep soil layers along with macropore preferential flow during rainfall events. Therefore, in the future management of protective forest cultivation, fertiliser application and pesticide spraying before rain storms should be avoided as much as possible in order to reduce the pollution of shallow groundwater by pesticides and nutrients, etc.
4. Conclusions
Our results indicated that infiltration amounts significantly affected dye flow patterns and infiltration depth. When the infiltration volume was less than 40 mm, further increasing infiltration amounts increased the lateral infiltration of preferential flow and increased solute concentration. When the infiltration volume exceeded 40 mm, increasing infiltration amounts resulted in the development of highly continuous and effective preferential flow paths and increased the amount of solutes transported to deep soil layers through macropores. The results shown in this study could provide some suggestions for protected forest management and preferential flow hazard reduction. Nevertheless, the scale of this study was small, and the results might be influenced by soil heterogeneity. Further research should combine solute transport models with field tracing experiments to explore large-scale preferential flow and solute transport characteristics during natural rainfall events.
Author Contributions
Conceptualisation, M.L. and J.Y; methodology, M.L., R.Y. and J.Y.; software, M.L.; validation, M.L. and J.Y; formal analysis, M.L., R.Y. and J.C.; investigation, M.L. and J.Y; resources, M.L., R.Y. and J.C.; data curation, M.L.; writing—original draft preparation, M.L., J.C., R.Y. and J.Y.; writing—review and editing, M.L. and J.Y.; visualisation, M.L. and J.Y; supervision, M.L. and J.Y; project administration, M.L.; funding acquisition, M.L., R.Y. and J.C. All authors have read and agreed to the published version of the manuscript.
Funding
This research was funded by the National Science and Technology Major Project (2018ZX07101005) and the National Natural Science Foundation of China (32071839).
Institutional Review Board Statement
No studies involving humans or experimental animals were conducted in this research.
Informed Consent Statement
No studies involving humans or experimental animals were conducted in this research.
Data Availability Statement
The data presented in this study are available on request from the corresponding author. The data are not publicly available due to privacy or ethical restrictions.
Acknowledgments
Many thanks to the Forest Management Station of Simian Mountain for offering accommodations and supporting field experiments. We also gratefully acknowledge the editor and reviewers.
Conflicts of Interest
The authors declare no conflict of interest.
References
- Wang, K.; Zhang, R. Heterogeneous soil water flow and macropores described with combined tracers of dye and iodine. J. Hydrol. 2011, 397, 105–117. [Google Scholar] [CrossRef]
- Nimmo, J.R. Preferential flow occurs in unsaturated conditions. Hydrol. Process. 2012, 26, 786–789. [Google Scholar] [CrossRef]
- Sheng, F.; Liu, H.; Kang, W.; Zhang, R.; Tang, Z. Investigation into preferential flow in natural unsaturated soils with field multiple-tracer infiltration experiments and the active region model. J. Hydrol. 2014, 508, 137–146. [Google Scholar] [CrossRef]
- Legout, A.; Legout, C.; Nys, C.; Dambrine, E. Preferential flow and slow convective chloride transport through the soil of a forested landscape (Fougères, France). Geoderma 2009, 151, 179–190. [Google Scholar] [CrossRef]
- Heijdena, G.d.; Legouta, A.; Polliera, B.; Bréchetb, C.; Rangera, J.; Dambrinec, E. Tracing and modeling preferential flow in a forest soil—Potential impact on nutrient leaching. Geoderma 2013, 195–196, 12–22. [Google Scholar] [CrossRef]
- Jarvis, N.J. A review of non-equilibrium water flow and solute transport in soil macropores: Principles, controlling factors and consequences for water quality. Eur. J. Soil Sci. 2007, 58, 523–546. [Google Scholar] [CrossRef]
- Forsmann, D.M.; Kjaergaard, C. Phosphorus release from anaerobic peat soils during convective discharge—Effect of soil Fe:P molar ratio and preferential flow. Geoderma 2014, 223–225, 21–32. [Google Scholar] [CrossRef]
- Alaoui, A. Modelling susceptibility of grassland soil to macropore flow. J. Hydrol. 2015, 525, 536–546. [Google Scholar] [CrossRef]
- Yi, J.; Yang, Y.; Liu, M.; Hu, W.; Zhang, D. Characterising macropores and preferential flow of mountainous forest soils with contrasting human disturbances. Soil Res. 2019, 57, 601–614. [Google Scholar] [CrossRef]
- Vidon, P.; Cuadra, P.E. Impact of precipitation characteristics on soil hydrology in tile-drained landscapes. Hydrol. Process. 2010, 24, 1821–1833. [Google Scholar] [CrossRef]
- Sheng, F.; Kang, W.; Zhang, R.; Liu, H. Characterizing soil preferential flow using iodine–starch staining experiments and the active region model. J. Hydrol. 2009, 367, 115–124. [Google Scholar] [CrossRef] [Green Version]
- Chen, X.; Cheng, J. Application of Landscape Pattern Analysis to Quantitatively Evaluate the Spatial Structure Characteristics of PreferentialFlow Paths in Farmland. Appl. Eng. Agric. 2016, 32, 203–215. [Google Scholar] [CrossRef]
- Grant, K.N.; Macrae, M.L.; Ali, G.A. Differences in preferential flow with antecedent moisture conditions and soil texture: Implications for subsurface P transport. Hydrol. Process. 2019, 33, 2068–2079. [Google Scholar] [CrossRef]
- Murielle, G.; Sidle, R.C.; Alexia, S. The Influence of Plant Root Systems on Subsurface Flow: Implications for Slope Stability. BioScience 2011, 61, 869–879. [Google Scholar] [CrossRef]
- Yao, J.; Cheng, J.; Sun, L.; Zhang, X.; Zhang, H. Effect of Antecedent Soil Water on Preferential Flow in Four Soybean Plots in Southwestern China. Soil Sci. 2017, 182, 1. [Google Scholar] [CrossRef]
- Mooney, S.J.; Morris, C. A morphological approach to understanding preferential flow using image analysis with dye tracers and X-ray Computed Tomography. Catena 2008, 73, 204–211. [Google Scholar] [CrossRef]
- Wang, F.; Chen, H.; Lian, J.; Fu, Z.; Nie, Y. Preferential Flow in Different Soil Architectures of a Small Karst Catchment. Vadose Zone J. 2018, 17, 2–10. [Google Scholar] [CrossRef]
- Bargués Tobella, A.; Reese, H.; Almaw, A.; Bayala, J.; Malmer, A.; Laudon, H.; Ilstedt, U. The effect of trees on preferential flow and soil infiltrability in an agroforestry parkland in semiarid Burkina Faso. Water Resour. Res. 2014, 50, 3342. [Google Scholar] [CrossRef] [PubMed] [Green Version]
- Kan, X.; Cheng, J.; Hou, F. Response of Preferential Soil Flow to Different Infiltration Rates and Vegetation Types in the Karst Region of Southwest China. Water 2020, 12, 1778. [Google Scholar] [CrossRef]
- Hardie, M.; Doyle, R.; Cotching, W.; Holz, G.; Lisson, S. Hydropedology and Preferential Flow in the Tasmanian Texture-Contrast Soils. Vadose Zone J. 2013, 12, 108–112. [Google Scholar] [CrossRef]
- Markus, W.; Felix, N. An experimental tracer study of the role of macropores in infiltration in grassland soils. Hydrol. Process. 2003, 17, 477–493. [Google Scholar] [CrossRef]
- Yan, J.; Zhao, W. Characteristics of preferential flow during simulated rainfall events in an arid region of China. Environ. Earth Sci. 2016, 75, 566. [Google Scholar] [CrossRef]
- Luo, Z.; Niu, J.; Xie, B.; Zhang, L.; Zhu, S. Influence of Root Distribution on Preferential Flow in Deciduous and Coniferous Forest Soils. Forests 2019, 10, 986. [Google Scholar] [CrossRef] [Green Version]
- Pan, W.; Xu, Y.; Liu, Y.; Gao, L.; Yao, X. Quantitative determination of preferential flow characteristics of loess based on nonuniformity and fractional dimension. Trans. CSAE 2017, 33, 140–147. [Google Scholar] [CrossRef]
- Schaik, N.L.M.B.V. Spatial variability of infiltration patterns related to site characteristics in a semi-arid watershed. Catena 2009, 78, 36–47. [Google Scholar] [CrossRef]
- Makowski, V.; Julich, S.; Feger, K.H.; Breuer, L.; Julich, D. Leaching of dissolved and particulate phosphorus via preferential flow pathways in a forest soil: An approach using zero-tension lysimeters. J. Plant. Nutr. Soil Sci. 2020, 183, 238–247. [Google Scholar] [CrossRef] [Green Version]
- Wu, Q.; Zhang, J.; Lin, W.; Wang, G. Appling dyeing tracer to investigate patterns of soil water flow and quantify preferential flow in soil columns. Trans. CSAE 2014, 30, 82–90. [Google Scholar] [CrossRef]
- Ghafoor, A.; Koestel, J.; Larsbo, M.; Moeys, J.; Jarvis, N. Soil properties and susceptibility to preferential solute transport in tilled topsoil at the catchment scale. J. Hydrol. 2013, 492, 190–199. [Google Scholar] [CrossRef]
- Wang, W.; Zhang, H.; Li, M.; Cheng, J.; Lu, W. Infiltration characteristics of water in forest soils in the Simian mountains, Chongqing City, southwestern China. Front. For. China 2009, 4, 338–343. [Google Scholar] [CrossRef]
- Kramers, G.; Richards, K.G.; Holden, N.M. Assessing the potential for the occurrence and character of preferential flow in three Irish grassland soils using image analysis. Geoderma 2009, 153, 362–371. [Google Scholar] [CrossRef]
Figure 1.
Diagram of the experimental set-up for multiple-tracer experiments.

Figure 2.
Images showing vertical slices from the dye-stained soil profiles and average dye coverage of vertical slices with depth under different water amounts: (a) 20, (b) 40 and (c) 60 mm.
Figure 2.
Images showing vertical slices from the dye-stained soil profiles and average dye coverage of vertical slices with depth under different water amounts: (a) 20, (b) 40 and (c) 60 mm.

Figure 3.
Changes in Br− concentration with soil depth.

Figure 4.
Changes in NO3− concentration with soil depth.


Table 1.
Soil characteristics of the studied field.
| Depth (cm) | Sand Content (%) (2–0.02 mm) | Silt Content (%) (0.02–0.002 mm) | Clay Content (%) (≤0.002 mm) | Bulk Density (g·cm3) | Total Porosity (%) | Organic Matter Content (%) |
|---|---|---|---|---|---|---|
| 0–10 | 66.33 ± 6.03 | 28.76 ± 1.03 | 4.91 ± 0.09 | 1.05 ± 0.07 | 60.30 ± 8.83 | 4.78 ± 0.23 |
| 10–20 | 59.34 ± 3.34 | 30.67 ± 0.78 | 9.99 ± 0.23 | 1.13 ± 0.03 | 58.15 ± 3.08 | 4.33 ± 0.12 |
| 20–30 | 45.32 ± 2.92 | 42.19 ± 2.26 | 12.49 ± 0.43 | 1.22 ± 0.06 | 50.95 ± 1.98 | 3.21 ± 0.13 |
| 30–40 | 44.32 ± 3.00 | 43.18 ± 2.23 | 12.50 ± 0.48 | 1.30 ± 0.02 | 52.20 ± 1.89 | 2.56 ± 0.13 |
| 40–50 | 43.21 ± 4.25 | 46.03 ± 1.30 | 10.76 ± 0.92 | 1.29 ± 0.03 | 49.36 ± 1.23 | 2.01 ± 0.12 |
| 50–60 | 40.45 ± 3.74 | 49.06 ± 3.24 | 10.49 ± 0.45 | 1.27 ± 0.05 | 49.71 ± 0.89 | 1.54 ± 0.11 |
Note: Data in the table are the average value ± standard deviation.
Table 2.
Periods of each step for P20, P40 and P60.
| Level | Plots | Sequence of Matrix Solution Application | Total Applied Solution Amount (mm) | Period of Mixture Solution Infiltration (min) |
|---|---|---|---|---|
| P20 | Plot 1 | KI + KBr | 20 | 13 |
| Plot 2 | KI + KNO3 | 20 | 15 | |
| P40 | Plot 3 | KI + KBr → KI + KBr | 40 | 17 → 44 |
| Plot 4 | KI + KBr → KI + KNO3 | 40 | 20 → 39 | |
| P60 | Plot 5 | KI + KBr → KI + KBr → KI + KBr | 60 | 14 → 38 → 35 |
| Plot 6 | KI + KBr → KI + KBr → KI + KNO3 | 60 | 15 → 45 → 40 |
Note: KI + KBr: Solution of KI (20 g L−1) and KBr (10 g L−1); KI + KNO3: Solution of KI (20 g L−1) and KNO3 (10 g L−1).
Table 3.
Root length (cm).
| Soil Depth (cm) | Root Diameter | ||||
|---|---|---|---|---|---|
| <1 mm | 1–3 mm | 3–5 mm | 5–10 mm | >10 mm | |
| 0–5 | 2549 ± 322 | 1284 ± 211 | 499 ± 142 | 125 ± 23 | 19 ± 12 |
| 5–10 | 1504 ± 97 | 528 ± 200 | 139 ± 53 | 54 ± 8 | 20 ± 11 |
| 10–15 | 2058 ± 88 | 426 ± 44 | 149 ± 40 | 138 ± 22 | 38 ± 10 |
| 15–20 | 2068 ± 282 | 394 ± 86 | 189 ± 40 | 104 ± 58 | 23 ± 10 |
| 20–25 | 720 ± 182 | 476 ± 112 | 111 ± 62 | 87 ± 54 | 38 ± 13 |
| 25–30 | 565 ± 300 | 212 ± 0 | 243 ± 13 | 44 ± 0 | 0 ± 0 |
| 30–35 | 373 ± 58 | 396 ± 58 | 158 ± 31 | 27 ± 1 | 0 ± 0 |
| 35–40 | 366 ± 21 | 122 ± 6 | 48 ± 6 | 0 ± 0 | 0 ± 0 |
Note: In each soil layer, the root length under different root diameter ranges is the sum of the root length of that root diameter, and the volume of each soil layer is 125 cm3.
Publisher’s Note: MDPI stays neutral with regard to jurisdictional claims in published maps and institutional affiliations. |
© 2021 by the authors. Licensee MDPI, Basel, Switzerland. This article is an open access article distributed under the terms and conditions of the Creative Commons Attribution (CC BY) license (https://creativecommons.org/licenses/by/4.0/).
Share and Cite
MDPI and ACS Style
Li, M.; Yao, J.; Yan, R.; Cheng, J. Effects of Infiltration Amounts on Preferential Flow Characteristics and Solute Transport in the Protection Forest Soil of Southwestern China. Water 2021, 13, 1301. https://doi.org/10.3390/w13091301
AMA Style
Li M, Yao J, Yan R, Cheng J. Effects of Infiltration Amounts on Preferential Flow Characteristics and Solute Transport in the Protection Forest Soil of Southwestern China. Water. 2021; 13(9):1301. https://doi.org/10.3390/w13091301
Chicago/Turabian StyleLi, Mingfeng, Jingjing Yao, Ru Yan, and Jinhua Cheng. 2021. "Effects of Infiltration Amounts on Preferential Flow Characteristics and Solute Transport in the Protection Forest Soil of Southwestern China" Water 13, no. 9: 1301. https://doi.org/10.3390/w13091301
Note that from the first issue of 2016, this journal uses article numbers instead of page numbers. See further details here.