Article

Remote Sensing Investigation of the Offset Effect between Reservoir Impoundment and Glacier Meltwater Supply in Tibetan Highland Catchment

1
Key Laboratory of Watershed Geographic Sciences, Nanjing Institute of Geography and Limnology, Chinese Academy of Sciences, Nanjing 210008, China
2
University of Chinese Academy of Sciences, Beijing 100049, China
3
College of Hydrology and Water Resources, Hohai University, Nanjing 210098, China
4
State Key Laboratory of Hydrology-Water Resources and Hydraulic Engineering, Hohai University, Nanjing 210098, China
*
Author to whom correspondence should be addressed.
Water 2021, 13(9), 1307; https://doi.org/10.3390/w13091307
Submission received: 7 April 2021 / Revised: 29 April 2021 / Accepted: 30 April 2021 / Published: 7 May 2021

Abstract

:
This article presents multi-source remote sensing measurements to quantify the water impoundment and regulation of the Zhikong Reservoir (ZKR) and Pangduo Reservoir (PDR), together with the estimation of the glacier mass balance to explore whether the increased glacier meltwater supply can buffer the influences of the reservoir impoundment to some degree in the Tibetan highland catchment. The ZKR and PDR are two reservoirs constructed on the upper Lhasa River that originate from the Nyainqentanglha glaciers in the remote headwater in the Tibetan Plateau (TP) and lacks historical in situ hydrological observations in the long term. Therefore, the Joint Research Center (JRC) Global Surface Water dataset (GSW), and the Shuttle Radar Topography Mission (SRTM) digital elevation model (DEM) data were used for estimating the total amount of water storage of the two reservoirs, and the SRTM and TanDEM-X DEMs were used for estimating the glacier mass balance. The result shows that the total amount of water impounded by reservoirs is 0.76 Gt, roughly 54% of their design capacities. The mass balance of the glaciers is estimated by comparing the elevation changes between the SRTM and TanDEM-X DEMs. The glaciers in this region melt at an average rate of 0.09 ± 0.02 Gt·year−1 from 2000 to circa 2013, and the impounded water of these reservoirs is comparable to the amount of glacier-fed meltwater in eight years.

1. Introduction

Reservoirs play a significant role in the terrestrial water budget and water resource management at the regional scale [1]. With the rapid economic development and growing energy demand in China, the hydropower industry has become a key energy source for accomplishing renewable energy targets. The Tibetan Plateau (TP), the headwaters of many large rivers in Asia, including the Yangtze River and the Yarlung Tsangpo, serves as the largest hydropower energy base of China [2]. In the past several decades, hydropower development occurs mainly in the middle and downstream sections (below 4000 m above sea level (a.s.l.)) of southeast Tibetan rivers, while additional reservoirs were built on the upper reaches of high-altitude and remote areas in recent years. For example, the Zhikong Reservoir (ZKR) and Pangduo Reservoir (PDR) were constructed on the Lhasa River, an important reach of the Yarlung Tsangpo. The impounded water of these reservoirs may account for a considerable proportion of the scant river discharges in the upper reaches on the TP.
Unlike other river basins at low altitudes, glaciers also play an essential role in the hydrological cycle and affect the regional water balances of the TP. Glacier meltwater is a critical contributor to river flow at regional scales [3]. Given the circumstances of climate change, the ongoing glacier retreat on the TP causes great mass loss and influences the downstream river basin and regional water balance [4,5]. Previous research reported that the most negative mass changes, with a mass loss rate of −4.0 ± 1.5  Gt·year−1 from 2000 to 2016, are observed in the Nyainqentanglha Mountains [4]. Li and Lin [6] investigated the mass balance of a part of Nyainqentanglha glaciers and estimated the mass loss rate at −0.235 ± 0.127 m water equivalent (w.e.) year−1 between 2000 and 2013/2014. Wu [7] found that mass losses accelerated from 0.42 ± 0.20 m w.e.year−1 to 0.60 ± 0.20 m w.e.year−1 between 1968–2000 and 2000–2013. These articles all focused on the issue of glacier mass balance, but did not consider the impact of the change of other hydrological factors on the water cycle on the TP.
Reservoirs are an important part of the terrestrial water cycle. Dam impoundment and regulation in the upstream regions inevitably decrease the river discharge and alter the flow regime [8,9,10]. In contrast, glacier meltwater under warming climate, another critical contributor to river discharge, is increasing on the TP [7,11,12,13]. Zhang [14] built a framework to investing both the current and future cumulative influence of damming on downstream water availability of the Yarlung Tsangpo basin with the reservoir design characteristic parameters and model data, instead of actual reservoir regulation data and other observational data. Therefore, it is necessary to advance the understanding of the complex influences of climate change combined with human intervention on the high-altitude hydrologic system with actual reservoir regulation data and other observation data.
This study aims to explore whether the increasing glacier meltwater supply in the highland catchment can buffer the hydrological impacts of the recent reservoir impoundment to some extent. The combined effect of glacier melting and reservoir construction in the high altitudes is quantified to advance the understanding the influence of climate change and human intervention on the water cycle in the high-altitude catchment.
However, it is a challenge to acquire the water storage data, regulation of the reservoirs, and the glacier mass balance (MB) records due to the lack of in situ observations in the remote and high-altitude mountainous regions. Therefore, the analysis of satellite data is the only way to study and monitor changes of the reservoirs and the glacier mass balance in the long term. Therefore, in this study, we firstly used the Global Surface Water (GSW) dataset on the Google Earth Engine (GEE), along with the digital elevation model (DEM) data to examine the regulation of ZKR and PDR. Then, we used the Shuttle Radar Topography Mission (SRTM) and TanDEM-X DEMs to detect the elevation changes of glaciers from 2000 to circa 2013, and estimated the water mass supply rate in the basin based on the essential data and method supported by our previous study [15], to explore whether the increasing glacier meltwater supply in the highland catchment can buffer the hydrological effects of the recent reservoir impoundment to some extent. Finally, we also discuss the influences of the reservoir impoundment and regulation activities by analyzing the Global Land Data Assimilation System (GLDAS) surface runoff and snow water equivalent (SWE) in the study area.

2. Materials and Methods
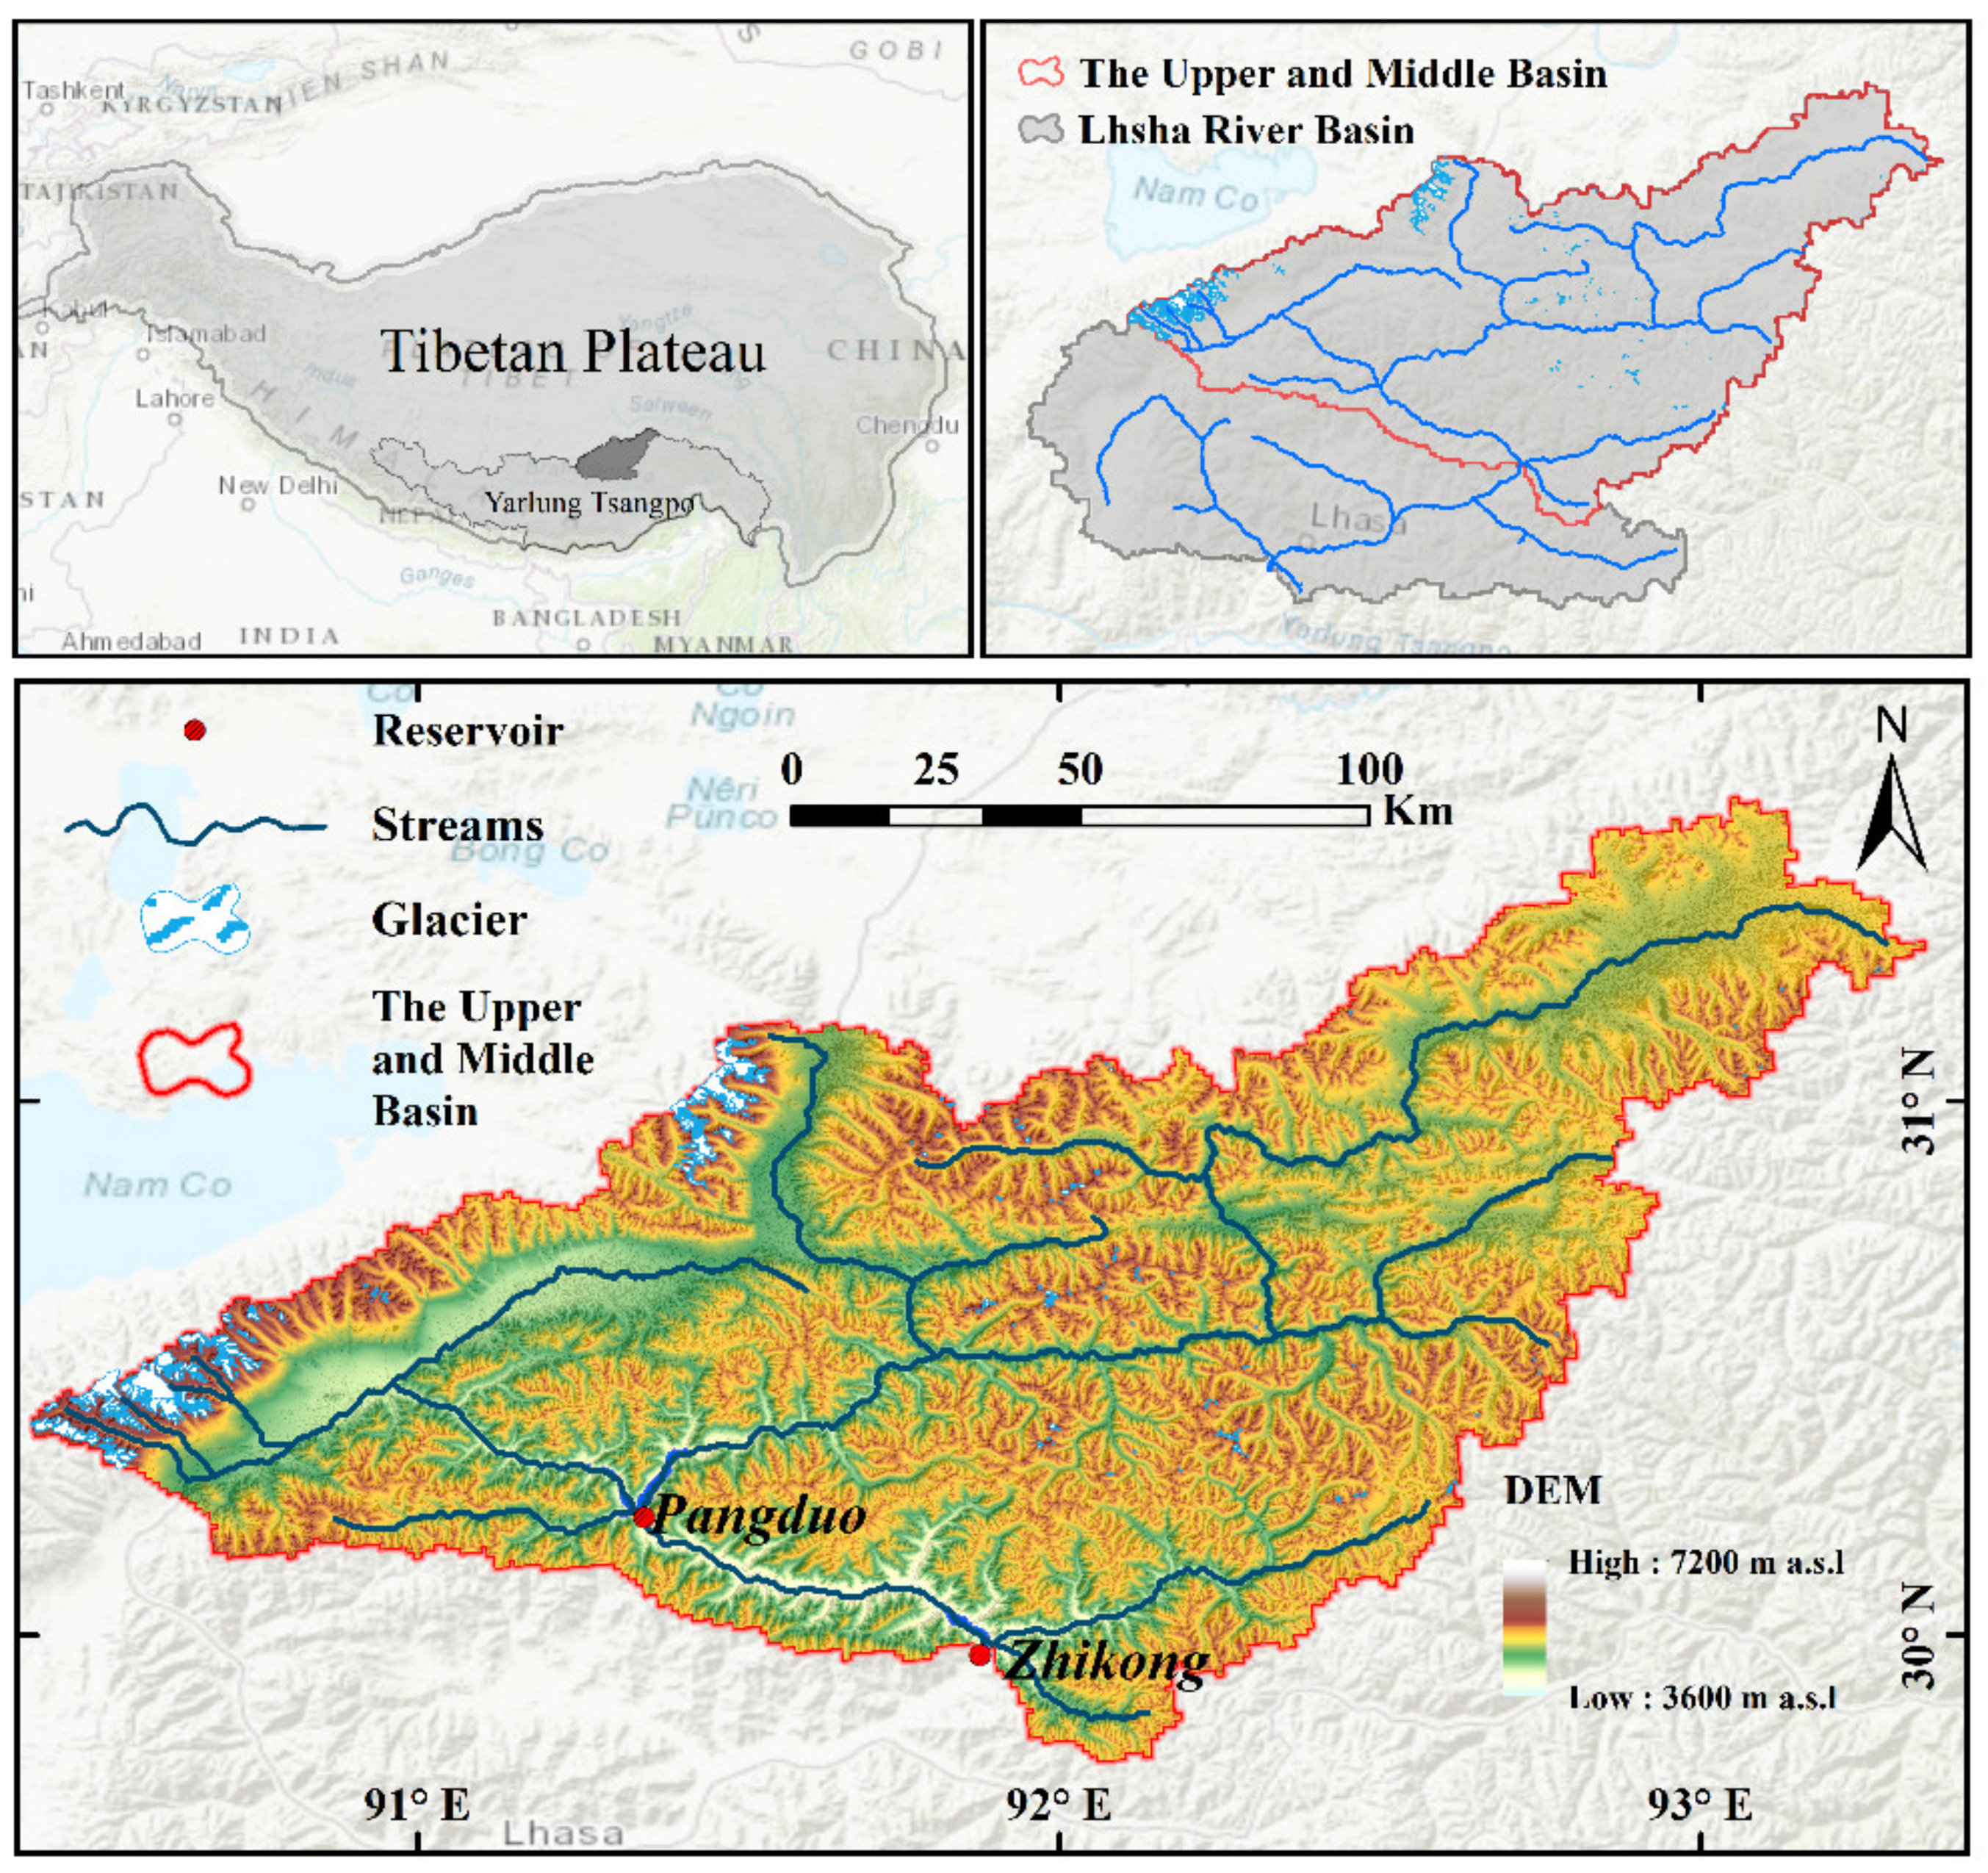
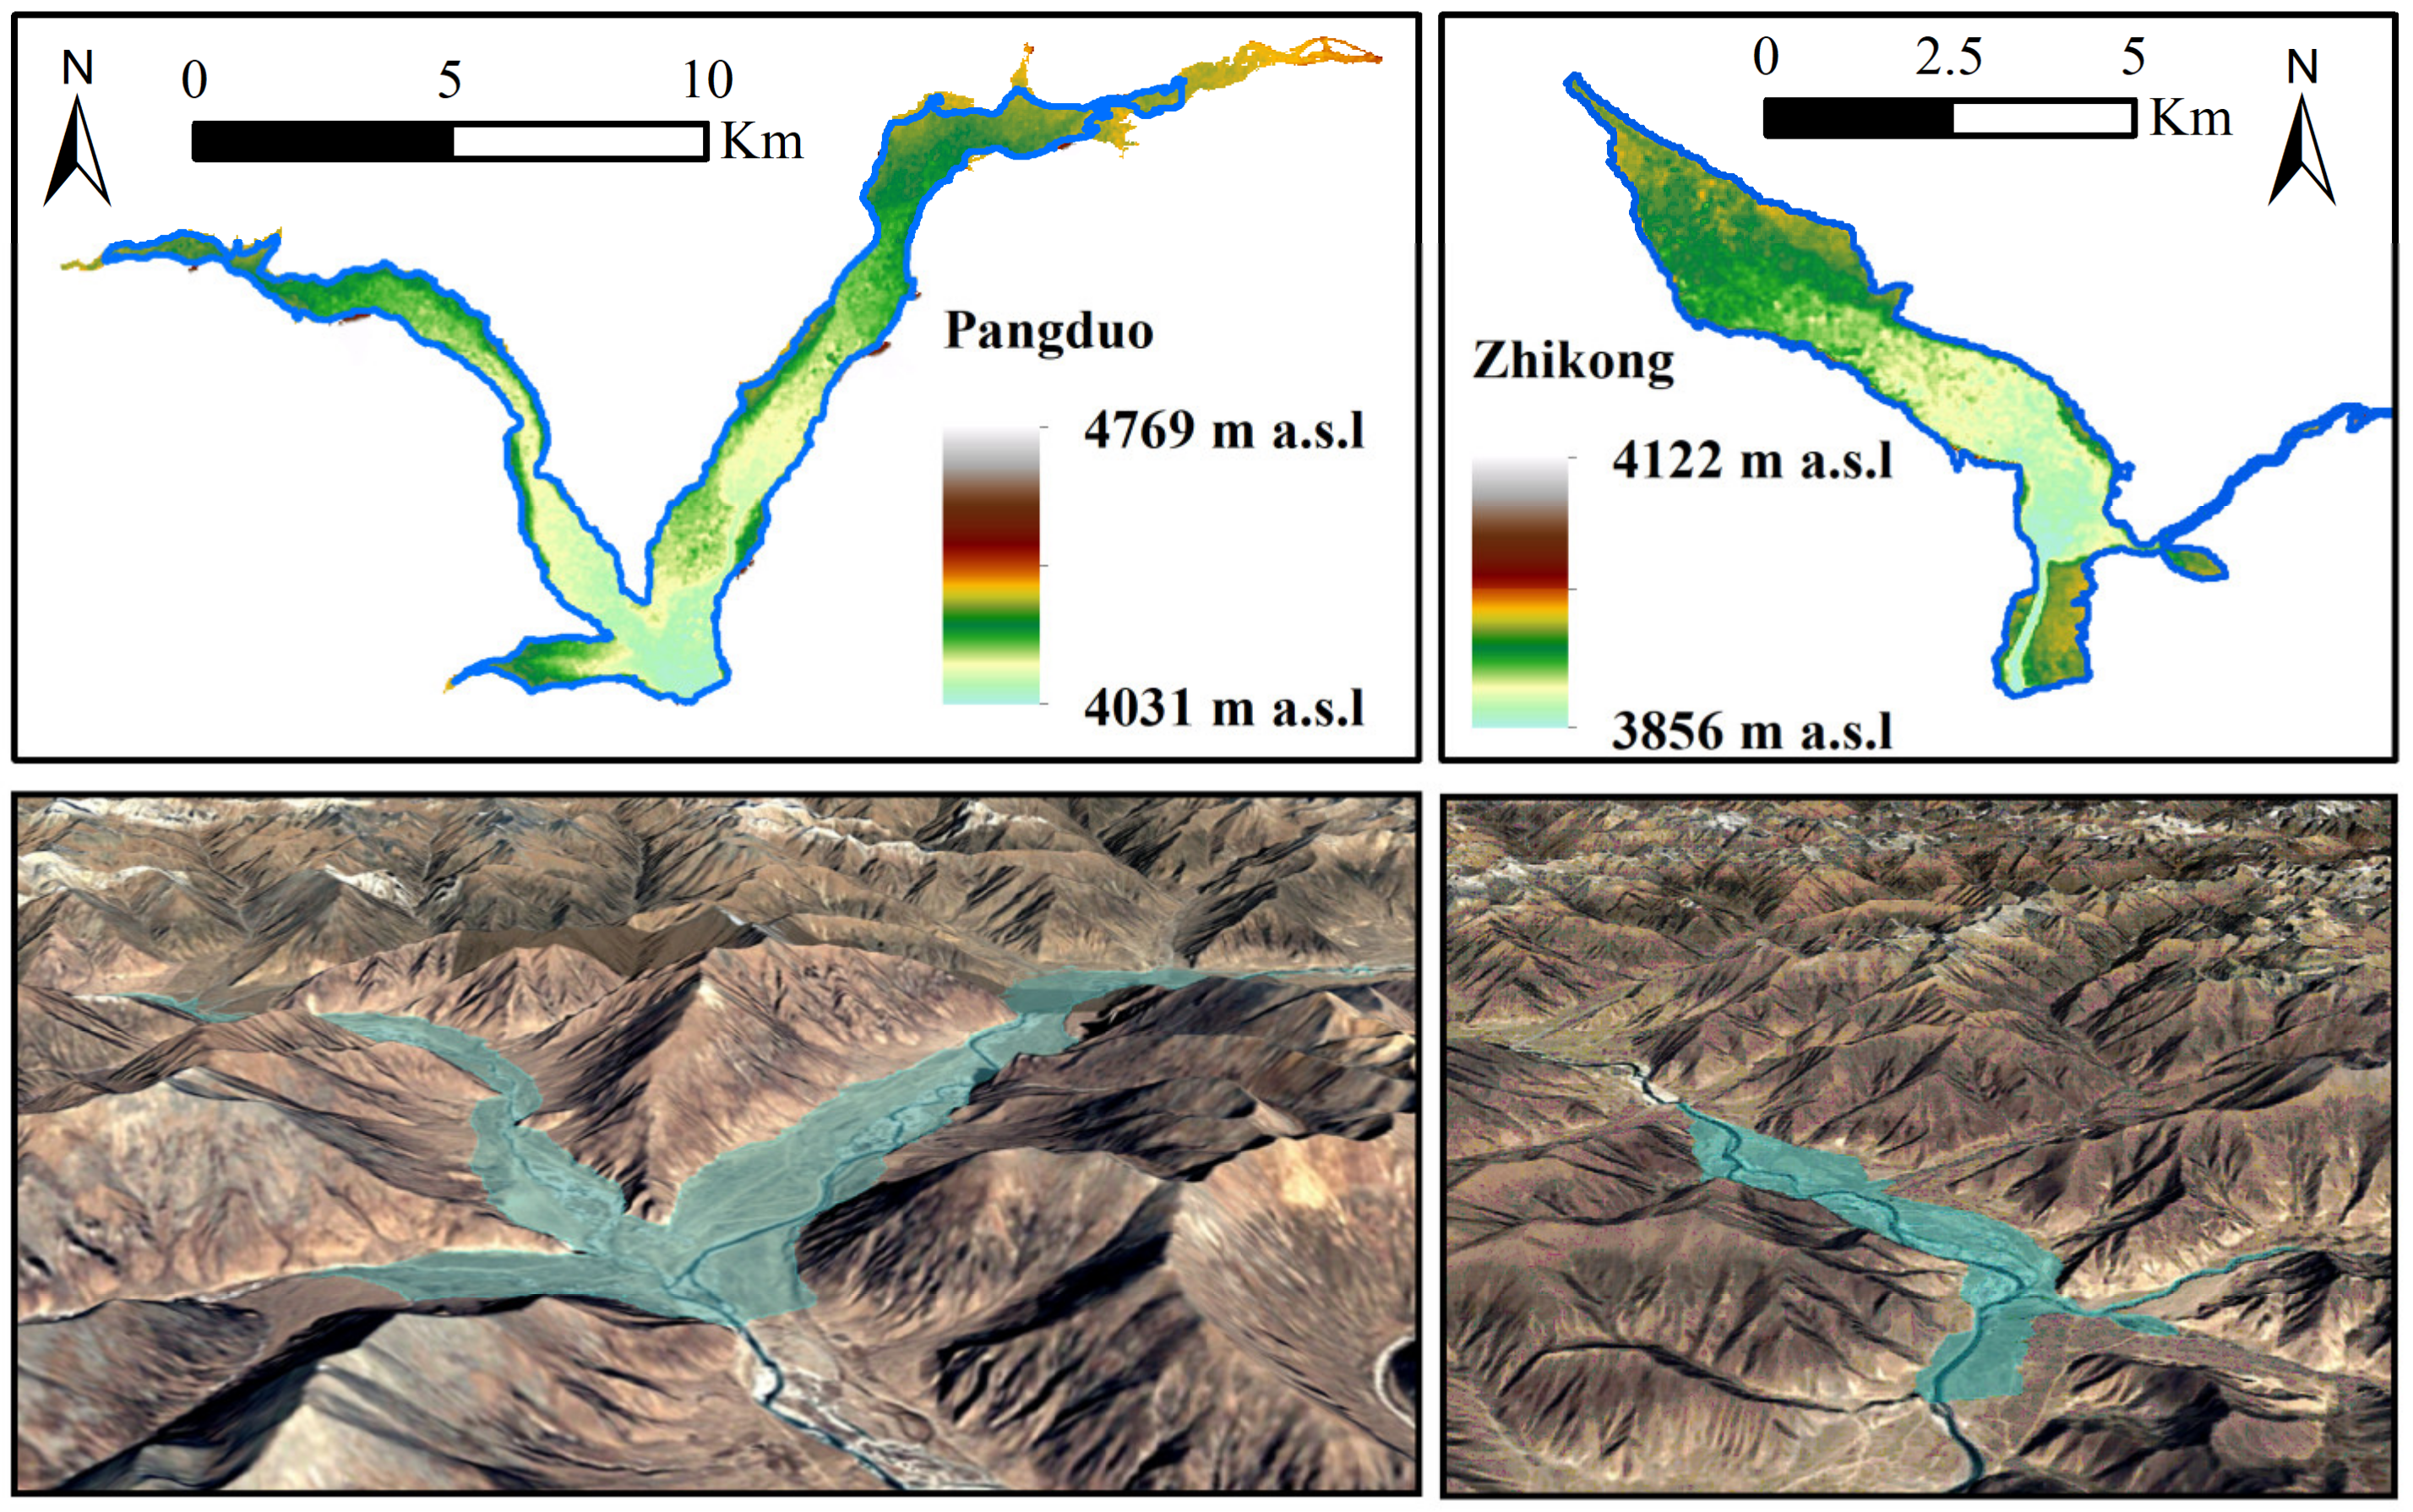
2.1. Study Area

The Lhasa River is located in the southeast of the Tibetan Plateau (90°05′–93°20′ E and 29°20′–31°15′ N), a representative of a glacierized, terrain-rugged head watershed with varying physio-geographic conditions, and is the largest and the longest tributary of the middle reach of the Yarlung Tsangpo (Figure 1). Originating from glaciers in the western Nyainqentanglha Mountains, the upper reaches of the Lhasa River Basin flow southeast through a deep valley, with the altitude ranging from 3800 m a.s.l. to 7200 m a.s.l. The basin in the lower reaches is an important agricultural area, including the valley plain of Lhasa City, the most developed, densely populated, and important agricultural area of Tibet.
Glaciers in the study area, being a crucial water supplement to the Lhasa River, are mainly distributed in the western and central Nyainqentanglha Mountains, and have witnessed an accelerated mass loss in the 21st century compared to the last century [7]. The number of glaciers within this basin is 314 in total and the area is approximately 258 km2 according to the RGI 6.0.
Runoff in this region is supplied by precipitation, meltwater, and groundwater, which accounts for about 46%, 26%, and 28%, respectively, and varies greatly in different seasons [16]. In the summer half-year (May to October), with the meltwater and the rainfall caused by the Indian Ocean Monsoon supplying the Lhasa River, the runoff in this period takes up about 96% runoff of the annual amount. While in the winter half-year from November to April, the runoff gradually becomes less and less due to the decreasing rainfall and temperature. To make full use of the potential of hydropower in this area and to satisfy the water demand of agriculture irrigation downstream, two reservoirs (PDR and ZKR) have been built in the middle basin of the Lhasa River. PDR and ZKR were built in 2014 and 2007, respectively. PDR reported a total storage capacity of 1.17 Gt, which impounds the Lhasa River in the Pangduo Township of Lhünzhub County. Downstream from PDR, the ZKR, with a total storage capacity of 0.23 Gt, is seated between the middle and lower reaches of the Lhasa River. Other basic information about the two reservoirs is listed in Table 1.

2.2. Datasets and Methods

2.2.1. Estimation of Impounded Water Storage and Variations of Monthly Water Extent and Storage of Reservoirs

The monthly reservoirs’ impounded water extent of ZKR and PDR was measured from January 2007 to December 2018 and January 2014 to December 2018, respectively. The monthly mapping results of the reservoir inundation areas were generated on the GEE platform using the JRC GSW dataset. This dataset is derived from all available Landsat satellite images on a 30-m gridded square over 34 years (from 1984 to 2018). This study utilized three layers in the dataset, namely monthly water history (MWH), maximum water extent (MWE), and water occurrence (WO). MWH provided the monthly water detention data, MWE comprised the masking results of pixels detected as water, and WO helped reconstruct the monthly water history when a certain data layer of MWH displayed poor observational quality (e.g., cloud cover). The final mapping result for each month was manually inspected with detailed quality control and transformed into an equal-area projection before calculating the monthly area.
To estimate the monthly reservoirs inundation storage, the DEM was introduced to calculate the reservoir water storage. The SRTM DEM, which was acquired (in February 2000) before the construction of the two reservoirs [17], provided data of the reservoir bathymetry. We use the 1-arc (approximately 30 m) SRTM DEM (version 3) product to align the resolution with the GSW data. Given that the two reservoirs were built after the acquisition time of the SRTM data, their bottom topographies were already known. Therefore, water level and storage in a specific month were easily calculated based on the DEM’s referenced bathymetry. The calculation was conducted by calculating the volume difference between the before and after the water-inundation masking images.

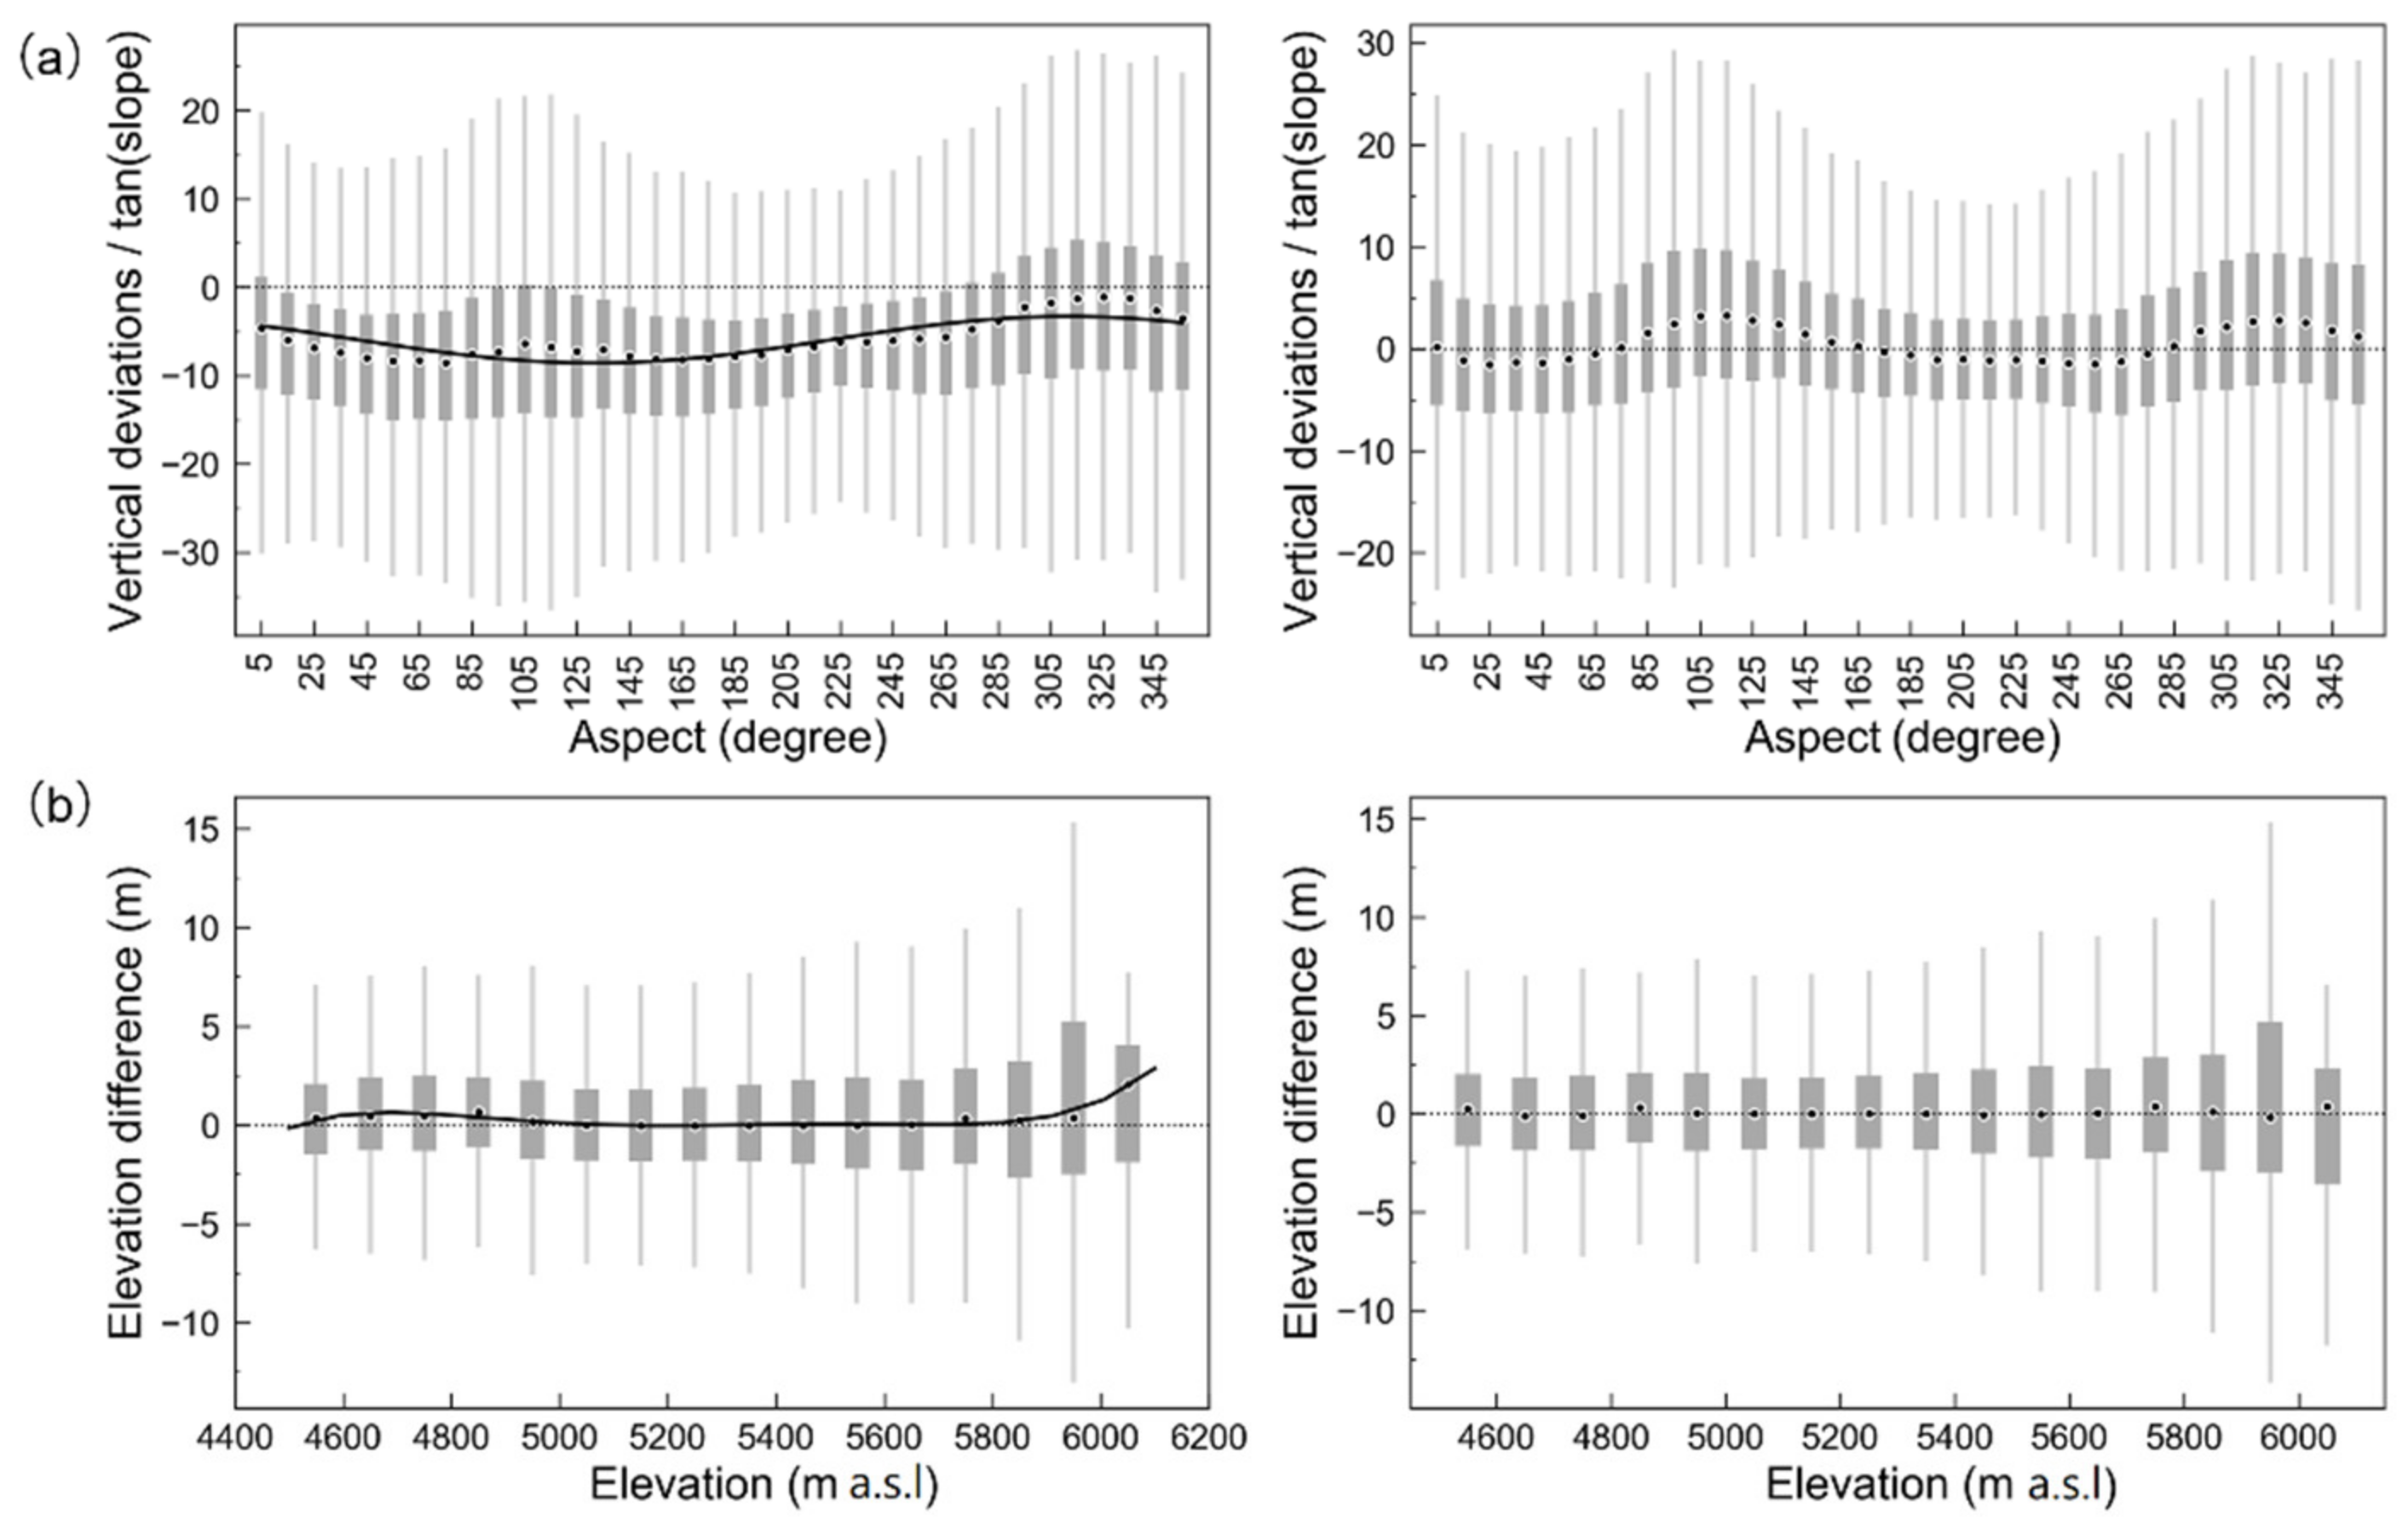
2.2.2. Estimation of Glacier Mass Change

To estimate the glacier mass change, two DEM datasets acquired at the beginning and the end of the study period were introduced and calculated under the constraints of the maximum glacial extent. To define the maximum glacial extent in this region, we used the latest version of the Randolph Glacier Inventory (RGI 6.0) [18]. The extent of the glacier in this study is derived from the Landsat images acquired around the first few years of this century in the study area [19,20].
The SRTM and the TanDEM-X DEMs were used to study glacier elevation changes. The SRTM mission was accomplished in February 2000; thus, the data acquired from this mission were considered as the previous glacial surface elevations. Although the 1-arc SRTM DEM had a higher spatial resolution, we dismissed it because the ratio of the void area was greater than that of the 3-arc resolution data in the study area. Therefore, the 3-arc resolution data of SRTM DEM were selected as the DEM at the beginning of the study period. The TanDEM-X DEM was used as the glacier surface elevations after 2000 because it was acquired between January 2010 and December 2015. According to the auxiliary file, the TanDEM-X DEMs used in this study were acquired in 2012 and 2013. The EGM96 heights of the two DEMs were calculated according to the scripts provided by the National Geospatial Intelligence Agency and the National Aeronautics and Space Administration (NGA/NASA) to maintain the consistency of the vertical reference. The DEM data cover about 91% glaciers in the study area.
The potential bias of the DEMs should be co-registered and corrected to estimate a reliable elevation change, especially when using a multi-temporal elevation dataset. First, the original DEM scenes were mosaicked into one scene and subsequently clipped using the predefined extent of the basin to avoid arbitrary geometrical shifts caused by processing steps such as resampling and re-projection between two DEM datasets. Then, the method proposed by Nuth and Kääb [21] was used to check the geometrical shifts, systemic offsets, and elevation-dependent biases between DEM pairs. The details about this procedure were provided in the work of Ke et al. [6]. Figure 2 depicts the distribution of the elevation differences (dh) in relation to the aspect (a) and elevation (b) before and after the systemic bias correction.
Noise filtering and hypsometry-based averaging are two fundamental steps for calculating the mean glacier elevation changes of two DEMs. Similar to many previous studies [16,22,23], we first removed all on-glacier dh values of which absolute values exceeding 150 m. Then, we used the modified SRTM3v4 to analyze the elevation changes of the 100-m altitude bins. For each 100-m altitude bin, we used another filtering method that reserves dh values within the threshold of three standard deviations of the mean. The glaciered area was considered as one virtual contiguous ice body, and the mean glacier elevation changes were calculated as a hypsometric average:
d h = i = 1 n R i × d h t ¯
where i and n represent the 100-m altitude bin and the number of total bins, respectively, R i is the percentage of glacier area in the elevation bin to the total glacier area, and d h t ¯ is the mean dh in the bin.
After the filter process and hypsometry-based averaging, the mean rate of elevation changes was determined and used in the calculation of the mass changes. The mass changes were the product of the total glacier area, mean rate of elevation changes, and mean ice density factor (0.85 × 10⁻⁶ Gt/m3) [24].

3. Results

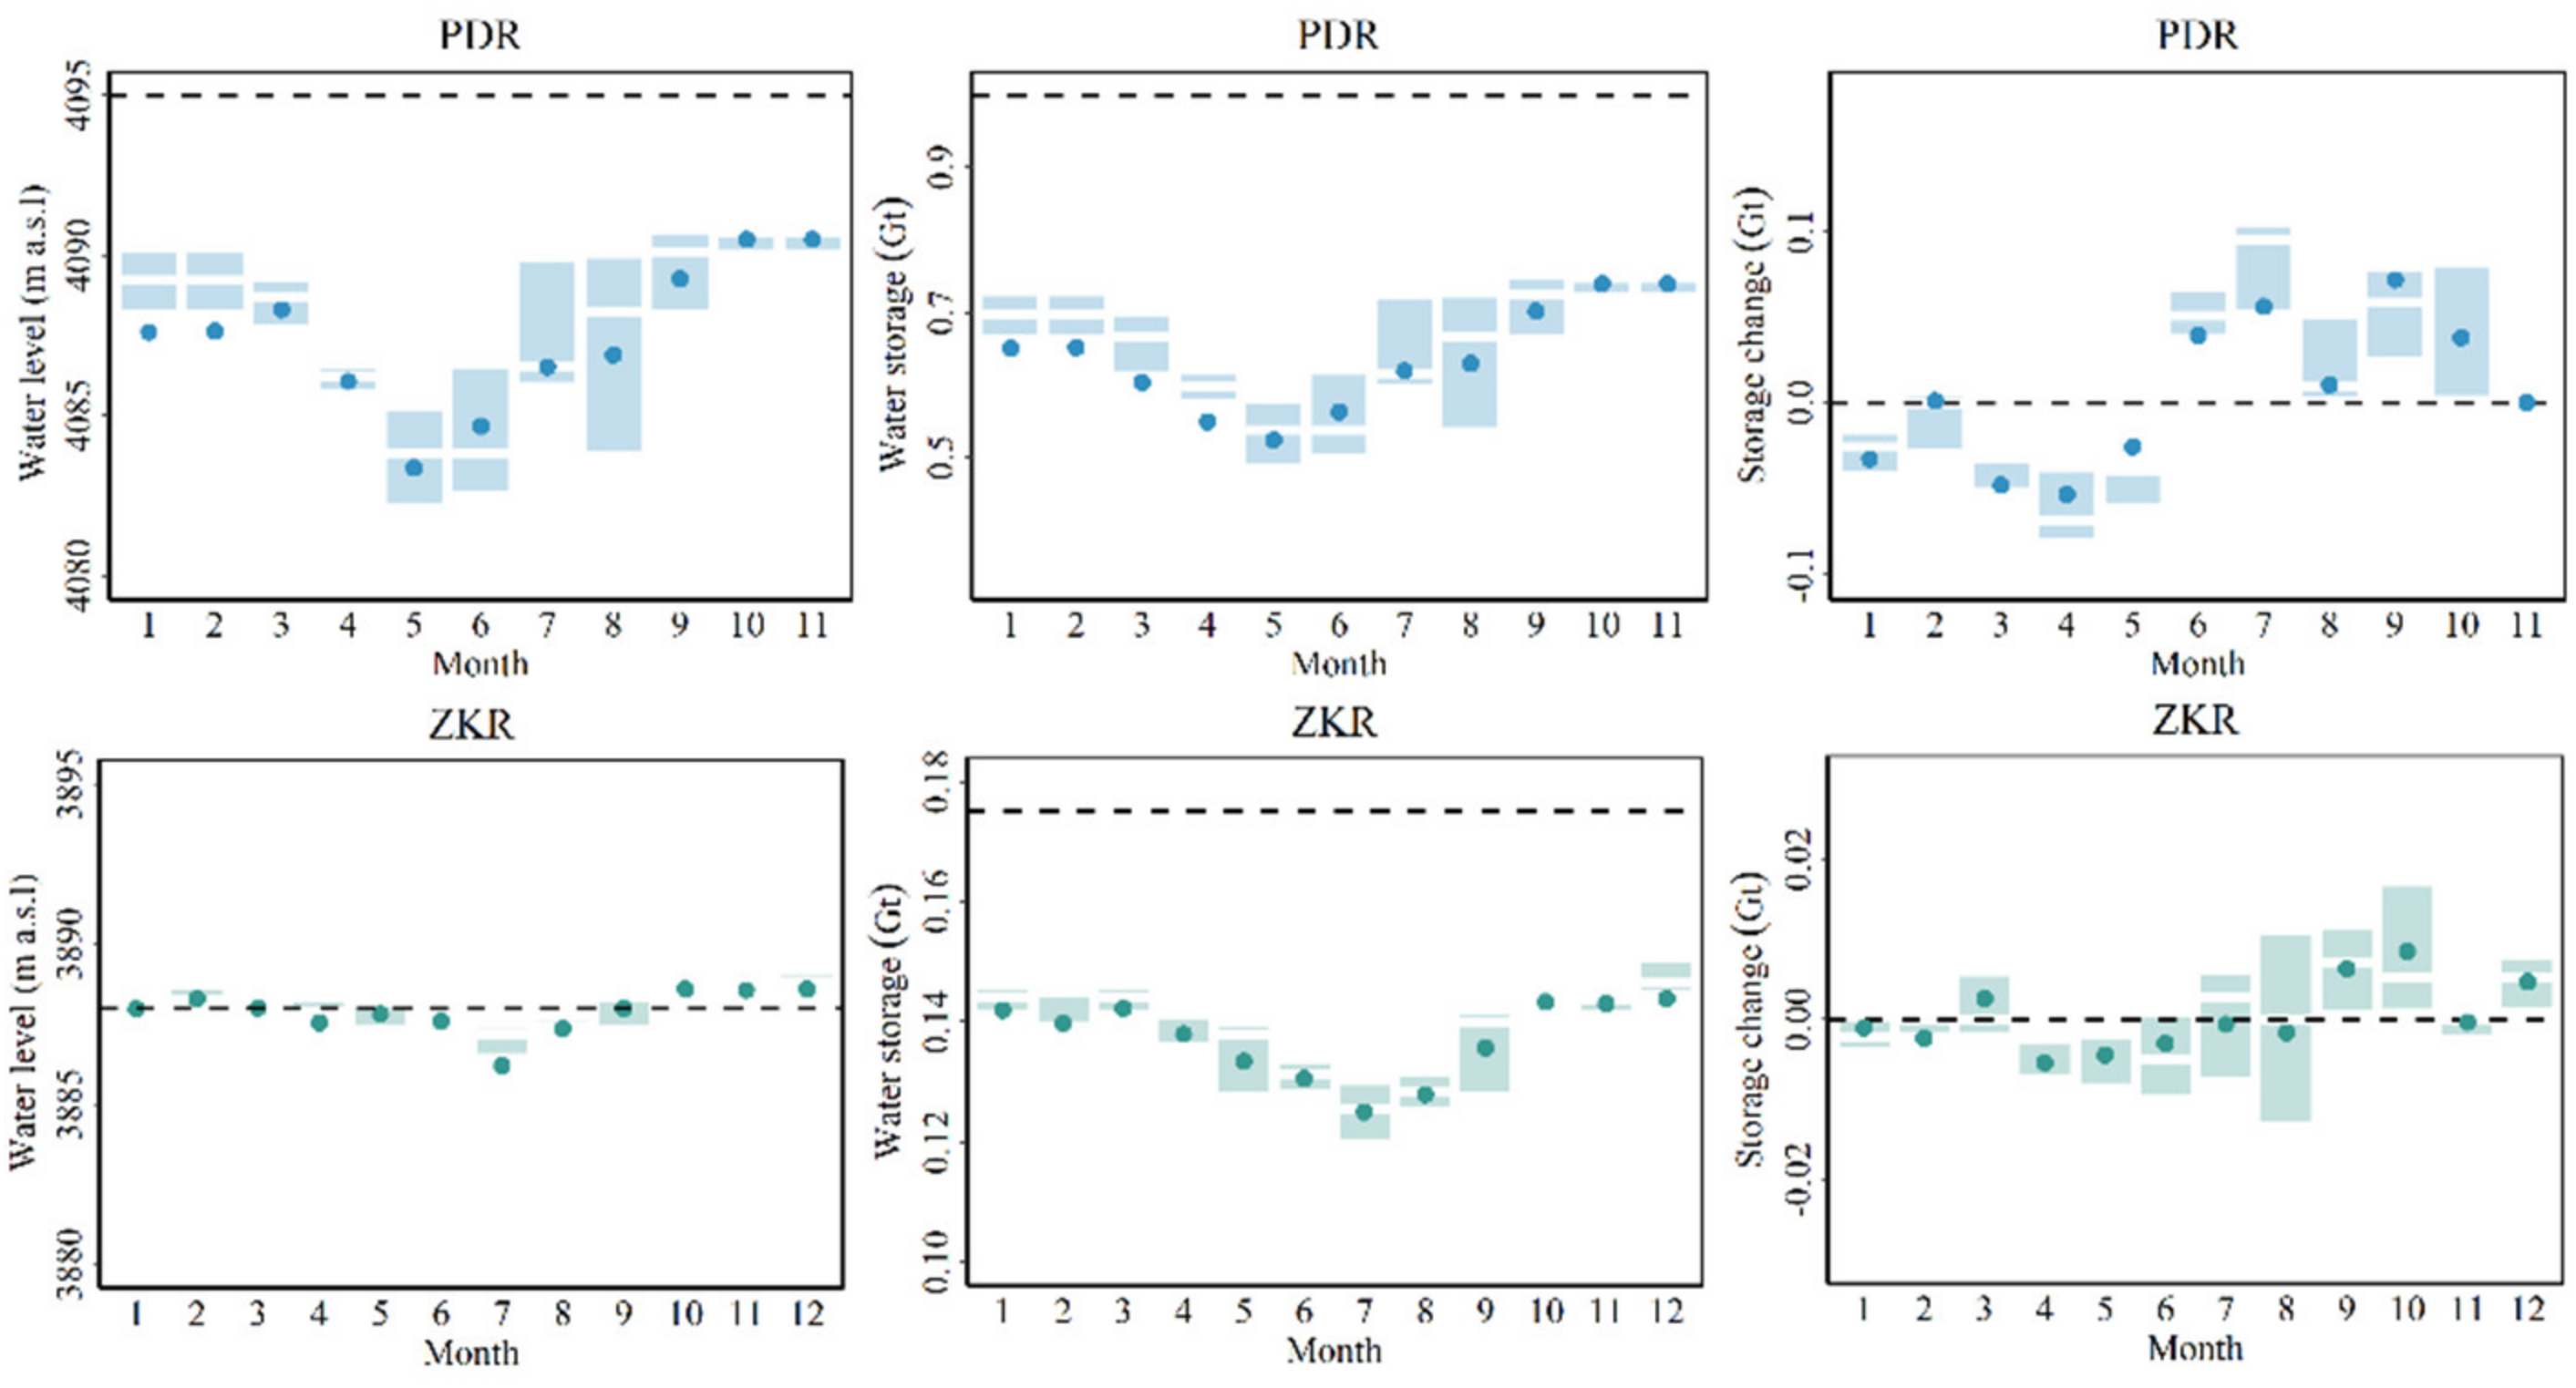
3.1. Reservoir Area and Storage Changes

The total area of the two reservoirs on average derived from the GSW datasets was up to 37.2 km2, and the total capacity on average was 0.76 ± 0.14 Gt, which was about 54% of the design capacity of the two reservoirs. According to the observed average water level versus the normal water level in Table 1, and the observed range versus regulation storage capacity, it is clear that the ZKR was in full operation as designed, except the first two years, during which the reservoir was running below the designed water level (3888.0 m a.s.l.). While the PDR only ran at an average water level of about 4086.97 m a.s.l., even the observed maximum water level (4090.72 m a.s.l.) was still lower than the designed normal water level (4095 m a.s.l.). The designed regulation storage capacity of the PDR is 0.81 Gt, while the data derived from the GSW show that the observed range was about 0.63 Gt during 2014–2018, about three-fourths of the designed amount. This denotes that the PDR still has a considerable storage capacity (about 0.21 Gt) to regulate more stream flow, and may further decrease the upstream river discharge if it run as designed in the future.
Figure 3 illustrates the monthly average area and storage of the ZKR from 2007 to 2018, and that of the PDR from 2014 to 2018 (the PDR was officially put into full use from the June 2014). It can be indicated from these figures that both reservoirs retained almost the same area in autumn and winter. Moreover, what stands out in the figure is that the storage of the PDR was lowest in May, while the ZKR reached the lowest point in June. These phenomena indicate different reservoir regulation rules of reservoirs that are located at different sections of the river.
However, there still may be uncertainties when calculating the storage of the two reservoirs. There may be some deviations that occur in the mapping procedure of GSW and the manual editing process. Some monthly images from GSW that we used in the study contains the scan line corrector-off gaps and some others were influence by cloud shadows since the area is often covered by clouds, especially in winter and summer.

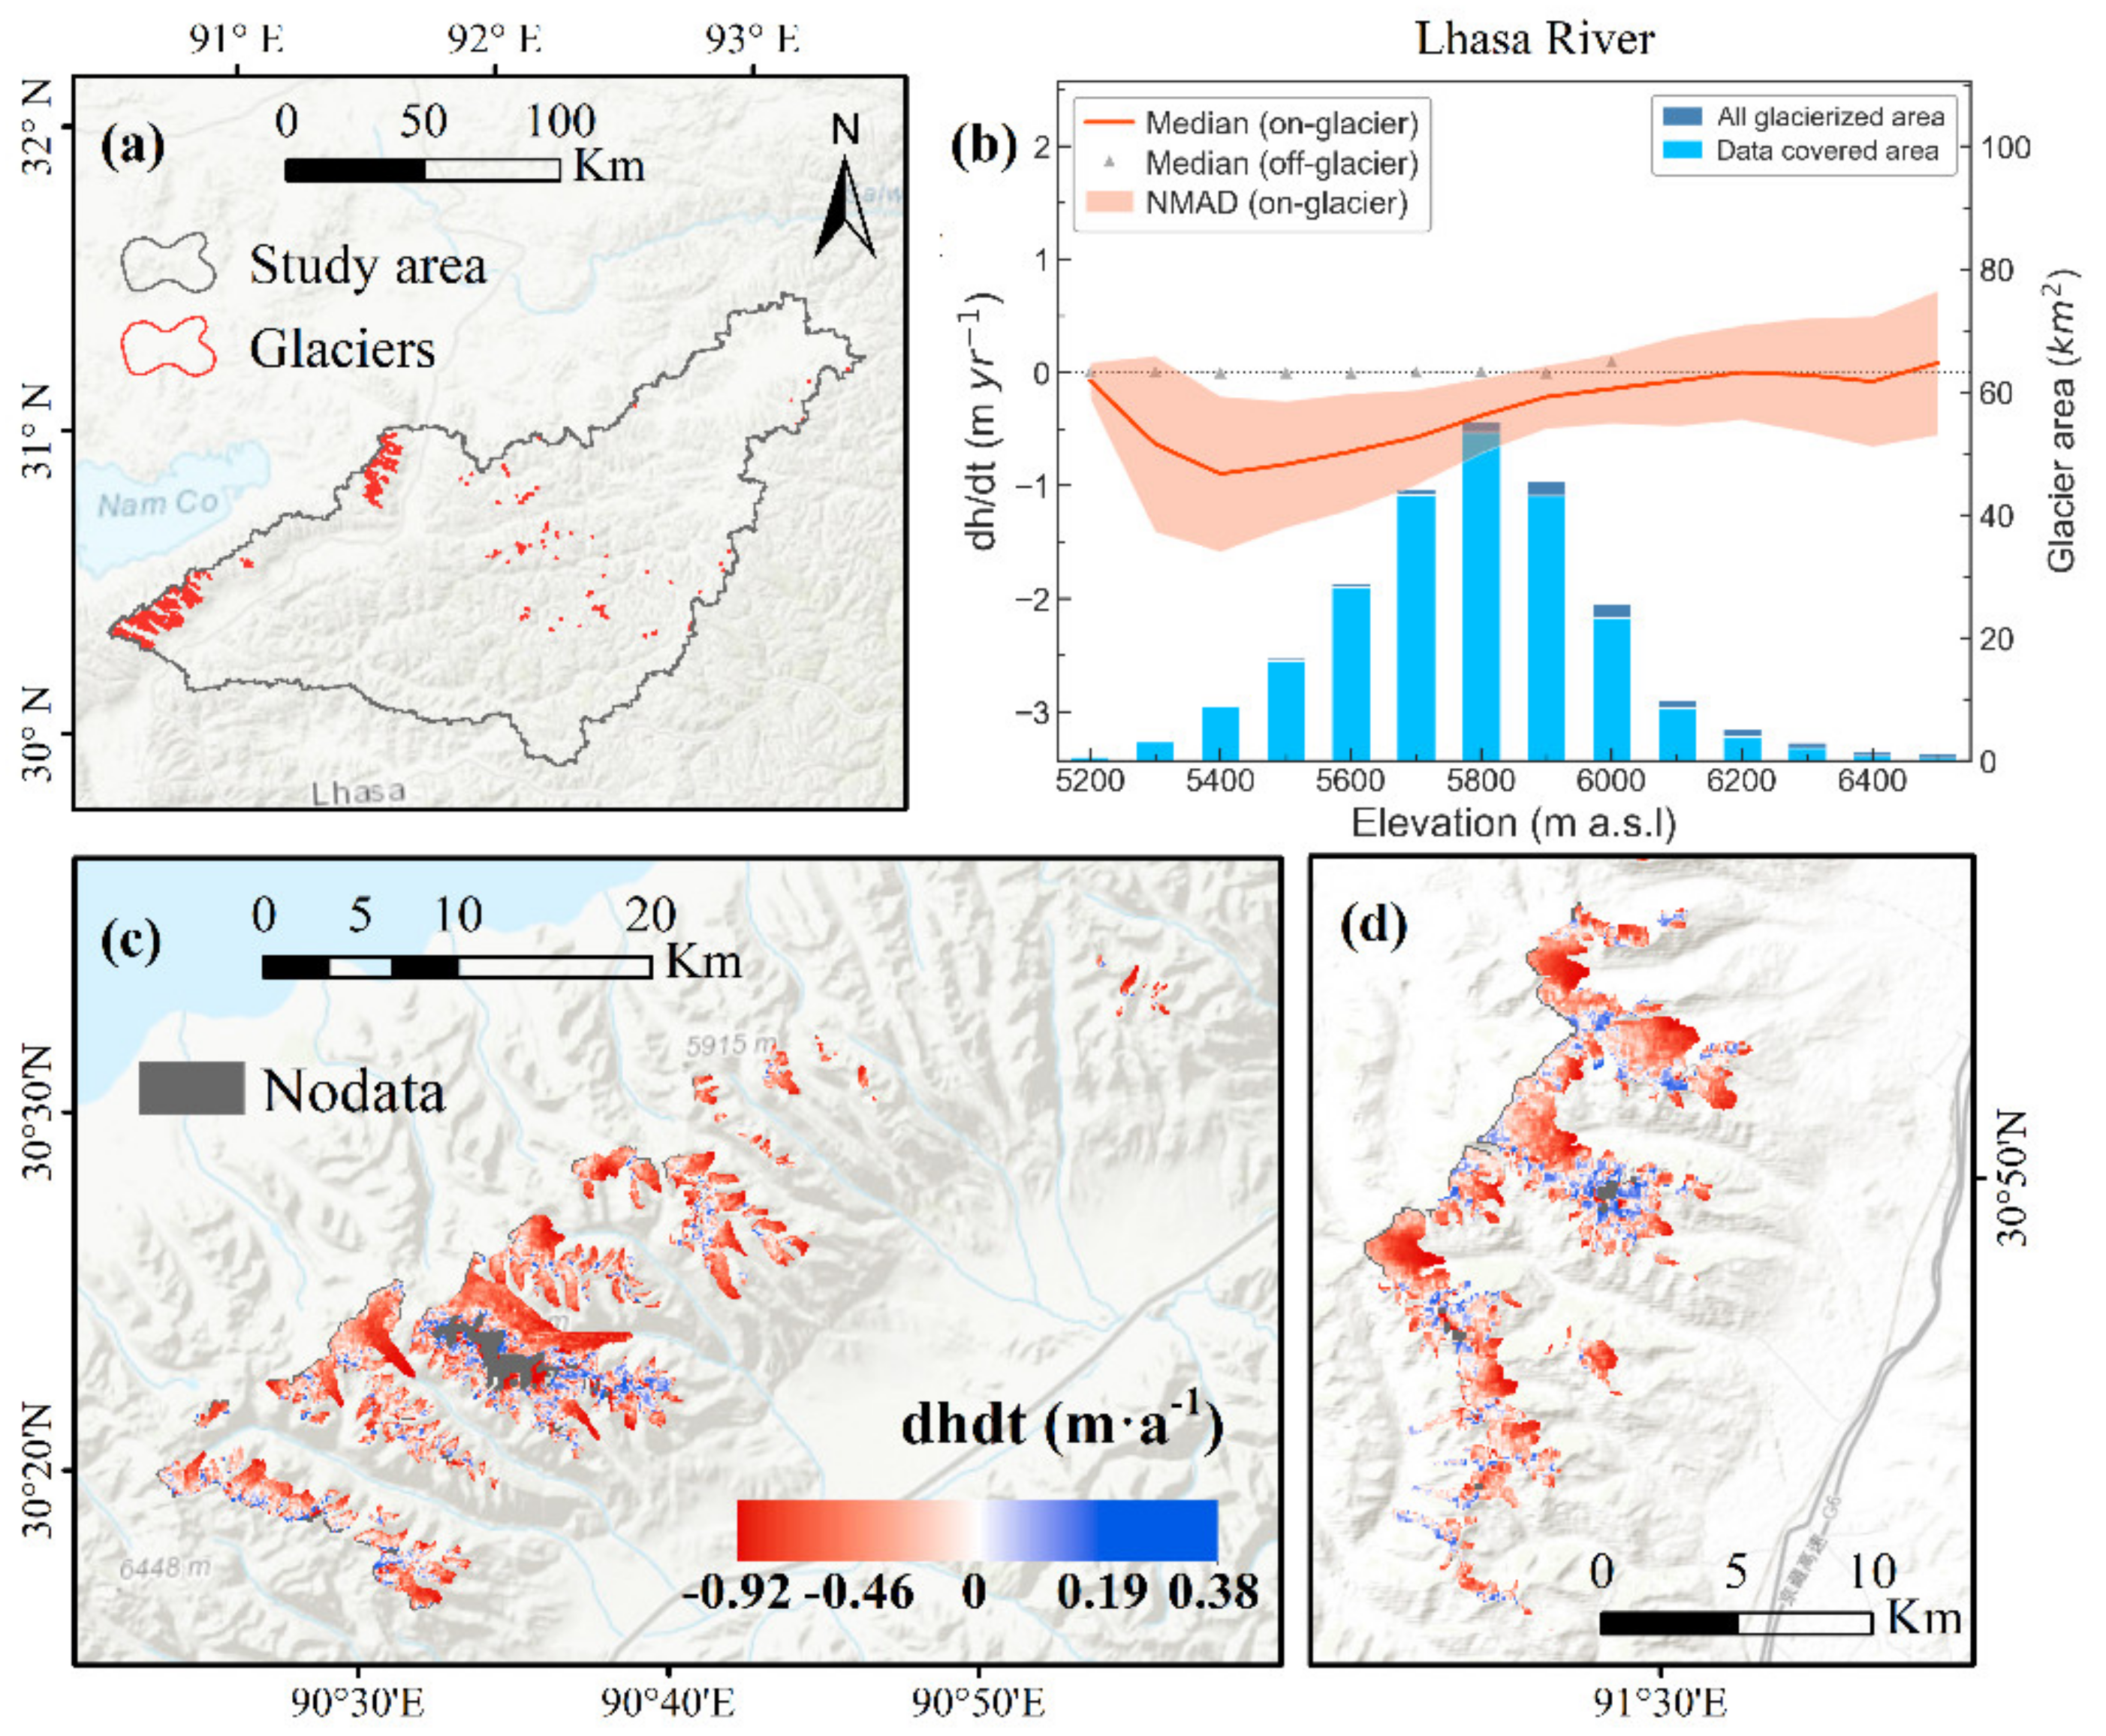
3.2. Glacier Changes and the Effect of Glacial Meltwater on Buffering Reservoir Impoundment

The mean elevation change of these glaciers in the whole study area is approximately −0.43 ± 0.08 m·year−1, and results of glaciers’ elevation change rate maps are illustrated in Figure 4. As shown in Figure 4, many glacier tongues have experienced rigorous thinning rates of up to about −0.90 m·year−1, particularly several long glaciers on the southwestern slope. Annual glacier height changes measured by the elevation change data at different elevations in the area are illustrated in Figure 4b. The observed ratio of the glacier at each elevation bin was larger than 85%, except for the region over 6200 m a.s.l. As the elevation decreases to 5400 m a.s.l., the glacier downwasting rate increases to about −1.25 m·year−1.
We transformed the glacier height changes into annual mass balances according to the method mentioned in Section 2.2.2; the average meltwater amount of the investigated glaciers in the Nyainqentanglha Mountain was approximately 0.09 ± 0.02 Gt·year−1 in the past 15 years. According to the former result of a total reservoir impoundment of 0.76 ± 0.14 Gt, the annual melting water amount was about one-eighth of the total storage, which equals to 70% of the water storage of the ZKR (0.13 ± 0.09 Gt) or 15% of that of the PDR (0.58 ± 0.25 Gt).
In more precise detail, given that the ZKR was constructed and began water impoundment in 2007 and that it only had an average storage of 0.13 Gt, we can draw the conclusion that the water impoundment of the ZKR was equivalent to the amount of glacier melting upstream in one and a half years. In 2014, the second reservoir—the PDR—was constructed. According to current reservoir regulation, it may take about six and a half years for glacier melting water to buffer the water impoundment of the PDR. Considering that the PDR has not been put into full designed operation, it may need more glacier melting water to offset the water impounded by the PDR if operated at the designed normal water level of 4095 m a.s.l.

4. Discussion

4.1. Uncertainty of Reservoir Storage Estimation

One of the major objectives of this study is to adopt multi-source remote sensing measurements with the possible trade-off effect on hydrological processes from increased glacier meltwater supply and reservoir impoundment in the high-altitude and vulnerable catchment. Therefore, it is essential to get a relatively accurate reservoir water volume.
The SRTM elevation was observed before the reservoirs were constructed, so the water surface was always above the lower limit of SRTM elevation. Figure 5 shows the terrain of the two reservoirs derived from SRTM DEM and the 3D topographic map of the PDR.
There are some aspects that may influence the accuracy of the water volume estimation; the quality of DEM is a significant challenge, especially in a high Asia mountain area such as the study area in this research. According to the previous research [25], the accuracy of the SRTM DEM shows the strongest relationship with the slope, and the accuracy of the SRTM DEM which slope is less than 2 degrees can satisfy the sub-meter accuracy requirements for calculating the water level change. Therefore, in the procedure of estimating the water level and water volume, we only used the DEM value which slope is less than 2 degrees to calculate water volume. We also estimated the water volume uncertainty through the following equation to evaluate the uncertainties:
V u = A × E s t d
where V u represents the uncertainty of the reservoir water volume, A is the reservoir area, and E s t d stands for the standard deviation of the elevation.

4.2. Analyses of the Potential Influences of the Reservoir Regulation on the River Discharge

To further research the seasonal effects of the reservoir impacts on the streamflow of the Lhasa River, we also utilized the GLDAS data to investigate the surface runoff and snow water equivalent (SWE) in the study area, and performed a qualitative assessment of the influences of the reservoir impoundment and regulation activities compared with the two variables. The Global Land Data Assimilation System provides high-quality, global land surface fields data about the water cycle generated from the Noah-3.6 [26,27], VIC-4.1.2 [28], and modified CLSM-F2.5 [29] models. Each LSM estimated the surface runoff and SWE based on various approaches. The GLDAS simulations were performed using default parameters at a global scale, which will obviously lead to a large bias in local areas, especially in the data-sparse regions such as the TP. According to a previous study, the runoff data of GLDAS2.1 performs better than other global data in the Yarlung Tsangpo River basin [30].
In this section, the latest released GLDAS-2.1 monthly 1.0° resolution outputs of surface runoff and snow water equivalent (SWE) generated from the models were used to represent the hydrological processes without the influence of the PDR and ZKR impoundments. Figure 6 shows a multi-year averaged seasonal time series of the surface runoff and snow water equivalent of the three LSMs and their averages in the basin from 2007 to 2018. In the summer half-year from May to October, the accumulation water volume of surface runoff was about 6.7 Gt, much higher than the increased amount of the two reservoirs storage during the same period. Before the PDR was built, the increased amount of water storage in the ZKR (0.01 Gt) of this period was far less than the total water volume of the surface runoff. However, the PDR gained a storage of 0.26 Gt during the same time after construction, 11 times that of the ZKR. Therefore, the PDR may contribute more to the alteration of discharge changes in summer than the ZKR.
In the winter half-year from November to April, the total amount of surface runoff and SWE was about 0.85 Gt, which is three times of the amount of storage decrease (0.24 Gt) of both reservoirs. This indicates that the reservoirs did not impound water in this period, but began to release about 0.24 Gt of water since February to cope with the large amount of precipitation in the following monsoonal months. This may lead to increased discharge downstream when compared to a situation without the reservoir.
The study area of this research is a typical example of a situation in which there is little precipitation and stream-flow gauges are installed. It is difficult to comprehend the hydrological processes and changes in the region. Therefore, it is still a challenge to have reliable surface runoff and SWE across a data-sparse region, and we derived a quantitative conclusion of the reservoir impacts on the streamflow of the Lhasa River.

5. Conclusions

This study makes a quantitative conclusion regarding the hydrological effects of reservoir impacts in the Lhasa River. The results reveal that the two reservoirs impound approximately 0.76 Gt of water, which is roughly 54% of the total design capacity. This amount can be attributed to the low water level regulation of the PDR. We also estimated the mass balance of the glaciers distributed in the basin by comparing the elevation changes between the SRTM and TanDEM-X DEMs. The results show that glaciers in this region melted at an average rate of 0.09 ± 0.02 Gt·year−1 from 2000 to circa 2013. Moreover, the impounded water of the two reservoirs is comparable to the amount of glacier-fed meltwater in eight years. The findings suggest that the increased glacier meltwater in warm climates most likely offsets the damming effect. However, a large amount of reservoir impoundment in fragile high-altitude regions might have a serious downstream influence, especially when the meltwater supply becomes limited due to the lasting shrinkage of mountain glaciers.
Due to the lack of ground station data and high-accuracy water level data, the estimation in the study remains a limitation. More accurate water level data can be derived from the recently released ICESat-2 data in the future. In addition, the Surface Water and Ocean Topography (SWOT) hydrology and oceanography satellite mission will launch in 2021 [31], and will provide water level estimations with an average high accuracy of 20 cm for water bodies.

Author Contributions

Conceptualization, C.S. and J.Z.; Data curation, J.Z., L.K. and C.S.; Formal analysis, J.Z. and C.S.; Funding acquisition, C.S.; Investigation, J.Z. and L.K.; Methodology, J.Z., L.K., and C.S.; Project administration, C.S.; Resources, J.Z., C.S. and L.K.; Software, J.Z. and L.K.; Supervision, C.S.; Validation, J.Z., C.S., L.K. and K.L.; Visualization, J.Z. and L.K.; Writing—original draft, J.Z., L.K. and C.S.; Writing—review and editing C.S., K.L. and T.C. All authors have read and agreed to the published version of the manuscript.

Funding

This research was funded by the Strategic Priority Research Program of the Chinese Academy of Sciences (Grant No. XDA23100102), the National Natural Science Foundation of China (Grant No. 41971403, 41801321), the National Key Research and Development Program of China (Grant No. 2018YFD0900804, 2018YFD1100101), and the Thousand Young Talents Program in China (Grant No. Y7QR011001).

Acknowledgments

The authors express their gratitude for the support from the Global Surface Water dataset provided by Jean-Francois Pekel et al. at https://global-surface-water.appspot.com/ and the Google Earth Engine platform, Digital Elevation Model data by the National Aeronautics and Space Administration (NASA), and the Global Land Data Assimilation System (GLDAS) datasets developed jointly by the NASA Goddard Space Flight Center (GSFC) and the National Oceanic and Atmospheric Administration (NOAA), National Centers for Environmental Prediction (NCEP).

Conflicts of Interest

The authors declare no conflict of interest.

References

  1. Mulligan, M.; Van Soesbergen, A.; Sáenz, L. GOODD, a global dataset of more than 38,000 georeferenced dams. Sci. Data 2020, 7, 1–8. [Google Scholar] [CrossRef] [Green Version]
  2. Li, X.-Z.; Chen, Z.-J.; Fan, X.-C.; Cheng, Z.-J. Hydropower development situation and prospects in China. Renew. Sustain. Energy Rev. 2018, 82, 232–239. [Google Scholar] [CrossRef]
  3. Radić, V.; Hock, R. Glaciers in the Earth’s Hydrological Cycle: Assessments of Glacier Mass and Runoff Changes on Global and Regional Scales. Surv. Geophys. 2014, 35, 813–837. [Google Scholar] [CrossRef]
  4. Brun, F.; Berthier, E.; Wagnon, P.; Kääb, A.; Treichler, D. A spatially resolved estimate of High Mountain Asia glacier mass balances from 2000 to 2016. Nat. Geosci. 2017, 10, 668–673. [Google Scholar] [CrossRef]
  5. Dehecq, A.; Gourmelen, N.; Gardner, A.S.; Brun, F.; Goldberg, D.; Nienow, P.W.; Berthier, E.; Vincent, C.; Wagnon, P.; Trouvé, E. Twenty-first century glacier slowdown driven by mass loss in High Mountain Asia. Nat. Geosci. 2019, 12, 22–27. [Google Scholar] [CrossRef]
  6. Li, G.; Lin, H. Recent decadal glacier mass balances over the Western Nyainqentanglha Mountains and the increase in their melting contribution to Nam Co Lake measured by differential bistatic SAR interferometry. Glob. Planet. Chang. 2017, 149, 177–190. [Google Scholar] [CrossRef] [Green Version]
  7. Wu, K.; Liu, S.; Jiang, Z.; Xu, J.; Wei, J. Glacier mass balance over the central Nyainqentanglha Range during recent decades derived from remote-sensing data. J. Glaciol. 2019, 65, 422–439. [Google Scholar] [CrossRef] [Green Version]
  8. Dugan, P.J.; Barlow, C.; Agostinho, A.A.; Baran, E.; Cada, G.F.; Chen, D.; Cowx, I.G.; Ferguson, J.W.; Jutagate, T.; Mallen-Cooper, M.; et al. Fish Migration, Dams, and Loss of Ecosystem Services in the Mekong Basin. Ambio 2010, 39, 344–348. [Google Scholar] [CrossRef] [PubMed] [Green Version]
  9. Grill, G.; Lehner, B.; Lumsdon, A.E.; Macdonald, G.K.; Zarfl, C.; Liermann, C.R. An index-based framework for assessing patterns and trends in river fragmentation and flow regulation by global dams at multiple scales. Environ. Res. Lett. 2015, 10, 015001. [Google Scholar] [CrossRef]
  10. Li, X.; Liu, J.P.; Saito, Y.; Nguyen, V.L. Recent evolution of the Mekong Delta and the impacts of dams. Earth-Science Rev. 2017, 175, 1–17. [Google Scholar] [CrossRef]
  11. Gao, H.; He, X.; Ye, B.; Pu, J. Modeling the runoff and glacier mass balance in a small watershed on the Central Tibetan Plateau, China, from 1955 to 2008. Hydrol. Process. 2012, 26, 1593–1603. [Google Scholar] [CrossRef]
  12. Liu, L.; Jiang, L.; Wang, H.; Ding, X.; Xu, H. Estimation of glacier mass loss and its contribution to river runoff in the source region of the Yangtze River during 2000–2018. J. Hydrol. 2020, 589, 125207. [Google Scholar] [CrossRef]
  13. Huss, M.; Hock, R. Global-scale hydrological response to future glacier mass loss. Nat. Clim. Chang. 2018, 8, 135–140. [Google Scholar] [CrossRef] [Green Version]
  14. Zhang, Y.; Zheng, H.; Herron, N.; Liu, X.; Wang, Z.; Chiew, F.H.; Parajka, J. A framework estimating cumulative impact of damming on downstream water availability. J. Hydrol. 2019, 575, 612–627. [Google Scholar] [CrossRef]
  15. Ke, L.; Song, C.; Yong, B.; Lei, Y.; Ding, X. Which heterogeneous glacier melting patterns can be robustly observed from space? A multi-scale assessment in southeastern Tibetan Plateau. Remote. Sens. Environ. 2020, 242, 111777. [Google Scholar] [CrossRef]
  16. Lin, X.; Zhang, Y.; Yao, Z.; Gong, T.; Wang, H.; Chu, D.; Liu, L.; Zhang, F. The trend on runoff variations in the Lhasa River Basin. J. Geogr. Sci. 2008, 18, 95–106. [Google Scholar] [CrossRef]
  17. Farr, T.G.; Rosen, P.A.; Caro, E.; Crippen, R.; Duren, R.; Hensley, S.; Kobrick, M.; Paller, M.; Rodriguez, E.; Roth, L.; et al. The Shuttle Radar Topography Mission. Rev. Geophys. 2007, 45, 45. [Google Scholar] [CrossRef] [Green Version]
  18. RGI Consortium. Randolph Glacier Inventory 6.0—A Dataset of Global Glacier Outlines: Version 6.0; Glims Technical Report for RGI Consortium; RGI Consortium: Colorado, IN, USA, 2017. [Google Scholar]
  19. Nuimura, T.; Sakai, A.; Taniguchi, K.; Nagai, H.; Lamsal, D.; Tsutaki, S.; Kozawa, A.; Hoshina, Y.; Takenaka, S.; Omiya, S.; et al. The GAMDAM glacier inventory: A quality-controlled inventory of Asian glaciers. Cryosphere 2015, 9, 849–864. [Google Scholar] [CrossRef] [Green Version]
  20. Guo, W.; Liu, S.; Xu, J.; Wu, L.; Shangguan, D.; Yao, X.; Wei, J.; Bao, W.; Yu, P.; Liu, Q.; et al. The second Chinese glacier inventory: Data, methods and results. J. Glaciol. 2015, 61, 357–372. [Google Scholar] [CrossRef] [Green Version]
  21. Nuth, C.; Kääb, A. Co-registration and bias corrections of satellite elevation data sets for quantifying glacier thickness change. Cryosphere 2011, 5, 271–290. [Google Scholar] [CrossRef] [Green Version]
  22. Gardelle, J.; Berthier, E.; Arnaud, Y.; Kääb, A. Region-wide glacier mass balances over the Pamir-Karakoram-Himalaya during 1999–2011. Cryosphere 2013, 7, 1263–1286. [Google Scholar] [CrossRef] [Green Version]
  23. Neckel, N.; Loibl, D.; Rankl, M. Recent slowdown and thinning of debris-covered glaciers in south-eastern Tibet. Earth Planet. Sci. Lett. 2017, 464, 95–102. [Google Scholar] [CrossRef] [Green Version]
  24. Huss, M. Density assumptions for converting geodetic glacier volume change to mass change. Cryosphere 2013, 7, 877–887. [Google Scholar] [CrossRef] [Green Version]
  25. Liu, K.; Song, C.; Ke, L.; Jiang, L.; Pan, Y.; Ma, R. Global open-access DEM performances in Earth’s most rugged region High Mountain Asia: A multi-level assessment. Geomorphology 2019, 338, 16–26. [Google Scholar] [CrossRef]
  26. Chen, F.; Mitchell, K.; Schaake, J.; Xue, Y.; Pan, H.-L.; Koren, V.; Duan, Q.Y.; Ek, M.; Betts, A. Modeling of land surface evaporation by four schemes and comparison with FIFE observations. J. Geophys. Res. Space Phys. 1996, 101, 7251–7268. [Google Scholar] [CrossRef] [Green Version]
  27. Koren, V.; Schaake, J.; Mitchell, K.; Duan, Q.-Y.; Chen, F.; Baker, J.M. A parameterization of snowpack and frozen ground intended for NCEP weather and climate models. J. Geophys. Res. Space Phys. 1999, 104, 19569–19585. [Google Scholar] [CrossRef]
  28. Liang, X.U.; Lettenmaier, D.P.; Wood, E.F.; Burges, S.J. A Simple hydrologically Based Model of Land Surface Water and Energy Fluxes for GSMs. J. Geophys. Res. Atmos. 1994, 99, 14415–14428. [Google Scholar] [CrossRef]
  29. Day, Y. The Common Land Model (CLM). Bull. Am. Meteorol. Soc. 2003, 84, 1013–1023. [Google Scholar] [CrossRef] [Green Version]
  30. Qi, W.; Liu, J.; Chen, D. Evaluations and Improvements of GLDAS2.0 and GLDAS2.1 Forcing Data’s Applicability for Basin Scale Hydrological Simulations in the Tibetan Plateau. J. Geophys. Res. Atmos. 2018, 123, 13–128. [Google Scholar] [CrossRef]
  31. Morrow, R.; Fu, L.-L.; Ardhuin, F.; Benkiran, M.; Chapron, B.; Cosme, E.; D’Ovidio, F.; Farrar, J.T.; Gille, S.T.; Lapeyre, G.; et al. Global Observations of Fine-Scale Ocean Surface Topography With the Surface Water and Ocean Topography (SWOT) Mission. Front. Mar. Sci. 2019, 6, 232. [Google Scholar] [CrossRef]
Figure 1. Overview of the Lhasa River basin and the location and main hydrological elements (DEM) of the study area.
Water 13 01307 g001
Figure 2. The distribution of elevation differences (dh) between the TanDEM-X and SRTM DEMs in relation to the aspect (a) and elevation (b) before and after systemic bias correction.
Water 13 01307 g002
Figure 3. Multiyear averaged monthly water level, storage, and storage change of the PDR (2014–2018) and the ZKR (2007–2018), respectively. The dashed lines of the water level and water storage are the designed normal water level and the corresponding water storage. The month of December for the PDR is omitted because of a lack of valid observations in the GSW datasets.
Water 13 01307 g003
Figure 4. Changes in (a) the annual elevation and (b) the annual glacier elevation in the study area, and (c,d) the glacier elevation changes in relation to the elevation (m a.s.l.) derived from differentiating the TanDEM-X and SRTM. Statistics are grouped in a 100-m elevation bin.
Water 13 01307 g004
Figure 5. Bathymetry of the PDR and ZKR; the 3D topographic map of the PDR and ZKR.
Water 13 01307 g005
Figure 6. (a) Monthly surface runoff and (b) SWE derived from Noah, VIC, and CLM and their average upstream basin values from 2007 to 2018.
Water 13 01307 g006
Table 1. Basic reservoir information and statistical data of the inundation area and water storage of ZKR and PDR.
Measurement ItemsPDRZKR
Area
(km2)
Observed Average26.3910.81
Observed Minimum17.705.91
Observed Maximum30.2012.08
Water Level
(m a.s.l.)
Observed Average4086.973887.80
Normal Water Level4095.003888.00
Observed Minimum4075.993880.70
Dead Water Level4066.003878.00
Observed Maximum4090.723889.56
Check Flood Level4098.703891.30
Storage
(Gt)
Observed Average0.63 ± 0.250.13 ± 0.09
Recorded Storage1.080.18
Observed Minimum0.33 ± 0.180.06 ± 0.08
Dead Storage0.270.08
Observed Maximum0.74 ± 0.30.15 ± 0.09
Total Storage Capacity1.170.22
Observed Range0.41 ± 0.480.09 ± 0.17
Regulation Storage Capacity0.810.11
Publisher’s Note: MDPI stays neutral with regard to jurisdictional claims in published maps and institutional affiliations.

