
Joint Gravity and Seismic Reflection Methods to Characterize the Deep Aquifers in Arid Ain El Beidha Plain (Central Tunisia, North Africa)

Georesources Laboratory, Centre de Recherches et des Technologies des Eaux, CERTE, University of Carthage, Borj Cedria Technopark BO 273, Soliman 8020, Tunisia
*
Author to whom correspondence should be addressed.
Water 2021, 13(9), 1310; https://doi.org/10.3390/w13091310
Submission received: 1 April 2021
/
Revised: 30 April 2021
/
Accepted: 5 May 2021
/
Published: 7 May 2021
Abstract
:Electric resistivity sounding and tomography, as well as electromagnetic sounding, are the classical methods frequently used for hydrogeological studies. In this work, we propose the development and implementation of an original integrated approach using the unconventional hydro–geophysical methods of gravity and seismic reflection for the fast, large–scale characterization of hydrogeological potential using the Ain El Beidha plain (central Tunisia) as an analogue. Extending the values of vintage petroleum seismic reflection profiles and gravity data, in conjunction with available geological and hydrogeological information, we performed an advanced analysis to characterize the geometry of deep tertiary (Oligocene and Eocene) aquifers in this arid area. Residual and tilt angle gravity maps revealed that most gravity anomalies have a short wavelength. The study area was mainly composed of three major areas: the Oued Ben Zitoun and Ain El Beidha basins, which are both related to negative gravity trends corresponding to low–density subsiding depocenters. These basins are separated by an important NE–SW trend called “El Gonna–J. El Mguataa–Kroumet Zemla” gravity high. Evaluation of the superposition of detected lineaments and Euler deconvolution solutions’ maps showed several NE–SW and N–S relay system faults. The 3D density inversion model using a lateral and vertical cutting plane suggested the presence of two different tectonic styles (thin VS thick). Results from the gravity analysis were in concordance with the seismic analysis. The deep Oligocene and Eocene seismic horizons were calibrated to the hydraulic wells and surrounding outcrops. Oligocene and Eocene geological reservoirs appear very fractured and compartmented. The faulting network also plays an important role in enhancing groundwater recharge process of the Oligocene and Eocene aquifers. Finally, generated isochron maps provided an excellent opportunity to develop future comprehensive exploration surveys over smaller and more favorable areas’ sub–basins.
1. Introduction
In arid and semi–arid regions, surface water resources are limited. These areas present a growing need for potable and irrigation water, and the population is obliged to use groundwater. In most cases, groundwater is not used sustainably.
The increasing need for groundwater supply has induced a mounting trend in the application of hydro–geophysics all over the world. However, because of their limited investigation depth, the commonly used near–surface hydro–geophysical methods such as electrical resistivity sounding (SEV), electrical resistivity tomography (ERT), and time electromagnetic sounding (TEM) do not allow for precise geometry or the extension of many interesting regional deep and poorly exploited groundwater tables.
Deep geophysical survey methods such as gravity and seismic, commonly used for petroleum exploration, can play an important role in improving the understanding of a regional tectonic framework and characterizing water–bearing geological formations. This will facilitate the quantification and assessment of deep groundwater resources. Data integration studies are widespread in geophysics. However, only a few studies using joint gravity and seismic investigations have been conducted for deep aquifer assessment in arid zones [1,2]. A more recent study [3] has integrated several findings obtained from a single–source/single–sensor seismic profile with gravity data. These studies were performed to detail the tectonic settings and characterize the subsurface, water–bearing formations of the Al Jaww plain, one of the most important groundwater reserves of the United Arab Emirates.
In Tunisia, not far from our study area [4], geophysical data combined with the geological and hydrogeological data of the Sidi Bouzid region have been analyzed to characterize the geometry of the water tables. The obtained results refined the geostructural schema and outlined the extension deep sub–basins of the two locations, Oued El Hajel and Ouled Asker. Another investigation in northwest Tunisia [5] has highlighted the contribution of gravity and seismic data in understanding the geometry of the Zouaraa–Ouchtata dune and its hydrogeological implications.
This work aims to use regional gravity and seismic reflection data, complemented by geological/hydrogeological background information, to detail the deep tectonic settings of Oligocene and Eocene groundwater reservoirs. The comprehension of the deep structuring of these reservoirs will make an important contribution to delineate the hydrogeological behavior of the Ain El Beidha basin.
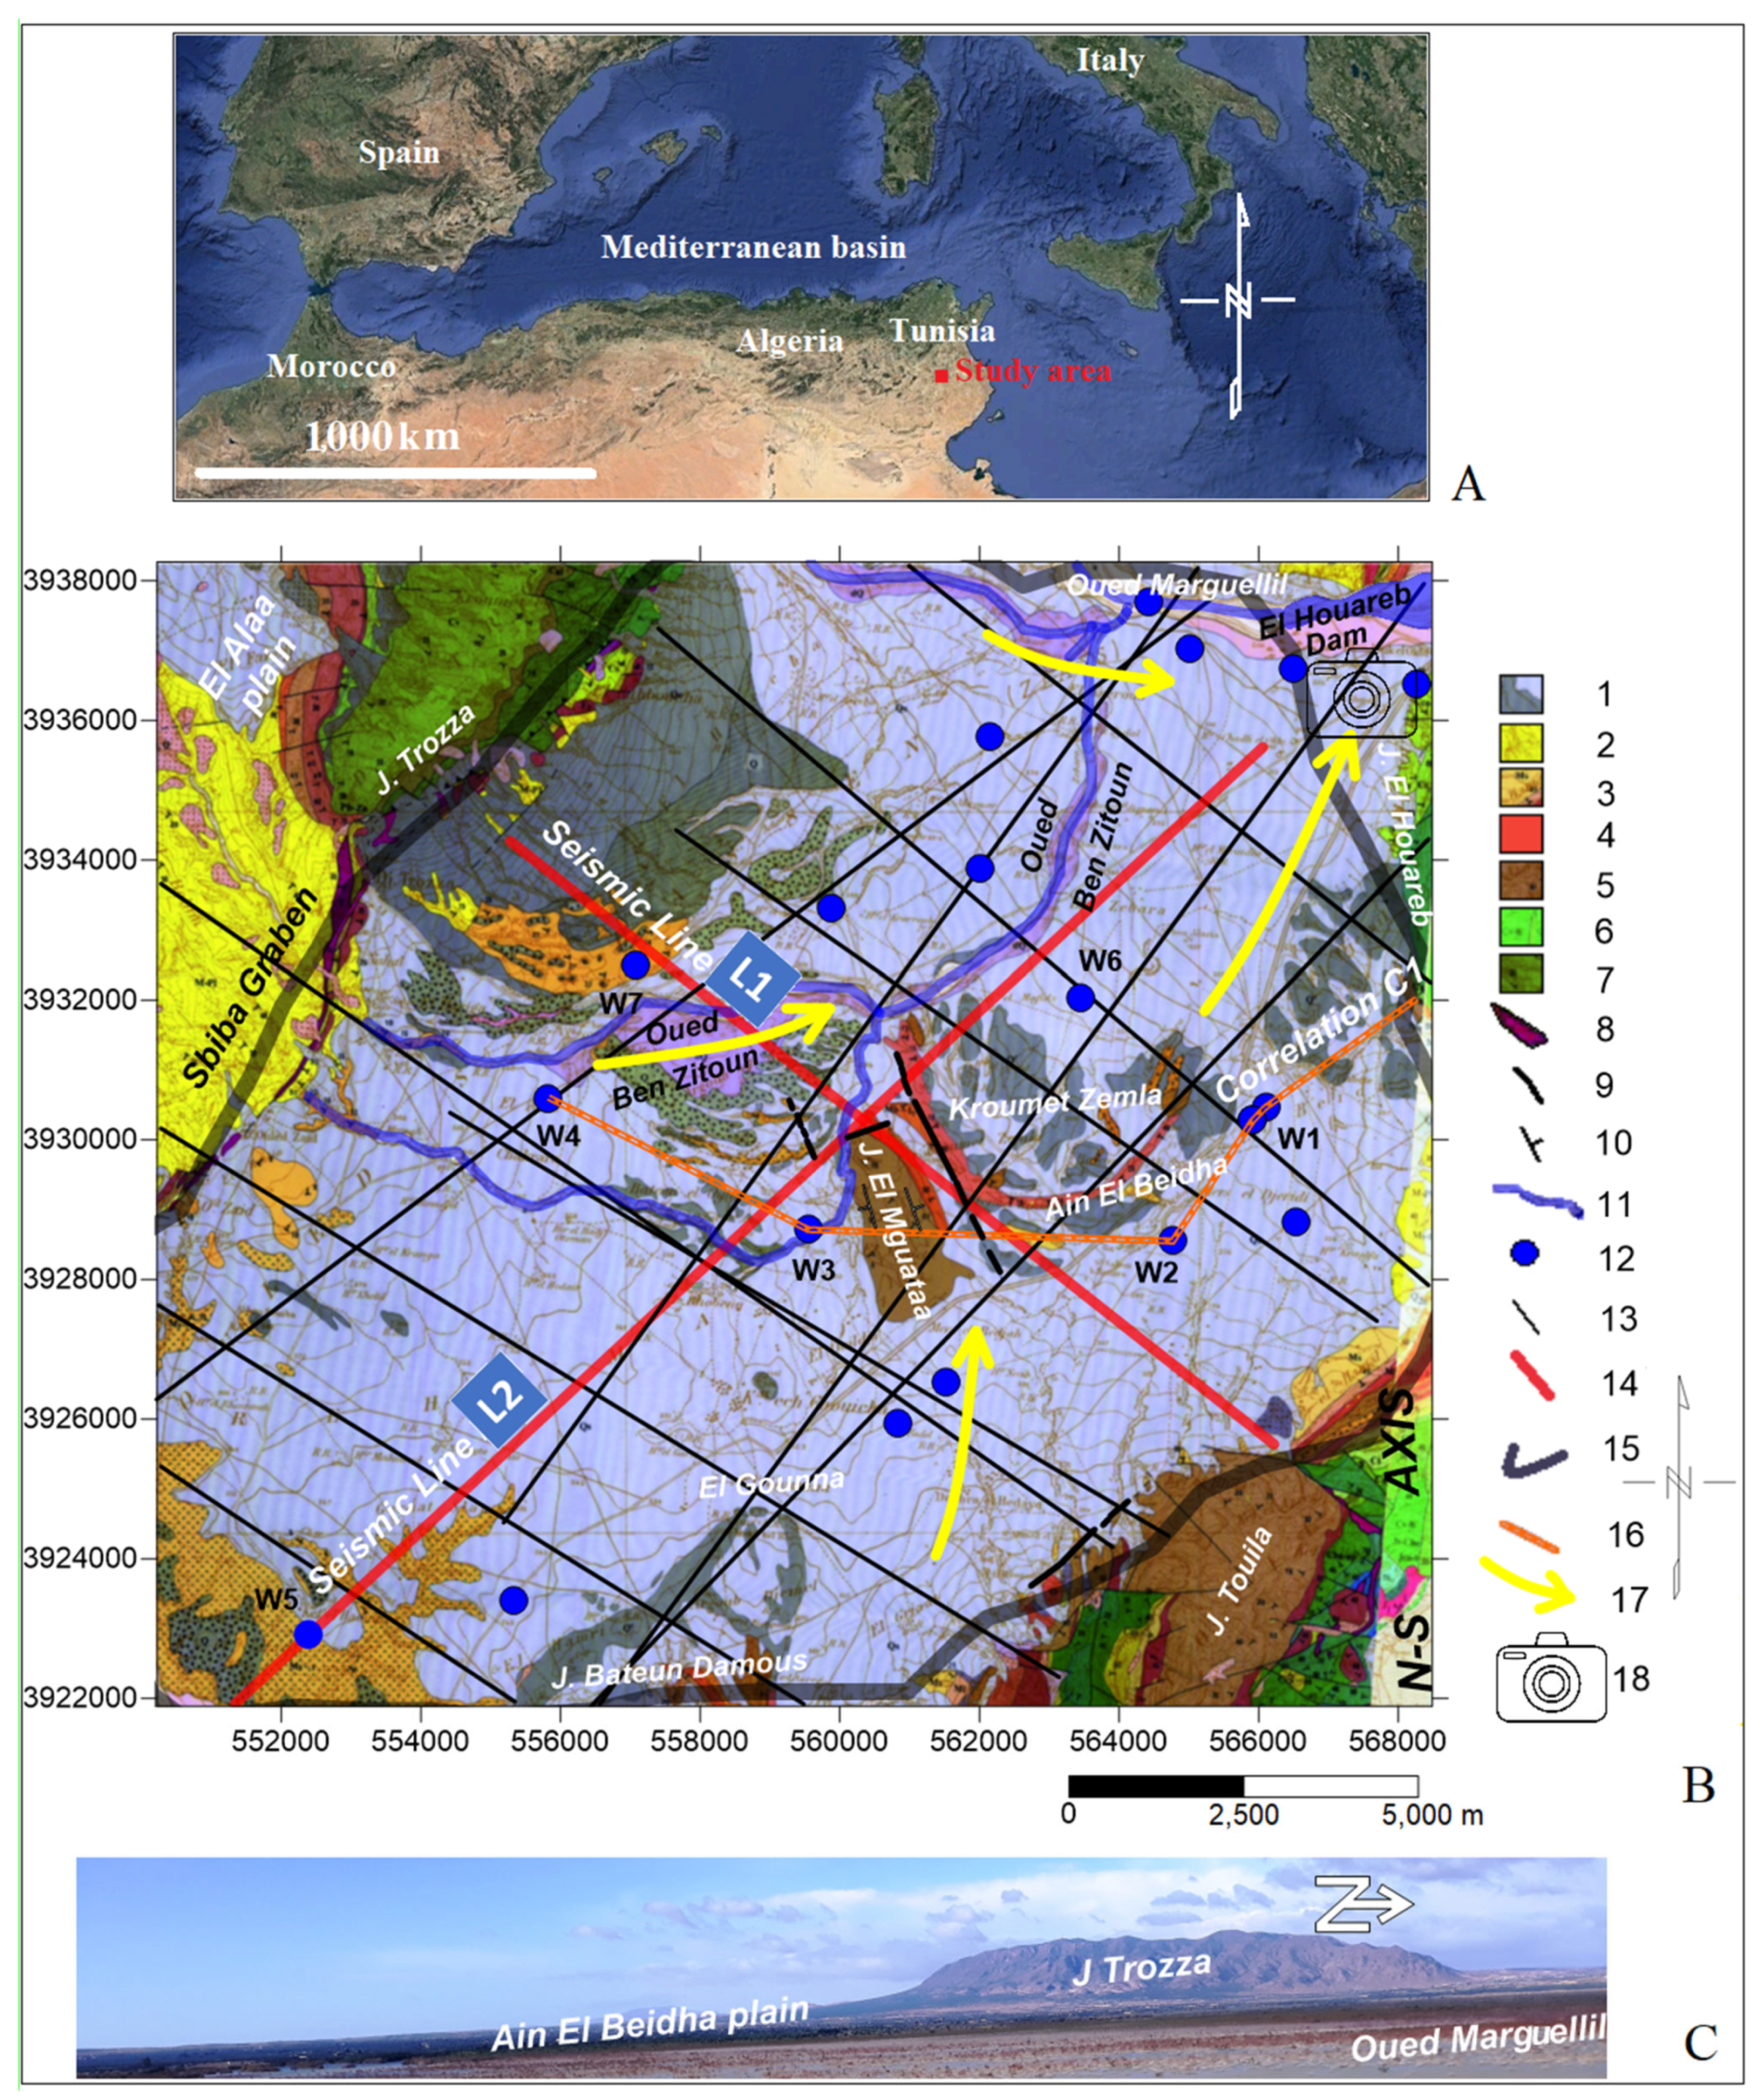
The Ain El Beidha plain is situated in central Tunisia (Figure 1), as part of the Tunisian Atlas and Merguellil/Kairouan basin that contains the biggest agricultural zones in central Tunisia. It is imbricated between two major structural elements in central Tunisia:
To the east, the north–south axis [6,7,8], or N–S axis (Figure 1), is composed of folded Mesozoic deposits from J. Touila [9,10] in the south to J. El Houareb in the north [7,8,11];
To the northwest, lies the NE–SW Labaiedh–Trozza–Cherichira trend with the J. Trozza thrust belt, which is formed of reefal Aptian carbonates [12,13,14,15,16,17,18].
Surface water stock (El Haouareb dam supplied by Oued Ben Zitoun and Oued Merguellil rivers (Figure 1)), as well as groundwater resources (Mio–Plio–Quaternary and Miocene aquifers), show quantitative and qualitative degradation [19]. During the last few decades, The Ain El Beidha plain has changed due to a fast and dynamic evolution in human and agricultural activities, leading to an increase in the demand for potable and irrigation water.
In this arid area, Oligocene siliciclastic and Eocene carbonate layers are the most interesting and strategic deep aquifers [19,21,22]. In order to perform a significant and meaningful hydrogeological study of the water potential for these aquifers, it is necessary to define the subsurface structuring beneath the Ain El Beidha plain.
2. Geological Setting
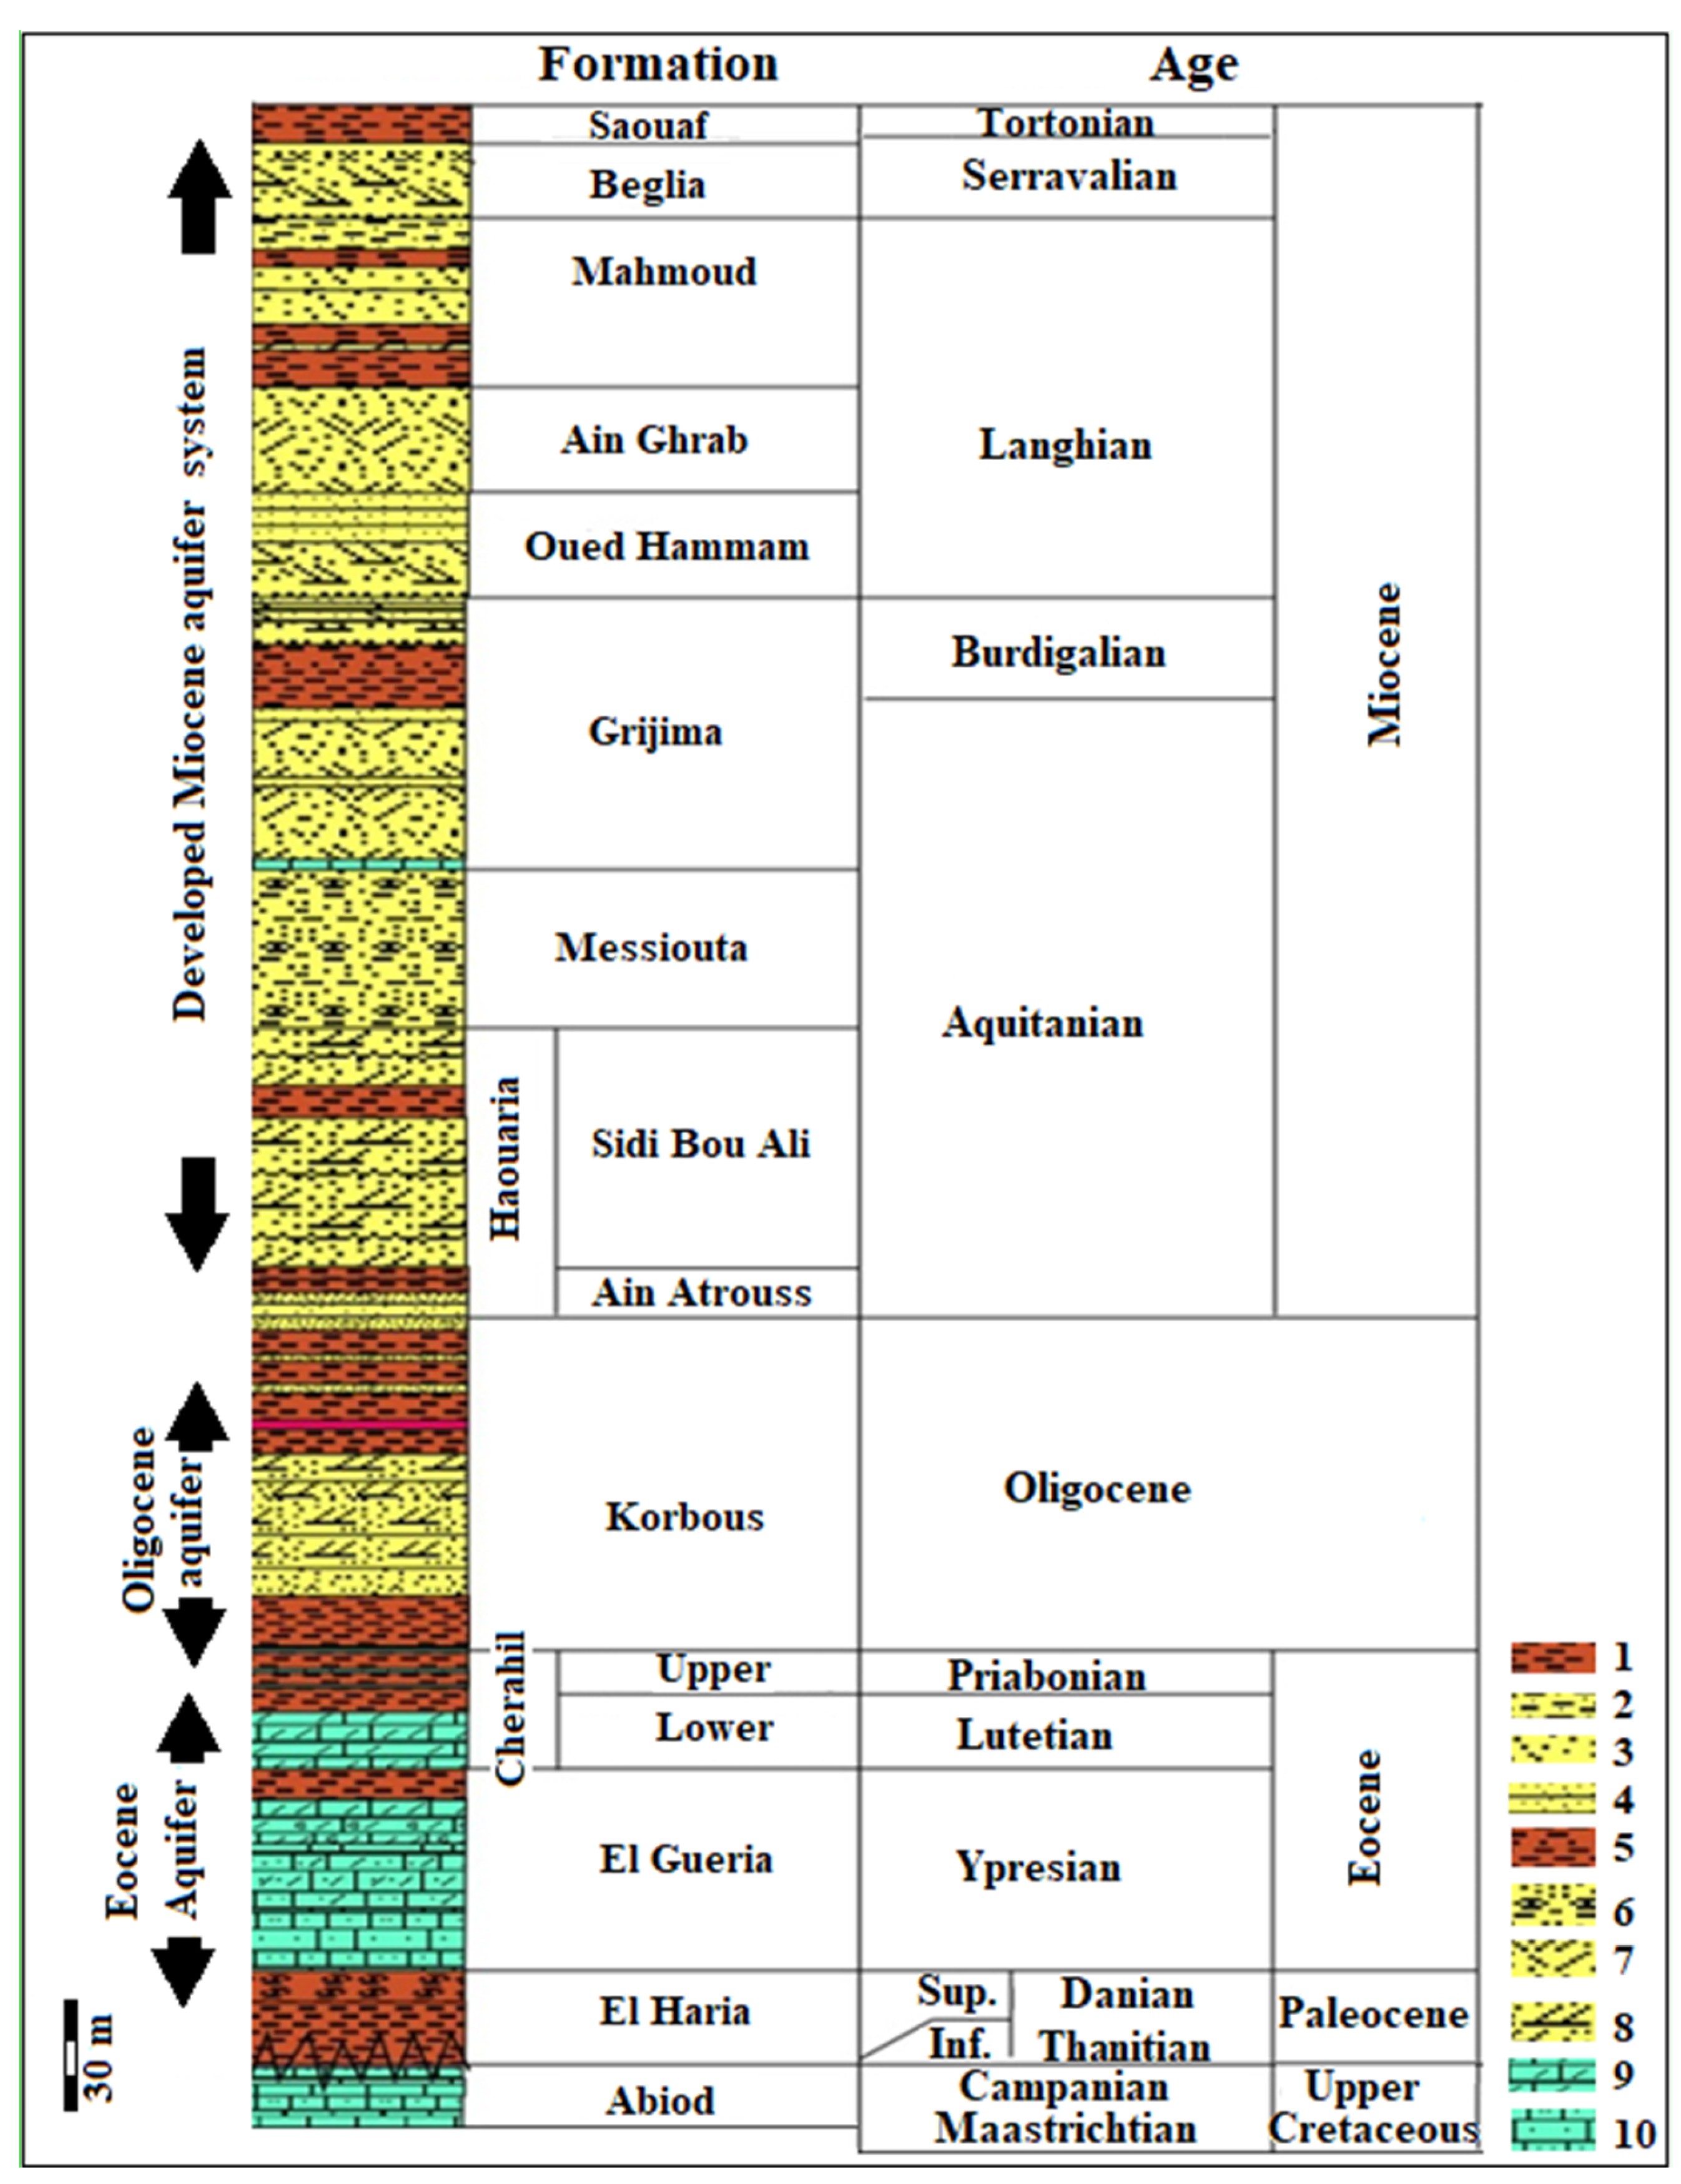
Geological outcrops surrounding the Ain El Beidha plain are characterized by the presence of Triassic to Miocene deposits (Figure 1) [7,8,11,17,23]. In the northwestern part of the study area, the J. Trozza presents a reefal Aptian outcrop affected by a radial fracturing system [17,24]. To the west, the J. Trozza anticline is linked to Labaiedh anticline by a Triassic salt corridor along the eastern part of Sbiba graben [25,26]. The Miocene, Oligocene, and Eocene deposits can be recognized in the western side of the N–S axis (Figure 2). Alternance of the paleogeographic areas from marine to shelf deposit paleoenvironment indicates Miocene siliciclastics of Beglia, Saouaf, Grijima, and Messiouta formations and shales and carbonate of Mahmoud, Ain Ghrab, Oued Hammam, and Haouaria Formations. The fluvio–deltaic siliciclastic paleoenvironment indicates Oligocene thick sandstone bars and clays of the Fortuna and Korbous formations, and the carbonate platform defines the Eocene deposits as the Cherahil and El Gueria formations (Figure 2) [11,20]. The substratum of tertiary deposits is composed of Paleocene clays of the El Haria formation and Campanian–Maastrichtian limestones of the Abiod formation [6,11,20].
The Ain El Beidha plain was impacted by numerous tectonic phases during the Mesozoic and Tertiary paroxysms [27,28,29]. Although the plain appears to be a simple large syncline (Figure 1A,B), a more thorough and accurate examination revealed some geomorphological elements, such as the following:
- (1)
- changes in river direction (Oued Ben Zitoun river), and
- (2)
- the presence of an Eocene outcrop at the center of the plain.
Consequently, the plain’s structure is complex and probably compartmented by hidden faults and discontinuities beneath the Quaternary deposits (Figure 1). From the west to the east, we can distinguish:
- –
- The NE–SW Oued Ben Zitoun syncline, limited to the west by the Sbiba graben and the Trozza anticline (Figure 1). This syncline is composed essentially of a thick Mio–Plio–Quaternary cover (siliciclastic and alluvium Segui formation). Miocene outcrops could also be noticed near the eastern border of the Trozza anticline (Figure 1).
- –
- The NE–SW faulted axis of J. Bateun Damous–El Gonna–J. El Mguataa–Kroumet Zemla. This axis is composed of folded Upper Eocene marls around J. El Mguataa, (The dip varies from 35° to 70°) and Miocene series (Figure 1). It is also affected by surface NE–SW and NW–SE faults.
- –
- The N–S axis from J. Touila to J. El Houareb is characterized by the presence of allochthonous Triassic layers and Cretaceous series along its western side.
3. Hydrogeological Setting
The hydrological and hydrogeological aspects of the Ain El Beidha basin have been previously studied [19,30,31,32]. The Oued Ben Zitoun river represents the major developed river in the Ain El Beidha plain. It supplies the Merguellil river (the most important river in the Kairouan zone) and the Haouareb dam. The Tertiary folded series of the Ain El Beidha plain are covered by Plio–Quaternary deposits. The different piezometric surveys in the study area [19,31,33] revealed a regional groundwater flow from southwest to northeast (Figure 1A).
Alluvial Mio–Plio–Quaternary and Miocene aquifers are currently over–exploited. The deep Oligocene siliciclastic and Eocene carbonates aquifers were explored by few wells. These aquifers represent an invaluable water resource in the region. The natural recharge is thought to be from outcrops surrounding Ain El Beidha (Figure 1).
The exploitation of Eocene limestone (Cherahil Formation) groundwater is over 1.31 Mm3/year (Figure 1 and Figure 2), with mostly good water quality (average of 1.15 g/L). Exploitation of Oligocene sandstone (Korbous Formation) groundwater is over 1.56 Mm3/year (Figure 1 and Figure 2), with good water quality (average of 1.2 g/L) [34].
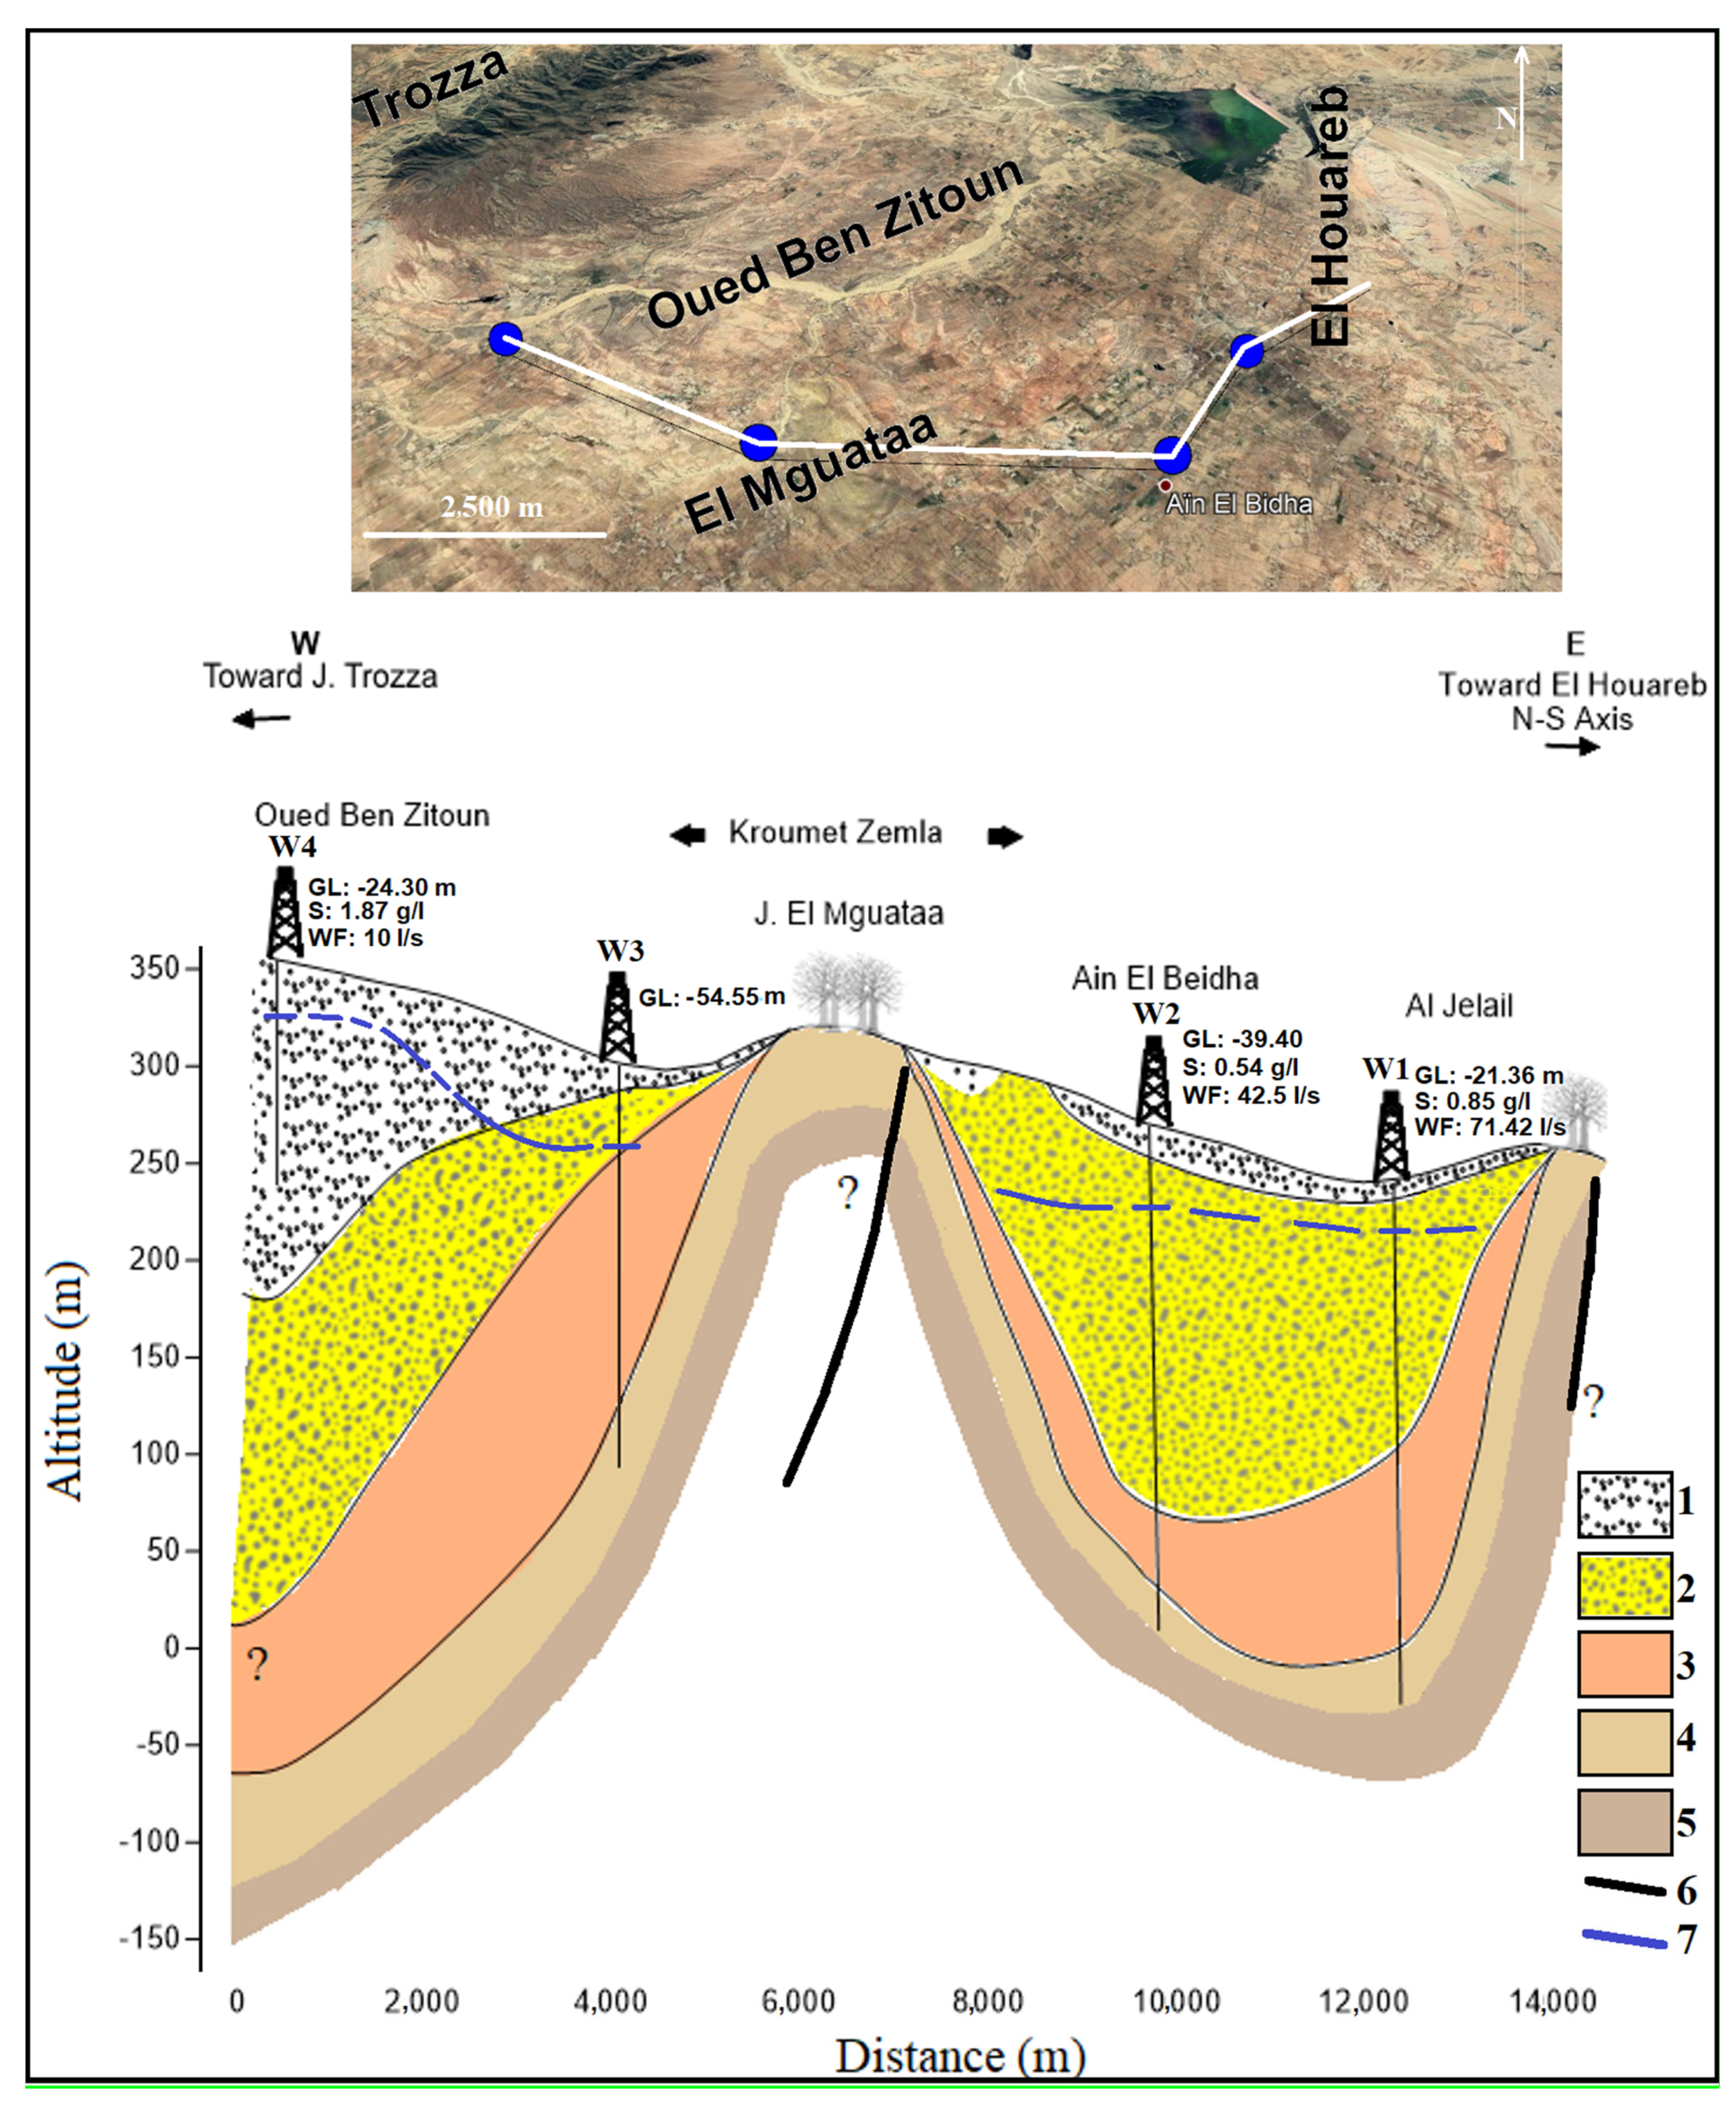
We performed a hydrogeological cross section (Figure 3) from the east to the west using information on the outcrops and deep well data obtained from the Ain El Beidha plain. Two depocenters were clearly delineated with the thickening of the Miocene and Oligocene aquifers in the Oued Ben Zitoun and Ain El Beidha areas. The hydraulic threshold is materialized by J. El Mguataa fold, as a part of the regional NE–SW J. Bateun Damous–El Gonna–J. El Mguetaa–Kroumet Zemla axis. It could also be distinguished in the center of the plain neighboring the W3 well. This structure represents a “demarcation line” and recharge area for shallow and deep tertiary aquifers in the Ain El Beidha plain.
4. Gravity and Seismic Data
We carried out an advanced analysis of gravity data to map structural elements in the plain. Results were compared to seismic reflection profiles to define “Oligocene/Eocene hydrogeological prospects” for prospective deep exploration.
Seismic reflection data for the study area were obtained from the national petroleum company in Tunisia (ETAP) (Figure 1). Migrated seismic profiles were analyzed to correlate seismic and stratigraphic horizons recognized in the calibration well boreholes obtained from the general direction for water resources in Tunisia (DGRE). First, we corrected and homogenized the datum plane. Next, we verified the spatial coherence by controlling the values of the two–way travel time (TWT) of the seismic horizons in the different profiles’ intersections. Then, we digitized the tops of the Oligocene and Eocene aquifers. Finally, we generated isochron and thickness maps using a mapping software.
The gravity data were obtained from the national mining company of Tunisia (ONM). The gravity survey was achieved using a homogenous data network (one station per Km²). Free–air corrections of the Bouguer anomaly were executed using the 1967 formula with 2.40 as a density correction.
5. Gravity Data Analysis
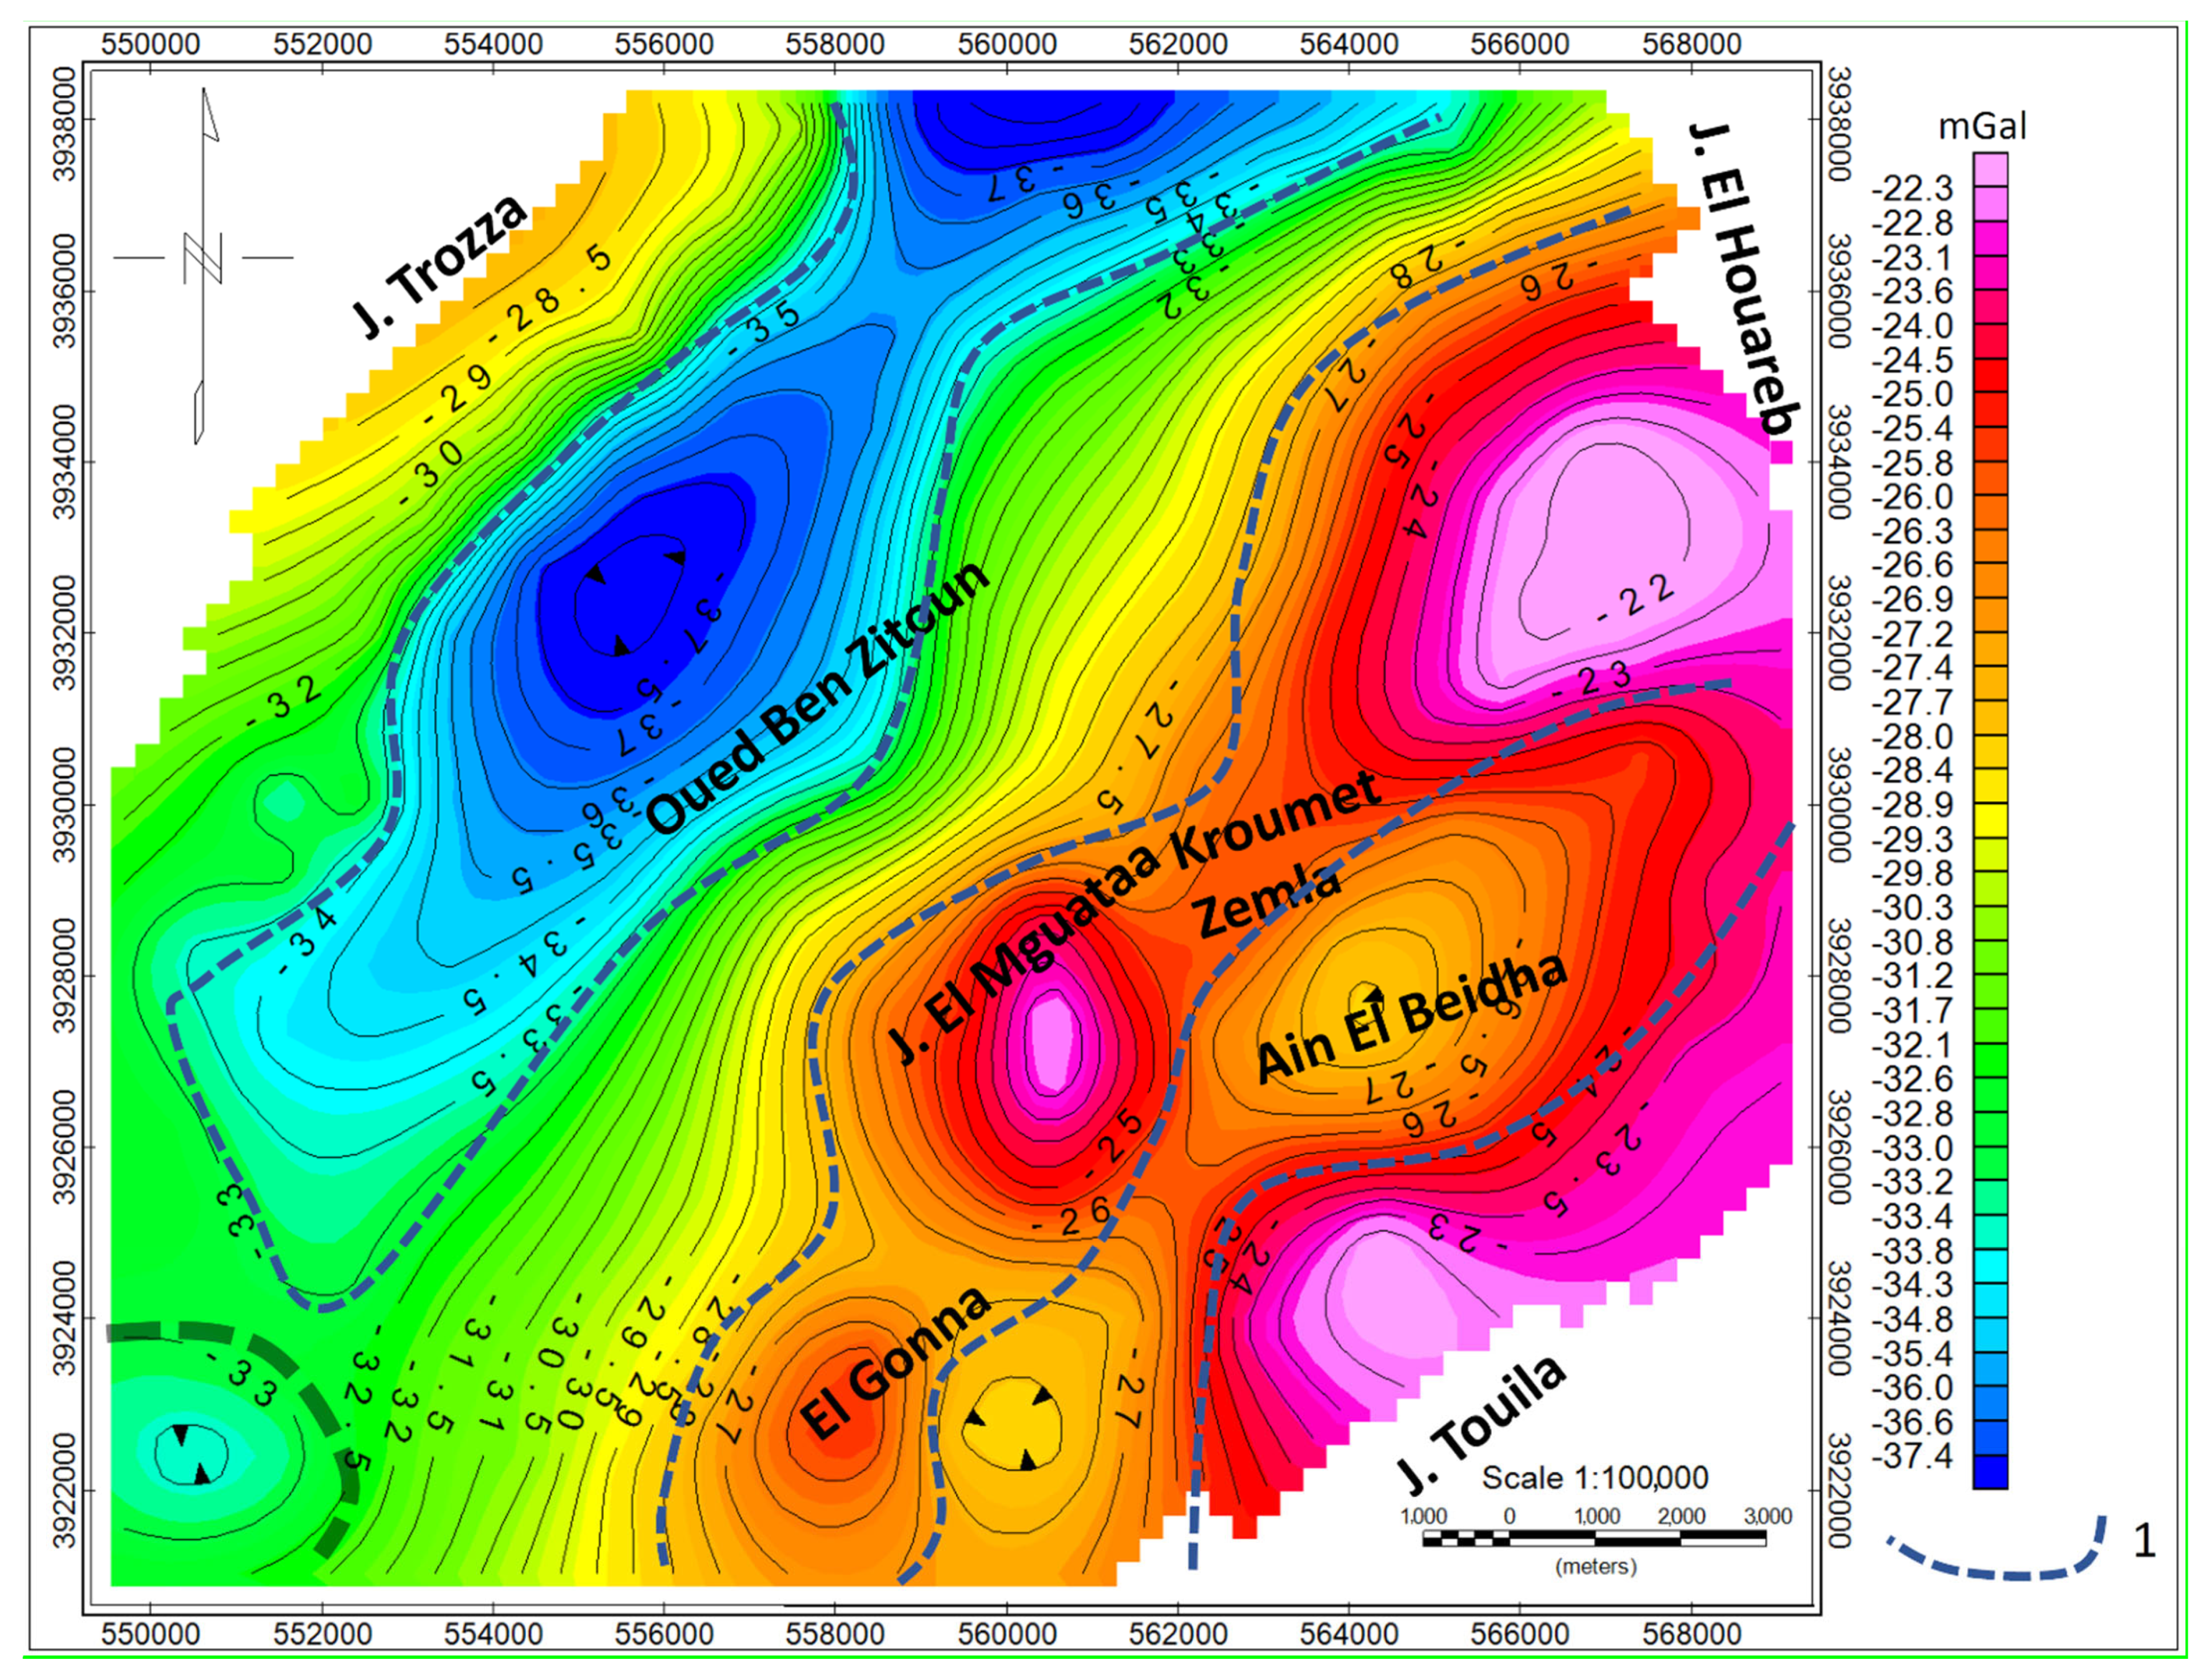
The produced Bouguer gravity map (Figure 4) yielded two main results:
- –
- A regional gravity field is clearly defined with a general NE–SW isoline direction. Gravity values, increasing from west to east, are explained [35] as the effect of crustal thinning.
- –
- The existence of several NE–SW lineament corridors of positive (El Gonna–J. El Mguataa–Kroumet Zemla) and negative anomalies (Oued Ben Zitoun and Ain El Beidha). These corridors are also divided into sub–anomalies probably limited by transverse deep discontinuities.
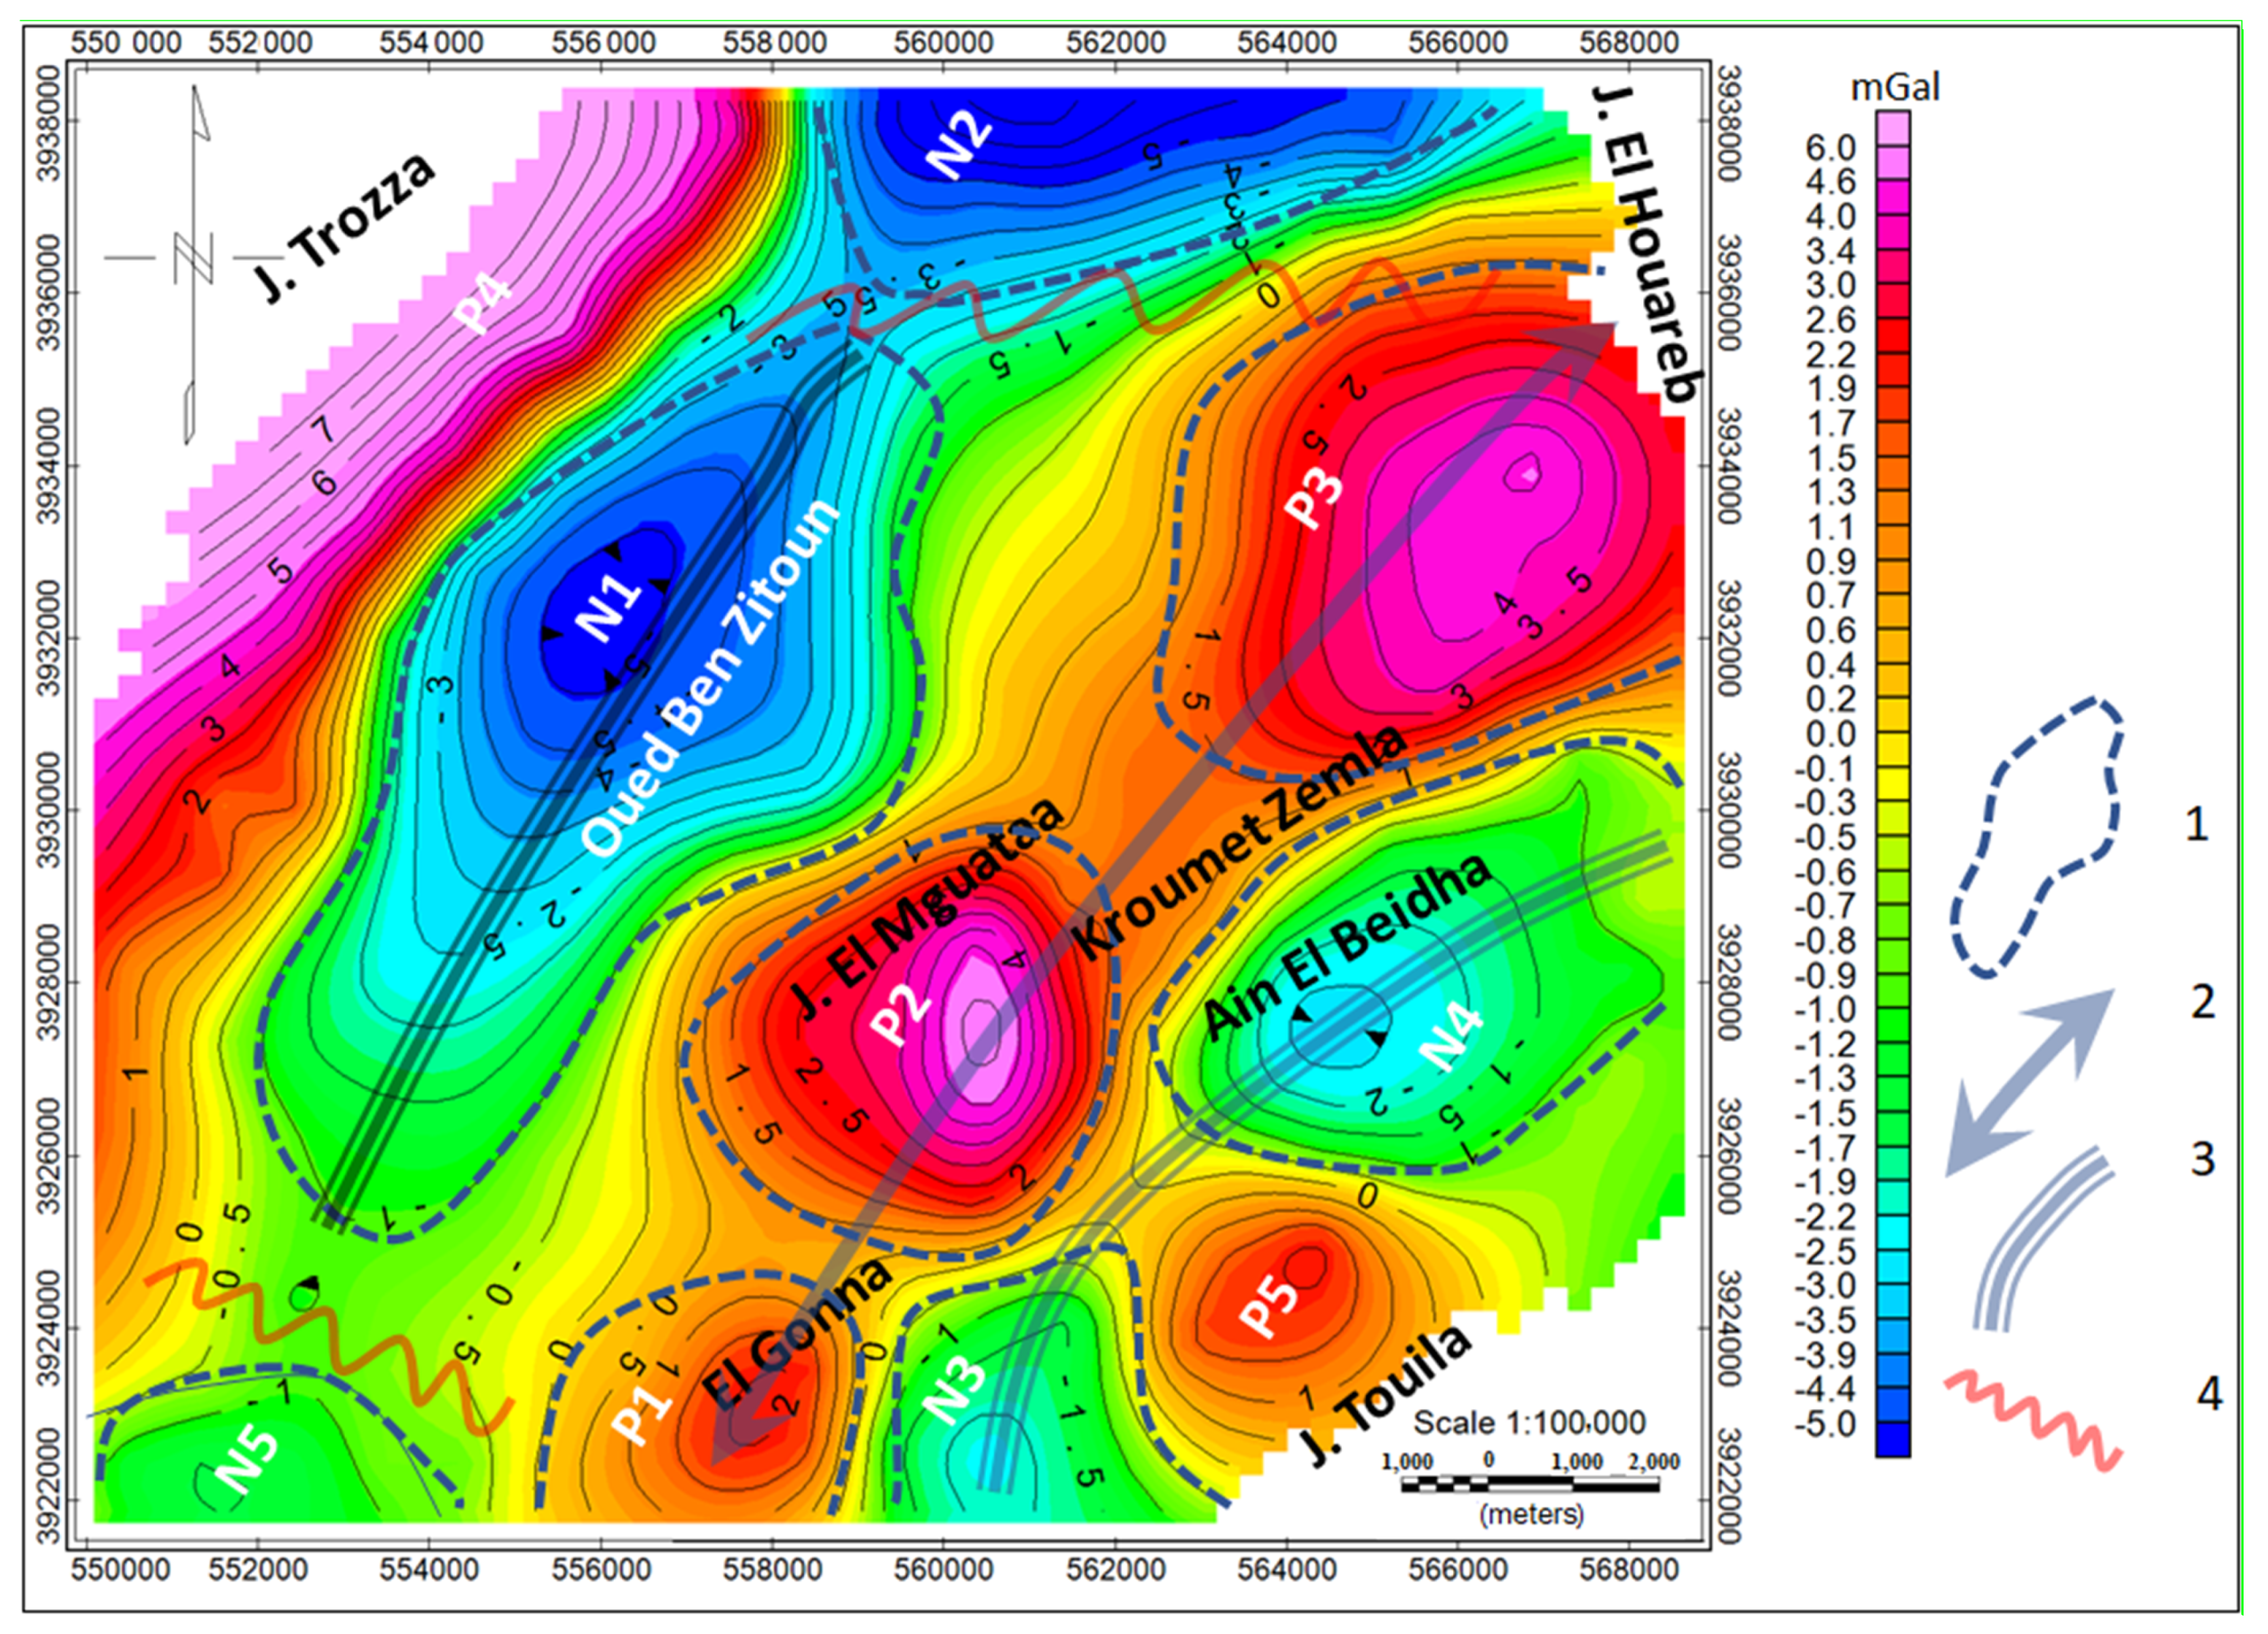
After subtraction of the regional gravity field (first order polynomial regression), the residual gravity map (Figure 5) could better specify the mapping of subsurface structures. Three major axes were recognized:
Oued Ben Zitoun negative corridor (N1). Separation lines between the N1 Oued Ben Zitoun anomaly could be seen: (1) the N2 Merguellil negative anomaly to the North, and (2) the Hajeb Layoun N5 negative anomaly to the South (Figure 5). These separation lines draw the subsurface limits of the Ain El Beidha plain.
El Gonna–J. El Mguataa–Kroumet Zemla positive gravity axis composed of three prominent positive gravity anomalies, P1, P2, and P3
The Ain El Beidha negative gravity axis was comprised of two distinguished sub–negative anomalies, N3 and N4. The northwestern and southeastern borders of the Ain El Beidha plain are constituted of positive gravity anomalies P4 and P5, respectively. They are related to the J. Trozza folded structure and J. Touila anticline as part of the N–S axis.
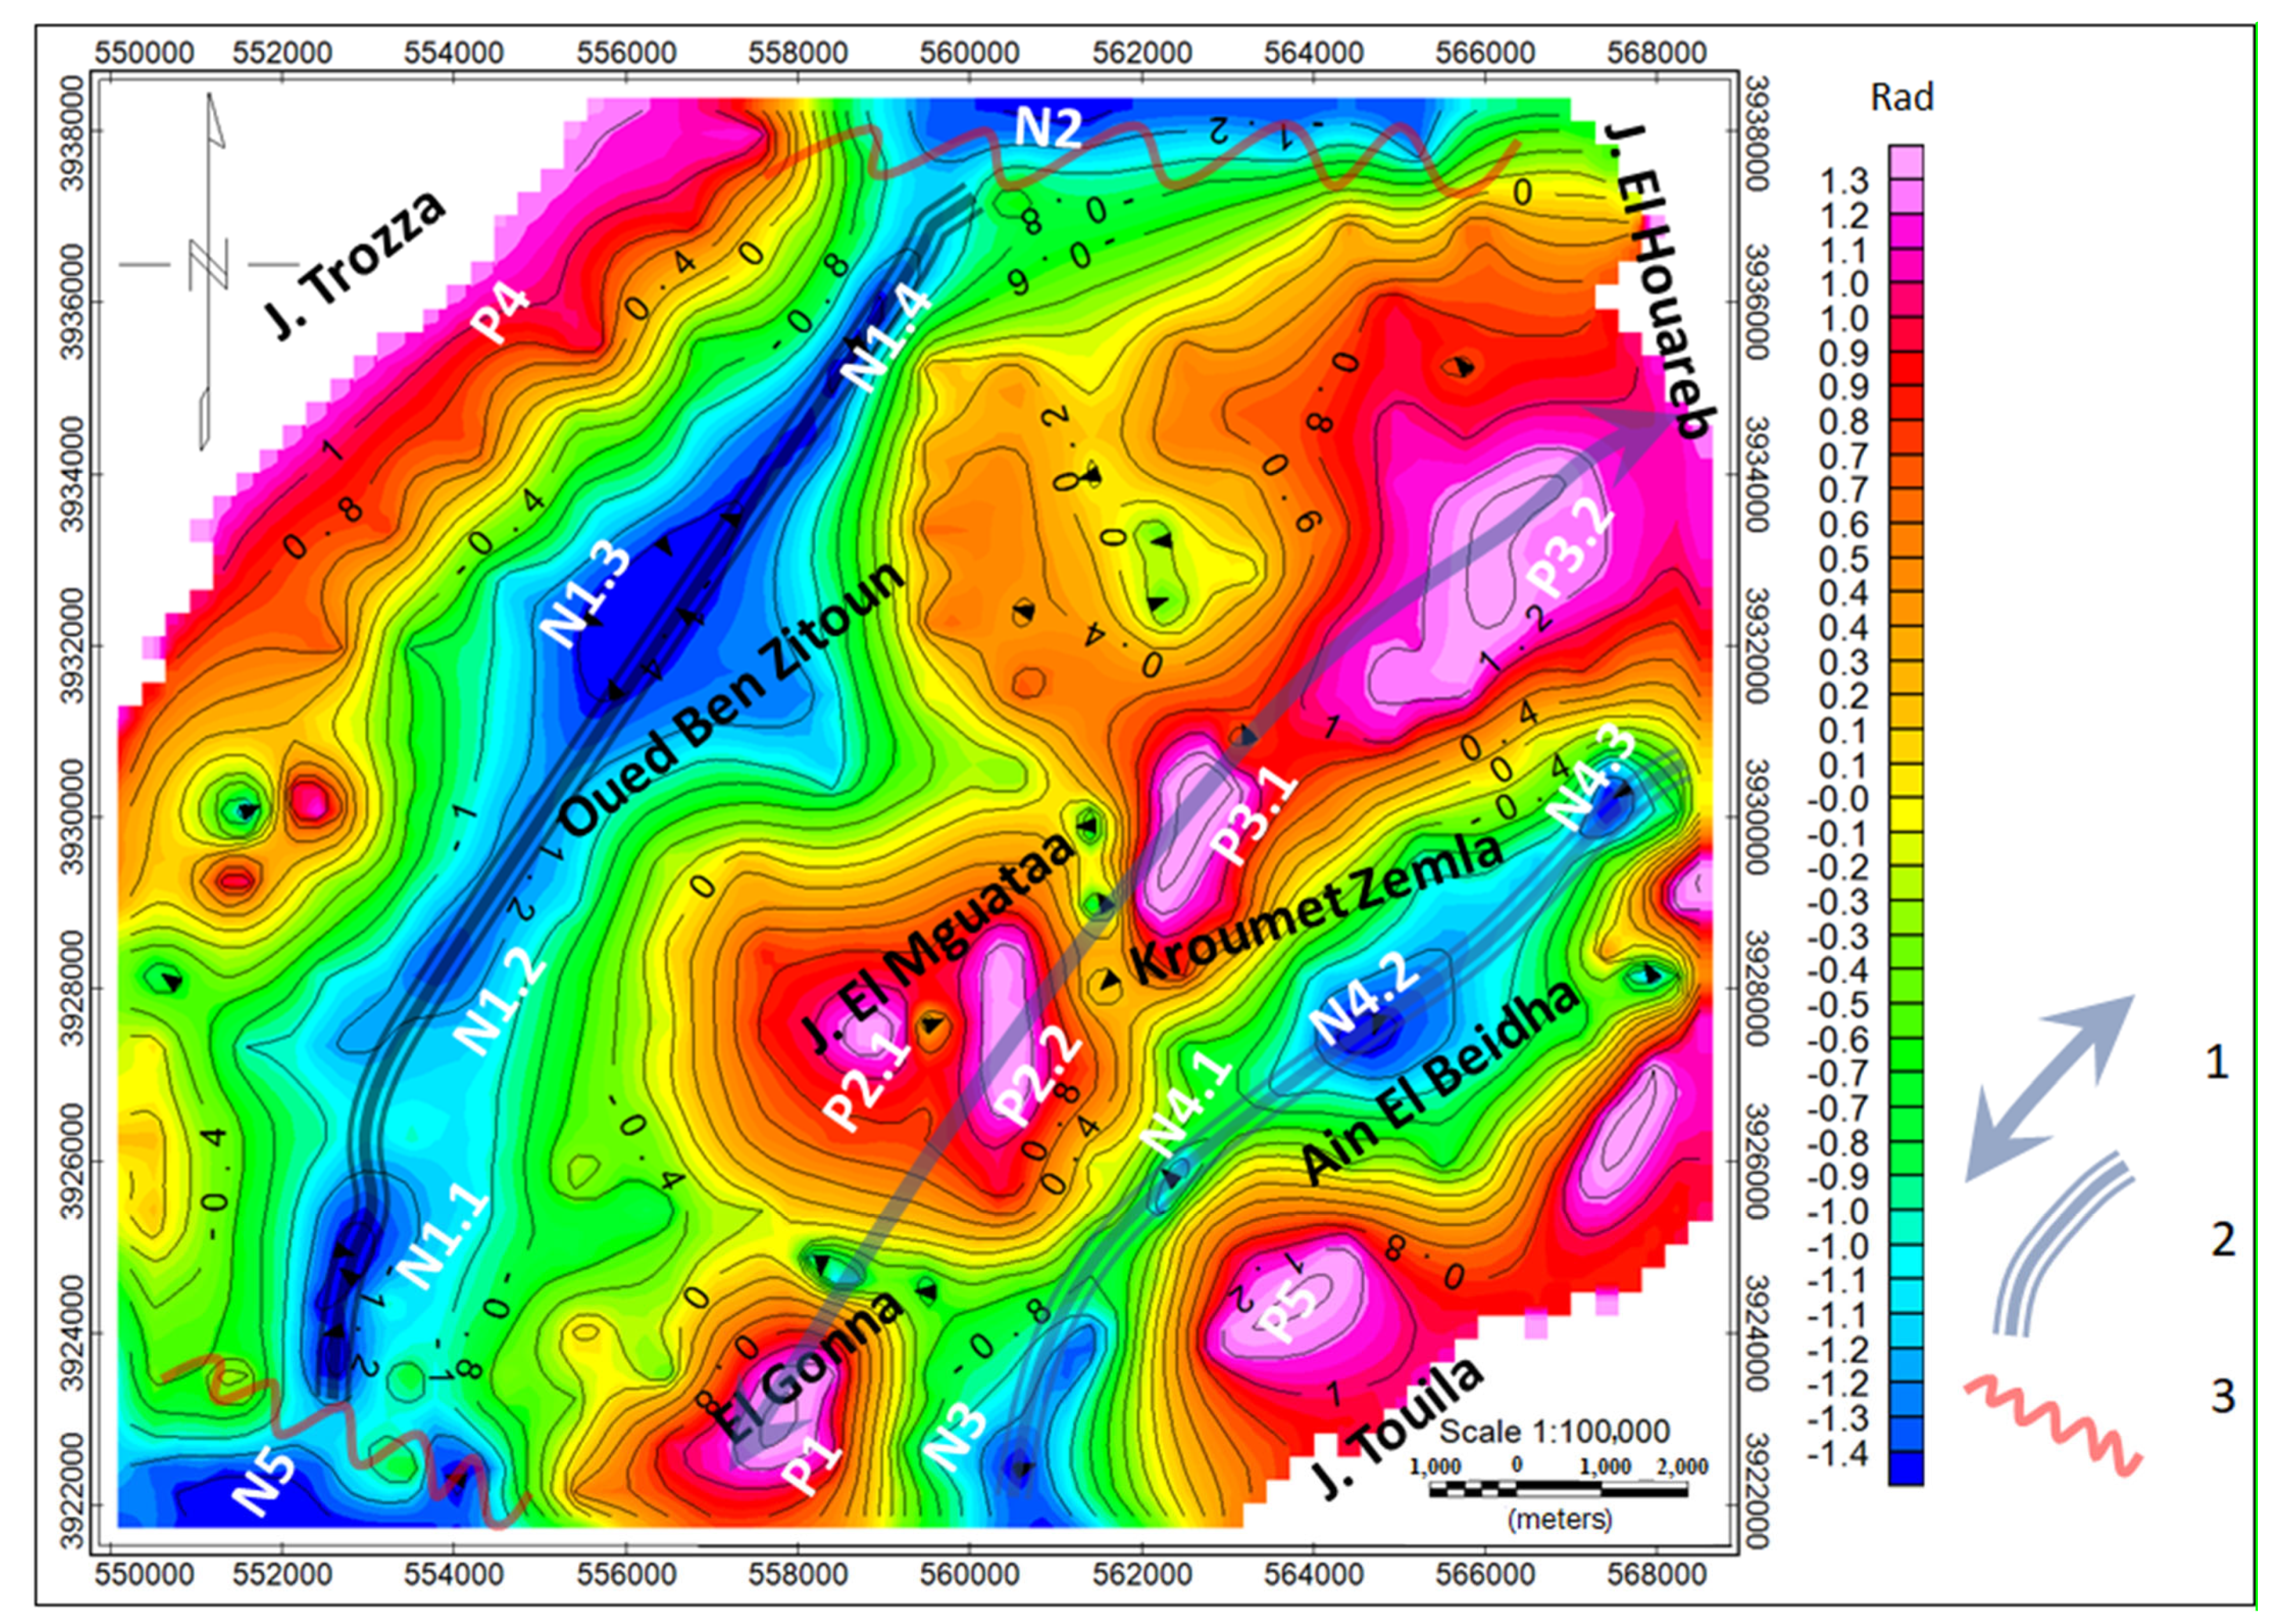
To better understand the structuring of these corridors, we applied the tilt angle filter, which highlights short wavelength anomalies [36]. This map (Figure 6) revealed the following:
- –
- the Oued Ben Zitoun negative corridor (N1) is formed of a succession of different negative gravity anomalies (N1.1, N1.2, N1.3, N1.4). This variation can be explained by thickness changes in the Mio–Plio–quaternary and tertiary deposits along this corridor;
- –
- the El Gonna–J. El Mguataa–Kroumet Zemla positive gravity main axis corresponds to a series of positive gravity anomalies (P1, P2.1, P2.2, P2.3, P3.1, P3.2) probably affected by an important faulting network;
- –
- the Ain El Beidha negative gravity axis is clearly individualized by numerous negative gravity anomalies (N3, N4.1, N4.2, N4.3).
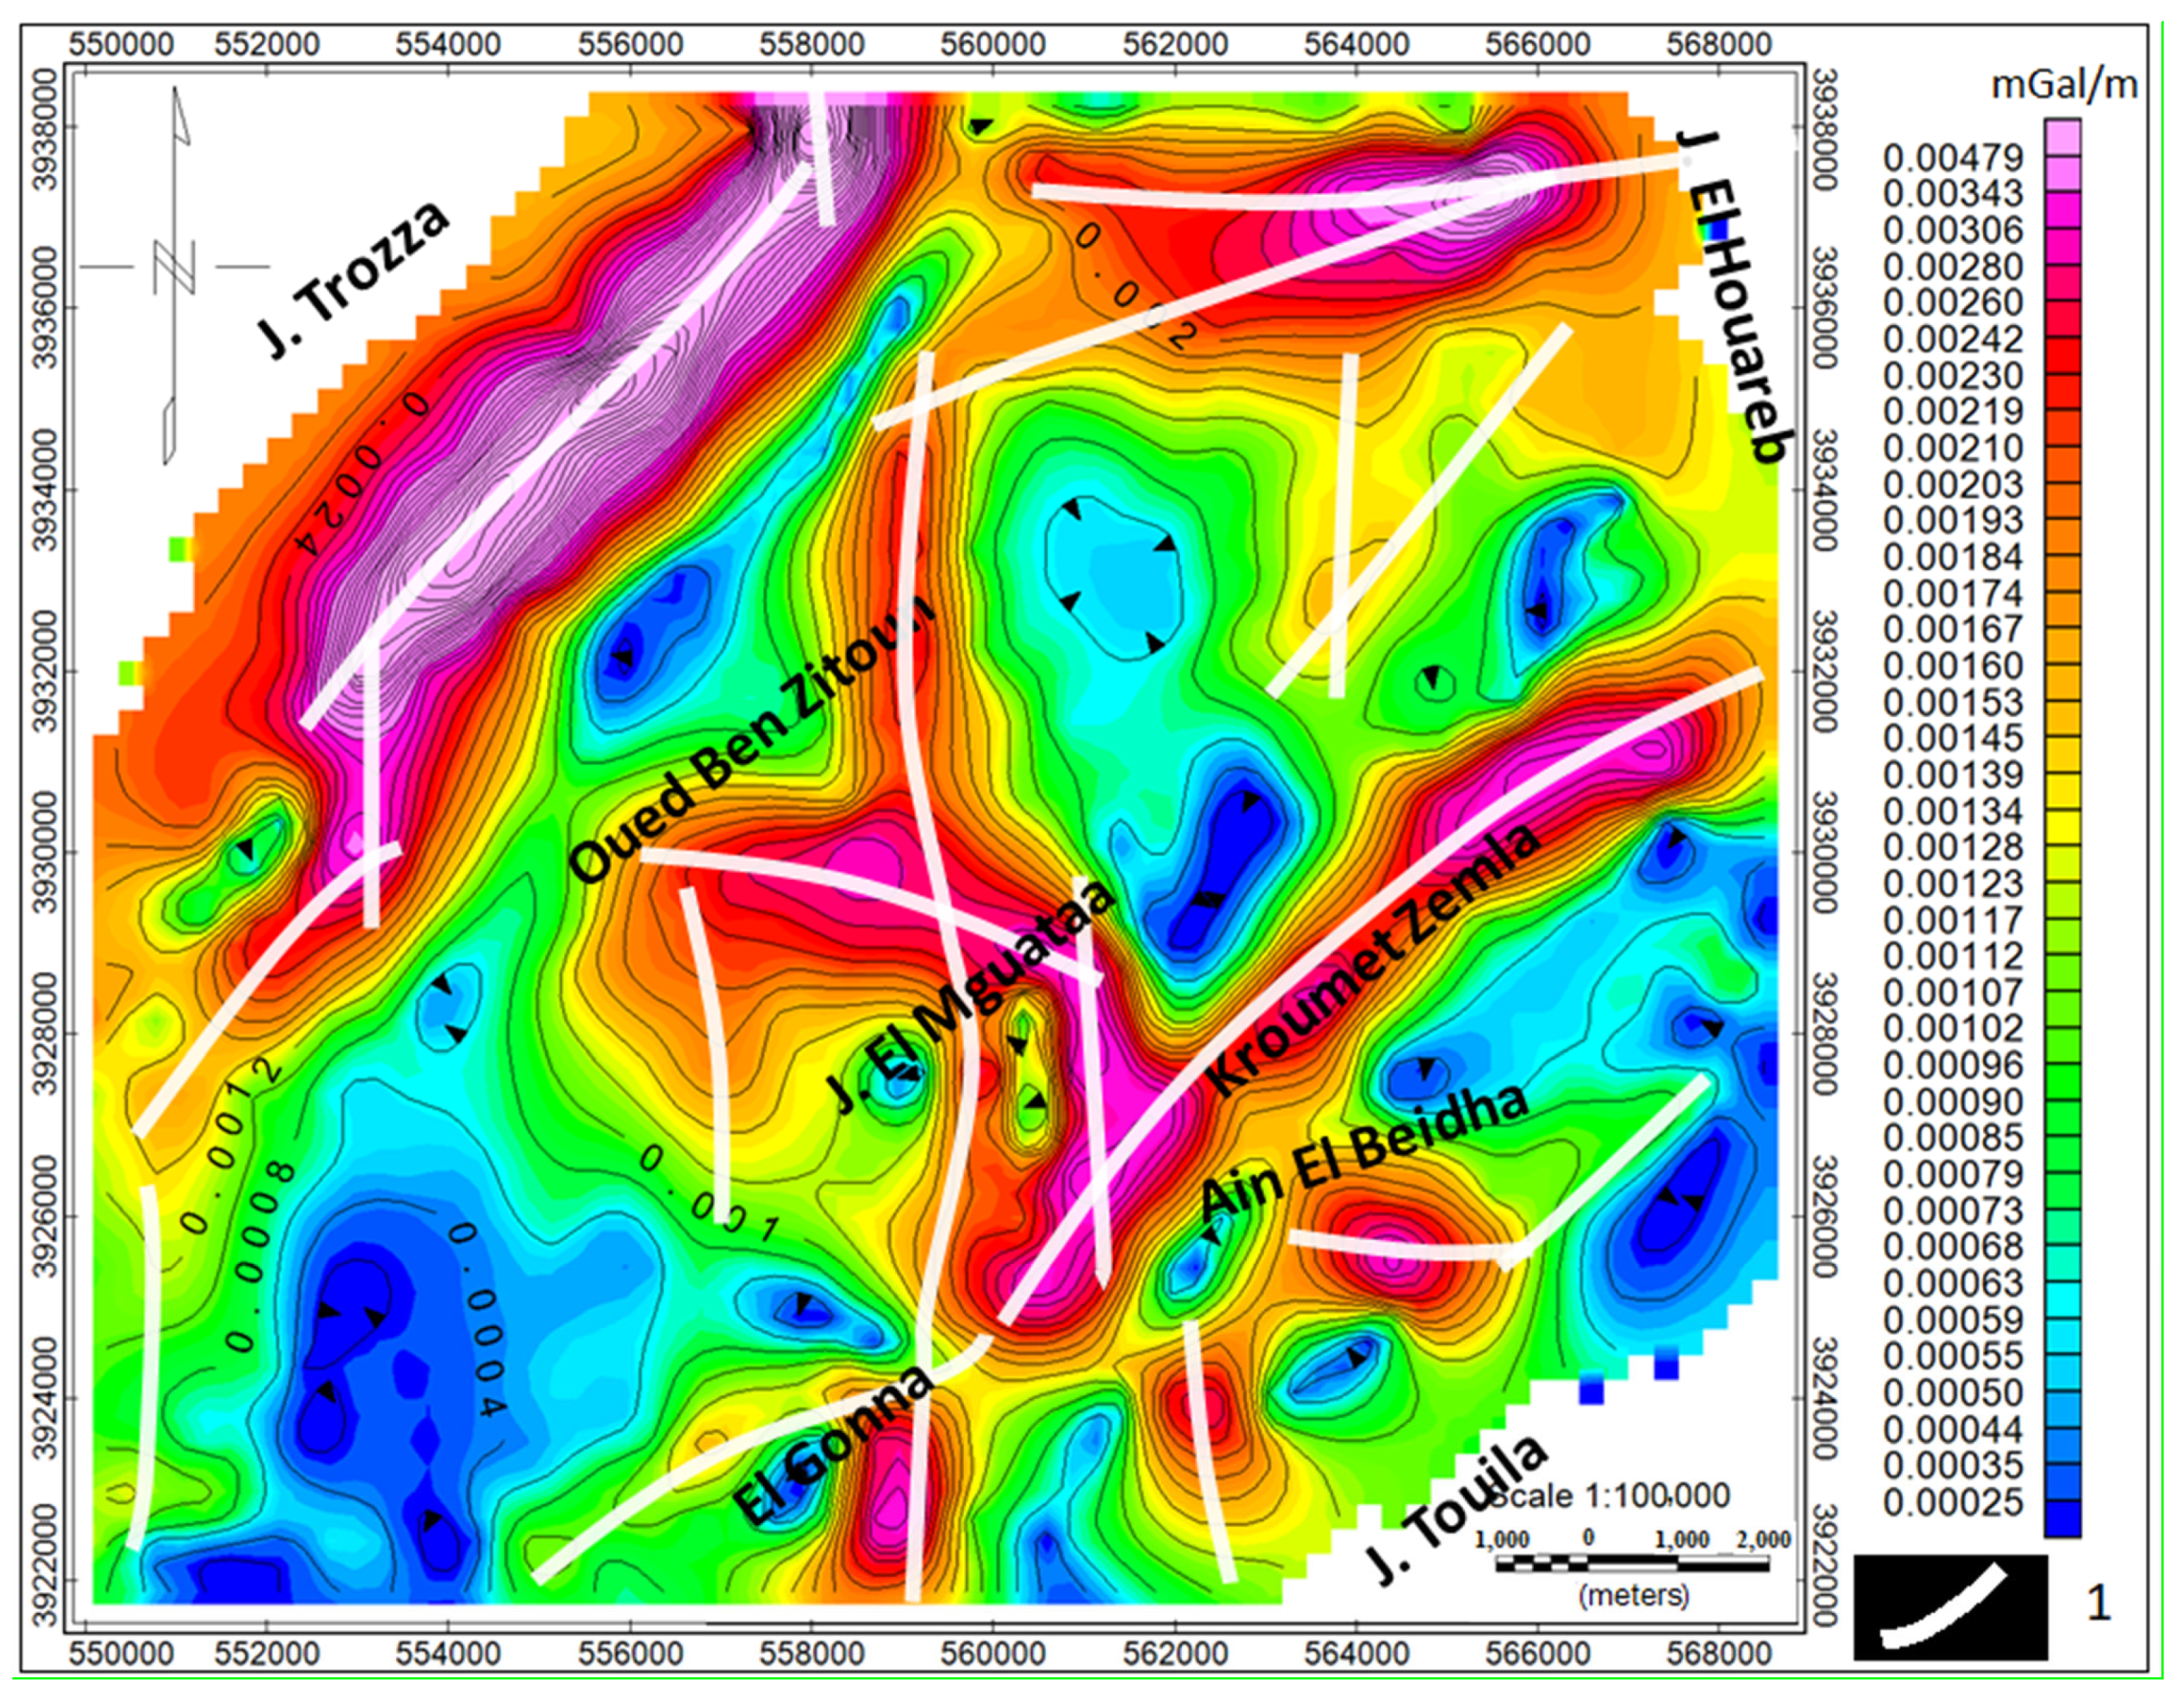
To identify the faulting network and the discontinuities affecting the Ain El Beidha plain appearing as gravity lineament corridors on the residual gravity map, we produced the magnitude of horizonal gravity derivative map [37]. This map highlighted three major elements (Figure 7):
- –
- The presence of a N–S corridor affecting the El Gonna–J. El Mguataa area and representing the western extension of the N–S axis. This trend played an important role in the structuring of the Ain El Beidha plain.
- –
- The existence of a NE–SW fault system along the Kroumet Zemla area and the J. Trozza anticline.
- –
- The occurrence of a relay fault system, mainly between the N–S and NE–SW directions. These districts had guaranteed movement transfer during different tectonic phases.
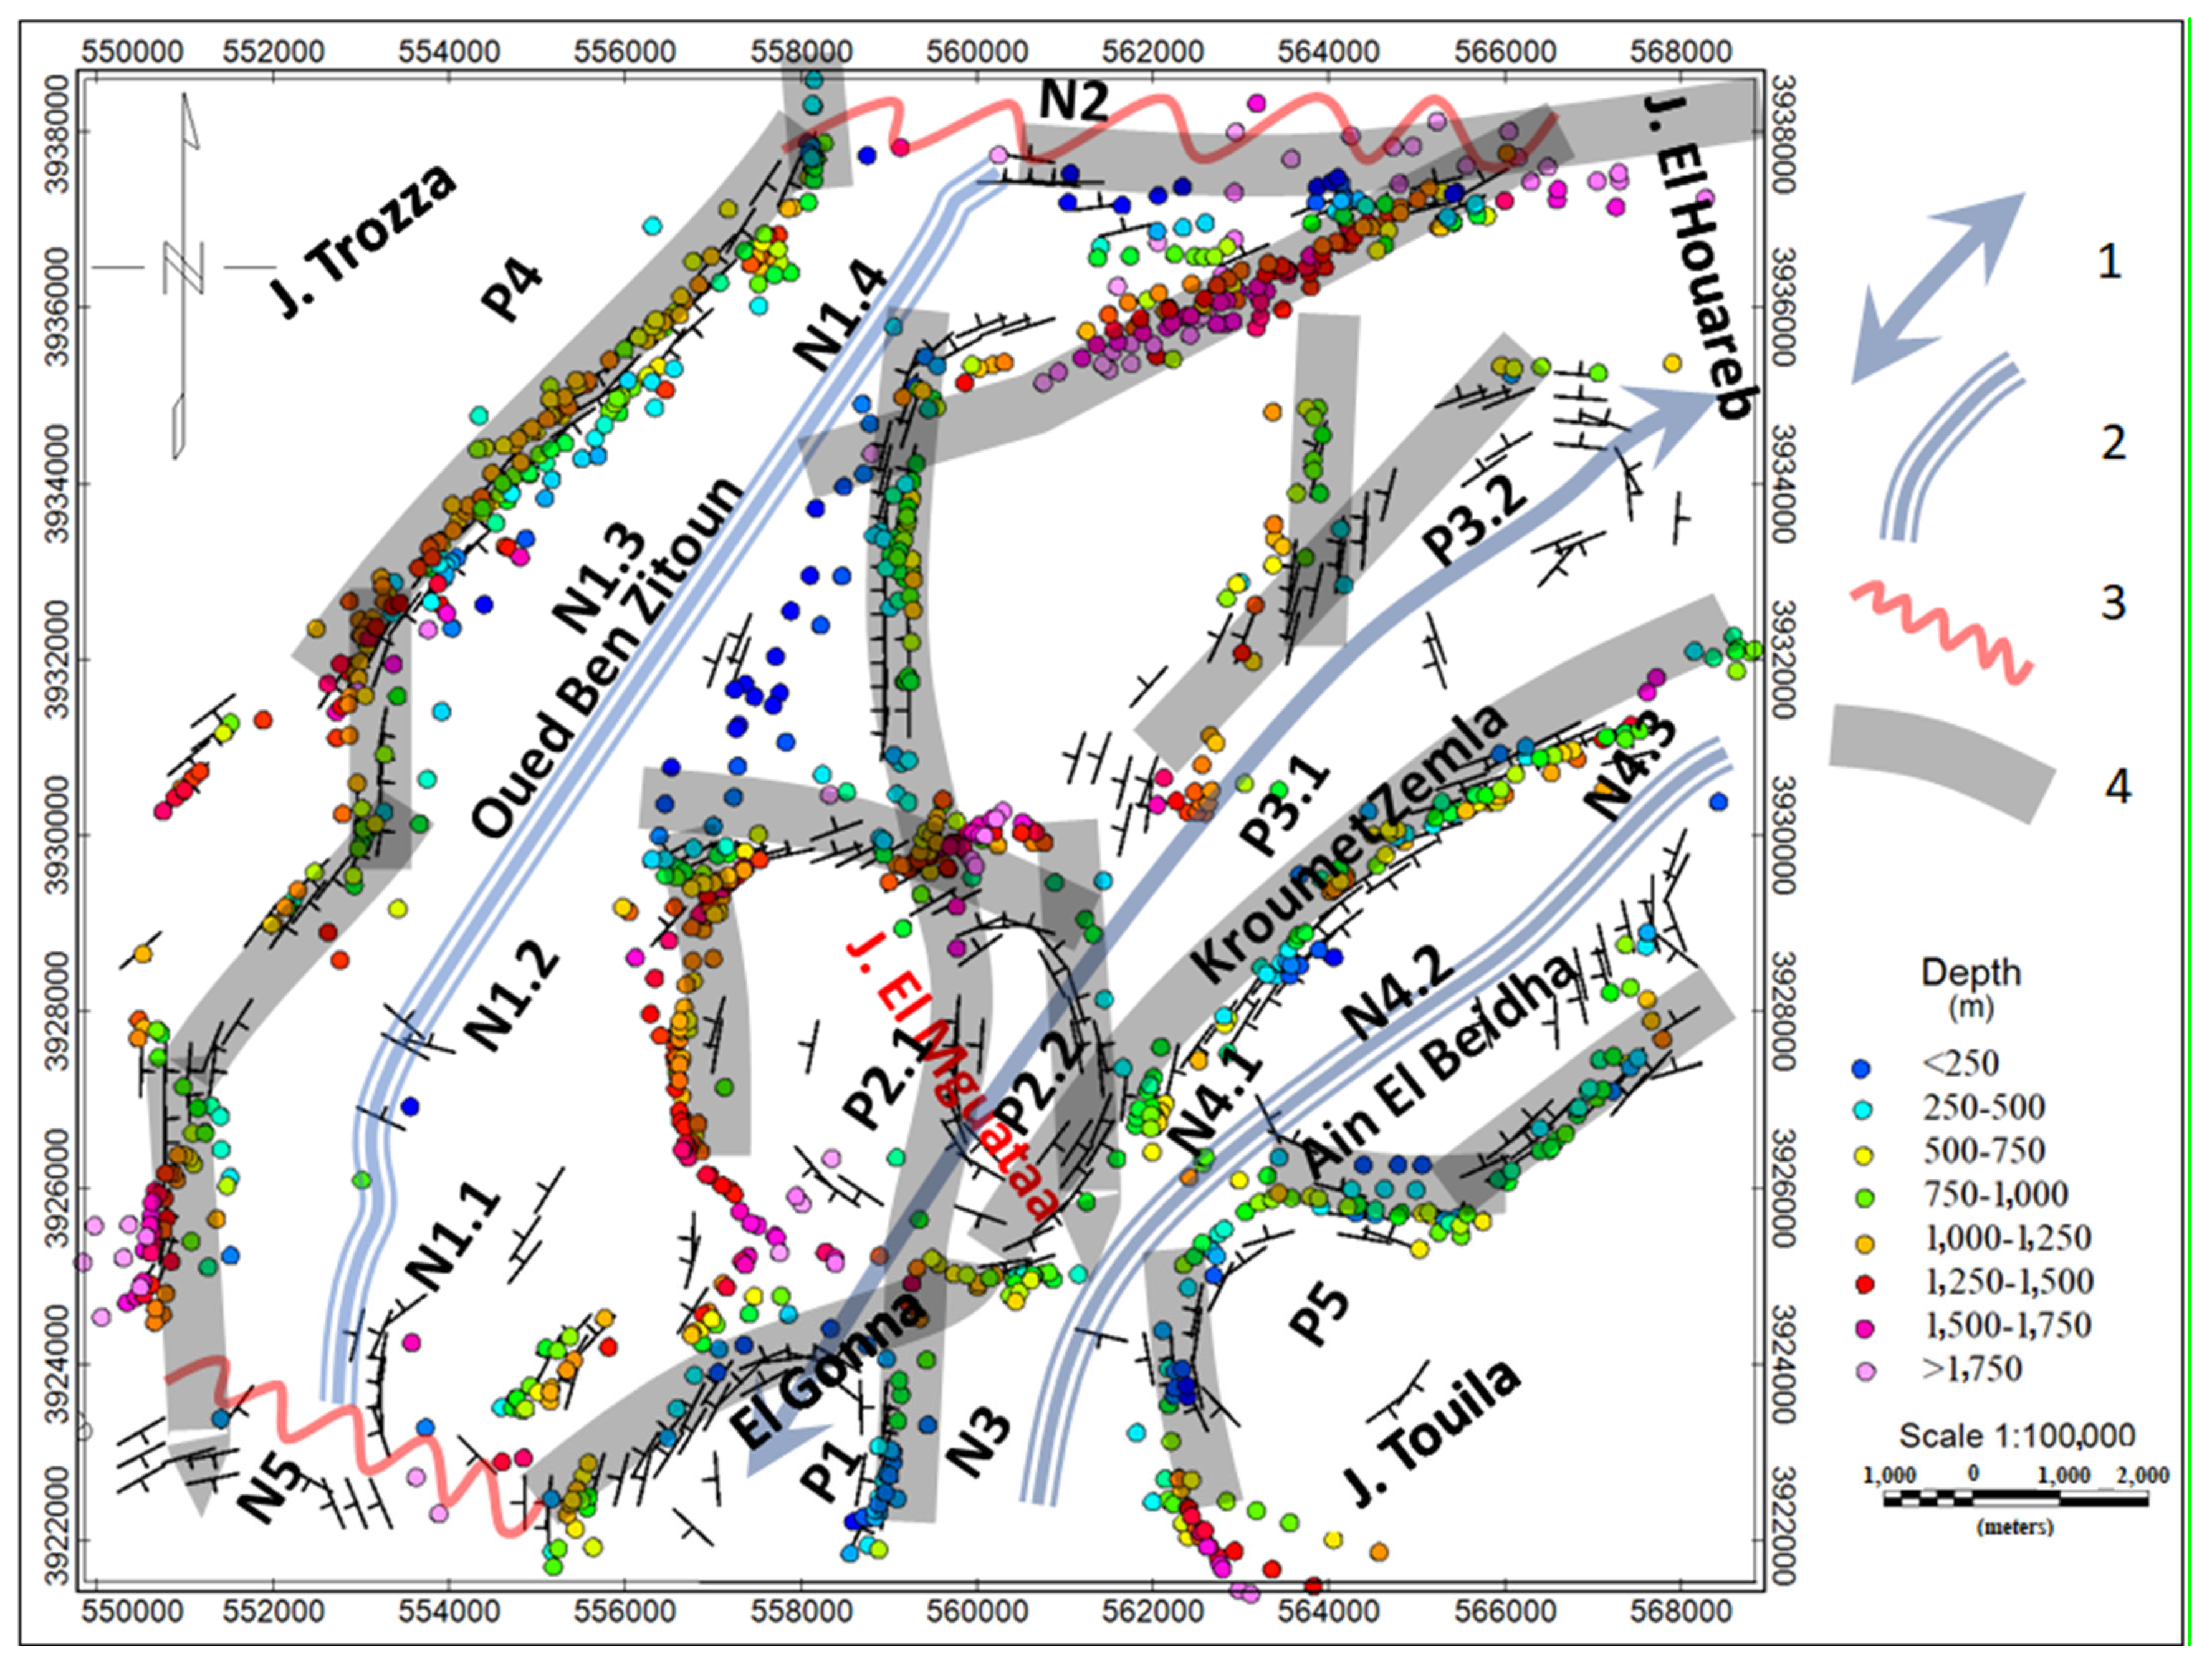
To generate a detailed lineament map, we applied the “source edge detect” or SED filter to the magnitude of horizonal gravity derivative map (Blackely and Simpson, 1986) (Figure 8). We also calculated the Euler deconvolution solutions [38] for the depth to source estimation using a structural index of 0, window size of 10×10, and a maximum percentage of depth tolerance of 15%. The superimposition of the SED lineament map, Euler deconvolution solutions, and previously identified gravity anomaly axis permitted us to define the following (Figure 8):
- –
- A tectonic framework constituted essentially of NE–SW and N–S faults. These faults played an important role in the control of groundwater flow pathways.
- –
- The El Gonna–J. El Mguataa–Kroumet Zemla fold axis represents an example of a N–S and NE–SW relay system. We perceived the same relay system in the western part of the plain (J. Trozza).
- –
- The estimated depth solutions from the Euler deconvolution method vary significantly.
We therefore defined two types of faults:
- (1)
- those which constitute the cover faults affecting the central part of the plain essentially and associated with the Gonna–J. El Mguataa–Kroumet Zemla fold axis, and
- (2)
- those which are fairly deep (more than 1750 m depth), affecting the eastern (N–S axis) and western (J. Trozza) plain borders.
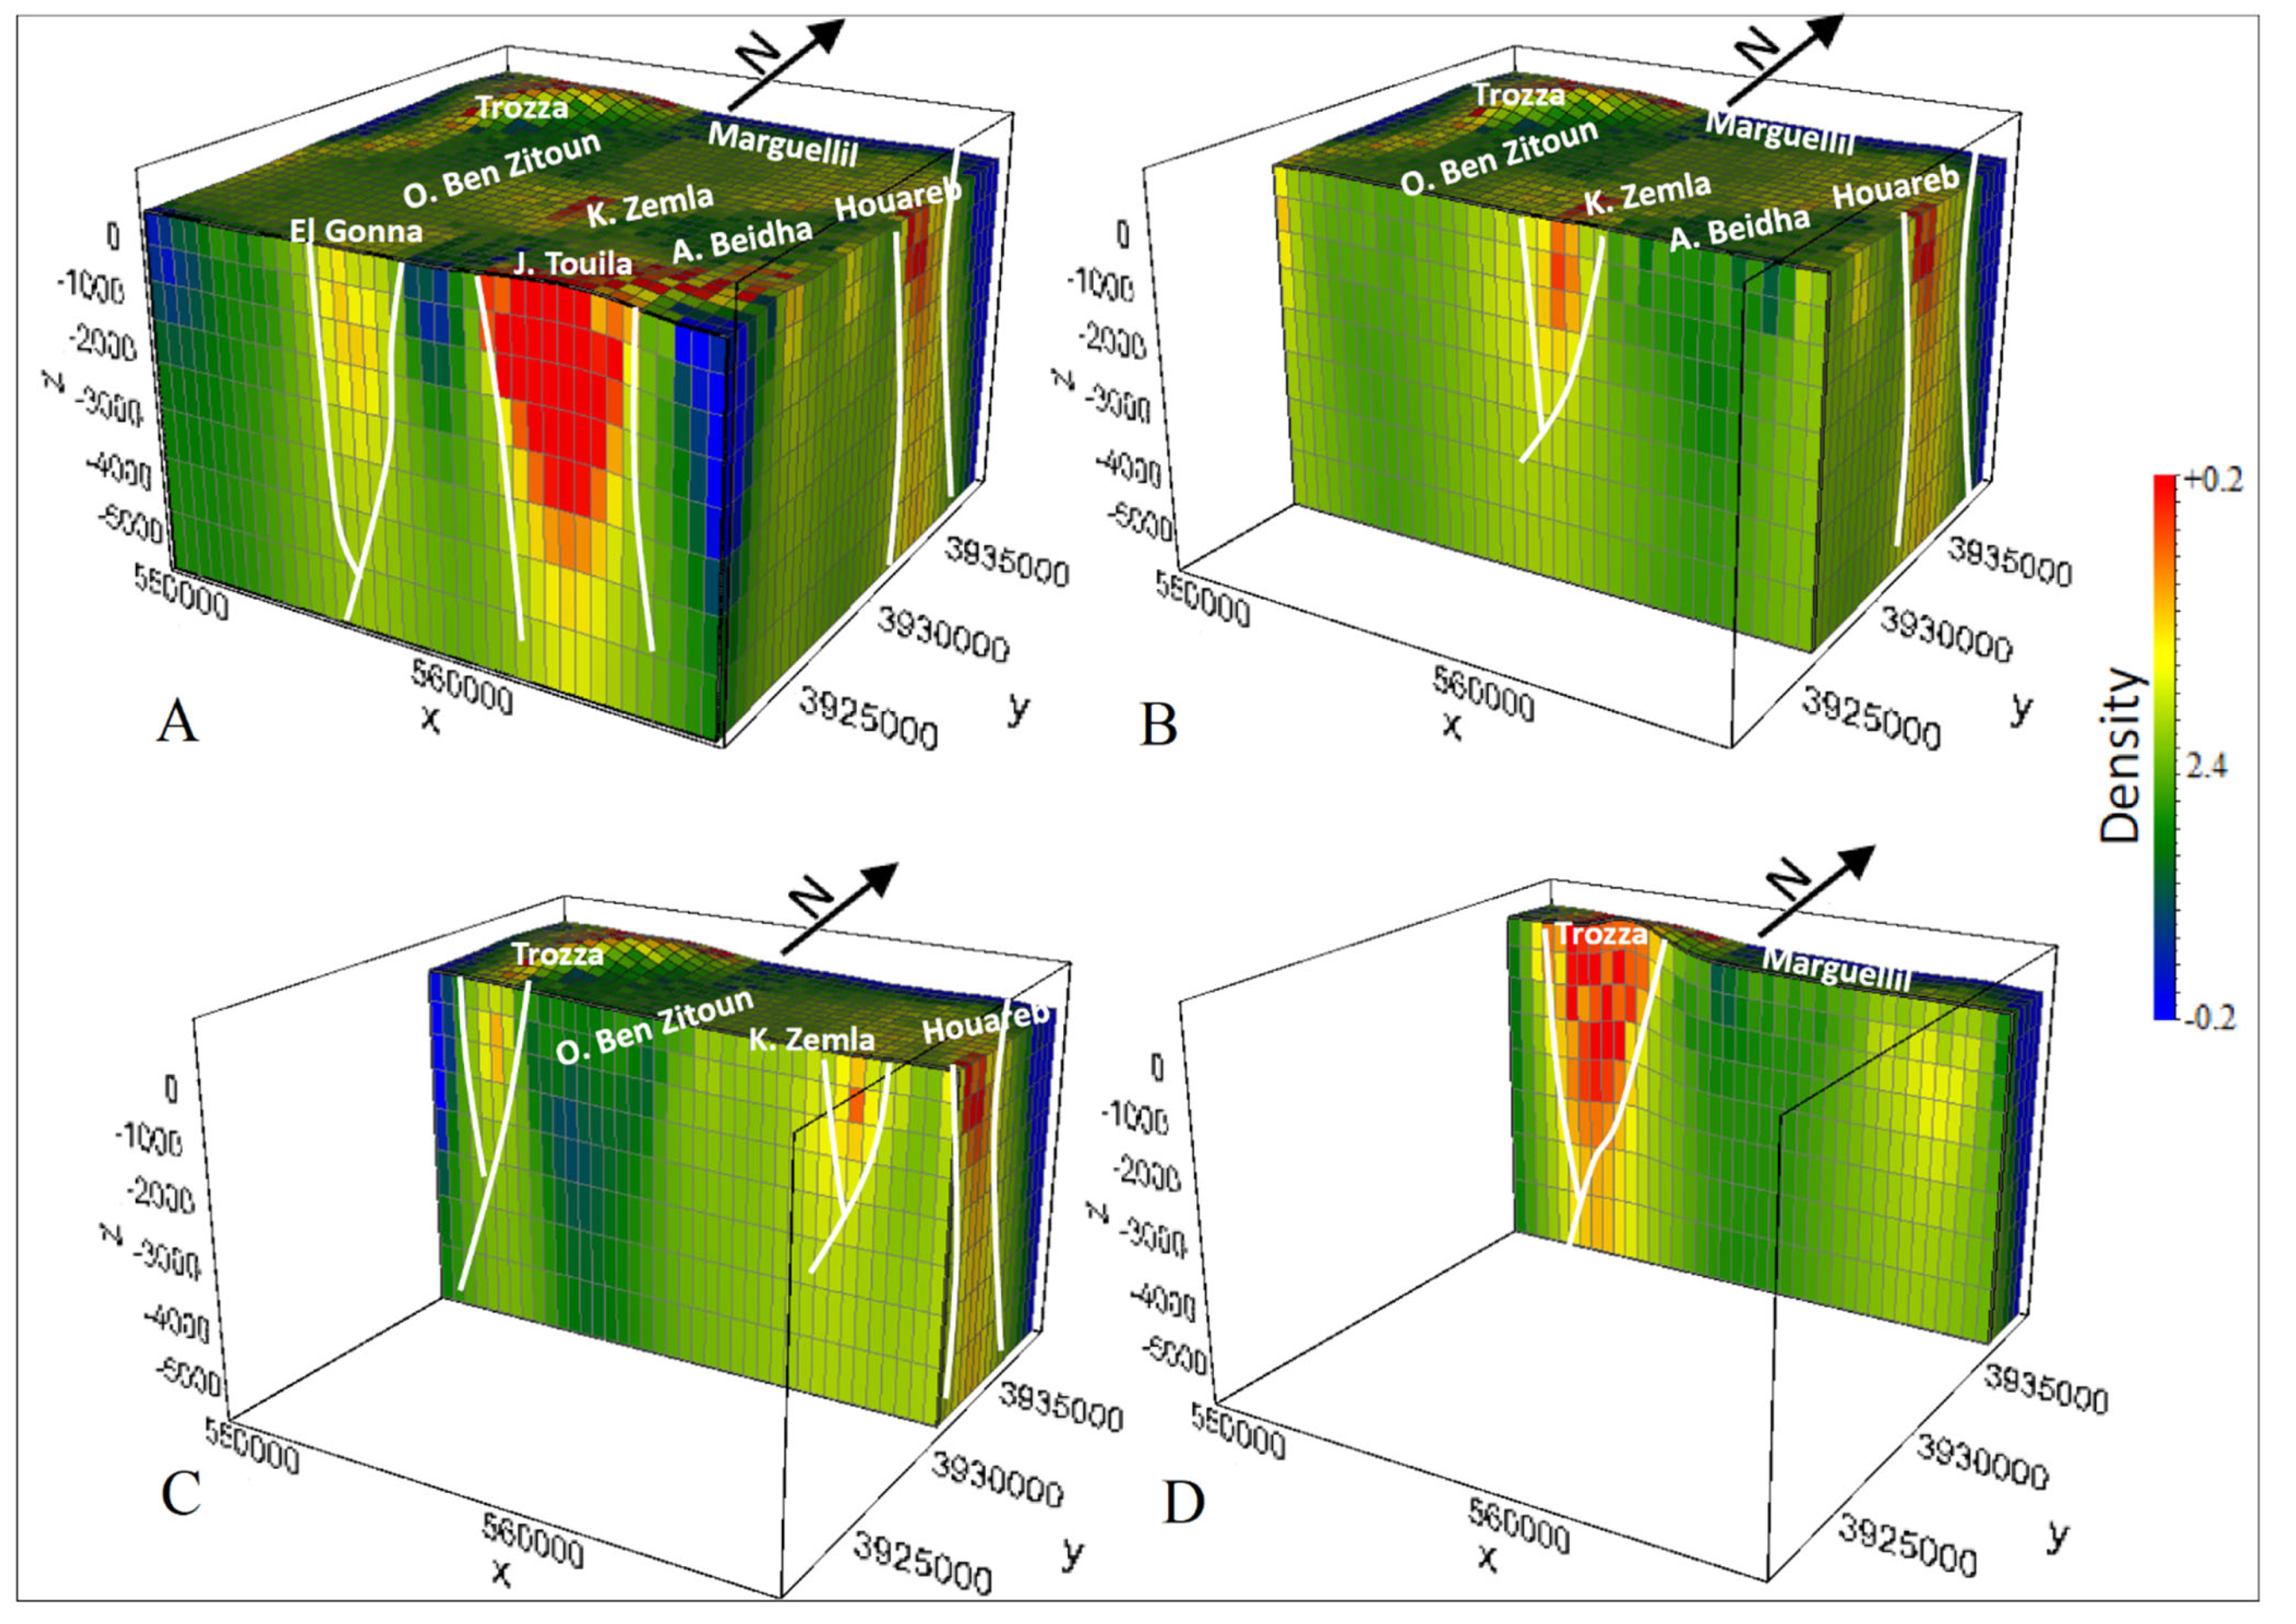
To better define the deep architecture of the Ain El Beidha plain, we chose to generate a 3D density model (Figure 9) by inversing the residual gravity anomalies using a 3D module. The uploaded data had been previously prepared to include the tomographic variations and define the 3D mesh constructor window. The inversion model was generated using a smoothness constrained inversion method, with 10 iterations, 2.4 as a background density, and an RMS error over 1%.
The 3D density inversion model using the lateral cutting plane (Figure 9) was in concordance with previous deductions. Inheritance of N–S axis faults (J. Touila, J. Houareb) and the NE–SW J. Trozza fault were identified. The Kroumet Zemla fault system represents an example of the thin–skinned tectonic associated with the Tertiary folding phase. This 3D model is in favor of a superimposition of two tectonic styles: thin– and thick–skinned tectonic styles.
6. Seismic Data Analysis
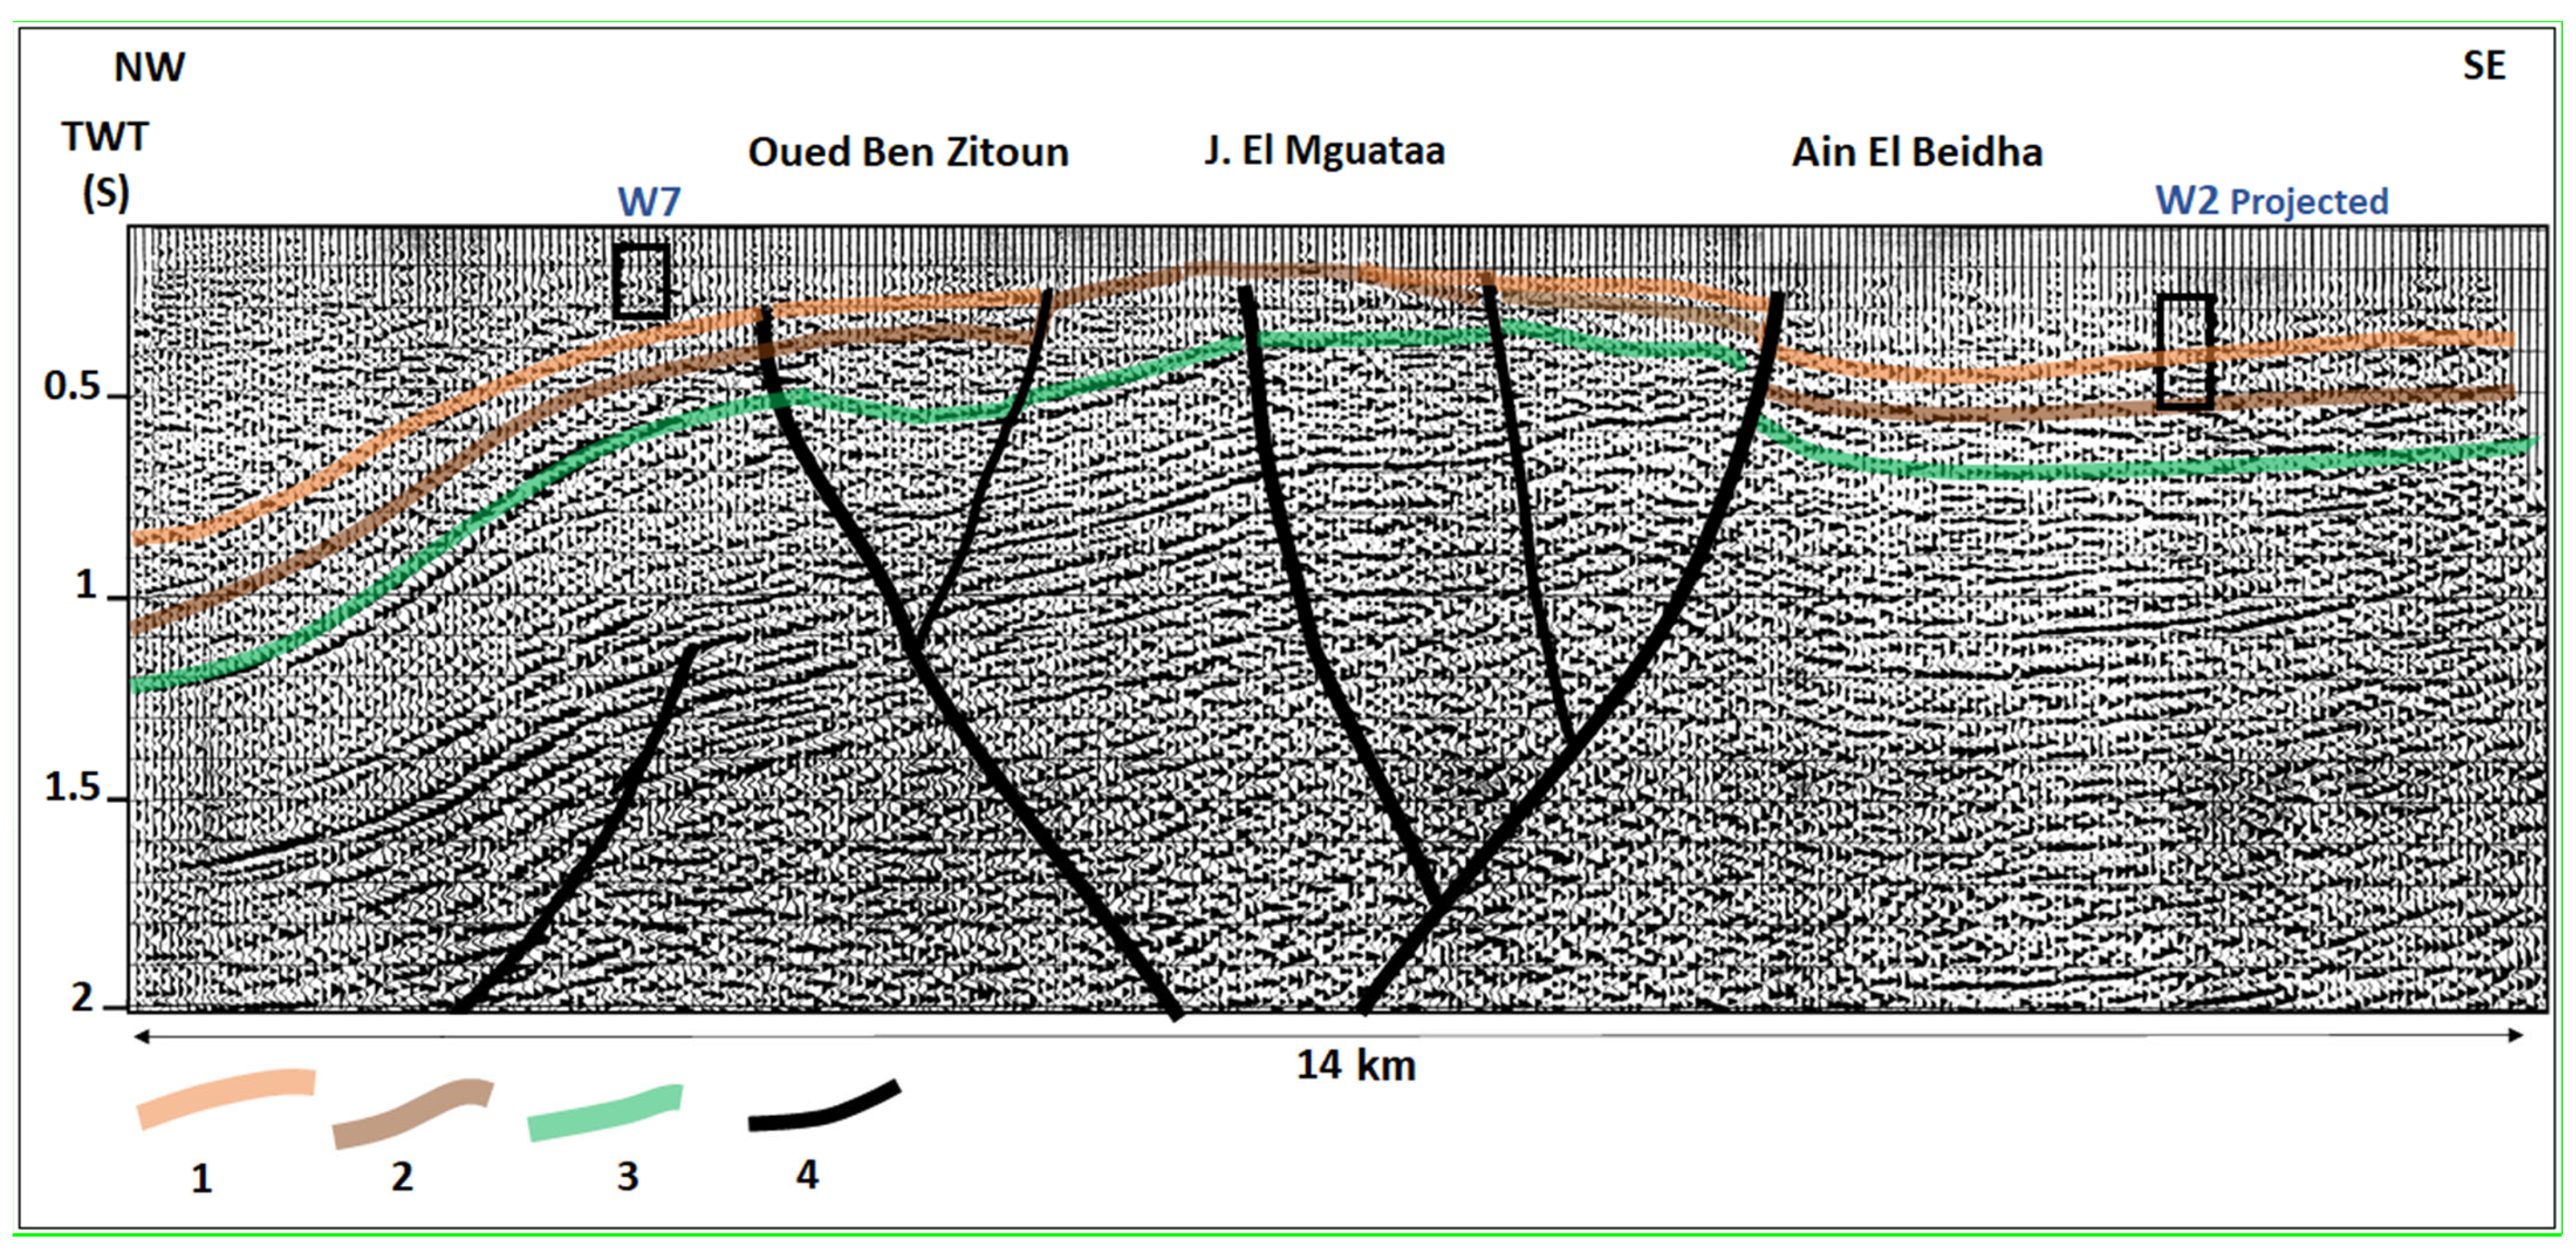
Seismic data sets were calibrated and interpreted using existing boreholes and outcrop geological information. NW–SE seismic profile L1 was calibrated to the W7 and W2 wells and the J. El Mguataa–Kroumet Zemla outcrops (Figure 1A).
The deep structure revealed by this profile (Figure 10) was in perfect agreement with previous gravity analysis results.
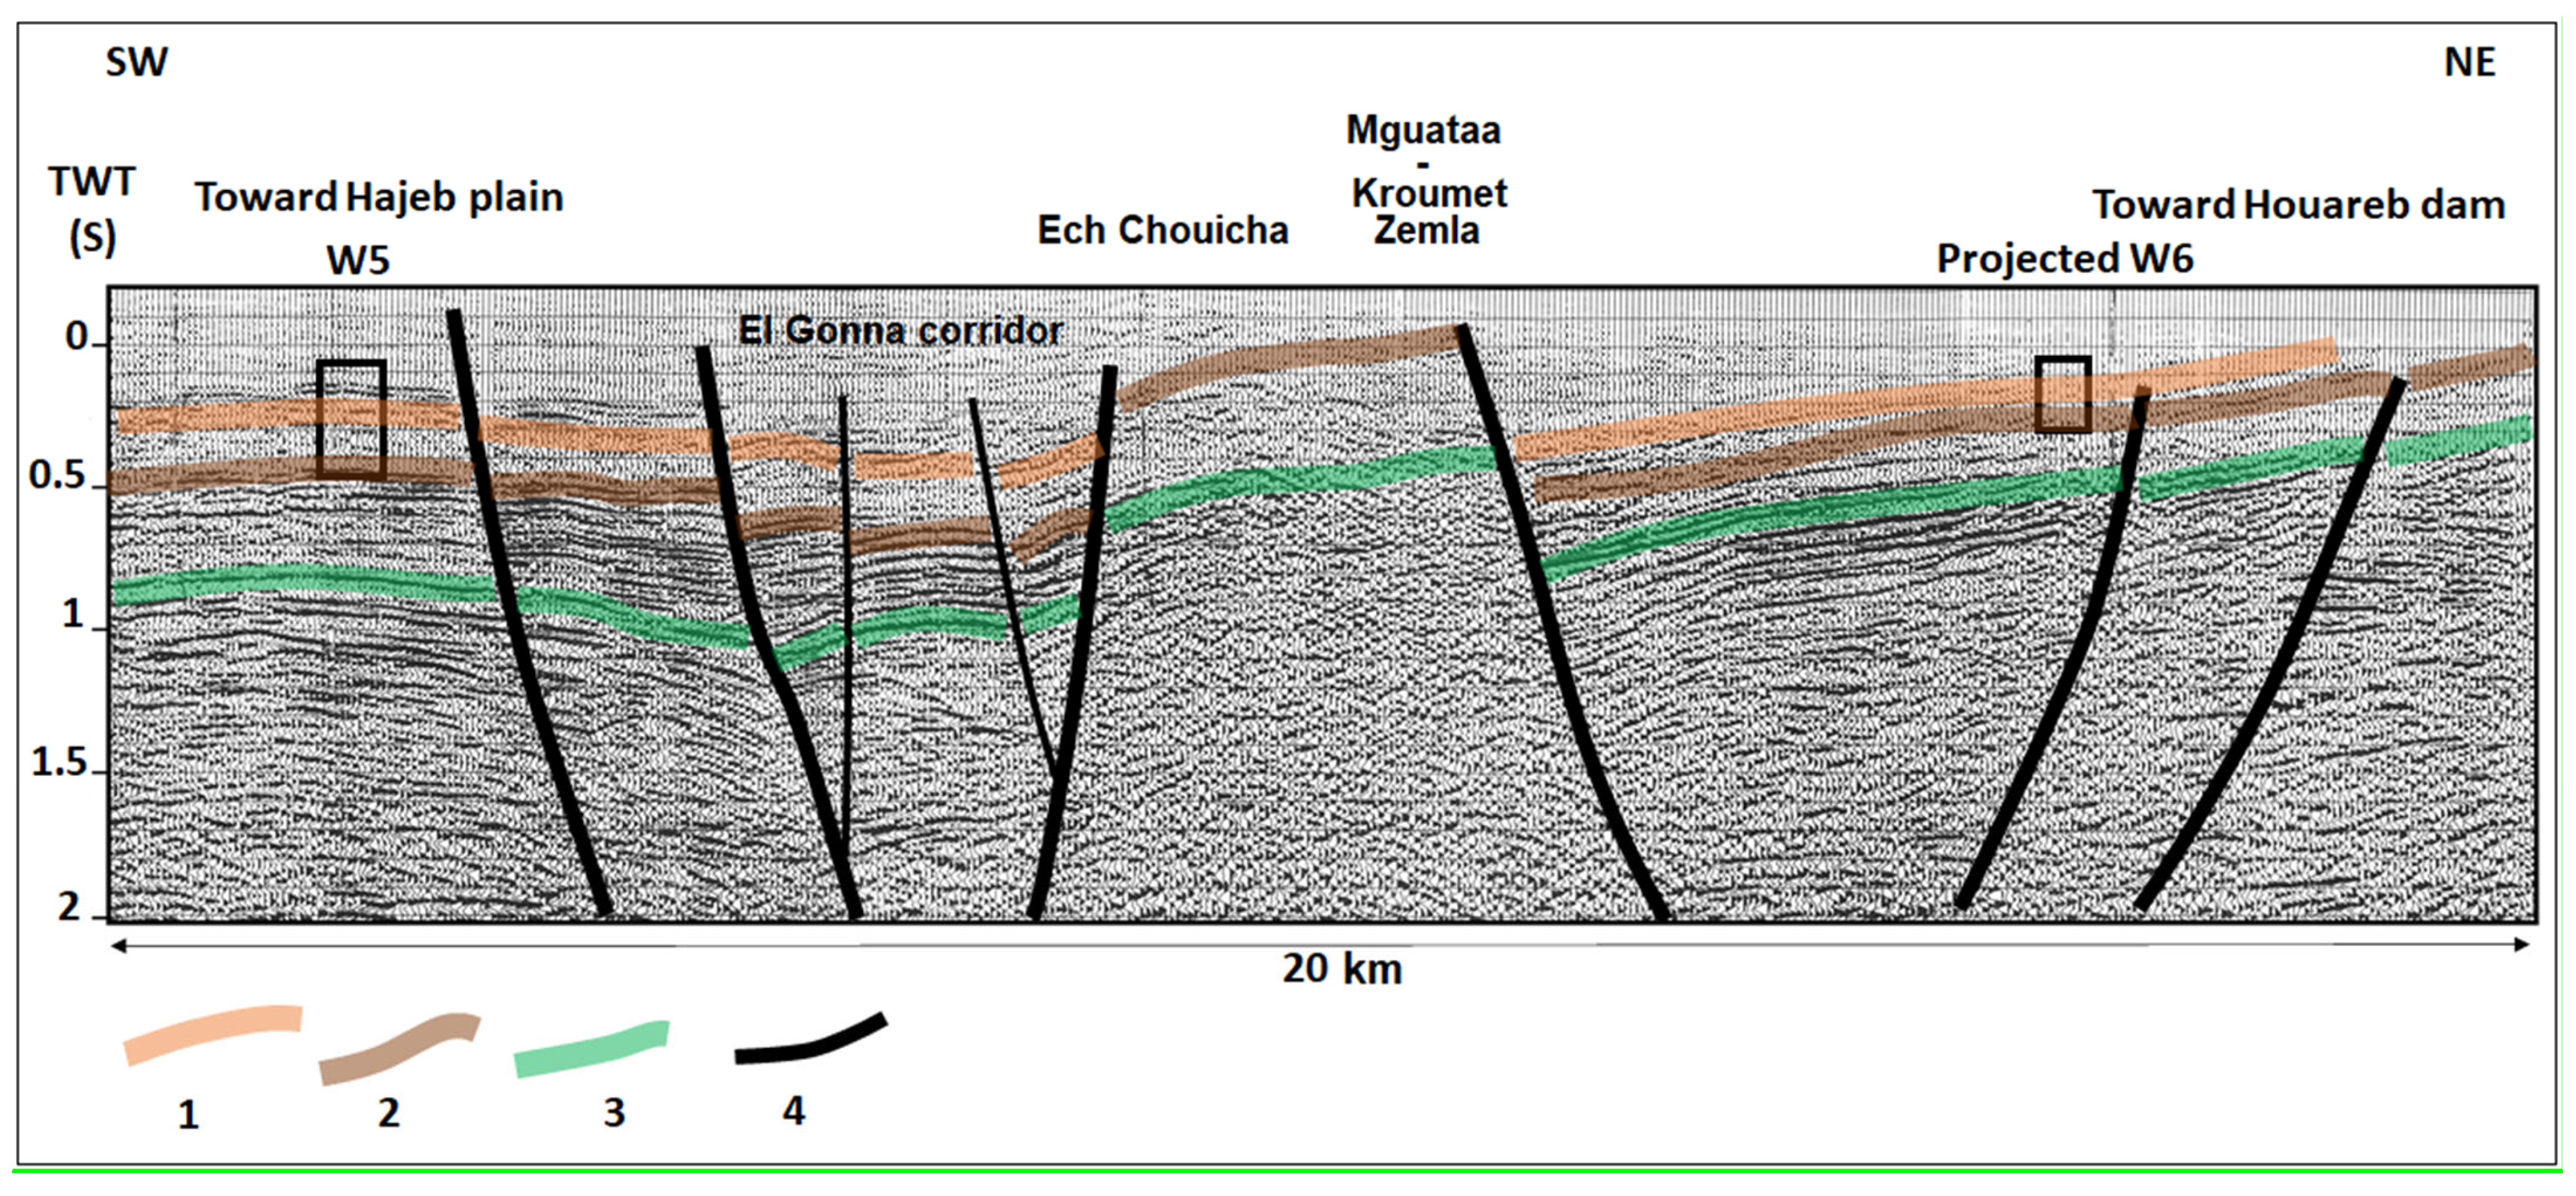
The El Gonna–J. El Mguataa–Kroumet Zemla fold axis is associated with a faulting corridor and a thrust structure to the SE (Figure 10). The Oued Ben Zitoun and Ain El Beidha basins represent the hanging wall and the footwall of this fault corridor, respectively. The Oued Ben Zitoun hanging wall area, to the NW, is more strongly subsiding than the Ain El Beidha basin in the eastern part of the plain. Tertiary and Quaternary seismic horizons show an important deepening to the NW, and the seismic sequences show significant thickening. This subsidence is also attested to by the thick Mio–Plio–Quaternary deposits, recognized in hydrogeological boreholes (Figure 3). NE–SW seismic profile L2 (Figure 1A) was calibrated to the W5 and W6 wells and the J. El Mguataa–Kroumet Zemla outcrops (Figure 11). On this profile, a second tectonic style related to the raised and collapsed blocks could also be seen (Figure 3).
The L2 seismic line shows in its center the N–S faulting that was highlighted by gravity analysis. This line exposes the uplifting of the Mguataa–Kroumet Zemla structure. It also confirms that the higher block extends to the SW in the Ech Chouicha area. Eocene and Oligocene–Aquitanian reservoirs outcrop in this block. To the SW, only two meters of soil cover the Oligocene deposits in the Ech Chouicha area, which constitutes a good recharge zone for these aquifers. To the SW of the Ain El Beidha plain, the seismic analysis shows that the Eocene and Oligocene–Aquitanian horizons are affected by the NW–SE normal fault corridor that we called the El Gonna corridor (Figure 11). This fault corridor has not been previously described prior to this work and is responsible for collapsing the Cretaceous and Tertiary sedimentary deposit horizons. Furthermore, we distinguished the first and second order faulting network implicated in the recharge process of deep aquifers.
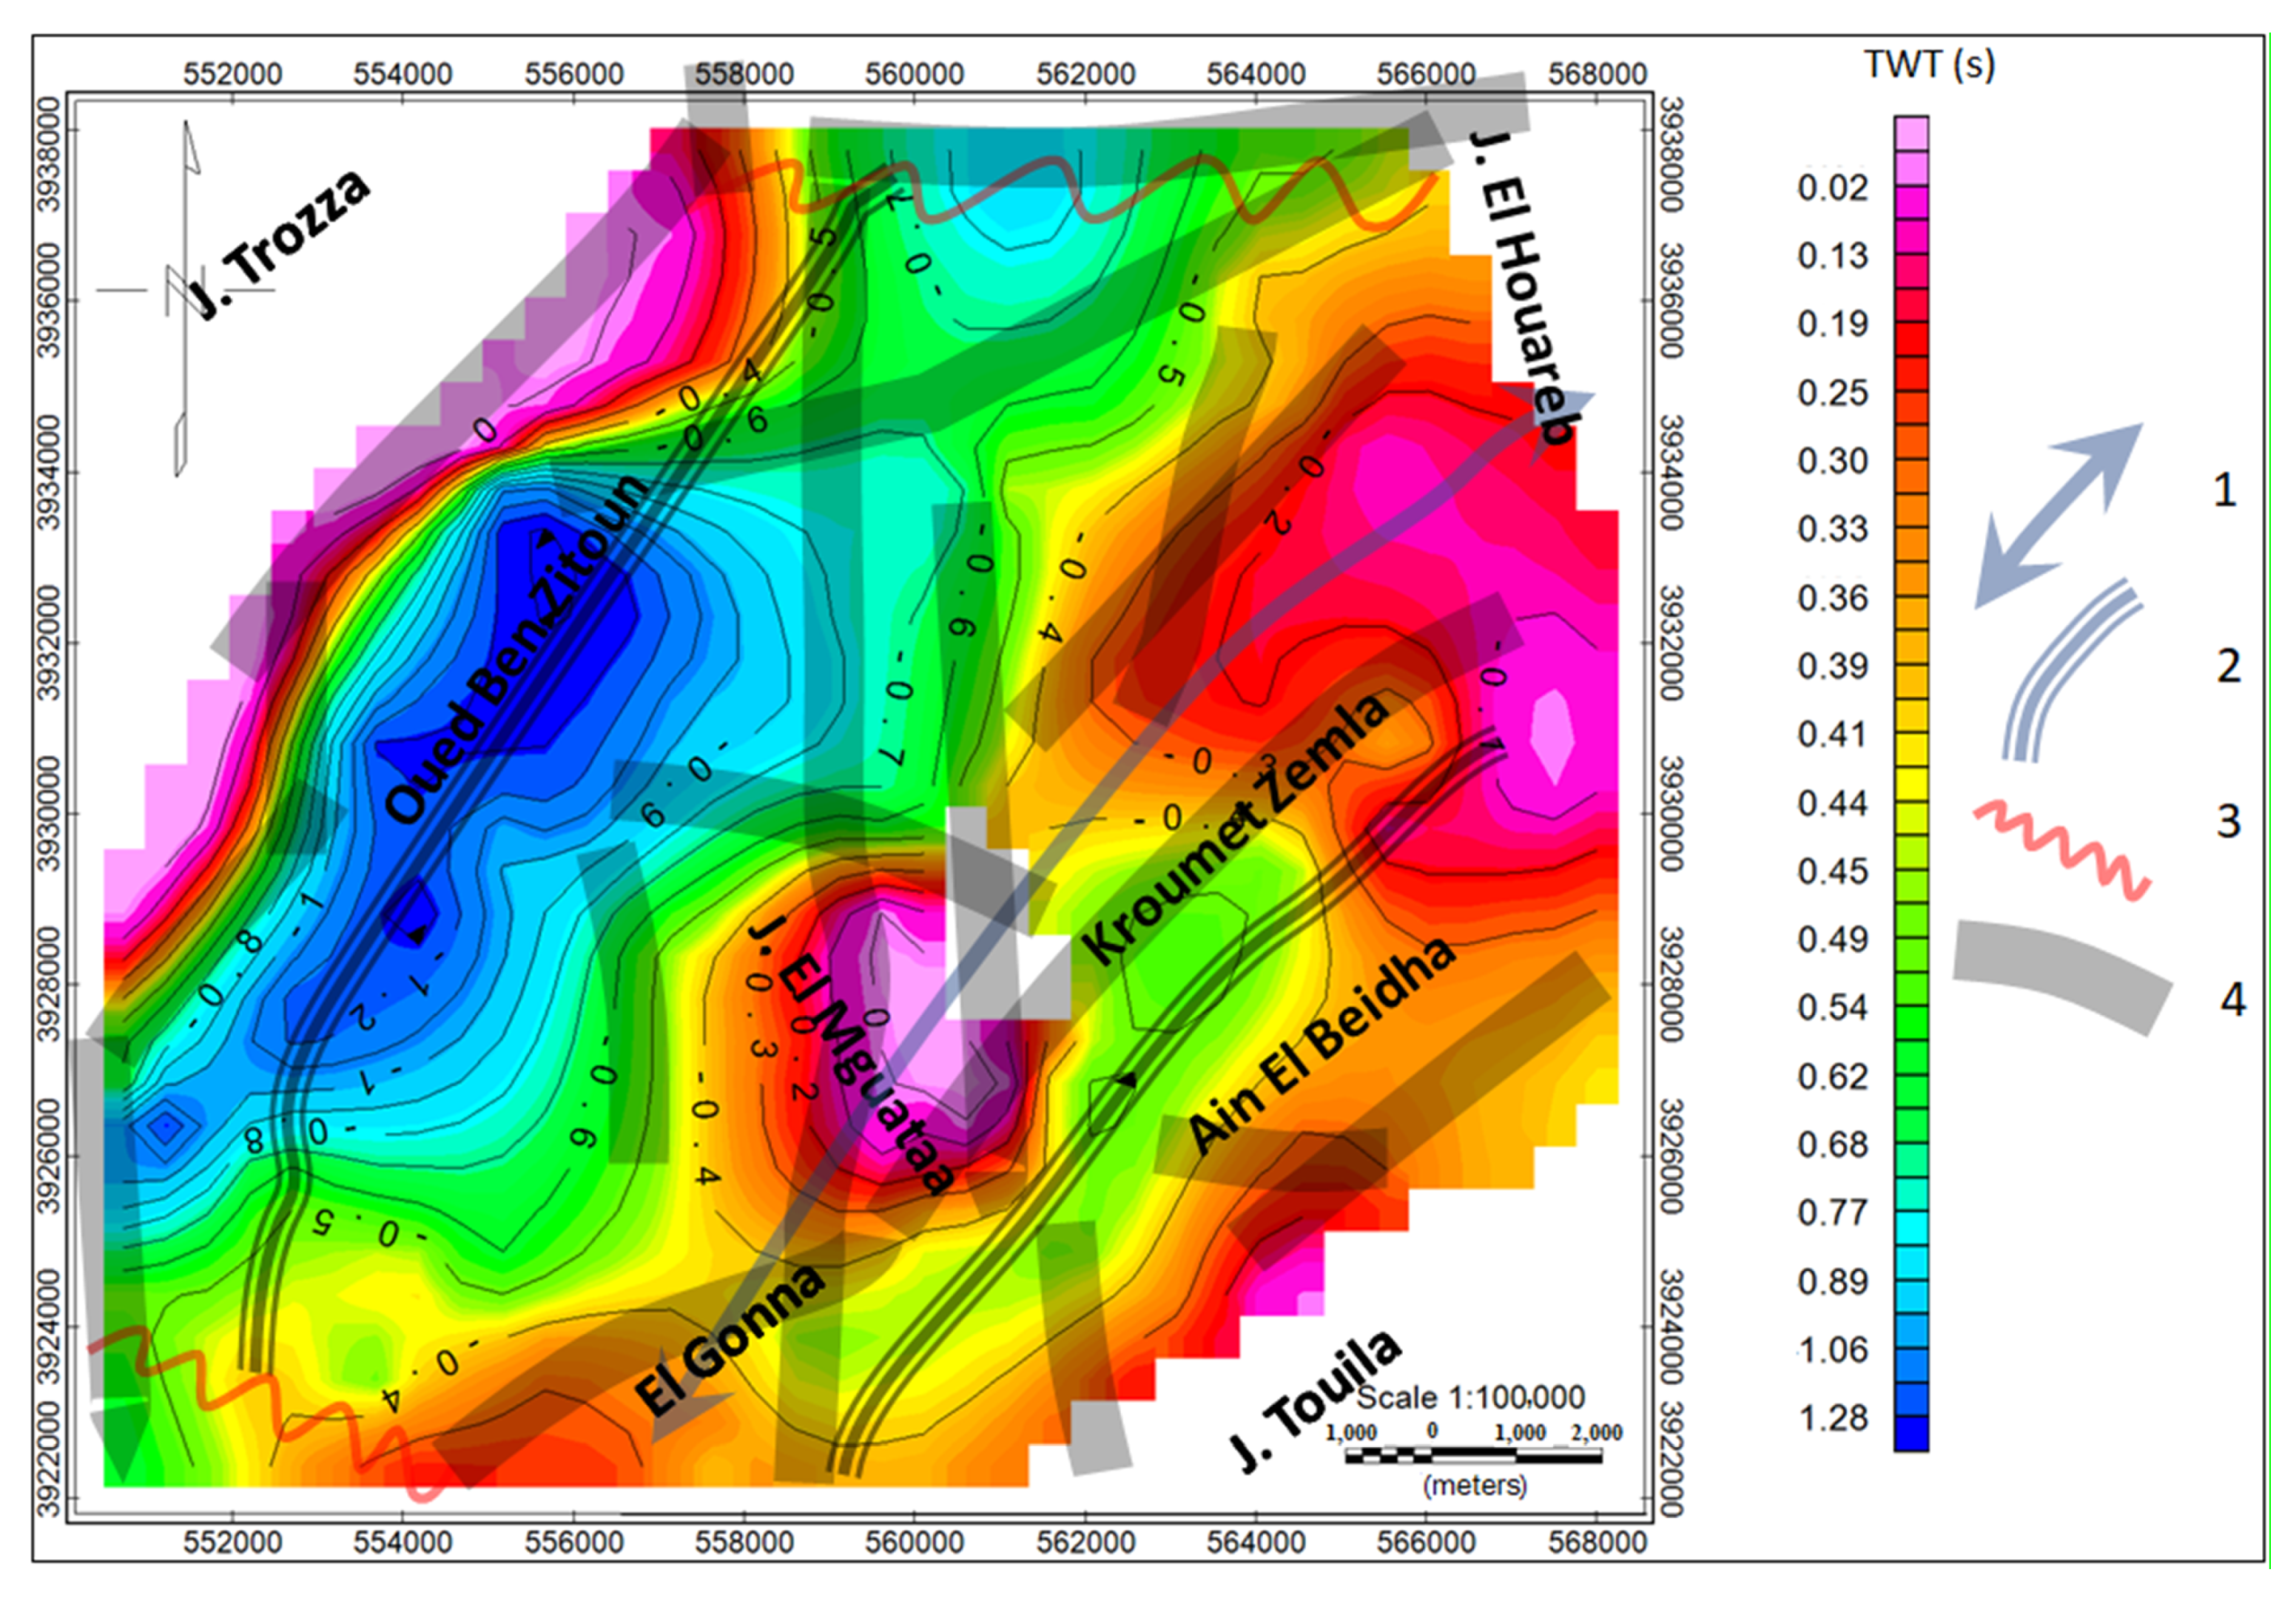
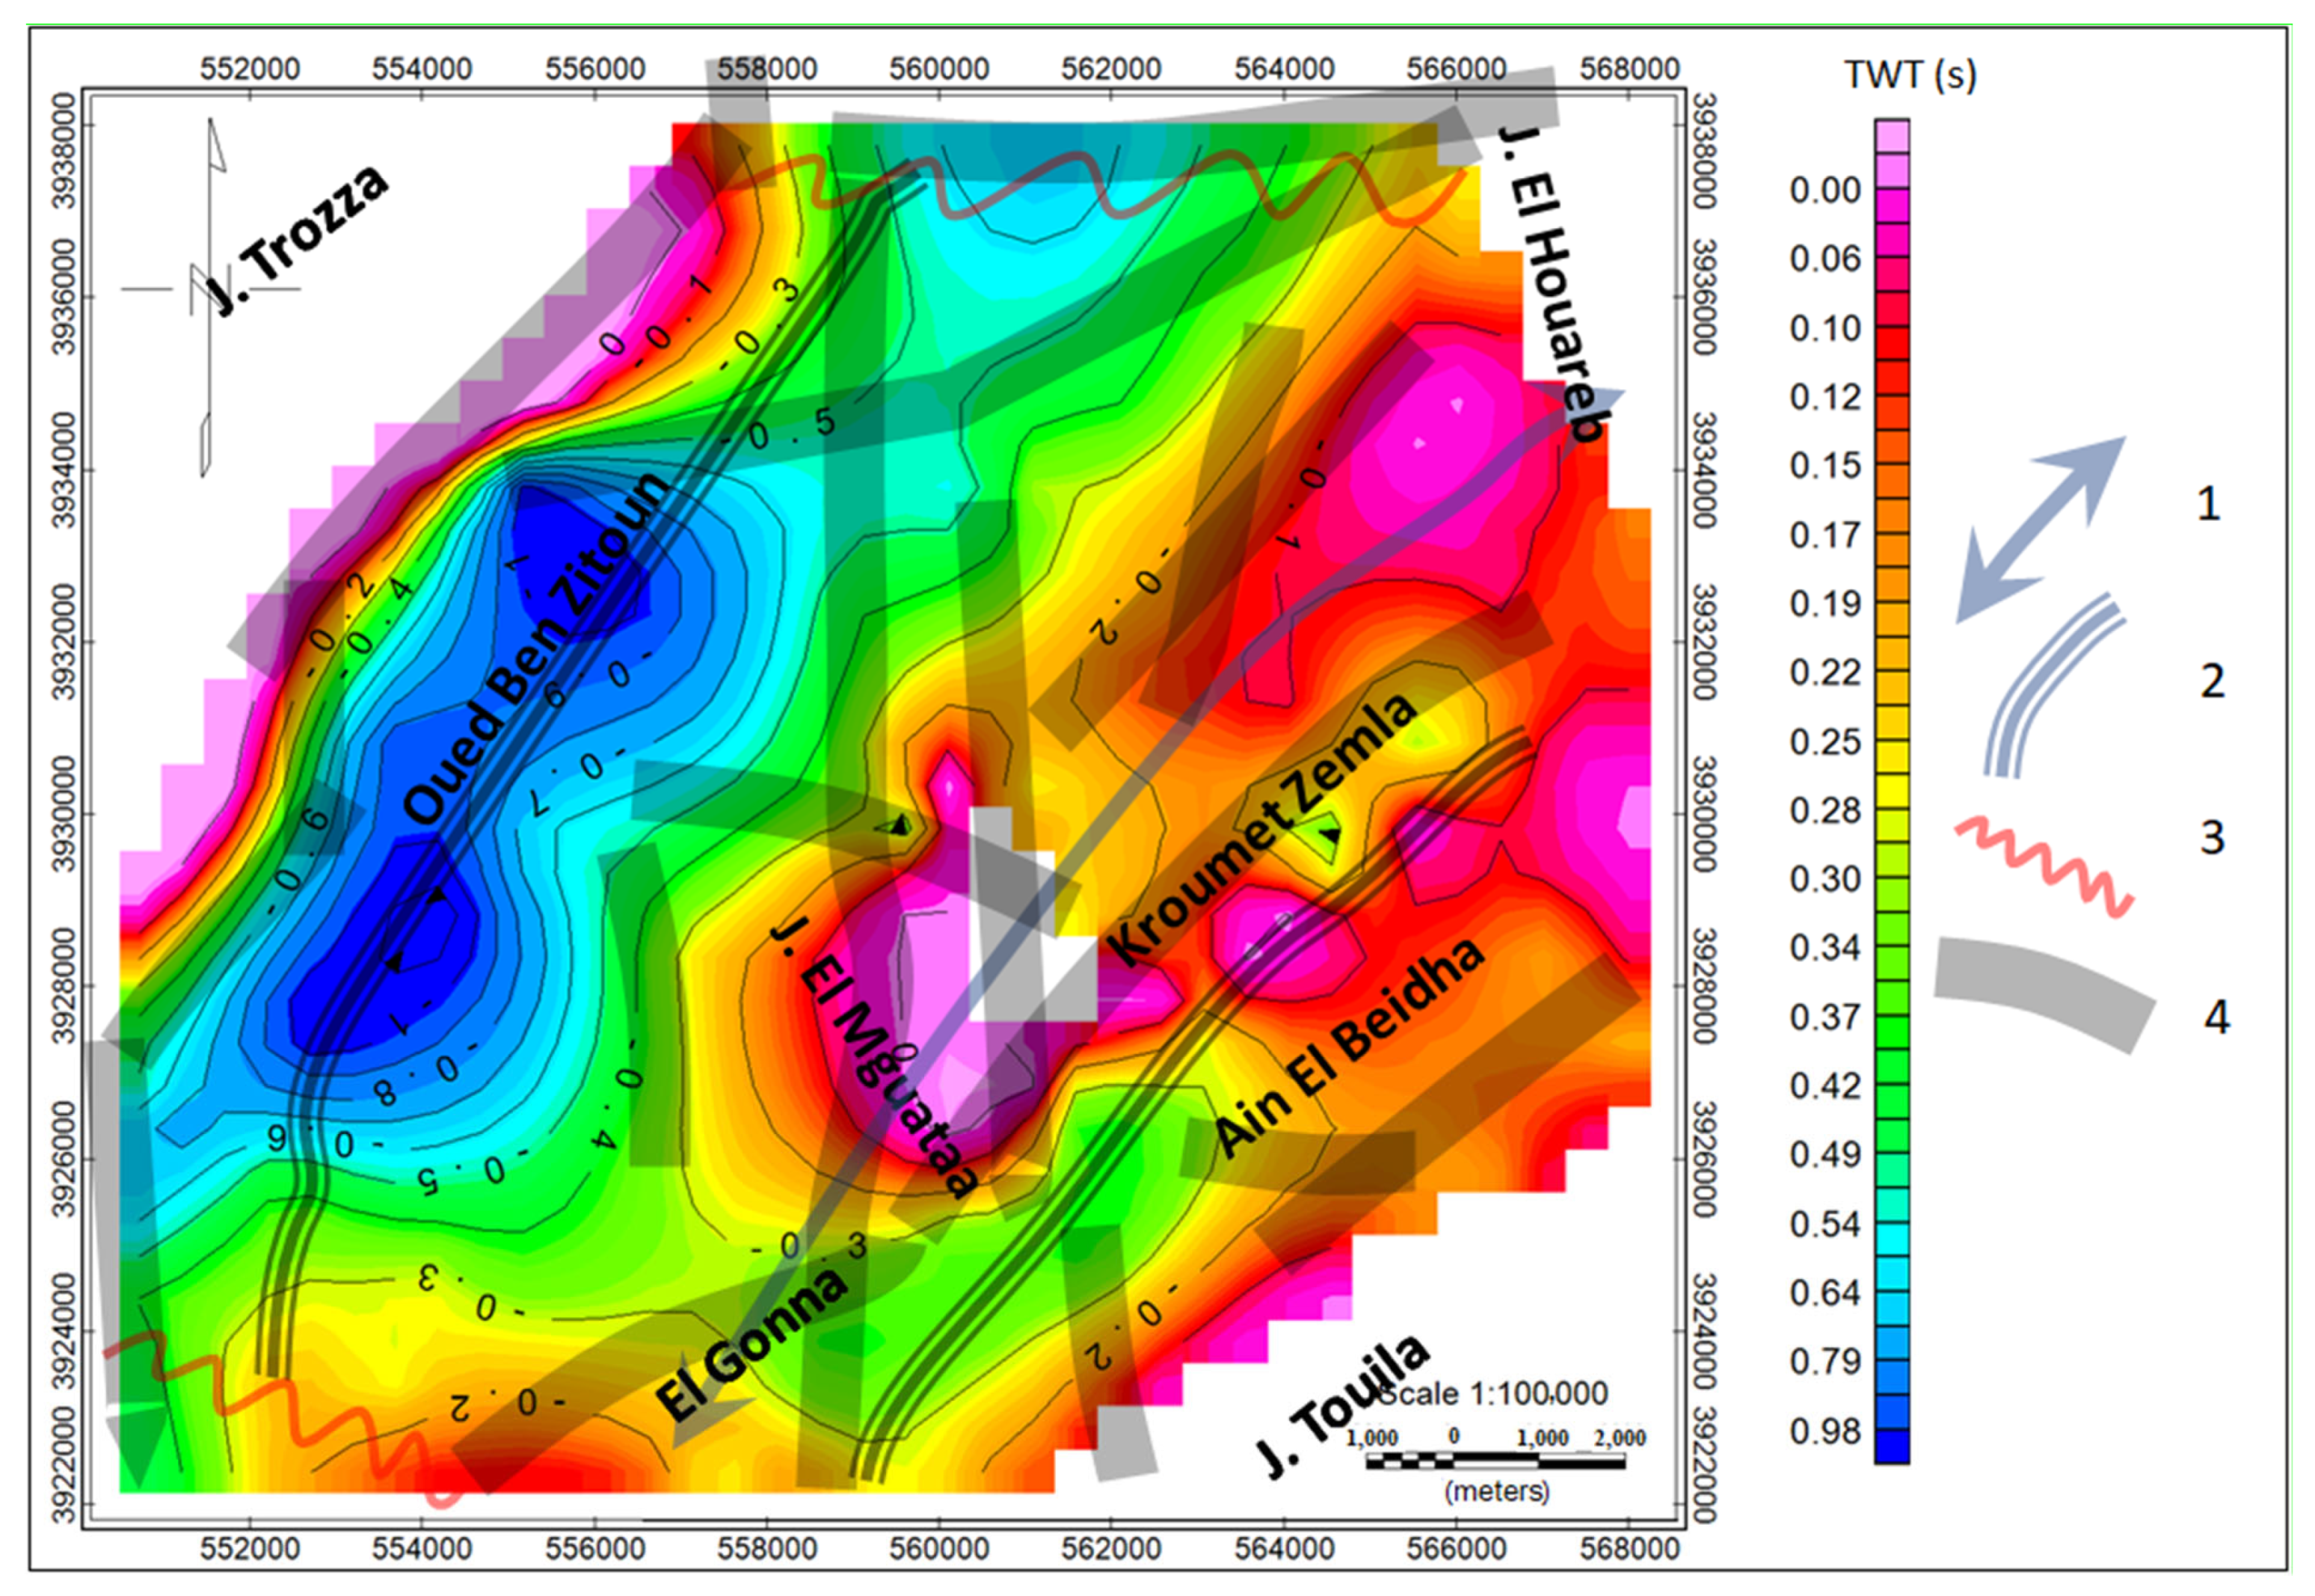
Isochron maps of the Oligocene and Eocene tops (Figure 12 and Figure 13) presume that the sources of previously analyzed gravity anomalies were caused by a structural framework characterizing the Ain El Beidha plain. As suggested by the above gravity analysis, isochron maps precisely and accurately revealed the boundaries and shapes of the Oued Ben Zitoun and Ain El Beidha basins containing the well–developed Oligocene and Eocene aquifers.
The Oligocene TWT thickness map (Figure 14) suggested that the developed siliciclastic sequences are essentially located in numerous interesting sub–basins for deep exploration. The dimensions and positions of these targets will help to prioritize future water exploration planning in the Ain El Beidha plain.
7. Conclusions
In the Ain El Beidha plain (central Tunisia), the alluvial Mio–Plio–Quaternary deposits contain the major groundwater table resources for drinking and irrigation.
These aquifers are currently over–exploited, which motivated this study. We highlighted the geometry of deep siliciclastic Oligocene and carbonate Eocene aquifers. These aquifers are naturally recharged from outcrops surrounding the plain.
The Ain El Beidha plain is strongly structured due to its location between the north–south axis (a major N–S tectonic corridor in central Tunisia) to the east, and the NE–SW Trozza Atlasic thrust to the west. To perform a detailed subsurface mapping of the structural elements, an advanced gravity data analysis was performed. Seismic reflection profiles were also used to confirm the gravity results and to produce isochron maps of the Oligocene and Eocene aquifers. The combined interpretation of the gravity and seismic reflection results complemented the geological and hydrogeological background information, and distinguished three NE–SW major areas with local structuring:
- (1)
- Oued Ben Zitoun, a very subsiding and elongated depocenter associated with thick Miocene and Oligocene series;
- (2)
- The El Gonna–J. El Mguataa–Kroumet Zemla trend, representing a complex faulted folding structure and an important groundwater “partition line” in the study region; and
- (3)
- The Ain El Beidha basin, showing Oligocene and Eocene deposit thickening.
The total horizontal gravity gradient associated with the source edge detect filter and Euler deconvolution solutions indicated that this plain is affected by N–S and NE–SW major faults with depths reaching over 1750 m. Interpretation of the 3D inversion of the residual anomalies and the analysis of the seismic reflection profiles confirmed the fault inheritance and the position of the hydrogeological basins and sub–basins in relation to deep accidents (such as the foot wall and hanging wall areas). Finally, isochron maps thus generated (isobath maps of the Oligocene top and Eocene top layers and the thickness map of the Oligocene aquifer) were compared to the previously obtained results from gravity anomalies and analyzed for a selection of promising sub–basins for the deep water exploration of Oligocene and Eocene aquifers.
The present work highlighted the advantage of combined gravity and seismic investigation to reliably characterize deep bearing water formations in a tectonically complicated context, and to determine their regional extension, as well as their depth and thickness. This approach has a great advantage for the better recognition of groundwater resources, their availability, and their vulnerability. It provides great insights for policy making for appropriately regulating the use of these rare resources, especially in a climate change context.
Author Contributions
H.A., paper coordination, seismic data analysis, writing and correcting; H.G., writing and gravity data analysis; M.B., project concept and supervision. All authors have read and agreed to the published version of the manuscript.
Funding
This research was supported by the Water Research and Technologies Center Borj–Cedria (CERTE, Tunisia) and was funded by research project entitled Water Task Force WTF, Milieux Poreux, Transferts des Fluides et Changements Globaux pour une Meilleure Gestion des Ressources, (CERTE/MERES, 2019–2022) and the “AS–HYDRO project” (PRF2019–D1P6 2019–2021).
Institutional Review Board Statement
Not applicable.
Informed Consent Statement
Not applicable.
Data Availability Statement
Not applicable.
Acknowledgments
The authors thank ONM, ETAP, and DGRE for providing gravity, seismic, and well data, respectively, and for their support of scientific research in Tunisia.
Conflicts of Interest
The authors declare no conflict of interest.
References
- Van Overmeeren, R.A. A combination of electrical resistivity, seismic refraction, and gravity measurements for groundwater exploration in Sudan. Geophys 1981, 46. [Google Scholar] [CrossRef]
- Van Overmeeren, R.A. A combination of gravity and seismic refraction measurements, applied to groundwater explorations near Taltal, Province of Antofagasta, Chile. Geophys. Prospect. 2006, 23, 248–258. [Google Scholar] [CrossRef]
- Bruno, P.P.G.; Vesnaber, A. Groundwater characterization in arid regions using seismic and gravity attributes: Al Jaww Plain, UAE. Front. Earth Sci. 2021, 8. [Google Scholar] [CrossRef]
- Khazri, D.; Gabtni, H. Geophysical Contribution in the Characterization of Deep Water Tables Geometry (Sidi Bouzid, Central Tunisia). Int. J. Geophys. 2015, 2015, 16. [Google Scholar] [CrossRef]
- Djebbi, M.; Gabtni, H. A contribution of gravity and seismic data in understanding the geometry of the Zouaraa – Ouchtata dune (NW Tunisia): Hydrogeological implications. J. Afr. Earth Sci. 2017, 137, 91–102. [Google Scholar] [CrossRef]
- Burollet, P.F. Contribution à l’étude stratigraphique de la Tunisie Centrale. Ann. Mines Geol. 1956, 18, 345. [Google Scholar]
- Abbès, C. Structurations et Evolutions Tectono–Sédimentaires Mésozoïques et Cénozoïques, Associées aux Accidents Reghmatiques, à la Jonction des Marges Téthysienne et Nord–Africaine (Chaîne Nord–Sud, Tunisie Centrale). Ph.D. Thesis, Université Tunis El Manar, Tunis, Tunisie, 2004. [Google Scholar]
- Ouali, J. Importance du Réseau Réghmatique dans la Tectonogenèse de la Tunisie Atlasique à Travers L’étude de L’axe Nord–Sud. Ph.D. Thesis, Université Tunis El Manar, Tunis, Tunisie, 2007. [Google Scholar]
- Richert, J.P. Mise en évidence de quatre phases tectoniques successives en Tunisie. Notes Serv. Géol. 1971, 34, 115–125. [Google Scholar]
- Abbès, C. Etude Structurale du Jebel Touila: Extrémité Septentrionale du Chaînon N–S Sidi Kralif–Nara–El Haouareb. Ph.D. Thesis, Université de Tunis El Manar, Tunis, Tunisie, 1983. [Google Scholar]
- Rabhi, M. Contribution à L’étude Stratigraphique et Analyse de L’évolution Géodynamique de l’Axe N–S et des Structures Avoisinantes (Tunisie Centrale). Ph.D. Thesis, Université de Tunis El Manar II, Tunis, Tunisie, 1999. [Google Scholar]
- Castany, G. Etude géologique de l’Atlas Tunisien Oriental. Ann. Mines et Géol. 1951, 8, 1–632. [Google Scholar]
- Ben Jemiaa, M. Evolution Tectonique de la Zone de Failles Trozza–Labeidh (Tunisie Centrale). Ph.D. Thesis, Université Paris–Saclay, Orsay, Paris, France, 1986. [Google Scholar]
- Abbès, C.; Boukadi, N. Sur la chaîne N–S de la Tunisie centrale et ses infléchissements d’axe. Analyse des déformations du noeud tectonique du jebel Ech Chérichira: Coulissement blocage et rotation. C.R. Acad. Sci. Paris 1988, 307, 1277–1288. [Google Scholar]
- Martinez, M.C.; Turki, M.M.; Truillet, R. La signification des plis d’orientation méridienne dans l’Atlas tunisien centro–méridional. Bull. Soc. Geol Fr. 1990, 8, 843–852. [Google Scholar] [CrossRef]
- Boukadi, N.; Zargouni, F. Sur l’interférence des directions structurales dans l’Atlas de Tunisie. L’exemple du noeud tectonique des Jebels M’rhila–Labeïd. C. R. Acad. Sci. Paris 1991, 312, 529–534. [Google Scholar]
- El Ghali, A. Néotectonique et évolution tectono–sédimentaire associées aux jeux de la faille de Sbiba–Kairouan du Crétacé supérieur à l’Actuel (Tunisie centrale). Ph.D. Thesis, Université de Tunis El Manar II, Tunis, Tunisie, 1993. [Google Scholar]
- Ayadi, S.; Rabhi, M.; Boukadi, N.; Zargouni, F. Analyse linéamentaire des données Satellitaires de la région de relais de fossé de Rohia, Sbiba et Hajeb El Aoun (Tunisie centrale). Afr. Geosci. Rev. 2005, 12, 1–2. [Google Scholar]
- Ben Ammar, S. Contribution à L’étude Hydrogéologique, Géochimique et Isotopique des Aquifères de Ain El Beidha et du Bassin du Merguellil (Plaine de Kairouan): Implications pour L’étude de la Relation Barrage–Nappes. Ph.D. Thesis, L’Université de Sfax, Tunis, Tunisie, 2007. [Google Scholar]
- El Ghali, A. Carte Géologique de Trozza; Édition Office National des Mines: Tunis, Tunisie, 1992. [Google Scholar]
- Jellalia, D.; Lachaal, F.; Andoulsi, M.; Zouaghi, T.; Hamdi, M.; Bédir, M. Hydro–geophysical and geochemical investigation of shallow and deep Neogene aquifer systems in Hajeb Layoun–Jilma–Ouled Asker area, Central Tunisia. J. Afr. Earth Sci. 2015, 110, 227–244. [Google Scholar] [CrossRef]
- Thebti, S.; Jellalia, D.; Azaiez, H.; Bédir, M. Basin structuring and hydro–geophysical characterization of Upper Cretaceous and Eocene fractured deep carbonate reservoirs in the Hajeb Layoun–Jelma–Ouled Asker area (Central Tunisia). Arab J. Geosci. 2018, 11, 107. [Google Scholar] [CrossRef]
- Ferjani, A.B.; Burollet, P.F.; Mejri, F. In Proceedings of the Conference: Annual convention and exposition of the American Association of Petroleum Geologists, San Francisco, CA, USA, 3–6 June 1990; 194p.
- El Ghali, A.; Ben Ayed, N. Mécanisme d’ouverture des bassins récents liés au système décrochant de Sbiba–Chérichira (Tunisie centrale). Géol. Méditerr. 1995, 22, 141–151. [Google Scholar] [CrossRef]
- Zouaghi, T.; Bédir, M.; Ayed–Khaled, A.; Soua, M.; Lazzez, M. Autochthonous versus allochthonous Triassic salt bodies in the North Africa continent setting, the Sbiba graben, central Atlas of Tunisia. J. Struct. Geol. 2013, 52, 163–182. [Google Scholar] [CrossRef]
- Djebbi, M.; Gabtni, H. 3D gravity modeling of a salt structure associated to the Trozza–Labaied lineament (Central Tunisia) constrained by seismic and borehole data. J. Afr. Earth Sci. 1995, 103, 71–80. [Google Scholar] [CrossRef]
- Bouaziz, S.; Barrier, E.; Soussi, M.; Turki, M.M.; Zouari, H. Tectonic evolution of the northern African margin in Tunisia from paleostress data and sedimentary record. Tectonophysics 2002, 357, 227–253. [Google Scholar] [CrossRef]
- Yaïch, C. Dynamique Sédimentaire, Eustatisme et Tectonique Durant l’Oligo–Miocène en Tunisie. Formation Fortuna, Messiouta et Grijima; Numidien et Gréso–Micacé. Ph.D. Thesis, Université de Tunis El Manar, Tunis, Tunisie, 1997. [Google Scholar]
- Zouaghi, T. Distribution des Séquences de Dépôt du Crétacé (Aptien–Maastrichtien) en Subsurface: Rôle de la Déformation Tectonique, l’Halocinèse et Evolution Géodynamique (Atlas central de Tunisie). Ph.D. Thesis, Université de Tunis El Manar, Tunis, Tunisie, 2008. [Google Scholar]
- Khouaja, A. Etude Hydrogéologique du Synclinal de Ain El Beidha, SO de Kairouan. Rapp. Tech. DGRE 1970. Available online: http://www.onm.nat.tn/en/index.php?p=notices&findtype=details&id=7707 (accessed on 5 May 2021).
- Hamza, M. Contribution à L’étude Hydrogéologique du Synclinal d’Ain El Beidha (Tunisie Centrale). Ph.D. Thesis, Université Paris VI, Paris, France, 1976. [Google Scholar]
- Sy, M.B. Modélisation de la Nappe d’Aïn Baïdha; Rapport ENIT/LMHE: Tunis, Tunisie, 1999. [Google Scholar]
- Ben Ammar, S.; Zouari, K.; Leduc, C.; M’Barek, J. Caractérisation isotopique de la relation barrage–nappe dans le bassin du Merguellil (Plaine de Kairouan, Tunisie centrale). Hydrol. Sc. J. 2006, 51, 272–284. [Google Scholar] [CrossRef]
- DGRE. Annuaire Hydrologique de Tunisie, 2013, Etude Hydrodynamique et Modélisation des Ecoulements Souterrains dans les Gouttières Synclinales Gréseuses du Barrémo–Albo–Aptien d’Aïn Séfra (Partie Centrale des Monts des Ksour–Atlas Saharien, Nord–Ouest Algérie). Available online: https://tel.xn--archivesouvertes-jg6i.fr/tel-01167133/document (accessed on 5 May 2021).
- Gabtni, H.; Jallouli, C. Regional–residual separation of potential field: An example from Tunisia. J. Appl. Geophys. 2017, 137, 8–24. [Google Scholar] [CrossRef]
- Miller, H.G.; Singh, V. Potential field tilt—A new concept for the location of potential field sources. J. Appl. Geophys. 1994, 32, 213–217. [Google Scholar] [CrossRef]
- Blackely, R.; Simpson, R. Approximating Edges of Sources Bodies from Magnetic or Gravity Anomalies. Geophysics 1986, 51, 1494–1498. [Google Scholar] [CrossRef]
- Reid, A.B.; Allsop, J.M.; Granser, H.; Millet, A.J.; Somerton, I.W. Magnetic interpretation in three dimensions using Euler Deconvolution. Geophysics 1990, 55, 80–91. [Google Scholar] [CrossRef] [Green Version]
Figure 1.
(A). Regional situation of Tunisia. (B) Geological and hydrogeological setting of the Ain El Beidha plain located in central Tunisia (Geological data adapted from [11,20] UTM projection WGS84 N32. (1) Quaternary and Mio–Plio–Quaternary. (2) Miocene (Sbiba graben). (3) Miocene (Ain El Beidha plain). (4) Oligocene. (5) Eocene. (6) Upper Cretaceous. (7) Lower Cretaceous. (8) Triassic. (9) Major mapped faults. (10) Dip. (11) River. (12) Boreholes. (13) Seismic line. (14) L1 and L2 seismic lines. (15) Limit of 1km*1km used gravity survey. (16) Hydrogeological well correlation. (17) Groundwater flow direction. (Adopted from [19]). (18) Position of the picture. (C) General view of the Ain El Beidha plain.

Figure 2.
Lithostratigraphic column of the tertiary series in the Ain El Beidha plain (adapted from the J. Touila tertiary series description [17]) and associated hydrogeological systems. (1) Clay. (2) Sandy clay. (3) Sand. (4) Sandstones. (5) Clayey sand. (6) Sand and clay alternances. (7) consolidated and fossilized Sandstones. (8) Siliciclastic deposits. (9) Dolomites. (10) Limestones.

Figure 3.
Hydrogeological wells correlation crossing the Ain El Beidha plain. (1) Quaternary and Mio–Plio–Quaternary. (2) Miocene (Ain El Beidha plain). (3) Oligocene. (4) Upper Eocene. (5) Lower Eocene. (6) Fault. (7) Water table level. GL: groundwater level. S: salinity. WF: water flow.
Figure 3.
Hydrogeological wells correlation crossing the Ain El Beidha plain. (1) Quaternary and Mio–Plio–Quaternary. (2) Miocene (Ain El Beidha plain). (3) Oligocene. (4) Upper Eocene. (5) Lower Eocene. (6) Fault. (7) Water table level. GL: groundwater level. S: salinity. WF: water flow.

Figure 4.
Interpreted Bouguer gravity map of the Ain El Beidha plain. (1) Limits of the major gravity anomalies.
Figure 4.
Interpreted Bouguer gravity map of the Ain El Beidha plain. (1) Limits of the major gravity anomalies.

Figure 5.
Interpreted residual gravity map of the Ain El Beidha plain. (1) Limits of major gravity anomalies. (2) Major positive gravity anomaly axis. (3) Major negative gravity anomaly axis. (4) Northern and southern limits of the Ain El Beidha plain.
Figure 5.
Interpreted residual gravity map of the Ain El Beidha plain. (1) Limits of major gravity anomalies. (2) Major positive gravity anomaly axis. (3) Major negative gravity anomaly axis. (4) Northern and southern limits of the Ain El Beidha plain.

Figure 6.
Interpreted tilt angle map of the Ain El Beidha plain. (1) Major positive gravity anomaly axis. (2) Major negative gravity anomaly axis. (3) Northern and southern limits of the Ain El Beidha plain.
Figure 6.
Interpreted tilt angle map of the Ain El Beidha plain. (1) Major positive gravity anomaly axis. (2) Major negative gravity anomaly axis. (3) Northern and southern limits of the Ain El Beidha plain.

Figure 7.
Interpreted magnitude of horizontal gravity gradient map of the Ain El Beidha plain. (1) Lineaments.
Figure 7.
Interpreted magnitude of horizontal gravity gradient map of the Ain El Beidha plain. (1) Lineaments.

Figure 8.
Detailed lineament map of the Ain El Beidha plain. deduced from the SED filter and Euler deconvolution solution results. Depth to source estimation was performed using a structural index of 0, a window size of 10*10, and a maximum percentage of depth tolerance of 15%. (1) Major positive gravity anomaly axis. (2) Major negative gravity anomaly axis. (3) Northern and southern limits of the Ain El Beidha plain. (4) Major fault/discontinuity corridors.

Figure 9.
Interpreted 3D density inversion model using the lateral cutting plane of the Ain El Beidha plain. (A) Lateral cutting across El Gonna and Touila structures. (B) Lateral cutting across Oued Ben Zitoun, Kroumet Zemla and Ain El Beidha. (C) Lateral cutting across southern Trozza Mountain, northern Oued Ben Zitoun syncline and northern Kroumet Zemla fold. (D) Lateral cutting across Trozza Mountain and northern Ain El Beidha plain.

Figure 10.
Interpreted seismic reflection profile L1. (1) Top. Oligocene. (2) Top. Eocene. (3) Top. Upper Cretaceous. (4) Major fault.
Figure 10.
Interpreted seismic reflection profile L1. (1) Top. Oligocene. (2) Top. Eocene. (3) Top. Upper Cretaceous. (4) Major fault.

Figure 11.
Interpreted seismic reflection profile L2. (1) Top. Oligocene. (2) Top. Eocene. (3) Top. Upper Cretaceous. (4) Major fault.
Figure 11.
Interpreted seismic reflection profile L2. (1) Top. Oligocene. (2) Top. Eocene. (3) Top. Upper Cretaceous. (4) Major fault.

Figure 12.
Isochron map of the top of the Oligocene aquifer. (1) Major positive gravity anomaly axis. (3) Major negative gravity anomaly axis. (4) Northern and southern limits of the Ain El Beidha plain. (4) Major fault/discontinuity corridors.
Figure 12.
Isochron map of the top of the Oligocene aquifer. (1) Major positive gravity anomaly axis. (3) Major negative gravity anomaly axis. (4) Northern and southern limits of the Ain El Beidha plain. (4) Major fault/discontinuity corridors.

Figure 13.
Isochron map of the top of the Eocene aquifer. (1) Major positive gravity anomaly axis. (3) Major negative gravity anomaly axis. (4) Northern and southern limits of the Ain El Beidha plain. (4) Major fault/discontinuity corridors.
Figure 13.
Isochron map of the top of the Eocene aquifer. (1) Major positive gravity anomaly axis. (3) Major negative gravity anomaly axis. (4) Northern and southern limits of the Ain El Beidha plain. (4) Major fault/discontinuity corridors.

Figure 14.
Thickness TWT map of the Oligocene aquifer. (1) Major positive gravity anomaly axis. (3) Major negative gravity anomaly axis. (4) Northern and southern limits of the Ain El Beidha plain. (4) Major fault/discontinuity corridors.
Figure 14.
Thickness TWT map of the Oligocene aquifer. (1) Major positive gravity anomaly axis. (3) Major negative gravity anomaly axis. (4) Northern and southern limits of the Ain El Beidha plain. (4) Major fault/discontinuity corridors.

Publisher’s Note: MDPI stays neutral with regard to jurisdictional claims in published maps and institutional affiliations. |
© 2021 by the authors. Licensee MDPI, Basel, Switzerland. This article is an open access article distributed under the terms and conditions of the Creative Commons Attribution (CC BY) license (https://creativecommons.org/licenses/by/4.0/).
Share and Cite
MDPI and ACS Style
Azaiez, H.; Gabtni, H.; Bédir, M. Joint Gravity and Seismic Reflection Methods to Characterize the Deep Aquifers in Arid Ain El Beidha Plain (Central Tunisia, North Africa). Water 2021, 13, 1310. https://doi.org/10.3390/w13091310
AMA Style
Azaiez H, Gabtni H, Bédir M. Joint Gravity and Seismic Reflection Methods to Characterize the Deep Aquifers in Arid Ain El Beidha Plain (Central Tunisia, North Africa). Water. 2021; 13(9):1310. https://doi.org/10.3390/w13091310
Chicago/Turabian StyleAzaiez, Hajer, Hakim Gabtni, and Mourad Bédir. 2021. "Joint Gravity and Seismic Reflection Methods to Characterize the Deep Aquifers in Arid Ain El Beidha Plain (Central Tunisia, North Africa)" Water 13, no. 9: 1310. https://doi.org/10.3390/w13091310
Note that from the first issue of 2016, this journal uses article numbers instead of page numbers. See further details here.