
Predicting Tropical Monsoon Hydrology Using CFSR and CMADS Data over the Cau River Basin in Vietnam
by
 , , , ,
Duy Minh Dao
1,2 ,
,
Jianzhong Lu
1,*,
Xiaoling Chen
1,
Sameh A. Kantoush
3,
Doan Van Binh
3,
Phamchimai Phan
1,4 and
Nguyen Xuan Tung
5 1
State Key Laboratory of Information Engineering in Surveying, Mapping and Remote Sensing, Wuhan University, Wuhan 430079, China
2
Faculty of Geography, Thai Nguyen University of Education, 20 Luong Ngoc Quyen, Thai Nguyen 250000, Vietnam
3
Water Resources Center, Disaster Prevention Research Institute, Kyoto University, Goka-sho, Uji City, Kyoto 611-0011, Japan
4
Faculty of Tourism, Thai Nguyen University of Sciences, Tan Thinh Ward, Thai Nguyen 250000, Vietnam
5
Institute of Marine Geology and Geophysics, VAST, 18 Hoang Quoc Viet, Hanoi 100000, Vietnam
*
Author to whom correspondence should be addressed.
Water 2021, 13(9), 1314; https://doi.org/10.3390/w13091314
Submission received: 2 April 2021
/
Revised: 29 April 2021
/
Accepted: 4 May 2021
/
Published: 8 May 2021
(This article belongs to the Special Issue Water and the Ecosphere in the Anthropocene)
Abstract
:To improve knowledge of this matter, the potential application of two gridded meteorological products (GMPs), the China Meteorological Assimilation Driving Datasets for the SWAT model (CMADS) and Climate Forecast System Reanalysis (CFSR), are compared for the first time with data from ground-based meteorological stations over 6 years, from 2008 to 2013, over the Cau River basin (CRB), northern Vietnam. Statistical indicators and the Soil and Water Assessment Tool (SWAT) model are employed to investigate the hydrological performances of the GMPs against the data of 17 rain gauges distributed across the CRB. The results show that there are strong correlations between the temperature reanalysis products in both CMADS and CFSR and those obtained from the ground-based observations (the correlation coefficients range from 0.92 to 0.97). The CFSR data overestimate precipitation (percentage bias approximately 99%) at both daily and monthly scales, whereas the CMADS product performs better, with obvious differences (compared to the ground-based observations) in high-terrain areas. Regarding the simulated river flows, CFSR-SWAT produced “unsatisfactory”, while CMADS-SWAT (R2 > 0.76 and NSE > 0.78) performs better than CFSR-SWAT on the monthly scale. This assessment of the applicative potential of GMPs, especially CMADS, may further provide an additional rapid alternative for water resource research and management in basins with similar hydro-meteorological conditions.
Keywords:
Cau River basin; CFSR; CMADS; SWAT model; tropical monsoon; reanalysis data; GMP; extreme weather event1. Introduction
Accurate and complete weather information provides important inputs into hydrological models, supporting flood forecasting and climate change impact assessments and serving as scientific guidance for water resource management [1,2,3]. Normally, data collected from meteorological stations are the most reliable and accurate data [4,5]; however, these data are insufficient to represent the actual weather conditions occurring in river basins due to their low spatial coverage [6,7], and as they are affected by signal distortions [8,9,10]. Furthermore, the acquisition of reliable temperature and precipitation data is a difficult task because of dynamic climatic conditions, altitudes, and surface properties [11,12,13,14]. These data are especially limited in developing countries due to technical and financial limitations [3,11,12,13,15].
Currently, satellite products with high spatiotemporal resolutions have become potential additional data sources for hydrological research, especially in areas where the number of surface observation stations is not adequate [13,16,17]. The use of these datasets in different hydrological models has yielded positive results. Ankur Srivastava et al. used the Variable Infiltration Capacity (VIC-3L) semi-distributive model to estimate evapotranspiration (ET) on a grid-scale with satisfactory results over a tropical river basin in eastern India [18]. The author has, also on this river, successfully quantified its main hydrological components using the VIC-3L semi-dispersion model and the Identification of unit Hydrograph and Component flows from the Rainfall, Evapotranspiration and Streamflow (IHACRES) conceptual model [19]. Another conceptual model, the Satellite-based Hydrological Model (SHM), has been evaluated with positive results but the scope has not been expanded as the product has not yet been developed outside India [20]. Currently, GMPs products are commonly used in SWAT, which is a semi-hydrological model with autocalibration and validation abilities [21,22,23].
In this study, the National Centers for Environmental Prediction-NCEP-CFSR and CMADS datasets are used because they have higher spatial resolutions than other products and are openly available for the study areas, covering both temperature and precipitation. Furthermore, these data are developed based on satellite data sources and then calibrated against ground-based observations to obtain better estimates [23,24,25]. Dile et al. [25] simulated the composition of the water and rainfall balance in the upstream sub-basins of the Blue Nile using CFSR data with satisfactory results, and found this dataset to be feasible in a region where data are scarce. A case study conducted in Africa by Worqlul et al. [26] reported that CFSR (and The Multi-Sensor Precipitation Estimate-Geostationary (MPEG) data performed best compared to TRMM data at the point-to-grid ratio and catchment scale over Lake Tana, Ethiopia. The authors also concluded that CFSR data are suitable for predicting extreme events using the Parameter Efficient Distributed (PED) and Hydrologiska Bryan Vattenbalansavdelning (HBV) models upstream of the Blue Nile basin [27]. Fuka et al. [23] assessed the reliability of CFSR data for different climate and river basin types in the U.S and Africa and recommended that these data be used as minimal indications with acceptable performances in hydrological models. In contrast, Mou Tan et al. [4,15] found that CFSR precipitation data had the lowest performance compared to other precipitation estimates and could not be used in runoff simulations in Malaysia or the humid tropics. Other studies by Zhu et al. [28] on two wet river basins in China and by Vu et al. [13] on the Dak Bla River, Vietnam, showed that CFSR exhibits potential for detecting rain events; however, caution should be noted when predicting runoff because of the low performance of this product.
Recently, the CMADS dataset has been used more frequently in hydrological studies. Cao et al. [29] used CMADS data to simulate the runoff and water balance at daily and monthly scales over the Lijiang River basin, South China. Studies by Lu et al. [2,12] on the Yangtze River basin and Poyang Lake and by X. Y. Meng and Zhang et al. [30] in Northeast China evaluated the overall performances of the CFSR and CMADS datasets based on ground observations. These authors determined that CMADS showed a better performance compared to CFSR in terms of temperature, precipitation, and flow regeneration.
The gridded meteorological products used in hydrological models need to be carefully assessed because of their variable performances among different areas (e.g., microclimates, storm, surface conditions, elevations, and topographic directions) and because of the uncertainty inherent in forecasting models [12,14,31,32]. In addition, in-depth studies on hydrology and the need to improve water resource management require a full awareness of the advantages and disadvantages of the GMPs that are popularly studied across different regions [8]. In general, CFSR and CMADS can be used as inputs in hydrological studies because of their uniform datasets, and these products can be used immediately in flow simulations. This is the great advantage of these two reanalysis datasets when comparing them to satellite precipitation products, which lack accompanying temperature data and heterogeneous timescales. To the best of our knowledge, the applicability of CMADS and CSFR data for hydro-meteorological studies has not yet been adequately investigated outside of China, including in Southeast Asia.
The Cau River basin (CRB) in the Thai Binh River network is located in northern Vietnam and plays an important social and economic role. The Cau River flows through six administrative provinces, including Hanoi city. Bui et al. [33] integrated the SWAT model with QUAL2K to simulate the water quality (mainly the organic and nutrient contaminant contents) in the CRB using limited data. Tran et al. [34] used the SWAT model to estimate the nitrogen (N) load with multiple polluting sources along the CRB, one of the three most polluted river basins in Vietnam. To date, assessments of the potential of CFSR data and especially CMADS data in hydrological applications have not been given sufficient attention. Furthermore, global climate change associated with extreme weather events adds complexity to water resource management issues in the CRB.
In this paper, CFSR and CMADS data are used for the first time in hydro-meteorological research over a specific river basin in Vietnam. For the aim of assessing the reliabilities and capabilities of these datasets in the hydrological model, in this study we have carried out the following specific tasks: (i) to use data from ground-based meteorological stations (GMS) to validate the CFSR and CMADS precipitation/temperature products on temporal and spatial scales using various statistical indicators; (ii) to assess the abilities of these datasets in hydrological simulations from 2008 to 2013 using the SWAT model; and (iii) to investigate the abilities of these GMPs to capture extreme weather (including rain events, extreme heat events, cold events, etc.) and streamflow events occurring in the CRB.
2. Materials and Methods
2.1. Study Area
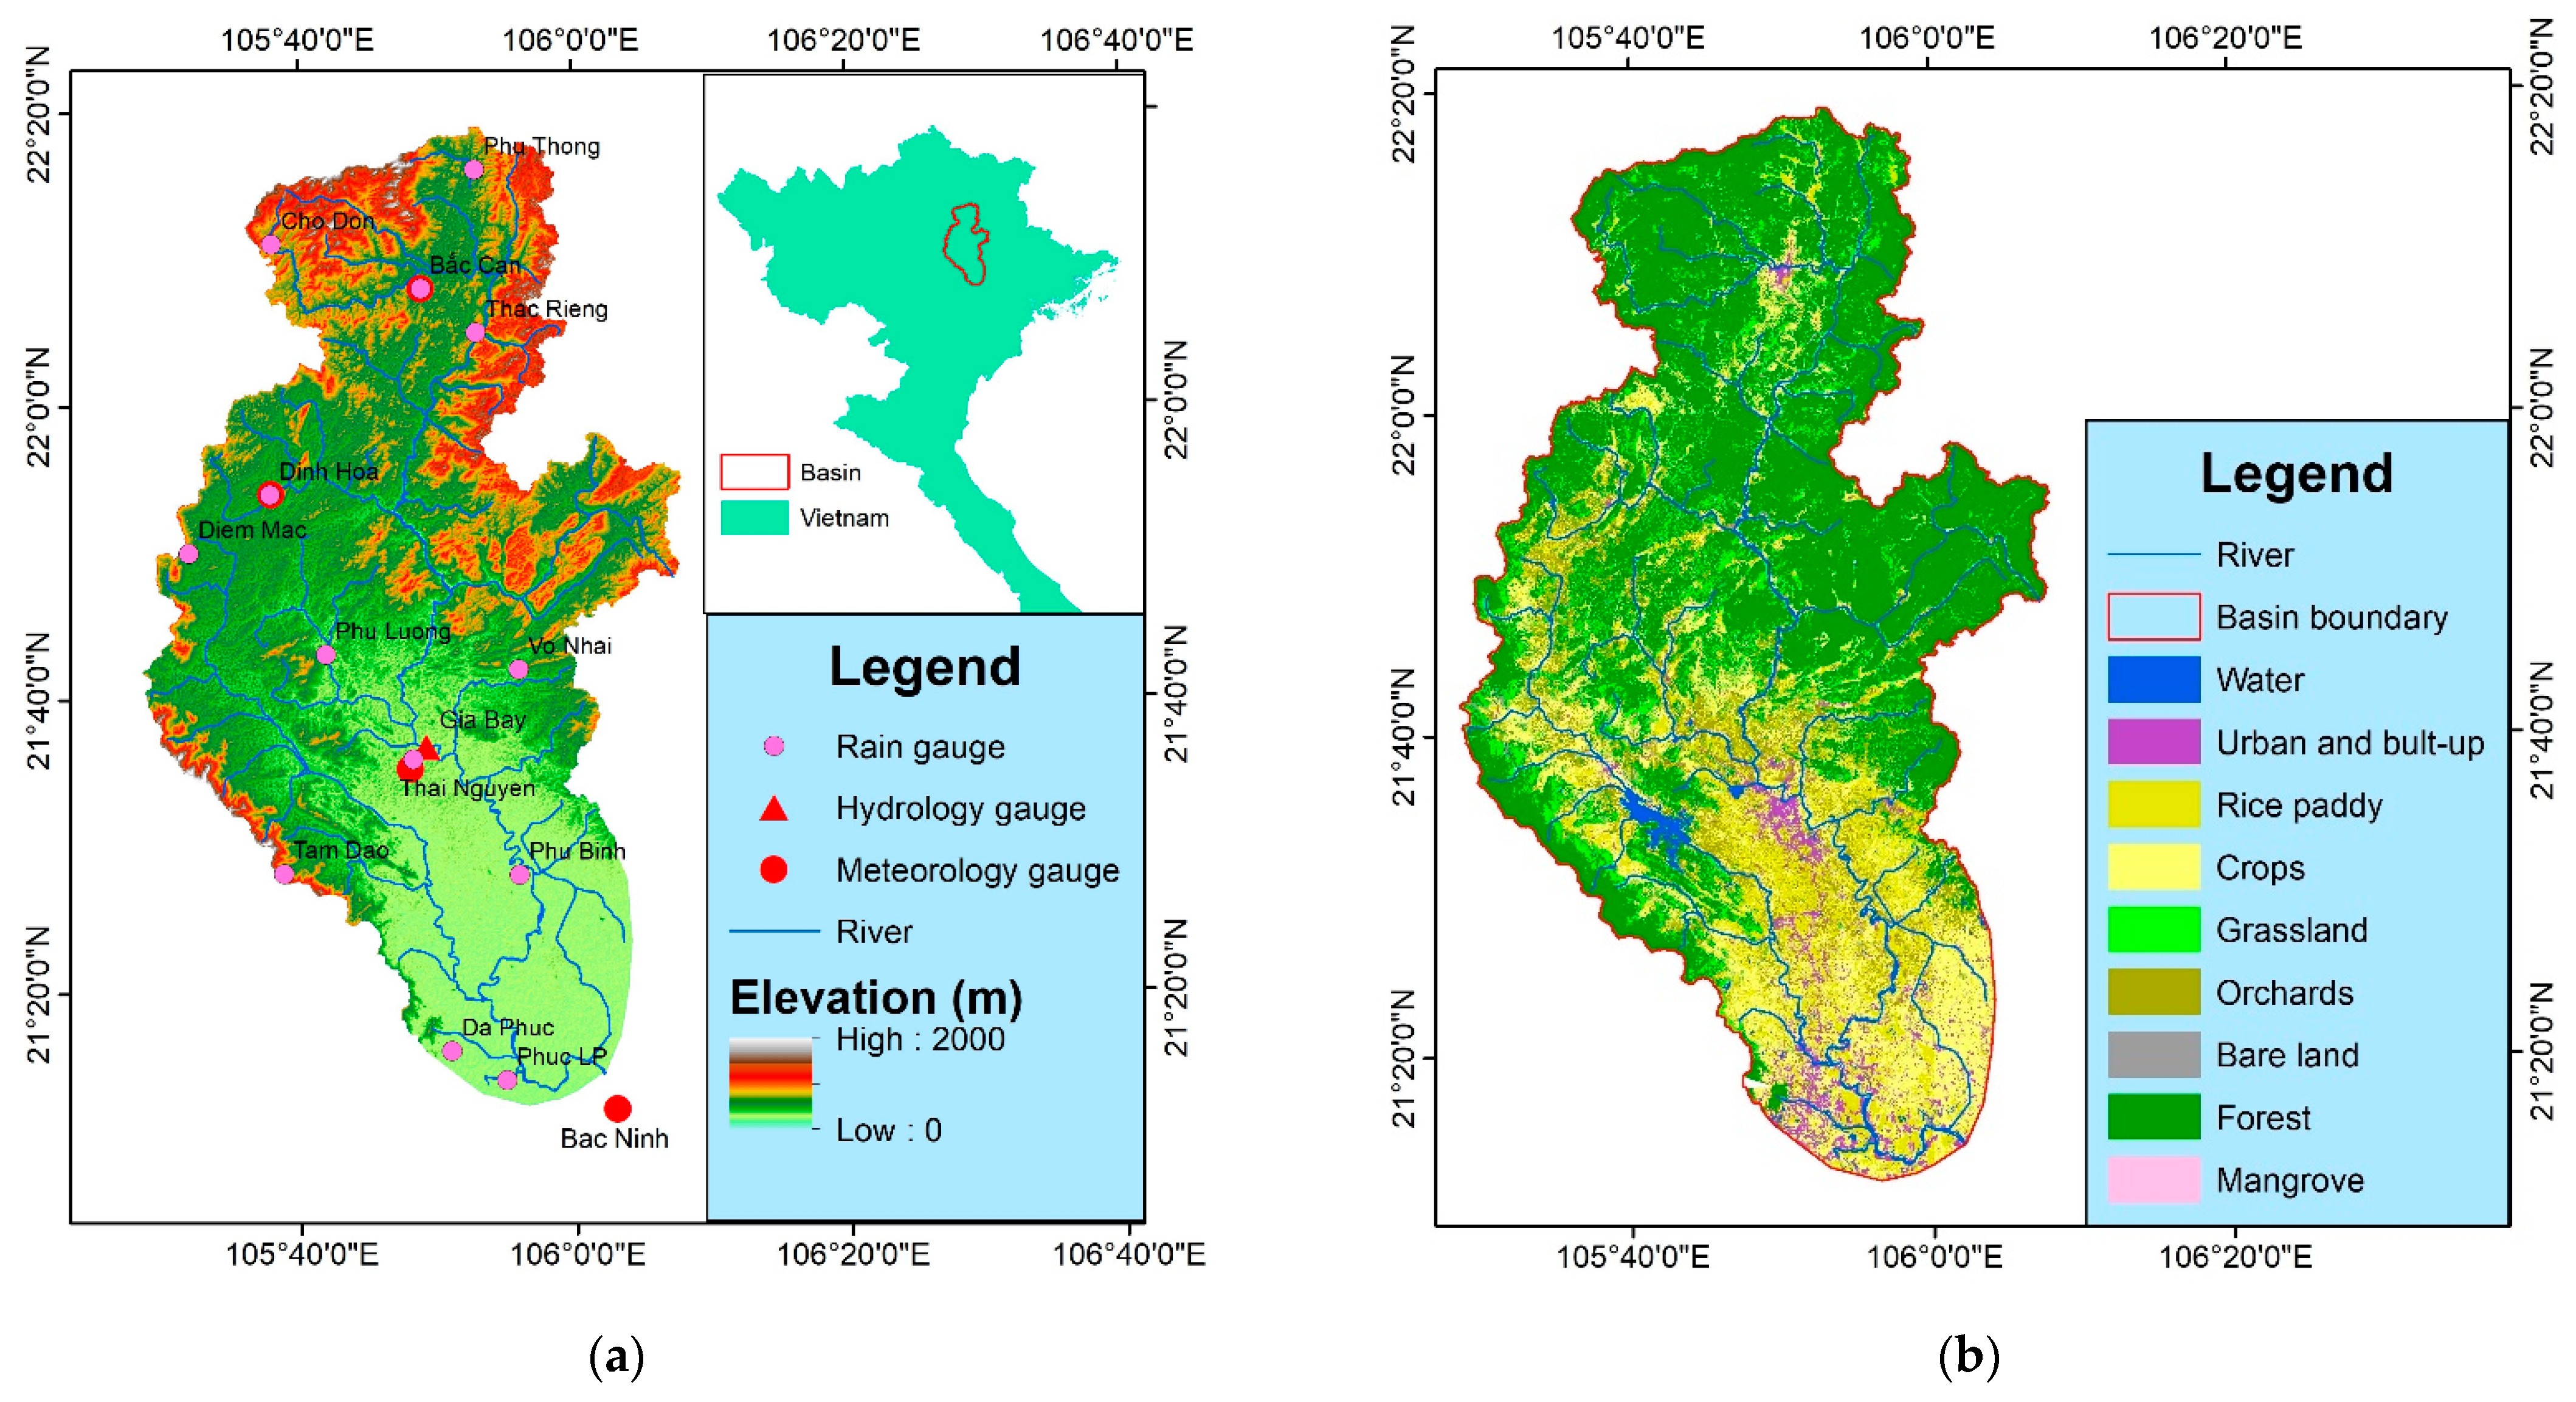
The CRB (21.07°–22.18° N and 105.28°–106.08° E) contains the Cau River, the main tributary of the Thai Binh River, which is the second-largest river system in northern Vietnam. The river flows in a north-south direction, originating from the high mountains in northwest Bac Kan province. It flows through six administrative provinces and cities (including northern Hanoi city in the downstream reach). The river basin covers an area of nearly 6300 km2 with a total length of ~1603 km; the mainstream length is 290 km [34].
The topography in the basin changes from an altitude of approximately 1000 m in the surrounding mountains in the west, north, and northeast regions to the plains in the central and south regions with elevations below 10 m, alternating with hills with elevations ranging between 200 and 400 m above sea level. The CRB is characterized by a tropical monsoon climate with an annual mean temperature of approximately 23 °C. However, due to the influence of the northeast monsoon, from December to February, the monthly average temperature declines below 18 °C. The annual mean precipitation is ~1600 mm, of which approximately 80% occurs in the wet season (May to October) and the rest occurs in the dry season (November to April). Land use in the region (Figure 1b) is divided into 9 major categories; approximately 49% of the region is natural forestland (the main upstream area has a complex mountainous topography), grassland, and shrubland (distributed in the midland areas of Bac Kan and Thai Nguyen provinces). Moreover, agricultural land (36%) and built-up regions (8%) are located in the downstream region of the river, where there are a crowded population and dynamic economic development. Notably, the irrigation canal system serving agricultural activities in the basin is quite complete. The Gia Bay hydrological station (Thai Nguyen province) measures the discharge in the center of the river basin.
2.2. Model Input Data
The spatial data required as inputs for the SWAT model include the digital elevation model (DEM), soil type map, and land use map. DEM data with a 30 m resolution were extracted from the United States Geological Survey (USGS). The land use data representing 2005 were collected from the Ministry of Natural Resources and Environment (MONRE) and were classified based on the SWAT format. Soil maps were obtained from the Food and Agriculture Organization of the United Nations (FAO), and the soil properties were determined based on the soil characteristic data of Vietnam.
2.2.1. NCEP-CFSR
CFSR is a reanalysis product developed by the US National Center for Environmental Prediction. This system was collected by NCEP from 1979 to July 2014 with a resolution of 0.31° (~38 km) based on the assimilation of atmosphere-ocean-land surface-sea ice system data at a global, coupled scale [23,25,35]. In the CRB, the daily meteorological data of 15 grid points were downloaded from the official website (https://globalweather.tamu.edu/ (accessed on 31 March 2021)).
2.2.2. CMADS Data
The CMADS dataset was developed by the Agricultural University of China based on the integration of the Local Analysis and Prediction System/Space-Time Multiscale Analysis System (LAPS/STMAS), the Climate Prediction Center Morphing (CMROPH) global precipitation data, and China’s National Meteorological Information Center. The data sources used for the CMADS series, available from 2008 to 2016 and covering all of East Asia (0°–65° N; 60°–160° E), were collected from nearly 40,000 regional automated stations belonging to 2421 national stations; this ensures that the CMADS data are widely available and increases the accuracy of the dataset [24,30,36]. In this paper, we use CMADS v1.1, with a spatial resolution of 0.25° and 24 available grid points (this product is available from the following website: http://www.cmads.org/ (accessed on 10 April 2021).
2.2.3. GMS Data
GMS data from 13 rain gauges and four daily meteorological stations in the CRB were obtained from the Meteorological and Hydrological Administration of the Ministry of Natural Resources and Environment (MORNE). On the CRB, only the Gia Bay hydrological station in Thai Nguyen province (which has been recording data from 1997 to the present) is used in this study, as other stations have stopped working or have collected inadequate data. No information is available at the river basin outlet.
The GMP and GMS data necessary for the SWAT model include the daily maximum/minimum temperature and precipitation data collected and processed from 1 January 2008 to 31 December 2013 to ensure consistency in the evaluation and comparison of the performances of the input data. Detailed information about the sources and the spatial/temporal resolutions of the products is shown in Table 1.
2.3. Hydrological Modeling Method
The SWAT model is a semi-distributed hydrological model developed by the Agricultural Research Service of the United States Department of Agriculture [22]. The hydrologic cycle as simulated by SWAT is based on the water balance equation, which considers precipitation, irrigation, evapotranspiration, surface runoff, lateral flow, and percolation to shallow and/or aquifers:
where SWt is the final soil water content, SW0 is the initial soil water content on day “i”, “t” is the time (days), Rday, Qsuf, ETa, Pi and QRi are the daily amounts of precipitation, runoff, evapotranspiration, percolation, and return flow on day “i”, respectively (all units are mm H2O) [37]. With outstanding advantages, SWAT has been widely used to simulate hydrological processes and conduct impact assessments of land management methods on water and point-/non-point-source pollution in river basins and watersheds [21,37]. Inputs of SWAT model simulations include weather data (e.g., precipitation, maximum/minimum temperature), soil properties, topography, vegetation, and land management practices. The 2012 ArcSWAT version, an interface in ArcGIS 10.2, was used to build the hydrological study in the CRB. Installation guidelines and research papers related to the SWAT model are available at https://swat.tamu.edu/ (accessed on 5 April 2021), as well as in an online open-source document [38].
Using 30 m DEM data and the river network, the basin delimiter in ArcSWAT creates 42 sub-basins in the CRB. These sub-basins are further subdivided into 405 hydrological reactive units (HRUs) with different land, topographic, and soil management characteristics. The GMS, CFSR, and CMADS weather data are then provided as inputs for the flow simulations (hereinafter referred to as the SWAT model controlled by CFSR_, CMADS_, and GMS_), and the results are verified with the hydrological observations.
2.4. Evaluation Indicators
2.4.1. Index Evaluates Temperature and Precipitation
Over the CRB, only four meteorological stations record maximum/minimum temperature data, while the number of grid points in CMADS/CFSR are relatively high. Therefore, authentication of the temperature data was conducted only for the meteorological stations. Moreover, precipitation data were collected from 13 stations covering the period from 2008–2013 at the catchment scale. A point-to-pixel assessment was applied by selecting the closest GMP grid points as references for authentication against the GMS data.
To assess the quality of CMP in collecting temperature and precipitation data, the following indicators were used.
- (i)
- Four basic statistical indicators: the correlation coefficient (CC), mean absolute error (MAE), root-mean-square error (RMSE), and percentage bias (PBIAS) [8,17,39]. The calculation formulas of these indicators are shown as follows:where and are the gridded and observed temperature (or precipitation), respectively; and are the average gridded and observed temperature (or precipitation), respectively; “i” is representative of each individual measurement; and “n” is the number of measurements. A high correlation coefficient value and low MAE, PBIAS, and RMSE values indicate the reliable performance of a GMP in correlation with GMS [2,4,40].
- (ii)
- Three statistical-categorical indicators were used to evaluate precipitation events, including the probability of detection (POD), false alarm ratio (FAR), and critical success index (CSI) [39]. Their formulas are as follows:where “a” represents the correct detection of precipitation (from CFSR/CMADS and GMS); “b” represents a false alarm (when precipitation is detected in the CFSR/CMADS products but is not observed in GMS); and “c” is a predictive error (when precipitation is observed from the rain gauges but not estimated from CFSR/CMADS). These values range from 0 to 1. A high FAR value and low POD and CSI values imply a more accurate quantification [41,42].
- (iii)
- To evaluate the effectiveness of GMPs in capturing extreme weather events, this study selected indicators proposed by the “Climate Change Detection and Indicator Experts Group” [43] and “Circular on technical regulations and the process of dangerous hydro-meteorological forecasting of the MORNE, Vietnam” (2016). Accordingly, the extreme events related to temperature include: (1) very cold events in which the average temperature is between 13° and 15 °C (Tav13–15 °C/day), (2) damaging cold events in which the average temperature during the day is below 13 °C (Tav13 °C/day), (3) strong sun events in which the maximum temperature is in the range of 37°–39 °C (Tmx37–39 °C/day), and (4) scorching hot days in which the maximum temperature is recorded above 39 °C (Tmx39 °C/day). For rainfall, in addition to the indicators R10 mm/day and R50 mm/day, we propose to test a very heavy rainfall threshold of R100 mm/day to further assess the impact of this heavy rain layer on river flow.
2.4.2. Flow Indicators
The performance of the SWAT model in simulating the river flow in the CRB was evaluated using the NSE (Nash Sutcliffe efficiency coefficient), R2 (coefficient of determination), and PBIAS (percent bias) statistics [4,8,41]. The equations (Equations (9)–(11)) of these indicators, as well as the criteria of Moriasi et al. [44] (in terms of performance ratings as “very good”, “good”, “satisfactory”, or “unsatisfactory” at the monthly scale (see Table 2)), are presented as follows:
where and are the simulated and observed values, respectively; and are the averages of the simulations and observations at event “i”, respectively; and “n” is the number of events. The R2 value (ranging from 0 to 1) represents the linear cohesion of the observed and simulated flows, with an ideal value of 1 [32]. The PBIAS value shows the tendency of the average simulated flow to be larger/smaller (overestimated/underestimated) than the observed data [4,13,41]. For example, a PBIAS value of −15% means that the simulated flow from CMADS/CFSR is 15% smaller than the observed flow. Moreover, this PBIAS value shows the tendency of the data product to underestimate the flow. On the other hand, a PBIAS value of 200% reflects that the simulated flow by the GMP is overestimated and is twice as much as the observed flow. The NSE value is a dimensionless statistic that determines the relative magnitude of the simulated variance against the observed data variance. The NSE value ranges from −∞ to 1. The model prediction is more accurate with an NSE value close to 1 [45].
3. Results
3.1. Compare CFSR and CMADS Temperatures Using GMS Data
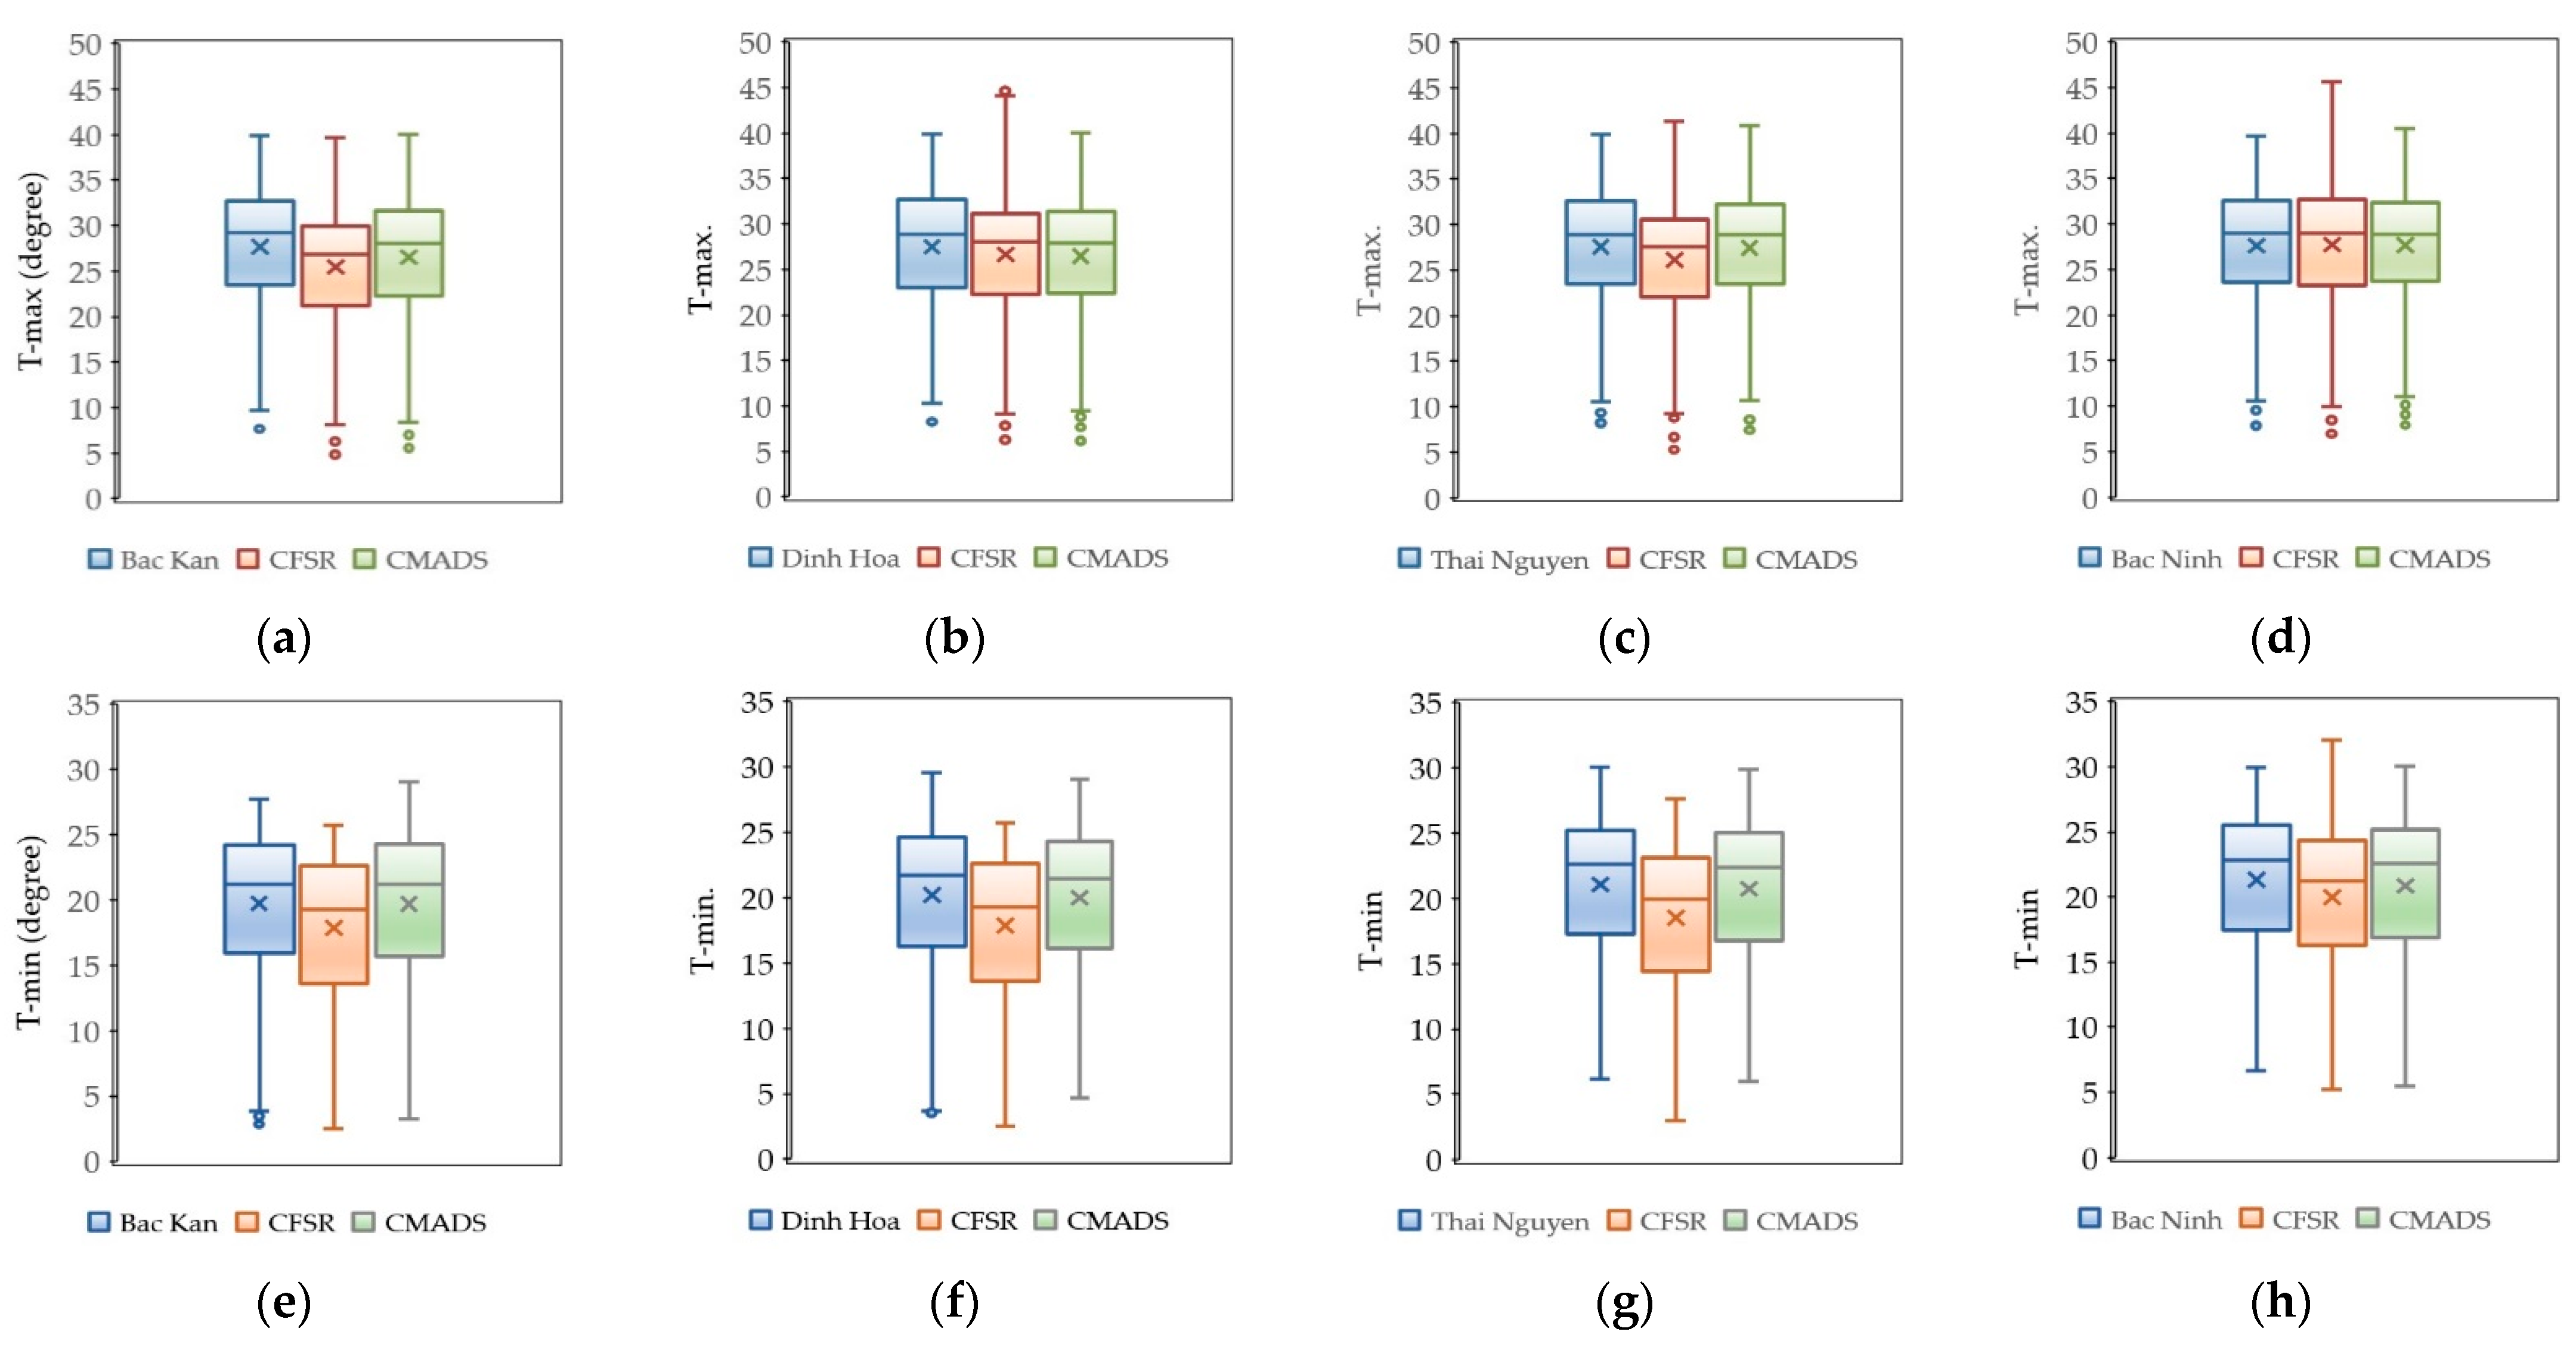
Within the CRB, there are 4 meteorological stations with temperature data information, while the densities of the CMADS and CFSR grid points are much higher; thus these monitoring stations are compared with the nearest CFSR and CMADS grid points. The average temperature and CC, MAE, RMSE, and MBE values selected to evaluate the accuracy of the maximum and minimum temperatures in the CMADS and CFSR datasets on daily and monthly scales are shown in Table 3. In general, Tmax and Tmin tend to increase gradually from north to south, i.e., from high latitudes and hills (e.g., Bac Kan and Dinh Hoa stations) to lower latitudes (e.g., Bac Ninh station). Both the CFSR and CMADS temperature data show strong correlations with the GMS data collected at observational stations. The average CC values obtained from CFSR are 0.92 for Tmax and 0.97 for Tmin, while those of CMADS are 0.96 and 0.97, respectively. The average MAE is 1.7, ranging from 0.95 to 2.47, and the average RMSE is 1.8, varying from 1.27 to 2.85; these values show that the GMP data are in good agreement with the temperatures observed at the stations. Figure 2 shows a box plot of the maximum and minimum temperatures of CFSR, CMADS, and the ground station data in the CRB. The boxes show that the CFSR temperatures have the largest range of changes. The mean values and interquartile range of temperature are consistent in CMADS than those in CFSR. Although the datasets are slightly different, the CFSR and CMADS temperature data can be used as GMS station data in hydrometeorological studies over the CRB.
The PBIAS values are negative at most stations (except that of Tmax at Bac Ninh station), reflecting that both CFSR and CMADS data tend to underestimate the maximum and minimum temperatures compared to those observed in the GMS data. Specifically, at Bac Ninh station, the PBIAS value is much smaller than that at other stations, showing that the CFSR and CMADS data have higher accuracies in low-terrain areas. Conversely, the increasing PBIAS values (especially with CFSR data) observed in areas with higher terrain may be related to temperature estimation errors that occur due to the effects of clouds in mountainous areas, and the minimum temperature value typically causes high PBIAS values in winter.
3.2. Statistical Evaluation of GMP Precipitation
3.2.1. Comparison in Each Time Scale (Daily/Monthly/Seasonal)
At the daily scale, the statistical results show no significant difference between the CFRS/CMADS rain data, with CC of 0.45/0.31 and RMSE values of 15.5/16.63, respectively (Table 4). A difference is found in that the CMADS values underestimated the actual precipitation, with a PBIAS value of −16.64%, while CFSR overestimated the actual precipitation with a PBIAS of 99.2%. Therefore, the MAE value of CFSR is also much higher than that of CMADS, with values of 8.01 and 5.7 mm/day, respectively.
As predicted, the trend described above is also seen on the monthly scale. The CC values of the CFSR and CMADS data ranged from 0.82 to 0.84, showing a good correlation with the GMS data. Moreover, the MAE and RMSE values of CFSR are many times higher than those of CMADS. The errors at the daily scale were eliminated by the aggregation to the monthly scale, causing the CC to become more balanced; however, this does not explain the big difference observed in the evaluation trends between CFSR and CMADS. The CFSR precipitation data is always overestimated across the basin, and the largest bias statistic indicator values were recognized with this dataset in evaluations by Mou Tan et al. [4] and Roth Lemann et al. [46]. Generally, CMADS precipitation data are slightly more accurate and agree relatively better than CFSR data with observations measured on the monthly scale.
As shown in Table 4, the analysis results of the seasonal statistical indicators obtained from the CFSR data show the largest mean errors, with MAE and RMSE values that are too large. At the same time, the PBIAS value of CMADS in the dry season is −40.9%, many times different from the rainy season value of −8.5%. This is related to the very low CMADS rainfall that occurs in the dry season; the lower rainfall value in the denominator of Equation (5) will cause the PBIAS value to be higher. Due to underestimating rainfall in the dry season, the rainfall in the CMADS data makes the difference between the two seasons much larger than the observed data. The rainfall ratios between the dry and rainy seasons for CMADS were 11% and 89%, respectively, while those for GMS were 18% and 82%, respectively.
3.2.2. Comparison in the Spatial Scale (Pixels)
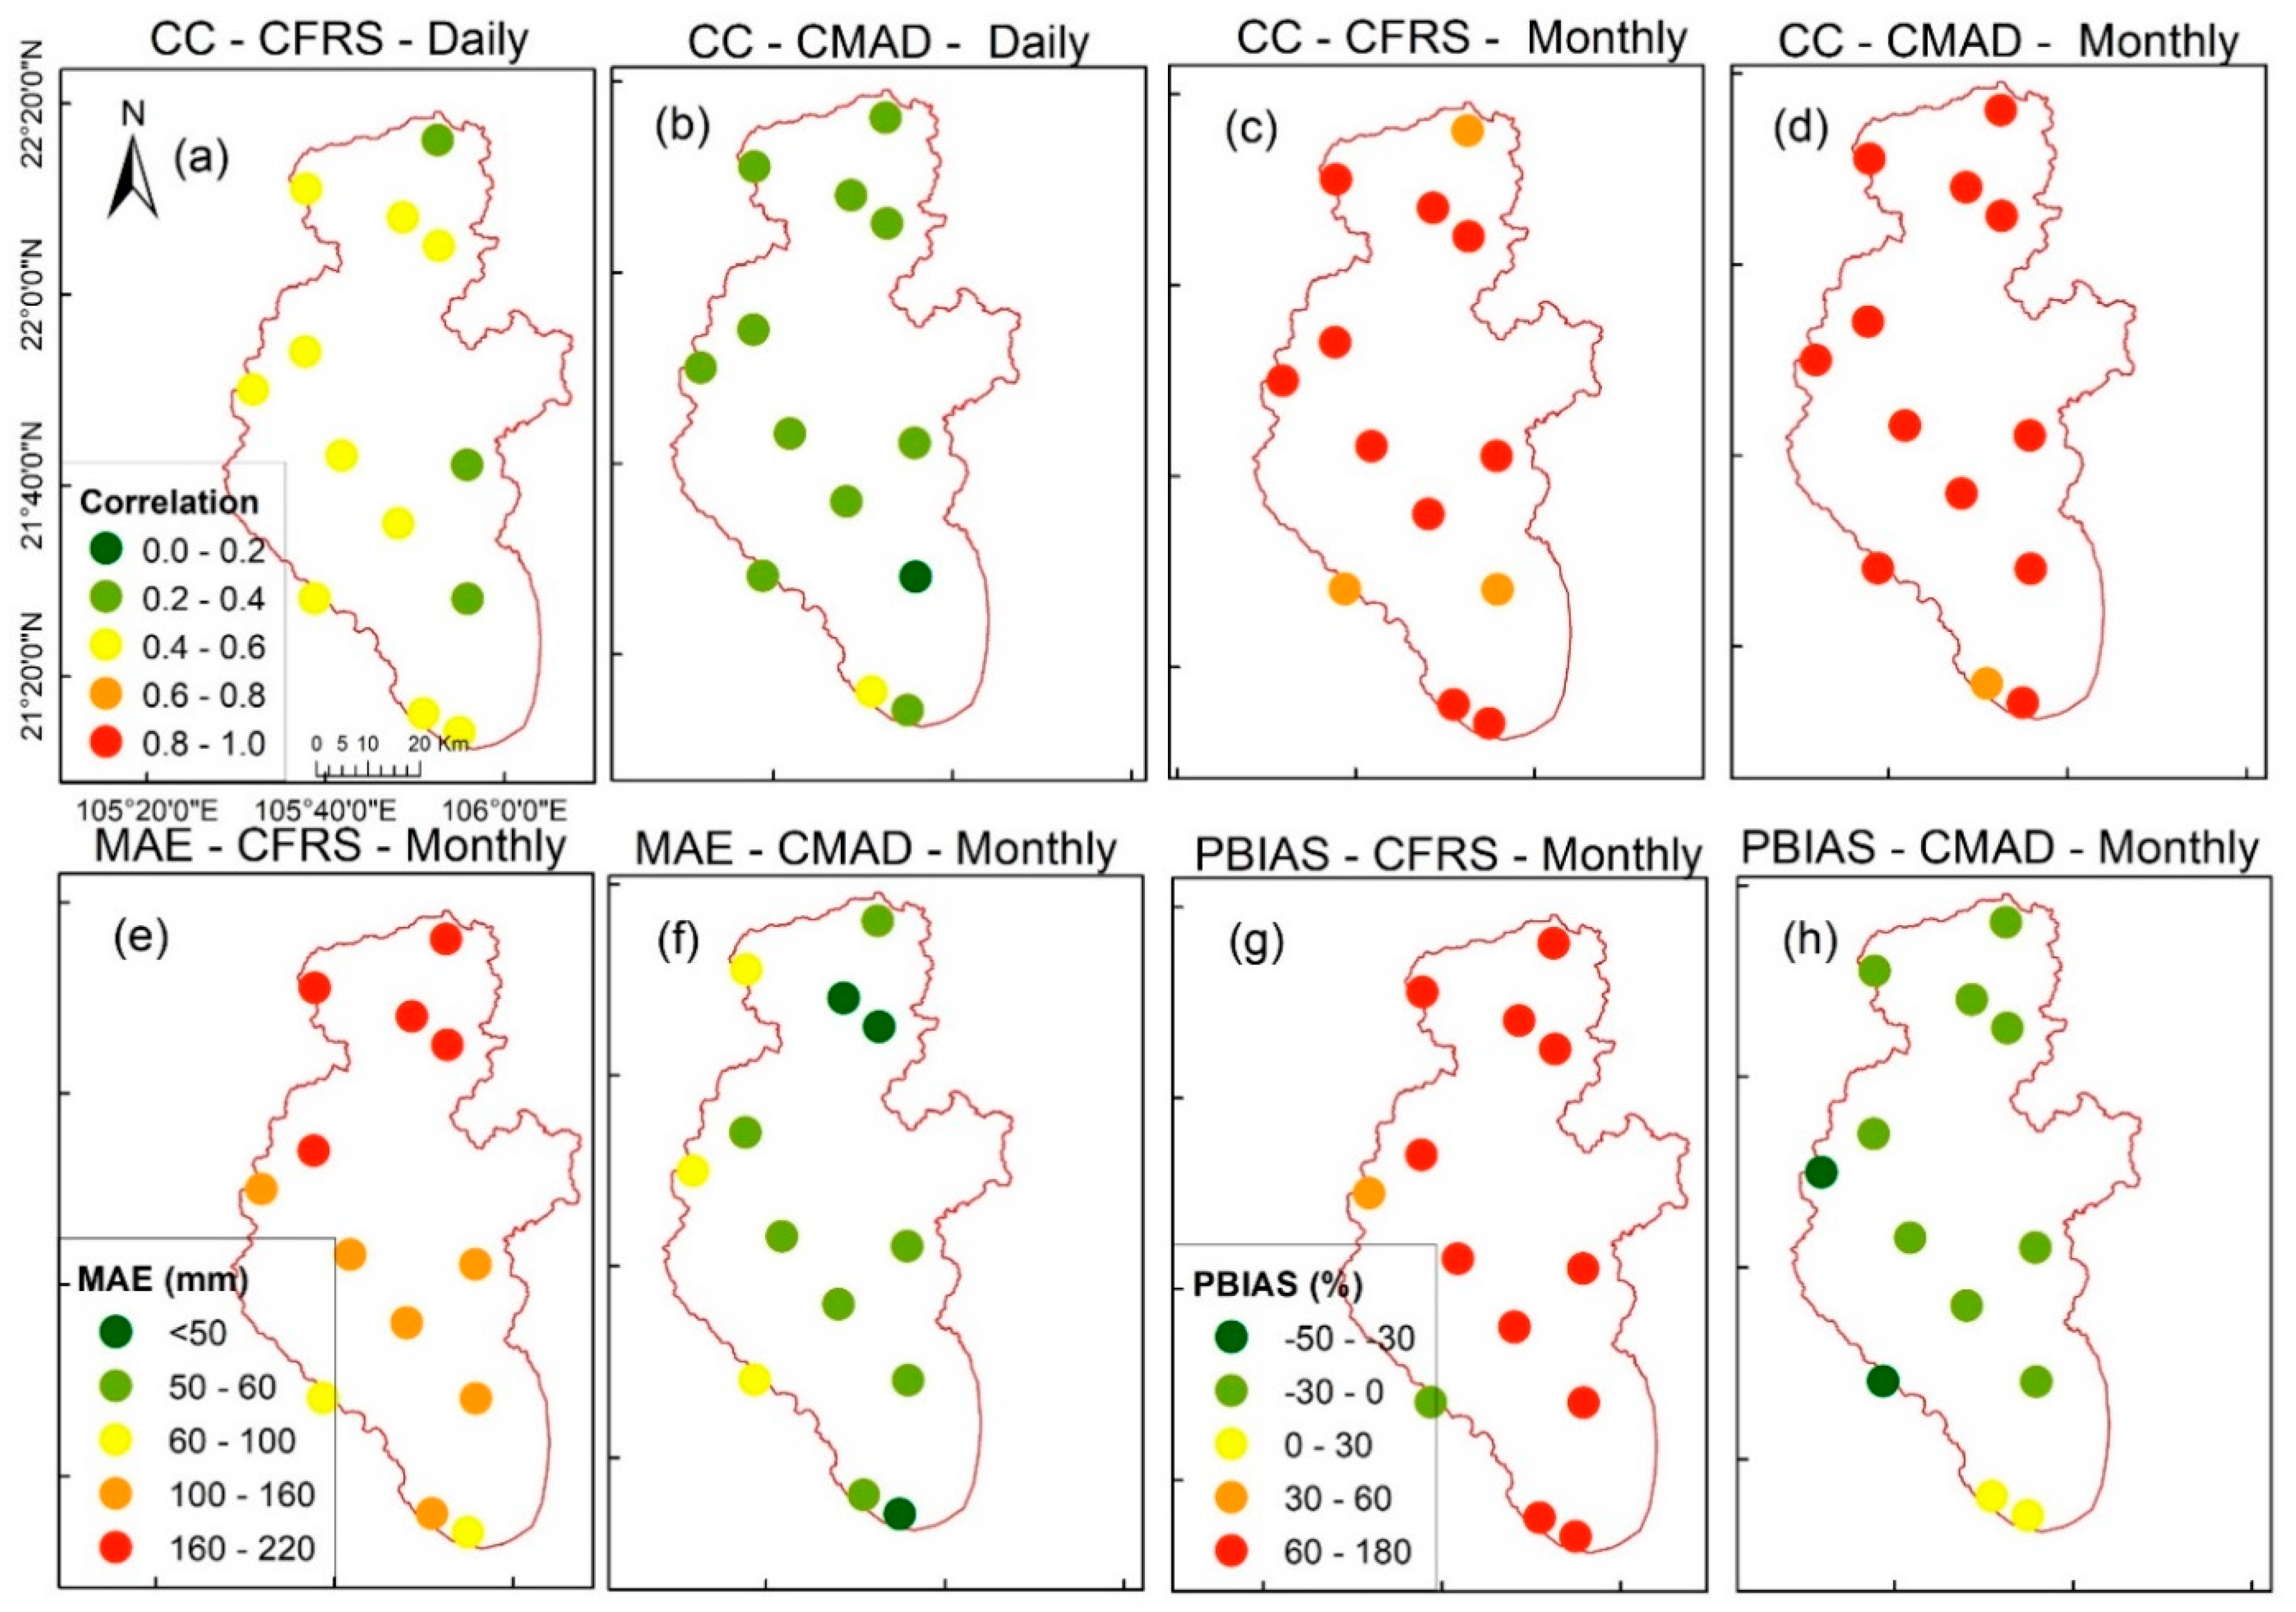
The distributions of the CC, MAE, and PBIAS values on a monthly scale at the pixel scale on the CRB are shown in Figure 3. Compared with the CC values obtained on the daily scale (ranging from 0.2 to 0.6), the values obtained on the monthly scale were significantly improved, with CC values of 0.82 for CFSR and 0.84 for CMADS (Figure 3a–d).
The spatial distribution of MAE shows the difference between CFSR and CMADS in the basin more clearly than the other indicators. As shown in Figure 3e, the largest MAE values were found in CFSR in the north and northwest (in altitudes ranging from 160 m to 300 m); the values then tended to decrease gradually to the south. Smaller MAE values were found at the western edge of the study region, such as at Tam Dao and Diem Mac stations; these are the locations with the highest rainfall rates, and as such their recorded data are balanced with the CFSR data; in the south of the study area, such as at Phuc Loc Phuong station, the MAE values may be related to the decline in rain forecasts by CFSR in the delta. In contrast, the CMADS-derived rainfall data achieved the highest MAE values in the western part of the river basin (ranging from 60 to 100 mm/month) (Figure 3f). Overall, the MAE values of the CMADS precipitation had less deviation than the GMS data, with an average value of 58.44 mm (ranging from 40.58 to 93.26 mm), because the rainfall rating of CMADS performs better on the daily scale than the observed data.
The PBIAS values obtained at the pixel scale in the basin, as shown in Figure 3g,h, provide more insight into the spatial variation in the GMPs. The CFSR rainfall data was overestimated over most of the basin, with a prevalence value between 60% and 150%. The PBIAS value of −2.3% obtained at Tam Dao station (at an elevation of ~900 m) shows that the CFSR precipitation data perform best in high mountainous terrain on the CRB (Figure 3g). In contrast, the rainfall data of CMADS tends to underestimate rainfall on the catchment scale, with an average PBIAS of −16%, but the data exhibit different states: rainfall is underestimated near the western edge of the study region (ranging from −23% to −38%), while the data have slightly higher ratings in the south of the region (~2% at Da Phuc and Phuc Loc Phuong stations) than those of the precipitation gauge data.
The analysis of the statistical indicators in the Cau River basin revealed the contradiction between the CMADS and CFSR rainfall data at the pixel scale, especially in the west. The amplification of precipitation in sheltered, mountainous terrain significantly increased the precipitation recorded at the GMS stations, so the statistics were more balanced with the CMADS than those of the CFSR data, for which the infrared sensors misjudged the effects of moist clouds on the mountaintops [7]. Second, considering medium-sized river basins such as the CRB, the CC value ratings obtained on the pixel scale at the daily and monthly temporal scales do not represent the characteristics of or variability in the gridded precipitation products. Moreover, the MAE and PBIAS values show the same trend, but these trends occur according to different parts of the spatial domain that are determined by terrain factors rather than latitudinal factors. This also shows that local knowledge and information are very useful in hydro-meteorological research to avoid too many misunderstandings occurring due to the characteristics of the utilized GMPs.
3.3. Evaluate the Precipitation Event Detection Accuracy
Using the value of 0.1 mm/day as the threshold for detecting rain/no rain [8,47], the POD, FAR, and CSI values were used to investigate the ability of the GMPs to detect rain. In terms of the CFSR data, the mean POD value of 0.98 (ranging from 0.94 to 0.99) shows the tendency of the data to capture nearly all daily precipitation events. At the same time, the average FAR value of 0.72 (ranging from 0.56 to 0.74) indicates that only nearly 30% of the rain events obtained from the CFSR data are accurate. In contrast, the CMADS data showed more harmony in their forecasts, with POD and FAR values of 0.61 and 0.2, respectively, consistent with a successful rain detection forecast of 43%. Overall, the CMADS precipitation data are more accurate when estimating precipitation events than the CFSR data, while the CFSR data excel at detection but require reliable validation with rain gauges.
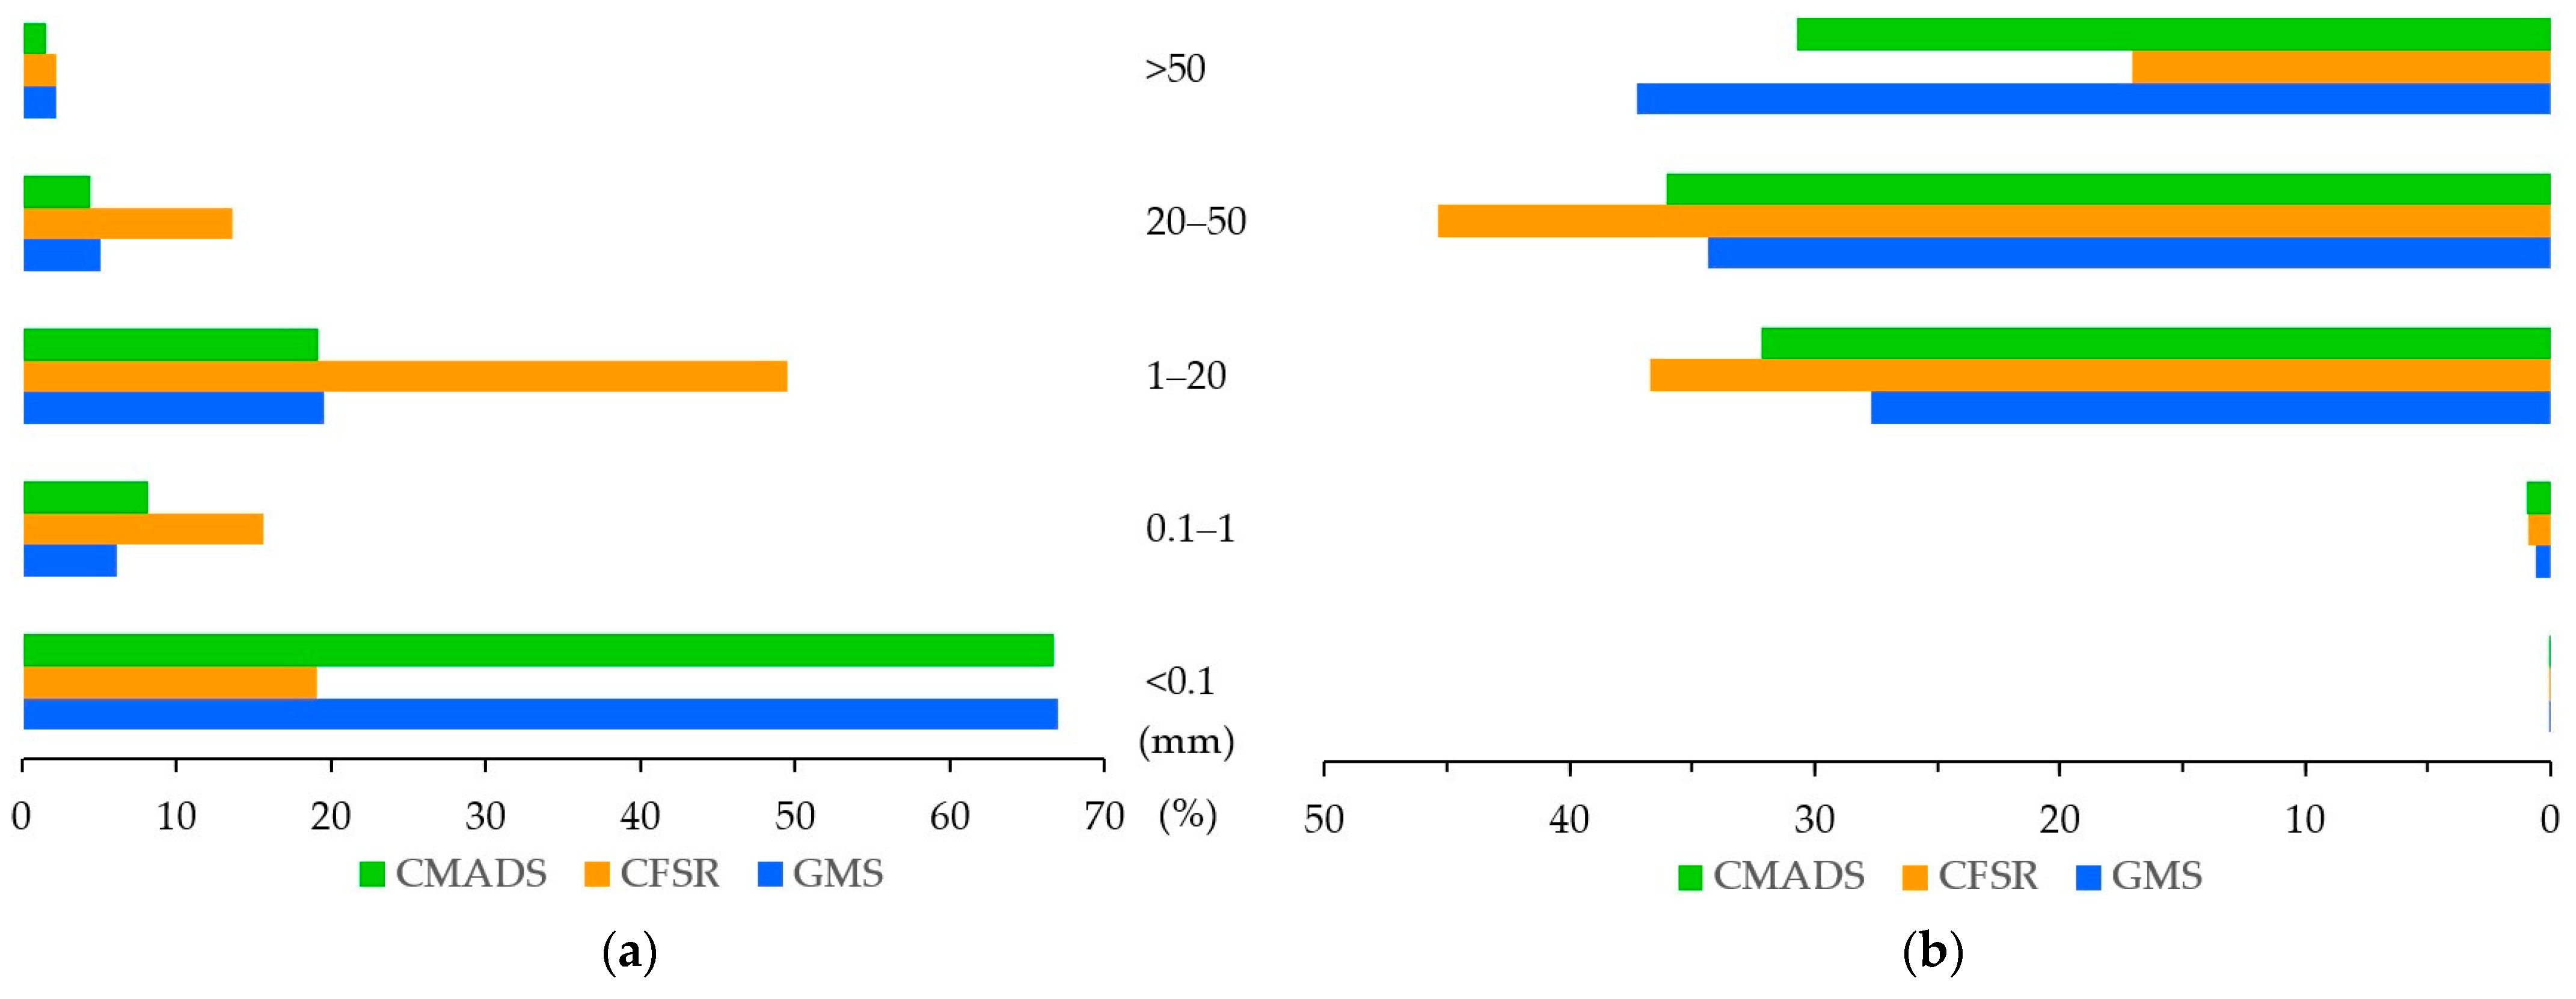
Figure 4 plots the occurrence frequencies and the contribution rates of the rainfall thresholds to the cumulative daily-scale rainfall from the CFSR, CMADS, and GMS data. Visually, we can see that the frequencies of the rain layers obtained from CMADS and GMS are similar. Specifically, the highest rate is observed at the threshold of 0.1 mm, accounting for over 66% (Figure 4a), indicating that the CMADS data may be suitable for detecting rain/no rain events. At other rainfall thresholds, although there is little difference, the rainfall threshold ratio observed between CMADS and GMS is still the smallest. Moreover, CFSR shows a clear difference in the drop to the 0.1mm rainfall threshold due to its association with excessively high POD and FAR values, leading to the omission of rain/no rain events. Compared with CMADS and GMS, CFSR tends to overestimate the light rain layer (1–20 mm), light rain (0.1–1 mm), and moderate rain (20–50 mm) at rates of 49.46%, 15.65%, 13.62%, respectively.
Despite the frequency of occurrence, but due to the insignificant rainfall, a threshold value < 0.1 mm limited the contribution to the total cumulative precipitation density (Figure 4b). The light rainfall (1–20 mm) and moderate rainfall (20–50 mm) layers of the CMADS and CFSR data are the most important contributors to the rainfall density, accounting for approximately 68% to 71% of the total rainfall. Simultaneously, in the GMPs, these rain layers all illustrate the same changes at higher ratings than that of the GMS data due to the large frequency of occurrence. Another degree is found in heavy rainfall (>50 mm) when estimates by CMADS, particularly by CFSR, tend to underestimate the actual rainfall. This precipitation layer has a small occurrence frequency (2.24%), but heavy rains contribute the greatest amount to the proportion of rain; approximately 37% of the rainfall over the CRB is related to typical summer showers as well as tropical storms brought to the area.
Thus, the analysis of the differences between the rain layers of GMPs and GMS data shows that the CMADS data have the same frequency as the rain gauge data at all thresholds. Moreover, CFSR has a disadvantage in capturing rain/no rain events but overestimated the occurrence of light rain (1–20 mm) and moderate rain (20–50 mm). At the same time, local calibration with on-site observations (rain gauge data or terrestrial radar) is needed to improve the performances of GMPs in heavy rainfall (>50 mm), as heavy rains play the most important role in the proportion of precipitation in the basin.
3.4. Evaluate the Ability to Capture Extreme Weather Events
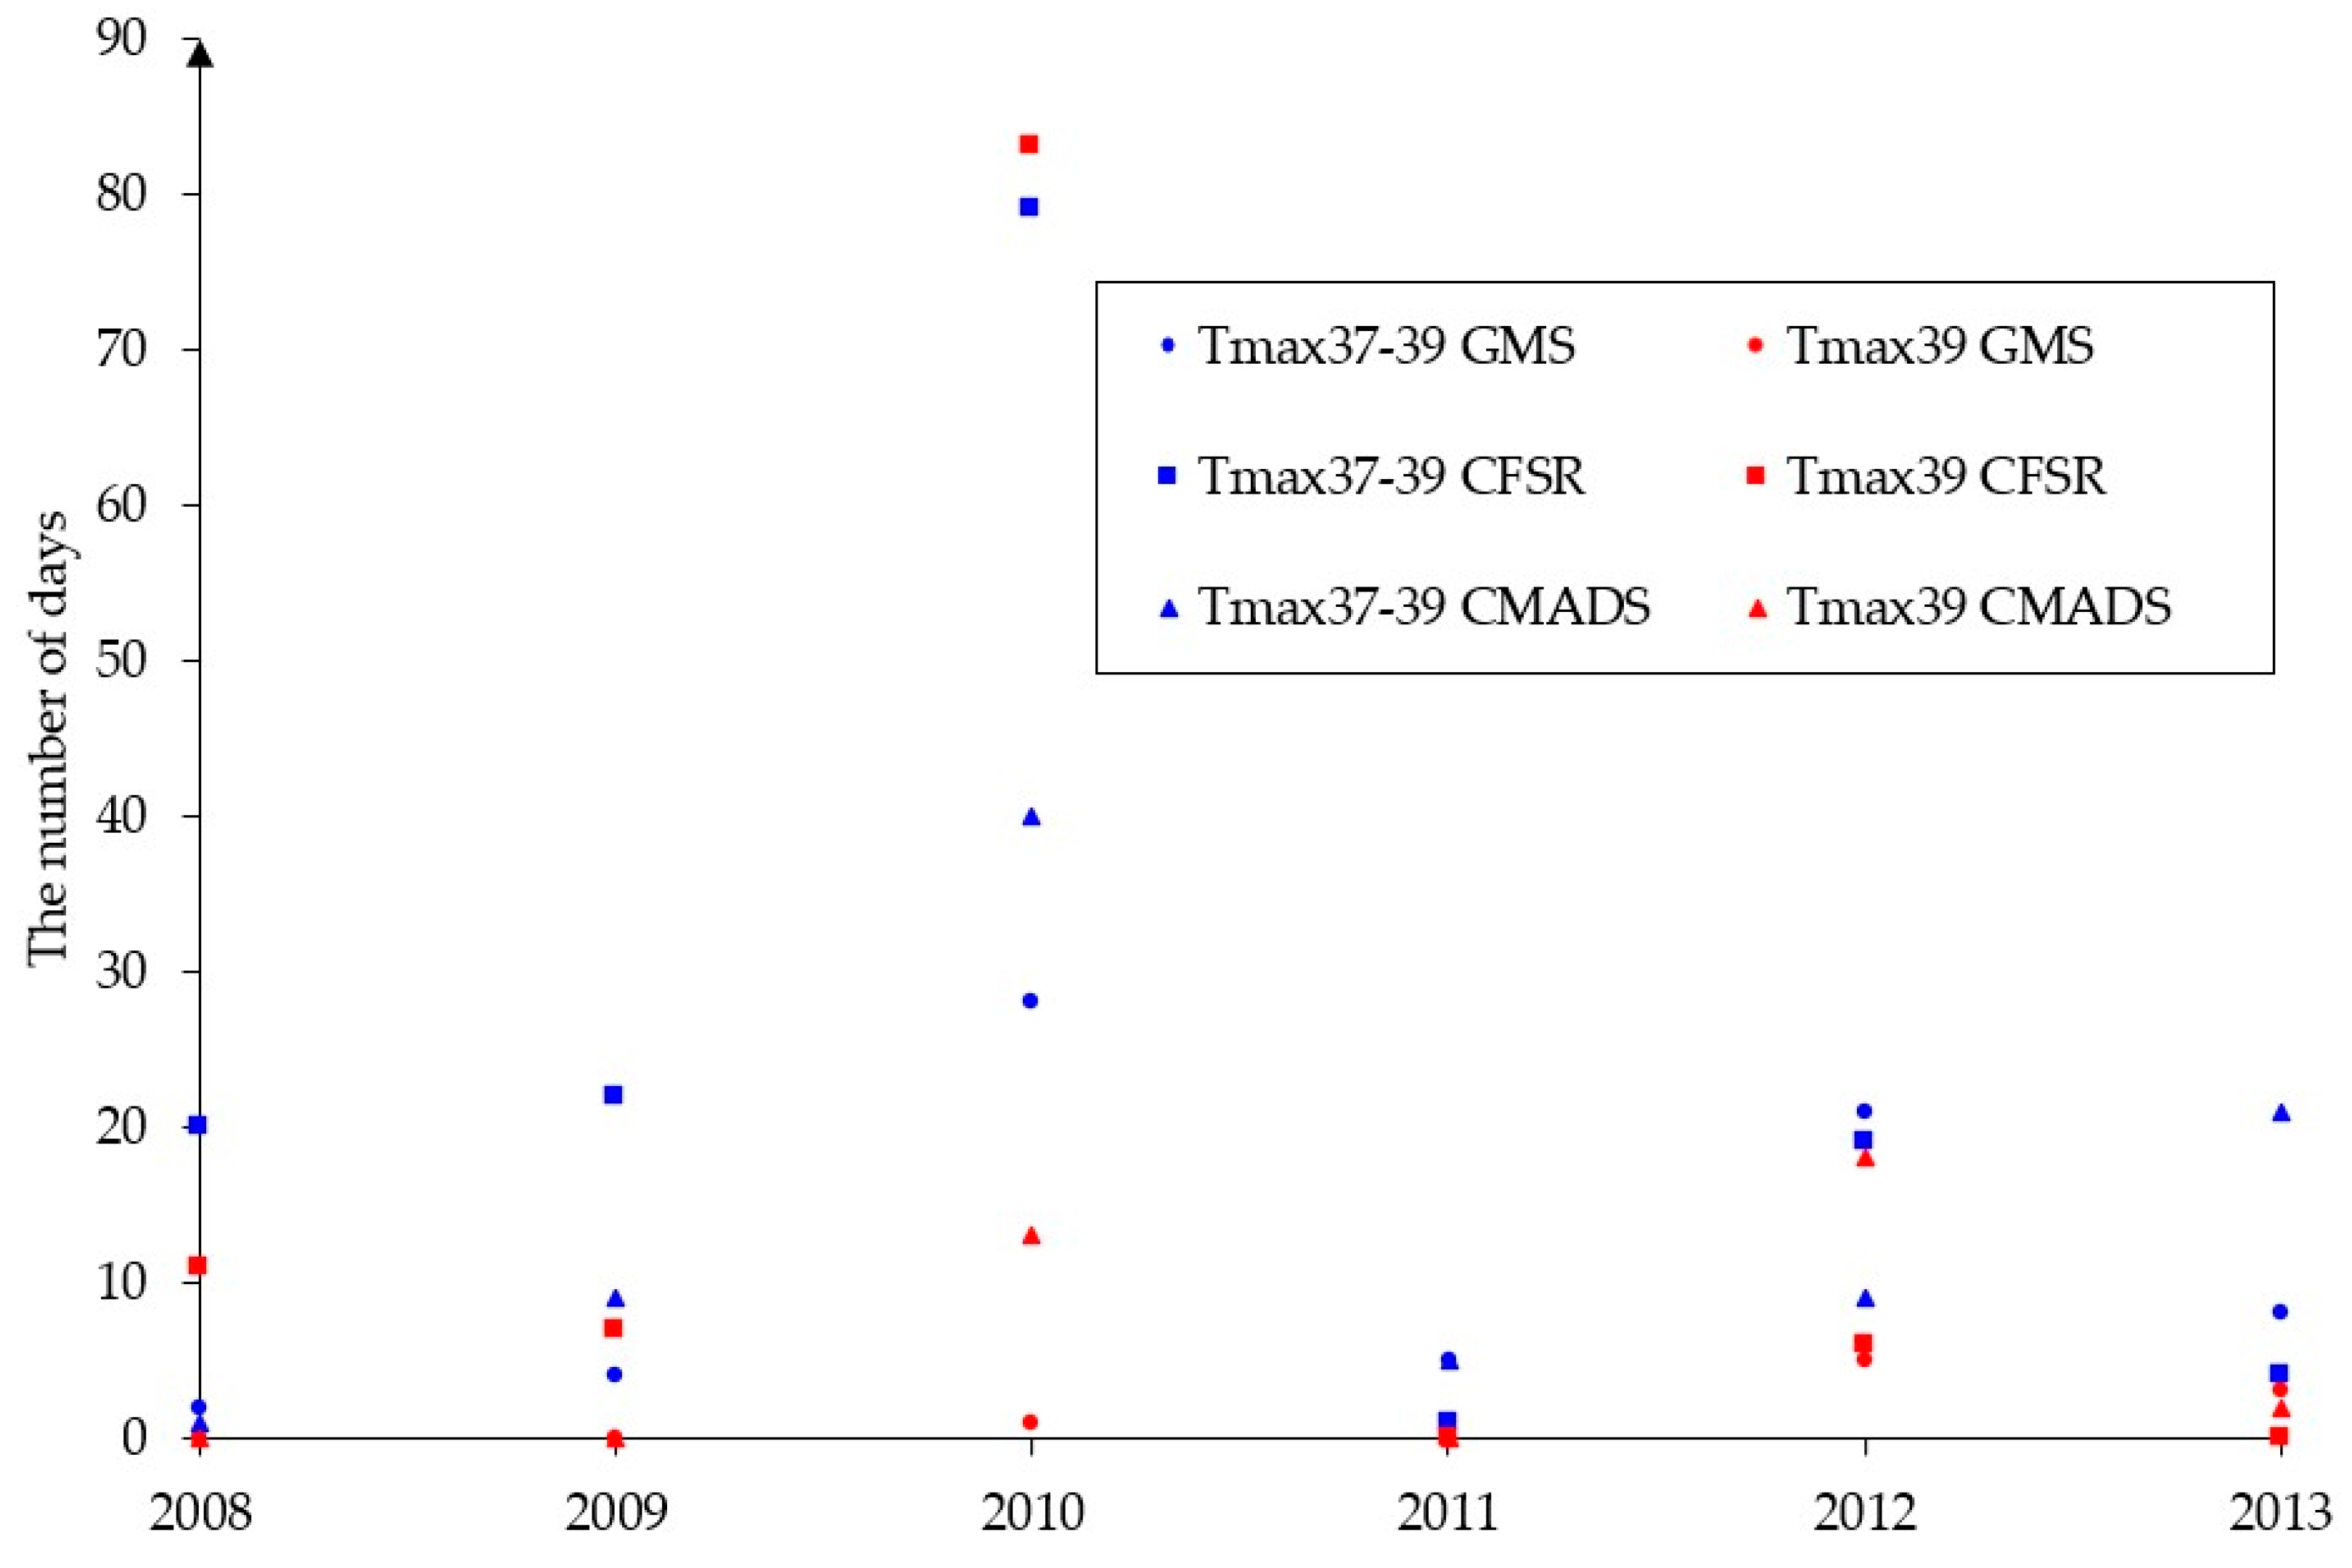
In this section, further studies on extreme weather events, such as temperature and precipitation events, on the CRB are conducted using the aggregated statistical results of GMPs data at meteorological stations at a daily scale over the period from 2008 to 2013. Specifically, the extreme events studied in the CRB included: (1) very cold events (Tav13–15 °C/day); (2) damaging cold events (Tav13 °C/day); (3) strong sun events (Tmx37–39 °C/day) and (4) scorching hot events (Tmx39 °C/day), and the specific results are listed in Table 5. For rainfall, the indicators R10 mm/day, R50 mm/day, and R100 mm/day were selected in this study.
The assessment results of the ability of the datasets to collect extreme rain layers were calculated using the average value of the corresponding points/stations in the period 2008–2013. The CFSR rainfall data contained 560 days of R10 mm, which is higher than that of the GMS data (216 days) and the CMADS data (190 days) obtained at the polymerization station. However, for R50 mm events, the GMS and CFSR precipitation data show 40 and 44 days, respectively, both of which are significantly more than the 29 days observed in the CMADS data. The total R100 days observed in the GMS precipitation data was 9 days, while the totals were 5 days for the CFSR and CMADS data. Thus, the CMADS rain data have a much lower rain detection rate than the rest of the heavy rain layers (>50 mm/day), while CMADS and CFSR have much lower detection probabilities than the GMS for extreme rain events (>100 mm/day).
Regarding Tav13–15 °C/day and Tav13 °C/day, these data are not available for CFSR, and as such only CMADS is compared with GMS. The statistics listed in Table 5 show that both of these datasets have similar changes, with the number of days decreasing from the high-latitude areas and hilly areas (Bac Kan and Dinh Hoa stations) to the regions with lower latitude and flat terrain (Thai Nguyen and Bac Ninh stations). The CMADS data are slightly underestimated compared to the GMS data in terms of cold days (except Tav13–15 °C at Thai Nguyen station) with the difference being over 11%. Notably, the total number of days with temperatures below 15 °C in the CMADS data are quite large (17.2 days/year), showing the strong influence of the northeast monsoons on the CRB. The appearance of cold airwaves not only lowers the temperature of the area (from December to February, the average temperature is below 20 °C) but also drastically decreases the humidity and precipitation during this period. This is a satisfactory explanation for the surge observed in the PBIAS values in the dry season and explains the difference in the rainfall contribution between the two seasons of the CMADS data.
The statistics compiled from the temperature stations also show that the CFSR and CMADS data outperformed at Tmx37–39 °C/day and Tmx39 °C/day. The largest difference was observed in the CFSR temperature data representing the peak likelihood compared to the GMS and CMADS data, which is consistent with the assessment results for temperature obtained from testing with box plots (see Figure 2). This discrepancy may be related to excessive misunderstandings about the buffer surfaces of GMP datasets. For example, at Dinh Hoa station, the number of days with Tmx37–39 °C and Tmx39 °C is very high, possibly due to the widely captured CFSR data in low mountainous areas in the windless part of summer. Moreover, Bac Ninh station is located in the delta area, with many industrial and construction activities, so its maximum temperatures may be incorrectly calculated for the buffer surface.
The distributions of the maximum temperatures recorded over the studied years (see Figure 5), from 2008 to 2013, also show that the CFSR data is outstanding in the number of days when hot weather occurs (Tmx > 37 °C). Notably, an unusual increase in hot days was found in all three datasets in 2010 (except for in the GMS data at Tmx39 °C/day). According to our collected information, from May to July of 2010, northern Vietnam experienced the longest heatwave in 27 years with many extremely hot days. This shows that while there are similar error characteristics if they can be “calibrated with the observed ground temperature”, the GMPs can provide an additional viable alternative to predicting and capturing extreme events in the CRB at various temporal and spatial scales.
3.5. Flow in the Cau River Basin
3.5.1. Calibration and Sensitivity Analysis of Parameters
The parameters affecting the sensitivity analysis and calibration were partly inherited from previous studies on the CRB [33,34]. The SWAT-CUP software and the SUFI-2 algorithm were used to calibrate the parameters in the CFSR, CMADS, and GMS simulations [22]. Accordingly, calibrations were performed simultaneously on SWAT-CUP and manually, with 1000 model runs performed for each iteration to obtain optimal parameter values. At the same time, due to the uncertainty of the meteorological data (especially the precipitation data), the parameter values and sensitivities may vary among each model [22]. Therefore, in this study, parameterization was performed in the SWAT model on the CRB using the CMADS, CFSR, and GMS data, and the results are listed in Table 6. In all simulations, CFSR, CMADS, and GMS data from 2008 were set to warm up the model, the calibration period was 2009–2011, and the validation period was 2012–2013. The calibration and validation of each simulation were conducted independently at daily and monthly time steps.
3.5.2. Flow Simulation in the CRB
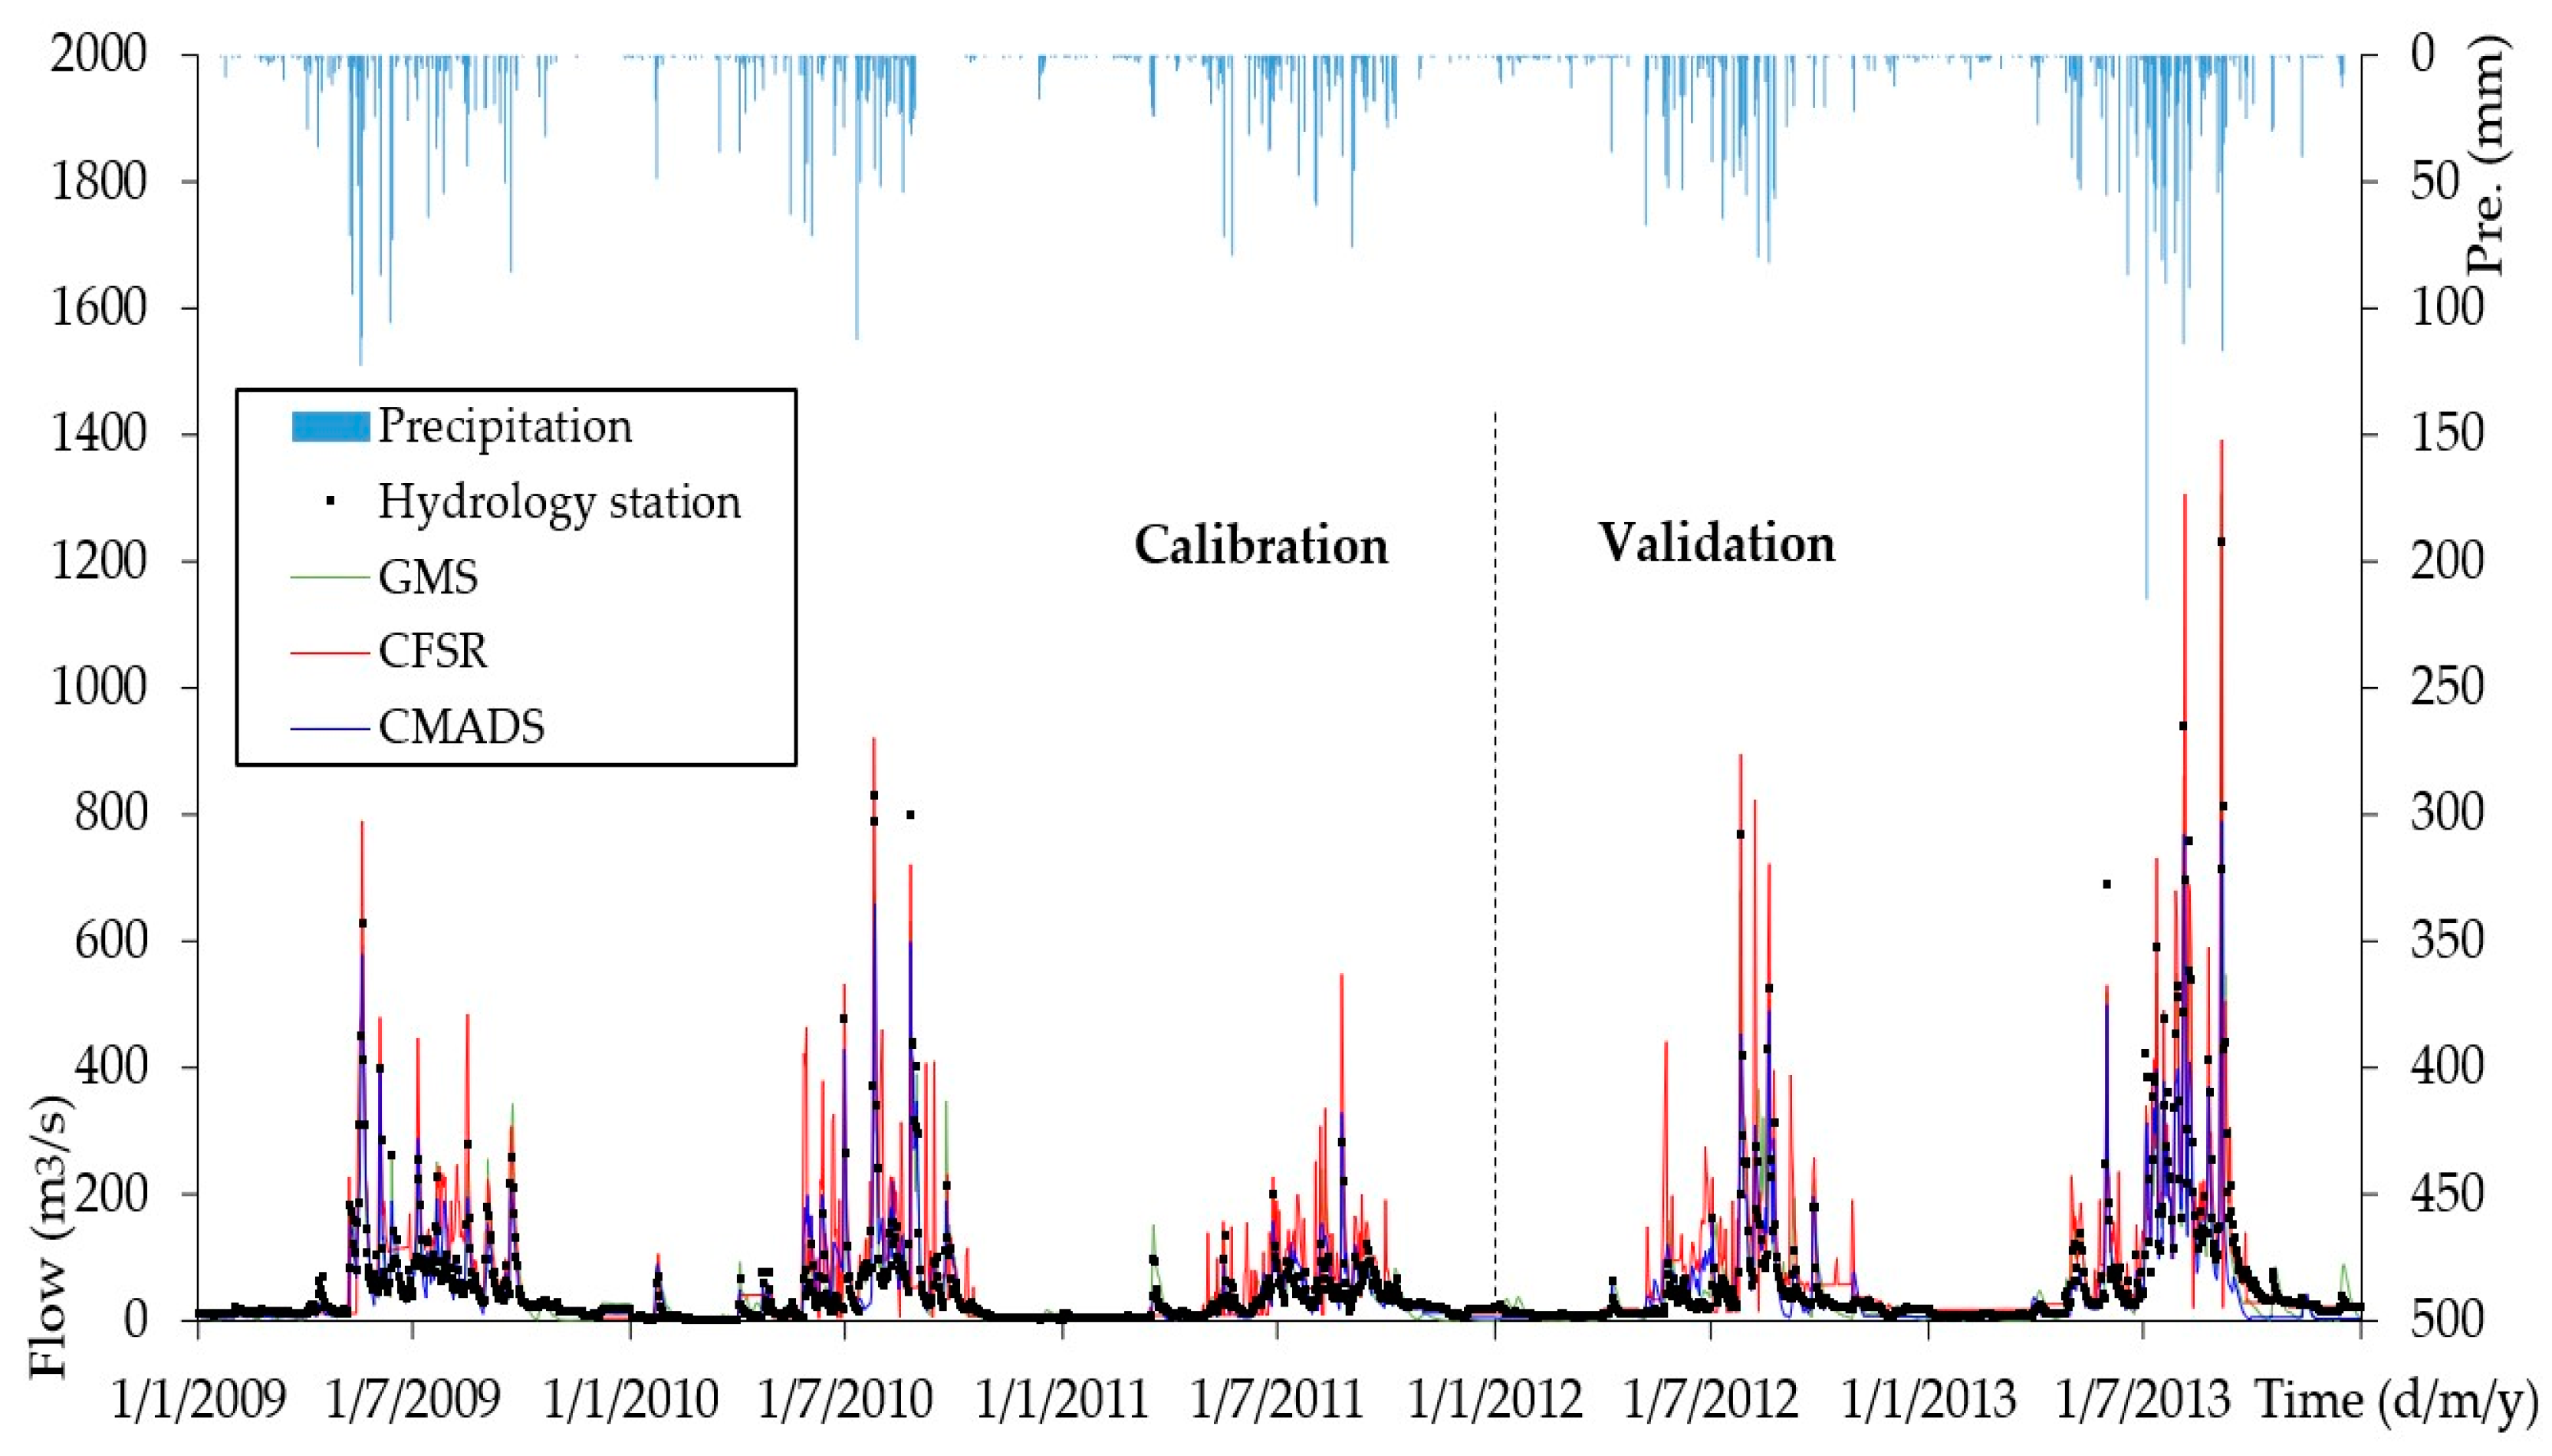
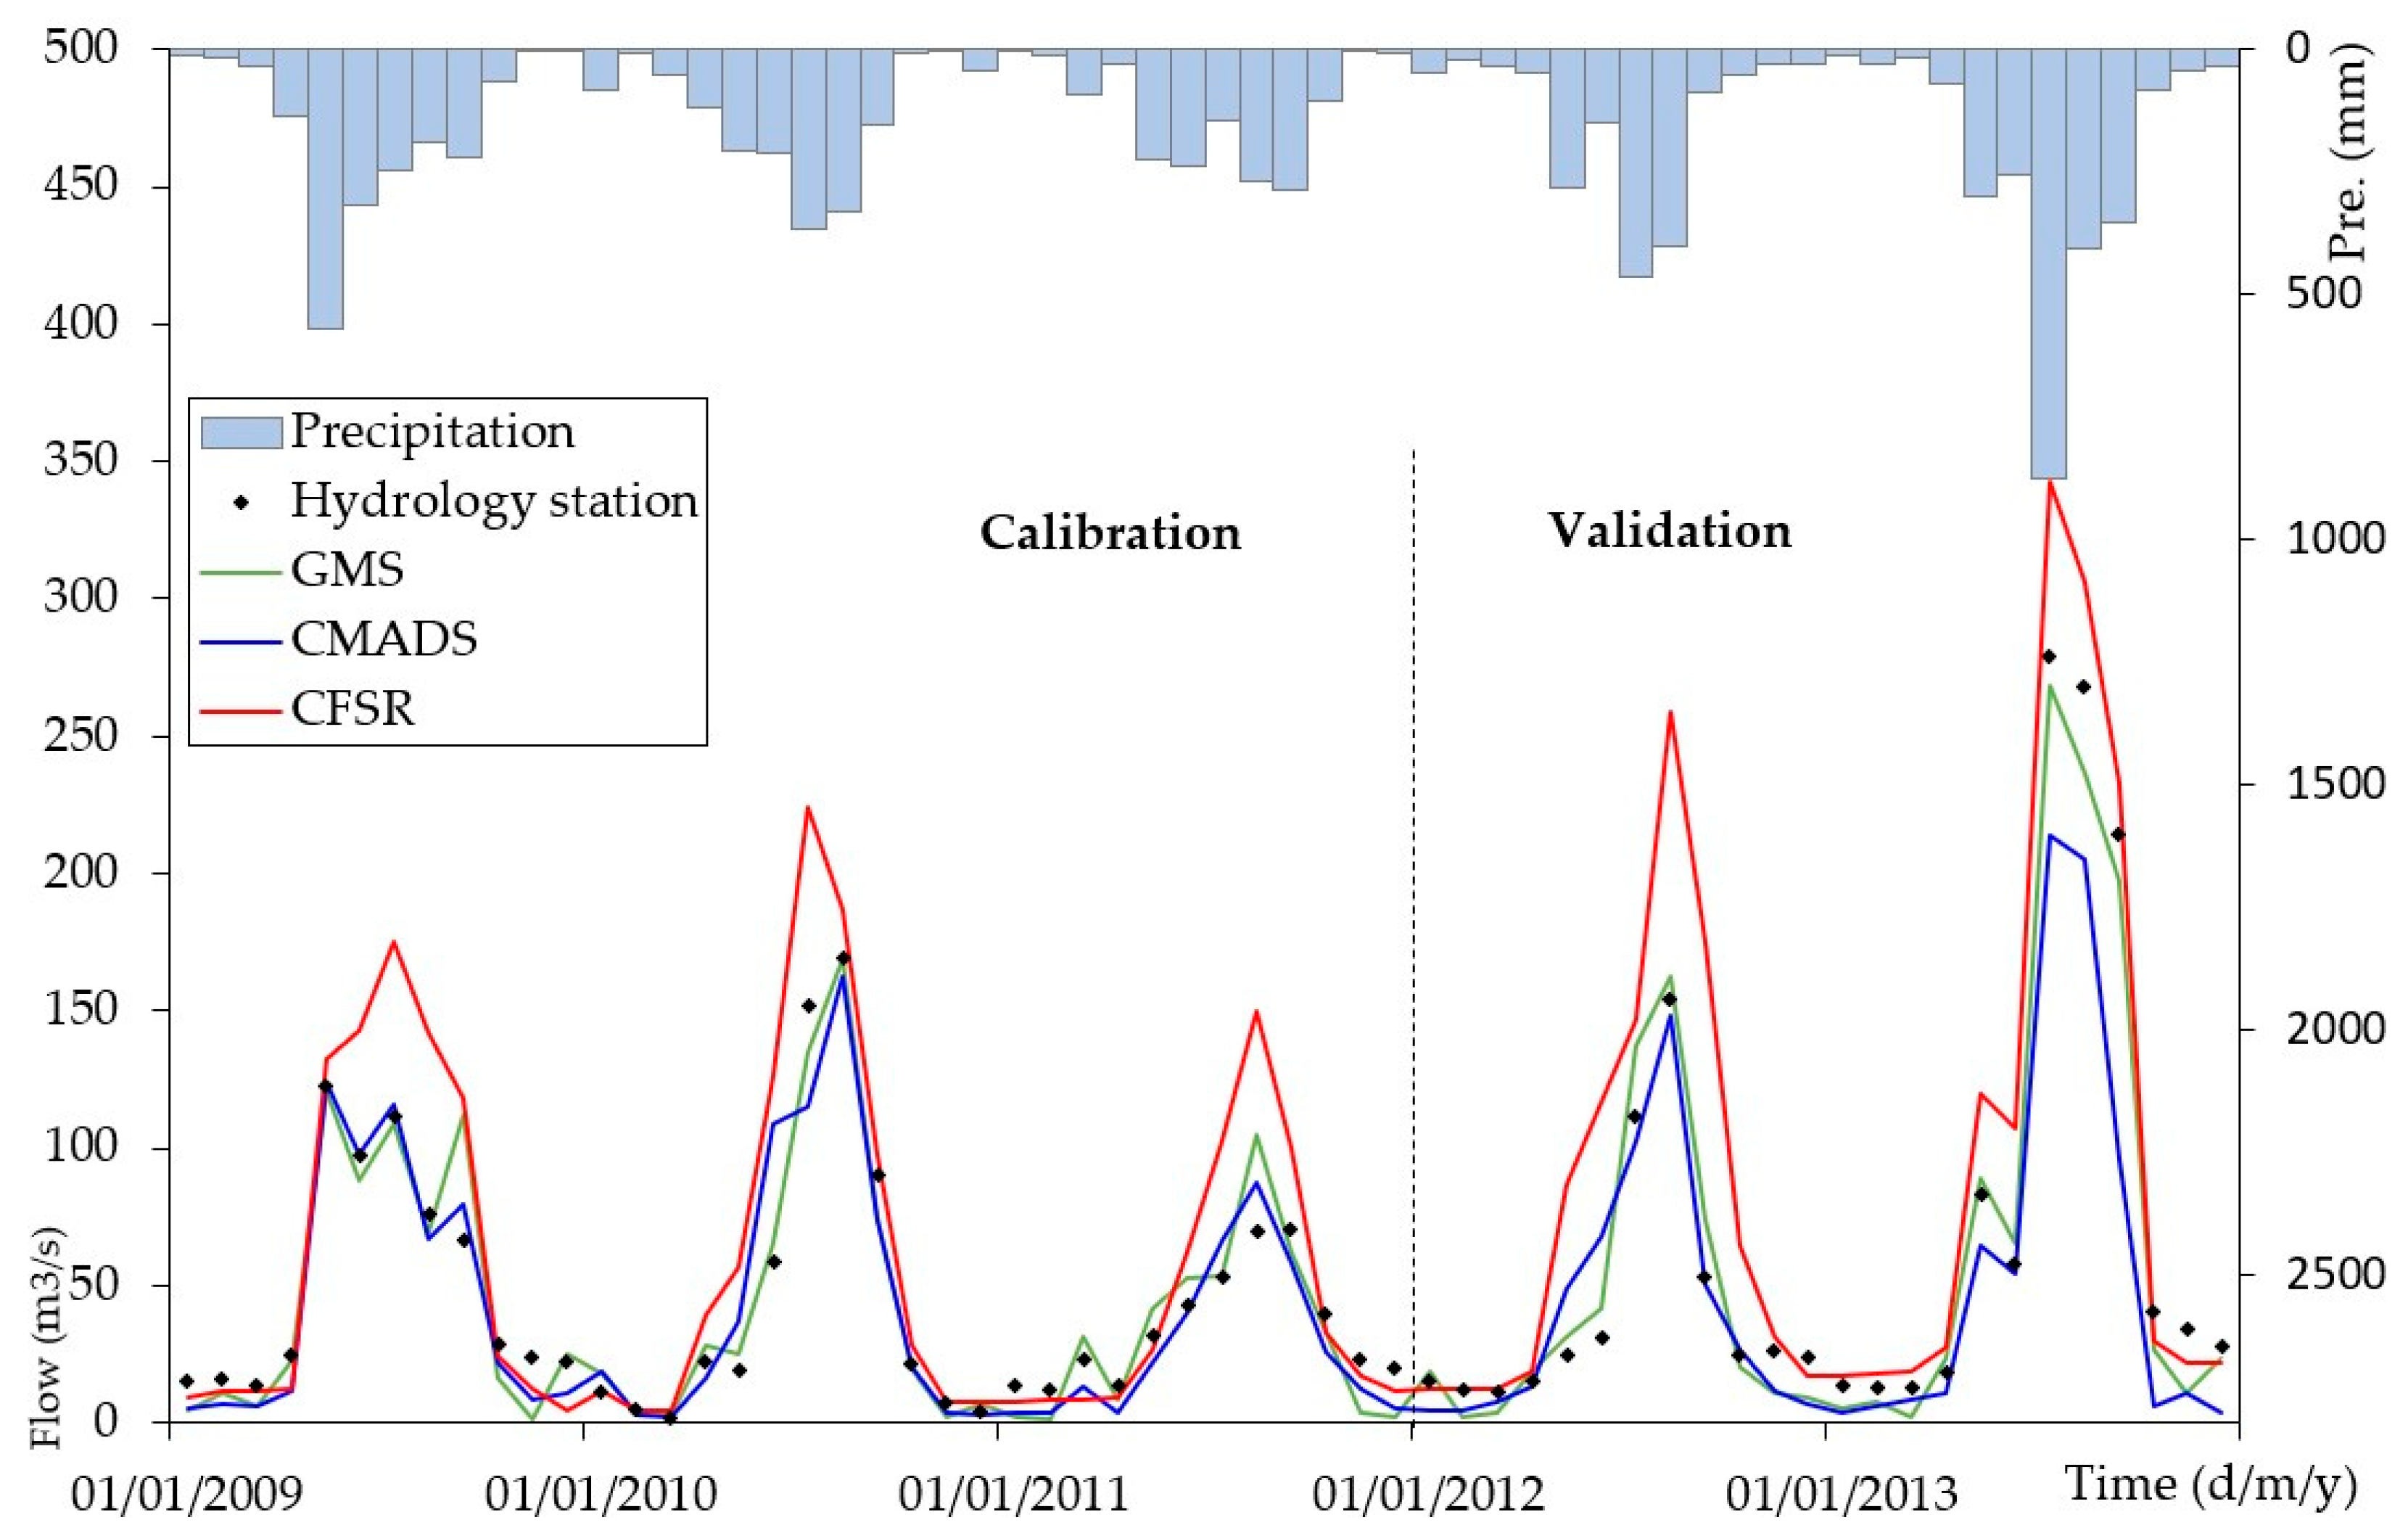
Table 7 summarizes the statistical indicators (R2, NSE and PBIAS) used for the SWAT simulations based on data from GMS, CFSR and CMADS for the 2009–2013 period. Overall, the SWAT model based on the GMS data is best suited during the calibration and validation periods at both daily and monthly scales. The simulated flow reproduced by GMS data at Gia Bay station is “good”, with NSE > 0.79 and R2 > 0.68. The simulations performed using the CMADS-driven model tended to underestimate the observed flow, with PBIAS values varying from −16.19 to −19.35%, but with R2 > 0.76 and NSE > 0.78; thus, this dataset was also identified as “satisfactory” on a monthly scale. Finally, the CFSR data led to a relatively appreciate assessment of the observed flows during the simulation period (as indicated by a high PBIAS value of >41.81%) and a tendency to capture peak flows (Figure 6 and Figure 7). Generally, the CFSR control model is not suitable for flow simulations over the CRB basin, with R2 and NSE values that are “unsatisfactory” based on the given criteria [44].
In the CRB, rainfall is the major source of streamflow, so the accuracy of these data will greatly affect the runoff simulation results. The above results showed that the rainfall data obtained from GMS and CMADS reached agreement better than the agreement between CFSR and GMS; thus the flow simulation performed by GMS- and CMADS-driven models also showed better performance, with high R2 and NSE values, and the absolute PBIAS value was smaller than that of the CFSR-driven simulation. Research by Mou Tan et al. showed that integrating temperature data from CFRS with the precipitation data of the other GMPs did not cause any difference compared to conventional simulations [34]. At the same time, the published results of Mou Tan et al. [4], D. N. Khoi et al. [48], Roth et al. [46], and Bressiani et al. [31] showed that the CFSR data had much lower, or even unacceptable, performances compared to other GMP products, mainly because these data overestimate actual precipitation values.
It is possible that the CFSR precipitation data are more suitable and have more uniform and dense grid point densities in temperate, subtropical climates, such as in the United States and China, as reported by Fuka et al. [23], Meng et al. [30], and Lu et al. [2], while these data have not been used extensively in Southeast Asia or Vietnam. It is quite difficult for estimated products such as CFSR to accurately capture climatic conditions in areas with very complex climates such as northern Vietnam (a tropical monsoon climate with cold winters). Furthermore, differences in catchment areas and topographies (including elevations and directions of ridges) also lead to changes in the model algorithm, interpolation, and parameters [49,50]. The CMADS dataset is integrated with CMROPH data and collected from automatic measuring stations in the region for reverse interpolation, so it can be widely used and increase its accuracy in Chinese territories [2,3,30,51]. Compared to published studies, we find that the performance of these data needs to be confirmed in areas within the region of coverage. In general, the analytical results show that the CMADS control model will have good performance if the input data are confirmed with an observation gauge.
4. Conclusions
This study is the first to refer to the role of temperature in extreme events based on regulations in Vietnam. The temperature verification in the CRB shows that CFSR and CMADS can be representative as ground temperature measurement stations in meteorological and hydrological studies. Temperature events such as very cold, damaging cold, strong sun, and scorching hot events affect the rainfall distribution and the inputs to the flow simulations. Moreover, the proposed study of the R100 mm/day rain layer is suitable for humid climate conditions in the tropics, such as the climatic conditions in the study area, and can be reliably used in other basins with similar conditions. The usefulness and suitability of the climate reanalysis products were evaluated in this study. Both the CMADS and CFSR temperature datasets performed well in comparison to the GMS data. Therefore, the CMADS and CFSR temperature data can be reliably used in areas with low numbers of observation stations. The verification of rainfall in the GMPs, as well as the flow simulation results of the SWAT model on the CRB, show that the CMADS data obtain more suitable results than the CFSR data; moreover, it is recommended that the overall CFSR data should be evaluated before they are applied in other hydrological research in which the conditions are similar. The advantages and disadvantages of the CFSR and CMADS data suggest that local knowledge/information is also very useful in hydro-meteorological research to avoid excessive misunderstandings of gridded climate products.
In our opinion, the results obtained in this study should not be conceded as a generalized imposition but rather can be seen as an attempt to explore the potential of reanalysis data in terms of their performances that are, as of yet, unproven due to limited, short duration, and heterogeneous observational data. Our tentative studies will be further expanded with other gridded climate products already recognized in Vietnam, and the spatial variations in the water balance components and the effects of climate change on flow changes in the CRB will be calculated.
Author Contributions
Software-investigation-analysis, P.P. and N.X.T.; writing-original draft preparation, D.M.D. and D.V.B.; writing-review and editing, J.L., X.C., D.M.D., S.A.K. and D.V.B.; supervision, J.L. and X.C. This paper was completed under the efforts of all authors. All authors have read and agreed to the published version of the manuscript.
Funding
This research was funded by the National Key Research and Development Program (2018YFC1506506), the Frontier Project of the Applied Foundation of Wuhan (2019020701011502), the Key Research and Development Program of Jiangxi Province (20201BBG71002), the Natural Science Foundation of Hubei Province (2019CFB736), the LIESMARS Special Research Funding, and the Asia-Pacific Network for Global Change Research under project reference number CRRP2020-09MY-Kantoush.
Institutional Review Board Statement
Not applicable.
Informed Consent Statement
Not applicable.
Data Availability Statement
Data is contained within the article.
Conflicts of Interest
The authors declare no conflict of interest.
References
- Aghakouchak, A.; Behrangi, A.; Sorooshian, S.; Hsu, K.; Amitai, E. Evaluation of satellite-retrieved extreme precipitation rates across the central United States. J. Geophys. Res. Atmos. 2011, 116, D02115. [Google Scholar] [CrossRef]
- Lu, J.; Liu, Z.; Liu, W.; Chen, X.; Zhang, L. Assessment of CFSR and CMADS Weather Data for Capturing Extreme Hydrologic Events in the Fuhe River Basin of the Poyang Lake. J. Am. Water Resour. Assoc. 2020, 56, 917–934. [Google Scholar] [CrossRef]
- Zhang, L.; Lu, J.; Chen, X.; Sauvage, S.; Sanchez Perez, J.-M. Stream flow simulation and verification in ungauged zones by coupling hydrological and hydrodynamic models: A case study of the Poyang Lake ungauged zone. Hydrol. Earth Syst. Sci. Discuss. 2017, 21, 5847–5861. [Google Scholar] [CrossRef] [Green Version]
- Tan, M.L.; Gassman, P.W.; Cracknell, A.P. Assessment of three long-term gridded climate products for hydro-climatic simulations in tropical river basins. Water 2017, 9, 229. [Google Scholar] [CrossRef] [Green Version]
- Lu, J.; Cui, X.; Chen, X.; Sauvage, S.; Perez, J.M.S. Evaluation of hydrological response to extreme climate variability using SWAT model: Application to the Fuhe basin of Poyang Lake Watershed, China. Hydrol. Res. 2017, 48, 1730–1744. [Google Scholar] [CrossRef] [Green Version]
- Steiner, M.; Bell, T.L.; Zhang, Y.; Wood, E.F. Comparison of two methods for estimating the sampling-related uncertainty of satellite rainfall averages based on a large radar dataset. J. Clim. 2003, 16, 3759–3778. [Google Scholar] [CrossRef] [Green Version]
- Yilmaz, K.K.; Hogue, T.S.; Hsu, K.L.; Sorooshian, S.; Gupta, H.V.; Wagener, T. Intercomparison of rain gauge, radar, and satellite-based precipitation estimates with emphasis on hydrologic forecasting. J. Hydrometeorol. 2005, 6, 497–517. [Google Scholar] [CrossRef]
- Dinh, K.D.; Anh, T.N.; Nguyen, N.Y.; Bui, D.D.; Srinivasan, R. Evaluation of grid-based rainfall products and water balances over the Mekong river Basin. Remote Sens. 2020, 12, 1858. [Google Scholar] [CrossRef]
- Tian, Y.; Peters-Lidard, C.D.; Adler, R.F.; Kubota, T.; Ushio, T. Evaluation of GSMaP precipitation estimates over the contiguous United States. J. Hydrometeorol. 2010, 11, 566–574. [Google Scholar] [CrossRef]
- Anagnostou, M.N.; Nikolopoulos, E.I.; Kalogiros, J.; Anagnostou, E.N.; Marra, F.; Mair, E.; Bertoldi, G.; Tappeiner, U.; Borga, M. Advancing precipitation estimation and streamflow simulations in complex terrain with X-Band dual-polarization radar observations. Remote Sens. 2018, 10, 1258. [Google Scholar] [CrossRef] [Green Version]
- Huffman, G.J.; Adler, R.F.; Morrissey, M.M.; Bolvin, D.T.; Curtis, S.; Joyce, R.; McGavock, B.; Susskind, J. Global precipitation at one-degree daily resolution from multisatellite observations. J. Hydrometeorol. 2001, 2, 36–50. [Google Scholar] [CrossRef] [Green Version]
- Lu, J.; Chen, X.; Zhang, L.; Sauvage, S.; Sánchez-Pérez, J.-M. Water balance assessment of an ungauged area in Poyang Lake watershed using a spatially distributed runoff coefficient model. J. Hydroinform. 2018, 20, 1009–1024. [Google Scholar] [CrossRef]
- Vu, M.T.; Raghavan, S.V.; Liong, S.Y. SWAT use of gridded observations for simulating runoff—A Vietnam river basin study. Hydrol. Earth Syst. Sci. 2012, 16, 2801–2811. [Google Scholar] [CrossRef] [Green Version]
- Dinku, T.; Chidzambwa, S.; Ceccato, P.; Connor, S.J.; Ropelewski, C.F. Validation of high-resolution satellite rainfall products over complex terrain. Int. J. Remote Sens. 2008, 29, 4097–4110. [Google Scholar] [CrossRef]
- Tan, M.L.; Ibrahim, A.L.; Duan, Z.; Cracknell, A.P.; Chaplot, V. Evaluation of six high-resolution satellite and ground-based precipitation products over Malaysia. Remote Sens. 2015, 7, 1504–1528. [Google Scholar] [CrossRef] [Green Version]
- Bao, X.; Zhang, F. Evaluation of NCEP-CFSR, NCEP-NCAR, ERA-Interim, and ERA-40 reanalysis datasets against independent sounding observations over the Tibetan Plateau. J. Clim. 2013, 26, 206–214. [Google Scholar] [CrossRef] [Green Version]
- Mashingia, F.; Mtalo, F.; Bruen, M. Validation of remotely sensed rainfall over major climatic regions in Northeast Tanzania. Phys. Chem. Earth 2014, 67–69, 55–63. [Google Scholar] [CrossRef]
- Srivastava, A.; Sahoo, B.; Raghuwanshi, N.S.; Singh, R. Evaluation of Variable-Infiltration Capacity Model and MODIS-Terra Satellite-Derived Grid-Scale Evapotranspiration Estimates in a River Basin with Tropical Monsoon-Type Climatology. J. Irrig. Drain. Eng. 2017, 143, 04017028. [Google Scholar] [CrossRef] [Green Version]
- Srivastava, A.; Deb, P.; Kumari, N. Multi-Model Approach to Assess the Dynamics of Hydrologic Components in a Tropical Ecosystem. Water Resour. Manag. 2020, 34, 327–341. [Google Scholar] [CrossRef]
- Paul, P.K.; Kumari, N.; Panigrahi, N.; Mishra, A.; Singh, R. Implementation of cell-to-cell routing scheme in a large scale conceptual hydrological model. Environ. Model. Softw. 2018, 101, 23–33. [Google Scholar] [CrossRef]
- Gassman, P.W.; Sadeghi, A.M.; Srinivasan, R. Applications of the SWAT Model Special Section: Overview and Insights. J. Environ. Qual. 2014, 43, 1–8. [Google Scholar] [CrossRef] [PubMed]
- Arnold, J.G.; Moriasi, D.N.; Gassman, P.W.; Abbaspour, K.C.; White, M.J.; Srinivasan, R.; Santhi, C.; Harmel, R.D.; Van Griensven, A.; Van Liew, M.W.; et al. SWAT: Model use, calibration, and validation. Trans. ASABE 2012, 55, 1491–1508. [Google Scholar] [CrossRef]
- Fuka, D.R.; Walter, M.T.; Macalister, C.; Degaetano, A.T.; Steenhuis, T.S.; Easton, Z.M. Using the Climate Forecast System Reanalysis as weather input data for watershed models. Hydrol. Process. 2014, 28, 5613–5623. [Google Scholar] [CrossRef]
- Meng, X.; Wang, H.; Shi, C.; Wu, Y.; Ji, X. Establishment and evaluation of the China meteorological assimilation driving datasets for the SWAT model (CMADS). Water 2018, 10, 1555. [Google Scholar] [CrossRef] [Green Version]
- Dile, Y.T.; Srinivasan, R. Evaluation of CFSR climate data for hydrologic prediction in data-scarce watersheds: An application in the blue nile river basin. J. Am. Water Resour. Assoc. 2014, 50, 1226–1241. [Google Scholar] [CrossRef]
- Worqlul, A.W.; Maathuis, B.; Adem, A.A.; Demissie, S.S.; Langan, S.; Steenhuis, T.S. Comparison of rainfall estimations by TRMM 3B42, MPEG and CFSR with ground-observed data for the Lake Tana basin in Ethiopia. Hydrol. Earth Syst. Sci. 2014, 18, 4871–4881. [Google Scholar] [CrossRef] [Green Version]
- Worqlul, A.W.; Collick, A.S.; Tilahun, S.A.; Langan, S.; Rientjes, T.H.M.; Steenhuis, T.S. Comparing TRMM 3B42, CFSR and ground-based rainfall estimates as input for hydrological models, in data scarce regions: The Upper Blue Nile Basin, Ethiopia. Hydrol. Earth Syst. Sci. Discuss. 2015, 12, 2081–2112. [Google Scholar] [CrossRef]
- Zhu, Q.; Xuan, W.; Liu, L.; Xu, Y.P. Evaluation and hydrological application of precipitation estimates derived from PERSIANN-CDR, TRMM 3B42V7, and NCEP-CFSR over humid regions in China. Hydrol. Process. 2016, 30, 3061–3083. [Google Scholar] [CrossRef]
- Cao, Y.; Zhang, J.; Yang, M.; Lei, X.; Guo, B.; Yang, L.; Zeng, Z.; Qu, J. Application of SWAT model with CMADS data to estimate hydrological elements and parameter uncertainty based on SUFI-2 algorithm in the Lijiang River basin, China. Water 2018, 10, 742. [Google Scholar] [CrossRef] [Green Version]
- Zhang, L.; Meng, X.; Wang, H.; Yang, M.; Cai, S. Investigate the applicability of CMADS and CFSR reanalysis in Northeast China. Water 2020, 12, 996. [Google Scholar] [CrossRef] [Green Version]
- Bressiani, D.D.A.; Srinivasan, R.; Jones, C.A.; Mendiondo, E.M. Effects of spatial and temporal weather data resolutions on streamflow modeling of a semi-arid basin, Northeast Brazil. Int. J. Agric. Biol. Eng. 2015, 8, 125–139. [Google Scholar] [CrossRef]
- Krause, P.; Boyle, D.P.; Bäse, F. Comparison of different efficiency criteria for hydrological model assessment. Adv. Geosci. 2005, 5, 89–97. [Google Scholar] [CrossRef] [Green Version]
- Bui, H.H.; Ha, N.H.; Nguyen, T.N.D.; Nguyen, A.T.; Pham, T.T.H.; Kandasamy, J.; Nguyen, T.V. Integration of SWAT and QUAL2K for water quality modeling in a data scarce basin of Cau River basin in Vietnam. Ecohydrol. Hydrobiol. 2019, 19, 210–223. [Google Scholar] [CrossRef]
- Tran, V.B.; Ishidaira, H.; Nakamura, T.; Do, T.N.; Nishida, K. Estimation of nitrogen load with multi-pollution sources using the SWAT model: A case study in the Cau river basin in Northern Vietnam. J. Water Environ. Technol. 2017, 15, 106–119. [Google Scholar] [CrossRef] [Green Version]
- Saha, S.; Moorthi, S.; Pan, H.L.; Wu, X.; Wang, J.; Nadiga, S.; Tripp, P.; Kistler, R.; Woollen, J.; Behringer, D.; et al. The NCEP climate forecast system reanalysis. Bull. Am. Meteorol. Soc. 2010, 91, 1015–1057. [Google Scholar] [CrossRef]
- Meng, X.; Zhang, X.; Yang, M.; Wang, H.; Chen, J.; Pan, Z.; Wu, Y. Application and evaluation of the China Meteorological Assimilation Driving Datasets for The Swat Model (CMADS) in poorly gauged regions in Western China. Water 2019, 11, 2171. [Google Scholar] [CrossRef] [Green Version]
- Neitsch, S.L.; Arnold, J.G.; Kiniry, J.R.; Williams, J.R. Soil and Water Assessment Tool Theoretical Documentation; Grassland, Soil and Water Research Laboratory, Agricultural Research Service; Blackland Research Center, Texas Agricultural Experiment Station: Temple, TX, USA, 2005. [Google Scholar]
- Neitsch, S.L.; Arnold, J.G.; Kiniry, J.R.; Williams, J.R. Soil and Water Assessment Tool Theoretical Documentation. Version 2009; Texas Water Resources Institute Technical Report No. 406; Texas A&M University System: College Station, TX, USA, 2011. [Google Scholar]
- Ebert, B.Y.E.E.; Janowiak, J.E.; Kidd, C. Comparison of Near-Real-Time Precipitation Estimates from Satellite Observations and Numerical Models. Bull. Am. Meteorol. Soc. 2007, 88, 47–64. [Google Scholar] [CrossRef] [Green Version]
- Wang, H.; Zhong, H.; Lu, J.; Yan, Q.; Li, S.; Zhou, Y. Understanding the river-lake relationship after the operation of TGR based on SWAT model. J. Coast. Res. 2020, 104, 593–600. [Google Scholar] [CrossRef]
- Lu, J.Z.; Zhang, L.; Cui, X.L.; Zhang, P.; Chen, X.L.; Sauvage, S.; Sanchez-Perez, J.M. Assessing the climate forecast system reanalysis weather data driven hydrological model for the Yangtze river basin in China. Appl. Ecol. Environ. Res. 2019, 17, 3615–3632. [Google Scholar] [CrossRef]
- Dinku, T.; Ceccato, P.; Kopec, E.G.; Lemma, M.; Connor, S.J. Validation of satellite rainfall products over East Africa’s complex topography. Int. J. Remote Sens. 2007, 28, 1503–1526. [Google Scholar] [CrossRef]
- Karl, T.R.; Nicholls, N.; Ghazi, A. CLIVAR/GCOS/WMO Workshop on Indices and Indicators for Climate Extremes—Workshop summary. Clim. Chang. 1999, 42, 3–7. [Google Scholar] [CrossRef]
- Moriasi, D.N.; Gitau, M.W.; Pai, N.; Daggupati, P. Hydrologic and water quality models: Performance measures and evaluation criteria. Trans. ASABE 2015, 58, 1763–1785. [Google Scholar] [CrossRef] [Green Version]
- Motovilov, Y.G.; Gottschalk, L.; Engeland, K.; Rodhe, A. Validation of a distributed hydrological model against spatial observations. Agric. For. Meteorol. 1999, 98–99, 257–277. [Google Scholar] [CrossRef]
- Roth, V.; Lemann, T. Comparing CFSR and conventional weather data for discharge and soil loss modelling with SWAT in small catchments in the Ethiopian Highlands. Hydrol. Earth Syst. Sci. 2016, 20, 921–934. [Google Scholar] [CrossRef] [Green Version]
- Gosset, M.; Viarre, J.; Quantin, G.; Alcoba, M. Evaluation of several rainfall products used for hydrological applications over West Africa using two high-resolution gauge networks. Q. J. R. Meteorol. Soc. 2013, 139, 923–940. [Google Scholar] [CrossRef]
- Khoi, D.N.; Thom, V.T. Parameter uncertainty analysis for simulating streamflow in a river catchment of Vietnam. Glob. Ecol. Conserv. 2015, 4, 538–548. [Google Scholar] [CrossRef] [Green Version]
- Blacutt, L.A.; Herdies, D.L.; de Gonçalves, L.G.G.; Vila, D.A.; Andrade, M. Precipitation comparison for the CFSR, MERRA, TRMM3B42 and Combined Scheme datasets in Bolivia. Atmos. Res. 2015, 163, 117–131. [Google Scholar] [CrossRef] [Green Version]
- Sorooshian, S.; Aghakouchak, A.; Arkin, P.; Eylander, J.; Foufoula-Georgiou, E.; Harmon, R.; Hendrickx, J.M.H.; Imam, B.; Kuligowski, R.; Skahill, B.; et al. Advanced concepts on remote sensing of precipitation at multiple scales. Bull. Am. Meteorol. Soc. 2011, 92, 1353–1357. [Google Scholar] [CrossRef]
- Asia, E. Significance of the China Meteorological Assimilation Driving Datasets for the SWAT Model. Water 2017, 9, 765. [Google Scholar] [CrossRef]
Figure 1.
Map of the Cau River basin: (a) location, digital elevation model (DEM), river systems, ground-based meteorological station (GMS) and hydrological station; (b) land use map.
Figure 1.
Map of the Cau River basin: (a) location, digital elevation model (DEM), river systems, ground-based meteorological station (GMS) and hydrological station; (b) land use map.

Figure 2.
Box plots of daily maximum (a–d) and minimum (e–h) temperatures from CFSR and CMADS at the Bac Kan, Dinh Hoa, Thai Nguyen and Bac Ninh meteorological stations.
Figure 2.
Box plots of daily maximum (a–d) and minimum (e–h) temperatures from CFSR and CMADS at the Bac Kan, Dinh Hoa, Thai Nguyen and Bac Ninh meteorological stations.

Figure 3.
Spatial distributions of the correlation coefficient (CC) on the daily (a,b) and monthly (c,d) scales and of MAE (mm/month) (e,f) and PBIAS (%) (g,h) on the monthly scale in the Cau River basin over the period from 2008–2013.
Figure 3.
Spatial distributions of the correlation coefficient (CC) on the daily (a,b) and monthly (c,d) scales and of MAE (mm/month) (e,f) and PBIAS (%) (g,h) on the monthly scale in the Cau River basin over the period from 2008–2013.

Figure 4.
Occurrence frequencies (a) and relative contributions (b) of daily-scale rainfall thresholds obtained from the CFSR, CMADS and GMS data for the period 2008–2013.
Figure 4.
Occurrence frequencies (a) and relative contributions (b) of daily-scale rainfall thresholds obtained from the CFSR, CMADS and GMS data for the period 2008–2013.

Figure 5.
Number of days when hot weather occurred in the period 2008–2013.

Figure 6.
Observed streamflow and simulations performed using the GMS-, CFSR-, and CMADS-driven models at the daily scale over the CRB.
Figure 6.
Observed streamflow and simulations performed using the GMS-, CFSR-, and CMADS-driven models at the daily scale over the CRB.

Figure 7.
Observed streamflow and simulations obtained using the GMS-, CFSR-, and CMADS-driven models at the monthly scale over the CRB.
Figure 7.
Observed streamflow and simulations obtained using the GMS-, CFSR-, and CMADS-driven models at the monthly scale over the CRB.


Table 1.
The input datasets used for the meteorological assessment and hydrological simulation in this study.
Table 1.
The input datasets used for the meteorological assessment and hydrological simulation in this study.
| Data Type | Product | Spatial Resolution | Temporal Resolution | Sources |
|---|---|---|---|---|
| Weather Data | CFSR | 0.31 × 0.31° (15 grids) | Daily (1979–2014) | NCEP 1 |
| CMADS (v1.1) | 0.25 × 0.25° (24 grids) | Daily (2008–2016) | CAU 2 | |
| GMS | Point (17 stations) | Daily (2008–2013) | MORNE 3 | |
| Geography | DEM | 30 × 30 m | 2005 | USGS 4 |
| Soil | 1 × 1 km | 2005 | FAO 5 | |
| Land use | 1 × 1 km | 2005 | MORNE 3 | |
| Hydrology | Discharge | Point (1 station) | Daily (2008–2013) | MORNE 3 |
Note: 1: National Centers for Environmental Prediction; 2: China Agricultural University; 3: MORNE: Ministry of Natural Resources and Environment, Vietnam; 4: USGS: United States Geological Survey; 5: FAO: Food and Agriculture Organization.
Table 2.
The criteria used for evaluating the SWAT model performance ratings for simulating flow at a monthly time scale.
Table 2.
The criteria used for evaluating the SWAT model performance ratings for simulating flow at a monthly time scale.
| Indicator | Very Good | Good | Satisfactory | Unsatisfactory |
|---|---|---|---|---|
| R2 | R2 > 0.85 | 0.75 < R2 ≤ 0.85 | 0.6 < R2 ≤ 0.75 | R2 ≤ 0.6 |
| NSE | NSE > 0.8 | 0.7 < NSE ≤ 0.8 | 0.5 < NSE ≤ 0.7 | NSE ≤ 0.5 |
Table 3.
Statistical indicators used to evaluate temperature (maximum, Tmax/minimum, Tmin) in the CFSR and CMADS data in the Cau River Basin.
Table 3.
Statistical indicators used to evaluate temperature (maximum, Tmax/minimum, Tmin) in the CFSR and CMADS data in the Cau River Basin.
| Temperature | Values | Bac Kan | Dinh Hoa | Thai Nguyen | Bac Ninh | ||||
|---|---|---|---|---|---|---|---|---|---|
| CFSR | CMADS | CFSR | CMADS | CFSR | CMADS | CFSR | CMADS | ||
| Tmax | Mean (°C) | 25.43 | 26.48 | 25.43 | 26.44 | 26.07 | 27.39 | 27.68 | 27.60 |
| CC | 0.92 | 0.97 | 0.92 | 0.97 | 0.92 | 0.97 | 0.91 | 0.97 | |
| MAE (°C) | 2.81 | 1.5 | 2.67 | 1.51 | 2.37 | 1.17 | 2.12 | 1.0 | |
| RMSE (°C) | 2.47 | 1.53 | 2.46 | 1.57 | 2.51 | 1.57 | 2.85 | 1.39 | |
| PBIAS | −8.05 | −4.22 | −7.34 | −3.63 | −5.19 | −0.39 | 0.33 | 0.05 | |
| Tmin | Mean (°C) | 17.8 | 19.66 | 17.8 | 19.94 | 18.47 | 20.68 | 19.9 | 20.81 |
| CC | 0.97 | 0.97 | 0.96 | 0.97 | 0.96 | 0.97 | 0.97 | 0.97 | |
| MAE (°C) | 2.01 | 0.94 | 2.41 | 1.05 | 2.59 | 0.95 | 1.57 | 1.01 | |
| RMSE (°C) | 1.4 | 1.29 | 1.48 | 1.38 | 1.47 | 1.27 | 1.34 | 1.28 | |
| PBIAS | −9.64 | −0.21 | −11.62 | −1.02 | −12.11 | −1.57 | −6.37 | −2.11 | |
Table 4.
Continuous statistical indicators of the CFSR and CMADS rainfall data on the CRB from 2008 to 2013.
Table 4.
Continuous statistical indicators of the CFSR and CMADS rainfall data on the CRB from 2008 to 2013.
| Time Scale | Product | Mean (mm) | CC | MAE (mm) | RMSE (mm) | PBIAS (%) |
|---|---|---|---|---|---|---|
| Daily | CFSR | 9.04 | 0.45 | 8.01 | 15.5 | 99.2 |
| CMADS | 3.81 | 0.31 | 5.7 | 15.63 | −16.64 | |
| Monthly | CFSR | 275.18 | 0.82 | 145.72 | 151.78 | 99.2 |
| CMADS | 115.95 | 0.84 | 58.44 | 80.31 | −16.64 | |
| Rainy season (V–X) | CFSR | 2783.2 | −0.2 | 1463.9 | 469.3 | 109.4 |
| CMADS | 1227.2 | 0.4 | 256.5 | 199.7 | −8.5 | |
| Dry season (XI–IV) | CFSR | 523.1 | 0.5 | 277 | 111 | 114.8 |
| CMADS | 145.1 | 0.6 | 121.5 | 73.3 | −40.9 |
Table 5.
Statistics on the total number of cold and damaging days at meteorological stations in the Cau River basin in the period 2008–2013.
Table 5.
Statistics on the total number of cold and damaging days at meteorological stations in the Cau River basin in the period 2008–2013.
| Product | Bac Kan | Dinh Hoa | Thai Nguyen | Bac Ninh | ||||
|---|---|---|---|---|---|---|---|---|
| Tav13 °C | Tav13–15 °C | Tav13 °C | Tav13–15 °C | Tav13 °C | Tav13–15 °C | Tav13 °C | Tav13–15 °C | |
| GMS | 153 | 108 | 147 | 108 | 114 | 91 | 112 | 94 |
| CMADS | 125 | 108 | 114 | 103 | 96 | 94 | 96 | 89 |
Table 6.
Sensitivity values of the parameters used for flow simulations by GMS_, CFSR_, and CMADS_ using the SWAT model in the Cau River basin.
Table 6.
Sensitivity values of the parameters used for flow simulations by GMS_, CFSR_, and CMADS_ using the SWAT model in the Cau River basin.
| Parameter | Name | Range | Calibrated Value | ||
|---|---|---|---|---|---|
| GMS | CFSR | CMADS | |||
| v__ALPHA_BF.gw | Baseflow alpha factor | 0–1 | 0.7 | 0.001 | 0.689 |
| v__GW_DELAY.gw | Groundwater delay time | 0–500 | 250 | 328.75 | 38.25 |
| v__GWQMN.gw | Threshold water depth in the shallow aquifer for flow | 0–5000 | 2500 | 107.5 | 32.5 |
| v__GW_ REVAP.gw | Groundwater re-vaporisation coefficient | 0.02–0.2 | 0.11 | 0.109 | 0.059 |
| v__ REVAPMN.gw | Threshold depth of water in the shallow aquifer for “revap” to occur | 0–500 | 250 | 447.75 | 433.25 |
| v__ CANMX.hru | Maximum canopy storage | 0–100 | 10 | 16.35 | 74.25 |
| v__SURLAG.bsn | Surface runoff lag coefficient | 0.05–24 | 16.815 | 4.996 | 16.512 |
| v__CH_N2.rte | Manning value for main channel | −0.01–0.3 | 0.207 | −0.001 | 0.021 |
| v__CH_K2.rte | Effective hydraulic conductivity in main channel alluvium | −0.01–500 | 449.99 | 201.74 | 182.74 |
| r__CN2.mgt | Initial SCS runoff curve number for moisture condition II | −0.42–0.065 | −0.275 | −0.029 | −0.291 |
| r__SOL_AWC.sol | Available water capacity of soil layer | 0–3.347 | 2.342 | 0.322 | 3.118 |
| r__SOL_K.sol | Saturated hydraulic conductivity | 0–306.6 | 30.66 | 259.23 | 184.41 |
| r__ESCO.hru | Soil evaporation compensation factor | 0–1 | 0.1 | 0.069 | 0.237 |
| r__EPCO.hru | Plant uptake compensation factor | 0–1 | 0.7 | 0.984 | 0.682 |
Notes: r: the parameter value is multiplied by (1+ given value); v: the parameter is replaced by the given value and then compared with the measured flow results from the Gia Bay hydrological station (Thai Nguyen).
Table 7.
Statistical indices obtained during the calibration and validation periods of the streamflow simulations with GMS-, CFSR-, and CMADS-driven models.
Table 7.
Statistical indices obtained during the calibration and validation periods of the streamflow simulations with GMS-, CFSR-, and CMADS-driven models.
| Period | Value | Daily | Monthly | ||||
|---|---|---|---|---|---|---|---|
| GMS | CFSR | CMADS | GMS | CFSR | CMADS | ||
| Calibration (2009–2011) | R2 | 0.73 | 0.36 | 0.69 | 0.89 | 0.63 | 0.82 |
| NSE | 0.81 | 0.38 | 0.69 | 0.85 | 0.58 | 0.85 | |
| PBIAS (%) | 0.16 | 51.78 | −18.9 | 2.14 | 38.23 | −16.19 | |
| Validation (2012–2013) | R2 | 0.68 | 0.25 | 0.62 | 0.84 | 0.58 | 0.76 |
| NSE | 0.79 | 0.43 | 0.71 | 0.82 | 0.43 | 0.78 | |
| PBIAS (%) | −0.58 | 48.29 | −19.92 | 5.42 | 41.81 | −19.35 | |
Publisher’s Note: MDPI stays neutral with regard to jurisdictional claims in published maps and institutional affiliations. |
© 2021 by the authors. Licensee MDPI, Basel, Switzerland. This article is an open access article distributed under the terms and conditions of the Creative Commons Attribution (CC BY) license (https://creativecommons.org/licenses/by/4.0/).
Share and Cite
MDPI and ACS Style
Dao, D.M.; Lu, J.; Chen, X.; Kantoush, S.A.; Binh, D.V.; Phan, P.; Tung, N.X. Predicting Tropical Monsoon Hydrology Using CFSR and CMADS Data over the Cau River Basin in Vietnam. Water 2021, 13, 1314. https://doi.org/10.3390/w13091314
AMA Style
Dao DM, Lu J, Chen X, Kantoush SA, Binh DV, Phan P, Tung NX. Predicting Tropical Monsoon Hydrology Using CFSR and CMADS Data over the Cau River Basin in Vietnam. Water. 2021; 13(9):1314. https://doi.org/10.3390/w13091314
Chicago/Turabian StyleDao, Duy Minh, Jianzhong Lu, Xiaoling Chen, Sameh A. Kantoush, Doan Van Binh, Phamchimai Phan, and Nguyen Xuan Tung. 2021. "Predicting Tropical Monsoon Hydrology Using CFSR and CMADS Data over the Cau River Basin in Vietnam" Water 13, no. 9: 1314. https://doi.org/10.3390/w13091314
Note that from the first issue of 2016, this journal uses article numbers instead of page numbers. See further details here.