
Combined Dispatching of Hydropower and Wind Power Based on the Hedging Theory


1
State Key Laboratory of Eco-Hydraulics in Northwest Arid Region, Xi’an University of Technology, Xi’an 710048, China
2
School of Electrical Engineering, Xi’an University of Technology, Xi’an 710048, China
3
State Grid Gansu Electric Power Company, Gansu Electric Power Research Institute, Lanzhou 730050, China
*
Author to whom correspondence should be addressed.
Water 2021, 13(9), 1319; https://doi.org/10.3390/w13091319
Submission received: 5 April 2021
/
Revised: 1 May 2021
/
Accepted: 6 May 2021
/
Published: 9 May 2021
(This article belongs to the Special Issue Advances and Challenges in Hydropower)
Abstract
:In order to improve the utilization rate of water resources in the flood season of the reservoir effectively and promote wind power consumption, this paper proposes an optimization model for the combined dispatching of wind power and hydropower based on the hedging theory. First, the conflicting relationship between the water storage benefits of hydropower stations, flood control risks, and the joint output of hydropower and wind power in joint dispatching is studied. The introduction of hedging theory divides the combined dispatching of wind power and hydropower into a two-stage dispatching problem including the decision-making stage and the remaining stage; Second, considering the uncertainty of water forecasting and wind power forecasting, a multi-objective optimal dispatching model of hydropower and wind power based on hedging theory is constructed. This model aims to minimize flood control risks, maximize water storage benefits, and minimize wind power and hydropower combined power output volatility. Finally, the non-dominated sorting genetic algorithm (NSGA2) is used to solve the specific examples. The results show that the model built in the article controls the flood control risk at each time period not to be higher than 1.63 × 10⁻³ (the flood control standard corresponding to the flood control risk in 50 years is 0.006). Additionally, the water level of the reservoir increased from the flood limit water level (583.00 m) to 583.70 m. It greatly increases the water storage capacity and effectively improves the utilization rate of water resources. At the same time, the optimized scheduling scheme reduced the peak-valley difference of joint output from 125.00 MW to 35.66 MW, and the peak-valley difference was greatly reduced. It effectively improves the volatility of wind power. The validity of the model is verified, and the obtained scheme can provide decision-making for the joint dispatch scheme of hydropower and wind power.
1. Introduction
The shortage of water resources in China is very prominent, and it is the main bottleneck restricting the sustainable development of the society and economy. A large population but few water resources and an uneven distribution of water resources are the basic national conditions and water conditions of our country. Water resources are mainly concentrated in the annual flood season, causing frequent floods and a low utilization rate of water resources. Therefore, in order to alleviate the contradiction between supply and demand of water resources, it is of great significance to dispatch hydropower stations rationally in flood season, increase the water storage capacity of hydropower stations, improve the water storage efficiency, and realize “flood resource utilization” on the basis of ensuring that the flood control risk rate is within a safe range [1]. In addition, wind power, a typical renewable clean energy, has developed rapidly. As of the end of 2019, the cumulative installed capacity of wind power nationwide was 210 GW, accounting for 10.5% of the total installed capacity of power generation. Restricted by resource characteristics and natural conditions, wind power has strong volatility and randomness, and the problem of large-scale wind power consumption is still unresolved. The joint dispatch of wind power and hydropower is an effective way to promote the integration of wind power into the grid, which can use the good regulation ability of hydropower to stabilize the fluctuation of wind power output and improve the safety level of system operation [2,3].
The joint dispatch of hydropower and wind power is suitable for the current actual demand and the policy of complementary consumption of multiple clean energy sources. Wind power and hydropower are highly complementary in the seasonal distribution of resources. Through reasonable planning of wind and hydropower resources, the volatility and instability of wind power can be restrained [4,5,6,7]. For example, the pumped-storage power station’s own energy storage characteristics [8] and reservoirs with higher regulating capacity [9] can be used to improve wind power absorption capacity. The goal of joint dispatching models of hydropower and wind power is mostly to minimize the amount of discarded wind [10] or the best joint dispatch benefit [11], which ignores the uncertainty of wind power forecasting, resulting in a large deviation between the dispatch results and the actual situation. Most of the traditional hydropower and wind power joint dispatching models aim at minimizing the abandoned air volume or maximizing the benefits of joint dispatching, ignoring the uncertainty of wind power forecasting, which leads to a large deviation between the dispatching results and the actual situation. To date, researchers achieved much progress on the randomness of wind power, including wind power prediction [12,13,14], random description [15,16], and so on. On this basis, the cascade hydropower units are introduced into the joint dispatching of wind power and hydropower to provide a peak shaving reserve for wind turbines [17,18,19], and the stochastic optimization model considering risk constraints is established [20,21], which can improve the effect of randomness of wind power on the stable operation of the power system. In addition, there are three ways to deal with the uncertainty of wind power prediction: decomposing the wind power data before forecasting [22,23], using copula theory to forecast the wind power interval [24], and using a fuzzy clustering method to cluster the predicted value and the actual value of wind power [25]. These methods consider the deviation between the predicted value and the actual value caused by the uncertainty of wind power output fully, and improve the feasibility of joint dispatching decision greatly. Existing dispatching models of hydropower and wind power focus on how to improve the capacity of wind power utilization mainly, but seldom pay attention to the conflict between benefits and risks within the joint system of hydropower, which leads to the poor performance of the dispatching plan.
The concept of hedging originates from finance, which can be used to analyze interrelated and opposite factors, and obtain the optimal solution from them. In 1946, Masse used Hedging Rules (HR) to analyze reservoir scheduling problems from an economic perspective for the first time. At present, the main research contents are divided into two categories: One is to reduce the probability of water shortage or severe water shortage in the future dispatching period by reserving part of the water in the reservoir, and improve the water shortage problem effectively in the dry season [26].The main point of reservoir hedging rules is to find the starting point of hedging and the amount of available water supply, obtain the interval for implementing hedging [27], and then determine the optimal operation scheme. After considering the influence of uncertainty of incoming water on hedging rules [28], scheduling rules closer to the actual situation can be obtained. In addition to the application in a single reservoir, the application effect of hedging rules in water supply dispatching of reservoir groups is also considerable [29], which can reduce the total risk of water shortage in water supply areas of multiple reservoirs. The second type of main research is the use of hedging rules to determine the optimal reservoir operation plan considering flood control and benefiting. For example, the concept of hedging is applied to the flood control dispatching of reservoirs, and the key is to adjust the storage capacity at the end of the period to balance the flood control risks between the current period and the future period, so as to achieve the goal of minimizing the flood control risks [30,31,32]. Therefore, the reservoir hedging rules use extensive small-scale flood losses to reduce the risk and cost of large-scale flood losses. In addition, the benefit hedging between reservoir flood control and power generation [33], between flood control and water supply [29], between water supply benefits and the ecological environment [34], and between multiple goals of reservoir dispatching, as well as interest hedging considering historical decision-making and the optimization of hedging rules [35], are all current research hotspots. These lay a theoretical foundation for the study of multi-objective and multi-interest conflict problems.
The above research projects show that applying the economic theory of hedging rules to reservoir dispatching can maximize the benefits of reservoir water supply and storage. During the flood season, on the basis of ensuring the safety of flood control and realizing the flood reclamation and reuse, the utilization rate of water resources can be improved fully. With the expansion of the installed capacity of new energy sources such as wind power, the requirements for the comprehensive functions of hydropower stations increased, and the difficulty of building and solving optimal dispatching models also increased. Although the hydropower and wind power joint dispatching model that was studied [20,25] has considered the uncertainty of wind power and solved the problem of wind power utilization effectively, it has failed to consider the benefits of hydropower stations fully. In fact, the joint dispatch of hydropower and wind power is a process of multi-body conflicts of interest and coordinated decision-making. The problem of goal conflict is far more complex than the simple reservoir dispatching problem, such as spatial goal conflicts (hydropower plants, wind farms, water conservancy departments), and temporal goal conflicts (power generation benefits in the current and future periods). Therefore, for the joint dispatch of hydropower and wind power, it is necessary to reserve enough water storage space during the storage period of the reservoir to meet the flood control risk requirements, and to take into account the maximization of resource utilization and power generation benefits during the reservoir impoundment period. The multi-interest-conflict joint generation of hydropower and wind power is suitable to be solved by hedging, which can solve the problem fundamentally.
Therefore, this paper applies the hedging theory to the traditional joint dispatching of hydropower and wind power. A real-time optimal dispatching model for hydropower and wind power is constructed with the goal of minimizing flood control risks, maximizing optimal water storage benefits, and minimizing wind power and hydropower joint output fluctuations. Specifically, the organizational structure of this article is as follows: Section 2 introduces theoretical methods briefly, including the application of hedging rules in joint scheduling and analysis of the two-stage decision-making process. And the model and solution methods of hydropower and wind power joint dispatch based on hedging theory are established; Section 3 verifies the model with an application example, and Section 4 provides conclusions.
2. Materials and Methods
2.1. Hedging Theory
Hedging is a financial term that refers to an investment that deliberately reduces the risk of another investment [36]. It is a way to reduce business risks while still profiting from investment. Generally, hedging involves conducting two transactions which are related to the market, opposite in direction, equal in quantity, and break even. Market correlation means that the market supply and demand that affect the price of two commodities have the same identity. If the relationship between supply and demand changes, it will affect the prices of the two commodities at the same time, and the direction of price changes are generally the same. An opposite direction means that two transactions are bought and sold in opposite directions, so that no matter what direction the price changes, there will always be a profit and a loss. Of course, in order to make ends meet, the quantity of the two transactions must be determined according to the range of their respective price changes, so that the quantity is generally equal. Hedging can usually be used to analyze interrelated and opposing factors.
2.2. Application of Hedging Rules in Reservoir Operation
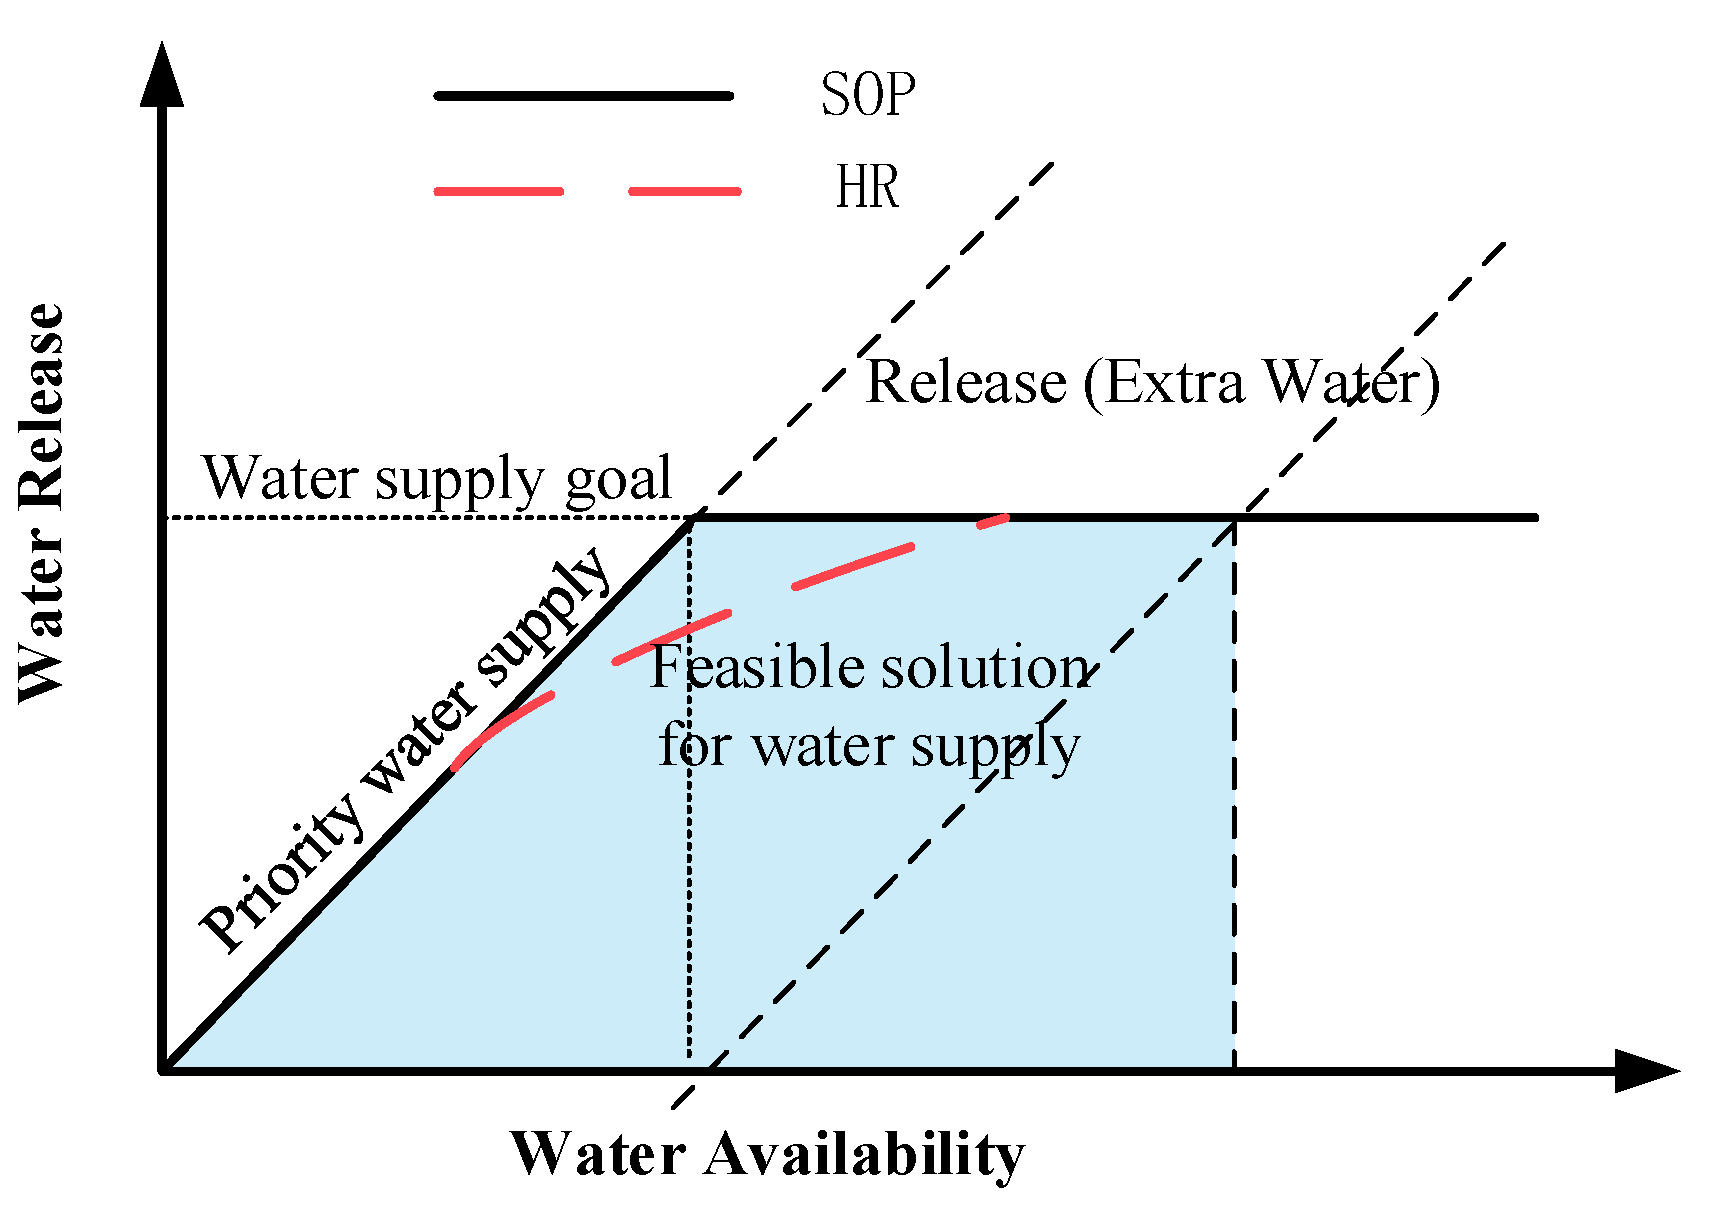
At present, the hedging theory is widely used to analyze dispatching rules of reservoirs. The traditional reservoir dispatching rule is the Standard Operation Policy (SOP). Its dispatching strategy is to supply water according to the current maximum water supply capacity, in order to give priority to meeting the water demand target during the facing period first. When the water supply objective function is the minimum total water shortage (or other forms of a linear function about the water shortage), the SOP rule is the optimal solution, but it lacks consideration of water shortage damage in the future period. For dispatchers, SOP rules are easy to operate. However, for the continuous low water periods that may be encountered in the dispatching period, SOP rules may cause serious water shortage damage to water consumption units in one or several dispatching periods, which will bring a greatly negative impact on the social economy. Based on this, the researchers proposed Hedging Rules (HR) for reservoir operation. The basic idea is: Under the condition of uncertain incoming water in the future dispatching period and judging that there is water shortage risk in the future, the water supply in the decision-making of the current dispatching period is reduced to a certain extent, and part of the water is reserved to avoid serious water shortage damage in the future period [28]. Figure 1 shows the application of hedging rules in reservoir operations.
In Figure 1, SOP is the Standard Operation Policy, and the area enclosed by the HR line and the available water (X axis) are both feasible dispatch intervals. Therefore, the most critical issue of hedging regulation is the determination of the HR dispatch curve. Usually, the goal is to maximize the benefits of the current water supply and the remaining period (two-stage water supply, time scale model). A variety of constraints are considered, and the objective function is established. It is also possible to consider multiple goals at the same time and solve them by a multi-objective algorithm, so as to obtain the final hedging rules for actual scheduling.
2.3. Analysis of Multi-Objective Hedging Relationship in Hydropower and Wind Power Joint Dispatching
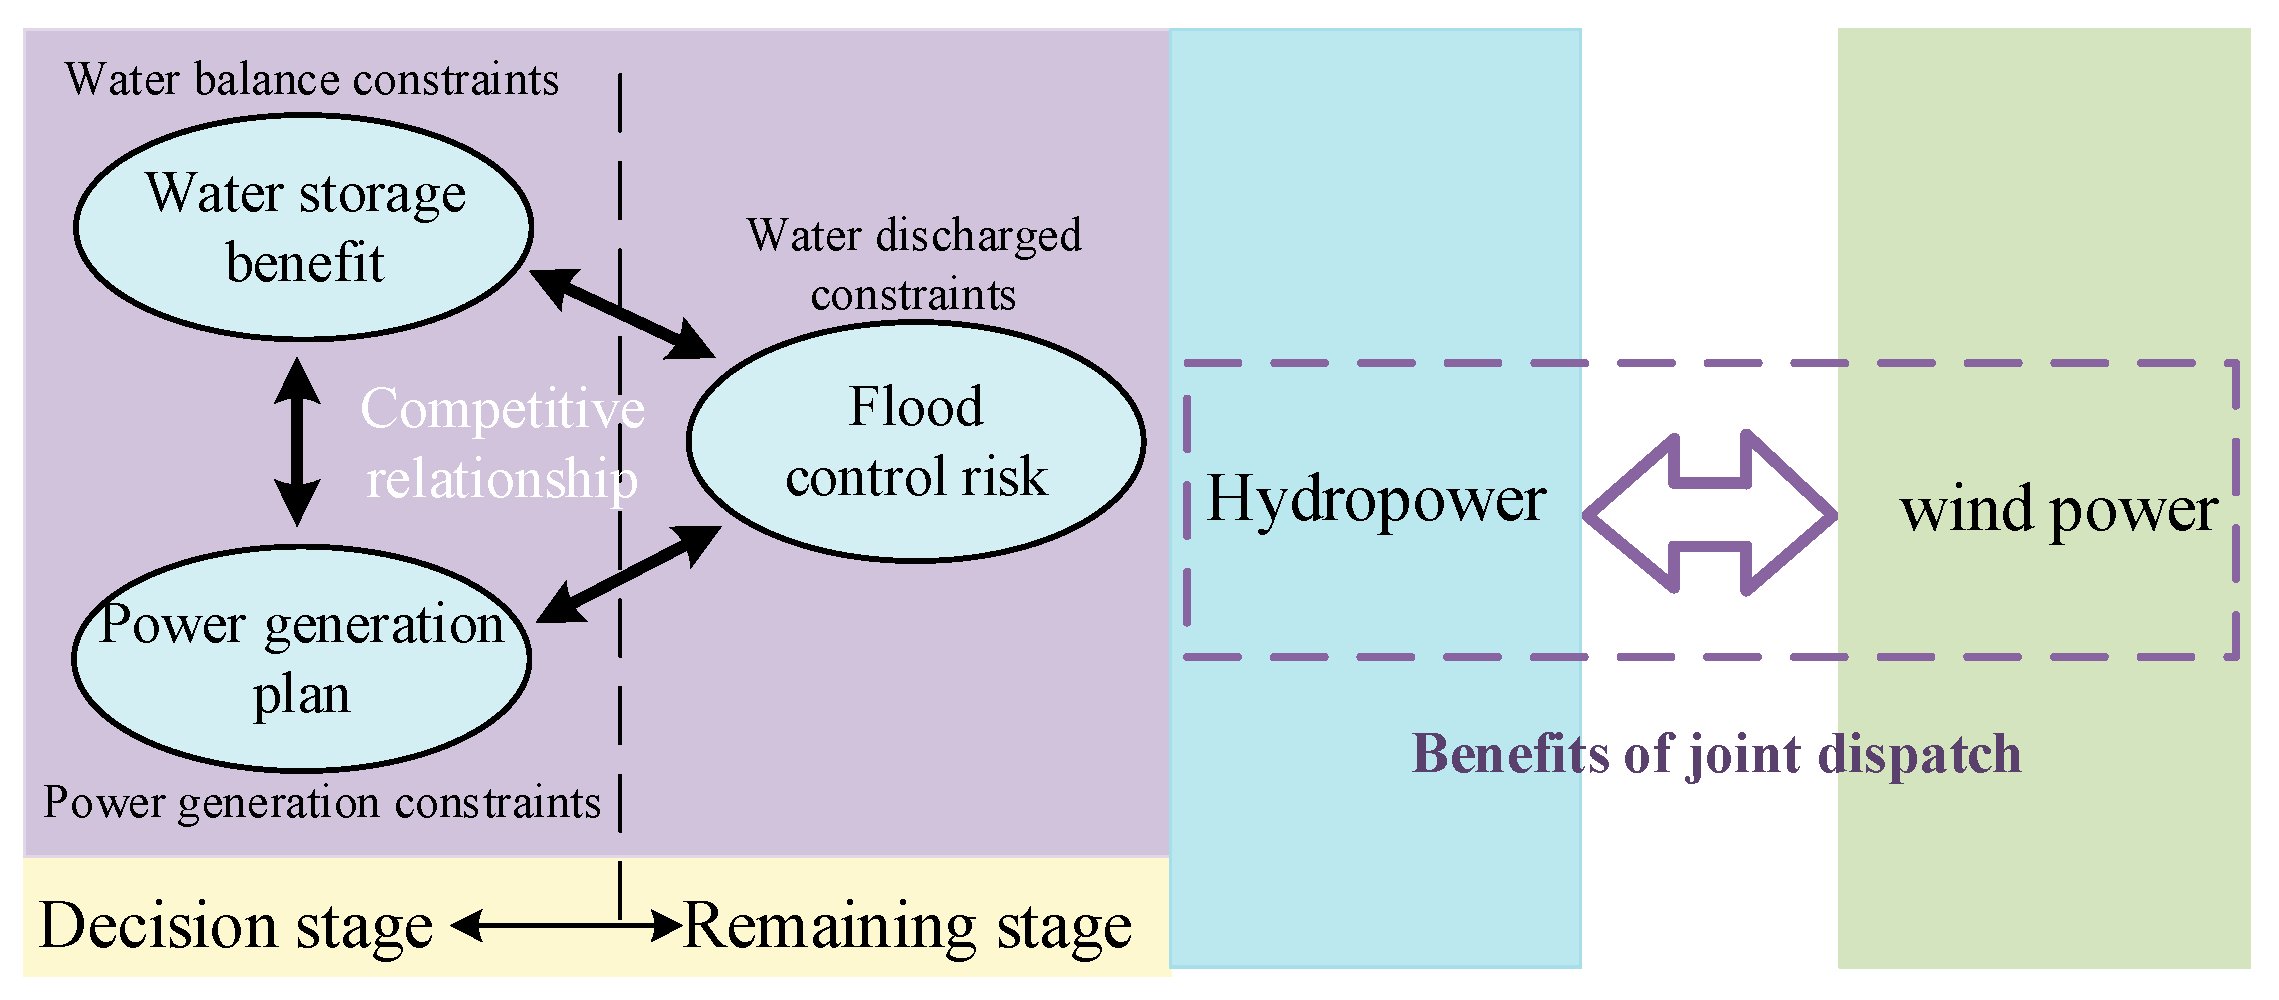
In order to ensure the safety of flood control during the flood season, the hydropower station is dispatched according to the flood limit water level. The utilization rate of water resources in this dispatching method is low. During the flood season, the joint dispatch of hydropower and wind power should not only consider the water storage benefits of hydropower stations, the flood control risks of hydropower stations, and upstream and downstream, but also ensure the peak-regulation and power generation requirements of the joint system. Therefore, joint dispatching is a typical multi-objective hedging problem. In terms of time, there is a conflicting relationship between the water storage benefit goal in the current period and the flood control risk goal in the future period. In terms of space, there is also a competitive relationship between the current water storage benefit goal of hydropower stations and the benefit goal of joint hydropower and wind power dispatch.
The pre-storage and pre-discharge dispatching method can be used to increase the pre-storage volume as much as possible without lowering the flood control standard. When the upstream water and rainfall of the hydropower station are small in the future, the water storage capacity of the hydropower station can be increased on the basis of ensuring the safety of flood control and the completion of the power generation task, and the water storage benefit can be increased as much as possible. At the same time, the wind power is adjusted by the power generated by the water discharge. On the contrary, when the water inflow is large in the future time period, in order to ensure safety, after meeting the power demand and peak shaving capacity, the excess water will be safely discharged, and the water level of the hydropower station will fall back to the limit water level during the flood season. The more water that is stored in the reservoir, the better the water storage benefit of the hydropower station. If the inflow is predicted to be large in the future, it may bring flood control risks to the reservoir. At the same time, the larger the water storage, the smaller the amount of water is available for power generation, which may not meet the power generation plan and reduce the ability to regulate wind power. If the water storage is small, the corresponding flood control risk will be reduced, but the water storage benefit of hydropower stations will be small, which cannot make full use of water resources, resulting in waste. If the discharge capacity is greater than the power generation flow of the hydropower station, the hydropower station will be in a full-scale state to avoid no water abandonment or less water abandonment as far as possible, which will also affect the regulation capacity of wind power. Figure 2 is a diagram of the multi-object conflict relationship in the joint dispatch of hydropower and wind power.
In summary, it can be seen that the joint dispatch of hydropower and wind power is a complex multi-objective conflict problem, which can be analyzed by hedging theory. According to the two-stage model of risk hedging described in Section 2.2, the essence of the two-stage model is to “take out” the benefits of water supply in the future stage to achieve the reduction risk of water supply benefits brought about by the priority water supply in the current stage. Additionally, there is a timing correlation between the two scheduling stages. This model method has obtained good application effects in the dispatching of a single water supply reservoir and a group of water supply reservoirs. Based on the implicit timing relationship between the hydropower station and the downstream control station, this paper uses the theoretical research basis of risk hedging rules to construct a two-stage hedging strategy for the joint dispatch of hydropower and wind power during the flood season. By reducing the benefits of water storage in the current time period, we will ensure the safety of flood control in the future time period, as well as the stability of the wind power and hydropower joint dispatch. It provides theoretical support for actual dispatching work.
2.4. Dynamic Decision-Making Process for Joint Dispatch of Hydropower and Wind Power Based on Hedging Theory
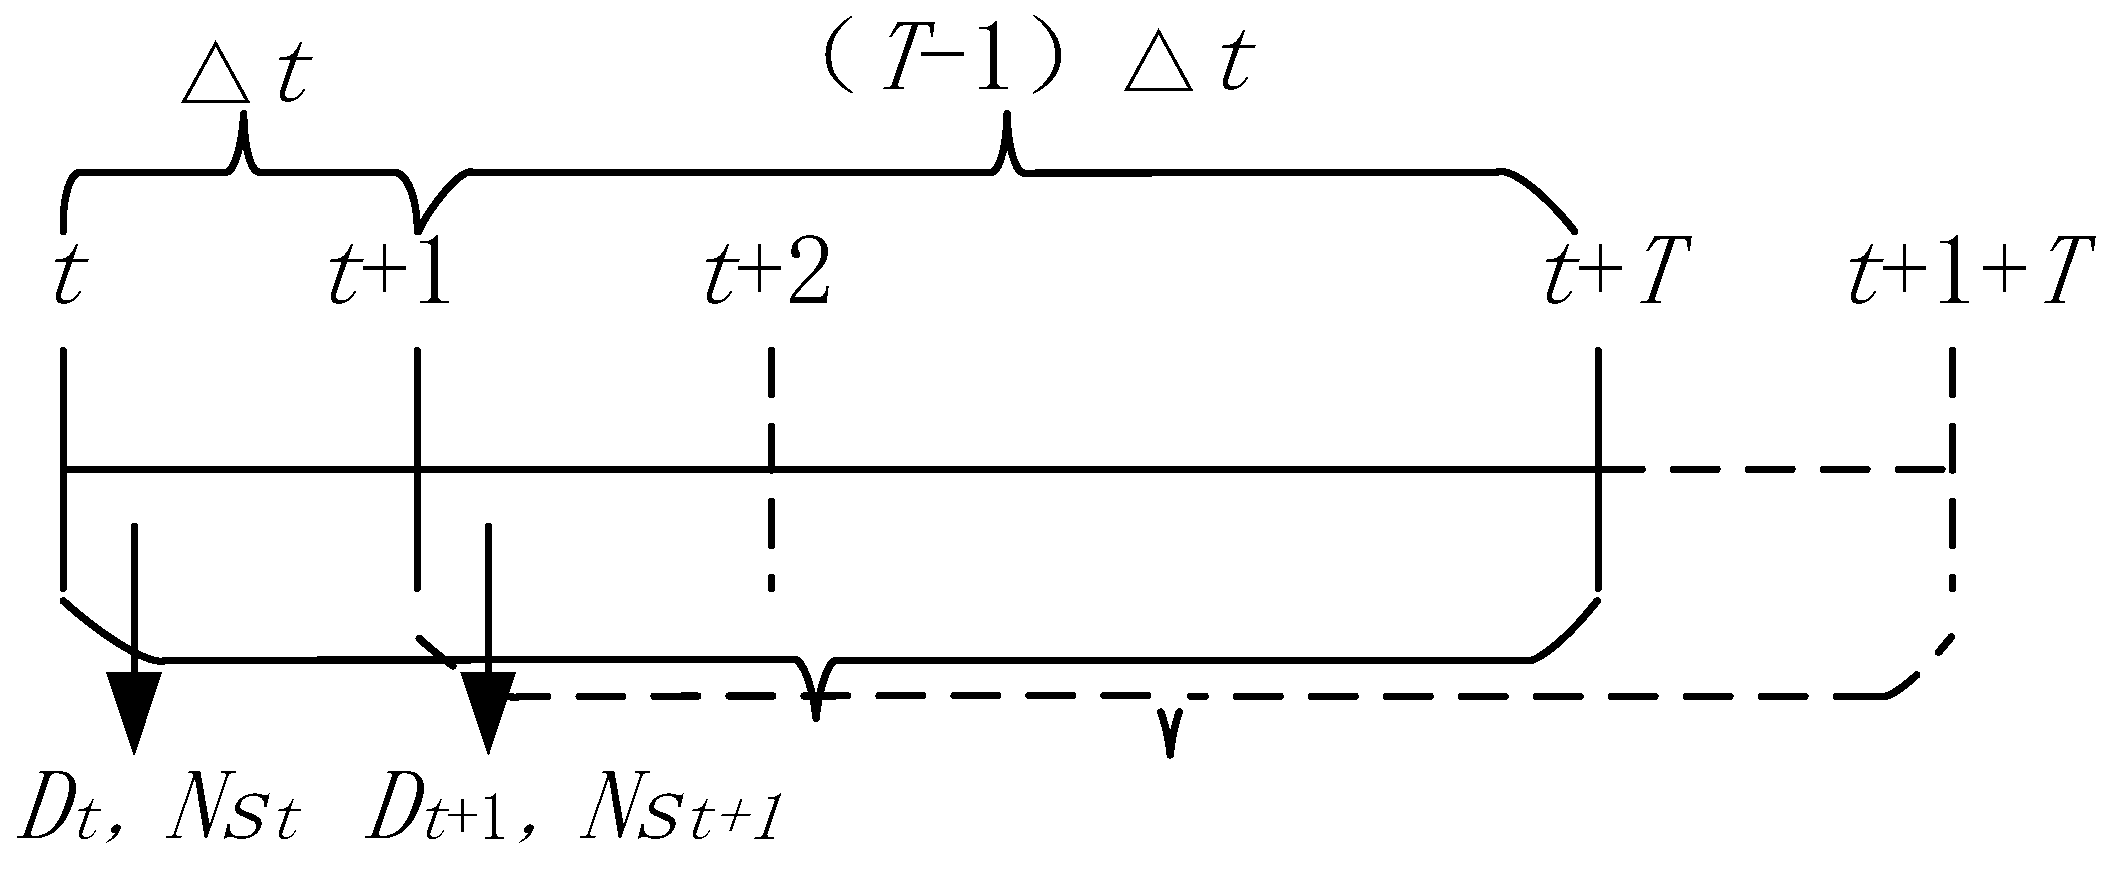
In the real-time joint dispatching, according to the forecasted water inflow and wind power output in each period, the hydropower and wind power joint dispatching plan for the current period is worked out by weighing the benefits of reservoir storage for profit, flood control risk, joint output volatility, etc. Then, according to the updated water inflow, wind power output, and other information, the dispatching plan for the latest period is re-formulated. It can be seen that real-time scheduling is a process of rolling forward the forecast and decision-making period by period based on the forecast information of the facing period and remaining period (foresight period). Therefore, the process of the joint dispatch of hydropower and wind power in the flood season can be regarded as a two-stage dispatch problem, which is divided into the decision-making stage and the remaining stage. As shown in Figure 3, stage 1 is the decision period including a scheduling period , and the remaining period of stage 2 includes periods . The real-time scheduling model keeps rolling forward with time, and the decisions in the decision-making period also keep rolling forward and updating. is the water discharge in each period, and is hydropower output in each period.
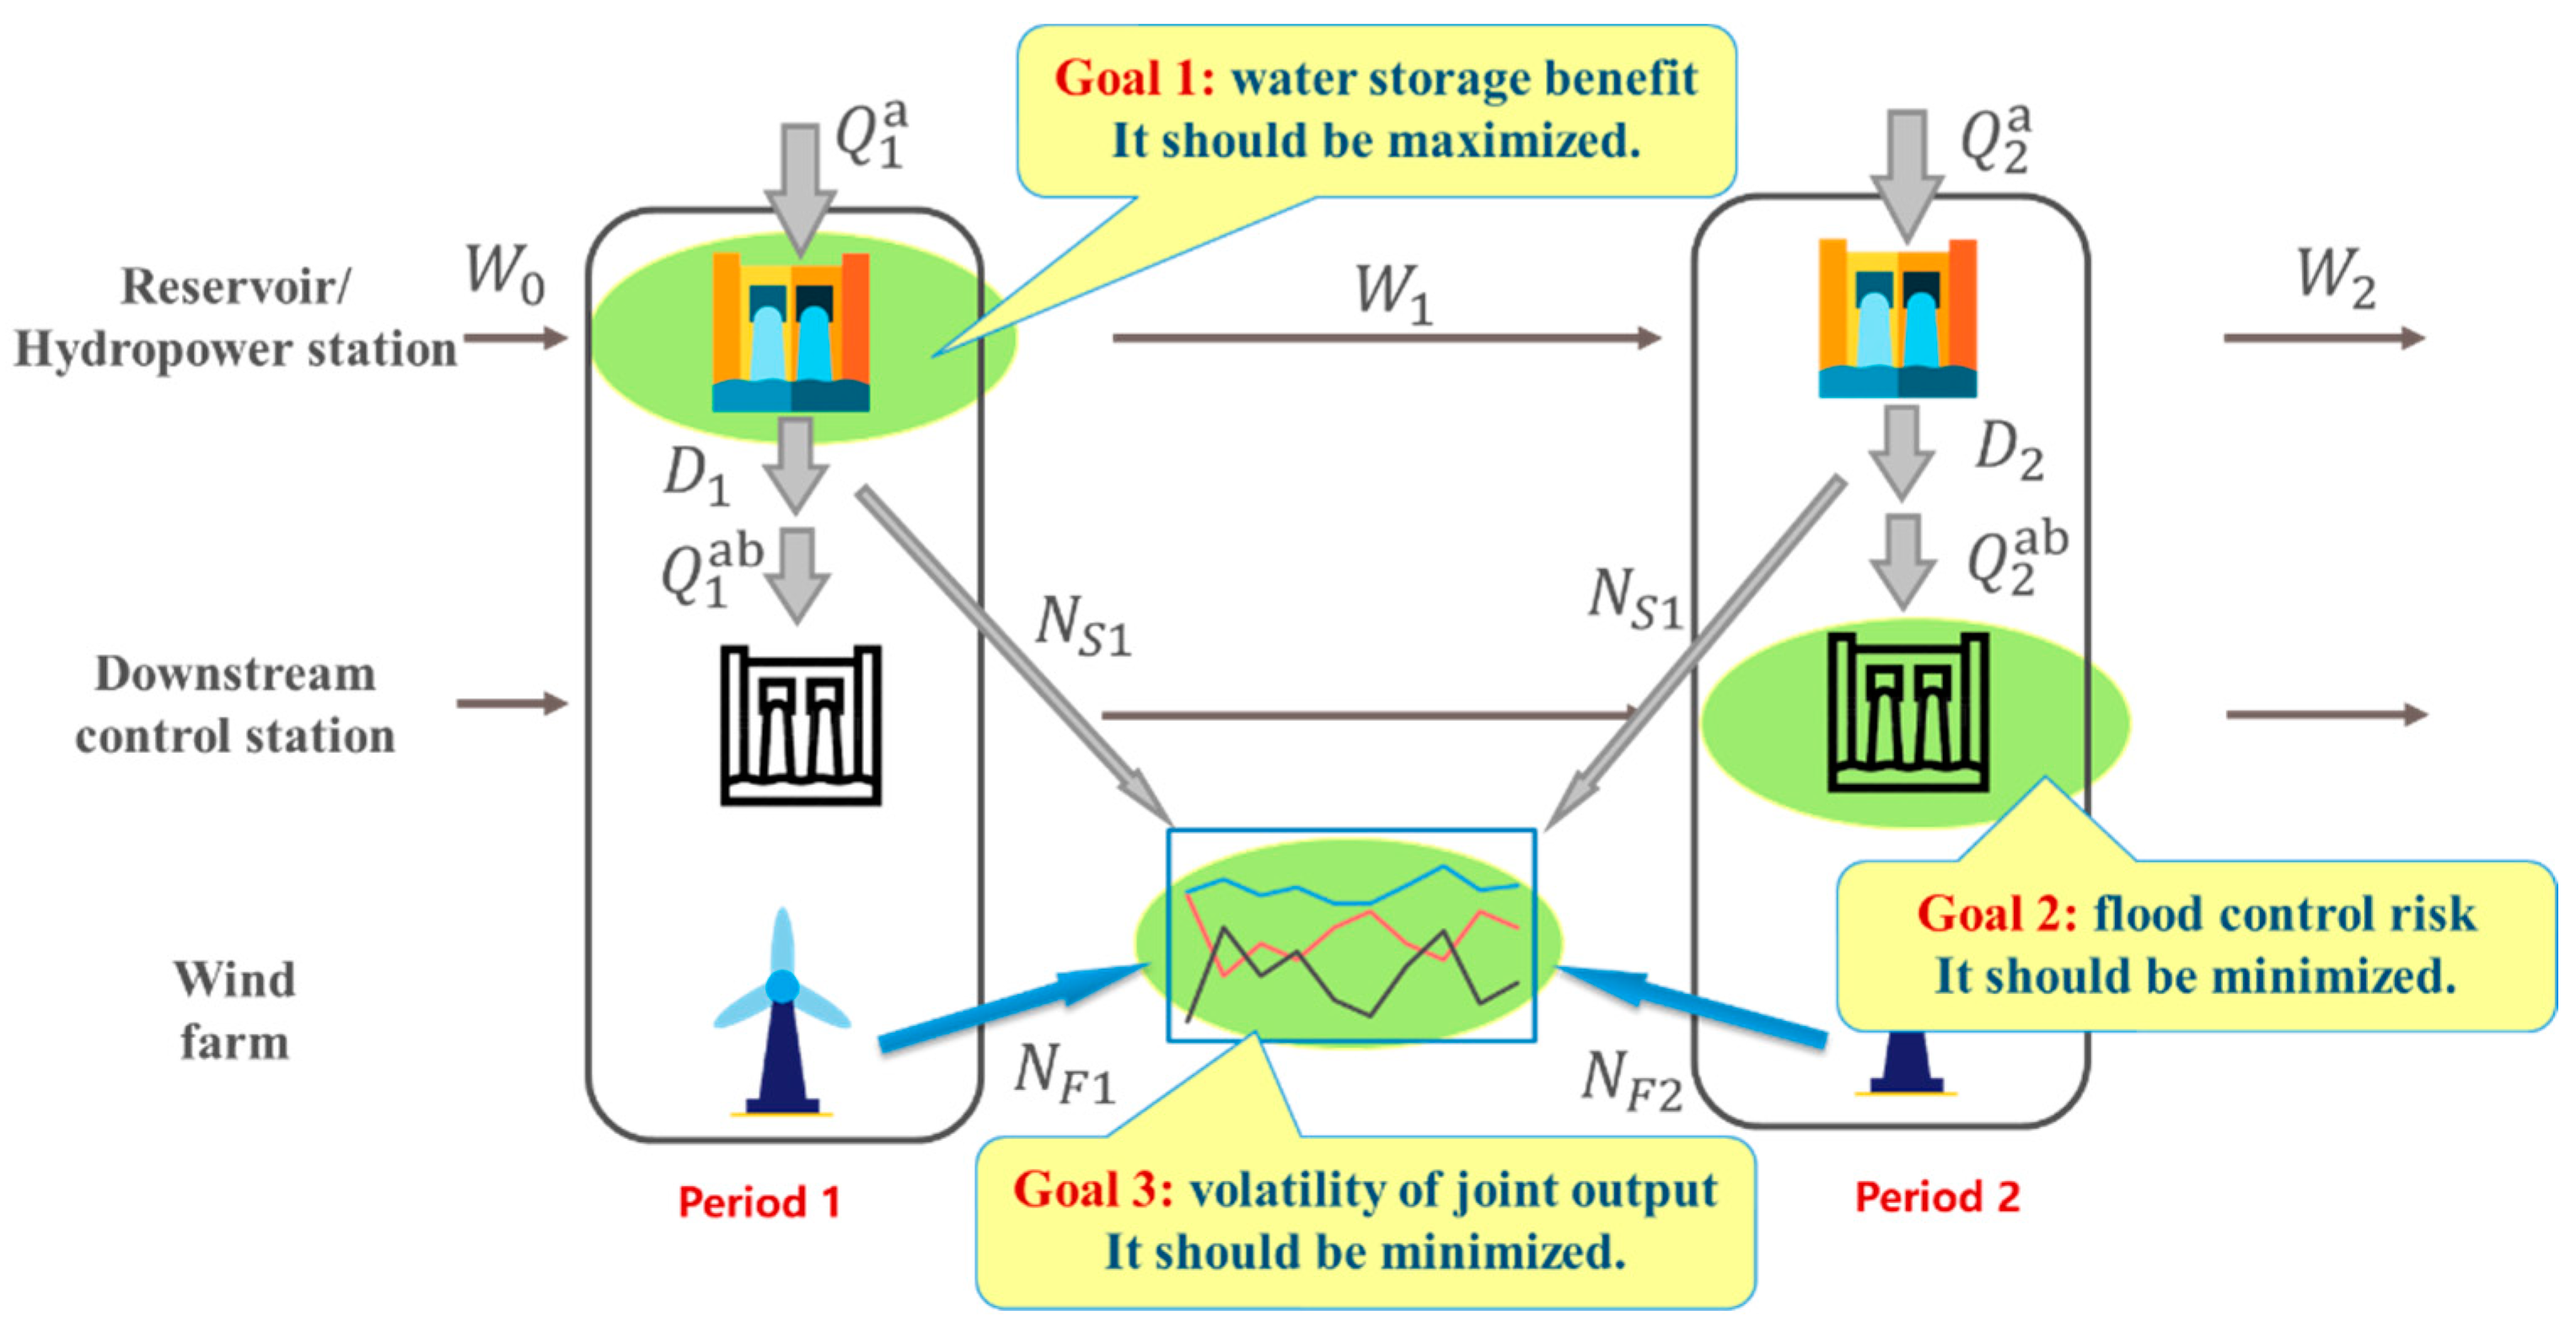
Each two-stage joint dispatch of the hydropower and wind power process during the flood season includes three goals: water storage benefits, flood control safety, and the volatility of hydropower and wind power joint output. In hydropower dispatching, this paper only analyzes the flood control risks caused by the uncertainty of the forecasting interval flow, and the benefits generated by the increased water storage in the public storage capacity. In order to consider the uncertainty of wind power forecasting, wind power output interval forecast results are used. The hedging mechanism of hydropower and wind power generation is mainly reflected in the variables of hedging, which means that the complex multi-objective conflicts are processed, streamlined, and generalized into a hedging relationship, forming a mathematical expression and providing a basis for establishing a hedging model. Two-stage hydropower and wind farms are taken as examples to illustrate the multi-objective two-stage hedging dispatch mechanism of hydropower and wind power. The decision-making instructions and related regulations are shown in Figure 4: The joint dispatch goals are: (1) the added value of the water storage benefit B of a hydropower station; (2) the flood control risk R of downstream control stations; (3) the fluctuation of volatility of joint output. The first goal should be maximized; the second goal should be minimized, and the third goal should be minimized too. Among them, there is a hedging relationship between the flood control risk goal and the water storage benefit goal of the hydropower station. The larger the water storage capacity, the better the profit benefit, but the flood control risk increases. In Figure 4, is the water inflow in period ; is the water discharged in period ; is the inflow of water from the reservoir and downstream section in period , and is the water storage in period ; is the hydropower output of the hydropower station in period , and is the wind power output in period .
2.5. Calculation of Water Storage Benefit and Flood Control Risk Considering the Uncertainty of Forecast Information
In the regular operation of the reservoir, as long as the initial water level of the reservoir does not exceed the flood limit water level, the flood control safety of the reservoir itself and the upstream and downstream protection objects in the planning and design can be guaranteed without additional flood control risks. In the forecast dispatching of reservoirs, the pre-storage and pre-discharge dispatching method is usually adopted. For example, if there is no rain or light rain for a period of time from now to later, some water can be pre-stored in the shared storage capacity. However, it is necessary to ensure that the pre-storage water can be safely released before the next flood without increasing the risk of flood control downstream of the reservoir; that is, the reservoir water level will fall back to the original designed flood limit water level through pre-release. At this time, the flood control safety of the reservoir itself and the upstream and downstream protection objects in the planning and design can also be guaranteed without additional flood control risks. However, because the forecast error exceeds a certain threshold, the downstream flood control safety restricts the pre-discharge so that the reservoir water level cannot fall back to the original designed flood limit water level before the flood. If a design flood or a check flood occurs at this time, the flood control safety of the reservoir or upstream and downstream planning and design cannot be guaranteed. That is to say, additional flood control risks arise due to large forecast errors.
In the two-stage dispatch model constructed in this paper, stage 1 is handled as a deterministic forecast, so there is no flood control risk. However, the forecast errors in stage 2 will bring certain flood prevention risks. Once the forecast value is too large or too small to cause the reservoir water level to deviate from the planned design value, the water level will be adjusted in time by adjusting the discharge flow of the reservoir to ensure that the water level in the end of the forecast period is controlled at the lower limit of the control domain. Then, no matter whether the inflow forecast in stage 2 is too large or too small, it can be considered that the flood control risk of the reservoir itself and the upstream protection object in stage 2 meet the planning and design requirements, but the downstream protection objects have certain flood control risks. When the forecast value is too large, the actual amount of water that needs to be discharged from the reservoir is smaller than the expected discharge, so that the risk of downstream protection objects meets the requirements; when the forecast value is too small, compared with the expected discharge, the actual amount of water that needs to be discharged is too large. It may increase the flood control risk of downstream protection objects. Therefore, in the regulation stage of reservoir water storage in flood season, when the water discharge in the predicted period is taken as the control target, it can be transformed into flood control risk, which only affects the downstream protection object. It is considered that the flood control risk of the reservoir itself and the upstream protection object meet the planning and design requirements, so as to simplify the analysis and approach the process of the rolling forward prediction and decision-making from time to time in engineering practice.
2.5.1. Calculation of Flood Control Risk Considering the Uncertainty of Forecast Information
For stage 1, the forecasting accuracy of the inflow of the hydropower station is relatively high, and it can be processed as a deterministic forecast, and there is no flood control risk. Therefore, as long as the downstream combined water inflow does not exceed the safe water flow, the planning and design requirements can be met.
The influence of the prediction error in stage 2 on the downstream flood control risk cannot be ignored. The water level at the end of the forecast period is controlled at the lower limit of the flood limit water level control domain. According to the water balance equation:
Therefore, the uncertainty of the reservoir discharge volume is caused by the error of the forecast information. The expected discharge volume of stage 2 is expressed by as follows:
is the storage capacity of stage 1; . Therefore, when , that is, the predicted inflow is less than the actual inflow, the actual discharge of the reservoir is greater than the expected discharge; that is, , and the downstream needs to bear certain flood control risks. When , that is, the forecasted water volume is too large, and the actual discharge volume of the reservoir is smaller than the expected discharge volume; that is, . At this time, the downstream flood control safety can be guaranteed.
The probability that the total inflow of stage 2 (including the expected discharge of stage 2 and the interval forecast inflow) exceeds the safe amount of water can be used to define the downstream flood control risk rate, and its expression is as follows:
According to the river flood evolution equation (excluding river flood propagation time), the total discharge from the downstream control station is the sum of the discharge from the reservoir and the forecast error. Assuming that the forecast error obeys the standard normal distribution, the downstream flood control risk rate with the forecast error as the independent variable is calculated as follows:
where: and , respectively, represent the probability density functions of the total inflow and the inflow forecast error of the downstream control station in stage 2.
2.5.2. Calculation of Benefits of Water Storage
In this paper, we use the added value of reservoir water storage benefit compared with the planning and design to describe the benefit goal, which is the bigger the better. For the convenience of solving, it is converted into the smaller the better target, that is, the benefit difference , which has a negative correlation with the water storage volume . The normalized calculation formula of the benefit difference is as follows:
where: is the shape coefficient of the curve of benefit difference versus water storage . The larger the value of , the more obvious the nonlinearity. When , the above formula is a convex function and has a minimum value. Therefore, the two-stage benefit difference can be obtained as:
This allows for the analysis of the regulation conditions and change process of the storage volume of the reservoir in the two stages. If the increased water storage in stage 1 ( is the corresponding water storage when the water level reaches the flood limit level), the regulation conditions for water storage are as follows: (1) It forecasts no large inbound flow process in time period ; (2) it is possible to release the increased water storage capacity of stage 1 in stage 2 safely, without increasing the risk of downstream flood control. In stage 2, the increased storage capacity of stage 1 can be safely discharged, indicating that the regulation goal of the reservoir at the end of stage 2 is not to store excess water; that is, ; (3) since the final water level of stage 2 can safely fall back to the lower limit of the dynamic control domain of the flood limit water level (), even if the design or check flood occurs immediately after the time period T, it will not increase the flood control risk of the flood control system planning and design.
2.6. Establishment of Dispatching Model of Hydropower and Wind Power Based on Hedging Theory
Based on the above content, a joint dispatching model of hydropower and wind power based on the hedging theory during the flood season is established.
2.6.1. Objective Functions
Goal 1: Minimize the difference in profit benefit of the two-stage reservoir.
where ; is the total dispatching period; is the difference in the water storage benefit in each period. In the actual calculation example, the goal is to minimize the average value of the benefit difference in each period.
Goal 2: Minimize the risk of flood control downstream of the reservoir at each stage.
where: ; is the flood control risk rate of stage 2. In order to ensure that the flood control risk in each period meets the requirements, the target in the actual calculation example is to minimize the largest flood control risk value in all periods.
Goal 3: Minimize the volatility of joint output.
where: is the combined total power generation of hydropower and wind power, (kW/h); that is, . Among them, is the hydropower generation in the period, (kW/h); is the wind power generation in the period, (kW/h).
2.6.2. Constraints
The mathematical model considering the fluctuation of joint output involves many constraints, mainly including: power balance, reservoir water balance, upper limit of pre-storage water volume, output of hydropower stations, output of wind power stations, and other constraints.
- Hydropower output constraintwhere: is the output of the hydropower station during the period , (kW); and are the guaranteed output and installed capacity of the hydropower station during the period, (kW); is the flow of the hydropower station during the period , (m3/s); is the average power generation head of the hydropower station during period , (m); k is the comprehensive output coefficient of the hydropower station. The output of a hydropower station cannot exceed the maximum power generation capacity of the hydropower station.
- Wind power output constraintwhere: is the output of the wind power station in the period , (kW); is the lower limit of wind power output in this period, (kW); is the upper limit of wind power output in this period, (kW); that is, the output of wind power cannot exceed the maximum power generation capacity of the wind power station.
- Combined system power generation output constraintwhere: is the combined output of hydropower and wind power in the period , (kW); is the length of the period interval.
- Reservoir capacity constraintwhere: is the minimum storage capacity of the reservoir, ; is the maximum storage capacity of the reservoir, .
- Water balance constraintwhere: is the initial storage capacity of the reservoir in stage 1 during the period , ; is the storage capacity of the reservoir at the end of stage 1 (beginning of stage 2) during the period , ; is the water storage capacity of the reservoir at the end of stage 2 during period , ; is the corresponding water storage when the water level reaches the flood limit level, ; is the actual water inflow of the reservoir in stage 1 during the period , ; is the predicted water inflow of the reservoir in period during stage 2, ; is the discharge of the reservoir in phase 1 during period , ; is the expected discharge of the reservoir in the second stage of time period , (m3).
- Discharge flow of the reservoir constraintwhere: is the discharge flow of the reservoir during the period , ; is the minimum discharge flow, ; is the downstream safe discharge, .
- Water level constraintwhere: is the dead water level of the reservoir, ; is the reservoir water level during the period , ; is the normal storage level of the reservoir, .
- Hydropower output climbing constraintLimiting the range of changes in the output of hydropower stations in adjacent periods.where: is the upper limit of the output variation of the hydropower station in the adjacent period.
2.7. Solution to the Dispatching Model of Hydropower and Wind Power Based on Hedging Theory
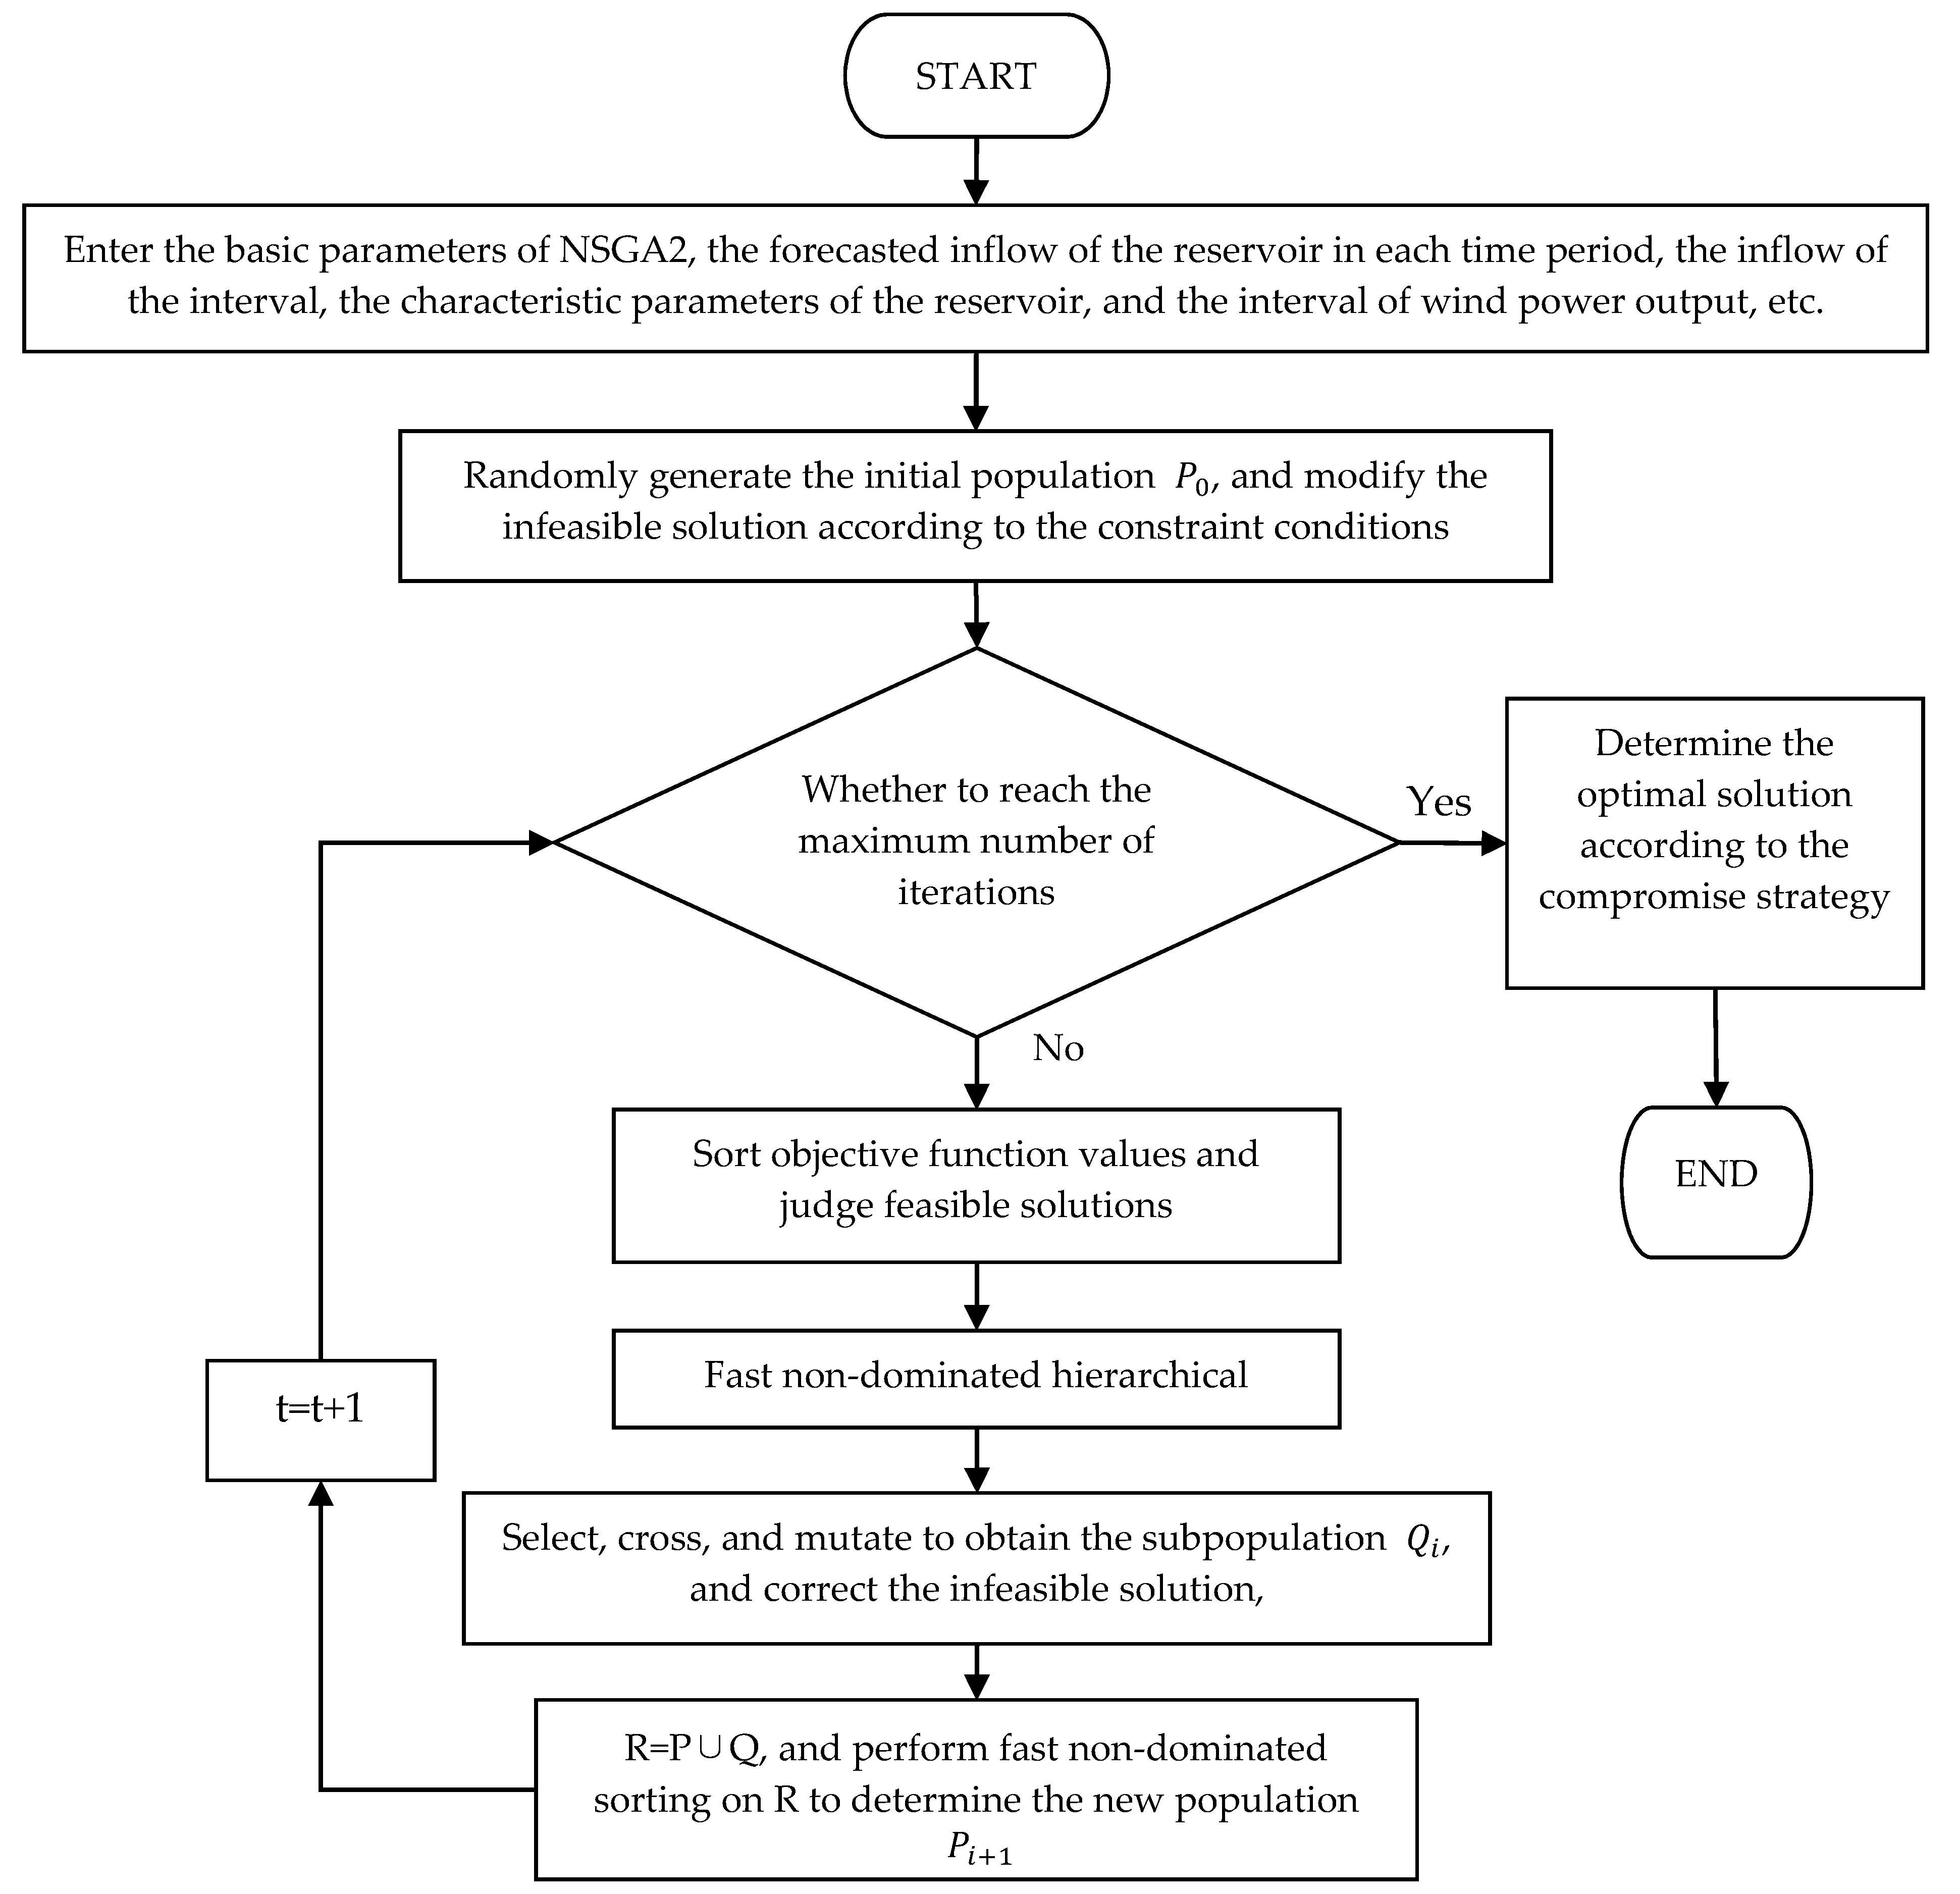
The dispatch of hydropower and wind power based on the hedging theory is a multi-objective problem, which can be solved by the non-dominated sorting genetic algorithm (NSGA2) [37]. The dispatching model of hydropower and wind power based on the hedging theory can adjust the parameters to be optimized based on the simulation of the dispatch process in each period, and solve the optimal parameters in the dispatch process, that is, the water storage capacity and wind power output in each period. Firstly, a set of optimal parameters is randomly generated in the feasible region. According to the forecast information, the current period of water storage benefit, the joint dispatch output, and the remaining period of flood control risk in the full calculation period are simulated and calculated, and the three optimized objective function values of the model are obtained. The statistical objective function values are fed back to the optimization algorithm, and the fast non-dominant sorting and crowding calculation are realized in the optimization algorithm. Then, one must use the optimization algorithm to cross-mutate the optimal parameters, and then select the appropriate individual to evolve to generate a new parent population, and finally enter the simulation module to re-simulate. One must follow the above steps to iterate until the requirements are met. The specific process is shown in Figure 5.
3. Results
3.1. Problem Description
This paper takes a hydropower station and a wind power station as an example to analyze the calculation example of the joint dispatch of hydropower and wind power. The total installed capacity of the hydropower station used is 280 MW, which is a multifunctional reservoir with annual adjustment capacity. The reservoir is mainly used for power generation and has comprehensive utilization benefits such as flood control and industrial irrigation. The total installed capacity of the wind power station used is 150 MW. The specific parameters of the hydropower station are shown in Table 1.
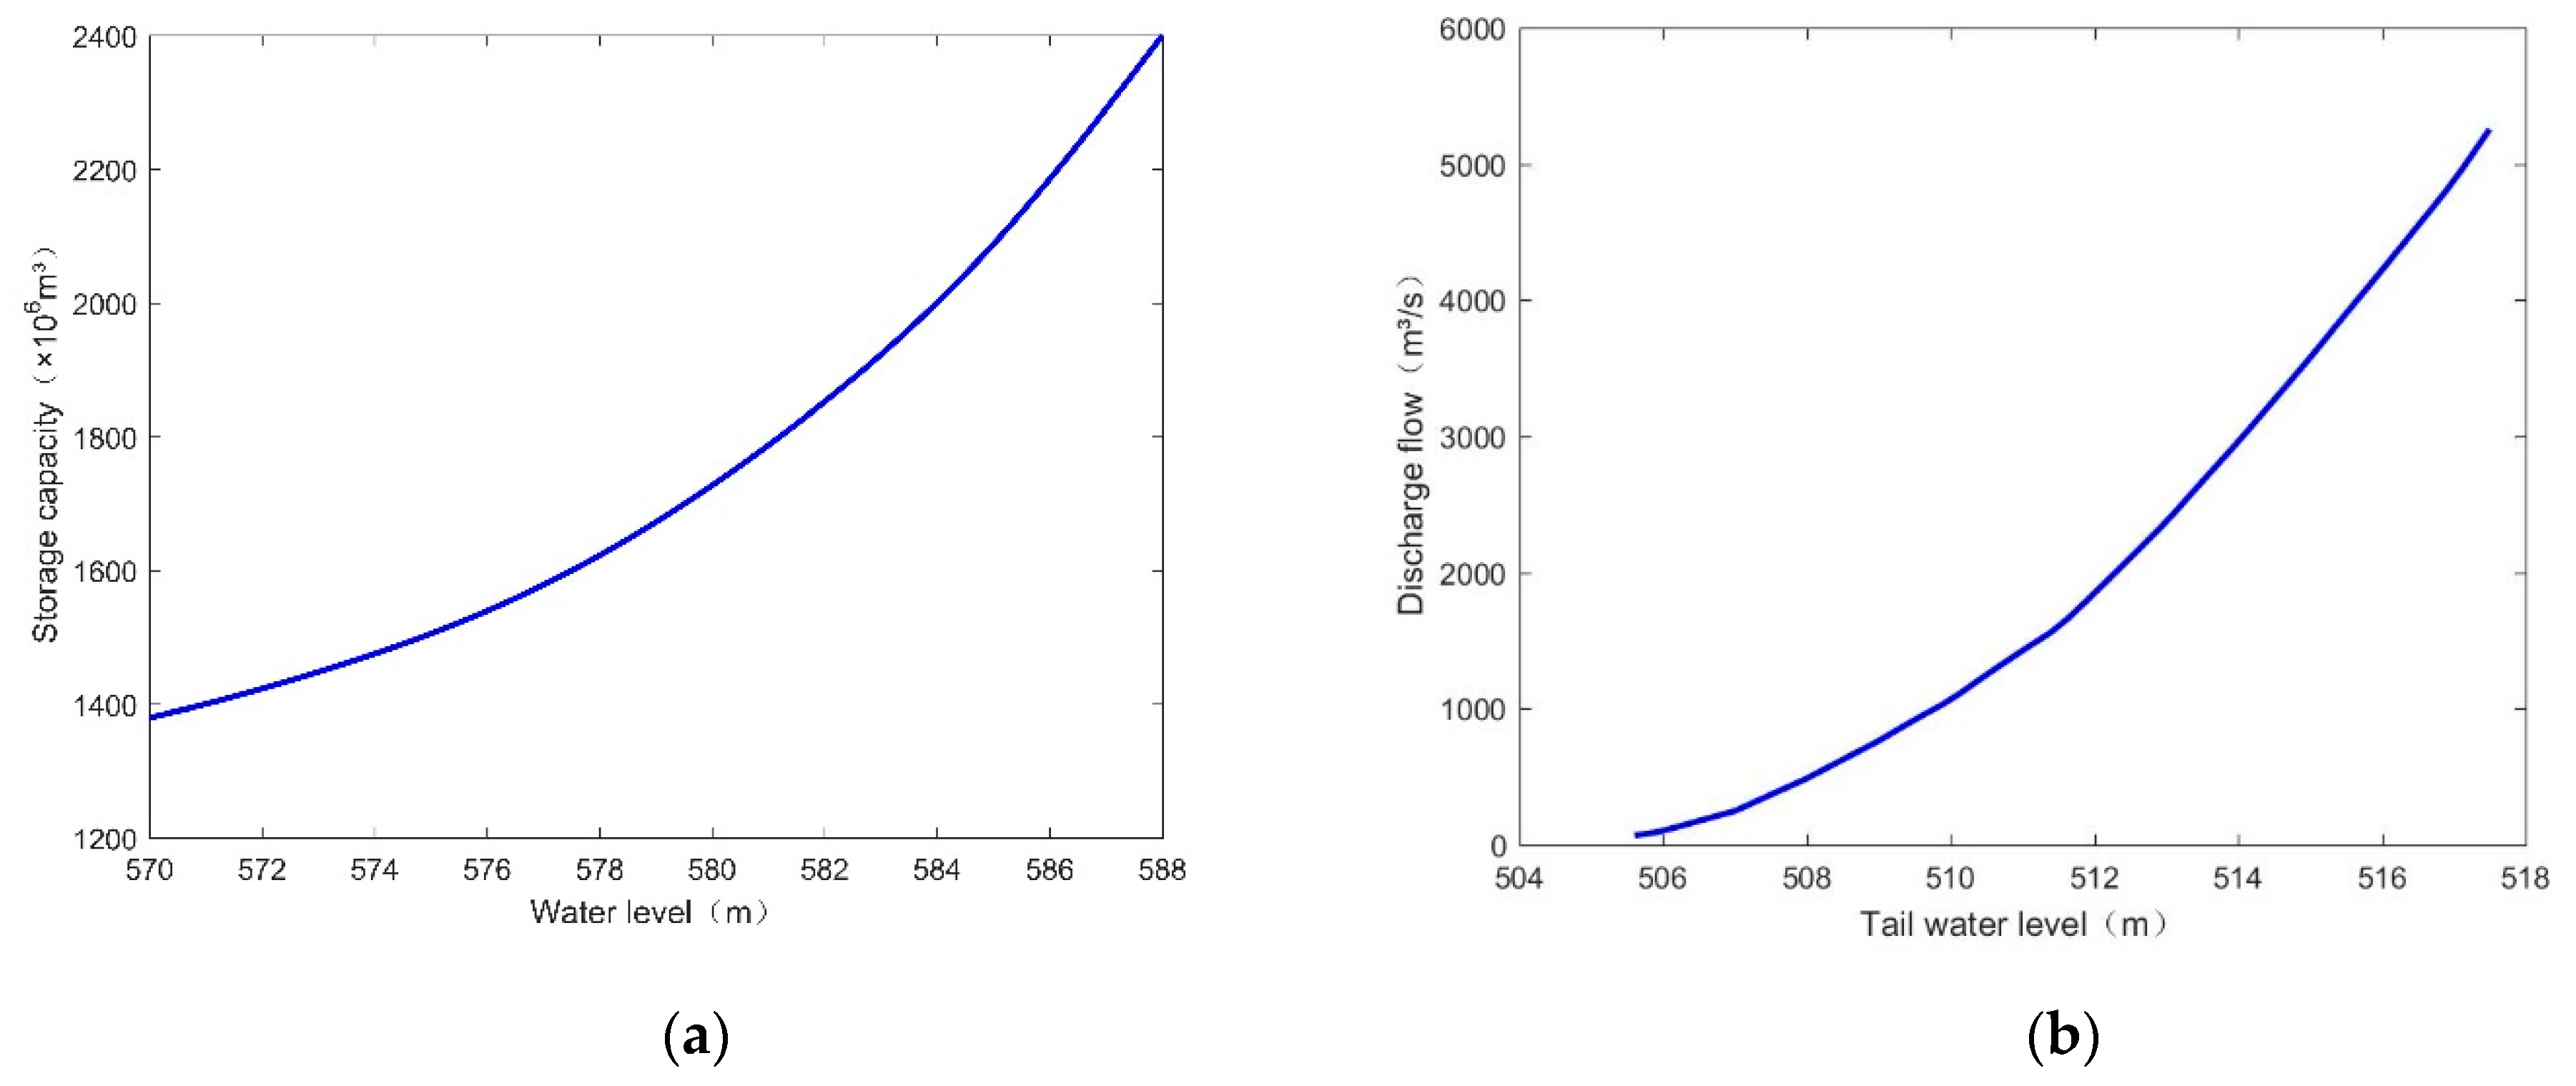
The relationship between water level and storage capacity of the reservoir and the relationship between downstream water level and flow is shown in Figure 6.
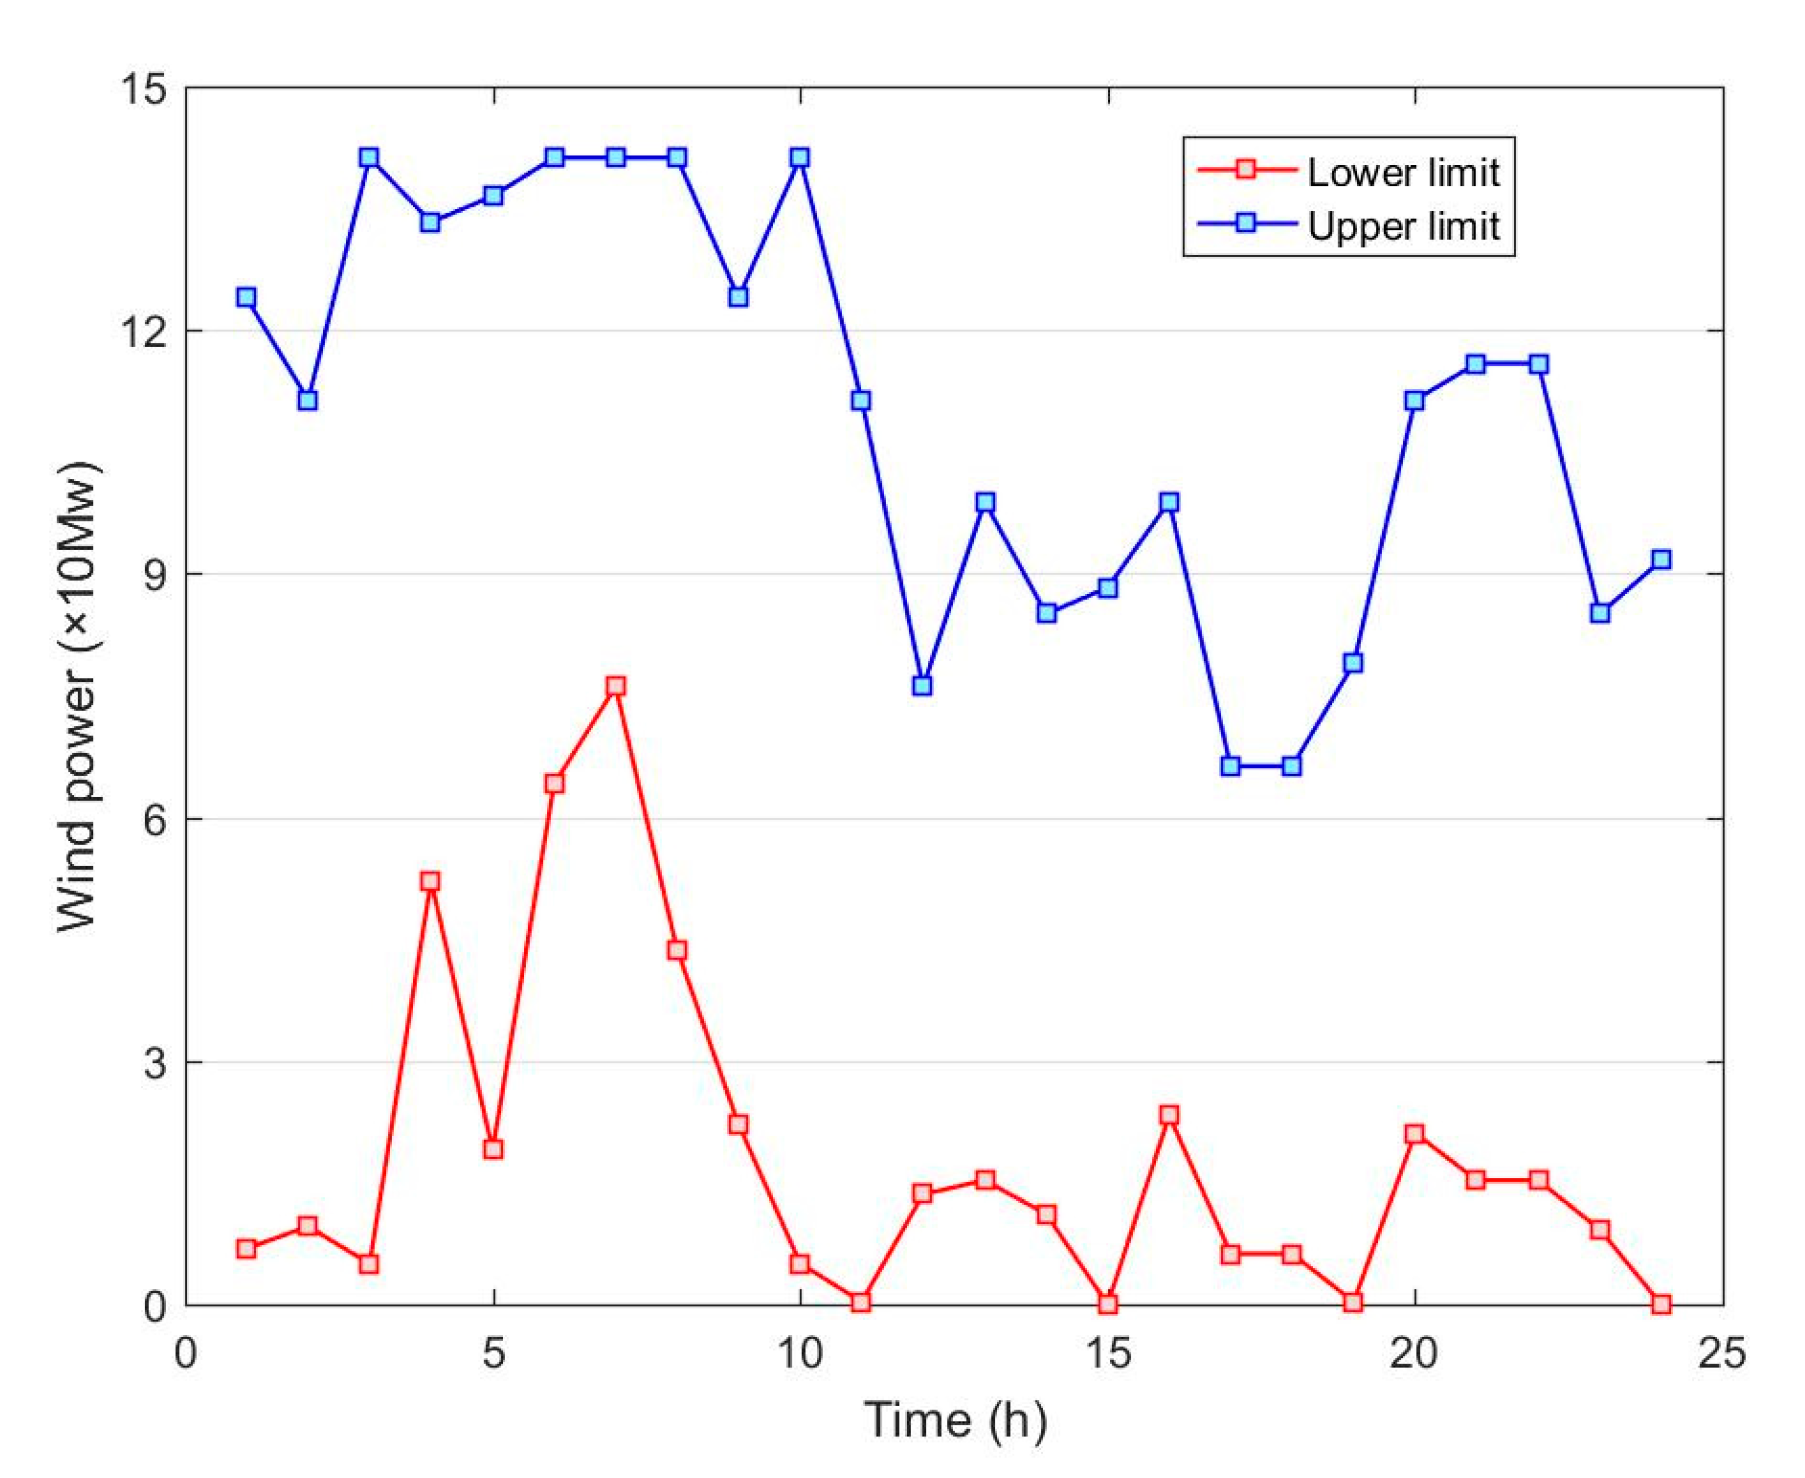
According to the wind power interval prediction model based on the Copula function established in the Ref [38], the interval prediction of the original wind power output is carried out. The confidence level is selected as 0.93. As the confidence level increases, the larger the interval coverage of the prediction result, the fewer the data points that are beyond the limit. It means that more actual values fall within the obtained wind power range. However, at the same time, the average width of the interval also increased, and the prediction result is conservative, which cannot provide more effective information for scheduling decision-making. Therefore, the confidence interval is 0.93. The result obtained is used as the wind power output data in the wind power and hydropower joint dispatching. The result is shown in Figure 7.
3.2. Determine Some Indicators and Parameters
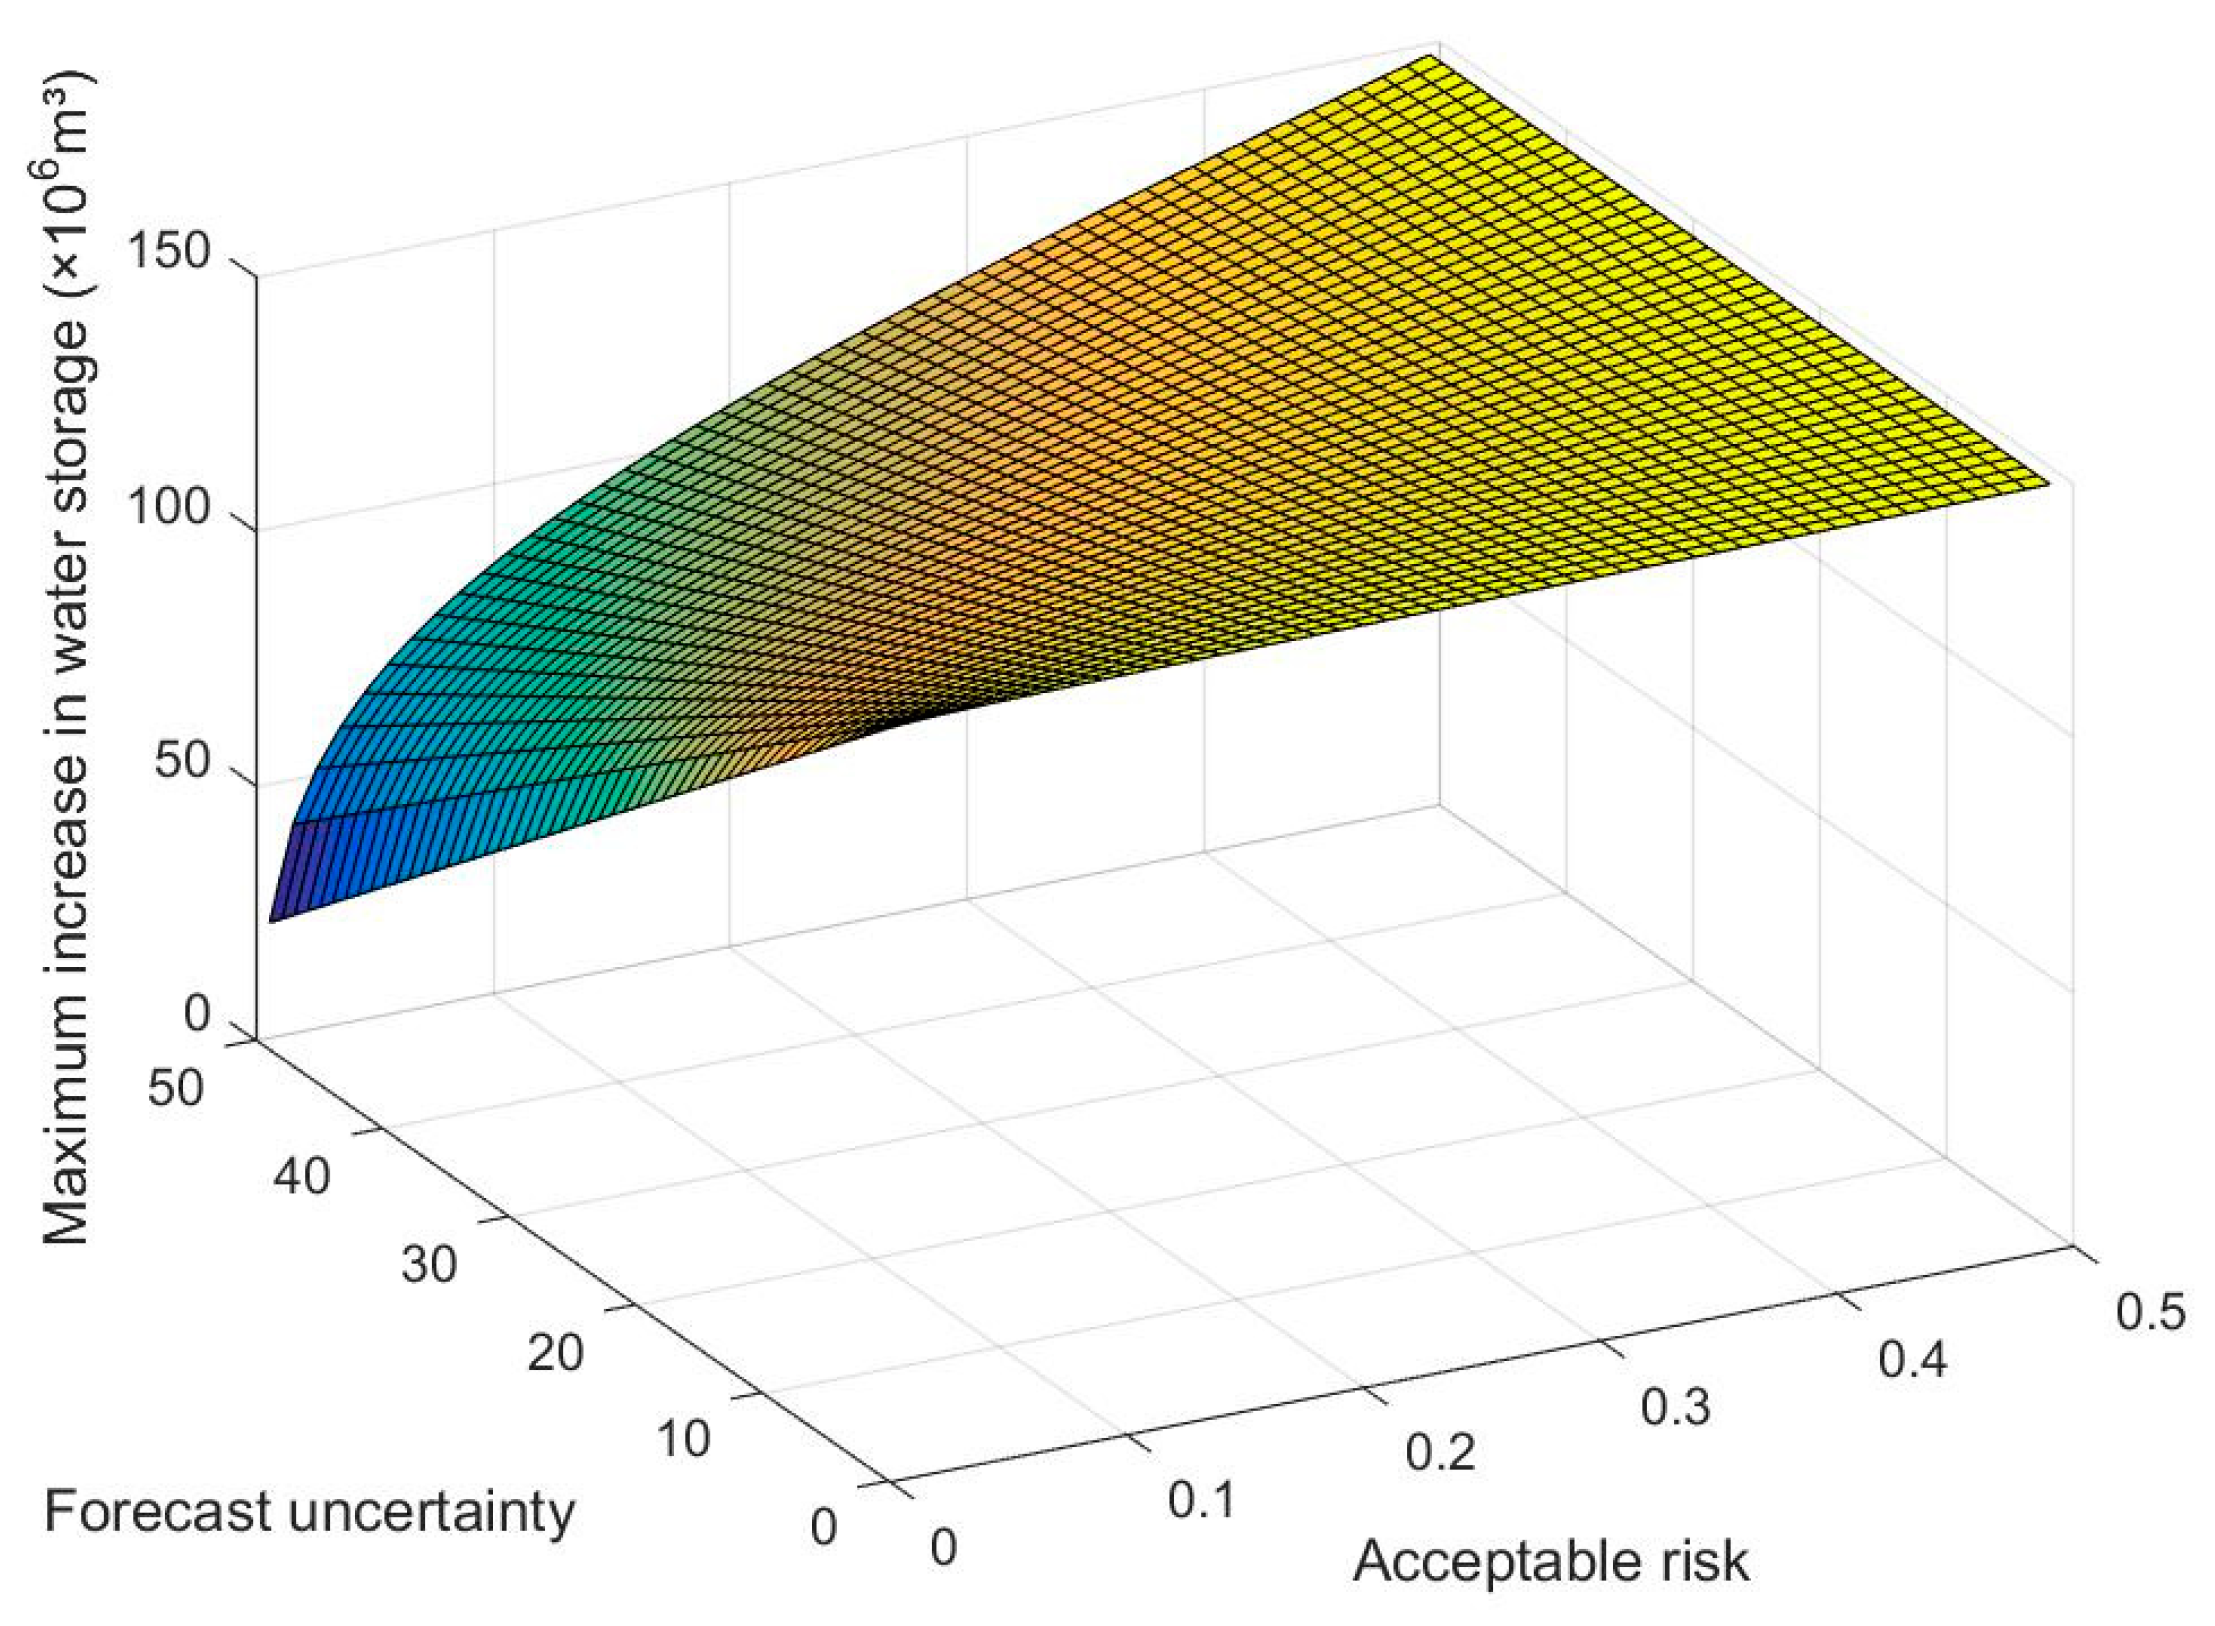
For the flood season, when moderate or heavy rain is forecasted or moderate rain or heavy rain has occurred, the increased water storage capacity shall be released as soon as possible; that is, the water level shall be reduced to the original flood limit water level of 583 m as soon as possible. If there is no rain in the future, excess water will be stored on the basis of meeting other benefits such as power generation and water supply. There is a functional relationship between the maximum pre-stored water value, the acceptable risk of downstream flood control safety, and the uncertainty of forecast information.
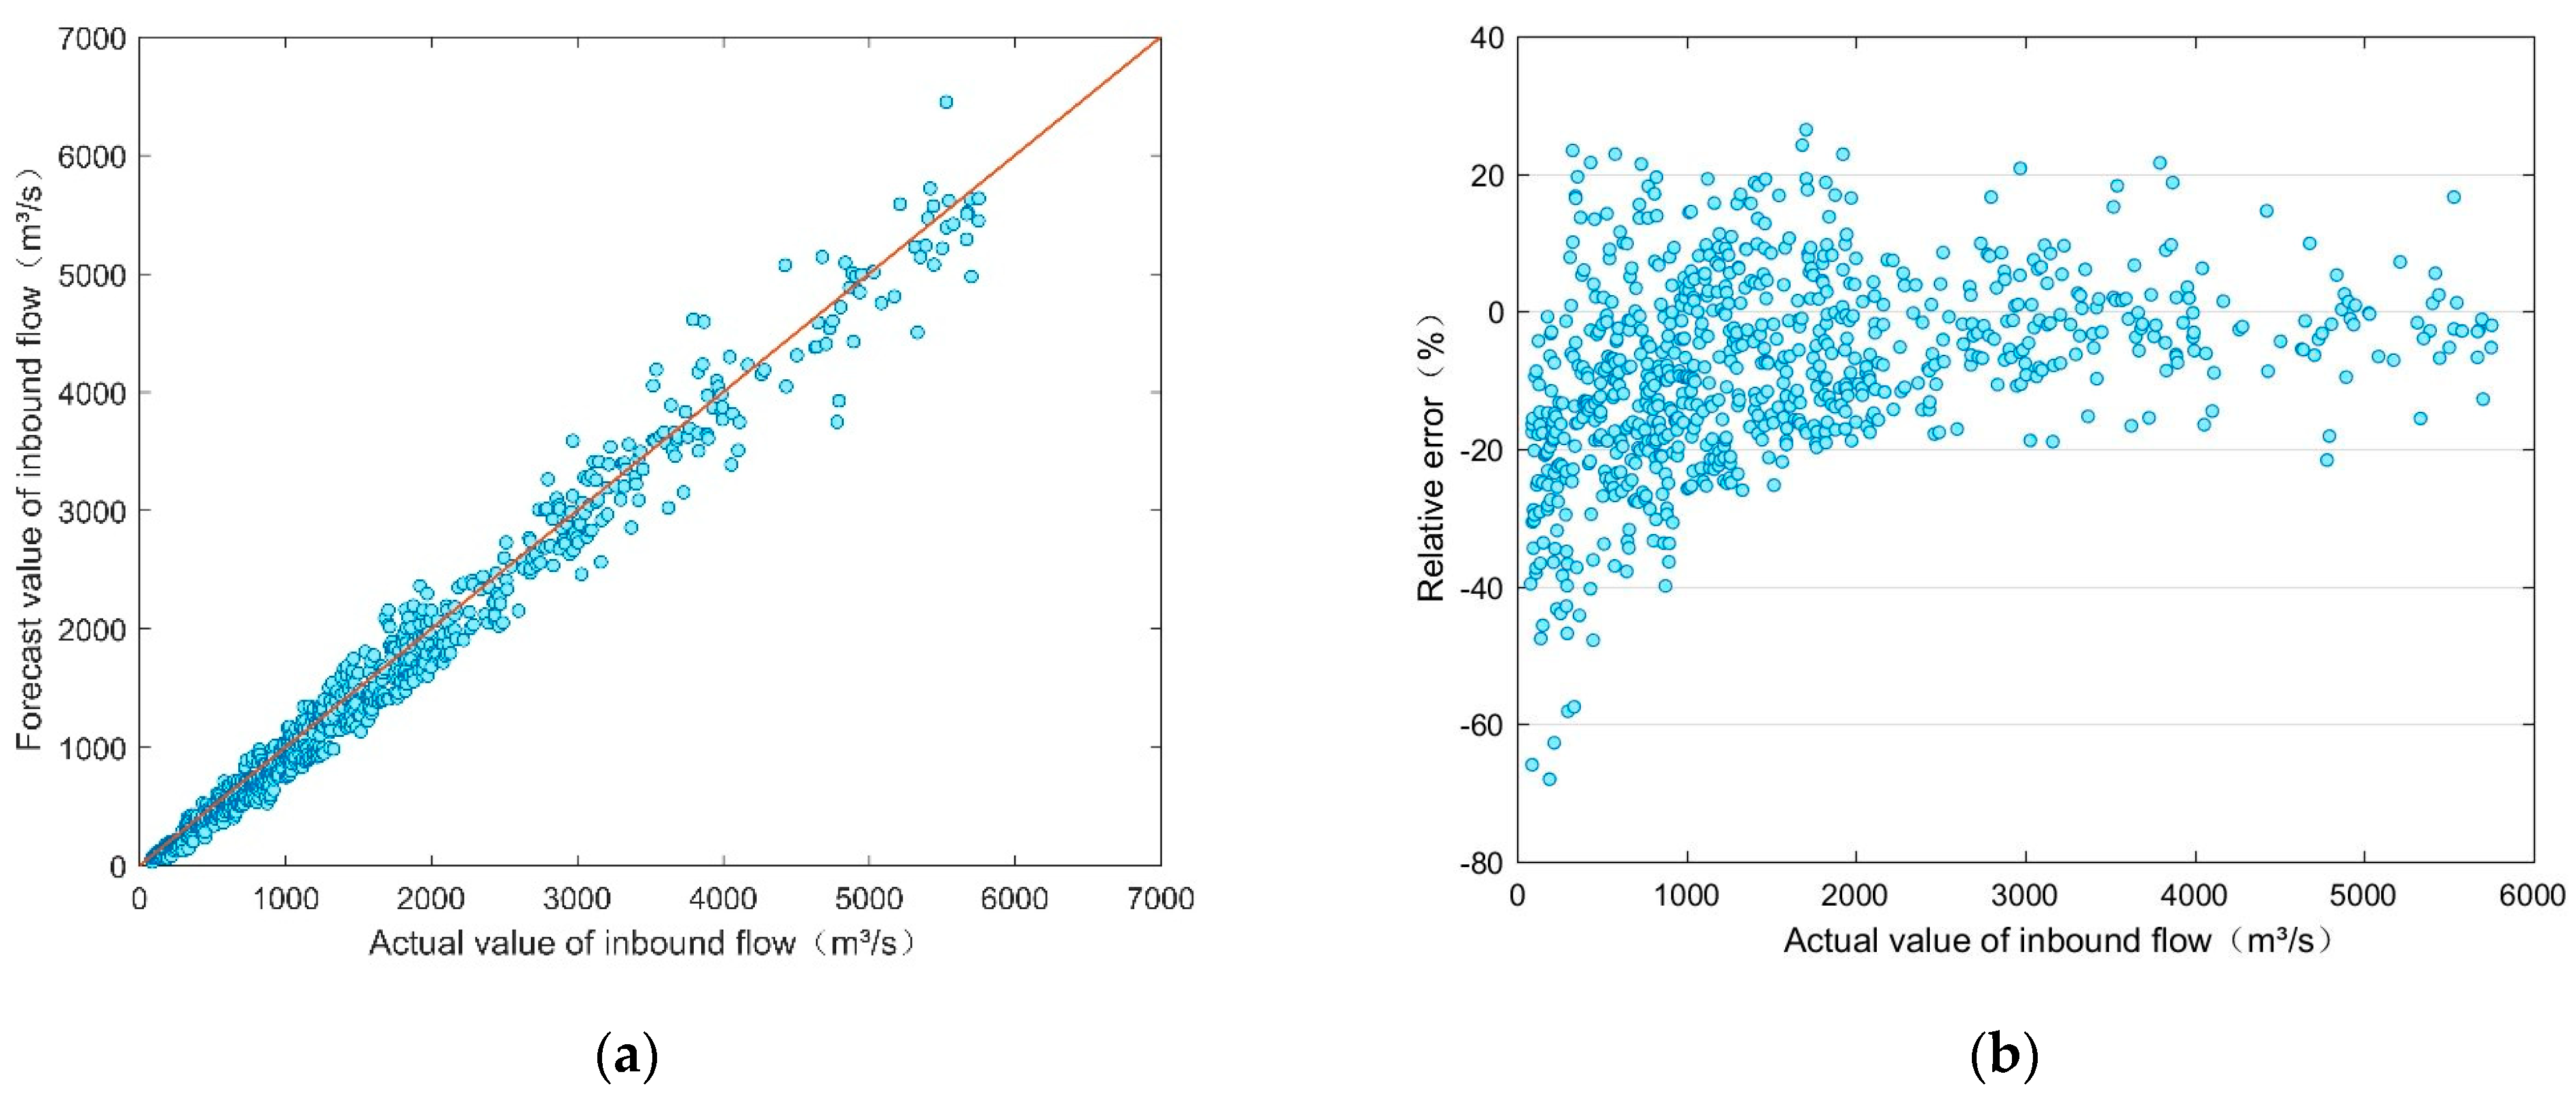
First, we analyze the error of the forecasted inflow of the hydropower station. Figure 8 shows the relationship between actual inflow and predicted inflow of the hydropower station, and the size of relative error. There are 800 sets of data, among which 654 sets of data with a relative error less than 20%, and the ratio is 81.75%; that is, the qualified rate is 81.75%. However, there is still a small amount of data with a large relative error. From the analysis was found that when the relative error is greater than 40%, the incoming water volume is very small. For example, the inflow is 125.64 m3/s; the relative error is 58.12%, and the forecast inflow is 300 m3/s; although the error is large, it is relatively safe. The Shapiro-Wilk method [39] was used to test the normal distribution of the forecast error, and the result showed that the significance level was greater than 0.05, indicating that the absolute error of the incoming water forecast obeys the normal distribution. Its distribution is , and its average is negative, indicating that the overall forecast value is a little large.
According to the downstream flood control risk determination method proposed in Ref [32], the relationship among the factors is shown in Figure 9. It can be seen that when the forecast uncertainty level increases or the acceptable risk decreases, the maximum allowable downstream storage capacity will decrease. According to the forecast model established in this paper, under the current forecasting level, the forecast error analyzed above obeys the normal distribution . When the downstream flood control acceptable risk is 0.006, the maximum increasable water storage capacity can be obtained as 63.0 × 10⁶ m3, and the corresponding reservoir water level is 583.90 m. The water storage level of the hydropower station is 588 m, which corresponds to a total storage capacity of 2400 × 106 m3.
3.3. Analysis of the Dispatch of Hydropower and Wind Power Based on Hedging Theory
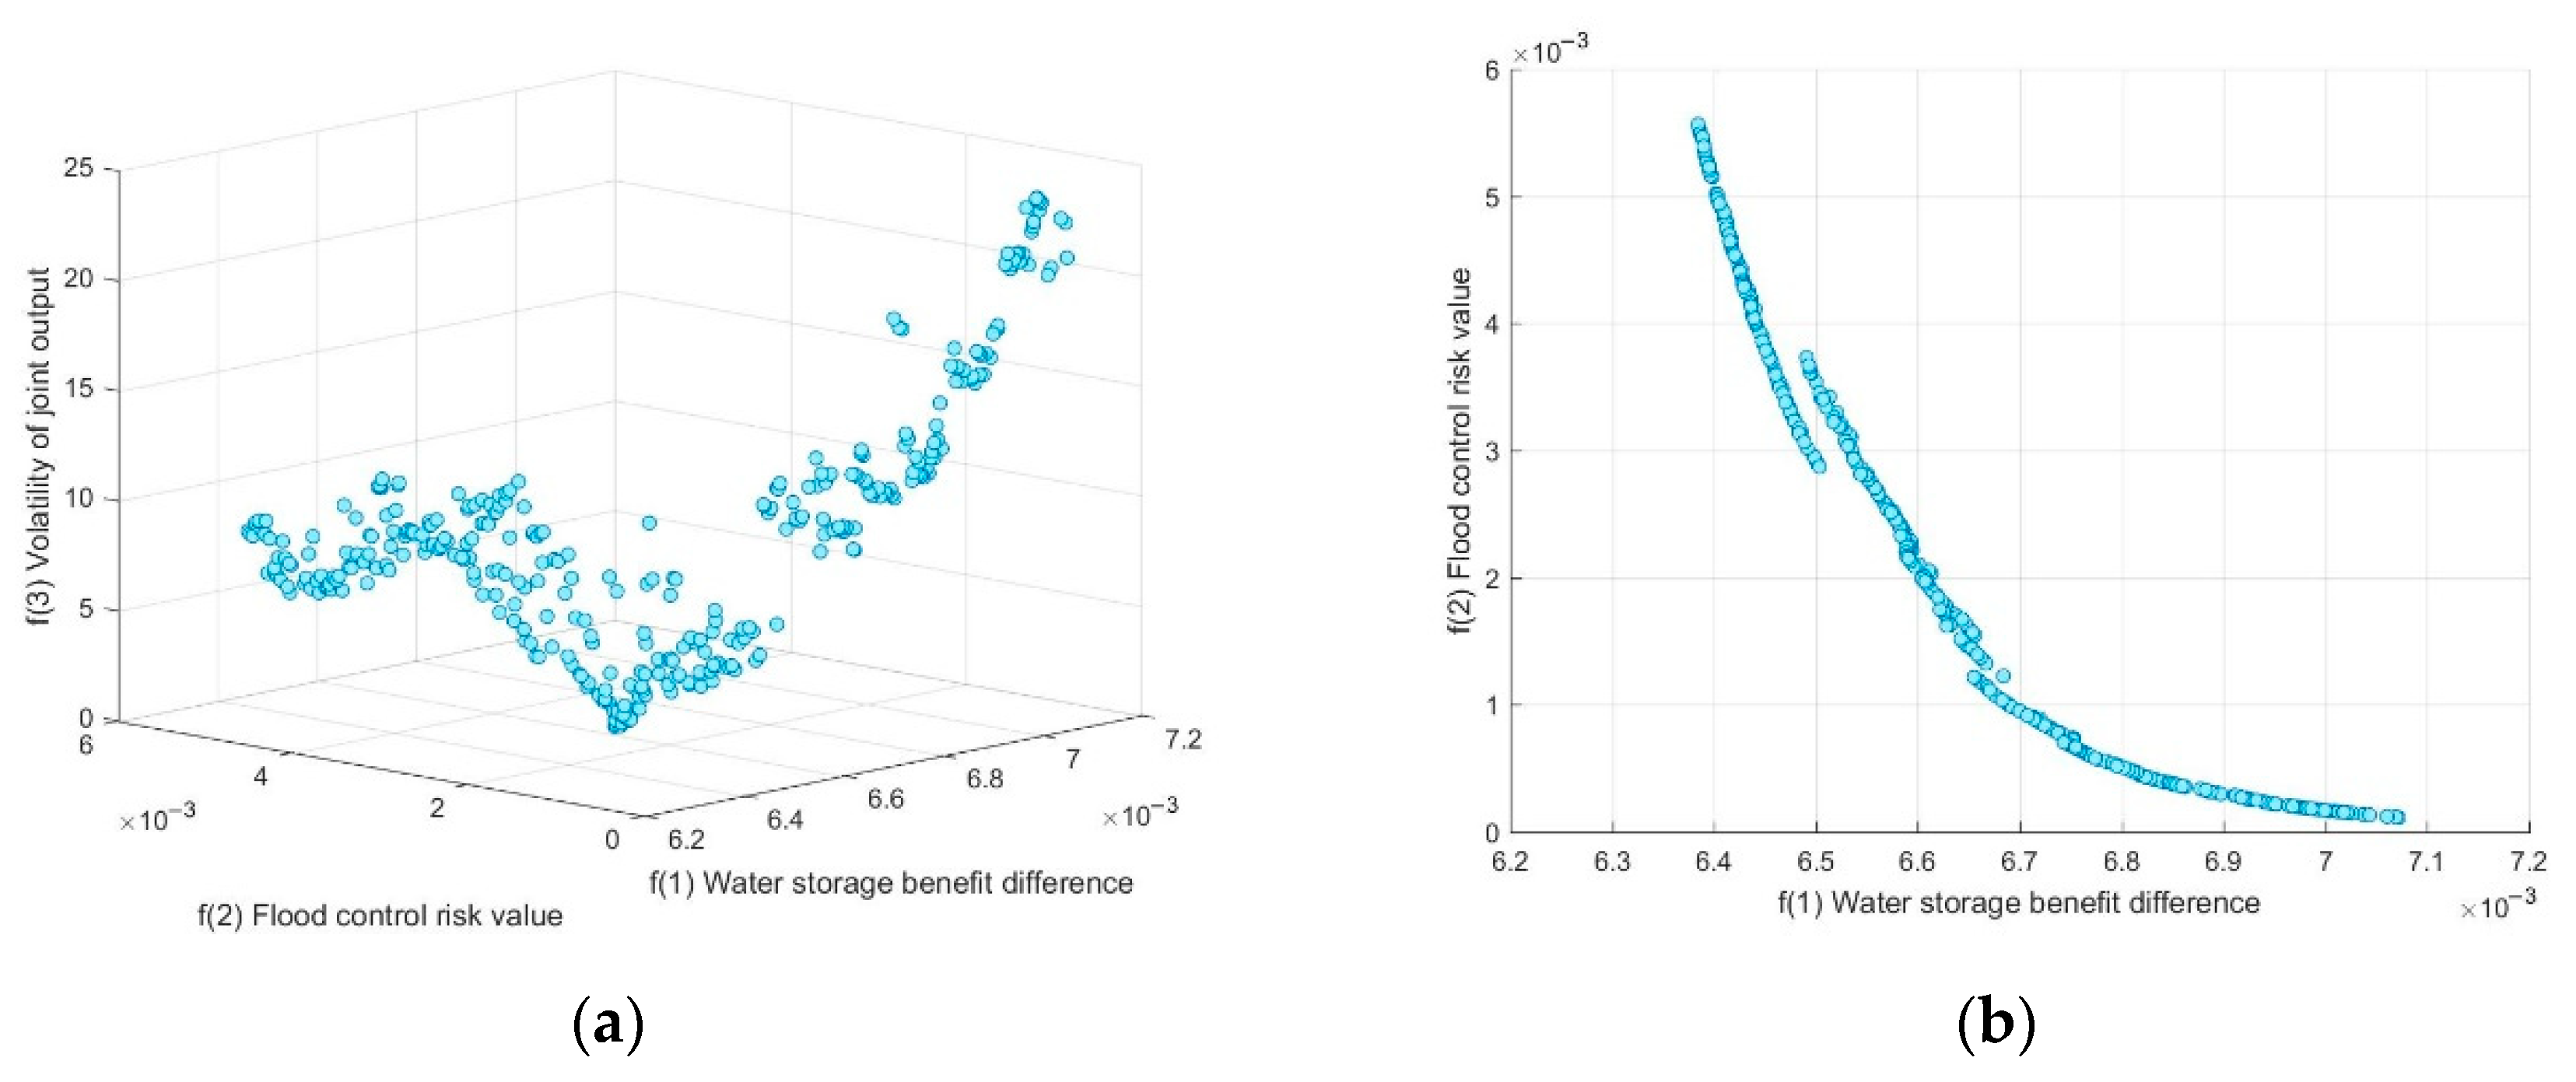
According to the joint scheduling model established in Part 3, the calculation example is analyzed and verified. The optimal frontier of Pareto obtained by using the NSGA2 algorithm is shown in Figure 10.
Figure 10 shows the Pareto optimal frontiers of multi-objective optimization. Among them, Figure 10a is the Pareto optimal frontier for the three goals of water storage benefit, flood control risk, and joint output volatility, and Figure 10b is the Pareto optimal frontier between the water storage benefit and flood control risk in Figure 10a. It can be seen from Figure 10b that there is a contradictory hedging relationship between the flood control risk value and the water storage benefit difference. When the water storage capacity increases, the difference in water storage benefits will decrease, but the flood control risk value will increase accordingly. However, due to the existence of the benefit goal of joint output, there is an overlap in the figure. At the same time, it can be seen from Figure 10a that the regulating capacity of hydropower stations will also be affected, which will affect the volatility of the joint dispatch of hydropower and wind power. Therefore, there is a certain competitive relationship among the three goals of the differences in water storage benefit of hydropower stations, the risk value of flood control, and the volatility of joint dispatch: There is an inverse proportional relationship between the profit benefit difference goal and the flood control risk goal of the reservoir, and the joint output volatility goal shows a trend of first decreasing and then increasing with the increase of the water storage benefit. When the water storage is large and the water discharge is small, the hydropower output value is small, and the regulation ability of wind power is reduced. When the water storage is small and the water discharge is large, in order to ensure that the amount of water discarded is small or not, the regulation ability of hydropower to wind power will also be affected. Table 2 presents the three sets of solutions with the best water storage benefit, the best flood control risk, and the best joint output volatility, as well as the most satisfactory solution selected according to the multi-objective compromise strategy.
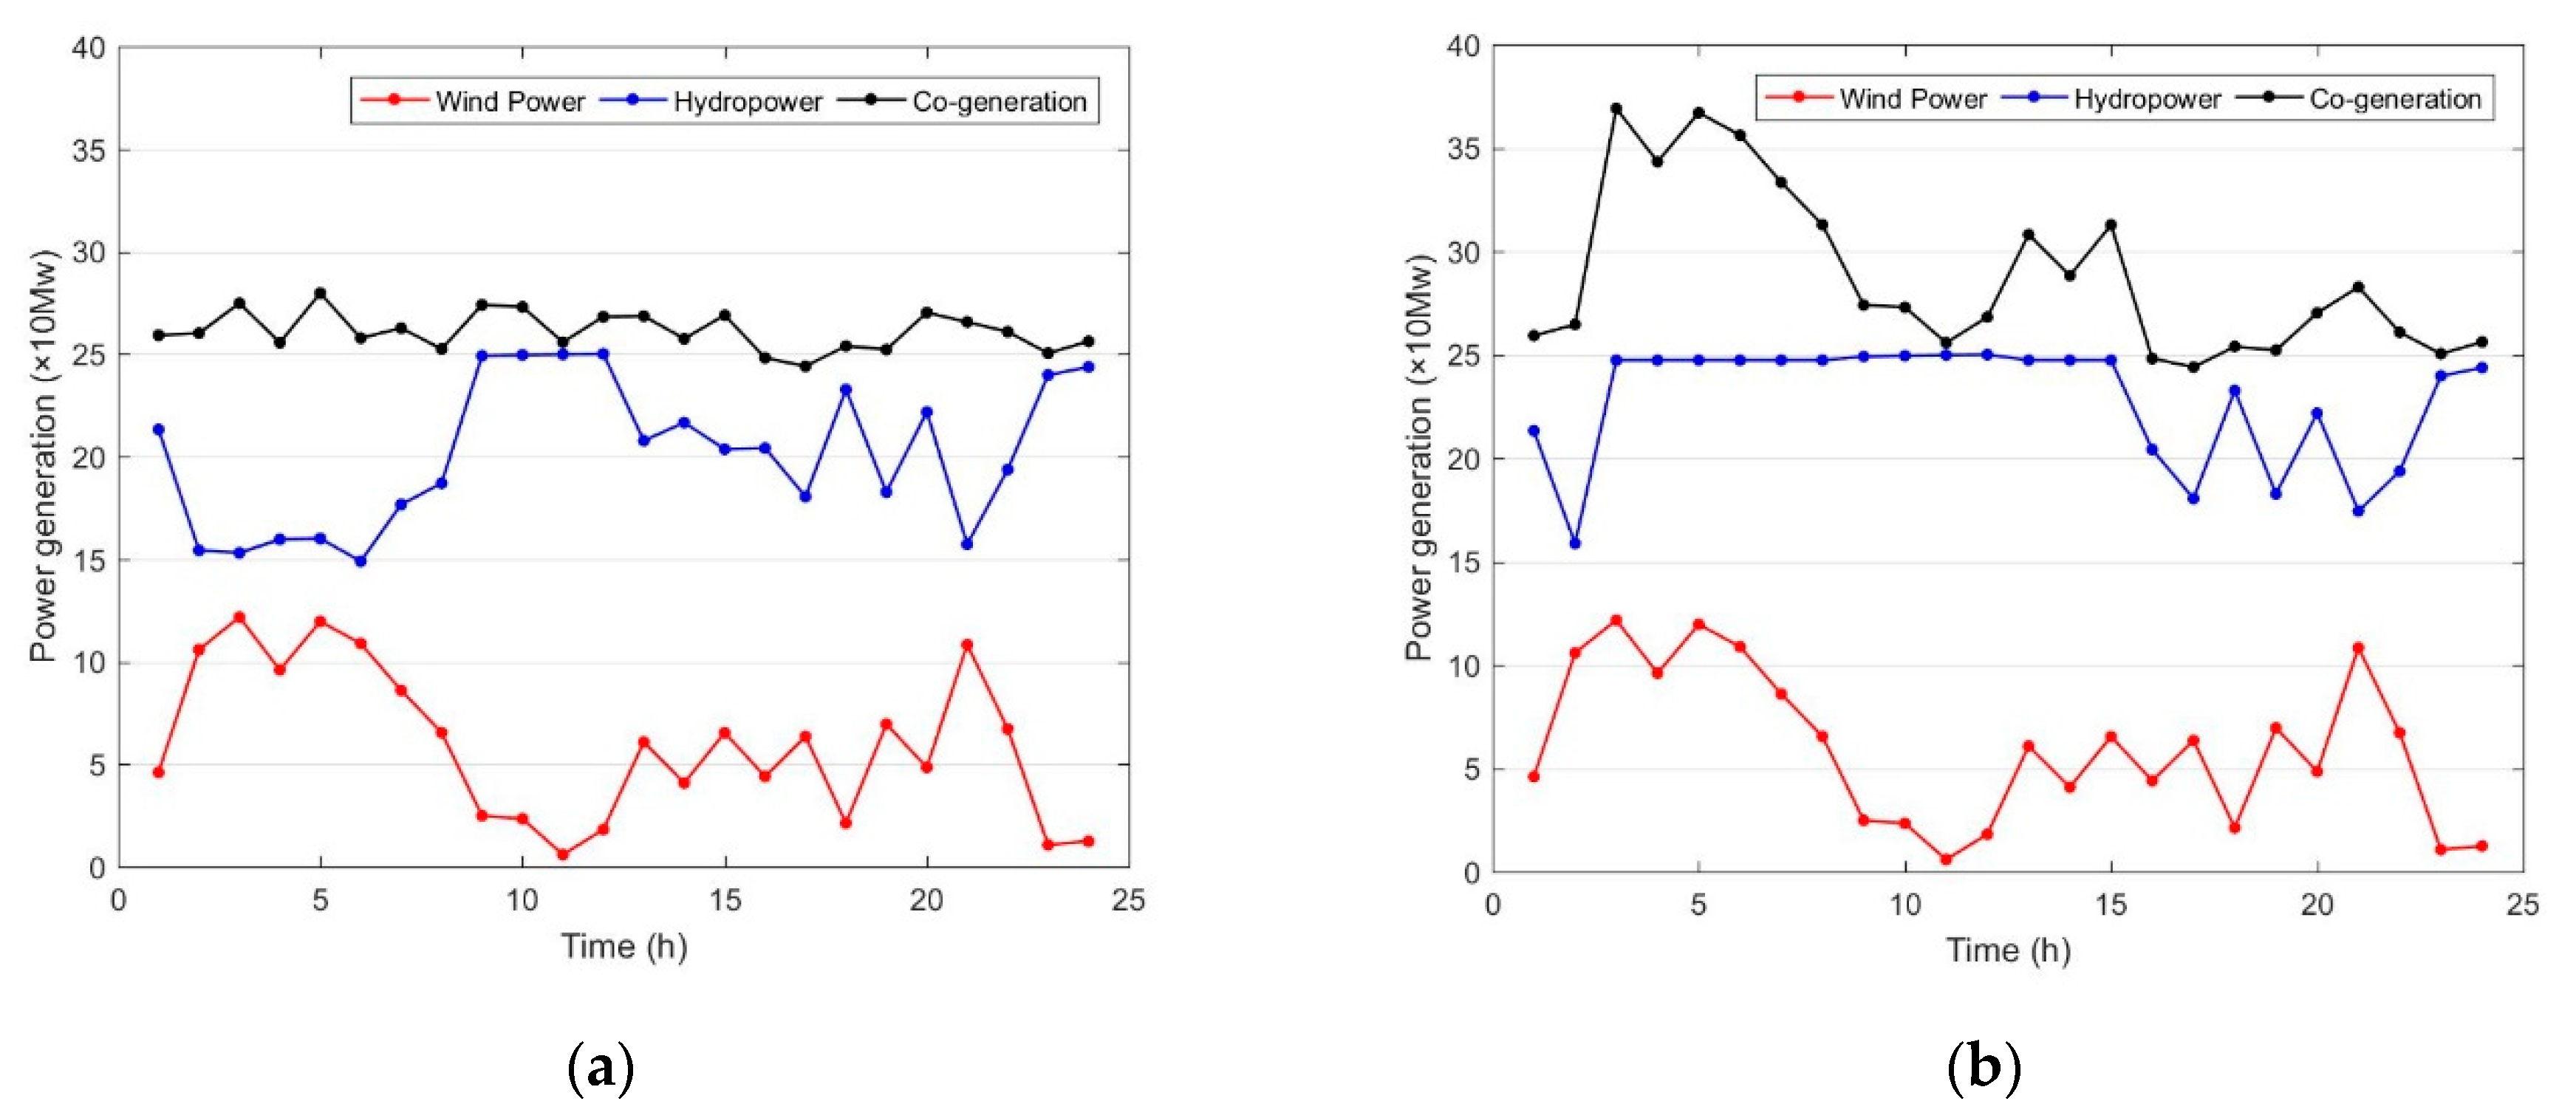
According to the multi-objective compromise strategy and for this example, it is necessary to ensure the safety of flood prevention as much as possible to determine the optimal solution, and the obtained dispatch curve result is shown in Figure 11a.
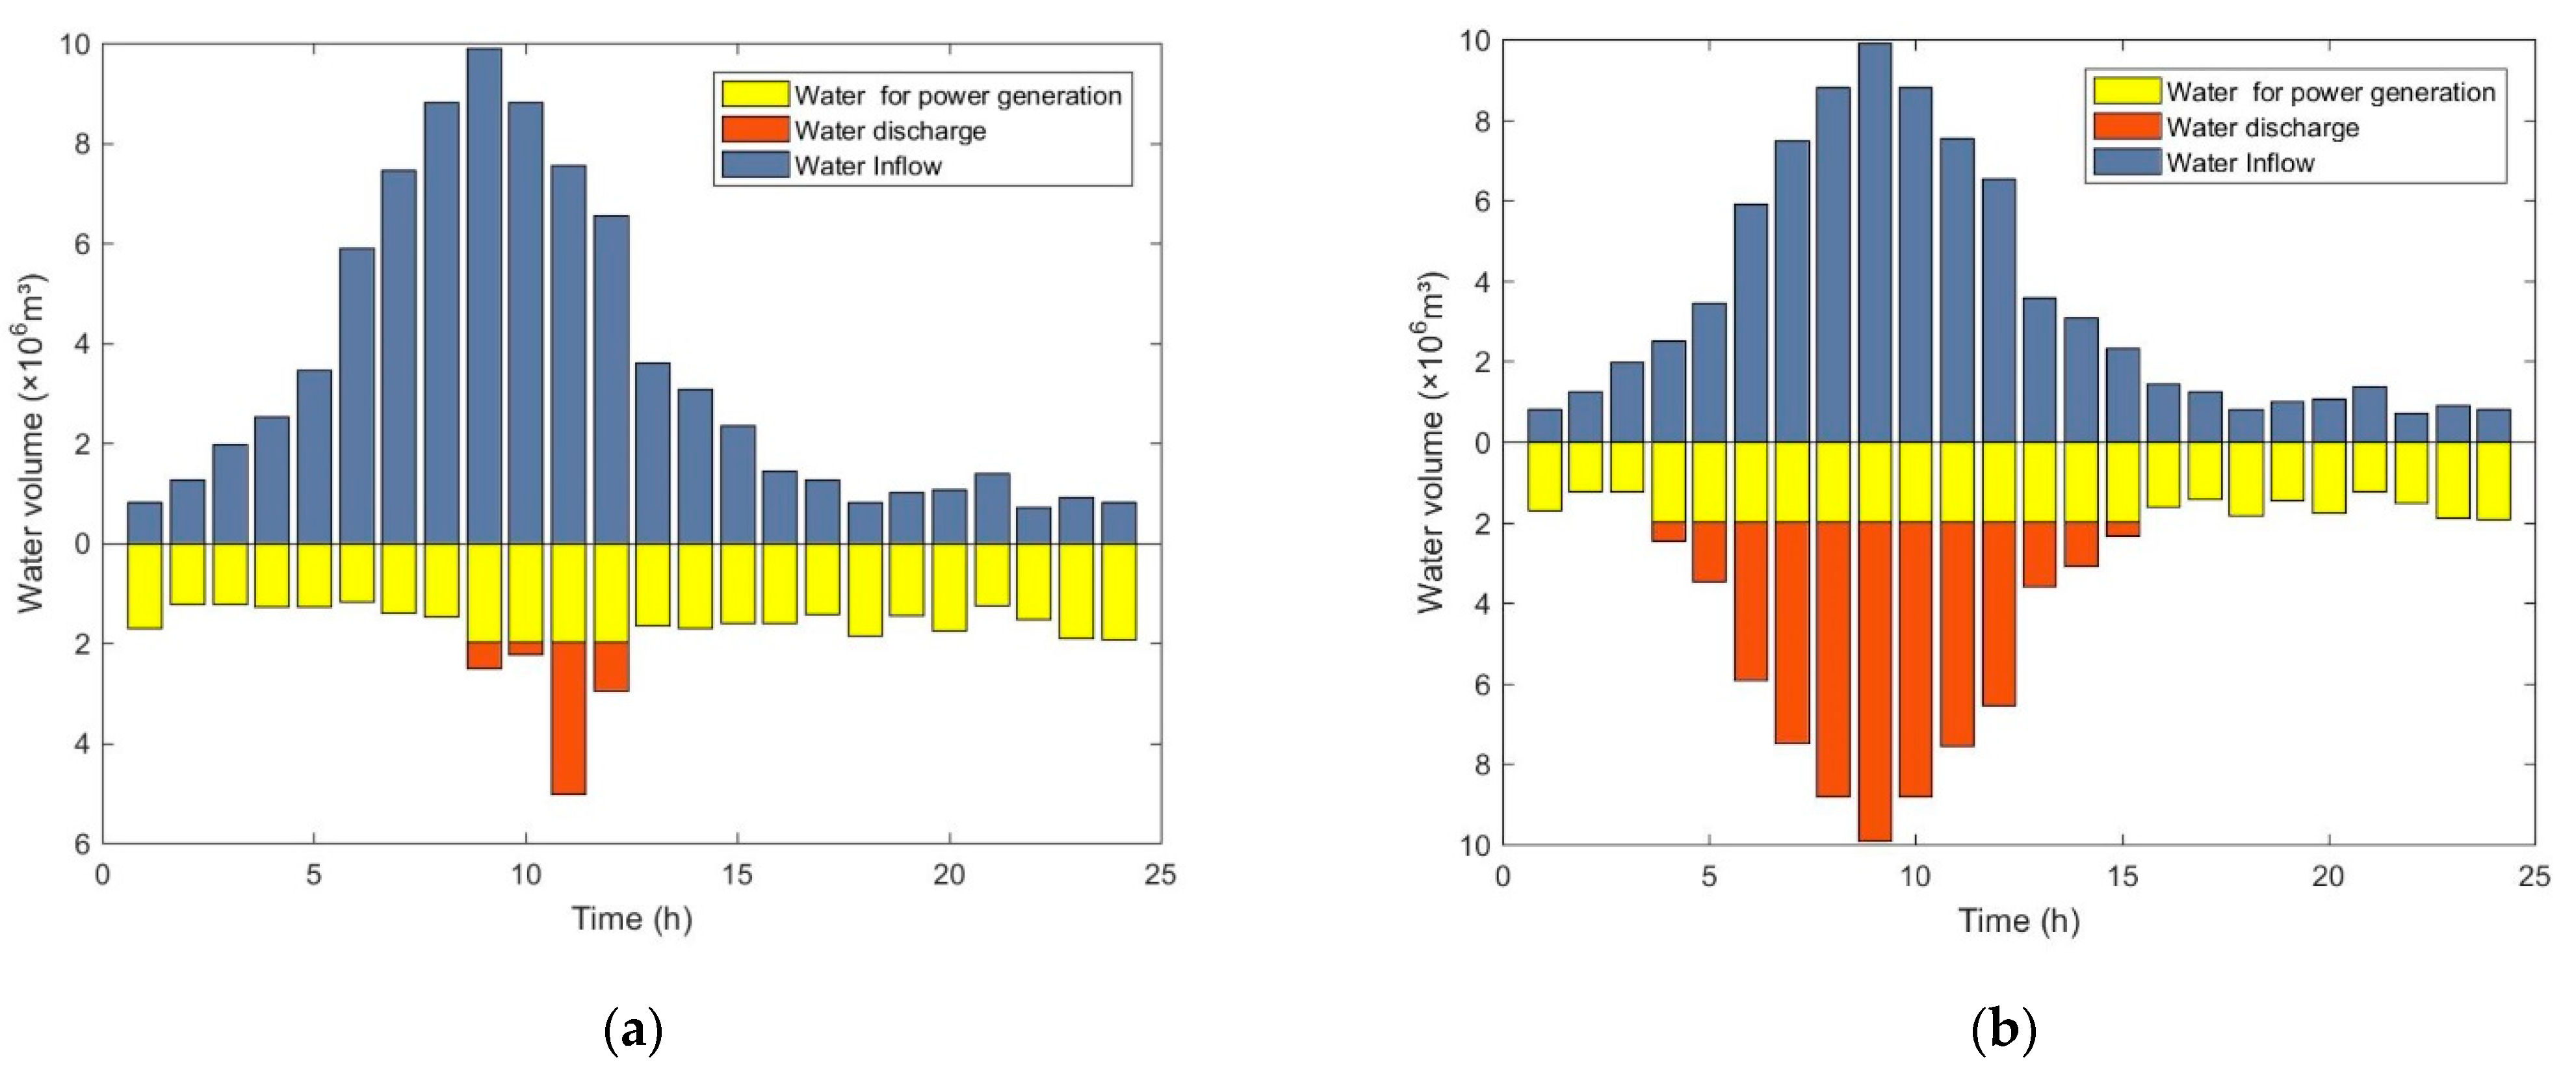
Figure 11 is a comparison diagram of the results of hydropower and wind power joint dispatch based on the hedging theory and conventional hydropower and wind power joint dispatch. Figure 11a is the dispatch result based on the hedging theory. It can be seen that on the basis of ensuring the safety of flood control during the flood season, the hydropower station stores the excess water outside the power generation plan in the reservoir on the basis of the original flood limit water level. It is necessary to y increase the amount of water storage appropriately, maximize the water resources during the flood season, and adjust the wind power output. When the wind power output is small, the hydropower output is increased, and when the wind power output is large, the water discharge is reduced to reduce the hydropower output, so that the volatility of the combined wind power and hydropower output is reduced. The traditional dispatching scheme is shown in Figure 11b. In order to ensure the safety of flood control, if the water level of the reservoir exceeds the flood limit water level, all the remaining water after the power generation task must be discharged to keep the reservoir water level at a safe flood limit water level. At the same time, in order to avoid the emergence of water abandonment, when the inflow of water is greater than the amount of water available for power generation, the hydropower station is basically in a full power generation state, and it is impossible to adjust the wind power output effectively. Therefore, the hydropower and wind power joint dispatching model increases the water storage benefit of the reservoir on the basis of ensuring the safety of flood control during the flood season. The public storage capacity is used to store the excess water in the reservoir, making full use of flood resources during the flood season, and at the same time keeping the joint output stable.
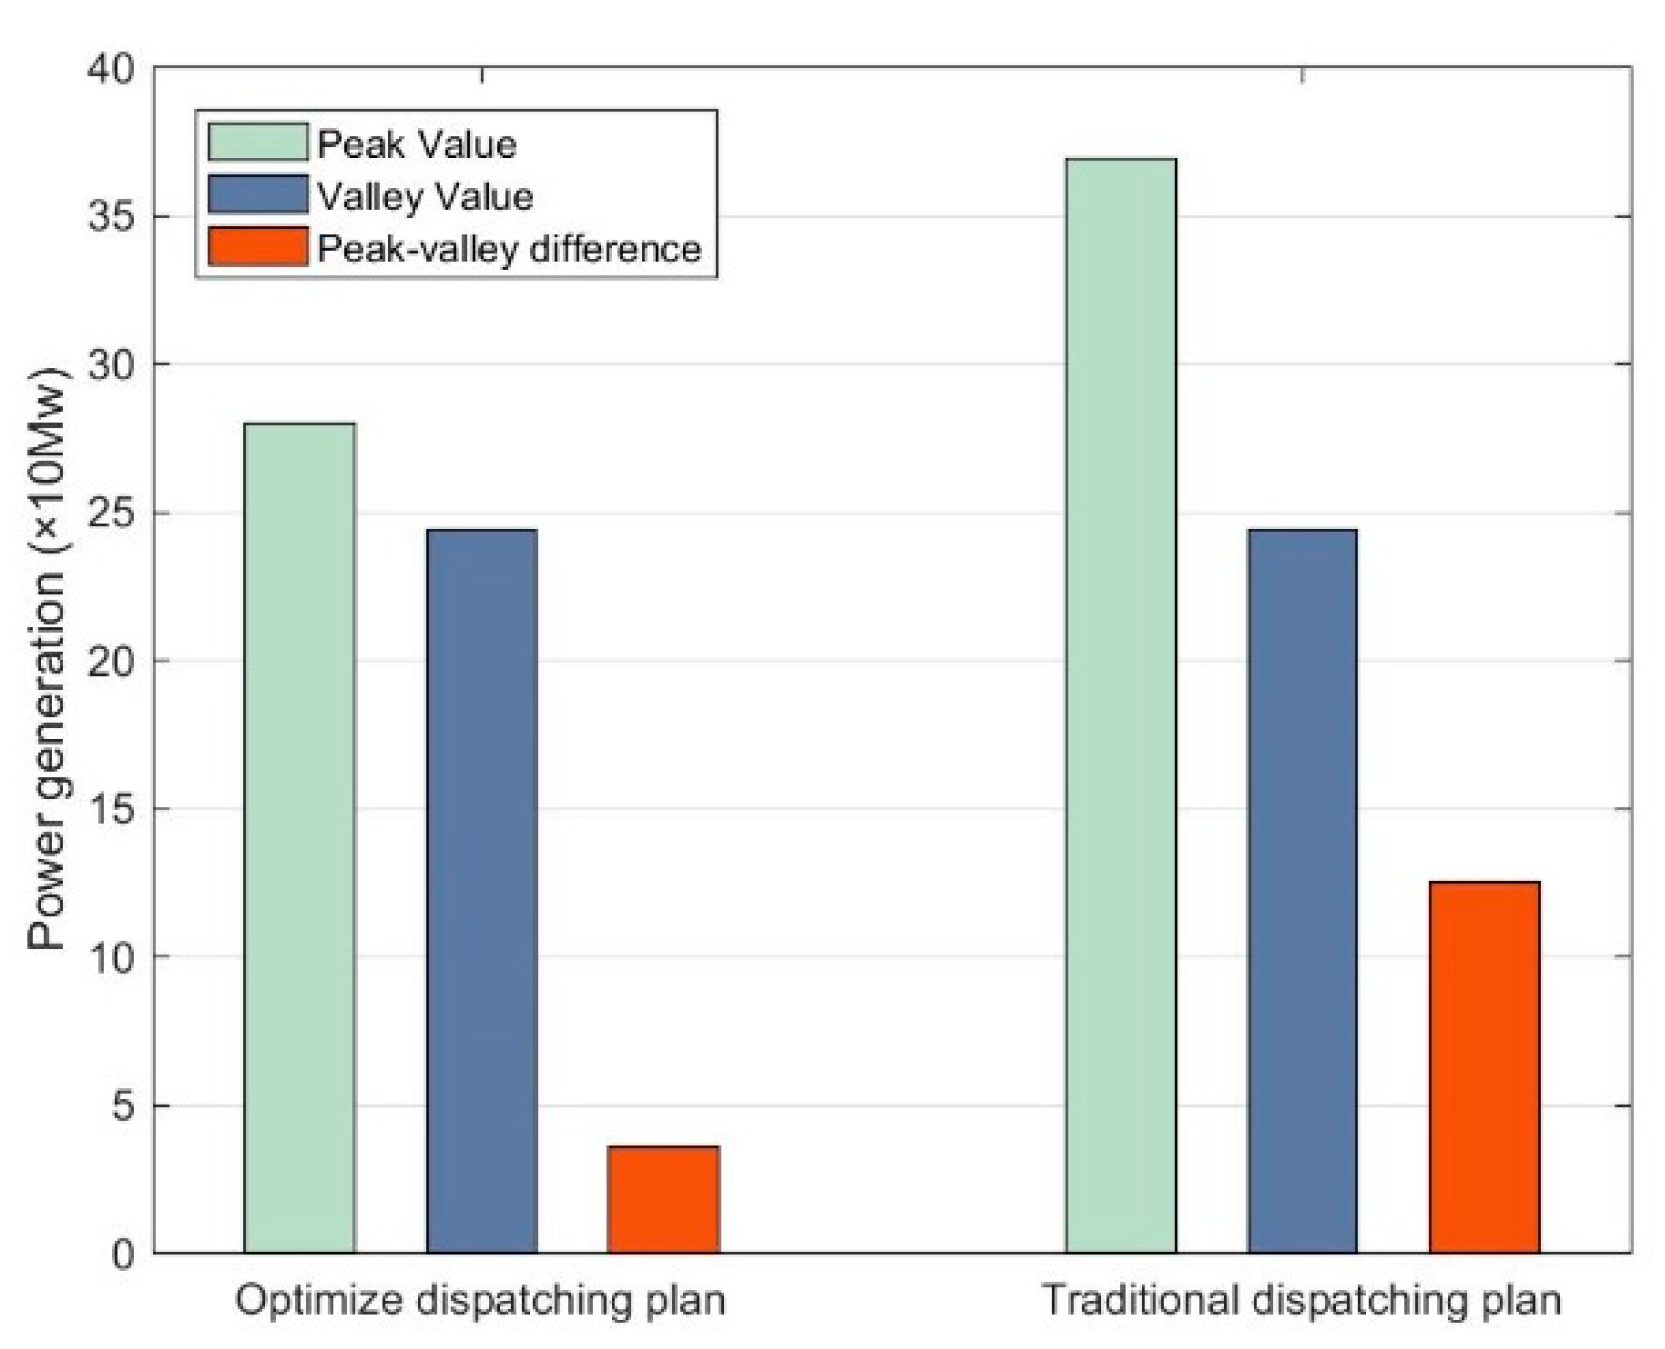
Figure 12 is a comparison diagram of the peak-to-valley difference between the optimized dispatching scheme and the joint output of the traditional scheme. It can be seen from the figure that the adoption of the multi-objective optimization dispatching scheme makes the peak-to-valley difference of wind power and hydropower combined output 35.66 MW, while the peak-valley difference of the conventional scheme is 125.00 MW. The optimal dispatching model enables part of the incoming water to be used for planned power generation, and the other part of the incoming water is stored in the reservoir under the conditions of flood prevention and safety, which increases the adjustment space of the hydropower station. Therefore, the curve is more stable and less volatile, which has a positive significance for wind power consumption.
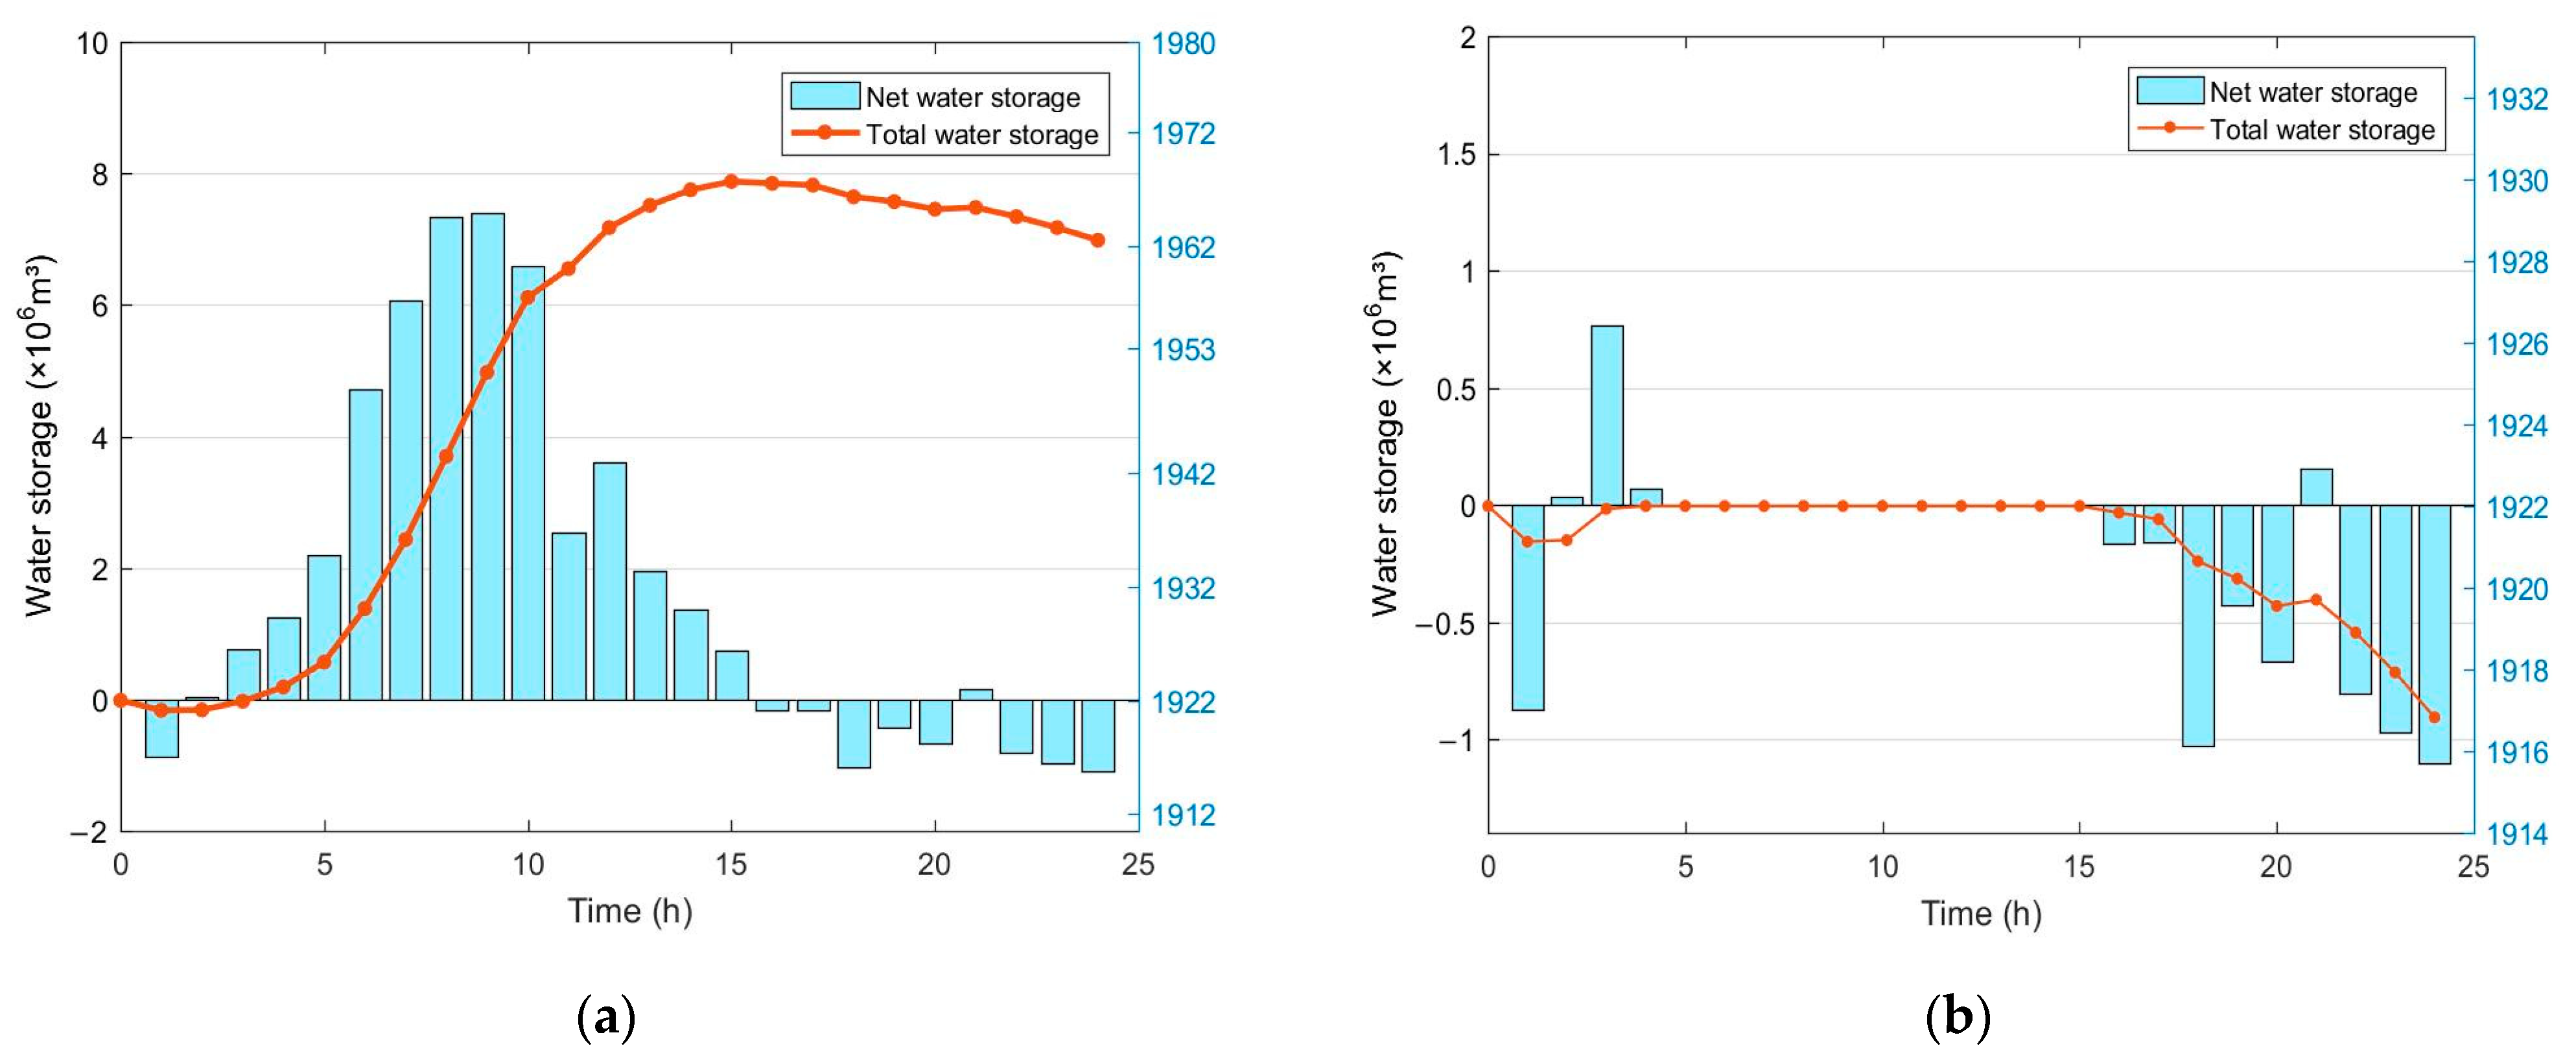
Figure 13 and Figure 14 show the comparison of inflow, discharge, net storage, and total reservoir storage between the hydropower and wind power joint dispatch based on hedging theory and conventional dispatch. Figure 13b shows the changes in the storage capacity of the conventional reservoir operation. In order to ensure the safety of flood control during the flood season, the storage capacity of the reservoir is guaranteed to be below the storage capacity (1922 × 106 m3) corresponding to the flood limit water level (583 m). When the water storage is less than 1922 × 106 m3, or the incoming water volume is less than the power generation water volume, the water volume beyond the completion of the power generation plan can be stored in the reservoir, as shown in Figure 13b for period 1–period 3. When the water storage reaches 1922 × 106 m3, the reservoir must safely discharge the excess storage, as shown in Figure 13b during the period 4–15. Additionally, in order to prevent water abandonment, the hydropower station is generally full-load at this time, which is not conducive to the smooth output of wind power and hydropower joint output. After time period 16, when the inflow of the reservoir is less than the water consumption for power generation, the reservoir needs to use the storage capacity below the flood limit water level for power generation. The original dispatch plan made the water resources underutilized. In Figure 13a, the hydropower and wind power joint dispatch scheme based on hedging theory uses public storage capacity to pre-store the excess water in the reservoir during periods of large inflows. Additionally, when the inflow of water and the inflow of the downstream area suddenly increase, the excess water in the reservoir can be safely discharged. Then, the water level drops back to the flood limit water level, making full use of flood resources on the basis of ensuring the safety of reservoirs and downstream control stations.
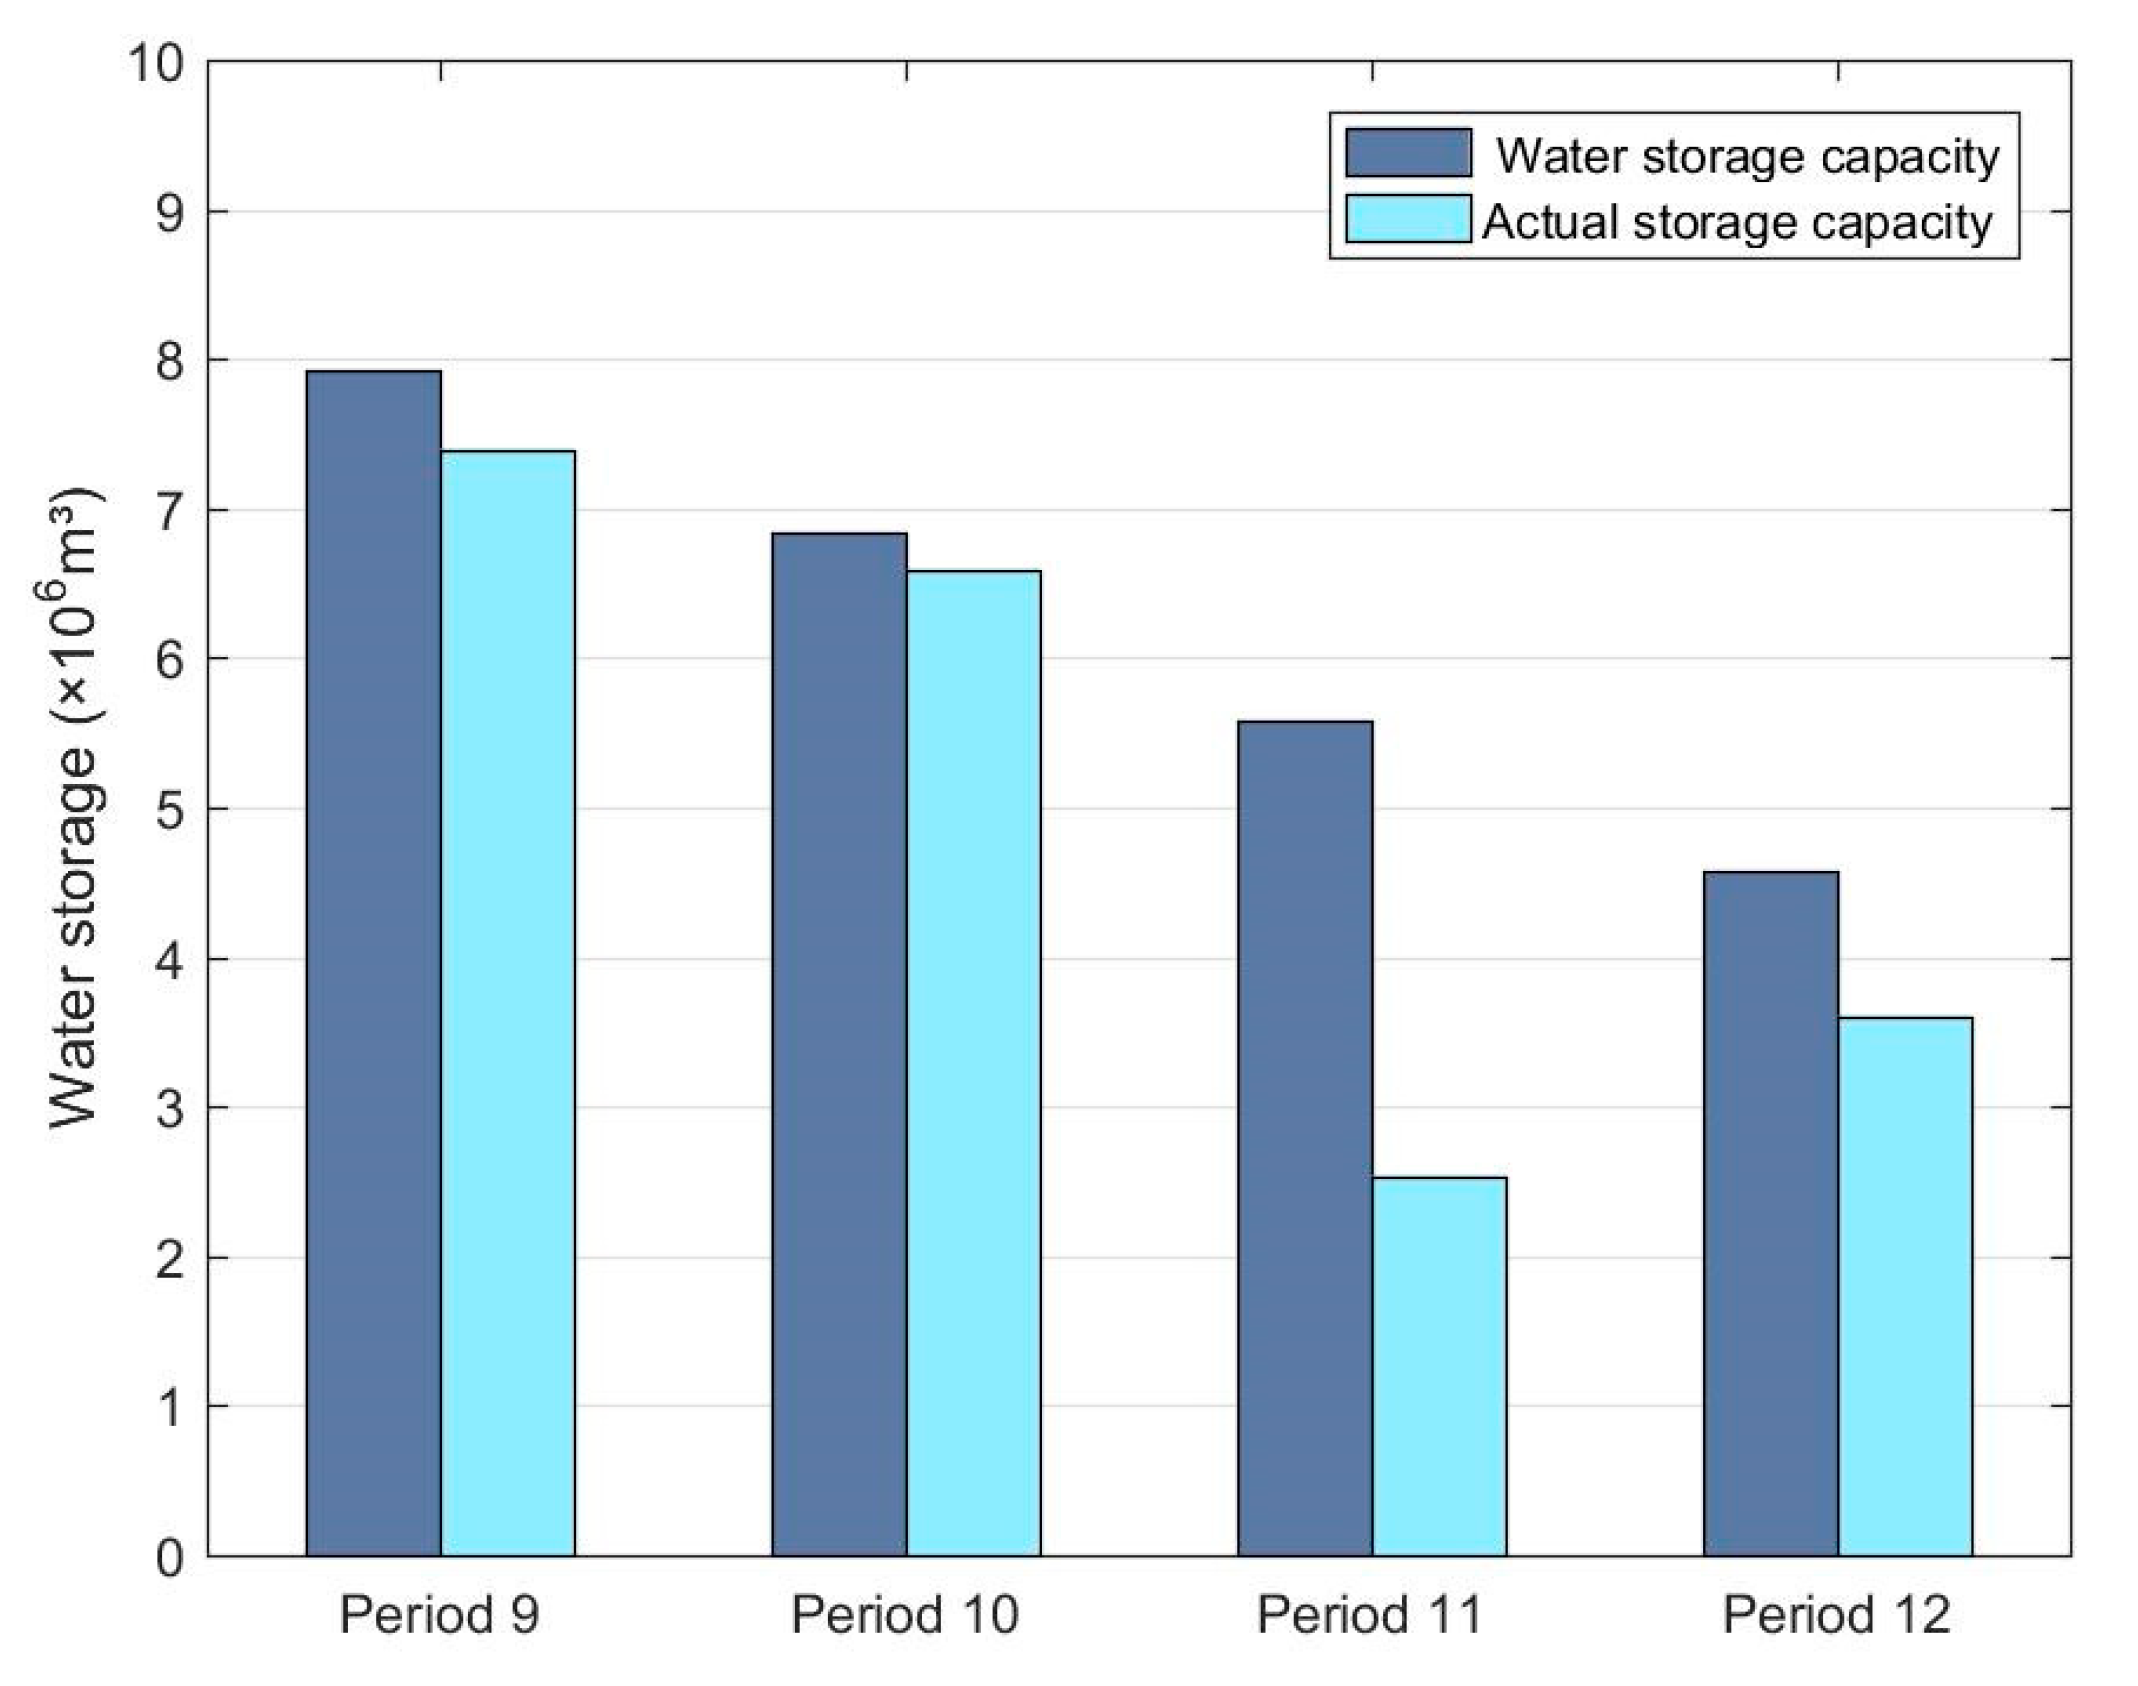
In the hydropower and wind power joint dispatching scheme based on the hedging theory shown in Figure 14a, the hedging process of the flood control risk goal and the water storage benefit goal appears in the period 9–12. In order to ensure the safety of flood control during the whole time period, part of the water storage benefit was discarded in the period 9–12. Some of the remaining water that can be stored after power generation water is safely discharged, instead of storing all of it in the reservoir. At this time, although the benefit of water storage is weakened, the risk of flood control is also reduced. Figure 15 shows the comparison between the water storage and the actual water storage during the period 9–12. The figure shows the comparison between the optimal storage decision value based on the hedging theory and the actual storage. The actual storage capacity in time period 9 to time period 12 is less than the storage capacity in order to reduce the risk of flood control. Therefore, some water storage benefits must be reduced. At time period 11, because the water storage volume is already large at this time, the forecasted water volume for the next time period is also large. In order to ensure that the flood control risk during the entire dispatch period is as low as possible and the water storage benefit is as large as possible, the actual water storage capacity in period 11 is very small. It can be seen that hydropower stations reduce the benefits of water storage in some periods of time to minimize the risk of flood control, thereby ensuring the safety of flood control.
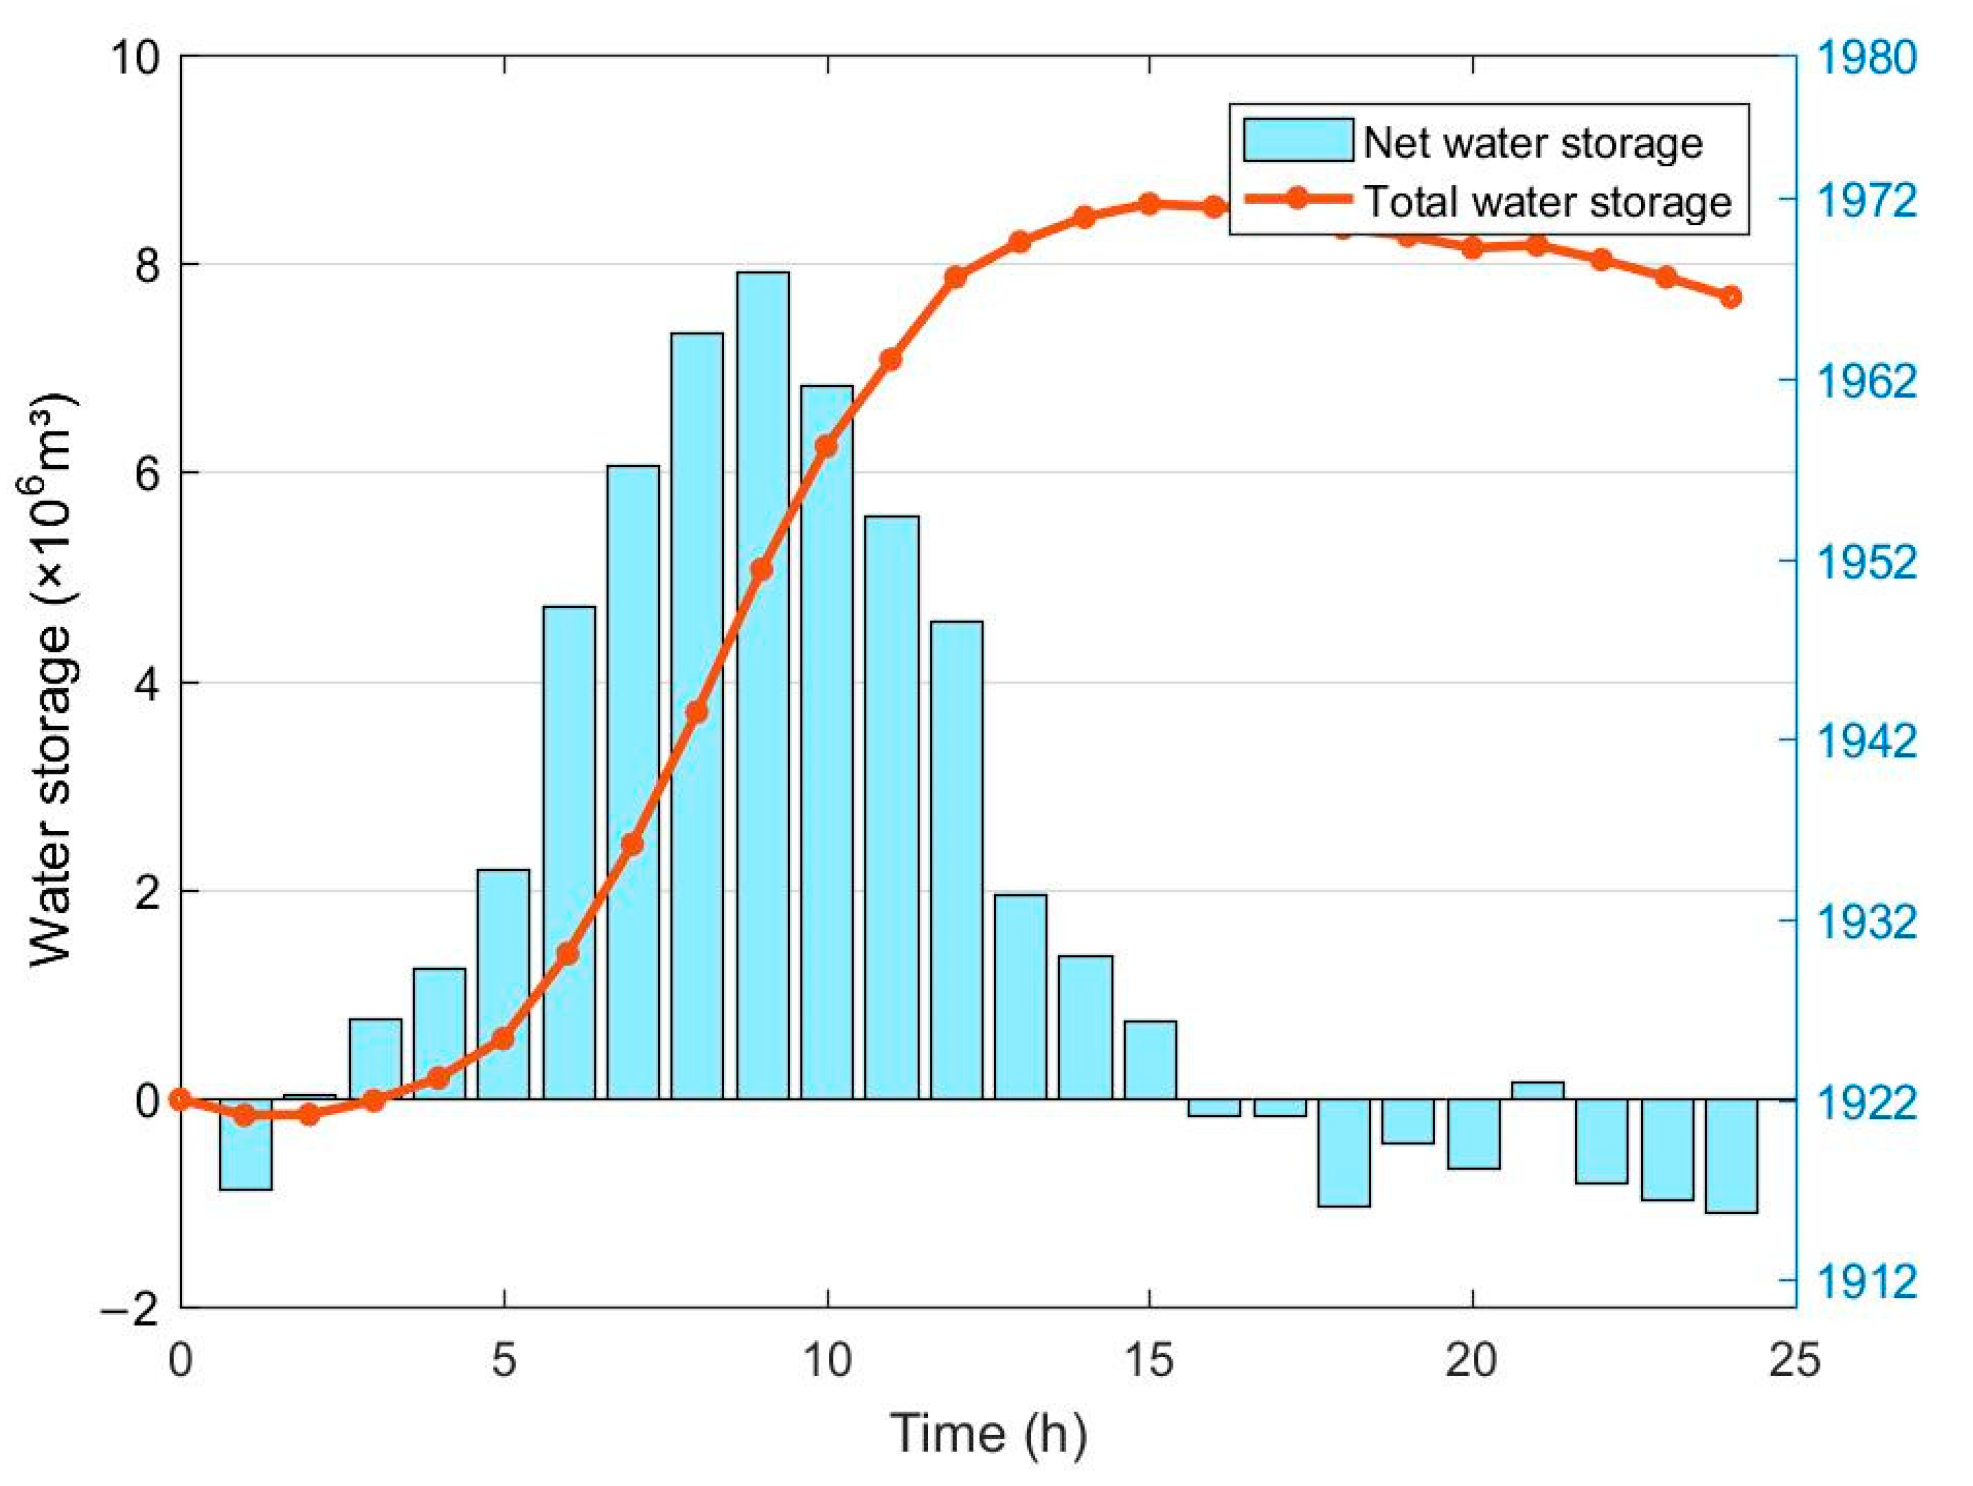
Figure 16 shows the change process of net water storage and reservoir water storage in each period of the scheme without hedging theory. The scheme that is not based on hedging theory will store all the surplus water into the reservoir after the power generation plan is completed. Table 3 shows the comparison between the water storage benefit difference and flood control risk value of the two schemes. It can be seen that although this scheme has better water storage benefits, it also greatly increases flood control risks.
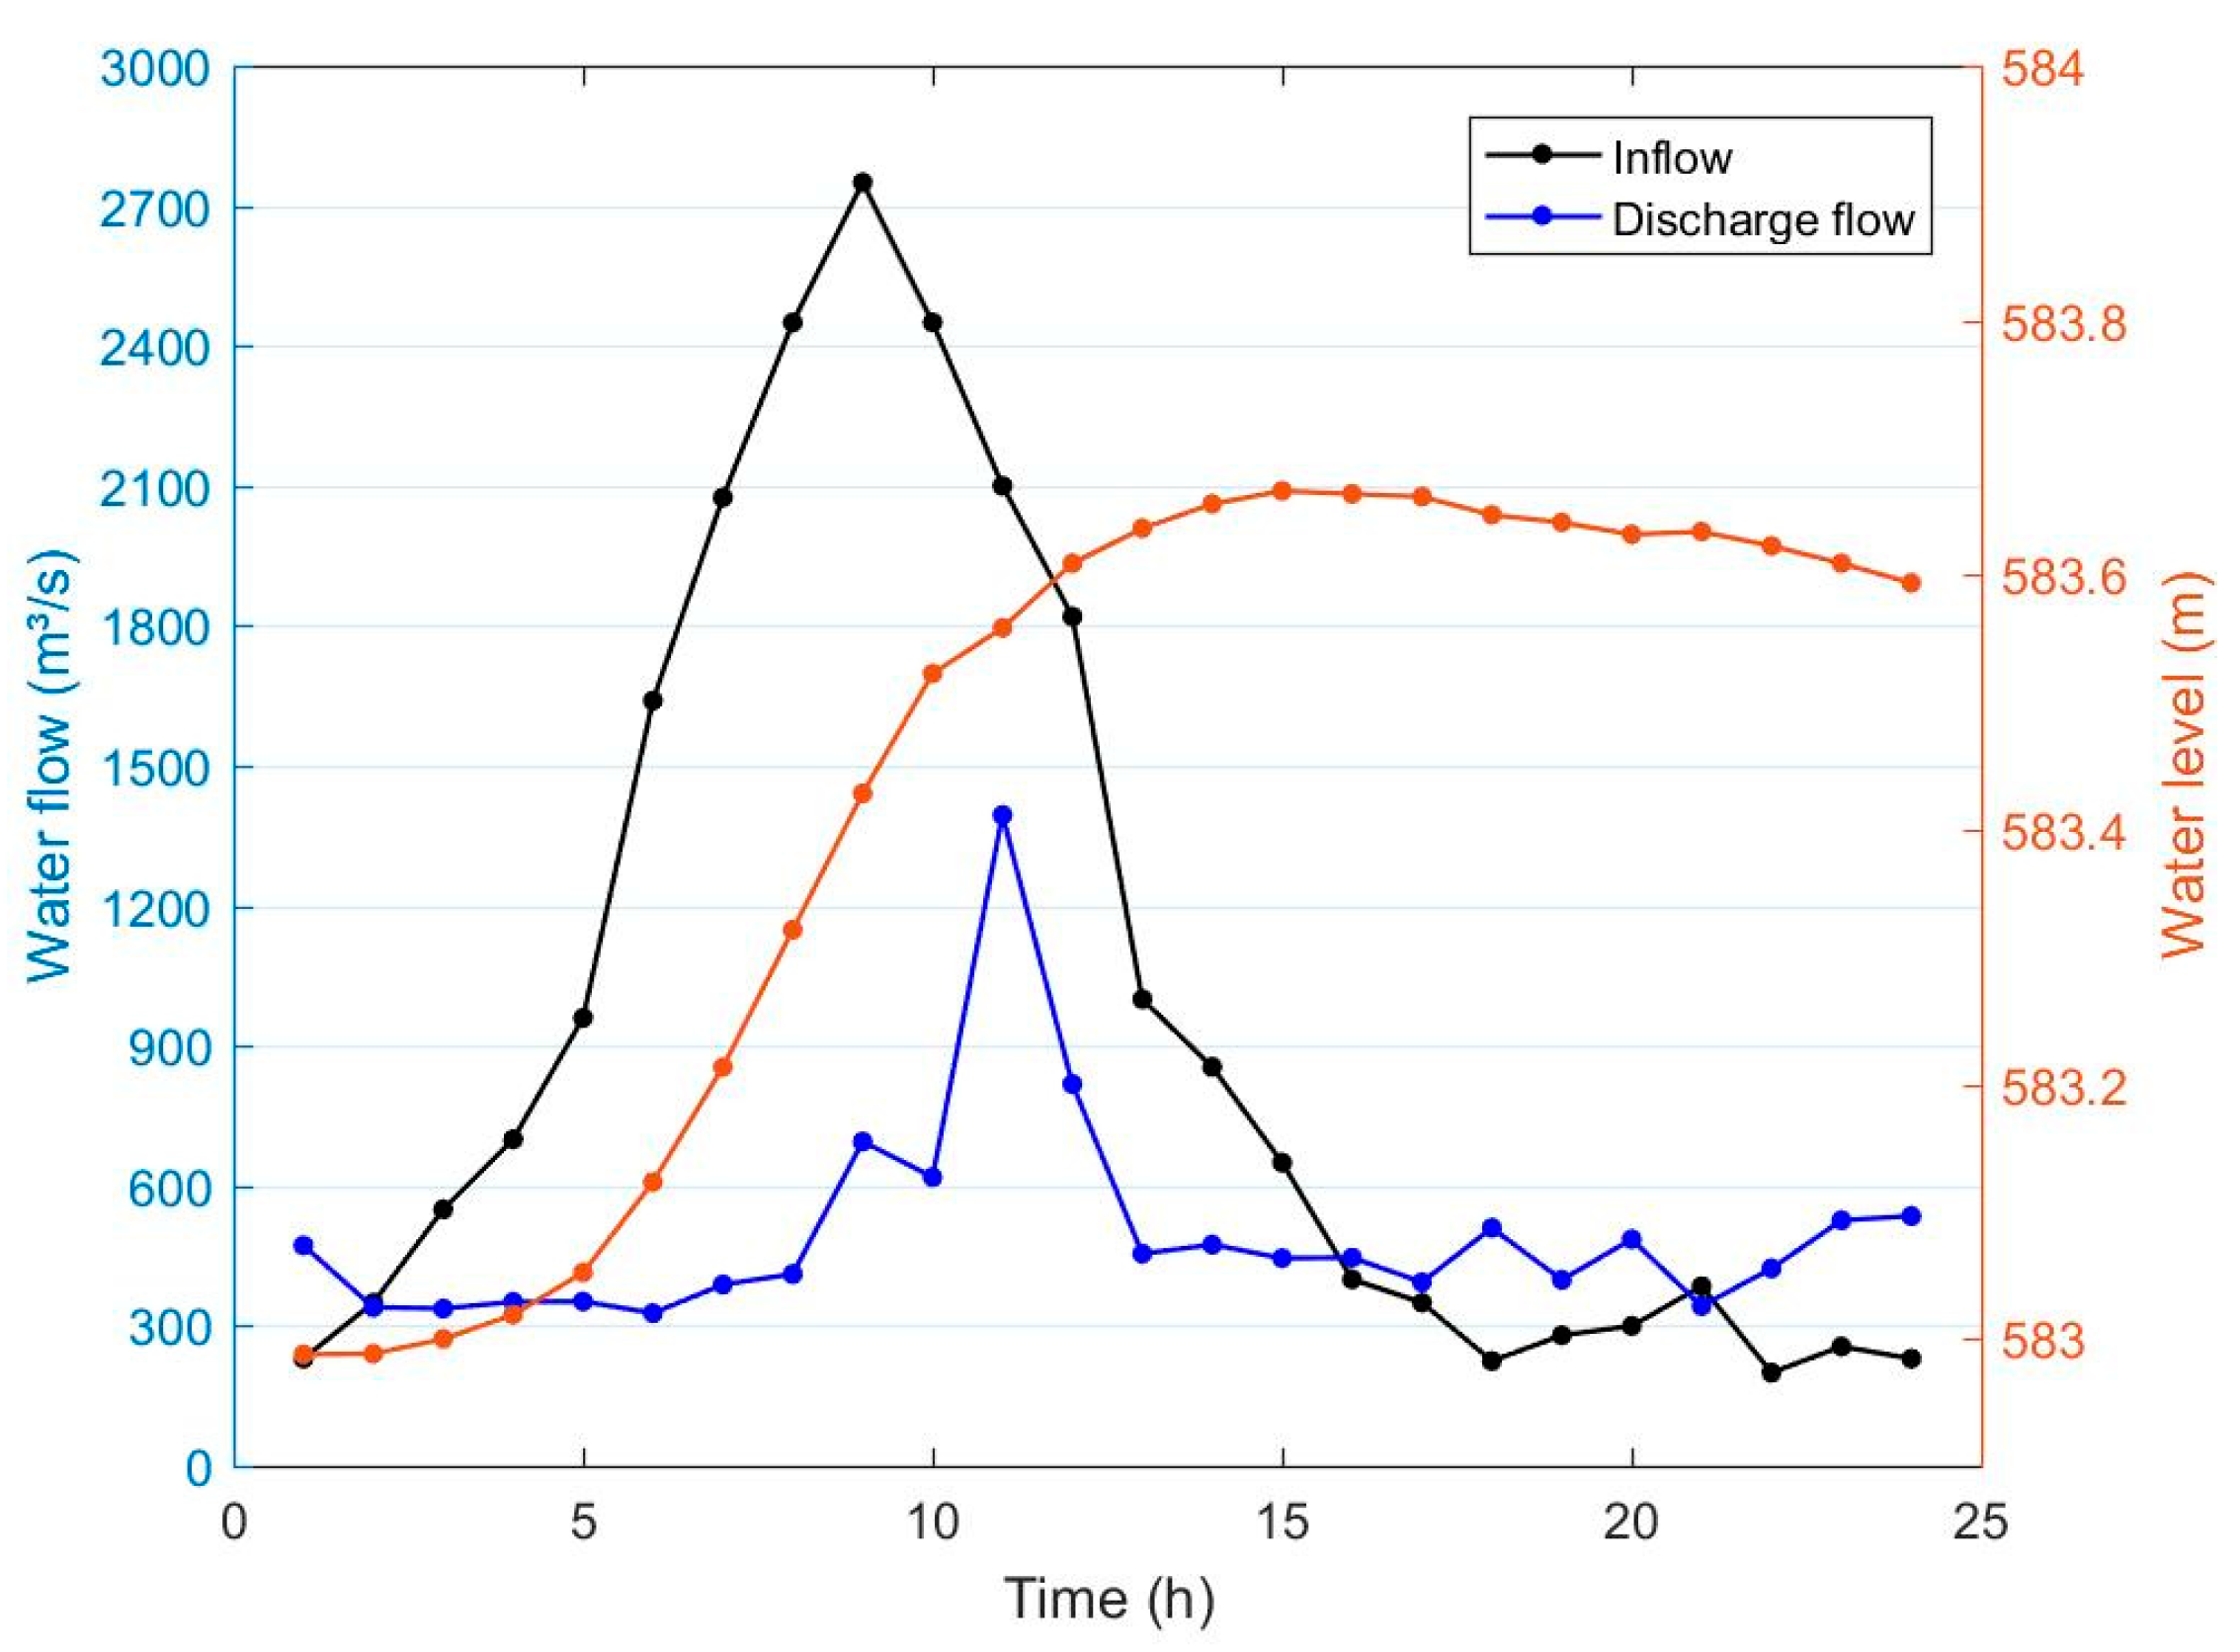
Figure 17 is a diagram of the reservoir dispatching process, showing the changes in the inflow, outflow, and water level of the reservoir in 24 periods. The original dispatching rules of the hydropower station are: (1) When the water level of the reservoir is lower than the flood limit water level (583.00 m), power generation will be operated according to the power generation needs, and the excess water will fill the reservoir until the reservoir water level reaches the flood limit water level (583.00 m); (2) when the water level of the reservoir has reached the flood limit water level (583.00 m), after generating operations according to the power generation needs, in order to ensure the safety of flood control, all the excess water will be discharged, resulting in a waste of water resources. In the optimized scheduling scheme, when the reservoir water level has reached the limit water level of 583.00 m in the flood season, the public storage capacity can be used to increase the water storage capacity, and the water storage level can be raised to 583.70 m. It increases the storage capacity of the reservoir and gives full play to the comprehensive utilization benefits of the reservoir. At the same time, when a large amount of water is forecasted for a certain period in the future, the extra water stored in the reservoir can also ensure safe discharge and meet the safety requirements for flood control.
4. Conclusions
In order to improve the utilization rate of water resources and effectively reduce wind power volatility, a dispatching model of hydropower and wind power based on the hedging theory is proposed in this paper. The specific research is as follows:
- The joint dispatching of hydropower and wind power is a multi-objective conflict problem, and the hedging theory can be introduced into the joint dispatching problem of hydropower and wind power for analysis.
- On the basis of considering the uncertainty of wind power and the uncertainty of the interval flow, an optimal dispatching model of hydropower and wind power based on the hedging theory is constructed during the flood season,
- The NSGA2 algorithm is used to solve the specific calculation examples. In the scheduling plan finally solved by the model built in this paper, the peak-valley difference of joint output ranges from 125.00 MW to 35.66 MW. It can effectively solve the problem of wind power volatility and improve the capacity of wind power utilization. Simultaneously, the water storage level was raised by 0.7 m, and the flood control risk is controlled below 1.63 × 10⁻³. The optimal water storage capacity decision is obtained, and the water storage benefit is as large as possible on the basis of ensuring flood control risks.
Regarding future research work: The model established in this paper only considers the impact of the discharge of a single hydropower station on the flood control risk of its downstream control station. The cascade hydropower station has a stronger regulating ability to wind power. Additionally, there is a time sequence relationship between the upstream and downstream of the cascade hydropower station. Next steps will consider the multi-objective hedging relationship of joint dispatch between the wind farm and multiple hydropower stations.
Author Contributions
Conceptualization, methodology, investigation, validation, and writing—original draft, K.Z.; investigation, formal analysis, software, and writing—review and editing, M.X.; resources, data curation, formal analysis, G.Z.; writing—review and editing, T.X.; writing—review and editing, X.L.; writing—review and editing, X.H. All authors have read and agreed to the published version of the manuscript.
Funding
The authors gratefully acknowledge the financial support provided by the Research Fund of the State Key Laboratory of Eco-Hydraulics in the Northwest Arid Region, Xi’an University of Technology (2019KJCXTD-5), and Key Research and Development Plan of Shaanxi Province (2018-ZDCXL-GY-10-04).
Institutional Review Board Statement
Not applicable.
Informed Consent Statement
Not applicable.
Data Availability Statement
The data presented in this study are available on request from the corresponding author. The data are not publicly available due to privacy reasons.
Conflicts of Interest
The authors declare no conflict of interest.
Abbreviations
| Variables | |
| the water discharge | |
| the hydropower output | |
| the water inflow | |
| the inflow of water from the reservoir and downstream section | |
| the water storage of stage | |
| the wind power output | |
| the flood control risk of stage | |
| total incoming water for stage | |
| safe water volume of stage | |
| reservoir capacity of stage | |
| flood limit water level | |
| incoming water error in stage 2 | |
| incoming water error of the downstream control station of stage 2 | |
| probability density function | |
| added value of water storage benefit | |
| benefit difference | |
| storage capacity corresponding to normal storage level | |
| corresponding storage capacity of flood limit water level | |
| the combined total power generation of hydropower and wind power | |
| the hydropower generation | |
| the wind power generation | |
| the output of the wind power station | |
| SOP | the Standard Operation Policy |
| HR | the Hedging Rules |
References
- Shao, X.; Wang, P.S.; Zhang, H.J. Research on the Floodwater Resources Utilization Based on the Flood Control Safety. Manag. Technol. SME 2018, 10, 167–168. [Google Scholar]
- Huang, Y.; Liu, B.Z.; Wang, K.Y.; Ai, X. Joint Planning of Energy Storage and Transmission Network Considering Wind Power Accommodation Capability. Power Syst. Technol. 2018, 42, 1480–1489. [Google Scholar]
- Rong, S.; Chen, X.G.; Guan, W.L.; Xu, M.Y. Coordinated dispatching strategy of multiple energy sources for wind power consumption. J. Mod. Power Syst. Clean Energy 2019, 7, 1461–1471. [Google Scholar] [CrossRef] [Green Version]
- Wu, J.R.; Ge, Z.C.; Yang, S.P. Review of Optimal Cooperation of Wind-hydro Hybrid Power System. Smart Power 2013, 41, 28–31. [Google Scholar]
- Huang, C.L.; Ding, J.; Tian, G.L.; Tang, H.H. Hydropower Operation Modes of Large-scale Wind Power Grid Integration. Autom. Electr. Power Syst. 2011, 35, 37–40. [Google Scholar]
- Wang, K.Y.; Luo, X.J.; Wu, L.; Liu, X.C. Optimal Dispatch of Wind-hydro-thermal Power System With Priority Given to Clean Energy. Proc. CSEE 2013, 33, 27–35. [Google Scholar]
- Jing, T.Y.; Lv, Q.; Guo, L.; Li, W.D. An inter-daycombined operation strategy of hydro and wind power system for regulating peak load. Autom. Electr. Power Syst. 2011, 35, 97–104. [Google Scholar]
- Castronuovo, E.D.; Lopes, J.A.P. On the optimization of the daily operation of a wind-hydro power plant. IEEE Trans. Power Syst. 2004, 19, 1599–1606. [Google Scholar] [CrossRef] [Green Version]
- Feng, Z.K.; Niu, W.J.; Cheng, C.T.; Wu, X.Y. Uniform progressive optimality algorithm for hydro-power station group peak operation. Proc. 2017, 37, 4315–4323. [Google Scholar]
- Chen, X.B.; Huang, K.; Wu, J.F. Research on Short-term Joint Optimal Operation of Hydropower and Wind Power. China Water Transp. 2014, 14, 201–202. [Google Scholar]
- Sheng, S.Q.; Sun, X.X. Operational Optimization Model for Combined Operation of Wind Power and Pumped-storage Plant. Proc. CSU-EPSA 2016, 28, 100–103. [Google Scholar]
- Ju, Y.; Qi, L.; Liu, S. Short-term wind power forecasting based on improved crow search algorithm and ESN neural network. Power Syst. Prot. Control 2019, 47, 58–64. [Google Scholar]
- Shi, Z.C.; Liang, H.; Dinavahi, V. Direct Interval Forecast of Uncertain Wind Power Based on Recurrent Neural Networks. IEEE Trans. Sustain. Energy 2018, 9, 1177–1187. [Google Scholar] [CrossRef]
- Ju, Y.; Sun, G.Y.; Chen, Q.H.; Zhang, M. A Model Combining Convolutional Neural Network and Light-GBM Algorithm for Ultra-Short-Term Wind Power Forecasting. IEEE Access 2019, 7, 28309–28318. [Google Scholar] [CrossRef]
- Sun, J.; Liu, B.; Liu, F.; Wei, W.; Zhou, Z.C.; Yuan, Q.F. Modeling and Evaluation of Uncertainty Set of Considering Wind Power Prediction Error Correlation. Autom. Electr. Power Syst. 2014, 38, 27–32. [Google Scholar]
- Lin, W.X.; Wen, J.Y.; Ai, X.M.; Cheng, S.J.; Li, W.R. Probability Density Function of Wind Power Variations. Proc. CSEE 2012, 32, 38–46. [Google Scholar]
- An, Y.; Huang, Q.; Ding, H.; Wang, H.; Wang, S.K. Research on the joint operation of hydropower and wind power system. J. Xi’an Univ. Technol. 2016, 32, 333–337. [Google Scholar]
- Yang, J.C.; Deng, C.H.; Long, Z.J.; Zhang, S.Y.; Wang, W.Z.; Bai, R.Q. Real-time dispatching strategy of cascade hydropower based on wind power generation and its evaluation method. Eng. J. Wuhan Univ. 2020, 53, 330–338. [Google Scholar]
- Niu, W.J.; Wu, X.Y.; Feng, Z.K.; Shen, J.J.; Cheng, C.T. The Optimal Operation Method of Multi-reservoir System under the Cascade Storage Energy Control. Proc. CSEE 2017, 37, 3139–3147. [Google Scholar]
- Zhang, W.; Li, D.; Zhang, X.Y.; Li, J.Y.; Tan, Z.F. Risk-Constrained Day-Ahead Scheduling Optimization Model of Hydro-Wind Power Generation. Electr. Power 2016, 5, 163–170. [Google Scholar]
- Jiang, Y.C.; He, Z.N.; Liu, A.L. A complementary optimal operation strategy of wind power-hydropower based on improved biogeography-based optimization algorithm. Power Syst. Prot. Control 2018, 46, 39–47. [Google Scholar]
- Lu, P.; Ye, L.; Sun, B.; Zhang, C.; Zhao, Y.; Teng, J. A New Hybrid Prediction Method of Ultra-Short-Term Wind Power Forecasting Based on EEMD-PE and LSSVM Optimized by the GSA. Energies 2018, 11, 697. [Google Scholar] [CrossRef] [Green Version]
- Zhang, G.; Liu, H.C.; Zhang, J.B.; Yan, Y.; Zhang, L.; Chen, W.; Hua, X.; Wang, Y. Wind power prediction based on variational mode decomposition multi-frequency combinations. J. Mod. Power Syst. Clean Energy 2019, 7, 281–288. [Google Scholar] [CrossRef] [Green Version]
- Lan, F.; Sang, C.C.; Liang, J.J.; Li, J.H. Interval Prediction for Wind Power Based on Conditional Copula Function. Proc. CSEE 2016, 36, 79–86. [Google Scholar]
- Miao, S.M.; Teng, Y.F.; Luo, B.; Chen, G.; Wang, L. Short-term Optimal Scheduling Method for Combined Operation of Wind Power and Hydropower Considering Uncertainty of Wind Power. Sichuan Electr. Power Technol. 2020, 43, 4–9. [Google Scholar]
- Bhatia, N.; Srivastav, R.; Srinivasan, K. Season-Dependent Hedging Policies for Reservoir Operation-A Comparison Study. Water 2018, 10, 1311. [Google Scholar] [CrossRef] [Green Version]
- Spiliotis, M.; Mediero, L.; Garrote, L. Optimization of Hedging Rules for Reservoir Operation during Droughts Based on Particle Swarm Optimization. Water Resour. Manag. 2016, 30, 1–20. [Google Scholar] [CrossRef]
- Xu, B.; Zhong, P.A.; Huang, Q.; Wang, J.; Yu, Z.; Zhang, J. Optimal Hedging Rules for Water Supply Reservoir Operations under Forecast Uncertainty and Conditional Value-at-Risk Criterion. Water 2017, 9, 568. [Google Scholar] [CrossRef] [Green Version]
- Tan, Q.F.; Wang, X.; Wang, H.; Wang, C.; Lei, X.H.; Xiong, Y.S.; Zhang, W. Derivation of optimal joint operating rules for multi-purpose multi-reservoir water-supply system. J. Hydrol. 2017, 551, 253–264. [Google Scholar] [CrossRef]
- Li, N.N.; Wang, L.P.; Wu, J.J.; Ma, H.Y. Research on the Flood Storage Model of Cascade Reservoir Based on Space Risk Hedging. China Rural Water Hydropower 2020, 9, 138–142+147. [Google Scholar]
- Diao, Y.F.; Wang, B.D. Risk analysis of flood control operation mode with forecast information based on a combination of risk sources. Sci. China 2010, 53, 1949–1956. [Google Scholar] [CrossRef]
- Li, B. Research on application of two-stage optimization model with two purposes of reservoir flood control and profiting. Water Conserv. Constr. Manag. 2017, 37, 39–42. [Google Scholar]
- Ahmadianfar, I.; Adib, A.; Taghian, M. Optimization of Fuzzified Hedging Rules for Multipurpose and Multireservoir Systems. J. Hydrol. Eng. 2016, 21, 05016003.1–05016003.10. [Google Scholar] [CrossRef]
- Liu, Y.; Zhao, J.; Zheng, H. Piecewise-Linear Hedging Rules for Reservoir Operation with Economic and Ecologic Objectives. Water 2018, 10, 865. [Google Scholar] [CrossRef] [Green Version]
- Huang, C.; Zhao, J.; Wang, Z.; Shang, W. Optimal Hedging Rules for Two-Objective Reservoir Operation: Balancing Water Supply and Environmental Flow. J. Water Resour. Plan. Manag. 2016, 142, 04016053.1–04016053.10. [Google Scholar] [CrossRef]
- Zhang, F.L. The principles and strategies of risk hedging thinking in predictive decision-making. Leadersh. Sci. 2020, 23, 28–30. [Google Scholar]
- Liu, X.J.; Yan, H.L. Research on the Multi-objective Scheduling Problem of Parallel Machine based on NSGA2 Algorithm. Internet Technol. 2013, 3, 44–45. [Google Scholar]
- Zhang, G.; Li, Z.X.; Zhang, K.; Zhang, L.; Hua, X.; Wang, Y. Multi-objective Interval Prediction of Wind Power based on Conditional Copula Function. J. Mod. Power Syst. Clean Energy 2019, 7, 140–150. [Google Scholar] [CrossRef] [Green Version]
- Verrill, S.; Johnson, R.A. The Asymptotic Equivalence of Some Modified Shapiro-Wilk Statistics-Complete and Censored Sample Cases. Ann. Stat. 1987, 15, 413–419. [Google Scholar] [CrossRef]
Figure 1.
Standard Operation Policy and Hedging Rules.

Figure 2.
Multi-objective hedging relationship in the joint dispatch of hydropower and wind power.

Figure 3.
Schematic diagram of rolling forecast.

Figure 4.
Two-stage decision diagram for joint dispatch of hydropower and wind power.

Figure 5.
The process of using NSGA2 algorithm to solve the joint dispatching model.

Figure 6.
(a) Water level-storage capacity curve; (b) Discharge flow-water level curve.

Figure 7.
Interval Prediction of Wind Power.

Figure 8.
(a) Relationship between actual inbound flow and forecasted flow; (b) Relationship between actual inbound flow and relative error.
Figure 8.
(a) Relationship between actual inbound flow and forecasted flow; (b) Relationship between actual inbound flow and relative error.

Figure 9.
The relationship between the maximum increase in storage capacity, acceptable risk, and forecast uncertainty.
Figure 9.
The relationship between the maximum increase in storage capacity, acceptable risk, and forecast uncertainty.

Figure 10.
Pareto frontier for multi-objective hedging. (a) Pareto frontier with three goals for hedging; (b) Pareto frontier of Goal 1 and Goal 2.
Figure 10.
Pareto frontier for multi-objective hedging. (a) Pareto frontier with three goals for hedging; (b) Pareto frontier of Goal 1 and Goal 2.

Figure 11.
Comparison of joint dispatching results. (a) Joint dispatch of hydropower and wind power based on hedging theory; (b) Conventional hydropower and wind power joint dispatch.
Figure 11.
Comparison of joint dispatching results. (a) Joint dispatch of hydropower and wind power based on hedging theory; (b) Conventional hydropower and wind power joint dispatch.

Figure 12.
Comparison of joint output volatility under the two schemes.

Figure 13.
Comparison of water storage process of joint dispatch schemes. (a) Water storage process based on the hedging theory scheme; (b) Conventional water storage process.
Figure 13.
Comparison of water storage process of joint dispatch schemes. (a) Water storage process based on the hedging theory scheme; (b) Conventional water storage process.

Figure 14.
Comparison of water storage changes in hydropower and wind power joint dispatch schemes. (a) Water storage change based on the hedging theory scheme; (b) Water storage change of conventional schemes.
Figure 14.
Comparison of water storage changes in hydropower and wind power joint dispatch schemes. (a) Water storage change based on the hedging theory scheme; (b) Water storage change of conventional schemes.

Figure 15.
Water storage capacity during the hedge period 9–12.

Figure 16.
Water storage change process without hedging rules.

Figure 17.
Water storage change process without hedging rules.


Table 1.
Some parameter indexes of hydropower station.
| Total Storage Capacity (×106 m3) | Beneficial Reservoir Capacity (×106 m3) | Dead Storage Capacity (×106 m3) | Normal Water Level (m) |
| 3660 | 2400 | 1380 | 588 |
| Dead Water Level (m) | Flood Limit Water Level (m) | Installed Capacity (MW) | Guaranteed Output (MW) |
| 570 | 583 | 280 | 65 |
Table 2.
Comparison of optimal solutions.
| Goals | Optimal Decision of Reservoir’s Water Storage Benefit | Optimal Decision of Downstream Flood Control Risk | Optimal Decision on Volatility of Combined Power Generation | Optimal Decision with the Highest Degree of Satisfaction |
|---|---|---|---|---|
| Water storage benefit difference | 6.38 × 10⁻³ | 7.07 × 10⁻³ | 6.58 × 10⁻³ | 6.65 × 10⁻³ |
| Flood control risk | 5.56 × 10⁻³ | 1.14 × 10⁻⁴ | 2.48 × 10⁻³ | 1.63 × 10⁻³ |
| Joint output volatility | 8.11 | 21.3 | 0.56 | 3.57 |
Table 3.
Comparison of scheduling schemes based on hedging theory and conventional scheme.
| Method | Water Storage Benefit | Flood Risk |
|---|---|---|
| Result based on the hedging theory plan | 6.65 × 10⁻³ | 1.63 × 10⁻³ |
| The result of the conventional plan | 6.562 × 10⁻³ | 3.65 × 10⁻³ |
Publisher’s Note: MDPI stays neutral with regard to jurisdictional claims in published maps and institutional affiliations. |
© 2021 by the authors. Licensee MDPI, Basel, Switzerland. This article is an open access article distributed under the terms and conditions of the Creative Commons Attribution (CC BY) license (https://creativecommons.org/licenses/by/4.0/).
Share and Cite
MDPI and ACS Style
Zhang, K.; Xie, M.; Zhang, G.; Xie, T.; Li, X.; He, X. Combined Dispatching of Hydropower and Wind Power Based on the Hedging Theory. Water 2021, 13, 1319. https://doi.org/10.3390/w13091319
AMA Style
Zhang K, Xie M, Zhang G, Xie T, Li X, He X. Combined Dispatching of Hydropower and Wind Power Based on the Hedging Theory. Water. 2021; 13(9):1319. https://doi.org/10.3390/w13091319
Chicago/Turabian StyleZhang, Kaoshe, Mengyan Xie, Gang Zhang, Tuo Xie, Xin Li, and Xin He. 2021. "Combined Dispatching of Hydropower and Wind Power Based on the Hedging Theory" Water 13, no. 9: 1319. https://doi.org/10.3390/w13091319
Note that from the first issue of 2016, this journal uses article numbers instead of page numbers. See further details here.