
A Predictive Model for Estimating Damage from Wind Waves during Coastal Storms


Department of Civil and Environmental Engineering, Pusan National University, Busan 46241, Korea
*
Author to whom correspondence should be addressed.
Water 2021, 13(9), 1322; https://doi.org/10.3390/w13091322
Submission received: 1 April 2021
/
Revised: 4 May 2021
/
Accepted: 6 May 2021
/
Published: 10 May 2021
(This article belongs to the Special Issue Coastal Hazards Management)
Abstract
:In recent years, climate abnormalities have been observed globally. Consequently, the scale and size of natural disasters, such as typhoons, wind wave, heavy snow, downpours, and storms, have increased. However, compared to other disasters, predicting the timing, location and severity of damages associated with typhoons and other extreme wind wave events is difficult. Accurately predicting the damage extent can reduce the damage scale by facilitating a speedy response. Therefore, in this study, a model to estimate the cost of damages associated with wind waves and their impacts during coastal storms was developed for the Republic of Korea. The history of wind wave and typhoon damages for coastal areas in Korea was collected from the disaster annual report (1991–2020), and the damage cost was converted such that it reflected the inflation rate as in 2020. Furthermore, data on ocean meteorological factors were collected for the events of wind wave and typhoon damages. Using logistic and linear regression, a wind wave damage prediction model reflecting the coastal regional characteristics based on 74 regions nationwide was developed. This prediction model enabled damage forecasting and can be utilized for improving the law and policy in disaster management.
1. Introduction
In recent years, the incidence of major natural disasters and the resultant damage costs have increased owing to accelerated global warming and frequent storms. These disasters cause damage to various social assets, in severe cases, and often result in injury to humans. In countries without social disaster prevention facilities or a preliminary system for addressing disasters, human injury and considerable damage to assets will rise.
Furthermore, the destruction of the ecosystem affects the climate adversely, and coastal areas are becoming increasingly fragile because of changing sea levels and the absence of buffering [1]. A total of 23% of the world’s population lives in coastal areas, large cities with a population of more than 10 million, and 66% of the residents live in coastal areas [2,3,4]. Following the revision of the Natural Disaster Countermeasures Act in 2005, storms caused by sea winds and waves were classified as natural disasters, along with heavy rains, typhoons, and earthquakes. However, compared to other natural disasters, there are very few studies on forecasting storm damage.
Existing studies on predicting the effects of storms and tsunamis focused on verifying the efficiency and accuracy of predicting tsunami heights using numerical analysis models. Kang Si hwan et al. (2004) predicted the tsunami invading Masan Bay of Typhoon Maemi by calculating the effect of typhoon speed using the local tsunami model [5]. Lee Hye Woo et al. (2014) created a storm prediction model to predict dangerous weather and measured its accuracy [6]. Lee Seung soo et al. (2014) demonstrated the usefulness of the data measurement provided by the Ocean Research Institute by predicting storm and tsunami using a meteorological-ocean-related numerical model [7]. Vanem et al. [8] studied some applications of extreme value analysis of ocean waves that are believed to be of relevance for coastal and ocean engineering. Fazeres-Ferradosa et al. [9] presented copula-based approach to obtain the joint cumulative distribution function of the significant wave heights and the up-crossing mean period.
The Korea Adaptation Center for Climate Change (2013) analyzed foreign climate change vulnerability and reclassified domestic climate change vulnerability to evaluate the vulnerability of local government areas based on climate change [10]. Wamdi (1988) developed a third-generation windfall prediction model, WAM, and studied windfall [11]. Soomere (2005) conducted a statistical study on the storm in the Gulf of Tallinn [12]. Recently, Ardhuin et al. (2017) conducted a study on the effect of small currents on storm [13]. Oliveria et al. [14] found that all the European Union guidelines and frameworks are being implemented in the Portuguese Governmental planning and are very well substantiated, whereas the base of all land management instruments (IGT), have a questionable implementation, mainly due to the number of entities involved and the long implementation process. Taveira-Pinto et al. [15] integrated management and planning of CPLP’s coastal zones. Wu et al. [16] presented a series of large-scale wave flume experiments on the scour protection damage around a monopile under combined waves and current conditions with model scales of 1:16.67 and 1:8.33.
Although various technologies have been developed for predicting wind and waves, research has been found to be insufficient to predict the extent of the damage based on past damage history. Therefore, in order to predict the damage scale and take an initial response to it, as mentioned in this study, we would like to propose a function to predict the damage amount by reflecting weather factors and regional characteristics of the Korea Meteorological Administration and the National Ocean Research Institute.
2. Wind Wave Financial Damage Prediction Model Methodology
2.1. Wind Wave Financial Damage Prediction Model Development Procedure
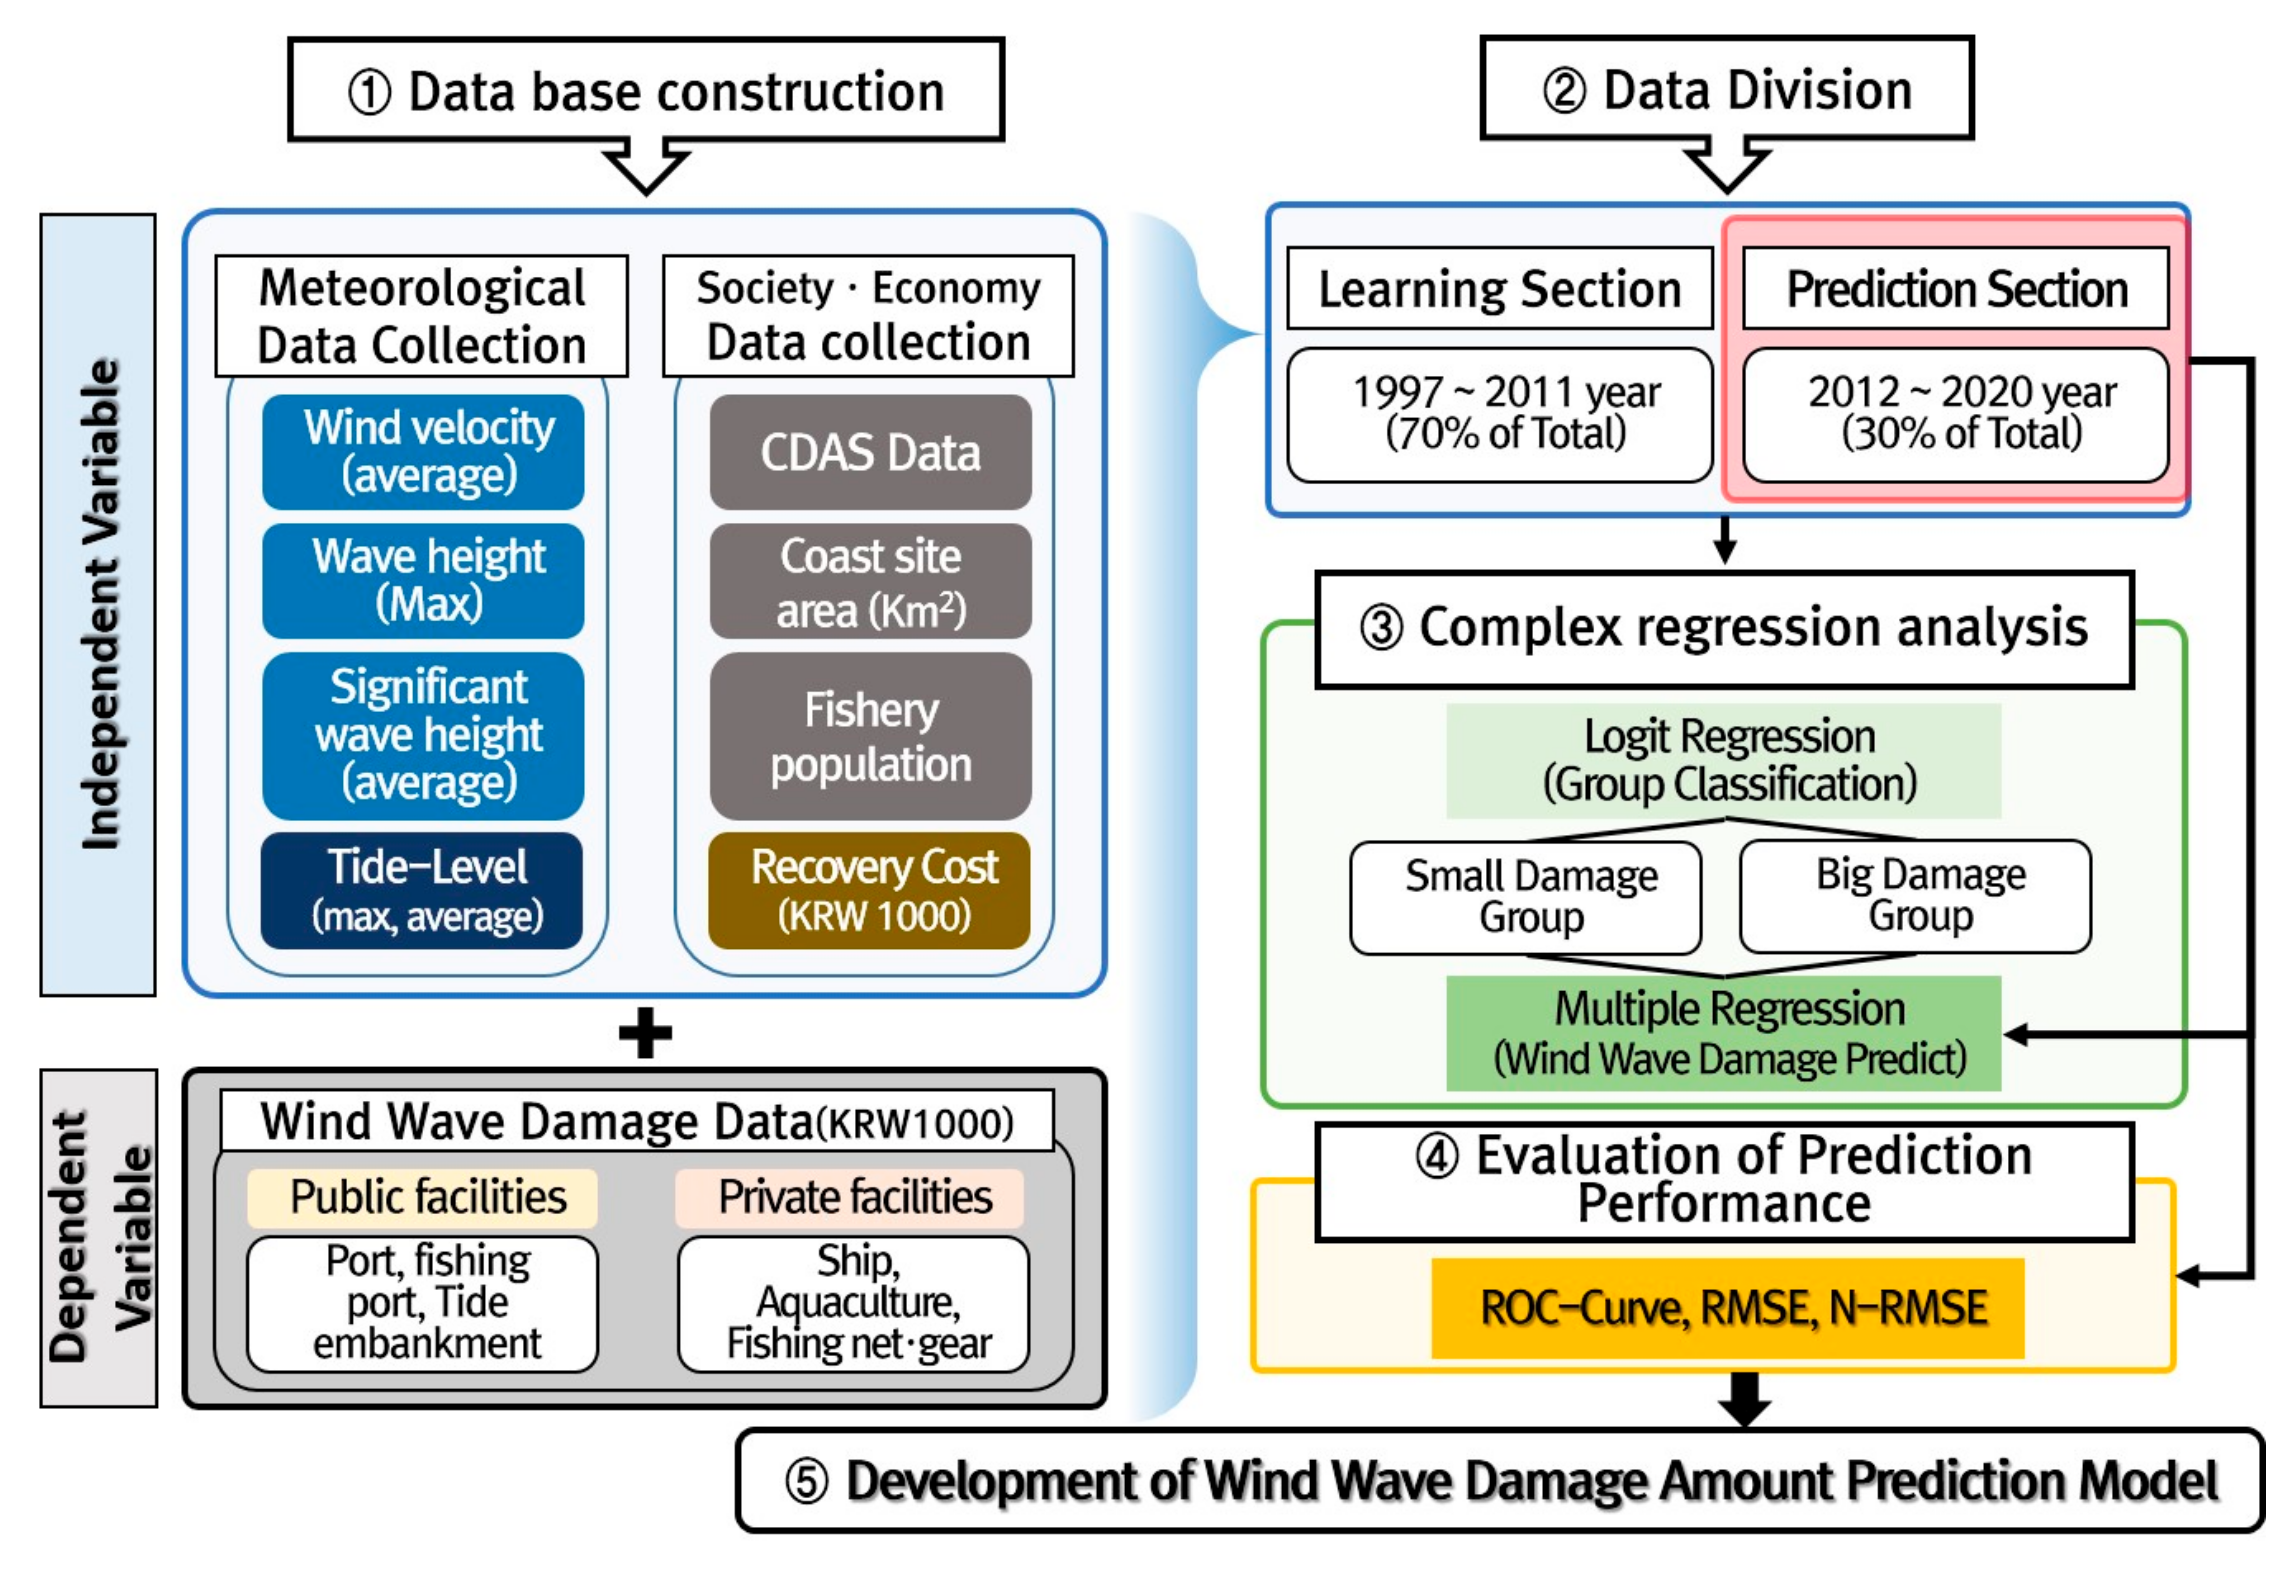
To develop a wind wave damage amount prediction model that can predict the extent of storm damage, the study was conducted in five stages, as shown in Figure 1. First, we collected the data used as independent and dependent variables. Second, we divided the model into the evaluation and learning sections to assess its predictive capacity. Third, we implemented a complex regression model and developed a financial damage prediction model prototype. Fourth, we tested the verification accuracy using the evaluation section. Finally, we developed the financial damage prediction model using the entire data (1994–2020).
2.1.1. Basic Data Building
This study was based on the annual disaster report of the Ministry of the Interior and Safety and Ministry of the Interior and Safety’s website. The wind wave financial damage was set as a dependent variable and the marine weather data (wind speed, wave height, and tide on the date of damage) and social and economic factors (number of fisheries, length of shoreline, and area of the coastal area) were set as the independent variables, based on which the wind wave financial damage was predicted. In addition, a group classification model was developed by classifying the total amount of damage into groups with large damages and small damages. A prediction function for the amount of damage was developed for each classified group.
2.1.2. Classification of Learning and Prediction Section
To evaluate the predictive ability of the windstorm-damage prediction function, the model was divided into the study and prediction sections that were used to develop the damage prediction function and verify the wind-damage prediction formula, respectively.
The classification was performed by analyzing the number of cases of wind damage by year; 60% of the total number of damages was set as the base point, based on which the learning and prediction sections were divided. The study section at the municipal and provincial levels was composed of 252 cases of wind-damage history from 1998 to 2011, and 126 cases of wind-damage history from 2012 to 2020 were set as the prediction sections.
2.1.3. Development of Wind Wave Prediction Model Prototype
A complex regression model (CRM) was implemented using the differentiated learning section data. The CRM prioritized the group classification of damages through the sequential logistic return and multi-return analyses and complemented a separate group-specific multiple return model to predict the amount of damage.
2.1.4. Predictive Performance Evaluation and Final Model Setup
As a result of the significance assessment between variables, we found that correlation was meaningless, so it could be used as an independent variable.
In addition, the performance of each model was evaluated based on the actual damage, and the model with the most accurate estimate of the amount of damage was selected as the final model. The classification performance assessment metric was the receiver operating characteristics (ROC) curve. The predictive power of the group damage amount classified was assessed based on the root mean square error (RMSE) and normalized RMSE (NRMSE).
2.2. Theoretical Background
2.2.1. Logistic Regression Model
Logistic regression is a regression method that is used when the dependent variable is binary (when there are two possible values such as failure/success and significant damage/insignificant damage).
Odds, the framework of logistic regression, is a concept that refers to the ratio of the probability of Event A occurring; it is summarized as shown in Equation (1) below:
The closer P(A) is to 1, the higher the odds, and if P(A) is 0, the odds are zero. In other words, the greater the odds, the greater the probability of Event A occurring. In this study, a logistic return model was used to classify the amount of damage; based on the ROC curve, the groups with significant and minimal damage were set to one and zero, respectively, and the optimal group classification was determined.
2.2.2. Multiple Regression Models
A multi-linear regression model is a linear model that predicts a response variable using two or more independent variables. Assuming the response variable is y, the independent variable is , , and the regression coefficient is , the response variable is then expressed by the linear combination between the independent variable and the regression coefficient, as shown in Equation (2) below, with representing intercepts and , the corresponding regression coefficients for each independent variable. is an error not explained by the model; it is assumed to follow a normal distribution with a mean of zero and variance of . The regression coefficient is estimated to minimize the following error sums:
2.2.3. Composite Return Model
The combined regression model used in this study is a technique that combines the logistic and multiple regression models. Due to the nature of storm damage, the range of the damage varies according to the season. Therefore, the proposed method entails developing the predictive function for the extent of damage by implementing multiple regression models through the logistic regression model (group with significant damage and group with minimal damage) and the classified learning data (classifying learning data by the amount of damage).
2.2.4. Classification Performance Evaluation
In this study, 1 and 0 indicated significant and minimal wind damage, respectively. The classification accuracy was verified through the ROC curve, a graph drawn on a two-dimensional plane with respect to the true value of the model. To draw an ROC curve, the boundary conditions must be adjusted before calculation. In the ROC curves, the sum of sensitivity and one-specificity is maximized as the curve gets closer to the left edge and the probability boundary value is determined as the optimal value.
2.2.5. RMSE
The RMSE is a measure of the residual, which is the difference between the values predicted by the model and actual observed values. The RMSE enables predictive power to be integrated into a single unit of measurement. The RMSE of the model’s prediction for the estimated variable is defined as the square root of the mean square error (Equation (3)):
Here, indicates the actual observed value, and is the predicted value obtained from the model.
2.2.6. NRMSE
The NMRSE is a normalized representation of the RMSE; it represents the difference between the values predicted by the model and actual observed values. The NMRSE has two expressions; the RMSE is either normalized to the observed range of data, as shown in Equation (4), or to the average of observed data, as shown in Equation (5):
In this study, the predictive performance evaluations were performed on different assessment data, with the entire data classified into learning and prediction data. The predictive performance of the data for evaluation corresponds to the predictive performance of the future data; therefore, among the candidate models, the model with the least NMRSE was chosen as the final model. The NRMSE quantitatively evaluated the predictive power of the wind-damage predictive function developed using the approach in Equation (4).
3. Development of Wind-Damage Estimation Model
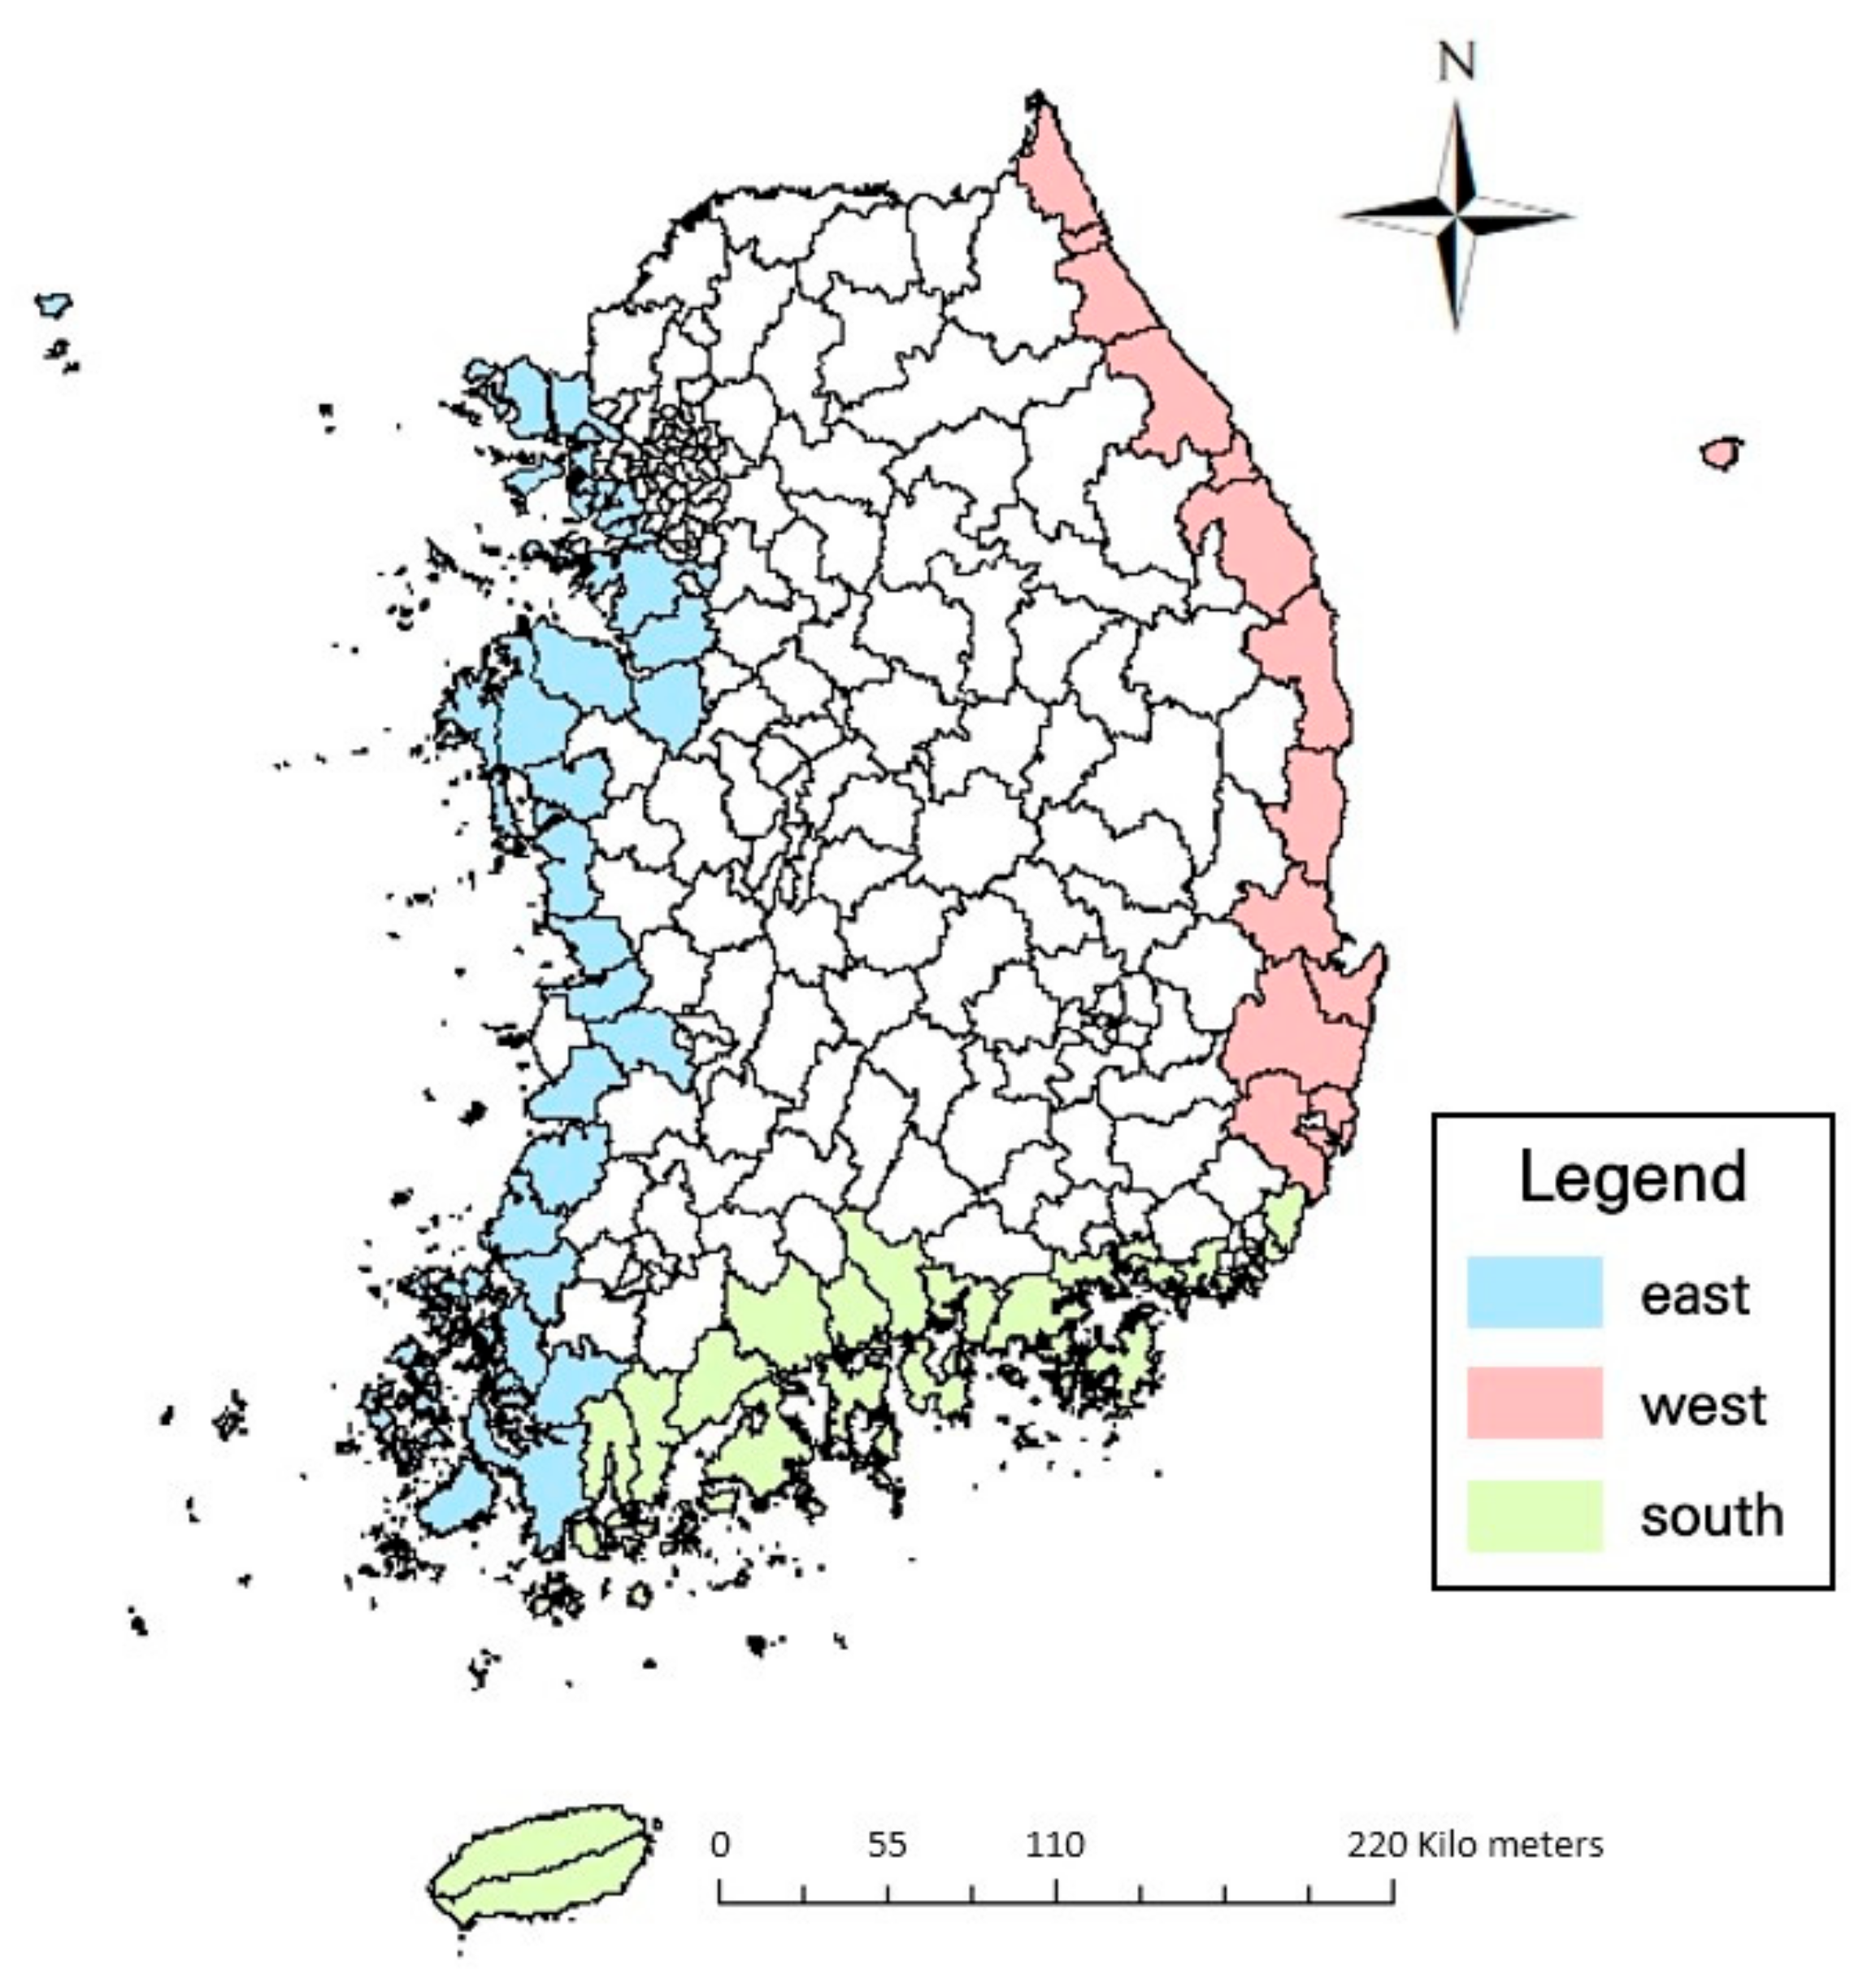
3.1. Selection of Research Areas
3.2. Basic Data Building
3.2.1. Classification by Sea Area
Although there were a total of 816 storm damage cases in the disaster compensation list, due to the delayed start date of observation by the Korea Meteorological Observatory, only 378 cases were available for analysis. Therefore, there were 44 areas with a wind-damage history, with less than five cases in 74 cities, counties, and districts in coastal areas, and six areas with more than ten cases, which were not sufficient to develop damage forecasting functions by region. Thus, this study sought to increase the reliability of the wind-damage prediction function by securing the number of samples by clustering the areas subject to research by sea area (the East Sea, Yellow Sea, Southern Ocean, and Jeju). Next, 74 of the community by littoral waters, 78, 138 cases, and the East Sea as storm damage by history are listed in Table 1, the Southern Ocean waters, Jeju-si, and Jeju-do, clustering in 162 cases.
3.2.2. Dependent Variable
In this study, the dependent variables were extracted from the disaster annual report provided by the Ministry of Public Administration and Security (MOIS). This is a systematic disaster-related statistical data, and following the enactment and amendment of the Natural Disaster Countermeasures Act, the disaster report began to include information on storm damage. To compensate for the short duration of the damage history, additional damage history (historical storm damage history) that can be considered as storm damage was collected from 1994 to 2020. Pseudo-flood damage history pertained to three types of public facilities and three types of private facilities selected through a historical survey of storm damage caused by typhoon according to the type of damaged facilities (fishery growth food, fishing nets, fishing grounds, ships, harbors, and fishing ports) in the event of a disaster compensation. Finally, the total amount of damage by damaged facilities was utilized as a subordinate variable.
3.2.3. Independent Variable
The independent variables used in this study were divided into three categories, i.e., ocean weather data, social and economic factors, and the pre-investment factor.
The marine weather data were composed of collected average wave height, maximum wave height, and average wind speed data from 11 domestic buoy locations managed by the Korea Meteorological Administration’s weather data open portal and 9 domestic lights, and dug, wind speed, and tide data from 16 marine observation sites managed by the National Oceanographic Research Institute, 3 marine science bases, 3 marine observation stations, and 47 tidal stations managed by the Korea Meteorological Administration. The optimal stations were selected for each coastal area based on the date of commencement of observation and the distance from the affected area. The social and economic factors, area and length of the coastal area and the number of fishery workers per year, were then utilized by the National Oceanographic Research Institute’s Coastal Disaster Assessment System (CDAS).
First, the CDAS evaluation system is a report published by the National Oceanographic Research Institute, which aims to develop an objective and quantitative coastal disaster vulnerability assessment index by disaster cause, establishes a geographic information system (GIS)-based coastal disaster vulnerability assessment system, produces the necessary basic data for national disaster response, and promotes the establishment of coastal related policies; further, it makes it possible to obtain all the coastal disaster vulnerability information from a single place. Among the coastal disaster vulnerability assessment system, the coastal disaster exposure index, coastal potential impact index, and coastal disaster sensitivity index were selected and utilized. The coastal area was selected based on the GIS provided by the National Geographic Information Service; coastal length is provided annually by the National Statistical Office. The number of fishery workers per year was obtained by calculating the number of fishery workers on a city-level basis, compared to the number of people in the relevant cities, counties, and districts per year. Next, the existing investment component was the cost of restoration by city, county, and district for each year of disaster compensation. As the restoration cost of the disaster compensation was calculated for the total damage to the relevant city, county, and district, the restoration work should be regarded as the recovery cost for the storm damage, and the data from the previous year should be utilized at the time of prediction. Finally, the dependent and independent variables used in this study are as shown in Table 2 below, and the variable names were specified for modeling.
3.3. Development of Wind-Damage Estimation Model
3.3.1. Development of Group Classification Model for Wind Damage
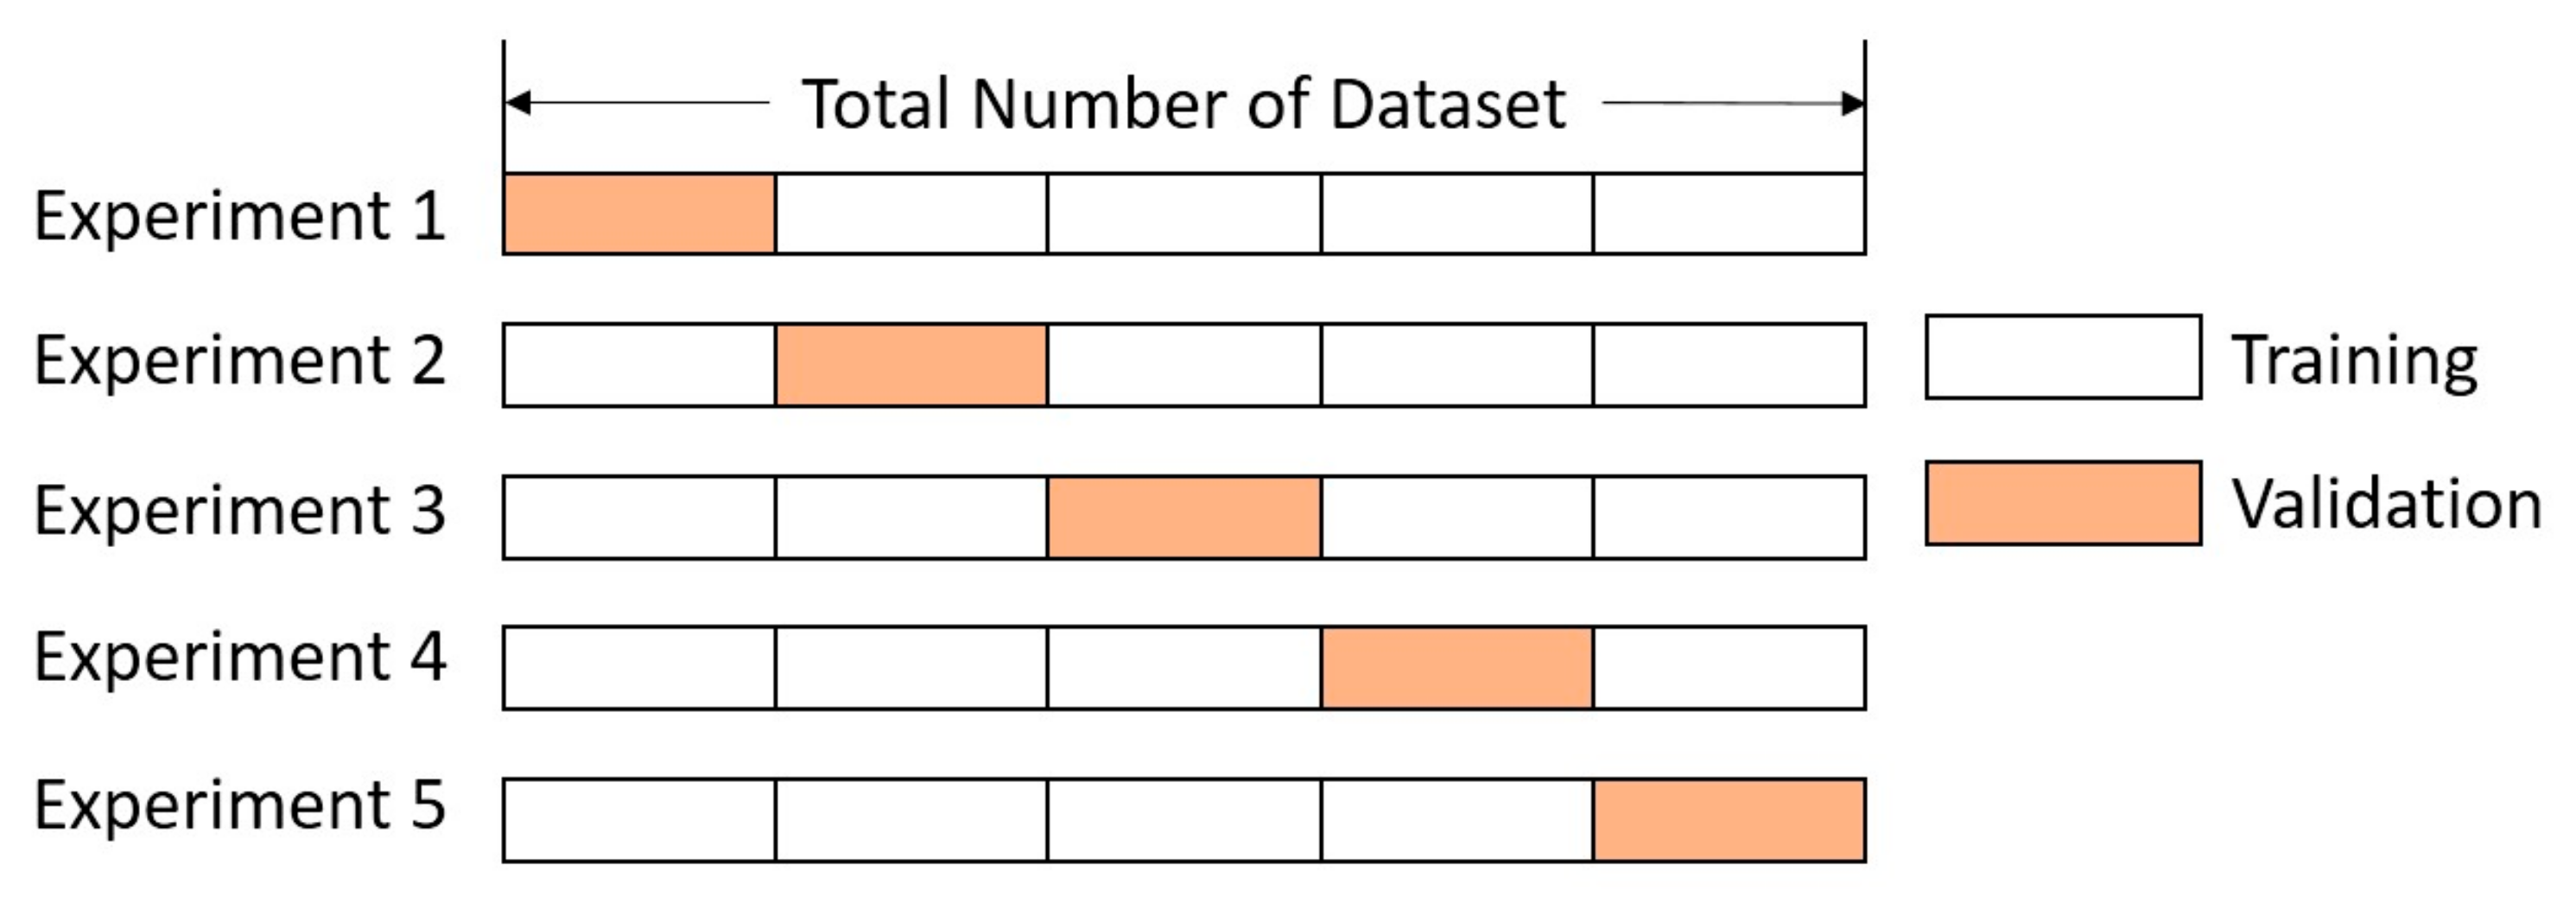
In this study, the group classification of the extent of damage was conducted using the wind-damage prediction function developed using the logistic regression model. The group classification model of the amount of damage was implemented first because the analysis of the data on the amount of damage caused by wind and wind damage revealed a difference of approximately 88 billion won between the minimum and maximum amount of damage, resulting in an overestimation of the amount of damage when regression analysis was conducted without classifying the amount of damage. Thus, damages were classified according to the scale in the learning section using the logistic regression model; the classification accuracy was evaluated based on the optimal probability boundary obtained using the area under the curve. To collectively classify the extent of damage, it was necessary to perform k-fold cross-validation (k-fold cross-validation, k-fold CV) for each parameter and derive the optimal probability boundary (pcut). The k-split cross-validation is a method to increase the statistical reliability of a classifier’s performance measurement when there is insufficient data. k is the number of partitions. Cross-validation was conducted to measure the performance of the model, as shown in Figure 3. In this study, a ten-division cross-validation was performed.
The ROC curve values of the adopted logistic regression model are shown in Figure 4. The area under the ROC (AUROC) curve with the highest accuracy was 0.9639, probability boundary value was 0.3834, and probability boundary value was 555,381.2.
3.3.2. Development of Damage Estimation Model by Group
Based on the probability boundary values determined through the logistic regression and ROC curve verification, the learning data were classified into groups with major and minor damage, following which a separate group-by-group multiple regression analysis was conducted. The accuracy of the group damage prediction model prototypes developed in the learning section was evaluated using the RMSE and NMRSE. RMSE: 1,260,167 and NMRSE: 6.95% of the results of the verification through the prediction section showed excellent accuracy and finally developed a predictive function using the entire section. The group classification function of the damage cost is shown in Table 3, which shows the regression coefficient and the intercept value of the group damage prediction function.
3.3.3. Verification of Predicted Amount by Wind-Damage Model
Through the prediction model of the wind-damage amount calculated through the above procedure, the accuracy of the forecast model was verified for four areas with recovery costs in 2020 out of the wind-damage history in 2018. First, the independent variable data and amount of damage amount data in the area were collected (Table 4), and the separation of the estimated amount of damage by group through the previously developed group damage prediction model was performed to compare and analyze the actual amount of damage. The analysis showed that the RMSE and NMRSE were 301,269 and 30.7%, respectively.
The biggest error occurred in Jeju City, which was attributed to the fact that the Geomundo Observatory, an observation site for the use of tidal data in Jeju City, was approximately 100 km away from Jeju City, which is not sufficiently close to representing the marine climate of Jeju Island.
Although there is a domestic observation post on Chujado Island, whose reports are closer to the occurrence time of the damage, it was not suitable for use in Jeju Island’s damage history (three cases from 1999 to 2013). In addition, because Jeju City was clustered and analyzed under Namhae and Jeju, it was believed that the amount of damage was overestimated, as it was leveled in other areas where there was significant storm damage (Table 5).
4. Conclusions
In this study, a storm damage prediction function was developed based on the CDAS index, number of local households per year, and local square measures to reflect the local characteristics after collecting wind-damage history and similar wind-damage history data from 1991 to 2020.
A total of 378 cases of storm damage were collected, with an average of 5.1 cases per 74 cities and counties in coastal areas, which was deemed insufficient to predict individual damage history in cities and counties. Therefore, the data shortage was addressed by clustering by the sea area, and the damage prediction function was developed through the representative factors of each city and county. According to the accuracy analysis of the developed wind damage prediction function, RMSE is 1,260,167 and N-RMSE is 6.9%, which is considered to be highly accurate. Consequently, the predictive power evaluation facilitated contributing to the establishment of policies that reflect regional characteristics, as it solved the problem of lack of disaster statistics data through reverse clustering of natural disasters, and reflected regional characteristics. The proposed model can effectively aggregate and calculate the actual storm damage; it can improve the laws and systems related to disaster management and, consequently, the recovery guidelines.
Specifically, by highlighting areas vulnerable areas that require proactive steps to prevent storm damage, the proposed model can enable the MOIS to establish a comprehensive plan to reduce natural disasters.
However, because of the necessary statistical analysis based on disaster history, implementing the proposed method necessitates building a database of continuously collected damage history data; it is believed that more accurate results will be obtained if additional data on storm damage alone are collected. In addition, further studies are required to improve the accuracy of observations for areas that are far from the damage location and ocean observation stations.
Author Contributions
Conceptualization, Y.M.C. and S.B.S.; Investigation, Y.M.C., S.B.S., H.S.J. and K.H.C.; Methodology, S.B.S.; Writing—original draft, Y.M.C. All authors have read and agreed to the published version of the manuscript.
Funding
This work was supported by Institute of Industrial Technology, Pusan National University.
Institutional Review Board Statement
Not Applicable.
Informed Consent Statement
Not Applicable.
Data Availability Statement
This study did not report any data.
Conflicts of Interest
The authors declare no conflict of interest.
References
- Platt, R.H. Disaster and Democracy; Washington Island Press: Washington, DC, USA, 1999. [Google Scholar]
- Park, D.K. The Emergency Management System in the U.S.—The Lessons from the Hurricane Sandy; The Korean Society of Private Security: Chungcheongnam-do, Korea, 2013; Volume 12, p. 77. [Google Scholar]
- Ko, D.H. Hurricane Katrina as Unnatural Disaster: Government Failure and Inequality of Risk; Korea Social Policy Review: Seoul, Korea, 2015; Volume 22, p. 84. [Google Scholar]
- Townsend, F. The Federal Response to Hurricane Katrina: Lessons Learned; The White House: Washington, DC, USA, 2006. [Google Scholar]
- Kang, S.W.; Jun, K.C.; Kim, S.I.; Park, K.S. Storm Surge Prediction in Masan Bay Using Fine-Scaled Surge Model for Typhoon ‘MAEMI’; The Korean Society of Oceanography: Seoul, Korea, 2004; pp. 178–179. [Google Scholar]
- Lee, H.W.; Lee, J.H. Heavy Seas Forecast Using Convolutional Neural Network; Korean Institute of Intelligent Systems Fall Conference: Seoul, Korea, 2014; Volume 24, pp. 77–78. [Google Scholar]
- Lee, S.S.; Won, C.H.; Kim, Y.M. Numerical Prediction of Typhoon Storm Surge Using Ocean-Meteorology Coupled Model. J. Wind Eng. Inst. Korea 2014, 18, 207–214. [Google Scholar]
- Vanem, E.; Fazeres-Ferradosa, T.; Rosa-Santos, P.; Taveira-Pinto, F. Statistical Description and Modelling of Extreme Ocean Wave Conditions. Proceedings of the Institution of Civil Engineers-Maritime Engineering; Thomas Telford Ltd.: London, UK, 2019; Volume 172. [Google Scholar] [CrossRef]
- Fazeres-Ferradosa, T.; Taveira-Pinto, F.; Vanem, E.; Reis, M.T.; Neves, L.D. Asymmetric Copula–Based Distribution Models for Met-ocean Data in Offshore Wind Engineering Applications; Wind Engineering: Washington, DC, USA, 2018; Volume 42, pp. 304–334. [Google Scholar] [CrossRef] [Green Version]
- Korea Adaptation Center for Climate Change (KACCC). Local Government Vulnerability Evaluation Support Report; Ministry of Environment: Seoul, Korea, 2013. [Google Scholar]
- WAMDI Group. The WAM model—A Third Generation Ocean Wave Prediction Model. J. Phys. Oceanogr. 1988, 18, 1775–1810. [Google Scholar] [CrossRef] [Green Version]
- Soomere, T. Wind Wave Statistics in Tallinn Bay. Boreal Environ. Res. 2005, 10, 103–118. [Google Scholar]
- Ardhuin, F.; Gille, S.T.; Menemenlis, D.; Rocha, C.B.; Rascle, N.; Chapron, B.; Molemaker, J. Small-scale Open Ocean Currents have Large Effects on Wind Wave Heights. J. Geophys. Res. Ocean. 2017, 122, 4500–4517. [Google Scholar] [CrossRef] [Green Version]
- Oliveira, S.; Moura, D.; Boski, T. The evolution of the European framework for coastal management, linked to the new environmental challenges. The Portuguese case. Gestão Costeira Integr. J. Integr. Coast. Zone Manag. 2020, 20, 27–48. [Google Scholar] [CrossRef]
- Taveira-Pinto, F.; Rosa-Santos, P.; Ferradosa, T. Integrated management and planning of coastal zones in CPLP-Part 1. J. Integr. Coast. Zone Manag. 2020, 20, 85–87. [Google Scholar] [CrossRef]
- Wu, M.; de Vos, L.; Chavez, C.E.A.; Stratigaki, V.; Fazeres-Ferradosa, T.; Rosa-Santos, P.; Taveira-Pinto, F.; Troch, P. Large scale experimental study of the scour protection damage around a monopile foundation under combined wave and current conditions. J. Mar. Sci. Eng. 2020, 8, 417. [Google Scholar] [CrossRef]
Figure 1.
Precedure to Develop Wind Wave Damage Amount Prediction Model.

Figure 2.
Study Area.

Figure 3.
k-fold Cross-validation.

Figure 4.
Evaluating Group Classification Model with ROC-Curve.


Table 1.
Number of Wind Wave Damage Events by Coast.
| Coast | Provinces | Cities and Counties | Number of Wind Wave Damage |
|---|---|---|---|
| east | Gangwon-do | Gangneung City, Goseong-gun, Gangwon-do, Sokcho City, Samcheok, Sokcho, Yangyang County. | 78 |
| Gyeongsangbuk-do | Gyeongju City, Yeongdeok County, Ulleung County, Uljin County, Pohang City | ||
| Ulsan Metropolitan City | Nam-gu, Dong-gu, Buk-gu, Ulju-gun | ||
| west | Gyeonggi-do | Gimpo City, Siheung City, Ansan City, Pyeongtaek City, and Hwaseong City | 138 |
| Incheon Metropolitan City | Ganghwa-gun, Dong-gu, Seo-gu, Yeonsu-gu, Ongjin-gun, Jung-gu | ||
| Jeollanam-do | Mokpo City, Muan County, Sinan County, Yeonggwang County, Yeongam County, Jindo County, Hampyeong County, Haenam County | ||
| Jeollabuk-do | Gochang-gun, Kunsan-si, Gimje-si, Buan-gun | ||
| Chungcheongnam-do | Dangjin-gun, Boryeong-si, Seosan-si, Seocheon-gun, Asan-si, Taean-gun, Hongseong-gun | ||
| south | Gyeongsangnam-do | Geoje City, Goseong County, Namhae County, Sacheon City, Changwon City, Tongyeong City and Hadong County | 162 |
| Busan Metropolitan City | Geoje City, Goseong County, Namhae County, Sacheon City, Changwon City, Tongyeong City and Hadong County | ||
| Jeollanam-do | Gangjin County, Goheung County, Gwangyang City, Boseong County, Suncheon City, Yeosu City, Wando County, and Jangheung County | ||
| Jeju Island | Seogwipo City, Jeju City | ||
| Total data | 378 | ||
Table 2.
Variable Selection.
| Index | Variable Name | Category |
|---|---|---|
| Wind Wave Damage Amount (1000 Won) | Y | Subordination Variable |
| Wind Wave Damage Recovery Amount (1000 Won) | Z | Independent Variable |
| Average Wind (m/s) | W | |
| Maximum Wave Height (m) | P1 | |
| Average Wave Height (m) | P2 | |
| Maximum Tidal Height (m) | T1 | |
| Average Tidal Height (m) | T2 | |
| Coastal Disaster Exposure Index | CODI | |
| Coastal Sensitivity Index | COSI | |
| Coastal Potential Impact Index | CPII | |
| Coast Area (km2) | area | |
| Coastline (km2) | length_coast | |
| Number of Fishers (1000 People) | fishery_pop |
Table 3.
Regression coefficient and the intercept value of the group damage prediction function.
| Variable Name | Cost | ||||||||
|---|---|---|---|---|---|---|---|---|---|
| Group Classification Function | Large Amount of Damage | Less Amount of Damage | |||||||
| East | West | South | East | West | South | East | West | South | |
| Y | −0.257 | −0.131 | 0.127 | 9.646 | 9.143 | 7.923 | 13.704 | 15.231 | 9.964 |
| Z | −0.009 | −0.009 | −0.009 | 0.034 | 0.034 | 0.034 | 0.066 | 0.066 | 0.066 |
| W | 0.031 | 0.028 | 0.032 | −0.033 | −0.033 | −0.033 | 0.209 | −0.007 | −0.077 |
| P1 | −0.091 | −0.091 | −0.091 | −0.075 | 0.050 | 0.802 | −1.093 | −0.004 | 0.704 |
| P2 | 0.756 | −0.206 | 0.087 | −0.200 | −0.200 | −0.200 | 0.463 | 0.463 | 0.463 |
| T1 | 0.265 | 0.254 | −0.030 | 0.223 | 0.223 | 0.223 | −0.191 | −0.191 | −0.191 |
| T2 | 4.6 × 10⁻⁹ | 8.2 × 10⁻⁹ | 4.0 × 10⁻⁸ | 2.1 × 10⁻⁶ | 3.8 × 10⁻⁶ | 1.1 × 10⁻⁶ | 4.4 × 10⁻⁸ | 5.7 × 10⁻⁸ | 1.7 × 10⁻⁷ |
| CODI | −0.088 | −0.088 | −0.088 | 0.548 | 0.548 | 0.548 | 0.254 | 1.509 | 0.854 |
| COSI | −0.043 | −0.043 | −0.043 | 0.659 | 0.659 | 0.659 | 0.318 | 0.318 | 0.318 |
| CPII | 0.169 | 0.169 | 0.169 | −1.141 | −1.141 | −1.141 | −0.679 | −2.235 | −0.431 |
| area | 1.6 × 10⁻⁴ | 1.6 × 10⁻⁴ | 1.6 × 10⁻⁴ | 5.4 × 10⁻⁴ | 5.4 × 10⁻⁴ | 5.4 × 10⁻⁴ | 4.8 × 10⁻⁶ | −1.9 × 10⁻³ | 6.4 × 10⁻⁴ |
| length_coast | −4.2 × 10⁻⁵ | −4.2 × 10⁻⁵ | −4.2 × 10⁻⁵ | 3.9 × 10⁻⁴ | 3.9 × 10⁻⁴ | 3.9 × 10⁻⁴ | −4.2 × 10⁻⁶ | −4.2 × 10⁻⁶ | −4.2 × 10⁻⁶ |
| fishery_pop | 5.4 × 10⁻⁷ | 5.4 × 10⁻⁷ | 5.4 × 10⁻⁷ | −4.5 × 10⁻⁵ | −4.5 × 10⁻⁵ | −4.5 × 10⁻⁵ | 3.8 × 10⁻⁵ | 3.8 × 10⁻⁵ | 3.8 × 10⁻⁵ |
Table 4.
Independent Variable Data Collection.
| Variable Name | Area Name | |||
|---|---|---|---|---|
| Seogwipo, Jeju-do | Jeju, Jeju-do | Seo-Gu, Busan-si | Sanchuck, Gangwon-do | |
| W (m/s) | 9.2 | 9.6 | 9.9 | 7.6 |
| P1 (m) | 9.3 | 8.7 | 4.1 | 5.5 |
| P2 (m) | 3.5 | 3.1 | 1.7 | 2 |
| T1 (m) | 1.9 | 2 | 0.9 | 0.3 |
| T2 (m) | 3.2 | 2.9 | 1.7 | 0.8 |
| Z (1000 Won) | 181,042 | 16,318 | 304,274 | 5000 |
| CODI | 5 | 5 | 4.8 | 2.9 |
| COSI | 3.7 | 4.2 | 4.6 | 3.4 |
| CPII | 4.5 | 4.7 | 4.8 | 3 |
| Area (km2) | 871 | 979 | 14 | 1187 |
| length_coast (km2) | 225.1 | 326.7 | 17.2 | 104.5 |
| fishery_pop (1000 People) | 2511 | 6740 | 295 | 654 |
Table 5.
Simulation result of Model (unit: KRW1000).
| Area Name | Actual Amount of Damage | Predict Amount of Damage |
|---|---|---|
| Seogwipo-si, Jeju-do | 41,834 | 49,837 |
| Jeju-si, Jeju-do | 3957 | 425,524 |
| Seo-Gu, Busan-si | 90,000 | 57,998 |
| Sanchuck-si, Gangwon-do | 455,140 | 434,021 |
| RMSE: 211,691/N-RMSE: 46.9% | ||
Publisher’s Note: MDPI stays neutral with regard to jurisdictional claims in published maps and institutional affiliations. |
© 2021 by the authors. Licensee MDPI, Basel, Switzerland. This article is an open access article distributed under the terms and conditions of the Creative Commons Attribution (CC BY) license (https://creativecommons.org/licenses/by/4.0/).
Share and Cite
MDPI and ACS Style
Choo, Y.M.; Chun, K.H.; Jeon, H.S.; Sim, S.B. A Predictive Model for Estimating Damage from Wind Waves during Coastal Storms. Water 2021, 13, 1322. https://doi.org/10.3390/w13091322
AMA Style
Choo YM, Chun KH, Jeon HS, Sim SB. A Predictive Model for Estimating Damage from Wind Waves during Coastal Storms. Water. 2021; 13(9):1322. https://doi.org/10.3390/w13091322
Chicago/Turabian StyleChoo, Yeon Moon, Kun Hak Chun, Hae Seong Jeon, and Sang Bo Sim. 2021. "A Predictive Model for Estimating Damage from Wind Waves during Coastal Storms" Water 13, no. 9: 1322. https://doi.org/10.3390/w13091322
Note that from the first issue of 2016, this journal uses article numbers instead of page numbers. See further details here.