
A Holistic Framework for Evaluating Adaptation Approaches to Coastal Hazards and Sea Level Rise: A Case Study from Imperial Beach, California

 ,
,
Abstract
:1. Introduction
2. Methods
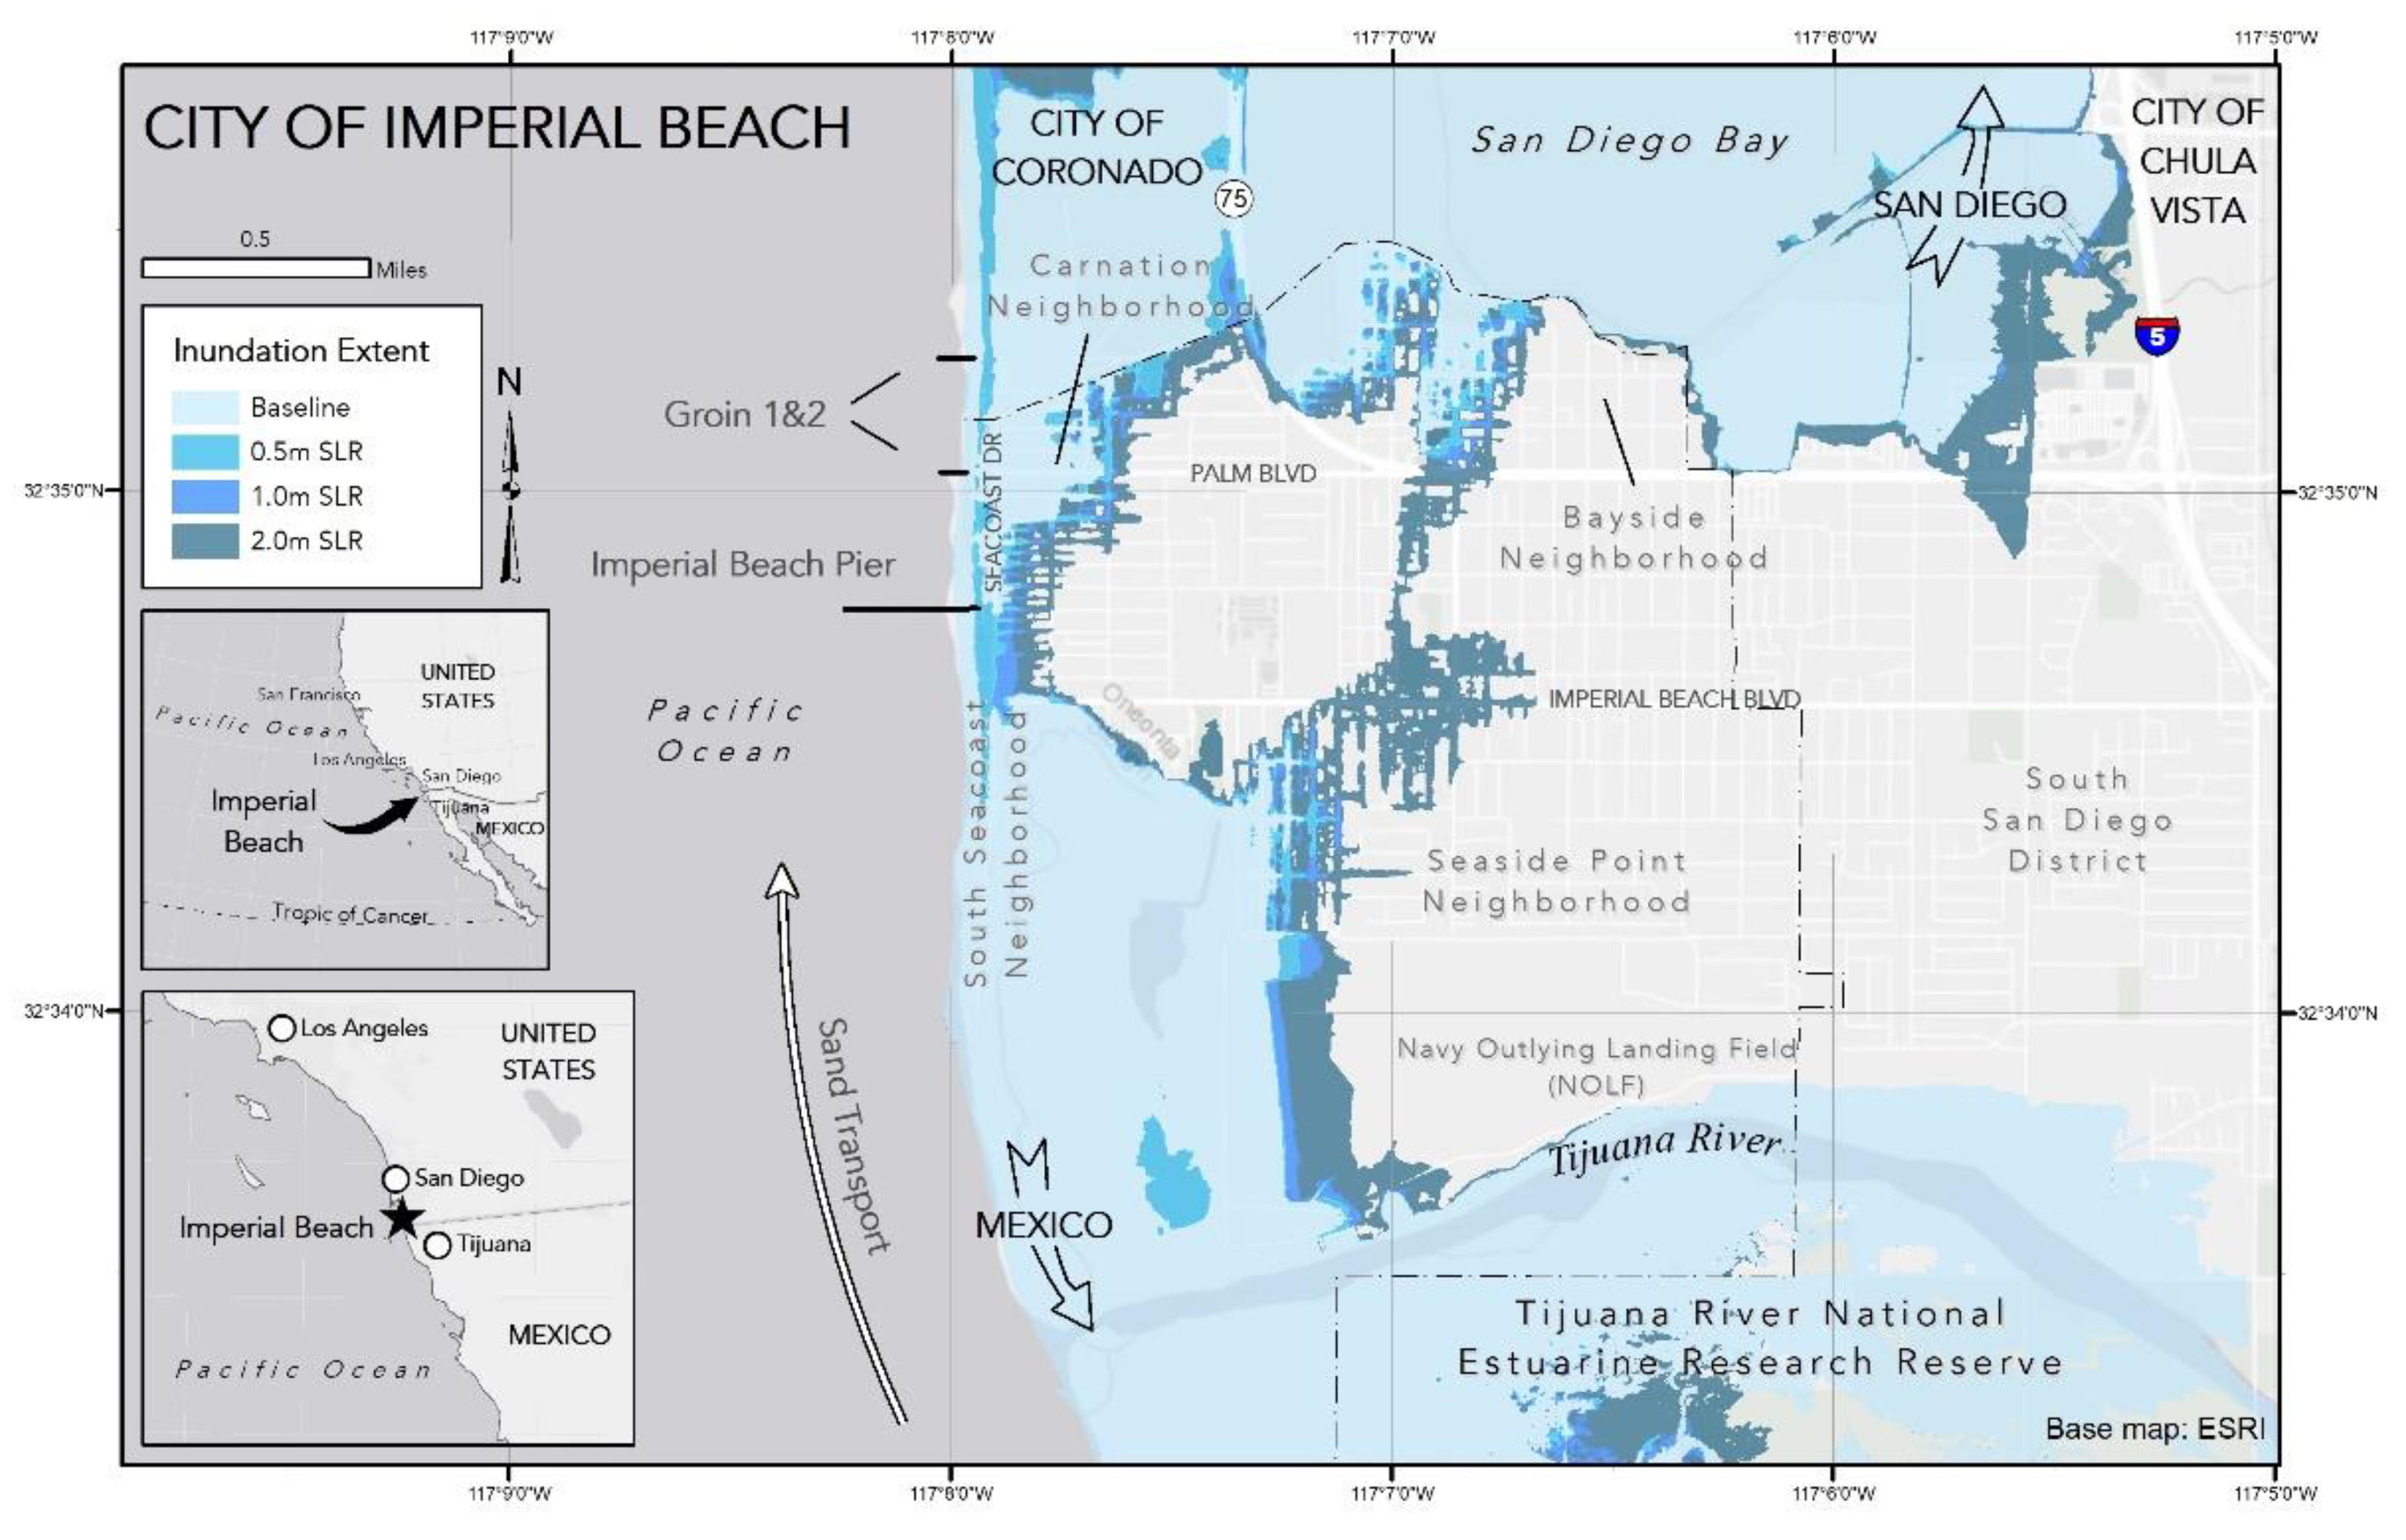
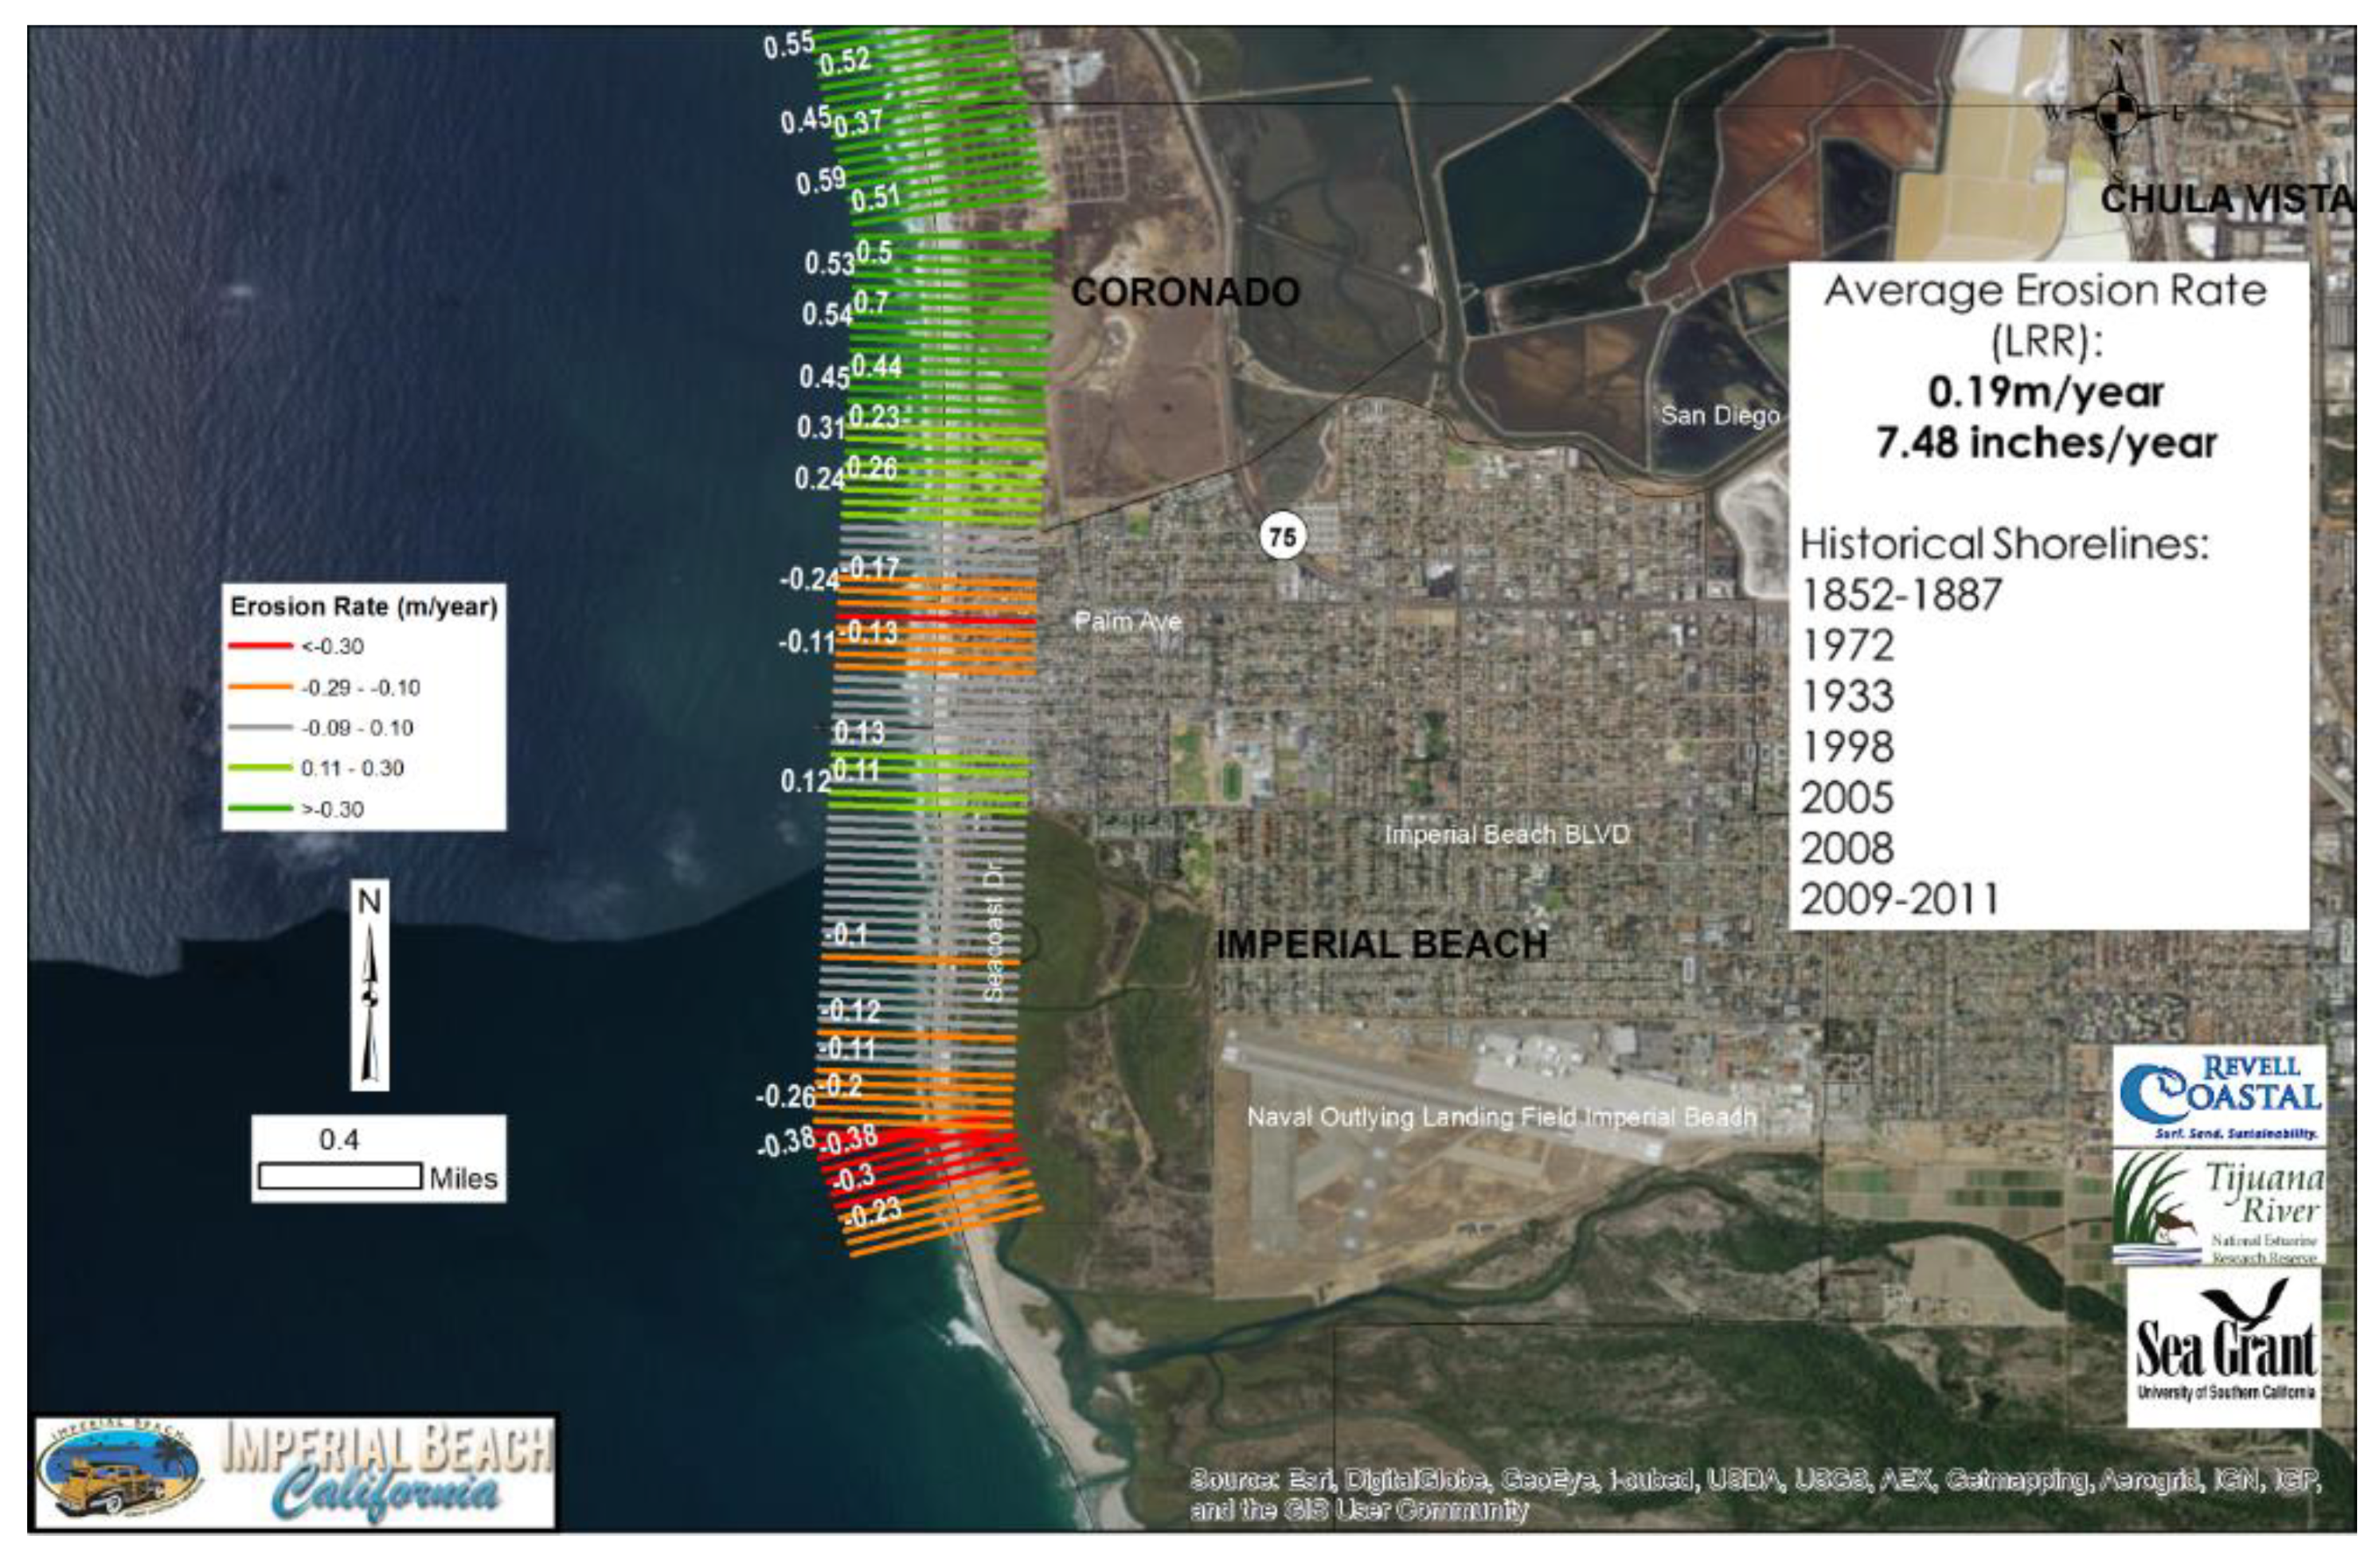
2.1. Site Description
2.2. Phase One: Vulnerability Assessment
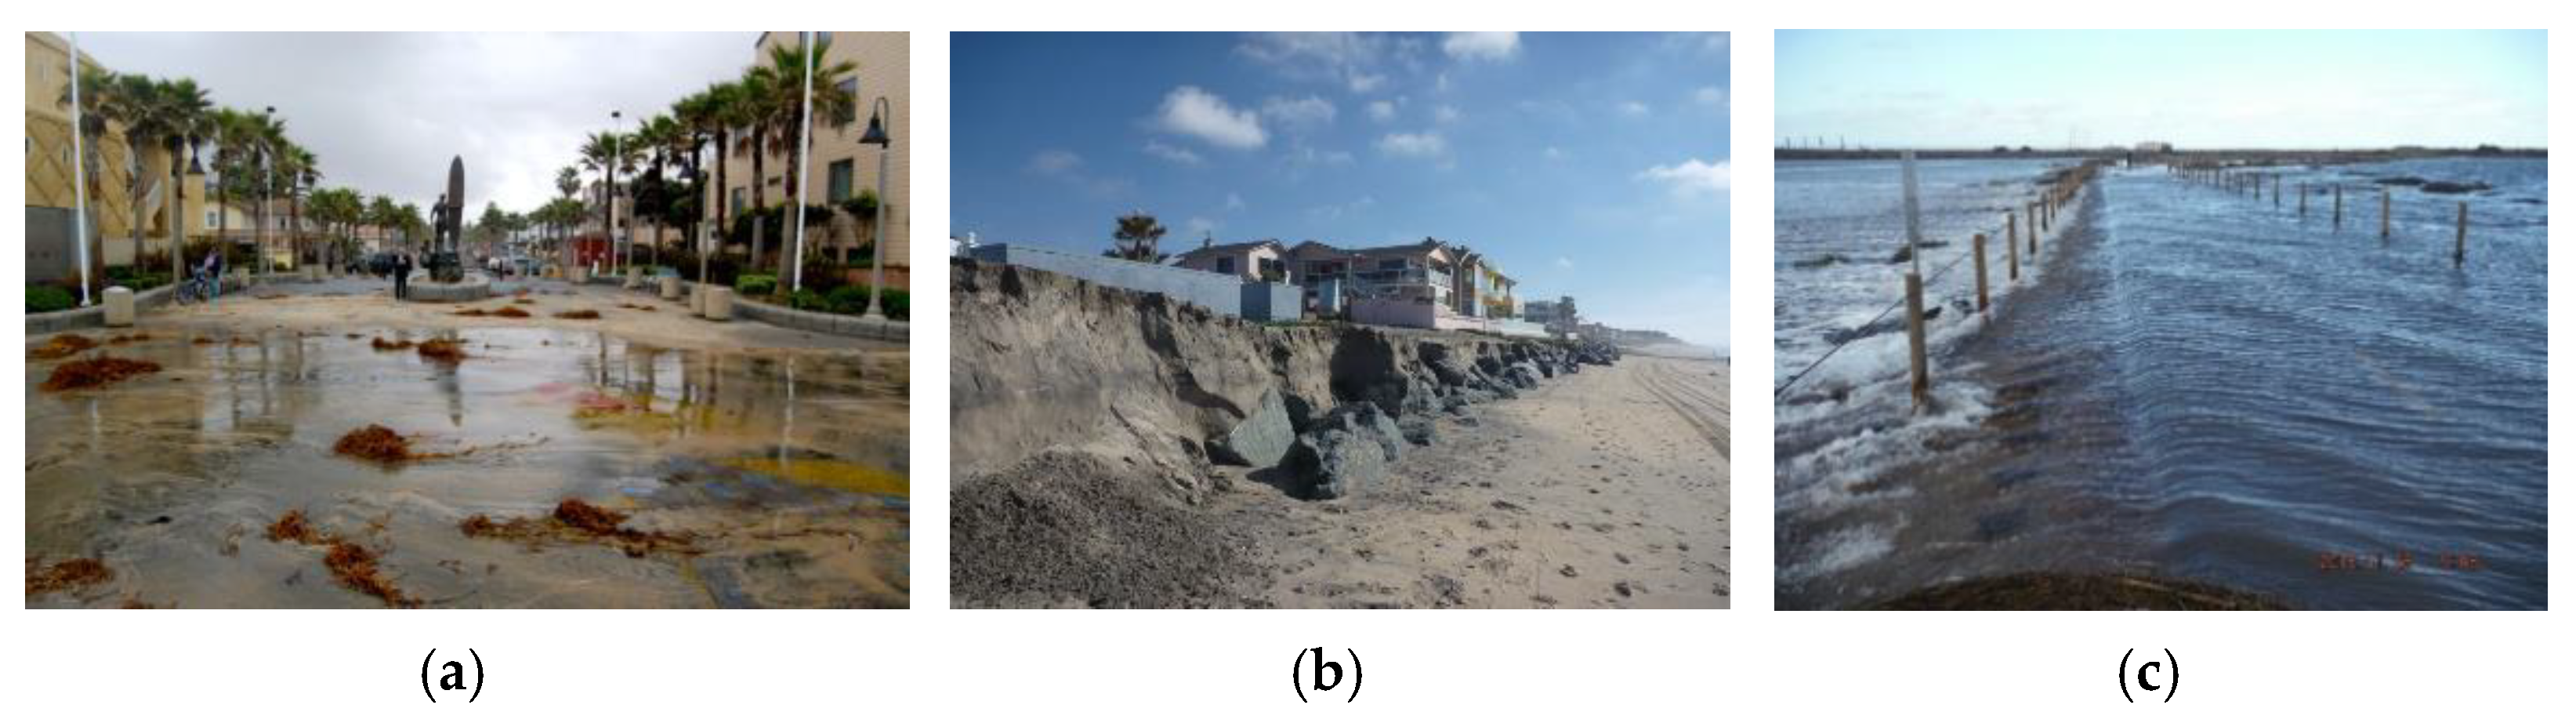
- Coastal Flooding (a): Temporary flooding caused by a 1% annual chance storm wave event.
- Coastal Erosion (b): Permanent erosion resulting in loss of land from a 1% annual chance of wave erosion.
- Tidal Inundation (c): Periodic inundation caused during a high king tide event.
- SPAWAR: Coastal erosion projections of 0, 0.5, 1.0, and 2.0 m [35].
- Asset Data: Infrastructure data from City of Imperial Beach, San Diego County, and the U.S. Environmental Protection Agency.
- Land Use—number of parcels and structures
- Roads—lengths
- Public Transportation—lengths and number of routes
- Wastewater—pipe lengths and pump stations
- Stormwater—drop inlets, pipe lengths, outfalls, and reduction in conveyance
- Schools—number of buildings and land area
- Hazardous Materials—number of businesses, underground tanks, cleanup sites.
2.3. Phase Two: Analysis of Adaptation Alternatives
- Coastal armoring
- Beach nourishment
- Living shoreline dune and cobble approach
- Five groins with sand nourishment
- Managed retreat.
2.3.1. Physical Methods
2.3.2. Economic Methods: Cost–Benefit Analysis
- Estimating the benefits of each adaptation alternative. The primary benefits measured in this study were:
- (a)
- Flood damage avoidance to private and public property;
- (b)
- Recreation (non-market) benefits of beaches;
- (c)
- Ecological value of beaches (measured at replacement cost).
- Estimating the project lifecycle costs of each alternative including, construction, maintenance, and (potentially) removal of structures.
- Calculating net present value of costs and benefits: the difference between the present value of cash inflows (benefits from adaptation) and the present value of cash outflows (cost and maintenance throughout the implementation period). Net present value is calculated as follows:
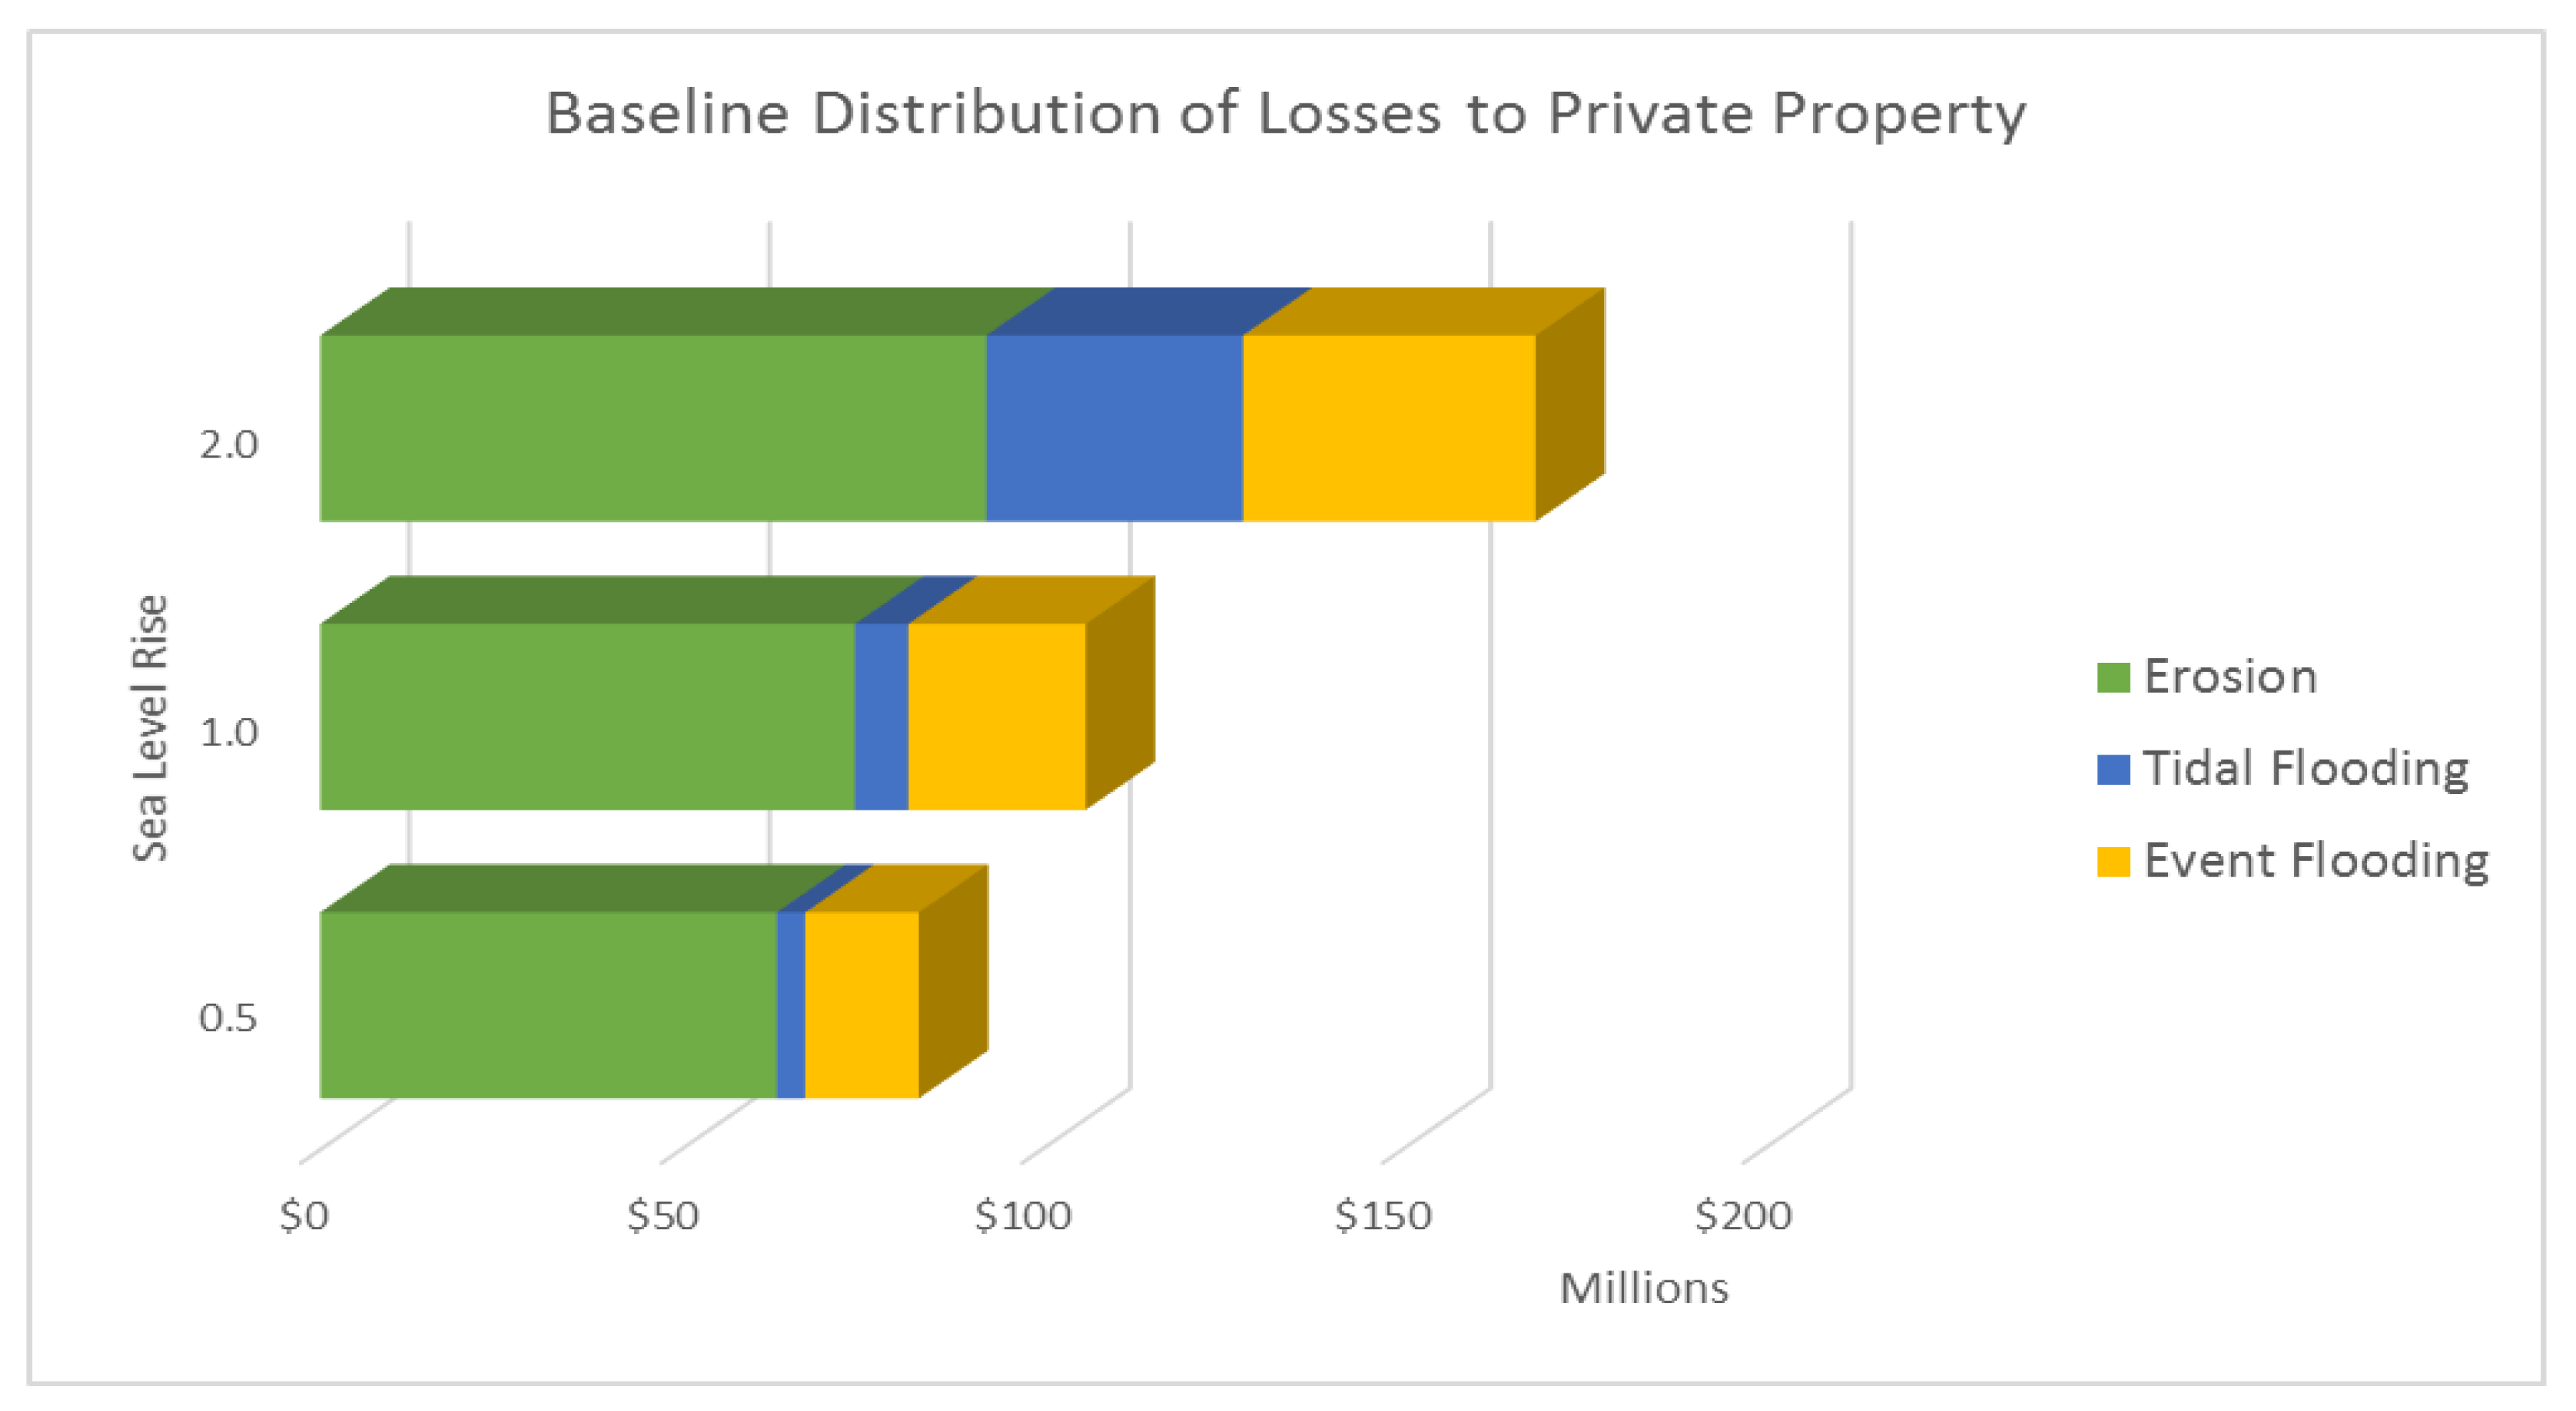
Private Property
Public Property
Infrastructure
Recreation
Ecological Benefits of Coastal Habitat
Ecological Impact of Nourishment
Engineering Cost Estimates
Tax Revenue Impacts
2.4. Comparison of Adaptation Strategies Using Net Benefits
3. Results
3.1. Vulnerability Assessment
- Stormwater—substantial decrease in stormwater capacity;
- Land Use—30% of all parcels and buildings;
- Roads—40% of all roads impacted.
3.2. Evaluation of Framework to Adaptation Alternatives
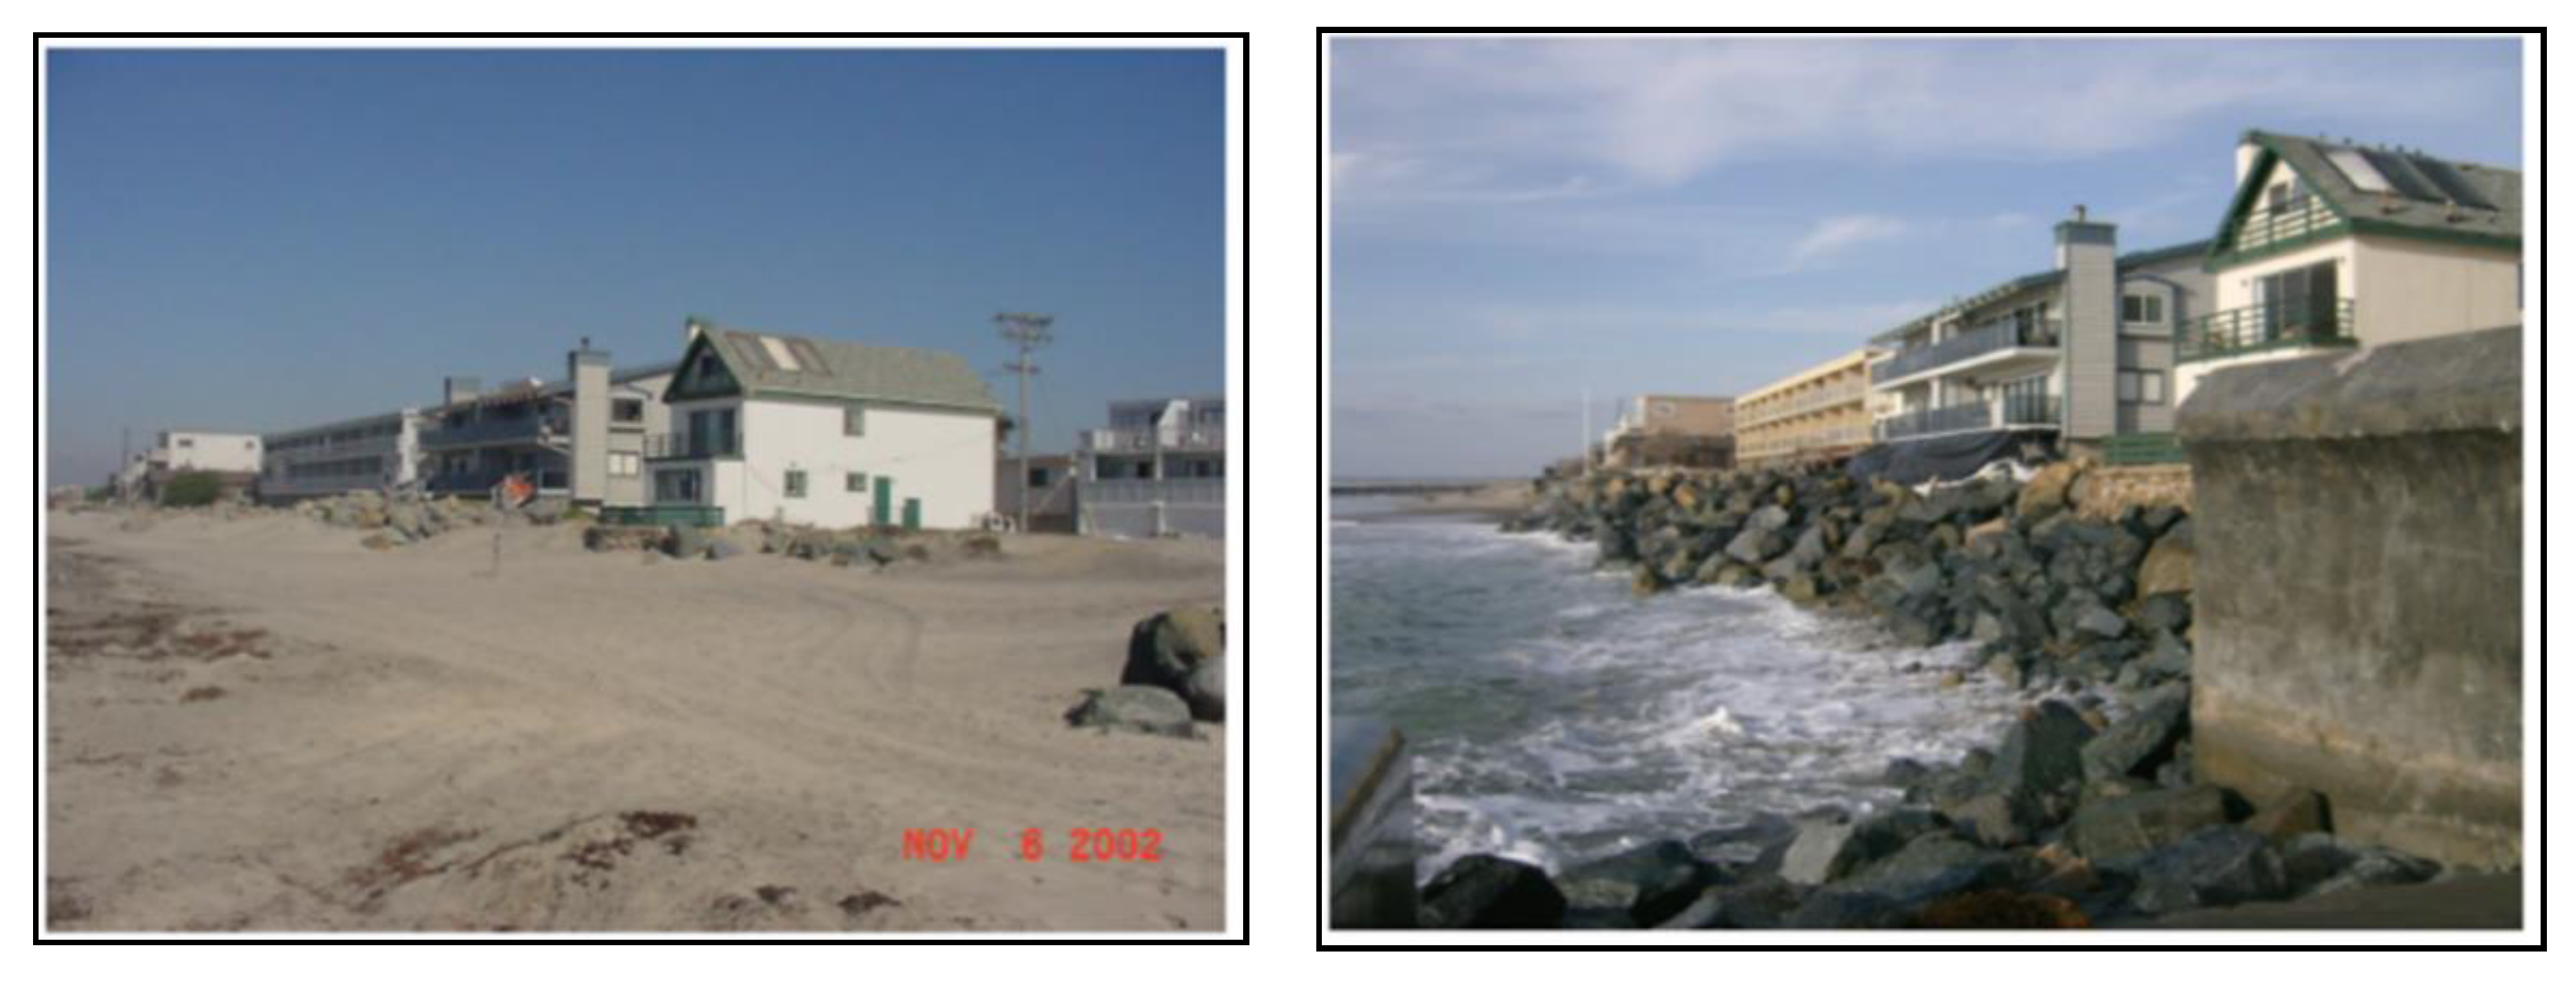
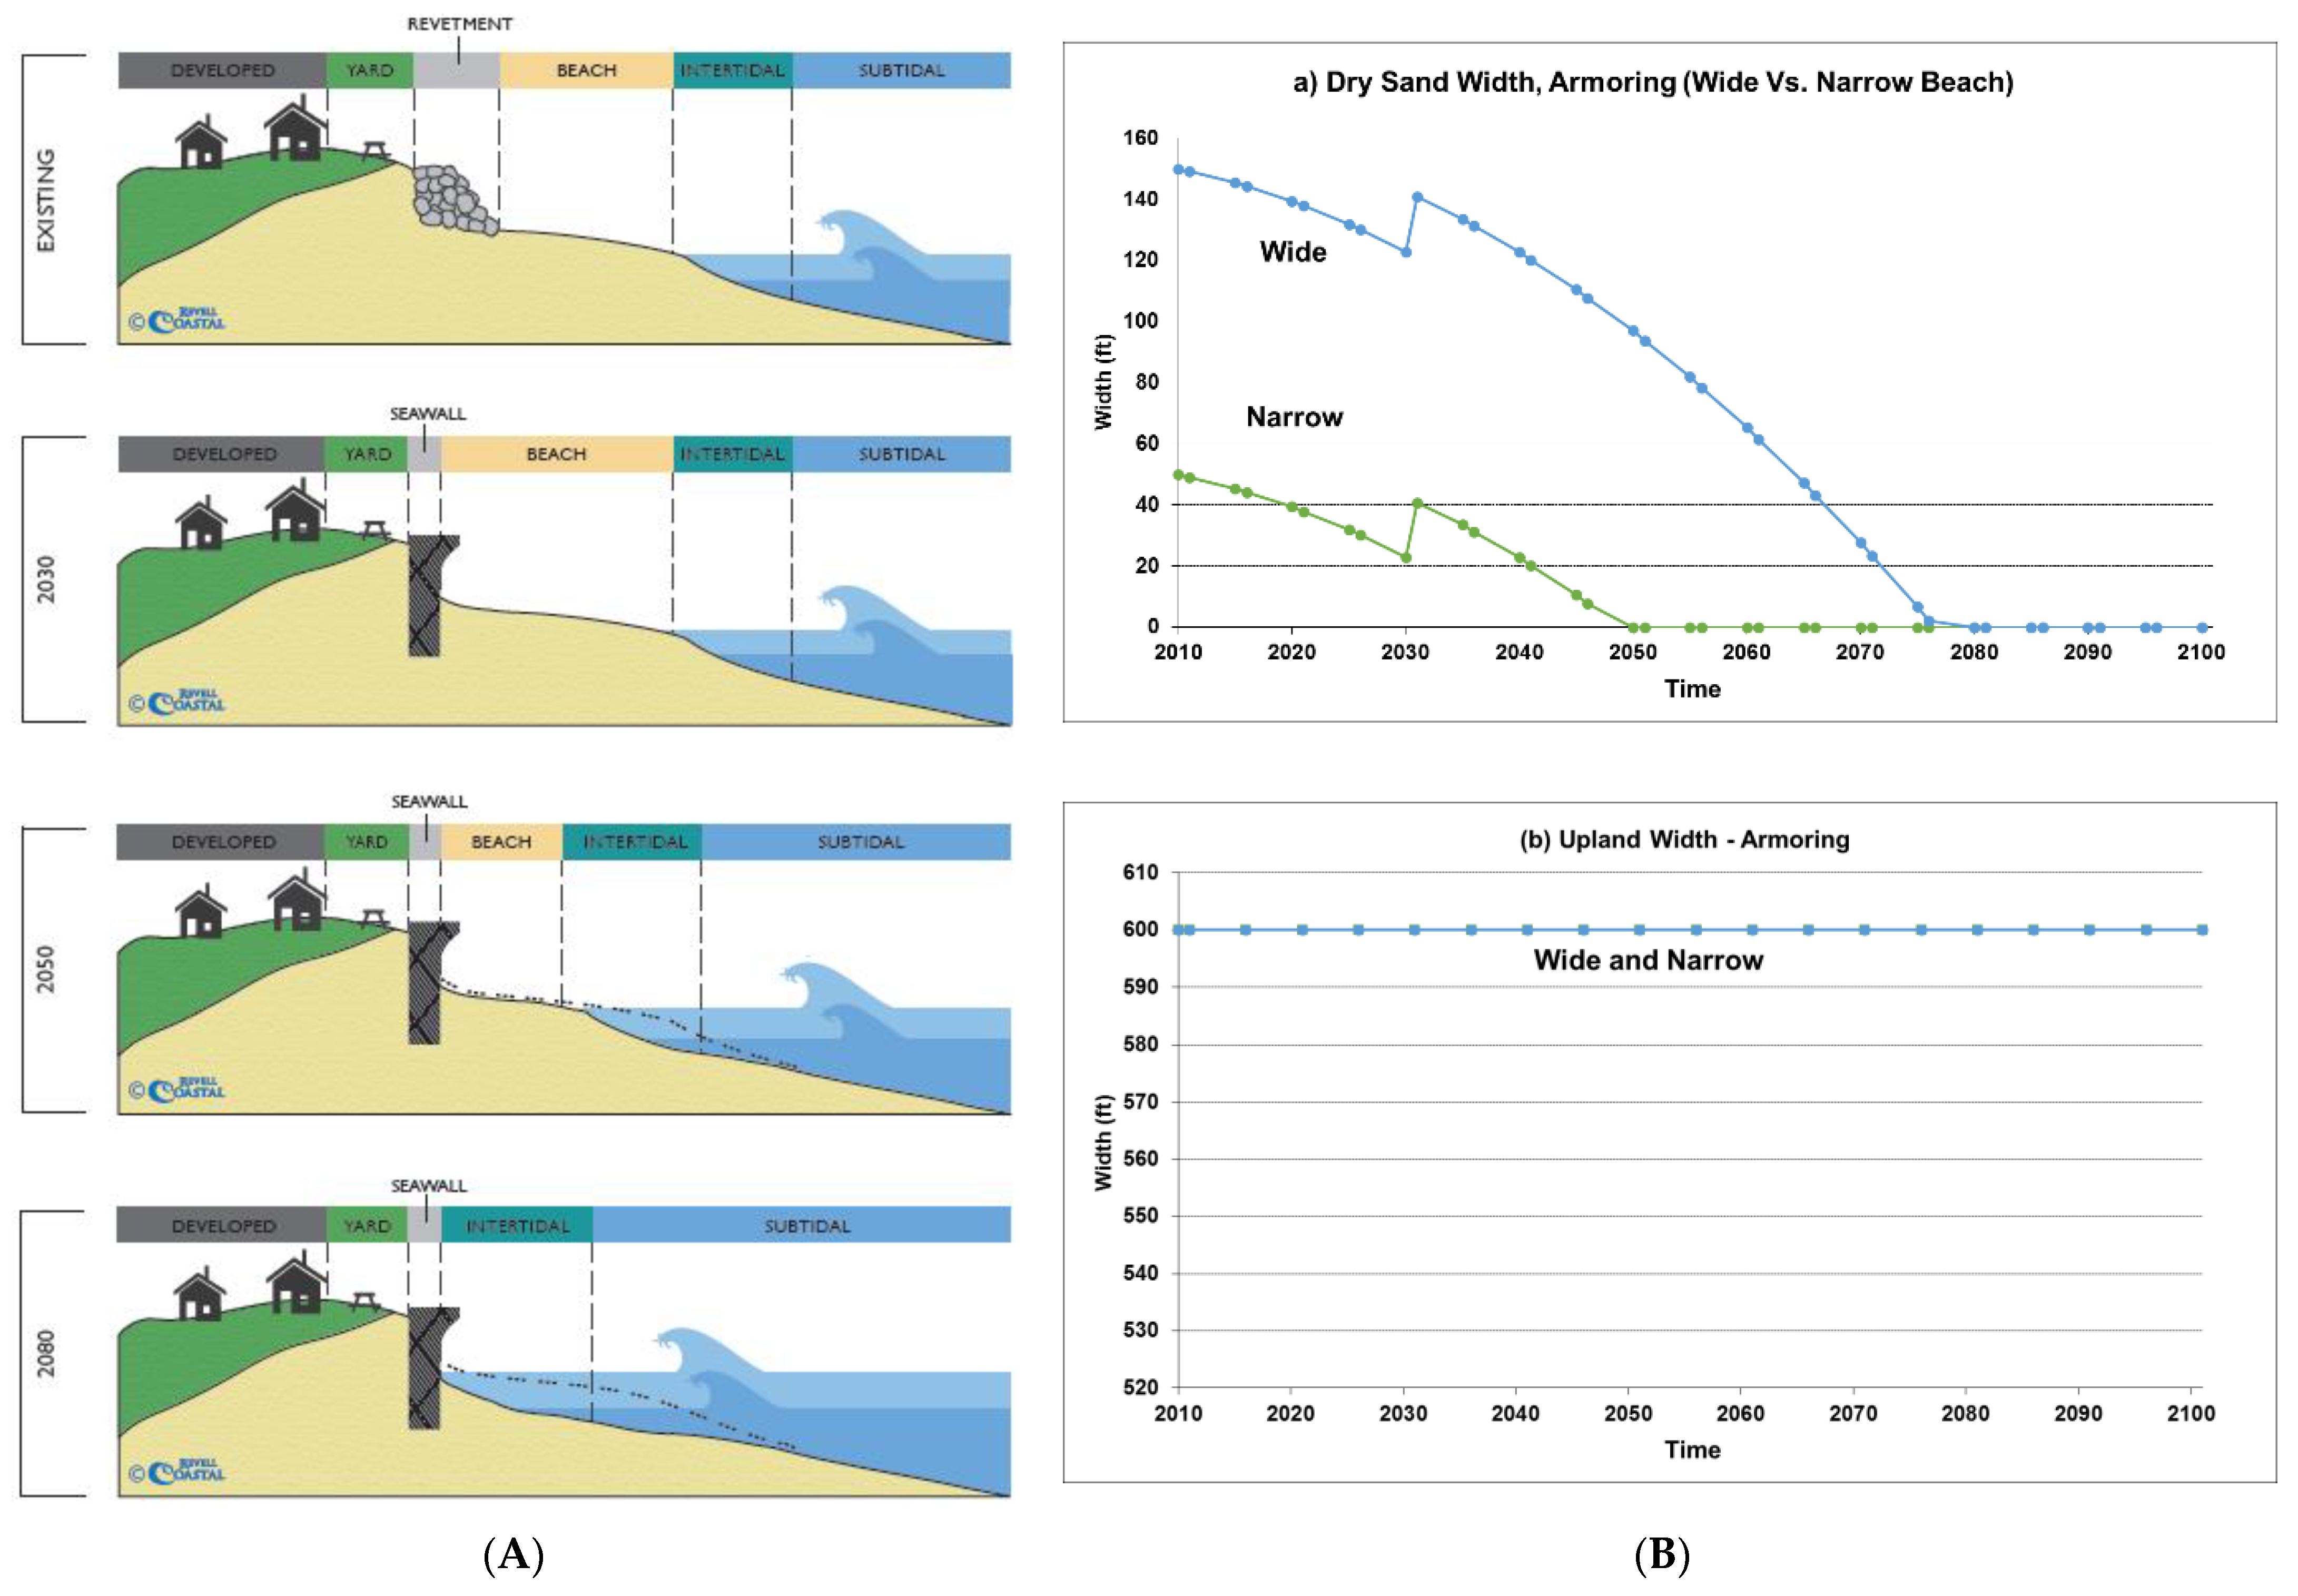
3.2.1. Coastal Armoring
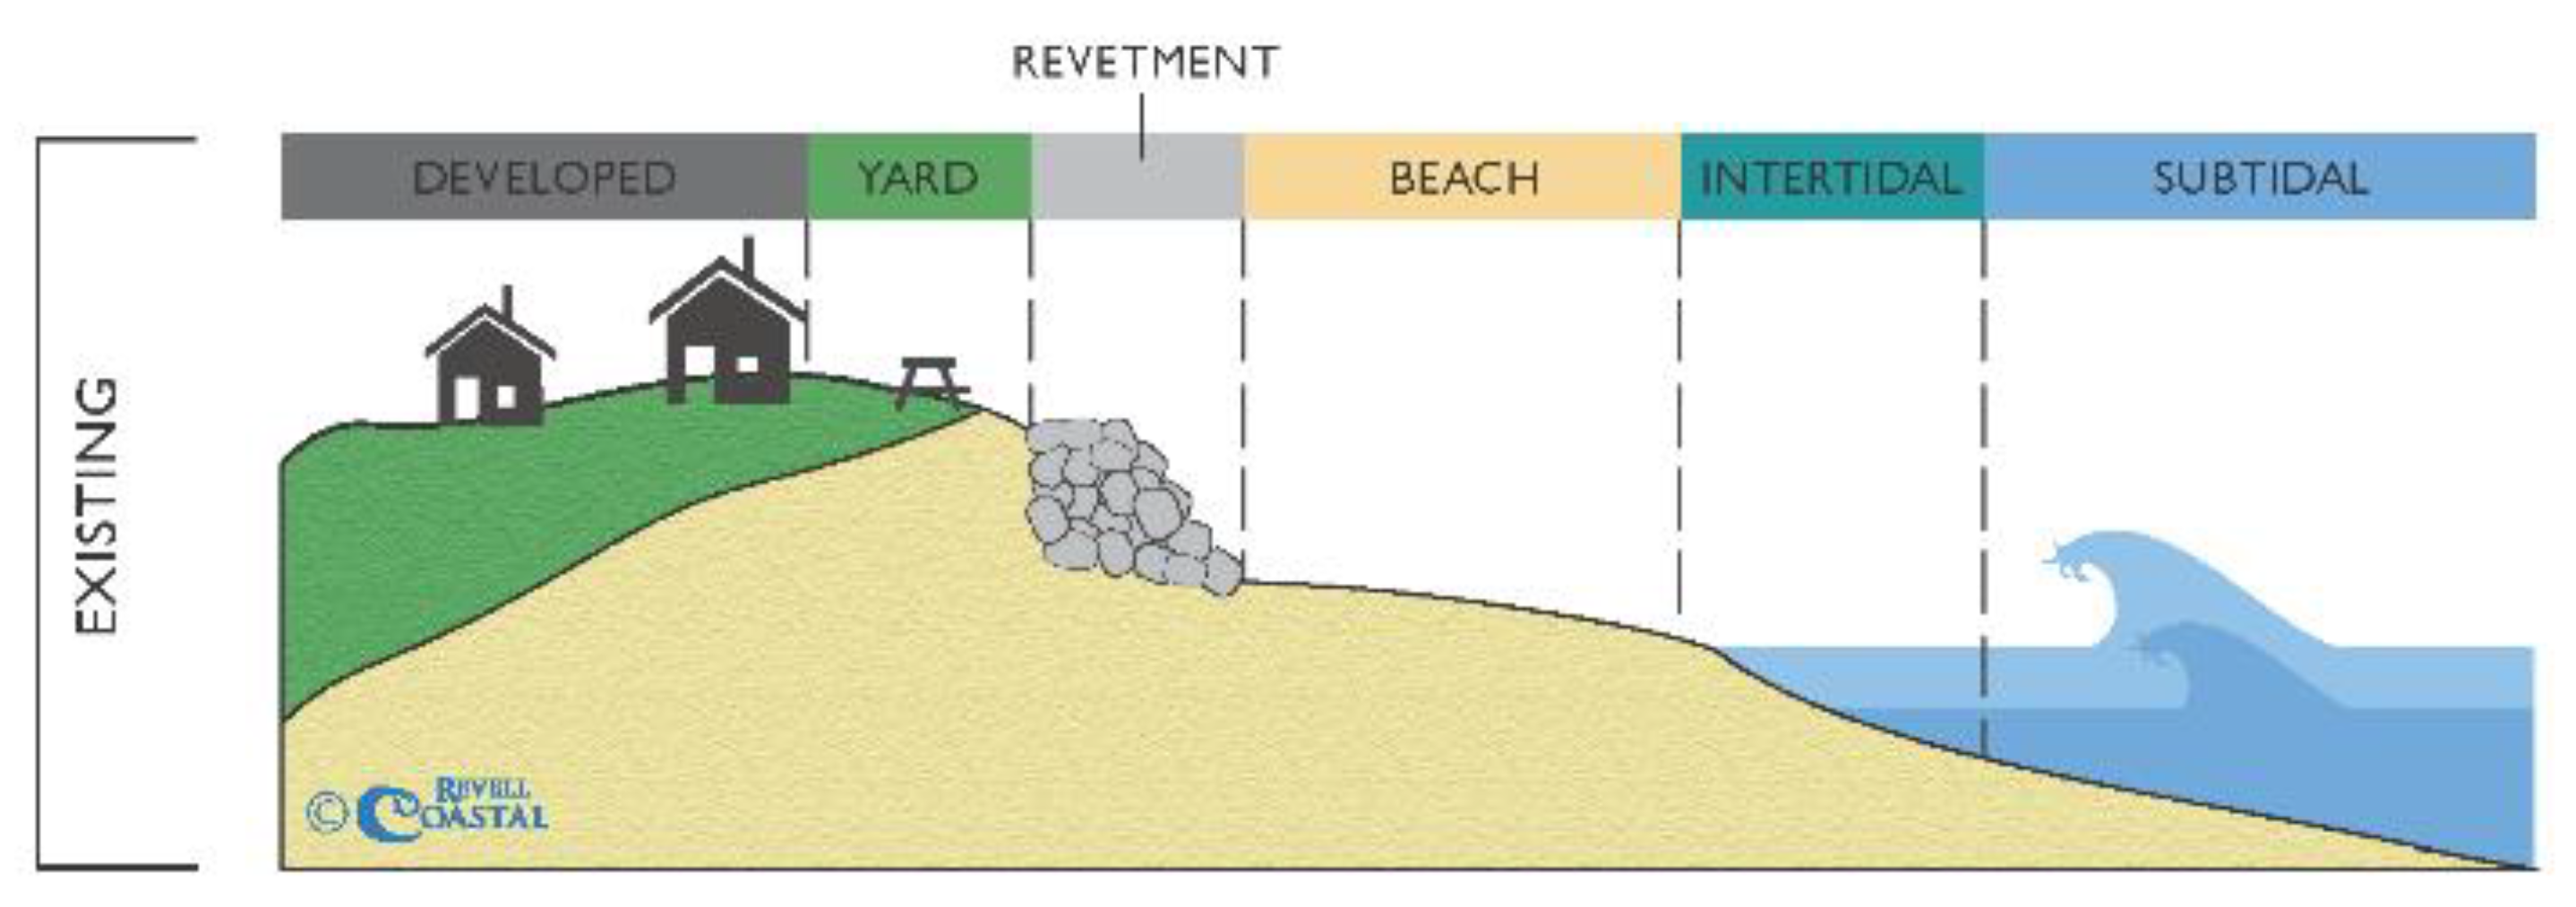
Conceptual Upland and Beach Response Model
Economic and Ecological Considerations
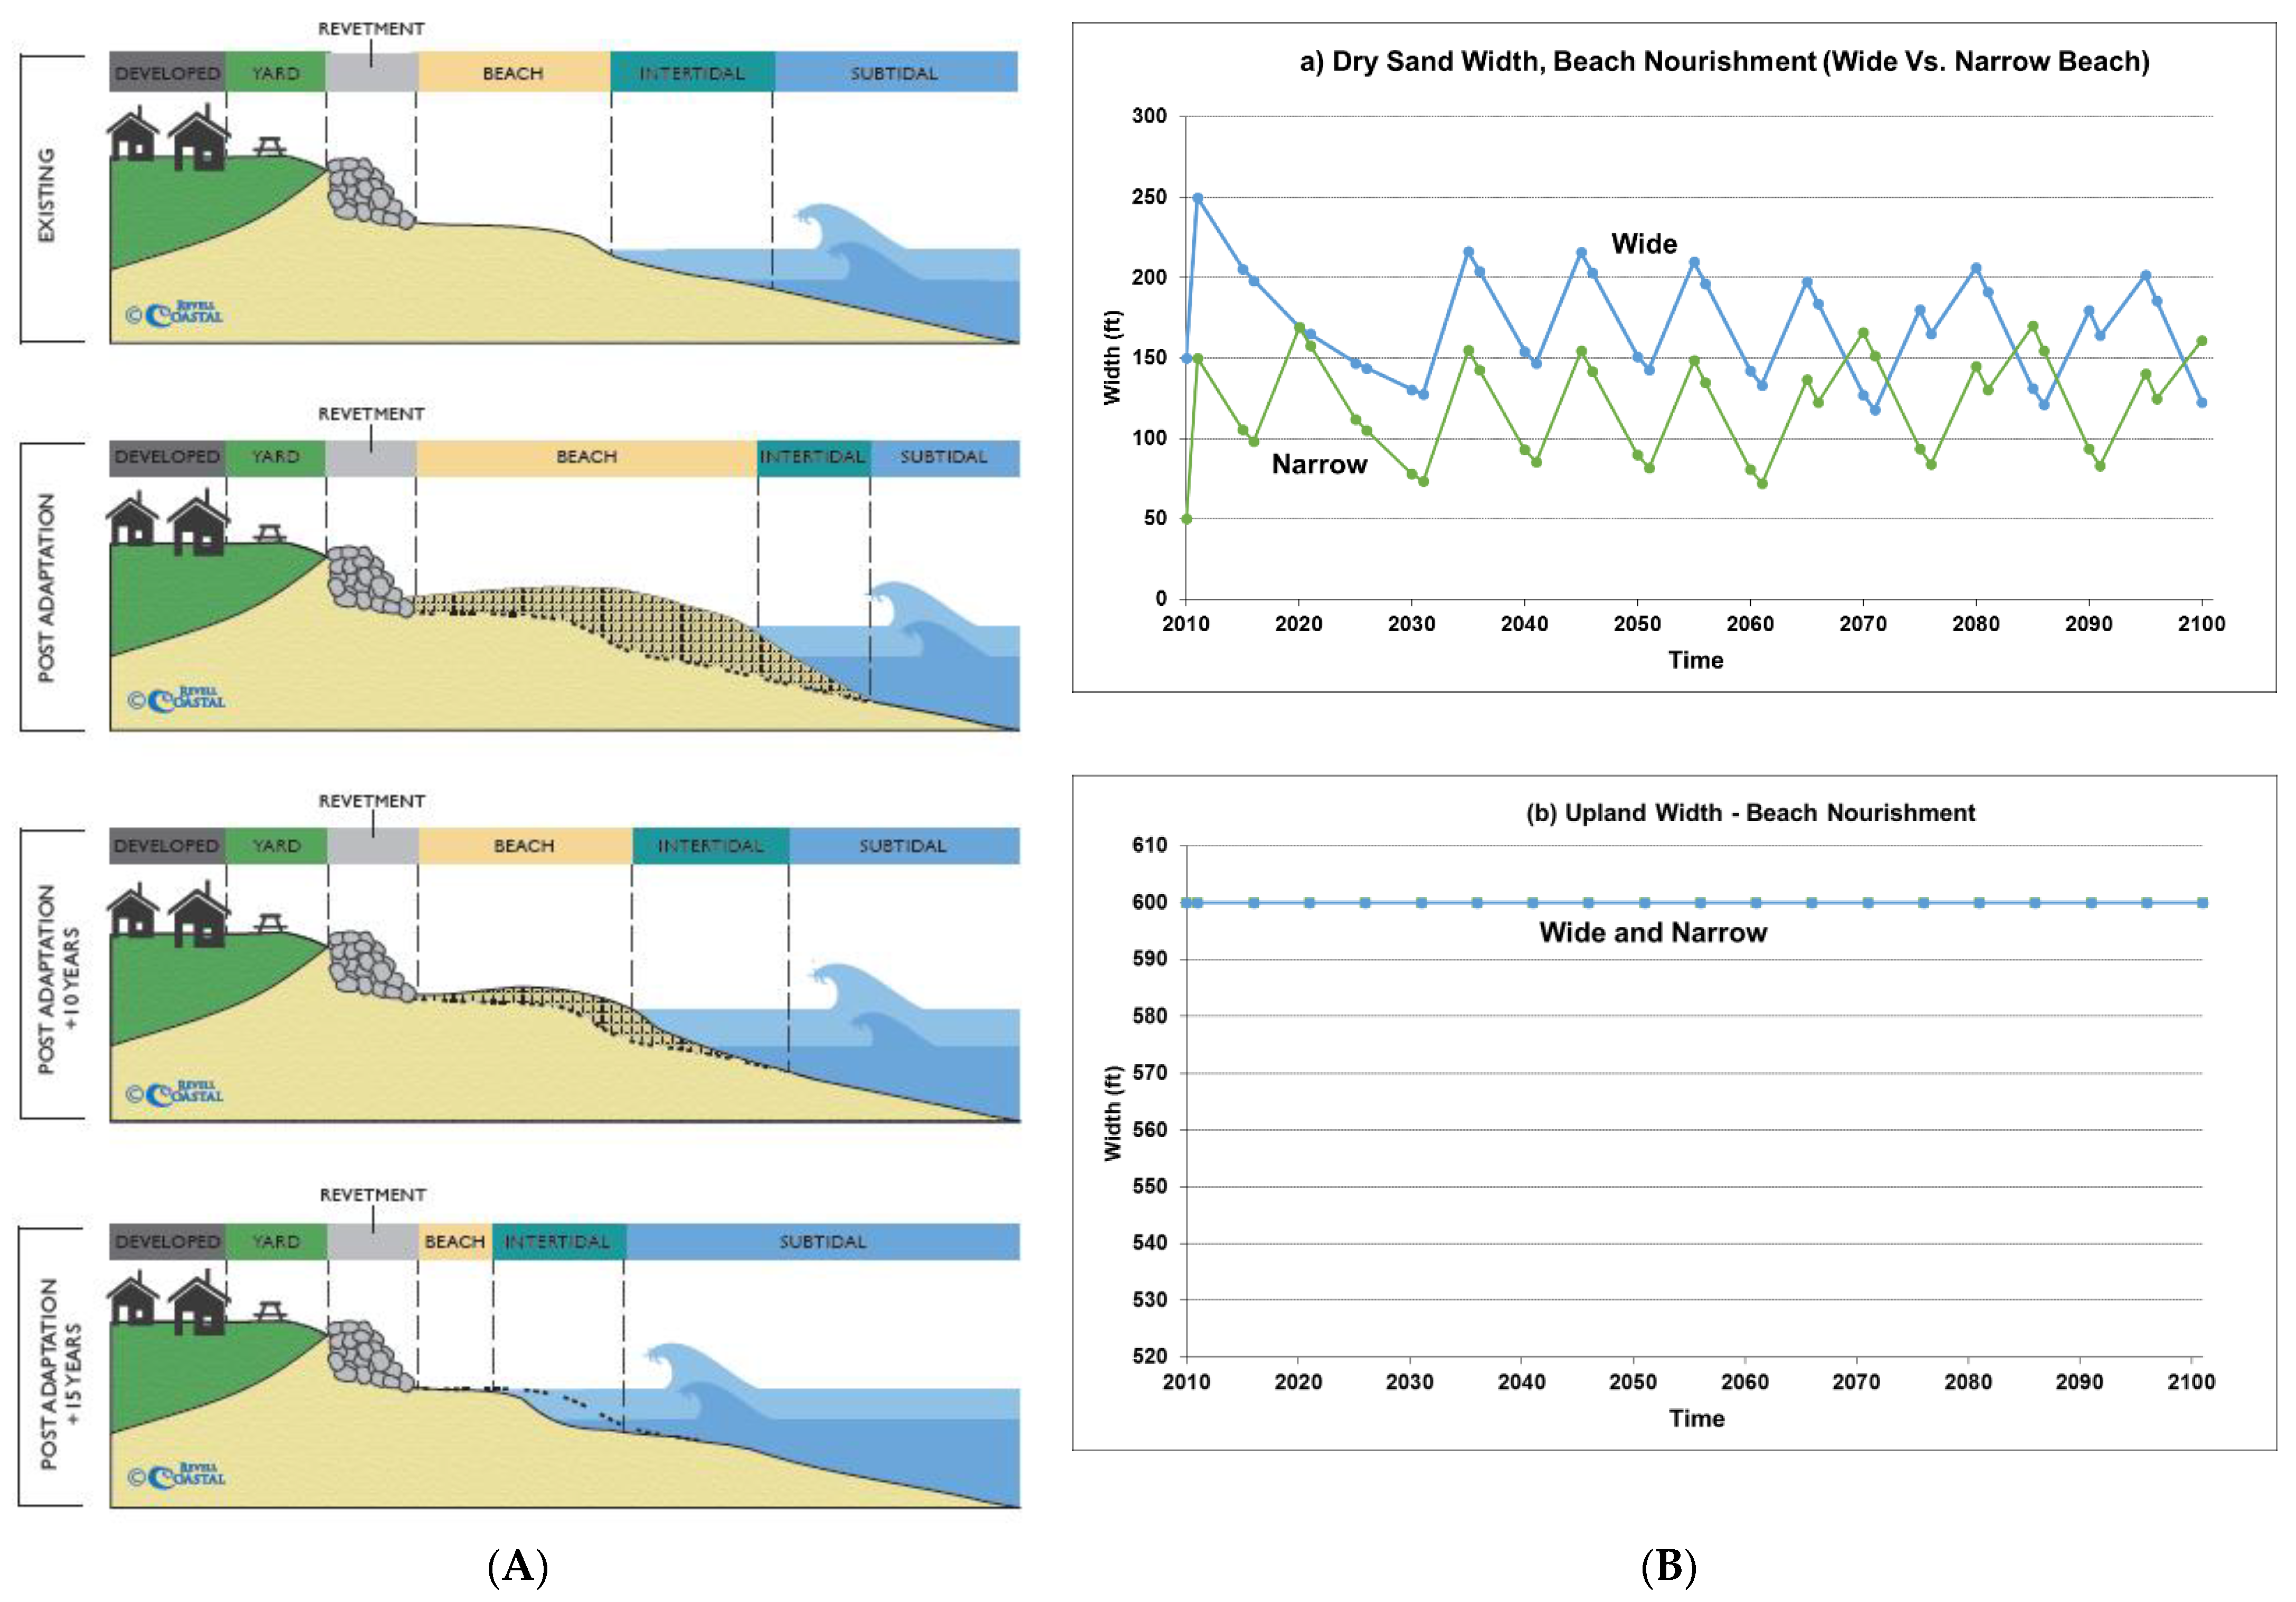
3.2.2. Beach Nourishment
Conceptual Upland and Beach Response Model
Economic and Ecological Considerations
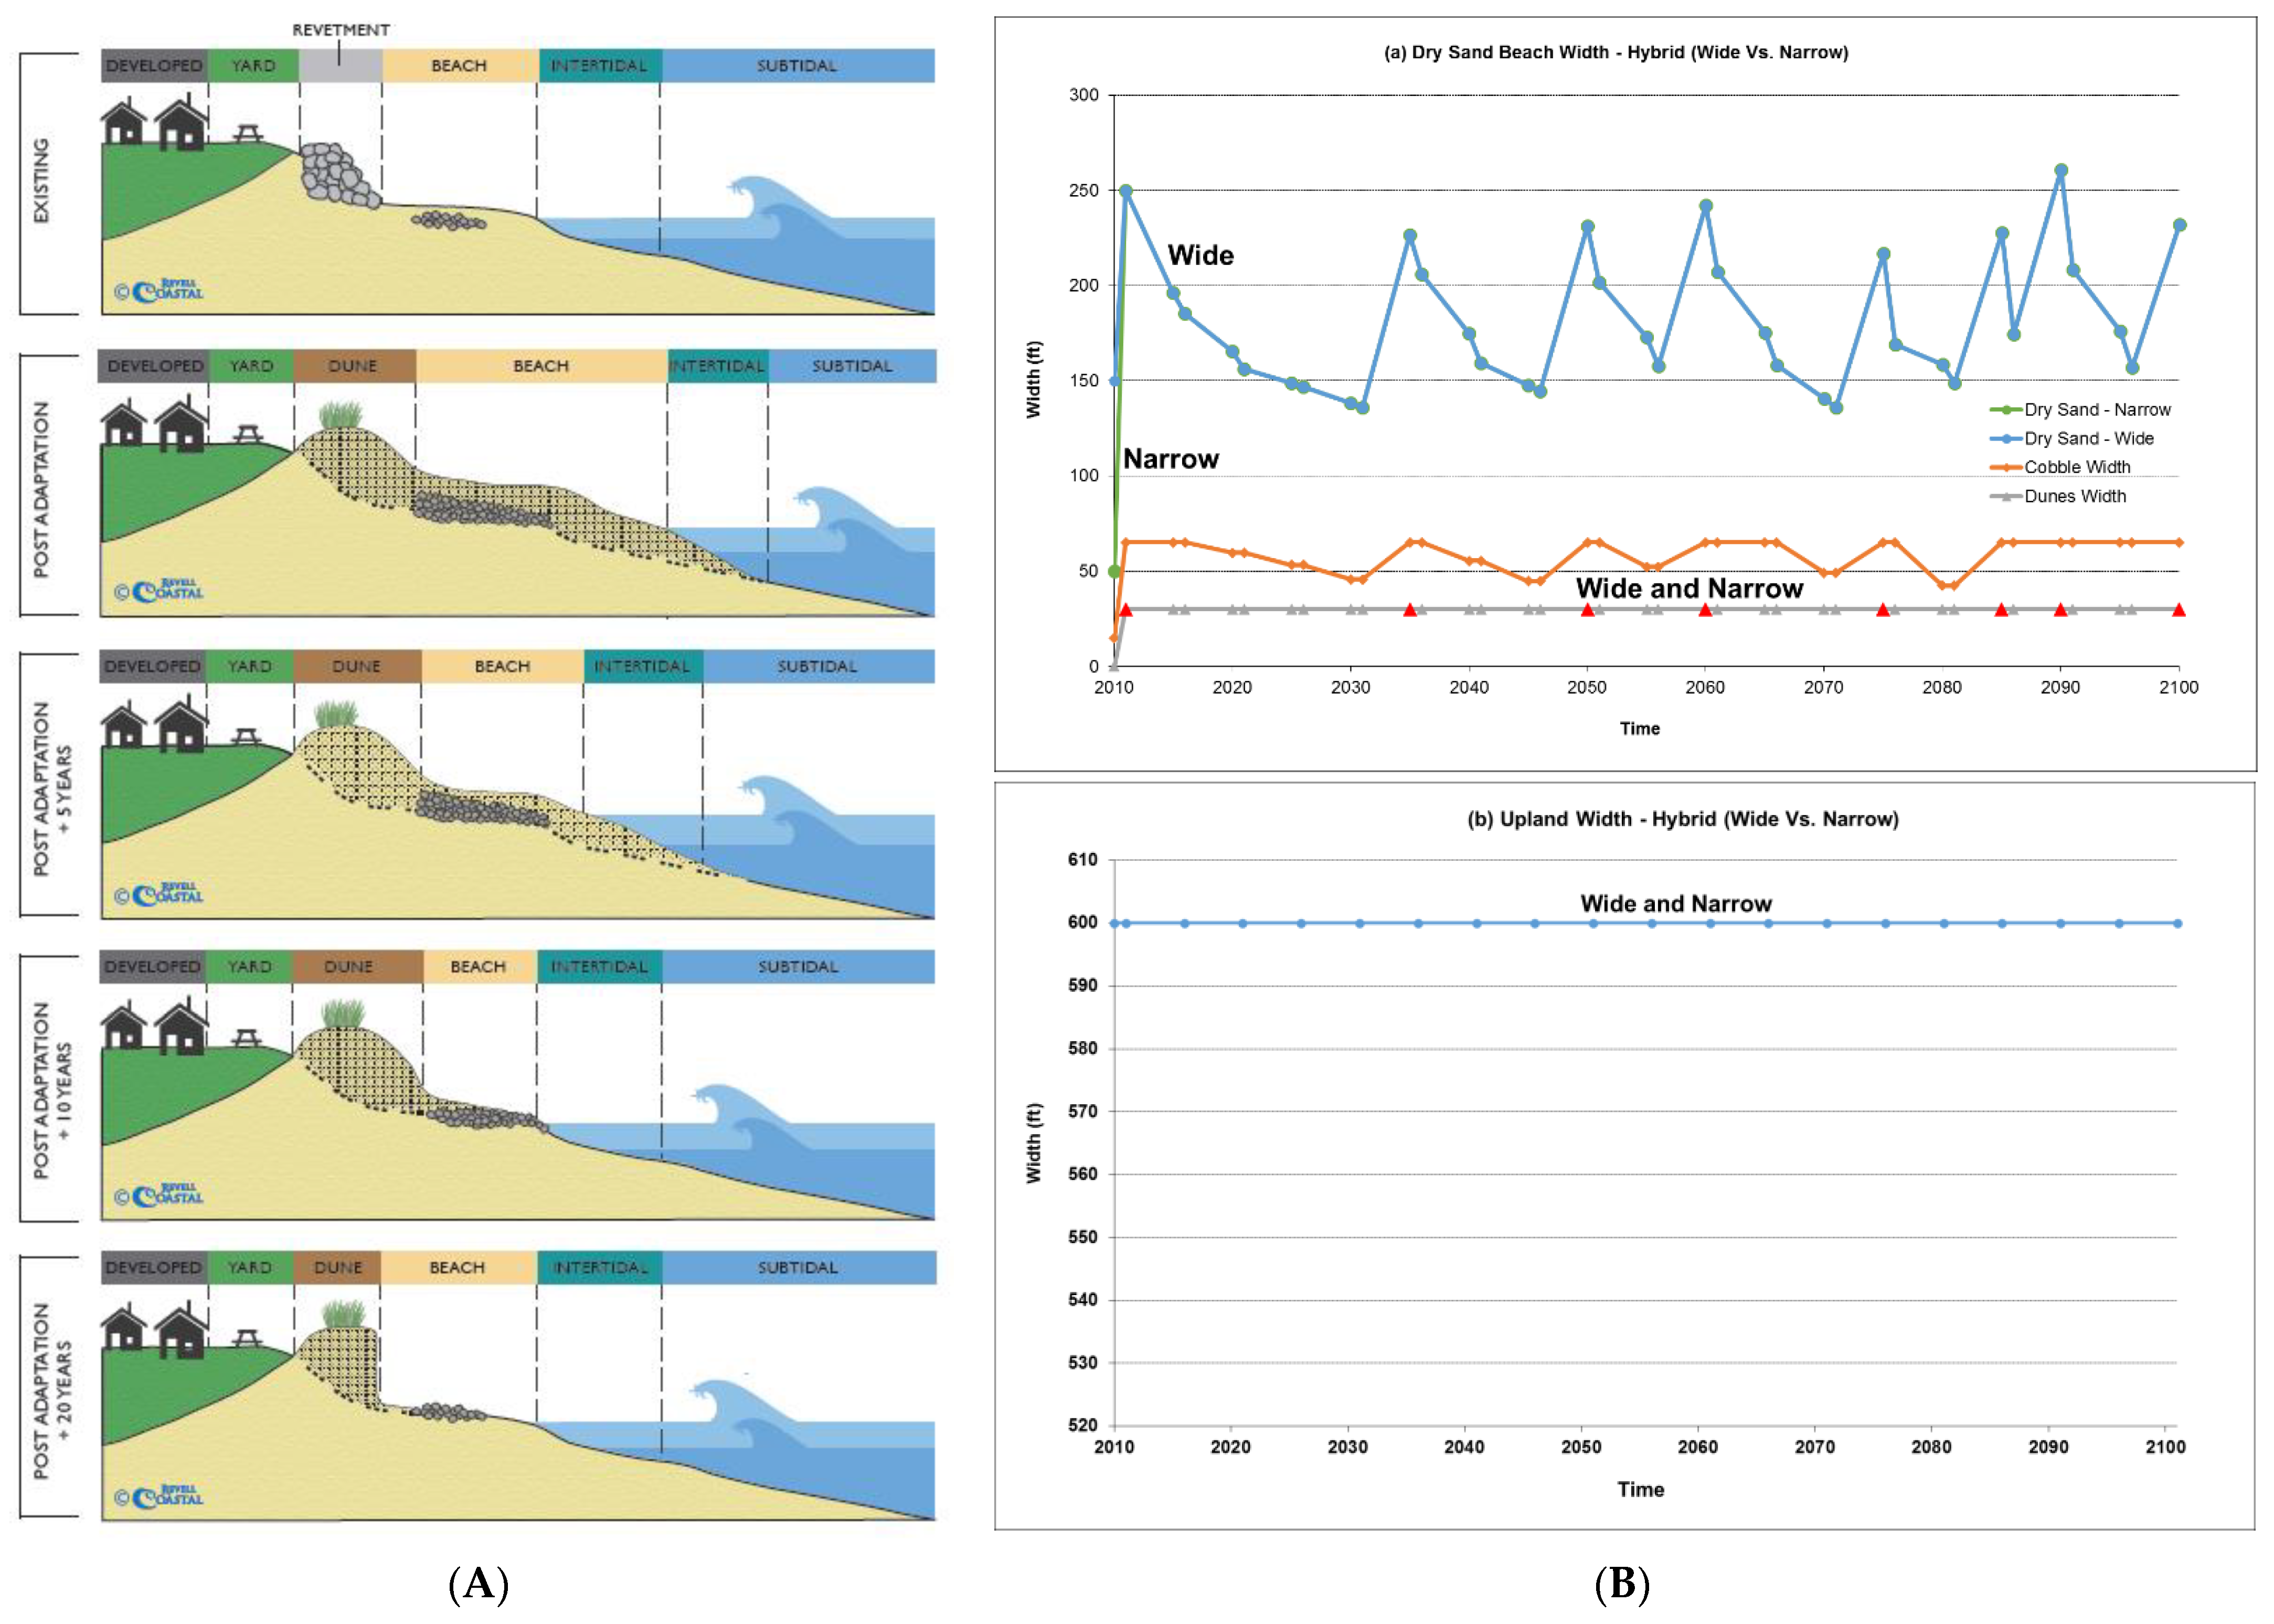
3.2.3. Living Shoreline Dune and Cobble Approach
Conceptual Upland and Beach Response Model
Economic and Ecological Considerations
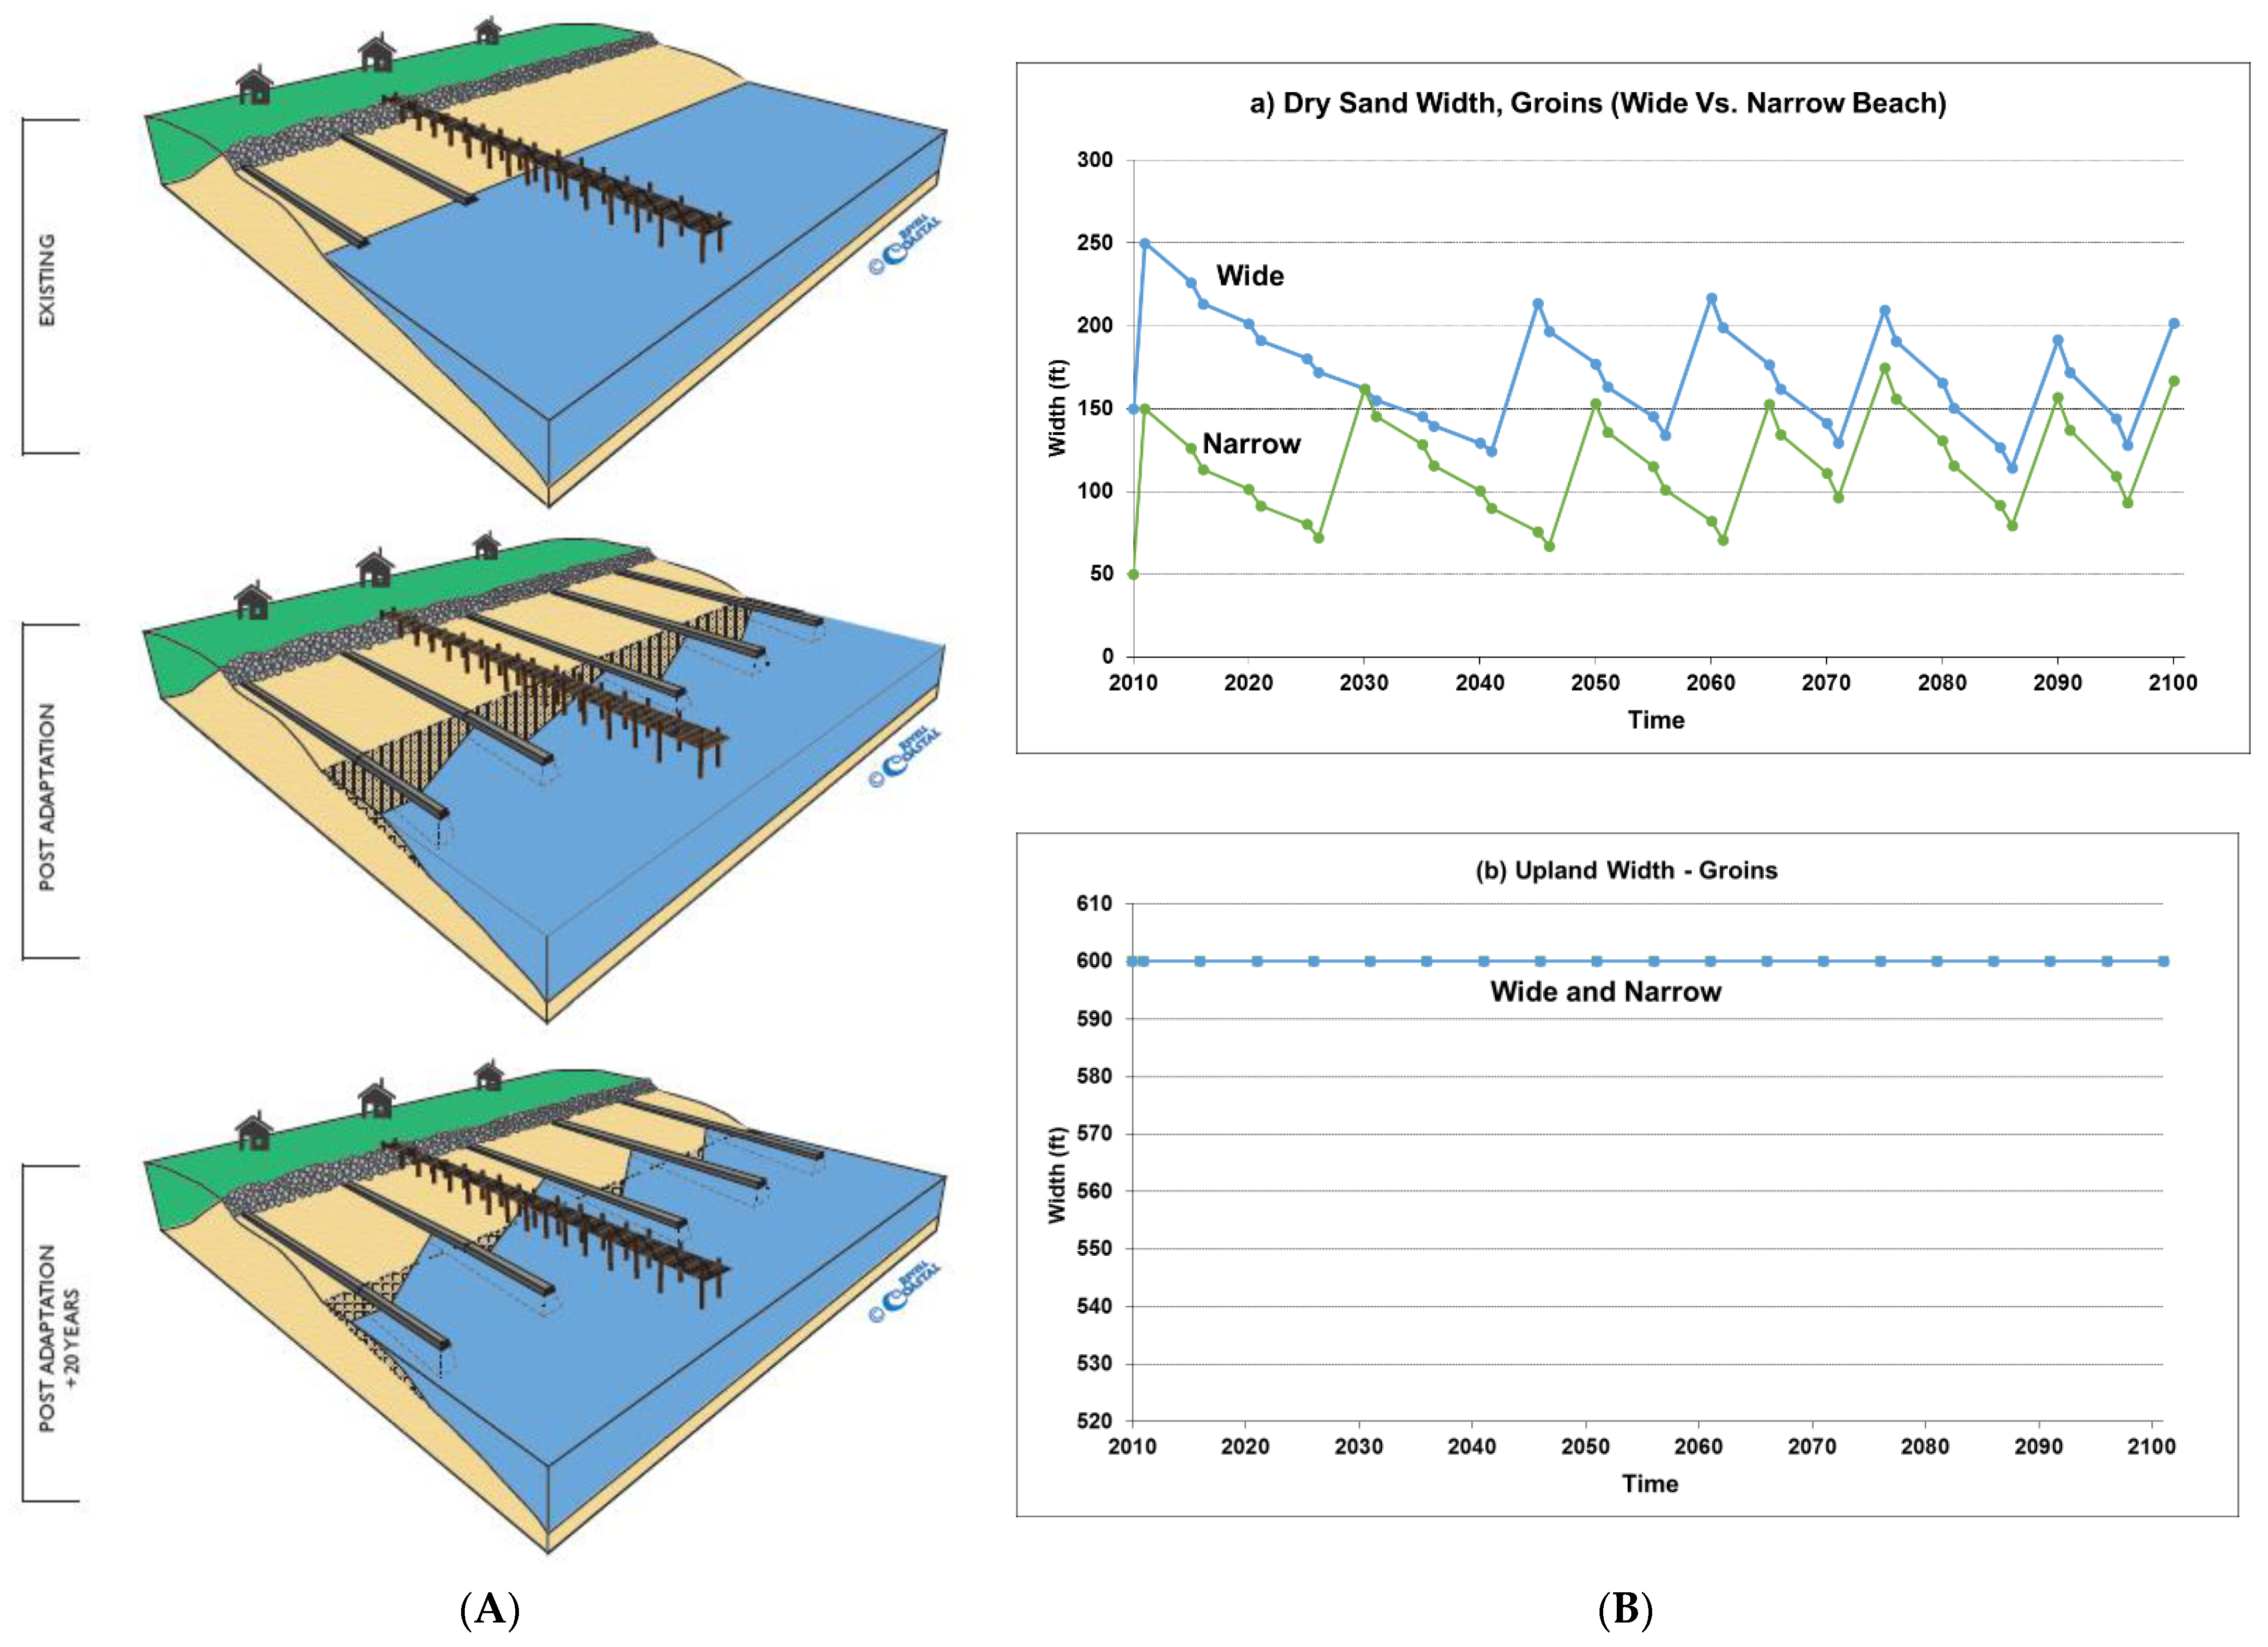
3.2.4. Five Groins with Sand Nourishment
Conceptual Upland and Beach Response Model
Economic and Ecological Considerations
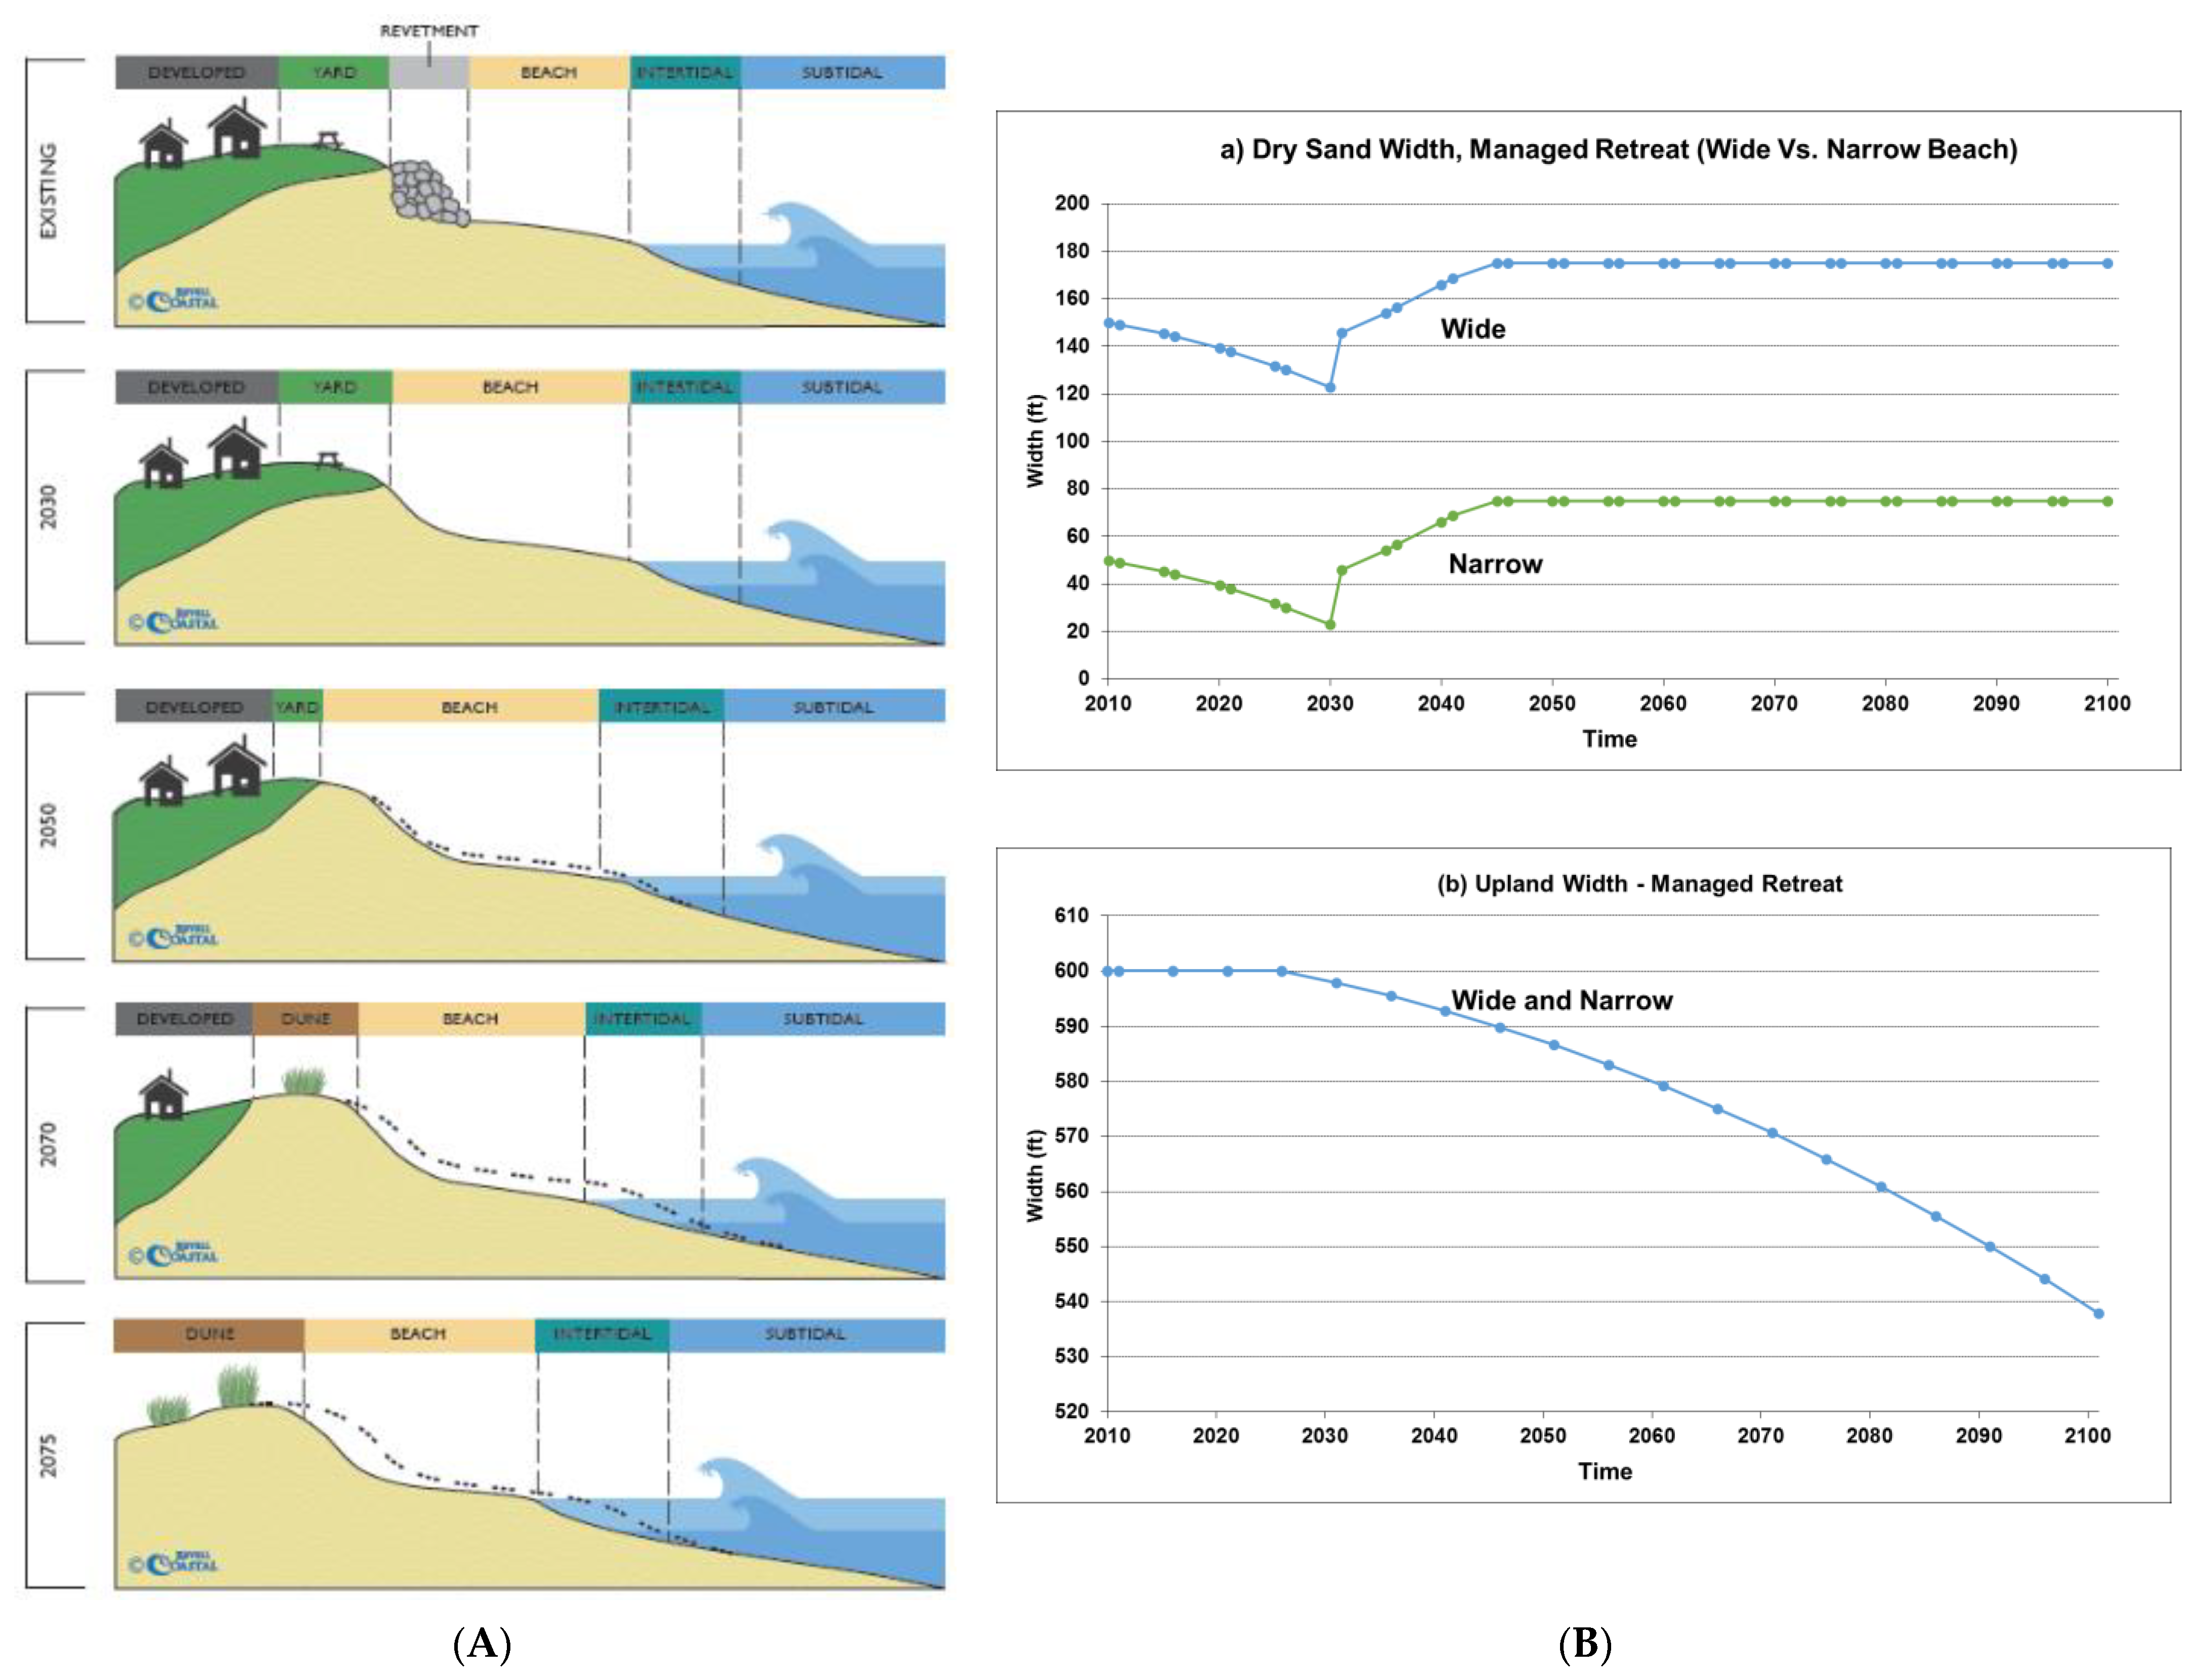
3.2.5. Managed Retreat
Conceptual Upland and Beach Response Model
Economic and Ecological Considerations
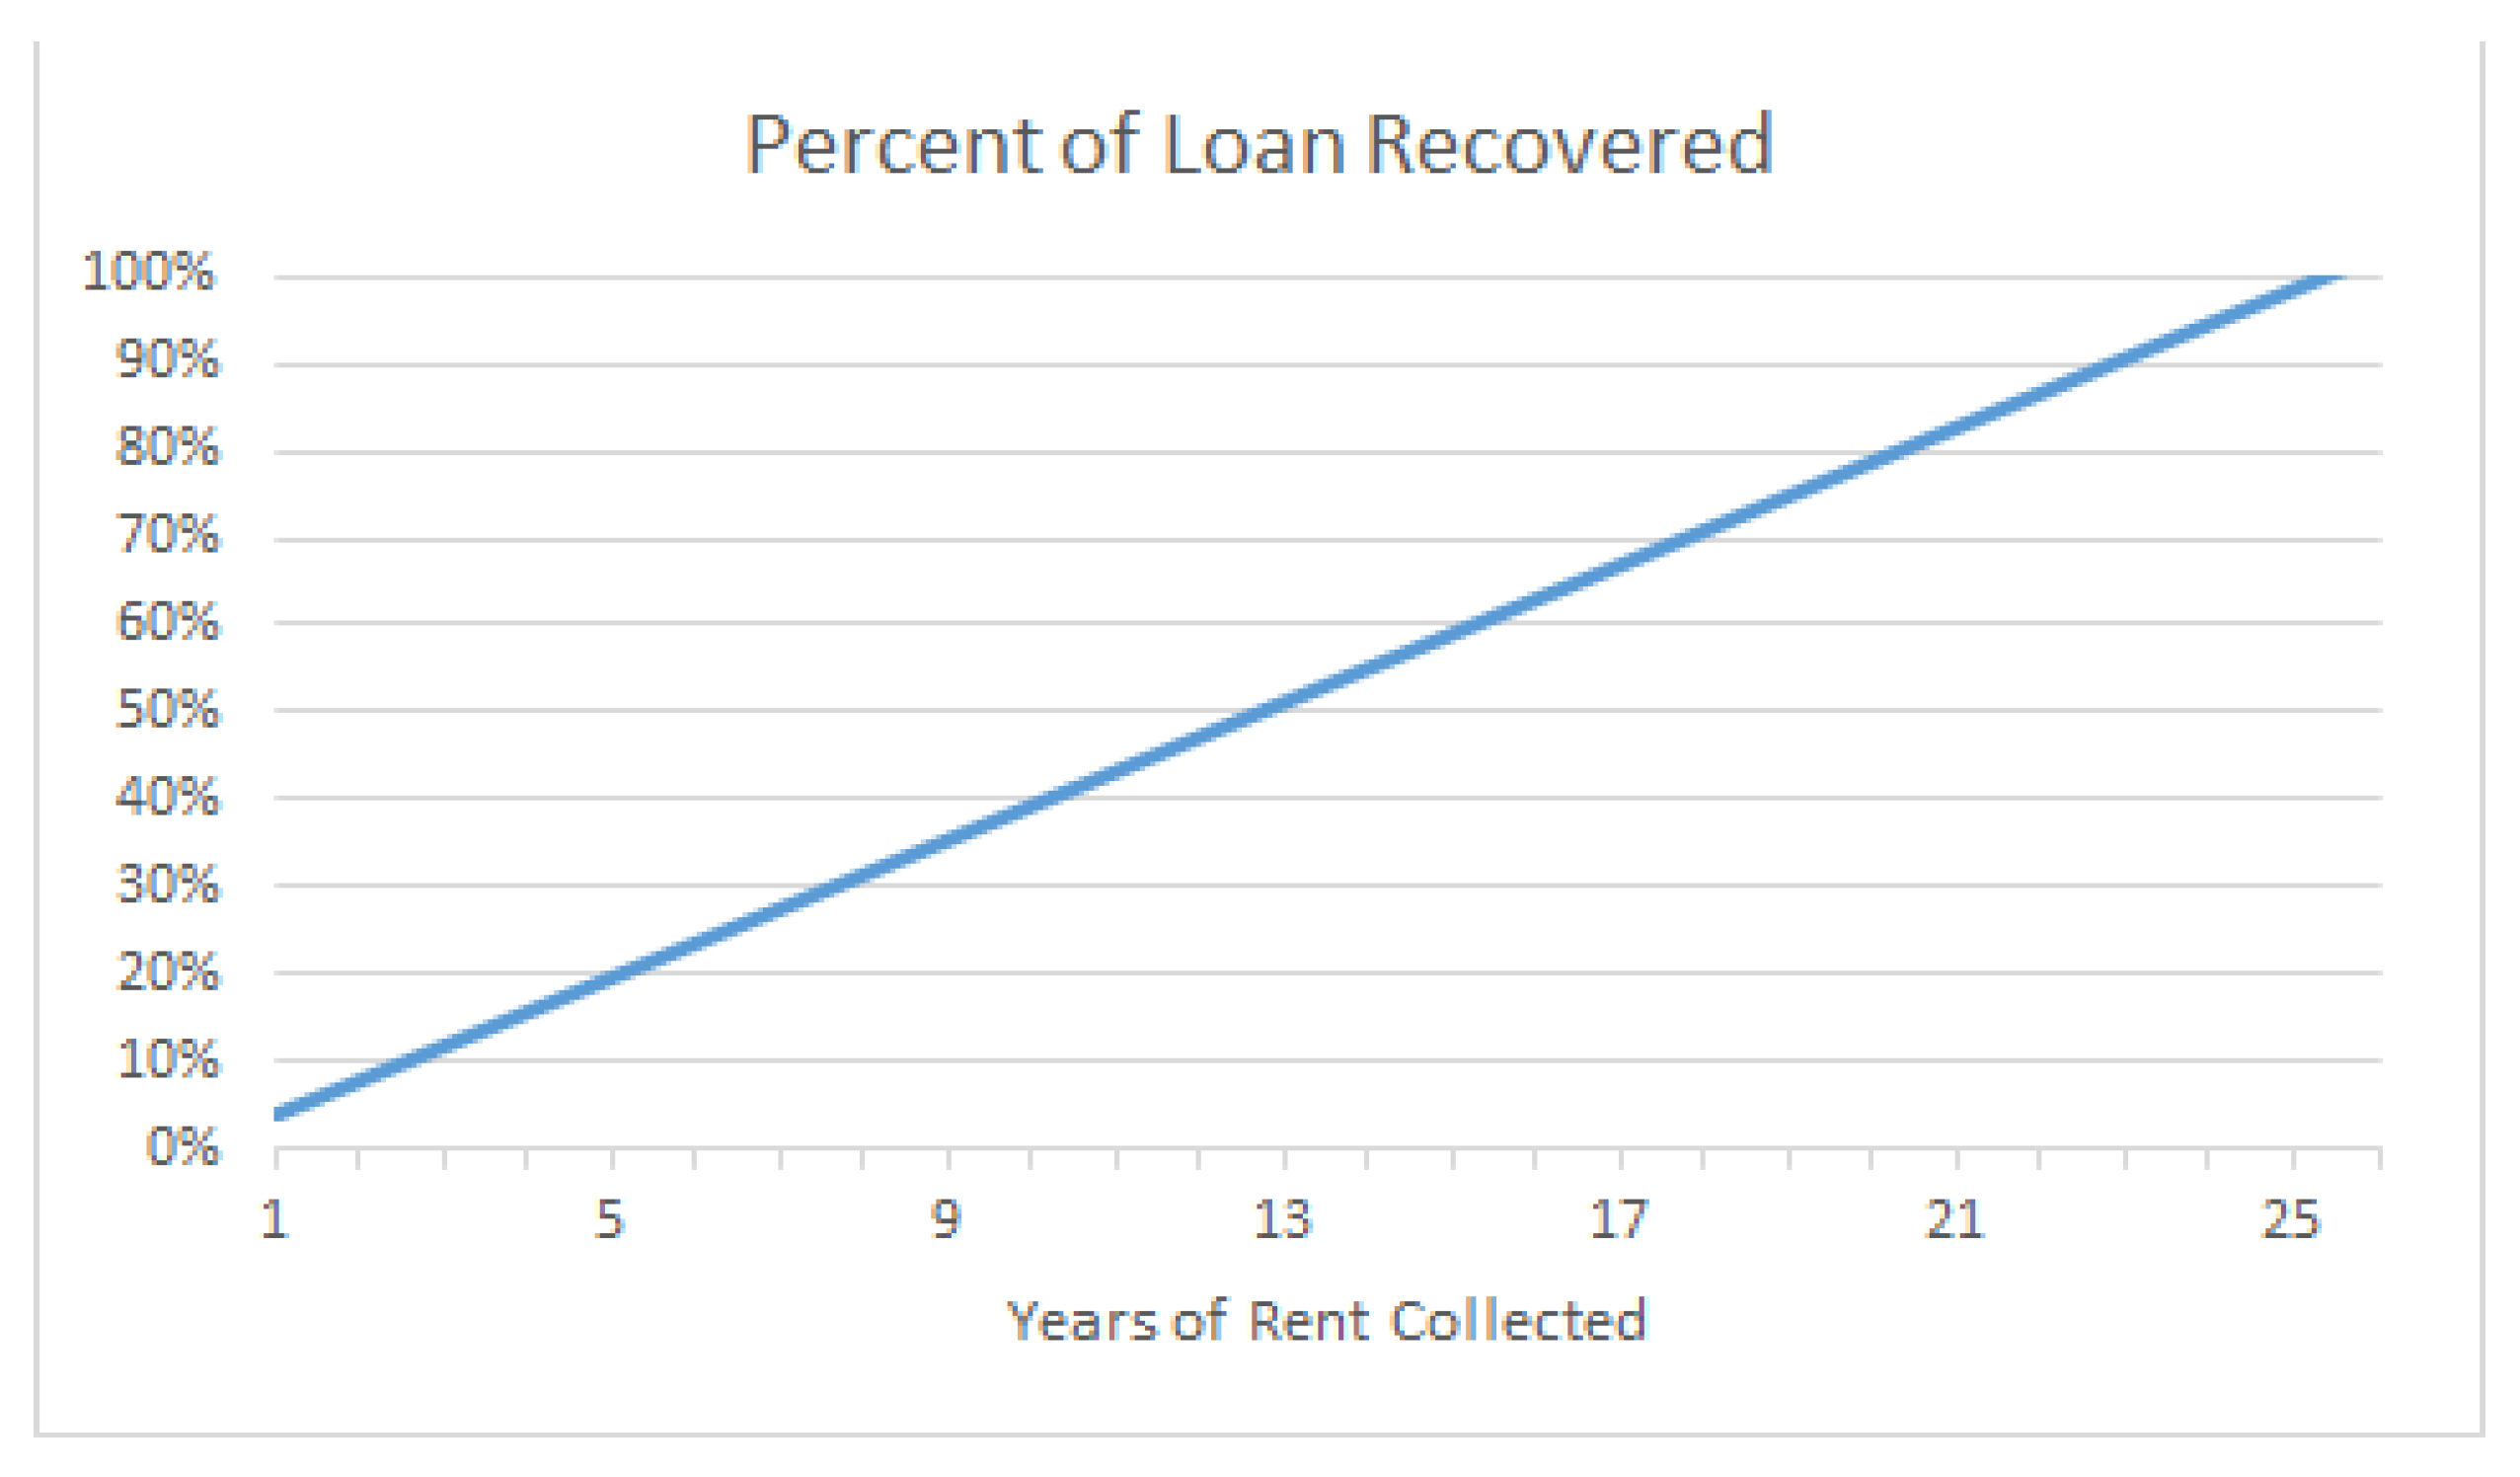
Alternative Policy Approach: Buyout with a Leaseback Option
3.3. Comparing Adaptation Strategies
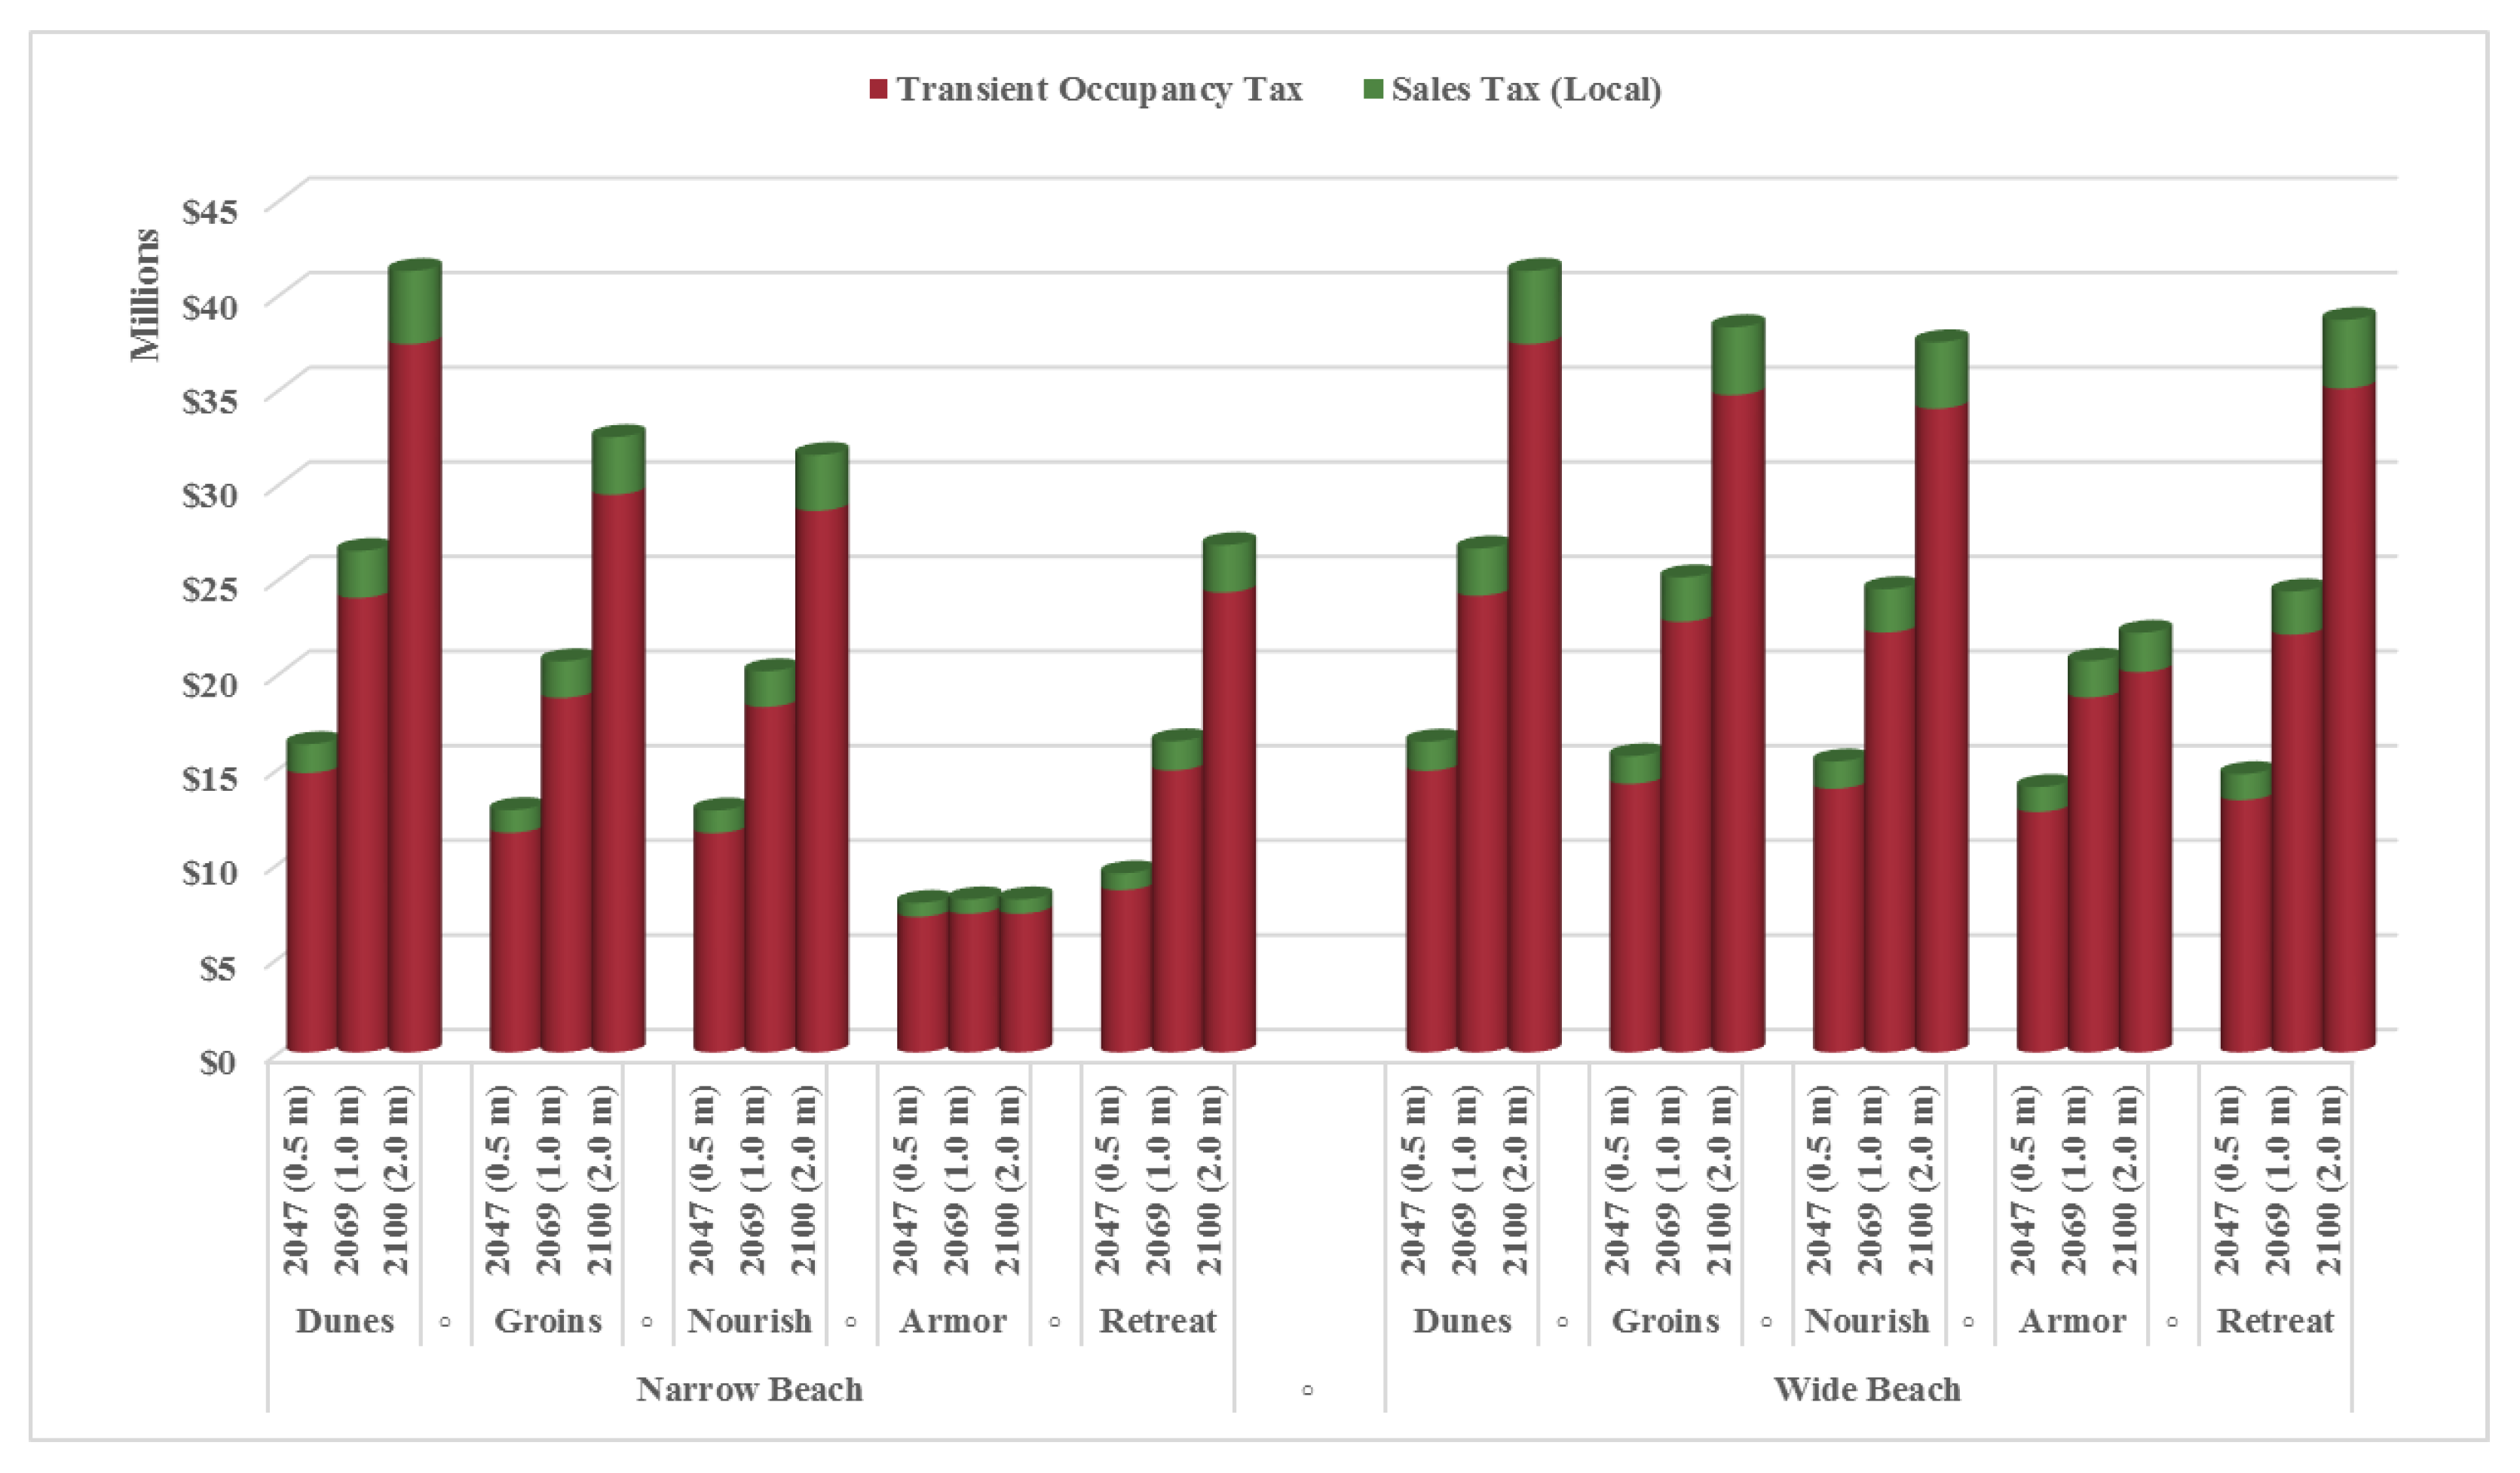
3.3.1. Economic and Fiscal Impacts
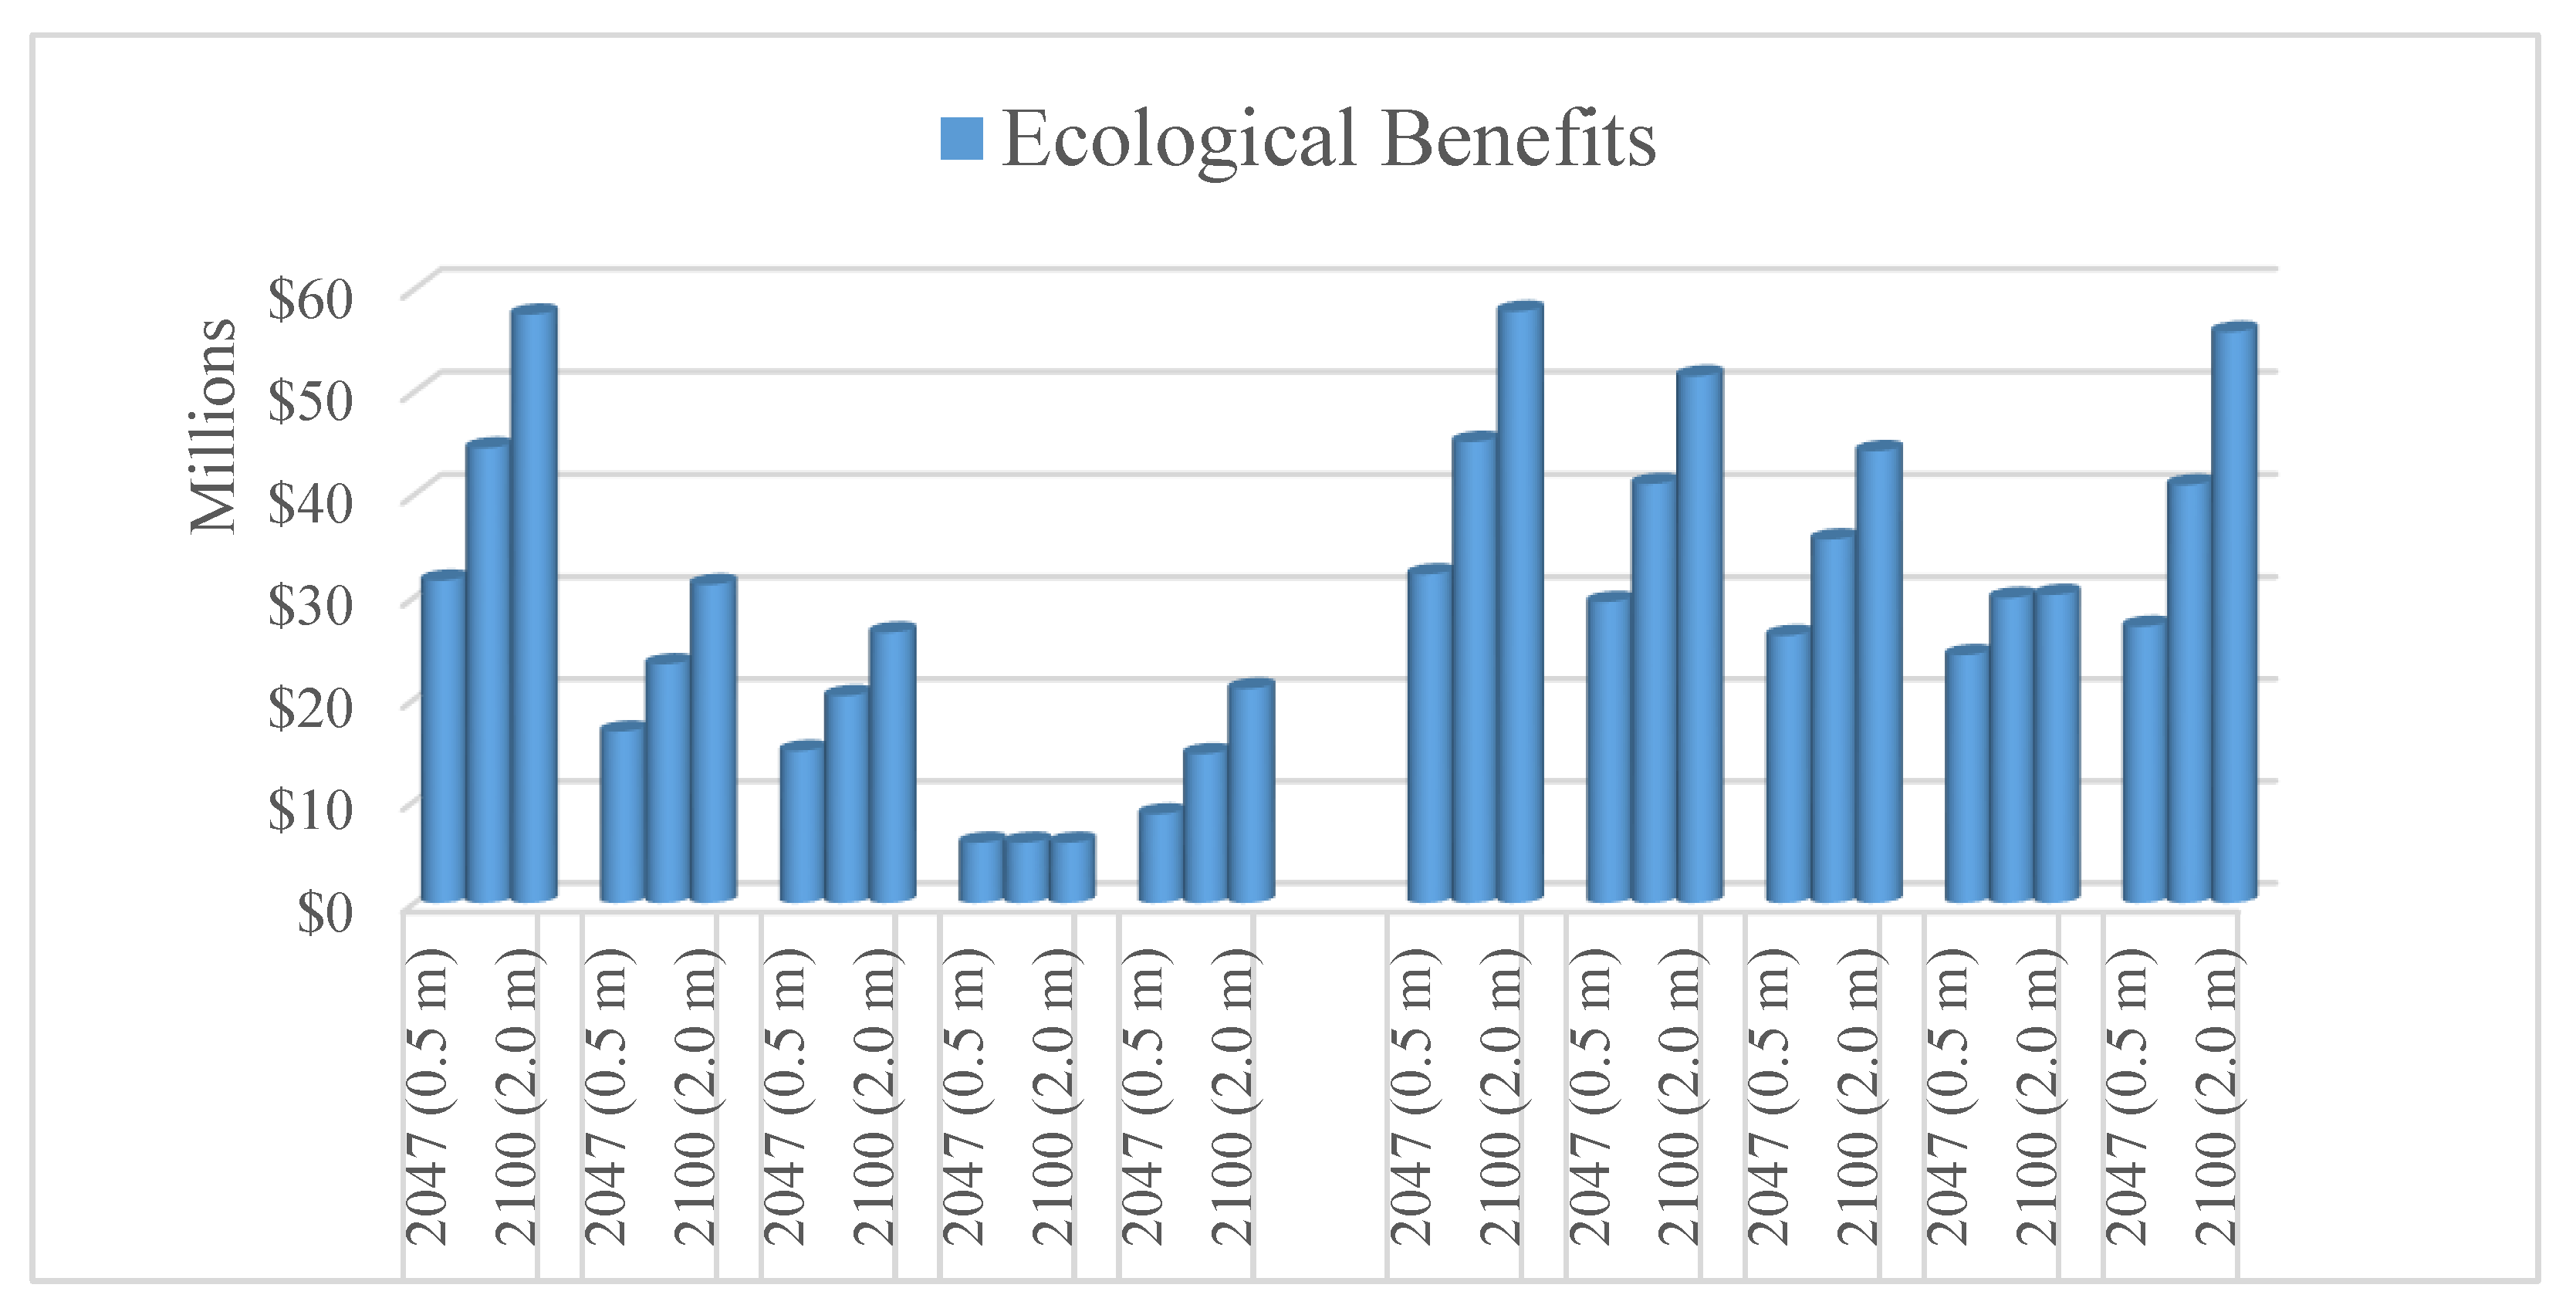
3.3.2. Ecology: Replacement Cost Approach
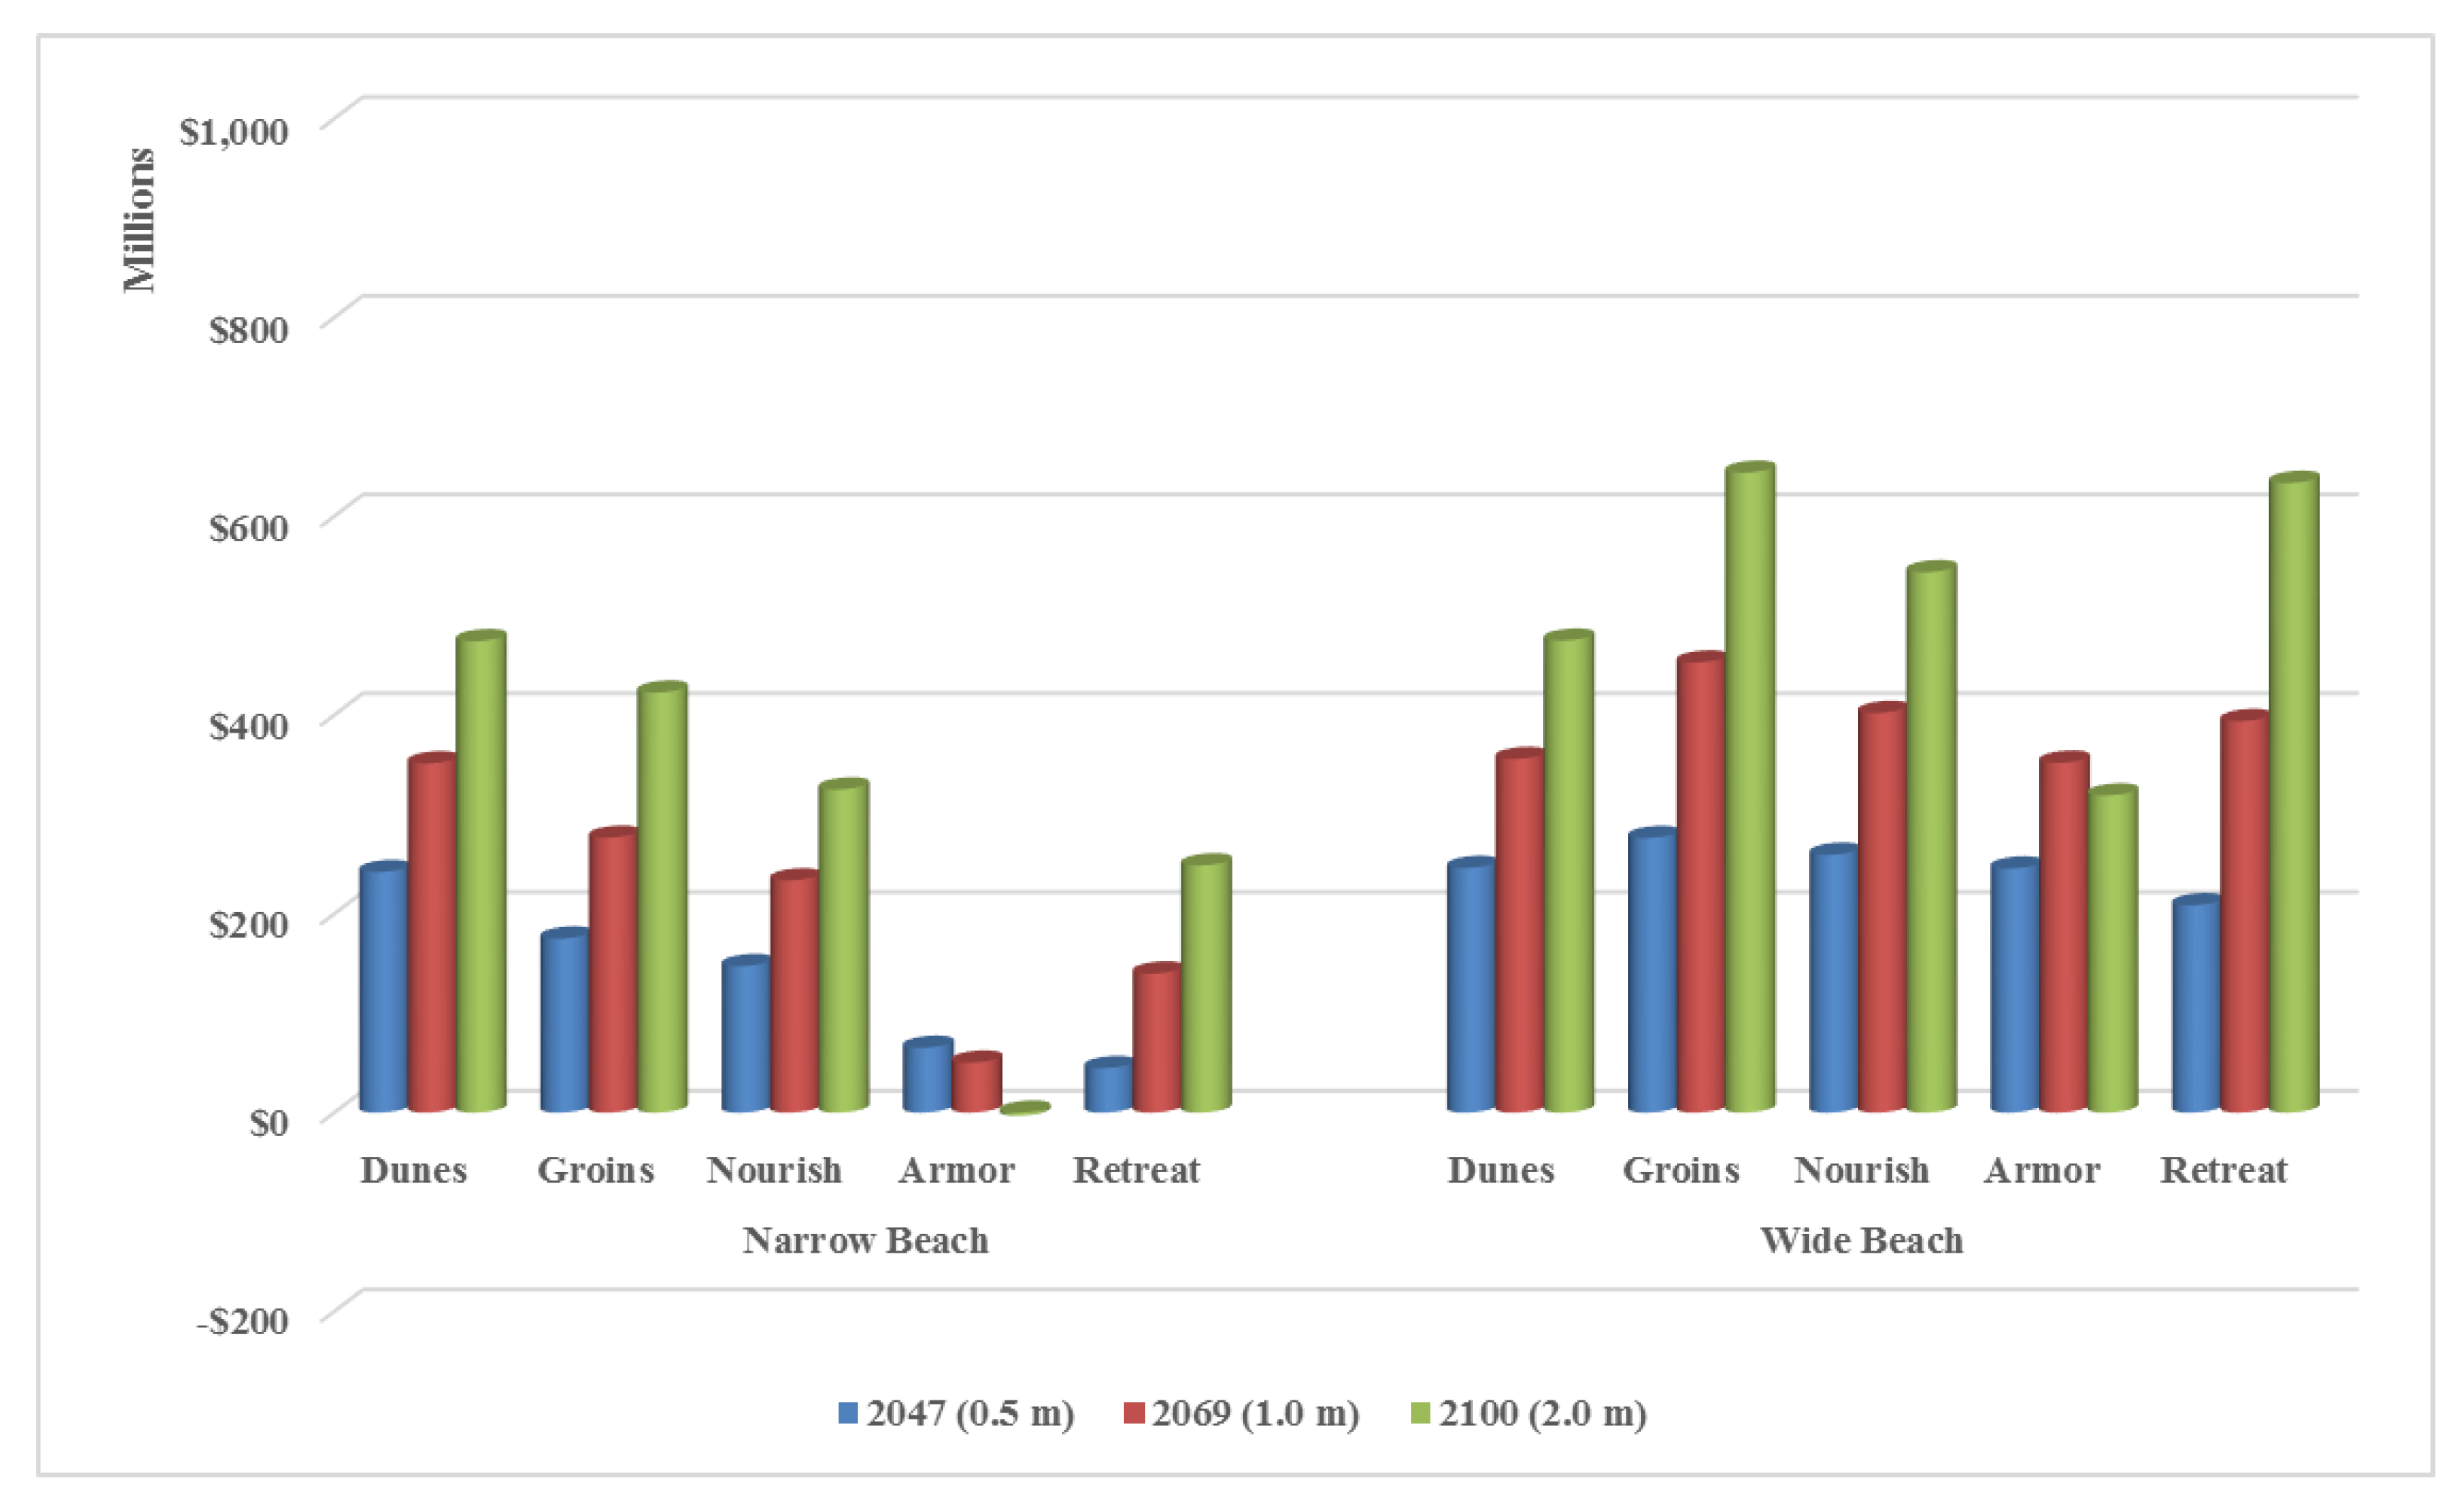
3.3.3. Net Benefits
4. Discussion
4.1. Improvements to the Physical Model
4.2. Improvements to the Economic Model
4.3. Applying This Approach to Adaptation Planning
5. Conclusions
Author Contributions
Funding
Institutional Review Board Statement
Informed Consent Statement
Data Availability Statement
Acknowledgments
Conflicts of Interest
References
- Barbier, E.B.; Hacker, S.D.; Kennedy, C.; Koch, E.W.; Stier, A.C.; Silliman, B.R. The value of estuarine and coastal ecosystem services. Ecol. Monogr. 2011, 81, 169–193. [Google Scholar] [CrossRef]
- California Coastal Commission. California Coastal Commission Sea Level Rise Policy Guidance: Interpretive Guidelines for Addressing Sea Level Rise in Local Coastal Programs and Coastal Development Permits. 2018. Available online: http://www.coastal.ca.gov/climate/slrguidance.html (accessed on 30 September 2018).
- Defeo, O.; McLachlan, A.; Schoeman, D.S.; Schlacher, T.A.; Dugan, J.; Jones, A.; Lastra, M.; Scapini, F. Threats to sandy beach ecosystems: A review. Estuar. Coast. Shelf Sci. 2009, 81, 1–12. [Google Scholar] [CrossRef]
- Dugan, J.E.; Hubbard, D.M. Sandy beach ecosystems. Chapter 20. In Ecosystems of California—A Source Book; Mooney, H., Zavaleta, E., Eds.; University of California Press: Berkeley, CA, USA, 2016. [Google Scholar]
- California Legislative Analyst’s Office (LAO). Preparing for Rising Seas: How the State Can Help Support Local Coastal Adaptation Efforts. 2019. Available online: https://lao.ca.gov/reports/2019/4121/coastal-adaptation-121019.pdf (accessed on 21 February 2020).
- Melius, M.L.; Caldwell, M.R. California Coastal Armoring Report: Managing Coastal Armoring and Climate Change Adaptation in the 21st Century. Environment and Natural Resources Law & Policy Program Working Paper. 2015. Available online: https://law.stanford.edu/publications/california-coastal-armoring-report-managing-coastal-armoring-and-climate-change-adaptation-in-the-21st-century/ (accessed on 6 February 2016).
- Arrow, K.J.; Cropper, M.L.; Gollier, C.; Groom, B.; Heal, G.M.; Newell, R.G.; Nordhaus, W.D.; Pindyck, R.S.; Pizer, W.A.; Portney, P.R.; et al. Should Governments Use a Declining Discount Rate in Project Analysis? Rev. Environ. Econ. Policy 2014, 8, 145–163. [Google Scholar] [CrossRef] [Green Version]
- King, P.; McGregor, A. Who’s counting: An analysis of beach attendance estimates and methodologies in southern California. Ocean Coast. Manag. 2012, 58, 17–25. [Google Scholar] [CrossRef]
- Federal Emergency Management Authority. Hazards U.S. Multi-Hazard (HAZUSMH). In: Computer Application and Digital Data Files on 2 CD-ROMs. Washington, DC. 2006. Available online: file:///C:/Users/MDPI/AppData/Local/Temp/fema_hazus_flood-model_technical-manual_2.1.pdf (accessed on 9 August 2015).
- Fu, X.; Song, J. Assessing the Economic Costs of Sea Level Rise and Benefits of Coastal Protection: A Spatiotemporal Approach. Sustainability 2017, 9, 1495. [Google Scholar] [CrossRef] [Green Version]
- Neumann, J.E.; A Emanuel, K.; Ravela, S.; Ludwig, L.; Kirshen, P.; Bosma, K.; Martinich, J. Joint effects of storm surge and sea-level rise on US Coasts: New economic estimates of impacts, adaptation, and benefits of mitigation policy. Clim. Chang. 2015, 129, 337–349. [Google Scholar] [CrossRef] [Green Version]
- Peng, B.; Song, J. A case study of preliminary cost-benefit analysis of building levees to mitigate the joint ef-fects of sea level rise and storm surge. Water 2018, 10, 169. [Google Scholar] [CrossRef] [Green Version]
- Reguero, B.G.; Beck, M.W.; Bresch, D.N.; Calil, J.; Meliane, I. Comparing the cost effectiveness of nature-based and coastal adaptation: A case study from the Gulf Coast of the United States. PLoS ONE 2018, 13, e0192132. [Google Scholar] [CrossRef] [Green Version]
- Tiggeloven, T.; de Moel, H.; Winsemius, H.C.; Eilander, D.; Erkens, G.; Gebremedhin, E.; Diaz Loaiza, A.; Kuzma, S.; Luo, T.; Iceland, C.; et al. Global-scale benefit–cost analysis of coastal flood adaptation to different flood risk drivers using structural measures. Nat. Hazards Earth Syst. Sci. 2020, 20, 1025–1044. [Google Scholar] [CrossRef] [Green Version]
- Liu, S.; Costanza, R.; Troy, A.; D’Aagostino, J.; Mates, W. Valuing New Jersey’s Ecosystem Services and Natural Capital: A Spatially Explicit Benefit Transfer Approach. Environ. Manag. 2010, 45, 1271–1285. [Google Scholar] [CrossRef]
- Georgetown Law Center. Helping Communities Prepare for Climate Change. 2021. Available online: https://www.georgetownclimate.org/adaptation/featured.html (accessed on 20 March 2021).
- King, P.G.; McGregor, A.R.; Whittet, J.D. Can California coastal managers plan for sea-level rise in a cost-effective way? J. Environ. Plan. Manag. 2015, 59, 1–22. [Google Scholar] [CrossRef]
- Dugan, J.E.; Hubbard, D.M.; Rodil, I.F.; Revell, D.L.; Schroeter, S. Ecological effects of coastal armoring on sandy beaches. Mar. Ecol. 2008, 29, 160–170. [Google Scholar] [CrossRef]
- Dugan, J.E.; Hubbard, D.M. Ecological responses to coastal armoring on exposed sandy beaches. Shore Beach 2006, 74, 10–16. [Google Scholar]
- California Department of Finance. Report P-1 (Total Population): State and County Population Projections, 2010–2060. 2014. Available online: https://sdcclearinghouse.com/2017/03/18/california-population-projections-2010-2060/ (accessed on 21 February 2015).
- California Economic Forecast. California County Level Economic Forecast 2014–2040. Prepared for the California Department of Transportation. 2014. Available online: http://www.californiaforecast.com (accessed on 21 February 2015).
- Revell Coastal. City of Imperial Beach-Final Sea Level Rise Assessment. 2016. Available online: https://www.imperialbeachca.gov/vertical/sites/%7BF99967EB-BF87-4CB2-BCD5-42DA3F739CA1%7D/uploads/Imperial_Beach_Sea_Level_Rise_Assessment_(FINAL_2016)(1).pdf (accessed on 20 April 2019).
- California State Board of Equalization (CABOE). California Constitution: Article 13A [Tax Limitation]. 1978. Available online: file:///C:/Users/MDPI/AppData/Local/Temp/CaliforniaStateConstitutionArticle13ASection1.pdf (accessed on 21 February 2015).
- City of Imperial Beach Public Works Department, Shoreline Protection Device Inventory and Evaluation for Imperial Beach, California. Final Report. Everest Coast. 2001, in press.
- Fan, W.; McGuire, J.J.; De Groot-Hedlin, C.D.; Hedlin, M.A.H.; Coats, S.; Fiedler, J.W. Stormquakes. Geophys. Res. Lett. 2019, 46, 12909–12918. [Google Scholar] [CrossRef]
- U.S. Army Corps of Engineers. State of the Coast Report, San Diego Region, Final, Coast of California Storm and Tidal Wave Study. U.S. Army Corps of Engineers, Los Angeles District, Los Angeles, CA. 1991. Available online: https://digital.library.unt.edu/ark:/67531/metadc714915/ (accessed on 15 May 2015).
- U.S. Army Corps of Engineers. Beach Erosion Control Report on Cooperative Study of San Diego County, California, Appendix IV, Phase 2. U.S. Army Engineer District Los Angeles, CA, Contract No. W-04–193–Eng. 5196, (with Appendices). 1960. Available online: https://www.google.com/url?sa=t&rct=j&q=&esrc=s&source=web&cd=&ved=2ahUKEwig2Pizvr3wAhWGHzQIHf6vBUUQFjAGegQICRAD&url=https%3A%2F%2Fapps.dtic.mil%2Fdtic%2Ftr%2Ffulltext%2Fu2%2Fa171534.pdf&usg=AOvVaw0yDFaf0pvy3Gan8uyxlSSW (accessed on 20 April 2015).
- Gallien, T. Validated coastal flood modeling at Imperial Beach, California: Comparing total water level, empirical and numerical overtopping methodologies. Coast. Eng. 2016, 111, 95–104. [Google Scholar] [CrossRef] [Green Version]
- SANDAG. Revised Environmental Assessment/Final Environmental Impact Report for the San Diego Regional Beach Sand Project II. Tech. Rep, State Clearinghouse Number, 2010051063. 2011. Available online: http://www.sandag.org/uploads/projectid/projectid_358_14427.pdf (accessed on 3 April 2015).
- Weitzman, M.L. Gamma Discounting. Am. Econ. Rev. 2001, 91, 260–271. [Google Scholar] [CrossRef]
- Intergovernmental Panel on Climate Change. Summary for Policymakers. In IPCC Special Report on the Ocean and Cryosphere in a Changing Climate; Pörtner, H.O., Roberts, D.C., Masson-Delmotte, V., Zhai, P., Tignor, M., Poloczanska, E., Mintenbeck, K., Nicolai, M., Okem, A., Petzold, J., et al., Eds.; IPCC: Geneva, Switzerland, 2019. [Google Scholar]
- Ocean Protection Council (OPC). State of California Sea-Level Rise Guidance 2018 Update. 2018. Available online: https://cawaterlibrary.net/document/state-of-california-sea-level-rise-guidance-2018-update/ (accessed on 20 April 2021).
- Barnard, P.L.; O’Reilly, B.; Van Ormondt, M.; Elias, E.; Ruggiero, P.; Erikson, L.H.; Hapke, C.; Collins, B.D.; Guza, R.T.; Adams, P.N.; et al. The Framework of a Coastal Hazards Model—A Tool for Predicting the Impact of Severe Storms; US Geological Survey, 2009; p. 21. Available online: https://www.researchgate.net/publication/255638309_The_Framework_of_a_Coastal_Hazards_Model-A_Tool_for_Predicting_the_Impact_of_Severe_Storms (accessed on 20 April 2021).
- O’Neill, A.C.; Erikson, L.H.; Barnard, P.L.; Limber, P.W.; Vitousek, S.; Warrick, J.A.; Foxgrover, A.C.; Lovering, J. Projected 21st Century Coastal Flooding in the Southern California Bight. Part 1: Development of the Third Generation CoSMoS Model. J. Mar. Sci. Eng. 2018, 6, 59. [Google Scholar] [CrossRef] [Green Version]
- Chadwick, B.; Wang, P.F.; Brand, M.; Flick, R.; Young, A.; O’Reilly, W.; Bromirski, P.; Crampton, W.; Guza, R.; Helly, J.; et al. Impacts of Sea Level Rise on Coastal Military Installations in the Southwestern United States. Final report to Department of Defense (RC-1703). 2014. Available online: https://serdp-estcp.org/Program-Areas/Resource-Conservation-and-Resiliency/Infrastructure-Resiliency/Vulnerability-and-Impact-Assessment/RC-1703/RC-1703/ (accessed on 17 March 2015).
- King, P.; Giliam, J. The Economics Benefits and Impacts of SANDAG’s Regional Nourishment Project; Prepared for California State Parks, Unpublished Agency Report; in press.
- Ehlers, R. What Threat Does Sea-Level Rise Pose to California? California Legislative Analyst’s Office Report. 10 August 2019. Available online: https://lao.ca.gov/Publications/Report/4261 (accessed on 6 February 2020).
- Ludka, B.; Guza, R.; O’Reilly, W. Nourishment evolution and impacts at four southern California beaches: A sand volume analysis. Coast. Eng. 2018, 136, 96–105. [Google Scholar] [CrossRef]
- Dietz, S.; Stern, N. Note—On the Timing of Greenhouse Gas Emissions Reductions: A Final Rejoinder to the Symposium on the Economics of Climate Change: The Stern Review and its Critics. Rev. Environ. Econ. Policy 2009, 3, 138–140. [Google Scholar] [CrossRef]
- Thieler, E.R.; Himmelstoss, E.A.; Zichichi, J.L.; Ergul, A. The Digital Shoreline Analysis System (DSAS) Version 4.0—An ArcGIS extension for calculating shoreline change. Open-File Report. 2009. Available online: https://pubs.er.usgs.gov/publication/ofr20081278 (accessed on 6 February 2020).
- Federal Reserve Bank of St. Louis Economic Data (FRED). Available online: https://fred.stlouisfed.org/series/SDXRSA (accessed on 21 March 2021).
- Zillow. Housing Data Research. Available online: https://www.zillow.com/research/data/ (accessed on 21 February 2015).
- Kriebel, D.; Tickner, J.; Epstein, P.; Lemons, J.; Levins, R.; Loechler, E.L.; Quinn, M.; Rudel, R.; Schettler, T.; Stoto, M. The precautionary principle in environmental science. Environ. Health Perspect. 2001, 109, 871–876. [Google Scholar] [CrossRef]
- Hilger, J.; Hanemann, M. The Impact of Water Quality on Southern California Beach Recreation: A Finite Mixture Model Approach; Working Paper Series; Department of Agricultural & Re-source Economics, University of California: Berkeley, CA, USA, 2008. [Google Scholar]
- Ventura County. VC Resilient Coastal Adaptation Project: Sea Level Rise Adaptation Strategies. 30 August 2019. Available online: https://docs.vcrma.org/images/pdf/planning/programs/vcrcap/adaptation_report_final.pdf (accessed on 6 March 2021).
- Arrow, K.J.; Cropper, M.L.; Eads, G.C.; Hahn, R.W.; Lave, L.B.; Noll, R.G.; Portney, P.R.; Russell, M.; Schmalensee, R.; Smith, K.; et al. Benefit-Cost Analysis in Environmental, Health, and Safety Regulation; American Enterprise Institute: Washington, DC, USA, 1996; pp. 1–17. [Google Scholar]
- King, P.G.; Nelsen, C.; Dugan, J.; Hubbard, D.; Martin, K.; Battalio, R. Valuing beach ecosystems in an age of retreat. Shore Beach 2018, 86, 45–59. [Google Scholar]
- Raheem, N.; Lopez, R.D.; Talberth, J. The Economic value of coastal ecosystems in California; U.S. Environmental Protection Agency, Office of Research and Development: Washington, DC, USA, 2009.
- U.S. Environmental Protection Agency, Section 404 of the Clean Air Act. Available online: https://www.epa.gov/cwa-404/mitigation-banks-under-cwa-section-404 (accessed on 21 February 2015).
- American Enterprise Institute. Land Price and Land Share Indicators. 2021. Available online: https://www.aei.org/housing/land-price-indicators/ (accessed on 6 March 2021).
- Refugio Beach Oil Spill Trustees. Refugio Beach Oil Spill Draft Damage Assessment and Restoration Plan/Environmental Assessment. Prepared by the California Department of Fish and Wildlife, California State Lands Commission, California Depart-ment of Parks and Recreation, Regents of the University of California, U.S. Department of the Interior, U.S. Fish and Wildlife Ser-vice, and National Oceanic and Atmospheric Administration. 2020. Available online: https://darrp.noaa.gov/oil-spills/refugio-beach-oil-spill-trustees-release-draft-assessment-and-restoration-plan-public (accessed on 20 April 2021).
- Dugan, J.E.; Defeo, O.; Jaramillo, E.; Jones, A.R.; Lastra, M.; Nel, R.; Peterson, C.H.; Scapini, F.; Schlacher, T.; Schoeman, D.S. Give Beach Ecosystems Their Day in the Sun. Science 2010, 329, 1146. [Google Scholar] [CrossRef] [PubMed]
- Martin, K.L.M.; Adams, L.C. Effects of Repeated Sand Replenishment Projects on Runs of a Beach-Spawning Fish, the California Grunion. J. Mar. Sci. Eng. 2020, 8, 178. [Google Scholar] [CrossRef] [Green Version]
- City of Imperial Beach. General Plan and Local Coastal Program. Adopted 19 October 1994, City Council Resolution 94-4427, Amended November 2015. Available online: https://www.imperialbeachca.gov/ (accessed on 15 November 2015).
- Wooldridge, T.; Henter, H.J.; Kohn, J.R. Effects of beach replenishment on intertidal invertebrates: A 15-month, eight beach study. Estuar. Coast. Shelf Sci. 2016, 175, 24–33. [Google Scholar] [CrossRef]
- Census 2015. Available online: http://www.census.gov/quickfacts/table/PST045215/0636294 (accessed on 6 August 2016).
- Climate Central. Surging Seas. 2014. Available online: http://sealevel.climatecentral.org/ssrf/california (accessed on 6 August 2016).
- Climate Education Partners. San Diego, 2050 Is Calling. How Will We Answer? 2015. Available online: https://escholarship.org/uc/item/9sb5f1s5 (accessed on 30 September 2015).
- Kahn, M.E. Adapting to Climate Change; University of Arizona Press: Tucson, AZ, USA, 2021. [Google Scholar]
- Vitousek, S.; Barnard, P.L.; Limber, P. Can beaches survive climate change? J. Geophys. Res. Earth Surf. 2017, 122, 1060–1067. [Google Scholar] [CrossRef]
- Hinkel, J.; Aerts, J.C.J.H.; Brown, S.; Jiménez, J.A.; Lincke, D.; Nicholls, R.J.; Scussolini, P.; Sanchez-Arcilla, A.; Vafeidis, A.; Addo, K.A. The ability of societies to adapt to twenty-first-century sea-level rise. Nat. Clim. Chang. 2018, 8, 570–578. [Google Scholar] [CrossRef]
- Federal Emergency Management Authority. Final Draft Guidelines for Coastal Flood Hazard Analysis and Mapping for the Pacific Coast of the United States. Oakland, CA. 2005. Available online: http://www.fema.gov/media-library-data/840f98e4cb236997e2bc6771f04c9dcb/Final+Draft+Guidelines+for+Coastal+Flood+Hazard+Analysis+and+Mapping+for+the+Pacific+Coast+of+the+United+States.pdf (accessed on 30 September 2015).
- Parsons, G. Travel cost models. In A Primer on Non-Market Valuation, 2nd ed.; Champ, P., Boyle, K., Brown, T., Eds.; Springer: Fort Collins, CO, USA, 2017. [Google Scholar]
- King, P.G.; Symes, D. Potential loss in GNP and GSP from a failure to maintain California’s beaches. Shore Beach 2004, 72, 3–8. [Google Scholar]


| Year | This Study | Low USACE | High USACE |
|---|---|---|---|
| 2000 | 0.18 | 1.43 | 1.98 |
| 2005 | 0.18 | 1.43 | 1.98 |
| 2010 | 0.27 | 2.10 | 2.93 |
| 2015 | 0.37 | 2.77 | 3.87 |
| 2020 | 0.46 | 3.45 | 4.82 |
| 2025 | 0.48 | 4.12 | 5.76 |
| 2030 | 0.64 | 4.79 | 6.71 |
| 2035 | 0.73 | 5.46 | 7.65 |
| 2040 | 0.82 | 6.13 | 8.57 |
| 2045 | 0.91 | 6.80 | 9.51 |
| 2050 | 1.01 | 7.47 | 10.46 |
| 2048 | 1.10 | 8.14 | 11.40 |
| 2060 | 1.16 | 8.81 | 12.35 |
| 2065 | 1.25 | 9.48 | 13.29 |
| 2070 | 1.34 | 10.15 | 14.18 |
| 2075 | 1.43 | 10.82 | 15.15 |
| 2080 | 1.52 | 11.52 | 16.10 |
| 2085 | 1.62 | 12.20 | 17.04 |
| 2090 | 1.71 | 12.87 | 17.99 |
| 2095 | 1.80 | 13.54 | 18.93 |
| 2100 | 1.89 | 14.18 | 19.85 |
| Sandy Beach Ecosystem Services | Direct Use Value | Indirect Use Value |
|---|---|---|
| Sediment storage and transport | X | |
| Wave dissipation and associated buffering against extreme events | X | |
| Dynamic response to sea-level rise (within limits) | X | |
| Breakdown of organic materials and pollutants | X | |
| Water filtration and purification | X | |
| Nutrient mineralization and recycling | X | |
| Water storage in dune aquifers and seawater discharge through beaches | X | |
| Maintenance of biodiversity and genetic resources | X | |
| Nursery areas for juvenile fishes | X | |
| Nesting sites for turtles and shorebirds, and rookeries for pinnipeds | X | |
| Prey resources for birds, fishes, and terrestrial wildlife | X | |
| Scenic vistas and recreational opportunities | X | |
| Bait and food organisms | X | |
| Functional links between terrestrial and marine environments on the coast | X |
| Sea Level Rise | Elevated Sq Ft | Total Cost |
|---|---|---|
| 2047 (0.5 m) | 791,630 | USD 197,907,500 |
| 2069 (1.0 m) | 1,039,031 | USD 259,757,750 |
| 2100 (2.0 m) | 1,539,025 | USD 384,756,250 |
| Structure | Initial Cost (USD)/Unit | Units | Total Cost (USD) | Maintenance |
|---|---|---|---|---|
| Seawall Removal | $1000 per ft | 7920 ft. | $7,920,000 | |
| Nourishment (30 m × 2.6 km) | $20 per cy ($1.1 M/acre) | 1 million cy 2.6 (acres) | $20,000,000 | (add USD 1/year) per cy |
| New Seawall | $4500 per ft | 7920 ft | $35,640,000 | 2% every 10 years |
| New Groin | $4000 per ft. (930ft each × 4 additional) | 3720 ft | $14,880,000 | 5% every 10 years |
| Cobble | $3000 per ft | 7920 ft | $23,760,000 | |
| Dune Sand | $1000 per ft | 7920 ft | $7,920,000 | |
| House Removal | $10 per sq ft | |||
| Condo Removal | $20 per sq ft | |||
| Road Removal | $4 per sq ft | |||
| Pipe Removal | $20 per ft | |||
| Pump Station Removal | $200 per sq ft | |||
| Dune Restoration | $77,000 per acre | 11.8 acres | $910,000 |
| Interest Rate: | 2.5% | 4.0% | |||
| Maintenance Cost: | 1.0% | 5.0% | 1.0% | 5.0% | |
| Prop. Tax: | 0.0% | 1.2% | 0.0% | 1.2% | |
| Price/Rent Ratio | 15 | 21.6 | 22.7 | 26.0 | 27.5 |
| 17.5 | 25.1 | 26.5 | 30.4 | 32.1 | |
| 20 | 28.7 | 30.3 | 34.7 | 36.6 | |
| 22.5 | 32.3 | 34.1 | 39.1 | 41.2 | |
| 25 | 35.9 | 37.9 | 43.4 | 45.8 | |
| Parameter | Results |
|---|---|
| Discount Rate | Results are robust within a reasonable range (0 to 5%). |
| Recreational Value | Increasing recreational value makes restoration costs (dunes, groins, nourishment) a more attractive option relative to retreat or armoring. |
| Beach Attendance | Increasing beach attendance makes restoration costs (dunes, groins, nourishment) a more attractive option relative to retreat or armoring. |
| Ecosystem Service Value | Results are robust within a reasonable range (0 to 200%) |
| Nourishment/Restoration Costs | Relatively robust over long term |
| Beach Width | Not robust |
Publisher’s Note: MDPI stays neutral with regard to jurisdictional claims in published maps and institutional affiliations. |
© 2021 by the authors. Licensee MDPI, Basel, Switzerland. This article is an open access article distributed under the terms and conditions of the Creative Commons Attribution (CC BY) license (https://creativecommons.org/licenses/by/4.0/).
Share and Cite
Revell, D.; King, P.; Giliam, J.; Calil, J.; Jenkins, S.; Helmer, C.; Nakagawa, J.; Snyder, A.; Ellis, J.; Jamieson, M. A Holistic Framework for Evaluating Adaptation Approaches to Coastal Hazards and Sea Level Rise: A Case Study from Imperial Beach, California. Water 2021, 13, 1324. https://doi.org/10.3390/w13091324
Revell D, King P, Giliam J, Calil J, Jenkins S, Helmer C, Nakagawa J, Snyder A, Ellis J, Jamieson M. A Holistic Framework for Evaluating Adaptation Approaches to Coastal Hazards and Sea Level Rise: A Case Study from Imperial Beach, California. Water. 2021; 13(9):1324. https://doi.org/10.3390/w13091324
Chicago/Turabian StyleRevell, David, Phil King, Jeff Giliam, Juliano Calil, Sarah Jenkins, Chris Helmer, Jim Nakagawa, Alex Snyder, Joe Ellis, and Matt Jamieson. 2021. "A Holistic Framework for Evaluating Adaptation Approaches to Coastal Hazards and Sea Level Rise: A Case Study from Imperial Beach, California" Water 13, no. 9: 1324. https://doi.org/10.3390/w13091324