
A Comprehensive Review on Membrane Fouling: Mathematical Modelling, Prediction, Diagnosis, and Mitigation


Department of Chemical Engineering, American University of Sharjah, Sharjah 26666, United Arab Emirates
*
Author to whom correspondence should be addressed.
Water 2021, 13(9), 1327; https://doi.org/10.3390/w13091327
Submission received: 7 April 2021
/
Revised: 30 April 2021
/
Accepted: 6 May 2021
/
Published: 11 May 2021
(This article belongs to the Section Water and One Health)
Abstract
:Membrane-based separation has gained increased popularity over the past few decades, particularly reverse osmosis (RO). A major impediment to the improved performance of membrane separation processes, in general, is membrane fouling. Fouling has detrimental effects on the membrane’s performance and integrity, as the deposition and accumulation of foulants on its surface and/or within its pores leads to a decline in the permeate flux, deterioration of selectivity, and permeability, as well as a significantly reduced lifespan. Several factors influence the fouling-propensity of a membrane, such as surface morphology, roughness, hydrophobicity, and material of fabrication. Generally, fouling can be categorized into particulate, organic, inorganic, and biofouling. Efficient prediction techniques and diagnostics are integral for strategizing control, management, and mitigation interventions to minimize the damage of fouling occurrences in the membranes. To improve the antifouling characteristics of RO membranes, surface enhancements by different chemical and physical means have been extensively sought after. Moreover, research efforts have been directed towards synthesizing membranes using novel materials that would improve their antifouling performance. This paper presents a review of the different membrane fouling types, fouling-inducing factors, predictive methods, diagnostic techniques, and mitigation strategies, with a special focus on RO membrane fouling.
1. Introduction
Water desalination is the process of purifying seawater or brackish water from salts and contaminants to produce water suitable for domestic and industrial applications. Membrane-based technologies are a promising approach to water treatment, due to their high energy efficiency, compactness and low space requirement, operational simplicity, and ease of automation. Among the most well-established membrane-based techniques for desalination are, reverse osmosis (RO), microfiltration (MF), nanofiltration (NF), ultrafiltration (UF), and membrane distillation (MD) [1,2].
Fouling is generally defined as the deposition and accumulation of undesired materials on the surface of or inside a given host solid material such as membranes, heat exchangers, and boilers. The deposited materials could be dissolved particles, partially soluble organic and/or inorganic macromolecules and/or biological micro-organisms. Thus, in membrane-based water treatment processes, membrane fouling is an inevitable occurrence that can significantly impair the processes’ performance, operation, sustainability, and economic feasibility. Fouling mechanisms are a product of the complex physical and chemical interactions between various feed constituents and the membrane surface [3,4,5]. The major contributing factors to membrane fouling include [6]:
- Feed chemistry and composition, i.e., pH, ionic strength, and foulant concentration.
- Concentration polarization (CP): CP can be broadly described as the deposition of rejected solutes on the membrane’s surface, creating a region near the membrane with spatially varying concentrations known as the polarized layer. This added resistance causes an increase in the osmotic pressure across the membrane, which decreases the driving force of the process (transmembrane pressure (TMP)), the permeate flux and the observed solute rejection, all of which increase the possibility of membrane fouling [5,7].
- Membrane properties include membrane material type, porosity, hydrophobicity, surface charges, membrane morphology, and molecular weight cut-off (MWCO).
- Process operating conditions such as temperature, pressure, aeration, permeate flux, and several other hydrodynamic conditions.
This review focuses on the various fouling mechanisms found in RO systems, factors influencing RO membrane fouling, as well as several techniques used to control this phenomenon.
2. Membrane Foulants
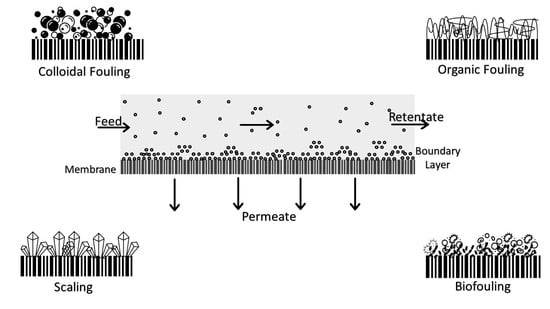
Membrane fouling is generally classified according to the type of foulant or location of fouling. The main categories of foulants include particulate, organic, inorganic, and biological micro-organisms (biofoulants). As for location, fouling can occur internally or on the membrane’s surface. Most low-pressure membrane-based separation processes, such as UF and MF, suffer from internal fouling due to the adsorption and clogging of the pores. On the other hand, relatively denser and more compact semi-permeable membranes, such as those used in NF and RO, experience surface fouling. The following sections elaborate on membrane fouling based on the type of foulant.
2.1. Particulate Fouling
Colloids or colloidal dispersions are solutions in which particles of one substance, usually ranging in size from a few nanometers to micrometers, are evenly dispersed in another substance [8]. Colloids can be classified according to size into settleable colloids where the particle size exceeds 100 µm, supra-colloids where the particle size ranges from 1 to 100 µm, colloidal solids where the particles range in size from 0.001 to 1 µm, and dissolved solids which are less than 0.001 µm in size [9]. Moreover, aquatic colloids can be classified according to the dispersed organic and inorganic compounds. Organic colloids comprise proteins, fats, carbohydrates, greases, oils, surfactants, and bio-colloids; whereas, inorganic colloids include clay, silt, crystals, silica sediments, as well as aluminum and iron precipitates resulting from incomplete treatments [9,10].
Particulate fouling is a multi-stage mechanism; the first stage starts with pore-blocking, during which particles deposit near the pore opening, constricting the aperture. With time, layers of the deposited particles will build up on the initial ply, causing the complete sealing and blockage of the membrane’s pores. The second stage is characterized by increased deposition, which forms a thick ‘cake layer’, compromising the membrane’s role in the effective and selective removal of the contaminants. The cake layer formed induces higher hydraulic resistance (referred to as cake resistance) and causes strong CP, which, as mentioned earlier, could decrease permeate flux and increase the adverse effects of the foulants [5,6]. The occurrence of particulate fouling is a function of the membrane surface properties (e.g., morphology and topography), feedwater characteristics, including the types of fouling agents present, their concentrations, and their physicochemical properties such as size and surface charge, the feed’s chemistry in terms of solution pH, ionic strength and charge interactions, as well as the operating conditions (i.e., temperature, pressure, flux and cross-flow velocity (CFV)). Generally, smoother membranes with enhanced hydrophilic characteristics and low charge surfaces are less likely to experience particulate fouling, whereas hydrodynamically stressful operating conditions featuring high membrane flux rates and/or low CFV can cause severe membrane damage [11].
2.2. Organic Fouling
Organic fouling is caused by the accumulation and deposition of relatively dense organic materials, such as polysaccharides, proteins, humic substances, nucleic acids, lipids, and amino acids. Dissolved organic matter (DOM) is abundant in both surface water and wastewater and can be classified into natural organic matter (NOM), synthetic compounds, and soluble microbial products (SMPs). NOM is naturally occurring heterogeneous mixtures formed as a result of the decomposition of animal and plant remains. Synthetic compounds are man-made DOMs and are artificially added or generated during the disinfection process. Lastly, SMPs are byproducts of biological treatment processes where organic compounds are biologically decomposed. Relevant research studies suggest that the effect of organic matter on RO membrane fouling varies according to the dominating type of organic foulant, feedwater chemistry, foulant-surface, and foulant–foulant interactions [5,6].
2.3. Inorganic Fouling
Inorganic fouling, or scaling, is the deposition of inorganic compounds on the membrane surface or inside the membrane pores [5]. The deposits could be either inorganic compounds with low solubility in water or solutes present in large amounts in water. They form supersaturated solutions and eventually precipitate out of the solution and onto the surface of the membrane. Scale formation on membrane surfaces could occur through two mechanisms, i.e., crystallization or particulate fouling. The former mechanism involves the precipitation of ions and their subsequent deposition on the membrane, whereas the latter involves the convective transport of particulates from the bulk of the solution to the membrane surface. In rivers, groundwater, seawater, and municipal wastewater, the main inorganic compounds that contribute to scaling are hydroxides, sulfates, carbonates, calcium, magnesium, iron, ortho-phosphates, silicic acids, and silica [5,6].
2.4. Biofouling
Biofouling refers to the adhesion and accumulation of microorganisms accompanied by biofilm development on the solid host material and can account for up to 40% of the total fouling during reverse osmosis filtration [3,12]. Table 1 provides a list of microorganisms that commonly attack membranes [13]. The biofilm is an assembly of surface-associated organisms enclosed within layers of a polymer-like material referred to as the extracellular polymeric substance (EPS) matrix. The EPS matrix is quite robust and is capable of protecting the enclosed microorganisms from biocides and toxins. The EPS matrix’s makeup depends on the environment in which the biofilm develops; commonly matrices contain proteins, glycoproteins, lipoproteins, nucleic acids, lipids, and polysaccharides. Mineral crystals, clay, silt, or corrosion particles can also be part of the composition of the matrix [3,5,14]. Membrane surface roughness and hydrophobicity are the two main characteristics that significantly affect biofilm development. Generally, hydrophobic membranes are more prone to microbial-associated interactions, thus, are more likely to experience biofouling. Similarly, membranes with rough surfaces tend to have larger exposed surface areas compared to smoother membranes, which provide more active sites for microbial growth and adhesion, increasing the chances of biofouling [13].
Biofouling has various effects on the physical components and operation of the membrane processes. These effects are clarified below [13]:
- Flux decline: as with the case of particulate fouling discussed earlier, the biofilm formation increases the resistance and reduces the permeate flux.
- Membrane biodeterioration: damage to the membrane’s structure due to acidic byproducts resulting from the microorganism’s biological activity.
- Deteriorated salt retention: inhibition of conventional transport mechanisms and increased CP effects across the membrane, due to the accumulation of dissolved salts and ions on the surface.
- Increased differential pressure: this is due to the increased resistance caused by biofilm formation.
- Higher energy requirements: the high-pressure requirements and the decline in permeate flux result in increased energy consumption.
- Frequent chemical cleaning: the cleaning process disrupts the membrane plant operation and shortens membrane life.
3. Fouling Prediction
Ever since the introduction of the membrane industry in the 1970s, membrane fouling has been an inevitable phenomenon in membrane operations that severely affects the plant’s performance and costs [15]. Predicting fouling in RO systems would allow diagnostic and preventive measures to be undertaken, which would rapidly limit the effects of fouling [16]. The tactics developed to predict membrane fouling can take several forms, including [14,16]:
- Pilot plant evaluation of the system’s performance;
- The use of fouling indices; and
- The use of predictive models.
3.1. Pilot Plant Evaluation of System Performance
Pilot plant studies involve the design of an optimal system based on the characteristics of the feed. Information obtained from the analysis of the proposed water source is used to develop a pretreatment scheme for the feed water, evaluate the compatibility of one or more types of membranes with the feed water, as well as determine the optimal operating conditions. Pilot plant tests are run for long hours (around several thousand hours) to gauge the performance of the membrane system. Although this method generally provides reasonably good predictability of membrane fouling, it is extremely costly and time-consuming [17].
In a pilot plant study led by Ruigómez et al. [18], the effect of implementing a rotating hollow-fiber membrane design on membrane fouling in submerged anaerobic membrane bioreactors (MBRs) was investigated. The pilot plant’s wastewater feed was obtained from a full-scale wastewater treatment plant located at Valle de Guerra (La Laguna, Canary Islands, Spain). The pilot plant consisted of a bioreactor and two different configurations for the membrane chamber; the first, a typical biogas sparging membrane configuration; and the second, a novel rotatory membrane configuration. The evaluation of the membranes’ filtration performance with respect to varying permeate flux conditions was conducted over short time intervals. Experiments showed that implementing the rotary membrane configuration enhanced the critical flux by 17–20%, as this design alteration decreased the fouling rate and was also successful in removing layers of previously formed fouling cake on the membrane’s surface. Melián-Martel et al. [19] conducted a pilot plant study to investigate the interactions and fouling potential of simultaneous foulants. Silica and sodium alginate were used as respective models of inorganic and organic colloidal foulants, and the pilot-scale RO unit consisted of a standard commercial spiral-wound thin-film composite (TFC) membrane. The results showed severe permeate flux decline and a synergistic effect on membrane fouling when the concentration of sodium alginate was equal to or higher than the concentration of silica. Another study investigating the effect of combining foulants was conducted by Sioutopoulos et al. [20]. In this study, mixtures of sodium alginate and bovine serum albumin (BSA) (in various proportions, i.e., 1:3, 1:1, 3:1) were fed to a hydrophilic polyacrylonitrile (PAN) UF flat-sheet membrane. The results showed that the fouling propensity increased significantly when the BSA-sodium alginate mixture was introduced compared to single foulants. Moreover, the fouling resistance increased with the increased mass ratio of alginate in the mixture, particularly at high fluxes. Hernández et al. [21] studied the fouling induced by polyethylene glycol (PEG) and alginate at different concentrations in the initial filtration stage of cross-flow UF using an empirical adjustment of flux decline data based on a bi-exponential equation with four coefficients. The results showed varying degrees of increase in resistance depending on the type of solution and membrane used.
In another study, Neubrand et al. [22] conducted a combined laboratory and pilot plant study to understand the fouling behavior of surface water (river Spree, Berlin, Germany). In the laboratory, an UF system was set-up and the tested experimental variables included different coagulants, introduced at varying dosages and pH levels under constant pressure conditions. However, testing for inline coagulation was carried out under actual site conditions in the pilot plant, where a constant flux and intermediate backwash were maintained. These experiments showed preferential performance of aluminum-based coagulants over iron salts in removing biopolymers and humic acids from the river water, which also resulted in decreased dissolved organic carbon (DOC) concentrations. The pilot plant study results confirmed the laboratory findings for inline coagulation and DOC removal; however, aluminum coagulants were found to significantly increase the differential pressure in the membrane system, when operated under standard industrial conditions. Therefore, using iron-based salt coagulants with slightly acidic pH presented the most stable option for the optimal operation of the UF system at the river site.
Until recently, studies dealing with fouling have been predominantly dependent on trial-and-error-based diagnostic methods tested in industrial and pilot-scale set-ups. Basic approaches for identifying fouling were based on measuring the operational parameters during a process, followed by destructive membrane autopsy studies. As a result, developing tools that enabled field-based, non-destructive, and real-time simulation of fouling occurrences are highly in demand [23]. A device servinf this purpose, known as the membrane fouling simulator (MFS), was introduced in 2006 by Vrouwenvelder et al. [24]. The developed MFS has comparable hydrodynamic performance, construction materials, and dimensions to spiral-wound RO and NF membranes, and is equipped with a gauging sight glass. Diagnosing and monitoring fouling using the MFS can be done by microscopically analyzing the sample coupons placed on the device’s membrane sheets, visually inspecting the coupon and membrane integrity through the sight glass and tracking the variations in operational parameters for the duration of the test. To validate the accuracy of the device’s detection and prediction of fouling occurrences, a comparative study was carried out where results from the MFS were compared against results obtained from a full-scale membrane module. Both set-ups were fed with UF pre-treated surface water and scale-inhibiting agents. The results were in agreement as both predictive methods showed similar pressure build-up profiles and biomass accumulation rates, yet the MFS detected the onset of fouling earlier than the membrane module.
A more recent study, conducted by Massons-Gassol et al. [25], compared the consistency of MFS predictions by operating a full-scale RO system along with four MFS units under identical process conditions. There were some measurement variabilities between the RO and the MFS units, in terms of the absolute differential pressure profiles as well as the biofouling rates. The MFS units presented slightly higher biofouling rates than the RO elements, where the percentages were found to be 17% and 8%, respectively. The discrepancy was attributed to the manual operation of MFS units, and a smaller sample size. Nonetheless, it was concluded that the MFS units are reliable biofouling screening devices, as they were successful in accurately simulating the different stages of biofilm accumulation on the membrane elements, as well as projecting predictive trends and observations. Given the potential of MFSs at fouling prediction, a few MFS units are currently available in the market, one of which is the Convergence MFS which was developed to quickly evaluate biofouling growth on RO membranes [26].
Current membrane-science research ventures into more advanced fouling management approaches, utilizing technological advancements like Artificial intelligence (AI) and machine learning (ML) to optimize operating conditions from online data, ensuring that the appropriate decisions are made at the proper time. AI and ML have proven to be effective fouling management and control tools, as they can be used to develop simulation, optimization, and diagnostic models to recognize fouling occurrence patterns and mechanisms [27]. Aidan et al. [28] used multilayer perceptron artificial neural networks (MPLANN) to establish maintenance and backwash schedules for an MBR to prevent biofouling occurrences. The flux prediction modeling results were matched against experiments and accordingly, backwash and service schedules were planned for the bioreactor. Similarly, a study by Curcio et al. [29] used MLPANN to investigate the effects of various fouling cleaning protocols on the permeate flux decay rates using different membrane types. The results provided by the neural network allowed planning external interventions at the right time to avoid fouling buildup on the membranes. Li and Wang [30] developed a fouling prediction model based on a feedback type Elman neural network to forecast fouling patterns and estimate the permeate flux decay rates. It was concluded that higher flux rates were predicted using the novel model, in contrast to estimations generated using the backpropagation (BP) neural network model. Another way AI can be utilized in membrane fouling management was introduced by Moghaddam et al. [31], who used fuzzy logic (FL) to process variables. The relationship between the wastewater feed operating parameters (i.e., temperature, pH, and flow rate) and the membrane’s fouling response was investigated. Based on changes in the permeate flow rate, the analysis allowed the determination of the critical ranges for the operating conditions; hence membrane fouling occurrences can be minimized.
3.2. Membrane Fouling Indices
Membrane fouling indices are predictive quantifiers that indicate how susceptible membranes are to fouling. The traditional and most widely applied fouling indices in RO systems are the silt density index (SDI) and the modified fouling index (MFI); however, these indices have several limitations, such as inadequate fouling prediction with small foulant agents (<0.45 µm), and neglecting cake-sustained osmotic pressure effects, as many of these fouling indices were developed before the recognition of such effects [16,32]. Therefore, current research efforts have been devoted to improving the reliability and accuracy of these indices in predicting fouling-propensity. The following sections present the most commonly used fouling indices.
3.2.1. Silt Density Index (SDI)
The silt density index (SDI) is an extensively used marker for fouling propensity prediction of feed water. To calculate the SDI for a certain feed, a MF membrane experimental set-up is used (diameter of 47 mm and pore size of 45 µm). The feed water is operated in a dead-end mode at a constant pressure of 207 kPa, and the time needed for a specific volume to be filtered is recorded. Consequently, the SDI can be calculated using Equation (1) [16,33]:
where ti and tf are the initial and final times required for the collection of a specific volume V, and T is the time difference between the samples collection. Commonly, an SDI value of up to 5 is passable, but preferably, it should be below 3. For many years, SDI has been the standard for predicting fouling, comparing different treatment methods, designing new plants, and monitoring the performance of existing ones. However, this widely used index was found to have a few limitations, mainly a lack of reliability due to a lack of rigorous theoretical basis. It is empirically derived based on the assumption of linear permeate flux decline, irrespective of any quantitative relationships with the feed’s colloidal content or any mechanism of fouling. Thus, it provides adequate results when the feed water is of high quality but fails when it has a considerable fouling potential [16,32].
Alhadidi et al. [34] proposed a few modifications to the SDI to overcome some of the pitfalls of the original index. Their first proposition was a normalized SDI (SDI+), which took into account the testing conditions, namely temperature T, change in pressure Δp, and the clean membrane resistance, RM. Moreover, the normalized index accounted for the different fouling mechanisms by normalizing the results using line and wheel slide charts. Similarly, the second proposition was a volume-based SDI (SDIv), which compared the difference in a specific volumetric flow rate before and after the filtration process. Alhadidi et al. [35] proposed a method to determine the SDIv, which requires a filtration setup, consisting of a membrane with a diameter of 47 mm and pore size of 0.45 µm, operated at a constant pressure of 207 kPa. The volume-dependent plugging ratio (%Pv) per specific unit volume (m3/m2), the reference membrane surface area AMO, and the time needed to collect the first and second volume samples, t1 and t2, after the filtration of the standard volume VFO are all parameters accounted for in the calculation method (refer Equation (2)). If the main driving mechanism for fouling is by a complete blockage of the membrane, a linear correlation between the index and the feed’s colloidal particle concentration can be observed.
To report the SDIv within the range of the standard SDI values (0 to 6.66), the plugging ratio can be divided by 15, which is a dimensionless down-scaling factor (refer Equation (3)).
3.2.2. Modified Fouling Index (MFI)
The modified fouling index (MFI), also known as MFI0.45, is a parameter developed in 1980 by Schippers and Verdouw, with values ranging between 1 to 4 [36]. The MFI test is carried out in the same manner as the SDI test; however, the MFI has a solid theoretical foundation accounting for the cake filtration mechanism. Therefore, the modified index can also estimate the fouling-driven flux decline across the membrane. A linear relationship between the index and the particle’s concentration in the tested sample can be obtained through the MFI equation (Equation (4)), which accounts for the water viscosity µ, the specific cake resistance α, the colloidal particles’ concentration C, the TMP across the membrane ∆P, and the active filtration membrane area A [16,32,36].
The traditionally used membrane with a pore size of 0.45 µm and 30 psi operating pressure proved to be inadequate in predicting fouling susceptibility in many situations; therefore, several variations of the MFI to accommodate tighter membranes (i.e., UF and NF) have been developed. Studies conducted by Boerlage et al. [37,38] aimed at modifying the MFI to consider processes where fouling is driven by small-sized colloids in the feed, and introduced the constant-pressure MFI-UF set-up to account for constant flux operative conditions. A more recent study by Cai et al. [39] changed the operating pressure to 40 psi and introduced a modified UF fouling index (MFI40). Moreover, it investigated the dependence of the developed index on the feed’s properties. For instance, it was observed that higher values of MFI40 were registered when the feedwater had higher biopolymer concentration and increased turbidity. To validate the reliability of the index, a fouling propensity predictive model was developed and had a prediction accuracy of 73%. Additionally, the laboratory and pilot-scale studies showed that a linear relationship existed between the feed’s MFI40 and UF fouling rates.
3.2.3. Langelier Saturation Index (LSI) and Stiff and Davis Saturation Index (S&DSI)
The Langelier saturation index (LSI) and the Stiff and Davis saturation index (S&DSI) are commonly used indices for predicting the probability of calcium carbonate (CaCO3) precipitation. The LSI was developed in 1936 by Langelier and is considered the first index of inorganic scaling [16,40]. The LSI is a measure of the deposition of CaCO3 and the corrosive tendencies of aqueous solutions. It can be computed by subtracting the saturation pH of a solution from its actual pH (Equation (5)) [41].
The saturation pH is represented mathematically as the sum of the negative logarithms of the calcium ion concentration, alkalinity, and a factor K. K represents the effects of the solution’s temperature (T) and ionic strength, accounted for by the total dissolved solids (TDS) concentration.
The acceptable range of TDS concentration is from 10 to 10,000 mg/L. The indicator is not a numerical quantifier of a solution’s corrosiveness potential, amount of scale/cake formed, or CaCO3 saturation degree; it is rather an indicator if corrosion and scaling would occur or not. Different ways of interpreting the LSI values are presented in Table 2 and Table 3 [41].
The S&DSI is a modification to the existing LSI to make it apply to feeds with higher TDS concentrations (TDS > 10,000 mg/L). The S&DSI is calculated in a similar manner to the LSI; the sole difference is in the K equation presented below (Equations (6)–(9)) [16]. Where T represents the feedwater temperature and Is is the ionic strength.
3.2.4. Total and Dissolved Organic Carbon (TOC and DOC)
Organic fouling indices are indirect, as total organic carbon (TOC) and DOC concentrations are inadequate representations of the organic matter in a feed because they do not distinguish whether the present organic carbon content exists naturally or is reinforced by biological interactions. Therefore, experiments using heat, oxygen, radiation, or chemicals can form carbon dioxide from the carbon matter, and consequently sequester it for measurement using infrared spectrometry. Other more direct organic matter quantification methods include liquid chromatography organic carbon detection (LCOCD) and fluorescence excitation–emission matrices (FEEM) [16].
3.3. Predictive Models
Another approach for fouling prediction in membrane systems involves using mathematical fouling prediction models. These mathematical models are valuable because they facilitate the optimization of fouling removal and prevention methods, and also help establish interactions and relationships between different filtration variables. Most equations aim at relating the time-dependent decline of the permeate flux Jw, with the water permeability coefficient A [32,42]. The model introduced by Wilf et al. [43] (Equation (10)) was developed based on empirical data that is intensively collected from multiple seawater desalination plants using RO filtration systems. The value for the model’s parameter m was found to range from −0.035 to −0.041, for a 20% and 25% decrease in permeate flow rates, respectively. The t in the equation accounts for the system’s operating time in days.
Chen et al. [44] developed a predictive model for simulating the development of membrane fouling with respect to time in full-scale RO processes. The model used the concept of fouling potential (i.e., the increment in membrane resistance due to a unit volume of permeate passing through the membrane) to directly relate the fouling property of feed water to the fouling rate of a RO membrane. The simulation results showed that there is a strong interaction between permeate flux and membrane fouling. In addition, the occurrence and duration of constant average flux are affected by clean membrane resistance, channel length, and water fouling potential.
Duclos-Orsello et al. [45] proposed a comprehensive model that collectively accounts for the three classical fouling stages; pore constriction followed by pore blockage, and then cake formation. The theoretical basis for the model shown in Equation (11) depends on the assumption that primitive fouling starts when the pores are constricted and eventually become blocked, driving the accumulation of cake layers on the membrane, which drastically affects the quality of filtration at such developed stages of fouling. The abovementioned three fouling mechanisms are represented in the equation by the parameters α, β, and f′R′, respectively. Furthermore, the model’s reliability was tested against several experiments, including the filtration of 0.25 μm polystyrene microspheres through 0.22 μm membranes and the filtration of a BSA non-agglomerate solution through hydrophobic membranes [45]. The results were greatly comparable, validating the accuracy of the model.
Likewise, Mondal and De [46] developed a model for fouling prediction in steady-state cross-flow filtration systems. The model’s underlying theory is based on just two stages of fouling, pore-blocking followed by cake formation. It assumes that the membrane’s pores get blocked up to a certain point in time, after which cake layers start to form and accumulate. However, the thickness of the cake layer is controlled by the feed’s crossflow rate, which results in a steady-state permeate flux. Equation (12) presents the steady-state flux:
The two fouling mechanisms, namely pore-blocking and cake formation, are mathematically represented in the equation as dimensionless values A1 and A2. A1 is the coefficient ratio between intermediate blocking and cake formation, whereas A2 accounts for the filtration resistance as a function of pores blocked. The findings showed that an optimized steady-state flux could be obtained by lowering the value of A2 and increasing that of A1. Moreover, a higher feed CFV could cause developed stages of cake-controlled filtration [46]. Chang et al. [47] tested the Hermia empirical model and the resistance-in-series model (given by Equations (13) and (14), respectively). Based on flux data collected from crossflow membrane NF, it was concluded that fouling was predominantly driven by intermediate pore-blocking and gel layer formation mechanisms, for raw water feeds and sand filter (SF) effluents, respectively.
Similarly, Virtanen et al. [48] examined the use of Raman spectroscopy and chemometrics for generating quantitative data representative of the extent of membrane fouling, from which a predictive model based on the principal component analysis (PCA) approach was developed. PCA is an adaptive data analysis technique that reduces the dimensionality of large datasets while maintaining as much variability as possible, by maximizing variance and introducing uncorrelated variables (referred to as principal components) [49]. The developed PCA-based model was deemed reliable for monitoring and controlling fouling in membrane systems, as its results were comparable to fouling empirical data collected from membrane adsorption experiments. Additionally, the results obtained using the model maintained the integrity of the datasets, as it captured 99.76% of the data’s total variance, while the residual 0.24% was attributed to noise.
Koonani et al. [50] developed five fouling models to describe the fouling-driven permeate flux decline behavior during MF. The first three models assume that fouling occurs in three successive stages; pore size reduction due to constriction followed by pore blockage and then cake accumulation. However, the second and third models integrated the Hagen-Poisseuille law for the estimation of the filtrate flux. The fourth and fifth models were modified by representing pore blockage kinetics with the assumption of zero-order time-dependence. Ruiz-García et al. [51] developed a model to estimate the flux or the average water permeability coefficient (A) decline over extended periods. Ten years of operating data of a brackish water reverse osmosis (BWRO) desalination plant were used. The proposed model was compared to the Wilf et al. [43] model presented earlier; compared to the developed model, the Wilf et al. model showed lower flexibility due to its dependence on only one parameter. The obtained findings showed that the models modified with the zero-order time-dependence assumption (i.e., models 4 and 5) best fit the experimental data and produced the most reliable fouling prediction results.
Following the rising popularity of using neural networks to model membrane fouling, Corbatón-Báguena et al. [52] compared the fouling-driven permeate flux decline predictions for cross-flow UF, generated from the MPLANNs and Hermia’s pore-blocking model. The permeate flow dependence on dynamic fouling conditions and feed’s operative parameters like crossflow velocity and the pressure was modeled. It was concluded that the multilayer perceptron model had similar results to Hermia’s model, and the former was very successful in generating highly accurate flux decline predictions for all the tested TMPs and crossflow velocities. Barello et al. [53] developed a time-dependent neural network (NN) based correlation to predict the water permeability constant, (Kw) in RO desalination processes under fouling conditions. Although the developed NN based correlation predicted Kw values close to those obtained by the existing correlations for the same membrane type (i.e., hollow fiber and spiral wound), operating pressure range and feed salinity; it was able to predict Kw values for any of the two membrane types at any operating pressure and any feed salinity within a wide range. Park et al. [54] developed a deep neural network (DNN) to simulate the developmental stages of organic fouling and the respective permeate flux decline, based on fouling data collected through optical coherence tomography (OCT) imaging. The authors compared the performance of the DNN model to existing mathematical models, namely, the Faridirad model and the pore blockage-cake formation model. It was concluded that the novel DNN approach delivered better predictions, giving a coefficient of determination (R2) of 0.99 for both DNN fouling growth and permeate flux decline simulations. Another study by Lim et al. [55] evaluated the prediction performance of hybrid systems, where a Kalman filter (KF) was combined in series, once with an ANN and another time with a support vector machine (SVM)—a family of ML models. It was concluded that the predictions of the hybrid systems outperformed those of the individual models alone; however, combining KF with SVM yielded more accurate predictive results than combining KF with ANN. Han et al. [56] ventured into developing a comprehensive system that would be used to predict fouling occurrences based on a data-driven approach. The system functions based on a self-organizing deep belief network (SDBN) that can predict the membrane permeability over long periods, coupled with an independent component analysis-principal component analysis (ICA-PCA) algorithm for triggering warnings. The kernel function is also employed as a diagnostic method to determine the fouling degree and mechanism; then, an intelligent decision-making algorithm is utilized to combat the situation. The system exhibited high effectiveness and reliability when its predictive results were compared to the empirical data obtained from two wastewater plants, with a prediction accuracy percentage mounting up to 90%.
4. Membrane Integrity and Fouling Diagnosis
Fouling is a burden on membrane-based treatment plants because it adversely affects the overall performance and efficiency of processes. Thus, conducting proper fouling diagnosis is an essential element in the management and control of fouling. Generally, the first step in RO membrane fouling diagnostics is the visual inspection and collection of samples from the malfunctioning membrane vessels. Visual inspection and sample collection are run in parallel with performance data analysis to determine whether the membrane performance challenges were caused by a loss of membrane integrity or productivity-related issues [62,63,64]. Membrane integrity diagnostics involve two steps [62]:
- A thorough assessment of the malfunctioning membrane’s conductivity profiles followed by an evaluation of the extent of deviation from expected performance;
- Examination of the malfunctioning membrane’s peripheral matrix and identifying any defective components (i.e., interconnectors, end-seals, spacers, O-rings).
The most common and comprehensive method for identifying the nature and source of membrane integrity and fouling is membrane autopsy. This method involves a series of laboratory tests on membrane sections taken from membranes with compromised performance. The following are the steps involved in membrane autopsy:
- External inspection: the different components that constitute the RO membrane are visually examined to diagnose the damaged zones. The core tubes, fiberglass castings, and anti-telescoping devices (ATDs) are carefully checked for potential impairments, including any obvious accumulation of foulants, crystals, scales, and biofilms [62,65,66];
- Mechanical integrity tests: several direct and indirect techniques have been developed to evaluate membrane integrity. Direct methods mainly utilize pressure-driven approaches to specify any grooves or channels in the sheets of the membrane, whereas indirect methods assess the overall integrity of the membrane’s structure [67];
- Dye test: dye testing is used to test damage to the surface of some membrane materials. Commonly used dyes include Congo Red, Methyl blue, and Rhodamine B. A fairly intense color is seen on damaged surfaces, particularly where the damage permits the access of a rather large dye molecule to the exposed surface on the porous supporting layer. If the membrane is intact, a uniformly colored stain would be observed [62,65];
- Cell test: a cell test is carried out to evaluate the performance of the malfunctioning membrane by comparing it against a new one, namely through a comparison of the differences in salt rejection and flux rates. The test is conducted by extracting an autopsied element from the defective membrane, followed by soaking it in deionized (DI) water to clean it from fouling residue and buildup, then inspecting its performance and comparing it against the standard performance of new membrane elements [62,66,68];
- Thorough analysis of the foulants: characterization techniques like scanning electron microscopy (SEM), energy dispersive X-ray (EDaX), Fujiwara oxidation testing, thermogravimetric analysis, and biological reactivity testing are commonly used to depict the membrane’s surface conditions and topography, and distinguish the different types of accumulated foulants [62,65].
5. Fouling Mitigation
Mitigating fouling is a challenging aspect of membrane processes, as the strategies and techniques have to be tailored specifically to the fouling type and occurrence for a successful intervention. This section will discuss some of the existing mitigation and control techniques that aim at managing the detrimental effects of membrane fouling.
5.1. Feedwater Pretreatment
Feedwater is usually pretreated prior to its processing in a membrane-based unit, in order to minimize the chances of fouling. Varying pretreatment schemes can be designed based on the feedwater’s properties and chemical composition. These schemes are generally classified into conventional and nonconventional methods. A conventional pretreatment scheme typically involves the following processes: disinfection, pH adjustment, in-line coagulation-flocculation, UV radiation, floatation, scale inhibition, hardness removal by lime, particulate removal by a coarse strainer, and media filtration [69,70,71]. Disinfection is an integral pretreatment step that aids in alleviating membrane biofouling by preventing the growth of biological matter. Commonly used disinfectants include free chlorine, chlorine dioxide, ozone, chloramines, UV, and potassium permanganate. The next step is primarily for turbidity removal, usually by processes of coagulation followed by flocculation. Coagulation destabilizes suspended solids by forming clumps or micro-flocs. Then, flocculation slowly mixes the micro-flocs, causing them to aggregate into free-floating visible particles that are subsequently removed through filtration, floatation, or sedimentation. Following filtration, scale inhibition agents can be added to control inorganic fouling [5,69,72]. Moreover, sodium bisulfite or activated carbon are commonly used to reduce unreacted chlorine during the chlorination step as the presence of chlorine even at extremely low concentrations could deteriorate TFC membranes. The dosage of anti-scaling agents and sodium bisulfite should be controlled carefully as overdosing can negatively impact the membrane desalination process and marine environment [73].
The main advantage of conventional pretreatment methods is that they are well established and have been used in RO desalination plants for several decades. However, such processes are highly sensitive to changes in the characteristics of the source water; therefore, there is no standard protocol to follow as every feed requires varying dosages of the different treatment chemicals. Additionally, many conventional processes involve many steps and require large spaces to accommodate the various equipment used. Moreover, they entail the usage of high concentrations of chemicals, significant manpower, lower quality of the produced effluent, unknown effects on membrane performance, and high operating costs [69,72]. To address these limitations, several non-conventional alternatives focusing on making the processes more competent have been proposed. These non-conventional pretreatment approaches, such as MF, UF, and NF, can achieve high rejection rates of various contaminants, and reduce the turbidity and SDI concentrations to less than 0.05 Nephelometric Turbidity Units (NTU) and 2, respectively.
MF processes have been proven efficient in removing colloidal, bacterial, and suspended matter with functional membrane pores size ranging from 0.1 to 0.35 µm. An early study conducted in 1997 by Ebrahim et al. [74] investigated the practicability and feasibility of employing MF as a pretreatment process to RO systems and compared its cost-effectiveness with other methods like beach wells and conventional systems. The permeate SDI was averaged at 2.24, where the percentages ranged from 0.26 to 3.10, and reduced averages of chemical oxygen demand (COD) and biochemical oxygen demand (BOD) concentrations were detected, which makes MF capable of producing an input feed to subsequent RO units. Moreover, the results of the techno-economic evaluation revealed that MF is economically feasible as it is the second most cost-effective process, preceded by the beach wells. Later studies focused on coupling MF with conventional pretreatment methods to further improve the efficiency and reduce biofouling propensity. For instance, Lee et al. [75] examined the performance of coupling MF and chlorination as a dual pretreatment set-up, and concluded that the combination was initially successful in the removal of bacterial matter; yet, bacterial regrowth and activity were later observed due to chlorination by-products. Another study by Jeong et al. [76] compared the performance of coupling MF with three different processes; the submerged membrane coagulation hybrid system (SMCHS), submerged membrane adsorption hybrid system (SMAHS), and submerged membrane coagulation–adsorption hybrid system (SMCAHS). The investigation concluded that the SMCAHS had superior performance in comparison to the other two systems; it yielded up to 72% DOC removal from the feed, with dilute coagulant dosages. Moreover, ceramic MF membranes are becoming popular in drinking water and wastewater treatment applications due to their resistance to extreme operating conditions and cleaning protocols compared to organic and polymeric MF membranes [77].
UF pretreatment has shown great promise in pretreating RO feedwater. It is able to reject a wider array of contaminants and impurities than MF, including viruses, suspended organics, silt, and bacteria, mainly due to its narrower pores size, ranging from 0.01 to 0.05 µm. The successful implementation of several UF membranes processes has led to many full-scale integrated UF-RO desalination plants built in Saudi Arabia, the United Arab Emirates, Singapore, China, and South Korea [69,73]. A comprehensive comparative analysis was carried out by Chua et al. [78], assessing the performance of non-conventional UF and MF versus conventional media-filtration methods, in terms of the quality of the permeate. Variables like the SDI, TOC, total suspended solids (TSS), COD, colloidal silica concentrations, TMP, and flux were gauged and compared. The study included two UF pilot plants, one MF pilot plant, and a conventional pretreatment plant. The results showed that the SDI levels ranged from 1.0 to 3.0 for the non-conventional membrane processes, where UF values were relatively towards the lower end of the range. In contrast, the SDI values ranged from 2.8 to 3.8, with inconsistent spikes reaching 6.3. Therefore, the performance of UF as a pretreatment method outweighed that of MF and the conventional system. A similar study by Gu et al. [79] used a pilot plant to evaluate the effectiveness of UF in pretreating feedwater to a RO unit and concluded that it increased the backwash efficiency by almost 36%. Monnot et al. [80] further enhanced the performance of UF as a pretreatment method by preceding it with a granular activated carbon (GAC) unit. The results showed the enhanced quality of the permeate as the SDI and turbidity levels were significantly reduced. Moreover, DOC and colloidal content decreased by about 70% and 90%, respectively.
A relatively new membrane filtration method is NF, which has shown great potential in producing filtrates with a significantly reduced concentration of TDS, organic matter, viruses, and a variety of salts, due to its very small pores, which range from 1 to 10 nm [81]. Talaeipour et al. [82] examined the performance of NF and RO as stand-alone processes and as a combined hybrid process for the treatment of brackish water (Qom, Iran). The hybrid process was more efficient as the salt rejection reached almost 79%, whereas it was about 50% and 73% for the independent NF and RO processes, respectively. Following the Saline Water Conversion Corporation [81], several studies tested and showed the potential of adapting NF as a pretreatment method for RO seawater desalination (SWRO). A demonstration unit where NF was used as a pretreatment step to SWRO was reported by Hassan et al. [83], the results of which were then extended to the operation of an SWRO plant (Umm Lujj, Saudi Arabia). In 2005, Al-Amoudi and Farooque [84] carried out a performance evaluation and membrane autopsy on the Umm Lujj NF-SWRO desalination plant. It was observed that integrating NF into the SWRO desalination system increased the permeate flux from 91.8 to 130 m3/h. Upon analysis of the autopsied membrane elements, dense layers of reddish-brown precipitate were accumulated on the lead surfaces, but the end elements were comparatively cleaner. Using these findings, measures to alleviate fouling were determined, including an updated chemical cleaning regimen and supplementing the NF rack with more membranes to lessen the load on individual membranes. A follow up on the plant’s long term operation and performance was reported in 2012 by Al-Hajouri et al. [85], which showed that the plant’s production was optimized by almost 42% when the NF rack was operated with a percentage recovery of 65% at a feed pH of 6 and pressure below 25 bar. Additionally, the SWRO membranes were checked and found to be in excellent condition. Thus, the NF–SWRO plant proved to be feasible and efficient.
5.2. Operational Conditions Optimization
Operational parameters like temperature, pressure, and hydrodynamic conditions can be optimized to mediate membrane fouling and improve the permeate quality [69,85]. Temperature is one of the most important factors that affect the performance and fouling propensity in RO systems. The temperature directly affects several variables such as salt solubility, mass transfer coefficient, supersaturation thresholds, and water viscosity. As the temperature increases, the permeate flux increases; thus, the membranes become more vulnerable to severe fouling due to the water’s decreased viscosity [11,86]. Similarly, organic matter metabolism and growth are augmented at higher temperatures which promote the formation of biofilms on the membrane surface [87]. Nonetheless, the thickness of the formed biofilm was reported to increase with decreasing temperature, so the authors theorized that the effects of CP are more pronounced at lower temperatures such that salt retention substantially drives biofilm accumulation [88]. Another important factor is the feed-side pressure, which can induce fouling if not critically applied. As the pressure increases, CP increases as well due to the accumulation of the particulate matter near the membrane’s surface, which in turn promotes bacterial growth and biofilm formation [69,89]. Likewise, hydrodynamic conditions play a pivotal role in fouling mitigation and control. Parameters such as CFV and flux can greatly impact the membrane’s fouling-propensity. Generally, decreasing the feed’s initial flux and increasing the CFV reduce the chances of fouling occurrence, as high velocities induce high shear rates, which decrease CP near the membrane surface and speed up back diffusion rates of the foulants [69].
Table 6 presents a summary of some of the techniques used to assess membrane integrity and provides a brief description of the general applications, advantages, and limitations of each test. Table 7 presents the advantages and limitations of some conventional pretreatment methods, while Table 8 presents a comparison between conventional and membrane pretreatment techniques.
5.3. Membrane Monitoring and Cleaning
Operational parameters can be used as fouling indicators; such parameters include TMP, permeate flux, and product quality. It is essential to employ in-situ and real-time monitoring techniques to track the performance of RO processes, which helps in developing the necessary maintenance and cleaning protocols for controlling fouling. One way to monitor fouling is by installing sensors on the membrane elements, which can detect and report any changes in the membrane’s topography due to the accumulation of foulants. Typically, these in-situ sensors are configured in a spiral-wound module (SWM); however, such a configuration is impractical for RO membranes considering the process’s high-pressure demands. Therefore, sensors are installed ex-situ where they are contained in a ‘canary cell’ that is mounted into the RO membrane’s train side. Since the canary cell’s hydrodynamics are similar to those in the RO modules, observations about fouling-propensity in the RO train can be deduced from the cell’s conditions.
Ultrasonic time domain reflectometry (UTDR) is a technique that measures the depth of the accumulated foulant layers on the membrane surface by calculating the reflection time of ultrasound (US) waves. Electrical impedance spectroscopy (EIS) is another technique that monitors fouling as a function of changes to the membrane’s electrical properties. The advantage of this technique is that it applies to all types of fouling [5,16,69]. Another real-time monitoring technique is the ex-situ scale observation detector (EX-SOD), which can selectively sense crystallization and scale formation before the onset of permeate flux decline. The detector can identify scaling only by utilizing a high-resolution digital camera and an optical microscope [10]. OCT is an imaging technique that exploits light instead of US waves to reveal information about the fouling layer thickness and structure using Fourier transforms and analysis of the interference spectrum, formed by combining the interference patterns of the reference and the backscattered light beams. These images can be further enhanced by conducting a series of scans to develop 2-dimensional and 3-dimensional depth profiles and models of the fouling layer [16,102].
To reduce the chances of fouling occurrence, membrane cleaning and maintenance routines must be carefully planned and critically scheduled. There is a variety of cleaning methods with different performance efficiencies, measured in terms of membrane resistance reduction and flux recovery. Conventionally, membrane cleaning methods include physical and chemical cleaning schemes. Physical methods can be further divided into [103,104]:
- Sponge ball cleaning: this method is only applicable for tubular modules, and involves scrubbing foulants from the membrane’s surface using a sponge ball made out of polyurethane or another material [105]. The sponge ball cleaning regiment is usually utilized when the membrane is used to treat heavily polluted feedwaters like wastewater and industrial process water [105,106,107].
- Alternative flushing: this method is mostly applicable for the removal of colloidal particles from the membrane’s surface. It entails applying alternative rounds of high-pressure cross-flow water from the permeate side to the feed side and vice versa, which creates turbulence and causes the adsorbed foulants to release from the membrane [107]. It is important to optimize the forward and backward flush times to avoid compromising the membrane’s recovery efficiency, yet ensure complete cleaning cycles of the membrane modules [107,108].
- Backwashing: this method is commonly used in industries as it can retain the membrane’s flux before fouling to a very good extent. It cleans the membrane’s clogged pores by creating a negative pressure gradient across the membrane such that the applied hydraulic pressure on the permeate side exceeds the operating pressure of the module [106]. The flush creates turbulence across the membrane’s surface, loosening the foulants from the surface and out of the pores. Nonetheless, backwashing is not suitable for cleaning irreversible fouling which is characterized by clogging due to the treatment of highly concentrated colloidal solutions [106,109].
- Air flushing: this method, commonly referred to as air sparging, is more suitable for cleaning tubular and flat sheet membranes than fiber and spiral wound modules [107]. It follows the normal flushing procedure except that air is supplied to create bubbles which further augment the produced turbulence, thus enhancing the dislodgement of deposits from the membrane. It can be applied during the filtration process or scheduled periodically, as it is a rapid cleaning method that does not require chemicals and can be easily integrated into an existing membrane system. However, the effectiveness of this cleaning method is limited and the pumping requirements can be costly [110].
- Chemical cleaning: this method involves the use of chemical reagents that react with the foulants and reduce their affinity to the membrane surface, making it easier to remove these deposits. The choice of chemical agents is very important because they should not damage the membrane structure or compromise its integrity in any way. The most commonly used chemicals include acids, bases, surfactants, and chelating agents [5,69]. Low pH cleaners are mostly used to remove colloidal particulates and inorganic scales, while organic foulants and microorganisms are best removed using high pH agents [111]. Hacıfazlıoğlu et al. [112] investigated the effect of chemical cleaning on fouling control in a mini pilot-scale NF and RO system installed at a wastewater treatment plant in the ITOB Industrial Organized Zone located in Izmir/Turkey. The dual-step chemical cleaning (acid cleaning followed by alkaline cleaning) process proposed by the researchers was applied to NF and RO membranes employed for the desalination of MBR effluent discharged from a wastewater treatment plant. The study results showed that the cleaning efficiency increased with increasing cleaning contact time with chemicals.
Some of the more nonconventional techniques for membrane cleaning include the use of the cavitational effect of US waves. When US waves pass through a liquid medium, the alternating pressure waves promote the formation, growth, and subsequent collapse of air bubbles in the insonated media in a phenomenon known as cavitation. The acoustic streaming and shear forces imposed by the cavitation bubbles increase the permeate flux, subsequently minimizing the CP and hence circumventing fouling deposition, which allows extending the period between scheduled cleaning episodes [103,113]. Ultrasonic cleaning is advantageous as it does not require the use of chemicals, can be carried out in-situ or ex-situ, can be easily integrated into an existing filtration system, does not require process downtime, and can be conveniently used with other conventional methods like backwashing. However, the method is most suitable for cleaning the membrane’s surface and is ineffective in unclogging the pores; thus, it needs to be combined with other cleaning regimens. In addition, it can cause long-term detrimental damage to the membrane’s structural integrity, reducing its lifespan [114,115].
Several parameters can affect the US cleaning efficiency, including US frequency, temperature, pressure, and CFV [106]. Generally, better cleaning efficiency is achieved when lower US frequencies and lower TMPs are used [116]. Moreover, higher sonication powers and CFVs enhance the sonication cleaning results linearly [117]. Several studies investigated the relationship between temperature and US cleaning efficiency and reported conflicting results. These varying results were attributed to foulant properties (i.e., diffusivity and solubility) and the cavitation-driven effects in the solution being temperature-dependent. To elaborate, decreasing the temperature increases the cavitational threshold, i.e., violent collapse cavitation occurs at lower temperatures; and decreases the viscosity, which limits bubbles nucleation in solution. Thus, such complicated effects make it difficult to postulate standard relationships between the effects of temperature on the cleaning efficiency [115,116,118].
5.4. Surface Modification and Novel Membrane Materials
Membrane surface modification and functionalization (altering the membrane’s surface properties such that it becomes less susceptible to fouling) is a standard tactic for fouling mitigation. Membrane surface smoothness and electrical charge are two of the most commonly modified surface characteristics. Smoother membranes have a lower propensity to experience fouling as the surface does not allow for the deposition or adhesion of the foulants into the grooves or valleys. However, if the foulants have opposite charges to the membrane’s surface (i.e., typically negatively charged RO membranes and positively charged multivalent ions), electrostatic interactions inducing more fouling events will occur. Hence, it is necessary to intervene by coating or grafting the membrane’s surface with noble non-interacting materials to hinder such unfavorable interactions [5,69,119].
5.4.1. Physical Surface Modification
A common technique to improve the antifouling characteristics of RO membranes involves coating the surface with a sacrificial layer that acts as a protective lining to suppress the accumulation and adsorption affinity of the foulants towards the membrane surface. It can be carried out in two ways, either coating-to or coating-from [120,121]. Several coatings have been studied. For instance, Son et al. [122] added two polyelectrolyte protective layers, positively charged poly (diallyldimethylammonium chloride) (PDDA) and negatively charged poly(sodium-4-styrenesulfonate) (PSS), to a commercial RO membrane. Five bilayered coatings were applied to the membrane with intermediate deionized water flushing to remove any unbound electrolytes. To evaluate the coatings’ efficiency in reducing fouling and impeding flux decline events, a series of dead-end filtration tests were carried out using alginate as a foulant in synthetic brackish water. The coated membrane achieved an average permeate flux of about 16 Lm−2h−1, whereas the noncoated membrane’s flux was about 13 Lm−2h−1 which showed that the approach was successful. Li et al. [123] used the layer-by-layer (LbL) method to fabricate a single bilayer polymeric polyelectrolyte membrane and tested its performance in a separation test where BSA was used as a foulant in a brine feed. The study concluded that the salt rejection efficacy increased by almost 2% upon using the modified membrane and showed enhanced antifouling characteristics. Using a similar approach, Halakoo and Feng [124] used LbL spraying to alter the surface of TFC polyamide (PA) membranes by adding cationic polyethyleneimine (PEI) and anionic graphene oxide (GO) particles into the membrane matrix. The modified membrane was tested for desalination of aqueous solutions containing NaCl, Na2SO4, MgSO4, and MgCl2 salts, and salt rejection as high as 99.9% was obtained for all the tested salts at various temperatures and feed concentrations.
Another study by Zhang et al. [125] modified the surface of a TFC membrane with sulfonated polyvinyl alcohol (SPVA), which was produced via the esterification of polyvinyl alcohol (PVA) with sulfuric acid. Several characterization tests were carried out including, atomic force microscopy (AFM), SEM, and streaming potential measurements. The modified membrane showed superior antifouling performance and achieved a salt rejection percentage of 99.17% when tested with BSA as a model foulant. Falath et al. [126] synthesized PVA-RO membranes conjugated with Gum Arabic (GA). The results of this study showed that the membrane PVA-GA-5 containing 0.9 wt% GA increased salt rejection and antibacterial properties by 98%, and chlorine resistance by 83%. Likewise, Anis et al. [127] incorporated nano zeolite-Y into RO PVA-networked cellulose membranes at loadings from 0.05 to 1.0 wt%. It was concluded that the best formulation was that with 0.5 wt% nano zeolite inclusion, as the membrane’s performance was drastically enhanced, achieving a flux improvement of almost 34% and a salt rejection percentage that reached 99.5%. Shao et al. [128] used spin-coating to assemble GO layers onto the surface of a PA-TFC-RO membrane. The modified membrane showed improved chlorine resistance as the number of GO layers increased and achieved a salt rejection of 75% after 16-hr chlorine exposure in an ethanol solution.
Similarly, Nurkhamidah et al. [129] investigated the modification of cellulose acetate/polyethylene glycol (CA/PEG) membranes with GO nanosheets at compositions ranging from 0.0025 to 0.0125 wt%. The membranes were characterized using SEM, contact angle analysis, dynamic mechanical analysis (DMA), and Fourier transform infrared (FTIR) spectroscopy. It was concluded that the membrane with the best performance was the one supplemented with 0.01 wt% GA, which achieved a salt rejection of 37%. Gholami et al. [130] fabricated TFC-RO membranes coated with polyethylene glycol diacrylate (PEGDA) and tested their chlorine resistance and salt rejection performance. The modified membranes with 30% PEGDA coatings rejected more chlorine than the unmodified ones, as the PEGDA-TFC-RO membrane retained 2.42% chlorine on its surface while the bare TFC-RO retained 4.04%. Another study by Zhang et al. [131] chelated PEG onto the PA-RO membrane surface and found that the modified membrane achieved a salt rejection percentage of 99.04%, while the bare one achieved 97.8%. Furthermore, the PEG-modified membrane exhibited improved organic fouling-resistance. After 12 h of BSA fouling, the novel membrane lost about 19% of its initial flux, whereas the uncoated membrane lost around 40%. A key limitation to using the physical modification methods is the eventual degradation of the modified RO membranes’ antifouling properties, as the coatings are held to the membrane’s surface by weak van der Waals forces, hydrogen bonding, or electrostatic interactions which wane over prolonged periods of operation.
5.4.2. Chemical Surface Modification
Chemical surface modification methods tailor membrane surfaces with desired functions via means of chemical reagents and interactions [10,69,132]. The most common chemical coating techniques investigated by researchers are:
- Hydrophilization treatment: in this method, an antifouling lining is hydrophilized onto the membrane’s surface through chemical reactions with protic acids (i.e., hydrofluoric, hydrochloric, sulfuric, and nitric acids), ethanol, or 2-propanol [10,132,133]. Miyamoto et al. [134] investigated the blending of polyvinylpyrrolidone (PVP) into a polysulfone (PSf) membrane. PSf membranes are hydrophobic and are susceptible to fouling by NOM. Therefore, a hydrophilization treatment is conducted using non-solvent-induced phase separation, in which PVP is added to the PSf membrane.
- Radical grafting: in this method, free radicals are produced and then reacted with the membrane’s monomers to graft its surface. Wei et al. [135] conducted a radical grafting study in which they used 3-allyl-5,5-dimethylhydantoin (ADMH) as the grafting monomer. The modified membrane was tested for biofouling resistance in a microbial-cell suspension, where it showed augmented microbial adsorption rejection and enhanced flux rates compared to the unmodified membrane. Another study carried out by Isawi et al. [136] investigated grafting RO membranes with ZnO nanoparticles (NPs). The ZnO-NPs-grafted membrane achieved improved salt, dissolved bivalent ions (i.e., Ca2+ and SO42−), and monovalent ions (Cl− and Na+) rejection percentages of 97%, 99%, and 98%, respectively.
- Chemical coupling: this method entails reacting the active free carboxylic acid and primary amine groups on the surface of the PA-RO with chemical reagents to induce antifouling behaviors [132,137]. Hu et al. [138] covalently attached PVA to the surface of PA-TFC RO membranes. The covalent attachment of PVA resulted in improved surface hydrophilicity, enhanced salt rejection ability, and a slightly increased surface roughness. Additionally, the modification improved the membrane antifouling characteristics to a variety of foulants, including BSA and dodecyltrimethyl ammonium bromide.
- Plasma treatment: this method is further classified into plasma polymerization and plasma-induced polymerization. In the former, plasma is used to induce the accumulation of a layer of polymers onto the surface of TFC and PA-RO membranes. While, in the latter, plasma initiates the activation of oxides and/or hydroxides on the membrane’s surface, which are then involved in other polymerization methods [132,139]. A study by Safarpour et al. [140] used interfacial polymerization to synthesize TFC-RO membranes and modified them by adding dimethyl sulfoxide and glycerol. The modified membranes were characterized using SEM, FTIR, and contact angle measurements. It was reported that using dimethyl sulfoxide and glycerol as additives increased the permeate flux, surface roughness, and hydrophilicity of the membranes while maintaining the same salt rejection performance. Jahangiri et al. [141] applied the dielectric barrier discharge (DBD) plasma method to enhance the antifouling characteristics of a PA-TFC-RO membrane. The novel membrane was characterized using SEM, attenuated total reflectance FITR (ATR-FITR), and contact angle measurements, which revealed changes to the membrane’s surface morphology. ATR-FITR images showed hydrogen bonding on the surface of the modified membrane, and the contact angle measurement showed that the hydrophilicity increased, leading to a boost in surface roughness. The modified membranes had improved performance in terms of salt rejection, permeate flux, and BSA filtration. Another study by Hirsch et al. [142] modified the surface of TFC-RO membranes by combining three methods, namely, plasma activation, plasma bromination, and surface-initiated atom transfer radical polymerization (si-ATRP). Although the synthesized membranes suffered from unstable coating adhesion, the highest biofilm reduction reached was 85.4%, which is a significant enhancement.
It is important to note that most surface modifications are restricted to the control of fouling that occurs on the membrane surface. Therefore, for some membrane processes, such as forward osmosis (FO), the modification should also include the membrane porous support layer in order for the internal fouling mitigation to be effective. In addition, a basic requirement for MD processes is that the membrane material should be intrinsically hydrophobic to prevent pore wetting. However, membrane fouling is a big concern for a highly hydrophobic membrane surface. Therefore, the feasibility of the modification methods should be carefully gauged based on various aspects [69,73,143].
5.4.3. Novel Membrane Materials
Recent research ventures have been focused on developing new, more fouling-resistant formulations for the synthesis of RO membranes. Potential materials include nanoporous graphene, carbon nanotubes (CNTs), zwitterionic materials, and metal oxide nanoparticles [5,10,137,144]. Polymer nanocomposite membranes are modifications of conventional polymeric membranes with nanomaterials dispersed within their polymer lattices. Polymer nanocomposite membranes are of two types, thin-film nanocomposite (TFNC) membranes and blended nanocomposite membranes. In TFNC membranes, the nanoparticles generate a thin film on the exterior of the membrane through dip-coating techniques or deposition on the surface of the membrane utilizing the pressure, whereas, for blended nanocomposite membranes, the polymer and the nanoparticles are dispersed in a casting solution during the membrane casting process [144]. Farahbakhsh et al. [145] fabricated PA-RO membranes blended with oxidized multiwalled carbon nanotubes (MWCNTs). It was concluded that the permeate flux and hydrophilicity were enhanced by increasing the concentration of the MWCNTs up to 0.005 wt%. The evaluation of fouling behavior using a BSA/salt solution showed that the membranes with all concentrations of MWCNTs had improved antifouling characteristics, compared to the unmodified ones. Rajakumaran et al. [146] analyzed the impact of incorporating nanocomposites into a polymeric RO membrane. The synthesized RO membrane consisted of GO incorporated with amino-functionalized ZnO. The best formulation was obtained with 0.02wt% GO-ZnO, as the permeate flux, permeability and hydrophilicity showed significant improvement. Fathizadeh et al. [147] supplemented PA-RO membranes with nitrogen-doped GOQD (N-GOQD) particles. The study found out that adding 0.02 wt%/v% of N-GOQD particles into the membrane tripled its permeability and increased its hydrophilicity and the effective surface area, while maintaining a high salt rejection performance. Nanoparticles and zwitterionic polymers are amongst the most famous and sought-after materials because of their markable antifouling properties [5]. Although novel membrane materials provide a promising solution to fouling issues, these membranes are not yet developed to the point of commercialization. For instance, the main challenge in the commercialization of TFNC membranes is the leaching out of nanoparticles into the retentate and permeate streams which compromises the safety regulations of drinking water. To limit the risk of leaching, the TFNC membrane could be pre-washed with the aim that nanoparticles lying freely on the surface can be separated. Another concern is the agglomeration of nanoparticles leading to the uneven distribution of nanoparticles on the membrane, which in turn compromises the membrane’s salt rejection capability. Surface modification can be used to mitigate this issue; however, that would create additional costs that would negatively impact the practicality of this technique. The health and environmental risk associated with the accidental discharge of nanoparticles are still a great concern. Further extensive studies are required to determine the safety, the economic feasibility of their mass production as well as their applicability in large-scale operations [144].
6. Conclusions
RO membrane processes are attractive technologies that have been widely used in desalination. A major challenge to this technology is membrane fouling. Membrane fouling depends on several factors including, the type of membrane material and membrane surface characteristics. This paper presented an overview of the different kinds of membrane fouling, the factors influencing fouling-propensity, tactics for the prediction of membrane fouling, diagnostics techniques for evaluating membrane integrity and fouling behaviors, as well as fouling mitigation strategies aimed at controlling and managing fouling occurrences. Conventional pretreatment of the feedwater before introducing it into the RO unit is a common practice; however, non-conventional methods have become more sought-after due to their enhanced efficiency, greener environmental footprint, flexible integration into existing systems, and competitive cost-benefits outcomes. Other techniques such as pH adjustment, chemical cleaning, backwashing have also been considered, with the objective of reducing the effects of CP and the foulants’ adsorption affinity towards the membrane surface [72,167]. Lastly, the ventures into novel materials for fabricating RO membranes with advanced antifouling characteristics were presented. Such membranes are anticipated to significantly cut RO technology costs. Therefore, the production of practical, stable, and fouling-resistant membranes remains to be a challenge, and more optimization and developmental studies need to be put forward. Regardless of the promising potentials of the novel formulations, many issues still need to be addressed, including the cost efficiency of the materials, feasibility of scale-up, and the longevity and durability of the novel membranes [10,72,81,167]. Therefore, the search for the optimum operating conditions, fabrication materials, grafting additions, and supplements is ongoing [81].
Author Contributions
Writing—original draft preparation, N.A. and W.A.; writing—review and editing, N.D. and G.H. All authors have read and agreed to the published version of the manuscript.
Funding
This research was funded by the Dana Gas Endowed Chair for Chemical Engineering.
Institutional Review Board Statement
Not applicable.
Informed Consent Statement
Not applicable.
Data Availability Statement
No new data were created or analyzed in this study. Data sharing is not applicable to this article.
Acknowledgments
We acknowledge the financial support provided by the American University of Sharjah Faculty Research Grants and the Dana Gas Endowed Chair for Chemical Engineering.
Conflicts of Interest
The authors declare no conflict of interest.
References
- Prihasto, N.; Liu, Q.F.; Kim, S.H. Pre-treatment strategies for seawater desalination by reverse osmosis system. Desalination 2009, 249, 308–316. [Google Scholar] [CrossRef]
- Henthorne, L.; Boysen, B. State-of-the-art of reverse osmosis desalination pretreatment. Desalination 2015, 356, 129–139. [Google Scholar] [CrossRef]
- Al-Juboori, R.A.; Yusaf, T. Biofouling in RO system: Mechanisms, monitoring and controlling. Desalination 2012, 302, 1–23. [Google Scholar] [CrossRef]
- Ochando-Pulido, J.M.; Stoller, M.; Di Palma, L.; Martínez-Ferez, A. On the optimization of a flocculation process as fouling inhibiting pretreatment on an ultrafiltration membrane during olive mill effluents treatment. Desalination 2016, 393, 151–158. [Google Scholar] [CrossRef]
- Jiang, S.; Li, Y.; Ladewig, B.P. A review of reverse osmosis membrane fouling and control strategies. Sci. Total Environ. 2017, 595, 567–583. [Google Scholar] [CrossRef]
- Guo, W.; Ngo, H.H.; Li, J. A mini-review on membrane fouling. Bioresour. Technol. 2012, 122, 27–34. [Google Scholar] [CrossRef]
- Field, R. Fundamentals of fouling. In Membranes for Water Treatment; Peinemann, K.-V., Pereira Nunes, S., Eds.; Wiley-VCH: Weinheim, Germany, 2010; Volume 4, pp. 1–23. [Google Scholar]
- Colloid|Definition of Colloid by Merriam-Webster. Available online: https://www.merriam-webster.com/dictionary/colloid (accessed on 29 January 2020).
- Yiantsios, S.G.; Sioutopoulos, D.; Karabelas, A.J. Colloidal fouling of RO membranes: An overview of key issues and efforts to develop improved prediction techniques. Desalination 2005, 183, 257–272. [Google Scholar] [CrossRef]
- Qasim, M.; Badrelzaman, M.; Darwish, N.N.; Darwish, N.A.; Hilal, N. Reverse osmosis desalination: A state-of-the-art review. Desalination 2019, 459, 59–104. [Google Scholar] [CrossRef] [Green Version]
- Tang, C.Y.; Chong, T.H.; Fane, A.G. Colloidal interactions and fouling of NF and RO membranes: A review. Adv. Colloid Interface Sci. 2011, 164, 126–143. [Google Scholar] [CrossRef]
- Kalafatakis, S.; Zarebska, A.; Lange, L.; Hélix-Nielsen, C.; Skiadas, I.V.; Gavala, H.N. Biofouling mitigation approaches during water recovery from fermented broth via forward osmosis. Membranes 2020, 10, 307. [Google Scholar] [CrossRef]
- Maddah, H.; Chogle, A. Biofouling in reverse osmosis: Phenomena, monitoring, controlling and remediation. Appl. Water Sci. 2017, 7, 2637–2651. [Google Scholar] [CrossRef] [Green Version]
- Donlan, R.M. Biofilms: Microbial life on surfaces. Emerg. Infect. Dis. 2002, 8, 881–890. [Google Scholar] [CrossRef]
- Chai-Hoon, C.K.O.O.; Mohammad, A.; Suja, F.; Zainal, M. Use and Development of Fouling Index in Predicting Membrane Fouling. Sep. Purif. Rev. 2013, 42. [Google Scholar] [CrossRef]
- Sim, L.N.; Chong, T.H.; Taheri, A.H.; Sim, S.T.V.; Lai, L.; Krantz, W.B.; Fane, A.G. A review of fouling indices and monitoring techniques for reverse osmosis. Desalination 2018, 434, 169–188. [Google Scholar] [CrossRef]
- Rudolph, G.; Virtanen, T.; Ferrando, M.; Güell, C.; Lipnizki, F.; Kallioinen, M. A review of in situ real-time monitoring techniques for membrane fouling in the biotechnology, biorefinery and food sectors. J. Membr. Sci. 2019, 588, 117221. [Google Scholar] [CrossRef]
- Ruigómez, I.; Vera, L.; González, E.; Rodríguez-Sevilla, J. Pilot plant study of a new rotating hollow fibre membrane module for improved performance of an anaerobic submerged MBR. J. Membr. Sci. 2016, 514, 105–113. [Google Scholar] [CrossRef]
- Melián-Martel, N.; Sadhwani Alonso, J.J.; Ruiz-García, A. Combined silica and sodium alginate fouling of spiral-wound reverse osmosis membranes for seawater desalination. Desalination 2018, 439, 25–30. [Google Scholar] [CrossRef]
- Sioutopoulos, D.; Karabelas, A.; Mappas, V. Membrane fouling due to protein—Polysaccharide mixtures in dead-end ultrafiltration; the effect of permeation flux on fouling resistance. Membranes 2019, 9, 21. [Google Scholar] [CrossRef] [Green Version]
- Hernández, M.; Melián-Martel, N.; Ruiz-García, A.; Río-Gamero, B. Del Fouling characterization during initial stage of cross-flow ultrafiltration. J. Water Process Eng. 2020, 38, 101611. [Google Scholar] [CrossRef]
- Neubrand, W.; Vogler, S.; Ernst, M.; Jekel, M. Lab and pilot scale investigations on membrane fouling during the ultrafiltration of surface water. Desalination 2010, 250, 968–972. [Google Scholar] [CrossRef]
- Kim, L.H.; Nava-Ocampo, M.; van Loosdrecht, M.C.M.; Kruithof, J.C.; Vrouwenvelder, J.S. The membrane fouling simulator: Development, application, and early-warning of biofouling in RO treatment. Desalin. Water Treat. 2018, 126, 1–23. [Google Scholar] [CrossRef] [Green Version]
- Vrouwenvelder, J.S.; van Paassen, J.A.M.; Wessels, L.P.; van Dam, A.F.; Bakker, S.M. The Membrane Fouling Simulator: A practical tool for fouling prediction and control. J. Membr. Sci. 2006, 281, 316–324. [Google Scholar] [CrossRef]
- Massons-Gassol, G.; Gilabert-Oriol, G.; Johnson, J.; Arrowood, T. Comparing Biofouling Development in Membrane Fouling Simulators and Spiral-Wound Reverse Osmosis Elements Using River Water and Municipal Wastewater. Ind. Eng. Chem. Res. 2017, 56, 11628–11633. [Google Scholar] [CrossRef]
- B.V. Convergence Industry. Membrane Fouling Simulator. Available online: https://www.con-vergence.com/product/membrane-fouling-simulator/ (accessed on 27 April 2021).
- Bagheri, M.; Akbari, A.; Mirbagheri, S.A. Advanced control of membrane fouling in filtration systems using artificial intelligence and machine learning techniques: A critical review. Process Saf. Environ. Prot. 2019, 123, 229–252. [Google Scholar] [CrossRef]
- Aidan, A.; Abdel-Jabbar, N.; Ibrahim, T.H.; Nenov, V.; Mjalli, F. Neural network modeling and optimization of scheduling backwash for membrane bioreactor. Clean Technol. Environ. Policy 2008, 10, 389–395. [Google Scholar] [CrossRef]
- Curcio, S.; Calabrò, V.; Iorio, G. Reduction and control of flux decline in cross-flow membrane processes modeled by artificial neural networks. J. Membr. Sci. 2006, 286, 125–132. [Google Scholar] [CrossRef]
- Li, C.; Wang, X. Application of MBR Membrane Flux Prediction Based on Elman Neural Network. DEStech Trans. Eng. Technol. Res. 2017. [Google Scholar] [CrossRef] [Green Version]
- Hedayati Moghaddam, A.; Hazrati, H.; Sargolzaei, J.; Shayegan, J. Assessing and simulation of membrane technology for modifying starchy wastewater treatment. Appl. Water Sci. 2017, 7, 2753–2765. [Google Scholar] [CrossRef] [Green Version]
- Ruiz-García, A.; Melián-Martel, N.; Nuez, I. Short review on predicting fouling in RO desalination. Membranes 2017, 7, 62. [Google Scholar] [CrossRef] [Green Version]
- ASTM D4189—07(2014) Standard Test Method for Silt Density Index (SDI) of Water. Available online: https://www.astm.org/Standards/D4189.htm (accessed on 21 June 2020).
- Alhadidi, A.; Kemperman, A.J.B.; Schippers, J.C.; Blankert, B.; Wessling, M.; van der Meer, W.G.J. SDI normalization and alternatives. Desalination 2011, 279, 390–403. [Google Scholar] [CrossRef]
- Alhadidi, A.M.M.; Blankert, B.; Kemperman, A.; Schurer, R.; Schippers, J.; Wessling, M. Limitations, improvements and alternatives of the silt density index. Desalin. Water Treat. 2012, 51, 1–10. [Google Scholar] [CrossRef]
- Schippers, J.C.; Verdouw, J. The modified fouling index, a method of determining the fouling characteristics of water. Desalination 1980, 32, 137–148. [Google Scholar] [CrossRef]
- Boerlage, S.F.E.; Kennedy, M.D.; Bonne, P.A.C.; Galjaard, G.; Schippers, J.C. Prediction of flux decline in membrane systems due to particulate fouling. Desalination 1997, 113, 231–233. [Google Scholar] [CrossRef]
- Boerlage, S.F.E.; Kennedy, M.D.; Dickson, M.R.; El-Hodali, D.E.Y.; Schippers, J.C. The modified fouling index using ultrafiltration membranes (MFI-UF): Characterisation, filtration mechanisms and proposed reference membrane. J. Membr. Sci. 2002, 197, 1–21. [Google Scholar] [CrossRef]
- Cai, B.J.; Baudin, I.; Ng, H.Y. A modified fouling index (MFI40) and fouling predicting approach for ultrafiltration of secondary effluents. J. Water Reuse Desalin. 2019, 9, 67–82. [Google Scholar] [CrossRef] [Green Version]
- Mirzabeygi, M.; Naji, M.; Yousefi, N.; Shams, M.; Biglari, H.; Mahvi, A.H. Evaluation of corrosion and scaling tendency indices in water distribution system: A case study of Torbat Heydariye, Iran. Desalin. Water Treat. 2016, 57, 25918–25926. [Google Scholar] [CrossRef]
- Leitz, F.; Guerra, K. Water Chemistry Analysis for Water Conveyance, Storage, and Desalination Projects Manuals and Standards Program; US Department of the Interior, Bureau of Reclamation: Denver, CO, USA, 2013.
- Jepsen, K.L.; Bram, M.V.; Pedersen, S.; Yang, Z. Membrane fouling for produced water treatment: A review study from a process control perspective. Water 2018, 10, 847. [Google Scholar] [CrossRef] [Green Version]
- Wilf, M.; Klinko, K. Performance of commercial seawater membranes. Desalination 1994, 96, 465–478. [Google Scholar] [CrossRef]
- Chen, K.L.; Song, L.; Ong, S.L.; Ng, W.J. The development of membrane fouling in full-scale RO processes. J. Membr. Sci. 2004, 232, 63–72. [Google Scholar] [CrossRef]
- Duclos-Orsello, C.; Li, W.; Ho, C.C. A three mechanism model to describe fouling of microfiltration membranes. J. Membr. Sci. 2006, 280, 856–866. [Google Scholar] [CrossRef]
- Mondal, S.; De, S. A fouling model for steady state crossflow membrane filtration considering sequential intermediate pore blocking and cake formation. Sep. Purif. Technol. 2010, 75, 222–228. [Google Scholar] [CrossRef]
- Chang, E.E.; Yang, S.Y.; Huang, C.P.; Liang, C.H.; Chiang, P.C. Assessing the fouling mechanisms of high-pressure nanofiltration membrane using the modified Hermia model and the resistance-in-series model. Sep. Purif. Technol. 2011, 79, 329–336. [Google Scholar] [CrossRef]
- Virtanen, T.; Reinikainen, S.P.; Lahti, J.; Mänttäri, M.; Kallioinen, M. Visual tool for real-time monitoring of membrane fouling via Raman spectroscopy and process model based on principal component analysis. Sci. Rep. 2018, 8. [Google Scholar] [CrossRef]
- Jolliffe, I.T.; Cadima, J. Principal component analysis: A review and recent developments. Philos. Trans. R. Soc. A Math. Phys. Eng. Sci. 2016, 374, 20150202. [Google Scholar] [CrossRef] [PubMed]
- Koonani, H.; Amirinejad, M. Combined three mechanisms models for membrane fouling during microfiltration. J. Membr. Sci. Res. 2019, 5, 274–282. [Google Scholar]
- Ruiz-García, A.; Nuez, I. Long-term performance decline in a brackish water reverse osmosis desalination plant. Predictive model for the water permeability coefficient. Desalination 2016, 397, 101–107. [Google Scholar] [CrossRef] [Green Version]
- Corbatón-Báguena, M.J.; Vincent-Vela, M.C.; Gozálvez-Zafrilla, J.M.; Álvarez-Blanco, S.; Lora-García, J.; Catalán-Martínez, D. Comparison between artificial neural networks and Hermia’s models to assess ultrafiltration performance. Sep. Purif. Technol. 2016, 170, 434–444. [Google Scholar] [CrossRef] [Green Version]
- Barello, M.; Manca, D.; Patel, R.; Mujtaba, I.M. Neural network based correlation for estimating water permeability constant in RO desalination process under fouling. Desalination 2014, 345, 101–111. [Google Scholar] [CrossRef] [Green Version]
- Park, S.; Baek, S.S.; Pyo, J.C.; Pachepsky, Y.; Park, J.; Cho, K.H. Deep neural networks for modeling fouling growth and flux decline during NF/RO membrane filtration. J. Membr. Sci. 2019, 587. [Google Scholar] [CrossRef]
- Lim, S.J.; Kim, Y.M.; Park, H.; Ki, S.; Jeong, K.; Seo, J.; Chae, S.H.; Kim, J.H. Enhancing accuracy of membrane fouling prediction using hybrid machine learning models. Desalin. Water Treat. 2019, 146, 22–28. [Google Scholar] [CrossRef]
- Han, H.G.; Zhang, H.J.; Liu, Z.; Qiao, J.F. Data-driven decision-making for wastewater treatment process. Control Eng. Pract. 2020, 96, 104305. [Google Scholar] [CrossRef]
- Koo, C.H.; Mohammad, A.W.; Suja’, F.; Meor Talib, M.Z. Review of the effect of selected physicochemical factors on membrane fouling propensity based on fouling indices. Desalination 2012, 287, 167–177. [Google Scholar] [CrossRef]
- Sim, L.N.; Ye, Y.; Chen, V.; Fane, A.G. Crossflow Sampler Modified Fouling Index Ultrafiltration (CFS-MFIUF)-An alternative Fouling Index. J. Membr. Sci. 2010, 360, 174–184. [Google Scholar] [CrossRef]
- Langelier-Explanation. Available online: https://www.lenntech.com/ro/index/langelier-explanation.htm (accessed on 3 February 2020).
- Yu, Y.; Lee, S.; Hong, K.; Hong, S. Evaluation of membrane fouling potential by multiple membrane array system (MMAS): Measurements and applications. J. Membr. Sci. 2010, 362, 279–288. [Google Scholar] [CrossRef]
- Ait Messaoudene, N.; Naceur, M.W. The Modified Fouling Index Revisited: Proposal of a Novel Dimensionless Fouling Index for Membranes—IJERT. Int. J. Eng. Res. Technol. 2014, 3, 193–198. [Google Scholar]
- Voutchkov, N. Diagnostics of Membrane Fouling and Scaling. In Pretreatment for Reverse Osmosis Desalination; Elsevier: Amsterdam, The Netherlands, 2017; pp. 43–64. [Google Scholar]
- Vrouwenvelder, J.S.; van der Kooij, D. Diagnosis of fouling problems of NF and RO membrane installations by a quick scan. Desalination 2003, 153, 121–124. [Google Scholar] [CrossRef]
- Vrouwenvelder, J.S.; Kappelhof, J.W.N.M.; Heijman, S.G.J.; Schippers, J.C.; van der Kooij, D. Tools for fouling diagnosis of NF and RO membranes and assessment of the fouling potential of feed water. Desalination 2003, 157, 361–365. [Google Scholar] [CrossRef]
- Leitz, F. Membrane Element Autopsy Manual. Security 1996, 157, 361–365. [Google Scholar]
- Membrane Autopsy & Analysis—MF, UF, NF & RO Membrane Inspection. Available online: https://www.pwtchemicals.com/services/membrane-autopsy/ (accessed on 12 February 2020).
- Ostarcevic, E.R.; Jacangelo, J.; Gray, S.R.; Cran, M.J. Current and emerging techniques for high-pressure membrane integrity testing. Membranes 2018, 8, 60. [Google Scholar] [CrossRef] [Green Version]
- Schipolowski, T.; Jezowska, A.; Wozny, G. Reliability of membrane test cell measurements. Desalination 2006, 189, 71–80. [Google Scholar] [CrossRef]
- Goh, P.S.; Lau, W.J.; Othman, M.H.D.; Ismail, A.F. Membrane fouling in desalination and its mitigation strategies. Desalination 2018, 425, 130–155. [Google Scholar] [CrossRef]
- Voutchkov, N. Membrane Foulants and Saline Water Pretreatment. In Pretreatment for Reverse Osmosis Desalination; Elsevier: Amsterdam, The Netherlands, 2017; pp. 11–41. [Google Scholar]
- Jamaly, S.; Darwish, N.N.; Ahmed, I.; Hasan, S.W. A short review on reverse osmosis pretreatment technologies. Desalination 2014, 354, 30–38. [Google Scholar] [CrossRef]
- Kavitha, J.; Rajalakshmi, M.; Phani, A.R.; Padaki, M. Pretreatment processes for seawater reverse osmosis desalination systems—A review. J. Water Process Eng. 2019, 32, 100926. [Google Scholar] [CrossRef]
- Lee, W.J.; Ng, Z.C.; Hubadillah, S.K.; Goh, P.S.; Lau, W.J.; Othman, M.H.D.; Ismail, A.F.; Hilal, N. Fouling mitigation in forward osmosis and membrane distillation for desalination. Desalination 2020, 480, 114338. [Google Scholar] [CrossRef]
- Ebrahim, S.; Bou-Hamed, S.; Abdel-Jawad, M.; Burney, N. Microfiltration system as a pretreatment for RO units: Technical and economic assessment. Desalination 1997, 109, 165–175. [Google Scholar] [CrossRef]
- Lee, J.; Oh, B.S.; Kim, S.; Kim, S.J.; Hong, S.K.; Kim, I.S. Fate of Bacillus sp. and Pseudomonas sp. isolated from seawater during chlorination and microfiltration as pretreatments of a desalination plant. J. Membr. Sci. 2010, 349, 208–216. [Google Scholar] [CrossRef]
- Jeong, S.; Choi, Y.J.; Nguyen, T.V.; Vigneswaran, S.; Hwang, T.M. Submerged membrane hybrid systems as pretreatment in seawater reverse osmosis (SWRO): Optimisation and fouling mechanism determination. J. Membr. Sci. 2012, 411–412, 173–181. [Google Scholar] [CrossRef]
- Hakami, M.W.; Alkhudhiri, A.; Al-Batty, S.; Zacharof, M.P.; Maddy, J.; Hilal, N. Ceramic microfiltration membranes in wastewater treatment: Filtration behavior, fouling and prevention. Membranes 2020, 10, 248. [Google Scholar] [CrossRef] [PubMed]
- Chua, K.T.; Hawlader, M.N.A.; Malek, A. Pretreatment of seawater: Results of pilot trials in Singapore. Desalination 2003, 159, 225–243. [Google Scholar] [CrossRef]
- Gu, H.; Rahardianto, A.; Gao, L.X.; Caro, X.P.; Giralt, J.; Rallo, R.; Christofides, P.D.; Cohen, Y. Fouling indicators for field monitoring the effectiveness of operational strategies of ultrafiltration as pretreatment for seawater desalination. Desalination 2018, 431, 86–99. [Google Scholar] [CrossRef]
- Monnot, M.; Laborie, S.; Cabassud, C. Granular activated carbon filtration plus ultrafiltration as a pretreatment to seawater desalination lines: Impact on water quality and UF fouling. Desalination 2016, 383, 1–11. [Google Scholar] [CrossRef]
- Anis, S.F.; Hashaikeh, R.; Hilal, N. Reverse osmosis pretreatment technologies and future trends: A comprehensive review. Desalination 2019, 452, 159–195. [Google Scholar] [CrossRef] [Green Version]
- Talaeipour, M.; Nouri, J.; Hassani, A.H.; Mahvi, A.H. An investigation of desalination by nanofiltration, reverse osmosis and integrated (hybrid NF/RO) membranes employed in brackish water treatment. J. Environ. Health Sci. Eng. 2017, 15. [Google Scholar] [CrossRef] [Green Version]
- Hassan, A.M.; Farooque, A.M.; Jamaluddin, A.T.M.; Al-Amoudi, A.S.; Al-Sofi, M.A.; Al-Rubaian, A.F.; Kither, N.M.; Al-Tisan, I.A.R.; Rowaili, A. Demonstration plant based on the new NF-SWRO process. Desalination 2000, 131, 157–171. [Google Scholar] [CrossRef]
- Al-Amoudi, A.S.; Farooque, A.M. Performance restoration and autopsy of NF membranes used in seawater pretreatment. Desalination 2005, 178, 261–271. [Google Scholar] [CrossRef]
- Al-Hajouri, A.A.; Al-Amoudi, A.S.; Farooque, A.M. Long term experience in the operation of nanofiltration pretreatment unit for seawater desalination at SWCC SWRO plant. Desalin. Water Treat. 2013, 51, 1861–1873. [Google Scholar] [CrossRef]
- Shirazi, S.; Lin, C.J.; Chen, D. Inorganic fouling of pressure-driven membrane processes—A critical review. Desalination 2010, 250, 236–248. [Google Scholar] [CrossRef]
- Ashfaq, M.Y.; Al-Ghouti, M.A.; Da’na, D.A.; Qiblawey, H.; Zouari, N. Investigating the effect of temperature on calcium sulfate scaling of reverse osmosis membranes using FTIR, SEM-EDX and multivariate analysis. Sci. Total Environ. 2020, 703, 134726. [Google Scholar] [CrossRef]
- Farhat, N.M.; Vrouwenvelder, J.S.; Van Loosdrecht, M.C.M.; Bucs, S.S.; Staal, M. Effect of water temperature on biofouling development in reverse osmosis membrane systems. Water Res. 2016, 103, 149–159. [Google Scholar] [CrossRef] [Green Version]
- Saeki, D.; Karkhanechi, H.; Matsuura, H.; Matsuyama, H. Effect of operating conditions on biofouling in reverse osmosis membrane processes: Bacterial adhesion, biofilm formation, and permeate flux decrease. Desalination 2016, 378, 74–79. [Google Scholar] [CrossRef]
- Dupont. Troubleshooting: Membrane Element Evaluation: Vacuum Decay Test Tech Manual; DuPont de Nemours Inc.: Wilmington, DE, USA, 2019. [Google Scholar]
- Niewersch, C.; Rieth, C.; Hailemariam, L.; Oriol, G.G.; Warczok, J. Reverse osmosis membrane element integrity evaluation using imperfection model. Desalination 2020, 476, 114175. [Google Scholar] [CrossRef]
- Chapman, M.; Linton, W.K. Methods for Monitoring the Integrity of Reverse Osmosis and Nanofiltration Membrane Systems; Department of Interior, Bureau of Reclamation: Denver, CO, USA, 2000.
- Standard Practice for Integrity Testing of Water Filtration Membrane Systems; ASTM International: West Conshohocken, PA, USA, 2003.
- Kruithof, J.C.; Kamp, P.C.; Folmer, H.C.; Nederlof, M.M.; Van Hoof, S.C.J.M. Development of a membrane integrity monitoring strategy for the UF/RO Heemskerk drinking water treatment plant. Water Sci. Technol. Water Supply 2001, 1, 261–271. [Google Scholar] [CrossRef]
- Reclamation. Desalination and Water Purification Research and Development Program Evaluation of Conventional and Membrane Pretreatment for Seawater Reverse Osmosis; Department of Interior, Bureau of Reclamation: Denver, CO, USA, 2005.
- Crozes, G.F.; Sethi, S.; Mi, B.; Curl, J.; Marias, B. Improving membrane integrity monitoring indirect methods to reduce plant downtime and increase microbial removal credit. Desalination 2002, 149, 493–497. [Google Scholar] [CrossRef]
- Adham, S.; Gagliardo, P.; Smith, D.; Ross, D.; Gramith, K.; Trussell, R. Monitoring the integrity of reverse osmosis membranes. Desalination 1998, 119, 143–150. [Google Scholar] [CrossRef]
- Pype, M.L.; Patureau, D.; Wery, N.; Poussade, Y.; Gernjak, W. Monitoring reverse osmosis performance: Conductivity versus fluorescence excitation-emission matrix (EEM). J. Membr. Sci. 2013, 428, 205–211. [Google Scholar] [CrossRef]
- Huang, X.; Min, J.H.; Lu, W.; Jaktar, K.; Yu, C.; Jiang, S.C. Evaluation of methods for reverse osmosis membrane integrity monitoring for wastewater reuse. J. Water Process Eng. 2015, 7, 161–168. [Google Scholar] [CrossRef]
- Fritzmann, C.; Löwenberg, J.; Wintgens, T.; Melin, T. State-of-the-art of reverse osmosis desalination. Desalination 2007, 216, 1–76. [Google Scholar] [CrossRef]
- Vedavyasan, C.V. Pretreatment trends—An overview. Desalination 2007, 203, 296–299. [Google Scholar] [CrossRef]
- Li, W.; Liu, X.; Wang, Y.-N.; Chong, T.H.; Tang, C.Y.; Fane, A.G. Analyzing the Evolution of Membrane Fouling via a Novel Method Based on 3D Optical Coherence Tomography Imaging. Environ. Sci. Technol. 2016, 50, 6930–6939. [Google Scholar] [CrossRef] [PubMed]
- Arnal, J.M.; García-Fayos, B.; Sancho, M. Membrane Cleaning. In Expanding Issues in Desalination Edited; Ning, R.Y., Ed.; Intech Open: Rijeka, Croatia, 2011; ISBN 9789533076249. [Google Scholar]
- Lin, J.C.T.; Lee, D.J.; Huang, C. Membrane fouling mitigation: Membrane cleaning. Sep. Sci. Technol. 2010, 45, 858–872. [Google Scholar] [CrossRef]
- Ebrahim, S. Cleaning and regeneration of membranes in desalination and wastewater applications: State-of-the-art. Desalination 1994, 96, 225–238. [Google Scholar] [CrossRef]
- Obotey Ezugbe, E.; Rathilal, S. Membrane Technologies in Wastewater Treatment: A Review. Membranes 2020, 10, 89. [Google Scholar] [CrossRef] [PubMed]
- Arnal, J.M.; García-Fayos, B.; Sancho, M. Chapter 3: Membrane cleaning. Expand. Issues Desalin. 2011, 63–84. [Google Scholar]
- Membrane Cleaning Technologies. Available online: https://www.lenntech.com/membrane-cleaning.htm (accessed on 7 July 2020).
- Zhao, Y.J.; Wu, K.F.; Wang, Z.J.; Zhao, L.; Li, S.S. Fouling and cleaning of membrane—A literature review. J. Environ. Sci. Engl. 2000, 12, 241–251. [Google Scholar]
- Nath, K. Membrane Separation Processes; PHI Learning Private Limited: Delhi, India, 2017; ISBN 8120352912. [Google Scholar]
- Andes, K.; Bartels, C.R.; Liu, E.; Sheehy Presenter, N.; Manager-Hydranautics, D. Methods for Enhanced Cleaning of Fouled Ro Elements; The International Desalination Association World Congress on Desalination and Water Reuse: Tianjin, China, 2013. [Google Scholar]
- Hacıfazlıoğlu, M.C.; Parlar, İ.; Pek, T.; Kabay, N. Evaluation of chemical cleaning to control fouling on nanofiltration and reverse osmosis membranes after desalination of MBR effluent. Desalination 2019, 466, 44–51. [Google Scholar] [CrossRef]
- Garcia-Fayos, B.; Arnal, J.M.; Gimenez, A.; Álvarez, S.; Sancho, M. Study of ultrasonically enhanced chemical cleaning of SWRO membranes at pilot plant scale. Desalin. Water Treat. 2017, 88, 1–7. [Google Scholar] [CrossRef]
- Thanu, D.P.R.; Zhao, M.; Han, Z.; Keswani, M. Fundamentals and Applications of Sonic Technology. In Developments in Surface Contamination and Cleaning: Applications of Cleaning Techniques; Elsevier: Amsterdam, The Netherlands, 2019; pp. 1–48. [Google Scholar]
- Qasim, M.; Darwish, N.N.; Mhiyo, S.; Darwish, N.A.; Hilal, N. The use of ultrasound to mitigate membrane fouling in desalination and water treatment. Desalination 2018, 443, 143–164. [Google Scholar] [CrossRef] [Green Version]
- Kyllönen, H.M.; Pirkonen, P.; Nyström, M. Membrane filtration enhanced by ultrasound: A review. Desalination 2005, 181, 319–335. [Google Scholar] [CrossRef]
- Alventosa-Delara, E.; Barredo-Damas, S.; Alcaina-Miranda, M.I.; Iborra-Clar, M.I. Study and optimization of the ultrasound-enhanced cleaning of an ultrafiltration ceramic membrane through a combined experimental-statistical approach. Ultrason. Sonochem. 2014, 21, 1222–1234. [Google Scholar] [CrossRef]
- Ahmad, A.L.; Che Lah, N.F.; Ismail, S.; Ooi, B.S. Membrane antifouling methods and alternatives: Ultrasound approach. Sep. Purif. Rev. 2012, 41, 318–346. [Google Scholar] [CrossRef]
- Shahkaramipour, N.; Tran, T.N.; Ramanan, S.; Lin, H. Membranes with surface-enhanced antifouling properties for water purification. Membranes 2017, 7, 13. [Google Scholar] [CrossRef] [Green Version]
- Zhang, R.; Liu, Y.; He, M.; Su, Y.; Zhao, X.; Elimelech, M.; Jiang, Z. Antifouling membranes for sustainable water purification: Strategies and mechanisms. Chem. Soc. Rev. 2016, 45, 5888–5924. [Google Scholar] [CrossRef]
- Saqib, J.; Aljundi, I.H. Membrane fouling and modification using surface treatment and layer-by-layer assembly of polyelectrolytes: State-of-the-art review. J. Water Process Eng. 2016, 11, 68–87. [Google Scholar] [CrossRef]
- Son, M.; Yang, W.; Bucs, S.S.; Nava-Ocampo, M.F.; Vrouwenvelder, J.S.; Logan, B.E. Polyelectrolyte-Based Sacrificial Protective Layer for Fouling Control in Reverse Osmosis Desalination. Environ. Sci. Technol. Lett. 2018, 5, 584–590. [Google Scholar] [CrossRef]
- Li, Q.; Chen, G.Q.; Liu, L.; Kentish, S.E. Spray assisted layer-by-layer assembled one-bilayer polyelectrolyte reverse osmosis membranes. J. Membr. Sci. 2018, 564, 501–507. [Google Scholar] [CrossRef]
- Halakoo, E.; Feng, X. Layer-by-layer assembly of polyethyleneimine/graphene oxide membranes for desalination of high-salinity water via pervaporation. Sep. Purif. Technol. 2020, 234, 116077. [Google Scholar] [CrossRef]
- Zhang, Y.; Wan, Y.; Pan, G.; Shi, H.; Yan, H.; Xu, J.; Guo, M.; Wang, Z.; Liu, Y. Surface modification of polyamide reverse osmosis membrane with sulfonated polyvinyl alcohol for antifouling. Appl. Surf. Sci. 2017, 419, 177–187. [Google Scholar] [CrossRef]
- Falath, W.; Sabir, A.; Jacob, K.I. Novel reverse osmosis membranes composed of modified PVA/Gum Arabic conjugates: Biofouling mitigation and chlorine resistance enhancement. Carbohydr. Polym. 2017, 155, 28–39. [Google Scholar] [CrossRef]
- Anis, S.F.; Hashaikeh, R.; Hilal, N. Flux and salt rejection enhancement of polyvinyl(alcohol) reverse osmosis membranes using nano-zeolite. Desalination 2019, 470, 114104. [Google Scholar] [CrossRef]
- Shao, F.; Dong, L.; Dong, H.; Zhang, Q.; Zhao, M.; Yu, L.; Pang, B.; Chen, Y. Graphene oxide modified polyamide reverse osmosis membranes with enhanced chlorine resistance. J. Membr. Sci. 2017, 525, 9–17. [Google Scholar] [CrossRef]
- Nurkhamidah, S.; Devi, B.C.; Febriansyah, B.A.; Ramadhani, A.; Nyamiati, R.D.; Rahmawati, Y.; Chafidz, A. Characteristics of Cellulose Acetate/Polyethylene Glycol membrane with the addition of Graphene Oxide by using surface coating method. IOP Conf. Ser. Mater. Sci. Eng. 2020, 732, 12002. [Google Scholar]
- Gholami, S.; Rezvani, A.; Vatanpour, V.; Cortina, J.L. Improving the chlorine resistance property of polyamide TFC RO membrane by polyethylene glycol diacrylate (PEGDA) coating. Desalination 2018, 443, 245–255. [Google Scholar] [CrossRef]
- Zhang, Y.; Wan, Y.; Guo, M.; Pan, G.; Shi, H.; Yao, X.; Liu, Y. Surface modification on thin-film composite reverse osmosis membrane by cation complexation for antifouling. J. Polym. Res. 2019, 26, 1–12. [Google Scholar] [CrossRef]
- Kang, G.D.; Cao, Y.M. Development of antifouling reverse osmosis membranes for water treatment: A review. Water Res. 2012, 46, 584–600. [Google Scholar] [PubMed]
- Kulkarni, A.; Mukherjee, D.; Gill, W.N. Flux enhancement by hydrophilization of thin film composite reverse osmosis membranes. J. Membr. Sci. 1996, 114, 39–50. [Google Scholar] [CrossRef]
- Miyamoto, K.; Ikeshima, D.; Furutani, T.; Xiao, H.; Yonezu, A.; Chen, X. On the surface hydrophilization of a blended polysulfone membrane: Atomic force microscopy measurement and molecular dynamics simulation. Surf. Topogr. Metrol. Prop. 2019, 7, 35003. [Google Scholar] [CrossRef]
- Wei, X.; Wang, Z.; Zhang, Z.; Wang, J.; Wang, S. Surface modification of commercial aromatic polyamide reverse osmosis membranes by graft polymerization of 3-allyl-5,5-dimethylhydantoin. J. Membr. Sci. 2010, 351, 222–233. [Google Scholar] [CrossRef]
- Isawi, H.; El-Sayed, M.H.; Feng, X.; Shawky, H.; Abdel Mottaleb, M.S. Surface nanostructuring of thin film composite membranes via grafting polymerization and incorporation of ZnO nanoparticles. Appl. Surf. Sci. 2016, 385, 268–281. [Google Scholar] [CrossRef]
- Asadollahi, M.; Bastani, D.; Musavi, S.A. Enhancement of surface properties and performance of reverse osmosis membranes after surface modification: A review. Desalination 2017, 420, 330–383. [Google Scholar] [CrossRef]
- Hu, Y.; Lu, K.; Yan, F.; Shi, Y.; Yu, P.; Yu, S.; Li, S.; Gao, C. Enhancing the performance of aromatic polyamide reverse osmosis membrane by surface modification via covalent attachment of polyvinyl alcohol (PVA). J. Membr. Sci. 2016, 501, 209–219. [Google Scholar]
- Ankoliya, D.; Mehta, B.; Raval, H. Advances in surface modification techniques of reverse osmosis membrane over the years. Sep. Sci. Technol. 2019, 54, 293–310. [Google Scholar] [CrossRef]
- Safarpour, M.; Vatanpour, V.; Khataee, A.; Zarrabi, H.; Gholami, P.; Yekavalangi, M.E. High flux and fouling resistant reverse osmosis membrane modified with plasma treated natural zeolite. Desalination 2017, 411, 89–100. [Google Scholar] [CrossRef]
- Jahangiri, F.; Asadollahi, M.; Mousavi, S.A.; Farhadi, F. Improvement of performance of polyamide reverse osmosis membranes using dielectric barrier discharge plasma treatment as a novel surface modification method. Polym. Eng. Sci. 2019, 59, E468–E475. [Google Scholar] [CrossRef]
- Hirsch, U.; Ruehl, M.; Teuscher, N.; Heilmann, A. Antifouling coatings via plasma polymerization and atom transfer radical polymerization on thin film composite membranes for reverse osmosis. Appl. Surf. Sci. 2018, 436, 207–216. [Google Scholar] [CrossRef]
- Choi, J.; Choi, Y.; Ju, J.; Park, Y.; Lee, S. Inorganic fouling mitigation using the baffle system in direct contact membrane distillation (DCMD). Desalination 2020, 496, 114714. [Google Scholar] [CrossRef]
- Saleem, H.; Zaidi, S.J. Nanoparticles in reverse osmosis membranes for desalination: A state of the art review. Desalination 2020, 475, 114171. [Google Scholar] [CrossRef]
- Farahbaksh, J.; Delnavaz, M.; Vatanpour, V. Investigation of raw and oxidized multiwalled carbon nanotubes in fabrication of reverse osmosis polyamide membranes for improvement in desalination and antifouling properties. Desalination 2017, 410, 1–9. [Google Scholar] [CrossRef]
- Rajakumaran, R.; Boddu, V.; Kumar, M.; Shalaby, M.S.; Abdallah, H.; Chetty, R. Effect of ZnO morphology on GO-ZnO modified polyamide reverse osmosis membranes for desalination. Desalination 2019, 467, 245–256. [Google Scholar] [CrossRef]
- Fathizadeh, M.; Tien, H.N.; Khivantsev, K.; Song, Z.; Zhou, F.; Yu, M. Polyamide/nitrogen-doped graphene oxide quantum dots (N-GOQD) thin film nanocomposite reverse osmosis membranes for high flux desalination. Desalination 2019, 451, 125–132. [Google Scholar] [CrossRef]
- Ragunath, S.; Roy, S.; Mitra, S. Selective hydrophilization of the permeate surface to enhance flux in membrane distillation. Sep. Purif. Technol. 2016, 170, 427–433. [Google Scholar] [CrossRef] [Green Version]
- Tong, T.; Zhao, S.; Boo, C.; Hashmi, S.M.; Elimelech, M. Relating Silica Scaling in Reverse Osmosis to Membrane Surface Properties. Environ. Sci. Technol. 2017, 51, 4396–4406. [Google Scholar] [CrossRef]
- Lin, S.; Huang, H.; Zeng, Y.; Zhang, L.; Hou, L. Facile surface modification by aldehydes to enhance chlorine resistance of polyamide thin film composite membranes. J. Membr. Sci. 2016, 518, 40–49. [Google Scholar] [CrossRef]
- Vatanpour, V.; Zoqi, N. Surface modification of commercial seawater reverse osmosis membranes by grafting of hydrophilic monomer blended with carboxylated multiwalled carbon nanotubes. Appl. Surf. Sci. 2017, 396, 1478–1489. [Google Scholar] [CrossRef] [Green Version]
- Li, K.; Lee, B.; Kim, Y. High performance reverse osmosis membrane with carbon nanotube support layer. J. Membr. Sci. 2019, 592, 117358. [Google Scholar]
- Hu, X.; Sun, J.; Peng, R.; Tang, Q.; Luo, Y.; Yu, P. Novel thin-film composite reverse osmosis membrane with superior water flux using parallel magnetic field induced magnetic multi-walled carbon nanotubes. J. Clean. Prod. 2020, 242, 118423. [Google Scholar] [CrossRef]
- Ahmed, F.E.; Hashaikeh, R.; Hilal, N. Fouling control in reverse osmosis membranes through modification with conductive carbon nanostructures. Desalination 2019, 470, 114118. [Google Scholar]
- Ma, R.; Ji, Y.L.; Weng, X.D.; An, Q.F.; Gao, C.J. High-flux and fouling-resistant reverse osmosis membrane prepared with incorporating zwitterionic amine monomers via interfacial polymerization. Desalination 2016, 381, 100–110. [Google Scholar] [CrossRef]
- Ma, R.; Ji, Y.L.; Guo, Y.S.; Mi, Y.F.; An, Q.F.; Gao, C.J. Fabrication of antifouling reverse osmosis membranes by incorporating zwitterionic colloids nanoparticles for brackish water desalination. Desalination 2017, 416, 35–44. [Google Scholar]
- Yang, Z.; Saeki, D.; Matsuyama, H. Zwitterionic polymer modification of polyamide reverse-osmosis membranes via surface amination and atom transfer radical polymerization for anti-biofouling. J. Membr. Sci. 2018, 550, 332–339. [Google Scholar]
- Li, S.L.; Wu, P.; Wang, J.; Wang, J.; Hu, Y. Fabrication of high performance polyamide reverse osmosis membrane from monomer 4-morpholino-m-phenylenediamine and tailoring with zwitterions. Desalination 2020, 473, 114169. [Google Scholar] [CrossRef]
- Mahdavi, H.; Rahimi, A. Zwitterion functionalized graphene oxide/polyamide thin film nanocomposite membrane: Towards improved anti-fouling performance for reverse osmosis. Desalination 2018, 433, 94–107. [Google Scholar] [CrossRef]
- Khorshidi, B.; Biswas, I.; Ghosh, T.; Thundat, T.; Sadrzadeh, M. Robust fabrication of thin film polyamide-TiO2 nanocomposite membranes with enhanced thermal stability and anti-biofouling propensity. Sci. Rep. 2018, 8, 1–10. [Google Scholar]
- Lee, T.H.; Oh, J.Y.; Hong, S.P.; Lee, J.M.; Roh, S.M.; Kim, S.H.; Park, H.B. ZIF-8 particle size effects on reverse osmosis performance of polyamide thin-film nanocomposite membranes: Importance of particle deposition. J. Membr. Sci. 2019, 570–571, 23–33. [Google Scholar] [CrossRef]
- Armendariz Ontiveros, M.; Quintero, Y.; Llanquilef, A.; Morel, M.; Argentel Martínez, L.; García García, A.; Garcia, A. Anti-Biofouling and Desalination Properties of Thin Film Composite Reverse Osmosis Membranes Modified with Copper and Iron Nanoparticles. Materials 2019, 12, 2081. [Google Scholar] [CrossRef] [PubMed] [Green Version]
- Mamah, S.C.; Goh, P.S.; Ismail, A.F.; Suzaimi, N.D.; Ahmad, N.A.; Lee, W.J. Flux enhancement in reverse osmosis membranes induced by synergistic effect of incorporated palygorskite/chitin hybrid nanomaterial. J. Environ. Chem. Eng. 2021, 9, 105432. [Google Scholar] [CrossRef]
- Ashfaq, M.Y.; Al-Ghouti, M.A.; Zouari, N. Functionalization of reverse osmosis membrane with graphene oxide to reduce both membrane scaling and biofouling. Carbon N. Y. 2020, 166, 374–387. [Google Scholar] [CrossRef]
- Liu, G.; Zhang, X.; Di Yuan, Y.; Yuan, H.; Li, N.; Ying, Y.; Peh, S.B.; Wang, Y.; Cheng, Y.; Cai, Y.; et al. Thin-Film Nanocomposite Membranes Containing Water-Stable Zirconium Metal-Organic Cages for Desalination. ACS Mater. Lett. 2021, 3, 268–274. [Google Scholar]
- Zhao, Q.; Zhao, D.L.; Chung, T.S. Thin-film nanocomposite membranes incorporated with defective ZIF-8 nanoparticles for brackish water and seawater desalination. J. Membr. Sci. 2021, 625, 119158. [Google Scholar] [CrossRef]
- Wenten, I.G. Khoiruddin Reverse osmosis applications: Prospect and challenges. Desalination 2016, 391, 112–125. [Google Scholar] [CrossRef]

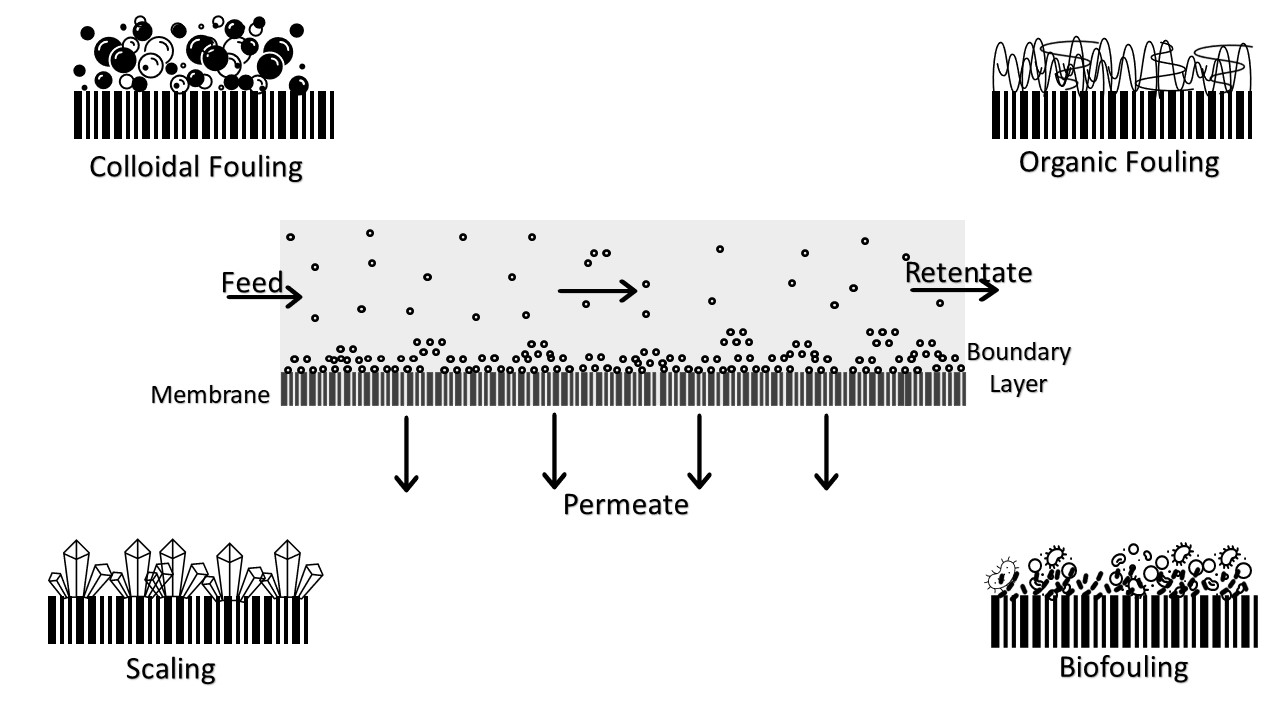
Table 1.
Common microorganisms Identified in biofilms (adapted from [13]).
Table 1.
Common microorganisms Identified in biofilms (adapted from [13]).
| Microorganism | Examples |
|---|---|
| Bacteria | Mycobacterium, Flavobacterium, Pseudomonas, Corynebacterium, Bacillus, Arthrobacte, Acinetobacter, Cytophaga, Moraxella, Micrococcus, Serratia, Lactobacillus, Aeromonas |
| Fungi | Penicillium, Trichoderma, Mucor, Fusarium, Aspergillus |
Table 2.
Interpretations of LSI values [41].
Table 2.
Interpretations of LSI values [41].
| LSI Value | Interpretation |
|---|---|
| <0 | Undersaturation of CaCO3 ions in the feedwater; scaling will not form. |
| 0 | Neutral feedwater, the index is inconclusive. |
| >0 | Supersaturation of CaCO3 ions in the feedwater; scaling is highly probable. |
Table 3.
Other interpretations of LSI values [41].
Table 3.
Other interpretations of LSI values [41].
| LSI Value | Interpretation |
|---|---|
| 2 | Non-corrosive scaling |
| 0.5 | Slight corrosive scaling |
| 0 | Neutral, probable pitting corrosion occurrence |
| −0.5 | Primitive corrosion with no scaling |
| −2 | Serious corrosion |
| Index | Membrane | Foulant | Filtration and Operating Mode | Test | Equation | Advantages | Limitations | Refs. |
|---|---|---|---|---|---|---|---|---|
| SDI | MF flat sheet 0.45 µm | Particulate matter | Dead end and constant pressure | t vs. V |
|
| [16,32,57] | |
| SDI+ | MF flat sheet 0.45 µm | Particulate matter | Dead end and constant pressure | t vs. V | - | 1. Considers variation in temperature, pressure, and membrane resistance. |
| [16,32,35,57] |
| SDIv | MF flat sheet 0.45 µm | Particulate matter | Dead end and constant pressure | t vs. V |
| Inaccurate results if the foulants size is smaller than 45 µm. | [16,32,35,57] | |
| MFI | MF flat sheet 0.45 µm | Particulate matter | Dead end and constant pressure | t/V vs. V |
| Inaccurate results if the foulants size is smaller than 45 µm. | [16,32,57] | |
| MFI-UFconst. flux | UF, flat sheet, 10-200 kDa | Colloids | Dead end and constant flux | Δp vs. t or Δt/ΔV vs. V | 1. Most industrial-scale RO filtration processes are constant flow processes. |
| [16,32,57] | |
| NF-MFI | NF | Organic matter | Dead end and constant pressure | t/(V/A) vs. V/A | 1. Able to filter out the organic matter. |
| [16,32,57] | |
| CFS-MFI | MF, UF, and NF | Particulate matter | Crossflow, dead-end, and constant pressure | t/V vs. V |
| Operating under constant pressure. | [16,32,57,58] | |
| CFI | MF and NF | All types of foulants | Constant pressure | t/V vs. V |
|
| [16,32,57] | |
| LSI | All membranes | CaCO3 | - | - |
| Does not quantify how much scale or calcium carbonate would precipitate at equilibrium conditions. | [16,32,57,59] | |
| S&DSI | All membranes | CaCO3 | - | - |
| Inconsiderate of the precipitation reaction kinetics thus fails to consider the induction time required for precipitate formation. | [16,32,57,59] | |
| SI | All membranes | CaCO3, CaSO4, BaSO4 and SiO2 | - | - |
| Ksp value is very sensitive to changes in operative parameters or to the presence of contaminants/impurities. | [16] | |
| MMAS | MF, UF, and NF | Particulate, colloids and organic matter | Dead end and constant pressure | t/V vs. V | - |
|
| [32,60] |
| DFI | MF flat sheet 0.45 µm | Particulate matter | Dead end and constant pressure | t/V vs. V |
| more accuracy and reliability tests are needed to validate the test | [32,61] |
Abbreviations: SDI, silt density index; MFI, modified fouling index; MF, microfiltration; UF, ultrafiltration; t, time; V, volume; CFS, cross-flow sampler; CFI, combined fouling index; LSI, Langelier saturation index; S&DSI, Stiff and Davis saturation index; SI, supersaturation index; IAP, ion activity product; Ksp, solubility constant; MMAS, multiple membrane array system; DFI, dimensionless fouling index.
Table 5.
Combined three mechanisms models, characteristics, and equations.
| Model | Characteristics | Equation |
|---|---|---|
| 1 | Standard blocking, intermediate pore blockage, and cake formation | |
| 2 | Standard blocking, complete pore blockage, and cake formation (using the Hagen–Poiseuille law) | |
| 3 | Standard blocking, intermediate pore blockage, and cake formation (using the Hagen–Poiseuille law) | |
| 4 | Zero-order standard blocking, complete pore blockage, cake formation | |
| 5 | Zero-order standard blocking, intermediate pore blockage, and cake formation |
| Monitoring Technique | Membrane | Mode | Description | Advantages | Limitations | Refs. |
|---|---|---|---|---|---|---|
| Pressure decay test | MF, UF, and NF | Offline | The pressure test uses a low-pressure air supply that is applied to the permeate side of the membrane. If the membrane’s integrity is compromised or suffers from leak spots; air would pass through. The air transfer would occur only if the applied pressure exceeds the defected site’s bubble point pressure. | 1. Suitable for a wide array of membranes; from RO to MF, and a vast range of configurations; including hollow fibers, tubular and flat sheets. |
| [90,92,93] |
| Vacuum decay test | NF and RO | Offline | The membrane element is placed into a clean water bath for several hours, then drained. The permeate tube is plugged then a vacuum is applied to measure vacuum decay rates. If the decay rate exceeds 10kPa/min, then the membrane’s integrity is compromised. | 1. Suitable for a wide array of membranes; from RO to MF, and a vast range of configurations; including hollow fibers, tubular and flat sheets. | 1. Applicable to separate elements in a system, not to the full system. | [67,90,92] |
| Particles tracking | MF and UF | Online | The concentration of a specific particle is tracked in both the feed and the permeate. | 1. Simple and rapid solution for membrane fouling analysis. |
| [92,94] |
| Turbidity monitoring | MF and UF | Online | Turbidity levels are measured in both the feed and the permeate. | 1. Simple and rapid solution for membrane fouling analysis. |
| [95,96] |
| TOC monitoring | NF and RO | Online | TOC concentrations are measured in both the feed and the permeate. | 1. Suitable for a wide array of membranes; from RO to NF, and a vast range of configurations; including hollow fibers, tubular and flat sheets. Applicable to full-scale setups. | Expensive equipment. | [92,93,97] |
| Sulfate tracking | NF and RO | Offline | Sulfate concentrations are measured in both the feed and the permeate. | 1. Suitable for a wide array of membranes; from RO to NF, and a vast range of configurations; including hollow fibers, tubular and flat sheets. Applicable to full-scale setups. | Expensive equipment. | [67] |
| Conductivity monitoring | NF and RO | Online | The conductivity is monitored in both the feed and the permeate. | Can assess the performance of critical control points. | Time-consuming. | [97,98] |
| Marker-based test (challenge test or seeding method) | MF, UF, NF, and RO | Offline | The feed is supplemented by microorganisms which are then tracked to the permeate. | 1. Assesses viruses’ removal efficiency New markers, like fluorescence-tagged nanoparticles, can provide high-resolution results. | 1. Requires seeding. Expensive. | [67,91] |
| Pulse integrity test | NF and RO | Online | The pulse of a highly rejected particle, i.e., magnesium sulfate is measured and monitored. |
| 1. Unsuitable for NF membranes as the elements themselves have substantial conductivity which can alter the accuracy of the test’s results. | [67,91] |
| Fluorescence excitation-emission matrix spectroscopy | NF and RO | Online | The concentration of microspheres in both the feed and the permeate is measured by fluorescence spectroscopy. | Up to 4 log10 removal reported.Results can be cross-checked with conductivity-based tests. | 1. Expensive due to the cost of particles. | [91,98] |
| Flow cytometry | NF and Ro | Offline | An optical analysis approach to quantify and characterize cells in a liquid matrix. | 1. Highly sensitive, thus accurate and can detect a wide range of membrane integrity problems. |
| [91,99] |
Abbreviations: NF, Nanofiltration; RO, Reverse osmosis; MF, Microfiltration; UF, Ultrafiltration.
Table 7.
Advantages and disadvantages of conventional pretreatment methods (adapted from [69,71,72,81,100]).
| Conventional Pretreatment Method | Advantages | Disadvantages |
|---|---|---|
| Coagulation/flocculation |
|
|
| Chlorination |
|
|
| Media filtration |
|
|
| Acidification |
|
|
| Ozonation | 1. Does not affect the integrity of the feed in terms of odor or taste. |
|
| DAF | 1. Cost-effective. | 1. Scraper-related issues. |
| Scale inhibitors | 1. Inhibits crystallization-induced scale formation. | 1. Overdosing of scale inhibitors can cause detrimental damage to RO membranes. |
| UV |
| 1. Can lead to biofilm formation. |
Abbreviations: NF, Nanofiltration; RO, Reverse osmosis; MF, Microfiltration; UF, Ultrafiltration.
Table 8.
Comparison between conventional and non-conventional pretreatment methods (adapted from [81,100,101]).
| Aspect of Comparison | Conventional Pretreatment Methods | Membrane Pretreatment Methods |
|---|---|---|
| Capital cost | lower than non-conventional membrane-based methods | Higher than conventional methods but new developments are causing costs to decline. |
| Carbon footprint | High | Low |
| Energy requirements | Low | High |
| Chemical costs | High | Low |
| Quality of permeate | SDI < 4 for 90% of the time inconsistent quality indicators. Turbidity: <1.0 NTU. | SDI < 2.5 for 100% of the time. Constant quality indicators. Turbidity < 0.1 NTU. |
Table 9.
Physical and chemical surface modification techniques.
| Method | Modifier | Test Conditions | Permeate Flux (Lm−2 h−1) | Salt Rejection (%) | Ref. |
|---|---|---|---|---|---|
| Surface coating | PDDA and PSS | 2000 ppm NaCl solution at 4.1 MPa | 15.5 | 99 | [122] |
| LbL surface coating | Pluronic F127 amphiphilic triblock copolymer | 2 g/L NaCl solution at 4 MPa | 30 | 94 | [123] |
| LbL surface coating | PEI and GO | 200 g/L NaCl at 65 °C | 8.4 kg m−2 h−1 | 99.9 | [124] |
| Surface coating | SPVA | 2000 ppm NaCl solution at 1.55 MPa | 42.6 | 99.18 | [125] |
| Surface coating | Pluronic F127 and Gum arabic | 2000 mg/L NaCl solution at 55.2 bar | - | 98 | [126] |
| Slip casting | Nano zeolite-Y | 25,000 mg/L NaCl solution at 25 bar | 5.1 | 99.52 | [127] |
| Spin coating | GO | 1 mg/mL NaCl solution at 1.5 MPa and 25 °C | - | 95.3 | [128] |
| Surface coating | GO | - | 1356 | 37 | [129] |
| Surface coating | PEGDA | 2000 ppm NaCl solution at 20 bar and 25 °C | - | 99 | [130] |
| Cation complexation | PEG | 2000 ppm NaCl solution at 1.55 MPa | 40.8 | 99.04 | [131] |
| Hydrophilization treatment | PVP | - | - | - | [134] |
| Hydrophilization treatment | Chromic acid | 60 °C | 61 | - | [148] |
| Free radical grafting | ADMH | 2000 ppm NaCl solution at 1.5 MPa and 25 °C | 184.5 | 95.8 | [135] |
| Free radical grafting | ZnO NPs | 2000 mg/l NaCl solution at 15 bar and 25 °C | 35 | 97 | [136] |
| Radical grafting | ADMH | 35mM NaCl solution at 27.6 bar and 22 °C | - | 99.1 | [149] |
| Chemical coupling | PVA | 500 mg/L NaCl solution at 5 bar and 25 °C | 27 | 98.46 | [138] |
| Chemical coupling | Aldehydes | 2000 ppm NaCl solution at 1.6MPa and 25 °C | 37.5 | 98.6 | [150] |
| Glow discharge plasma treatment | Clinoptilolite | 16,000 ppm NaCl solution at 1.5 MPa and 25 °C | - | 97.12 | [140] |
| Dielectric barrier discharge plasma treatment | - | - | - | - | [141] |
| Plasma polymerization and si-ATRP | HEMA, MPC, and SBMA | - | 6042 | 99 | [142] |
Abbreviations: PDDA, poly (diallyl- dimethylammonium chloride); PSS, poly(sodium-4-styrenesulfonate); LbL, layer-by-layer; PEI, polyethylenimine; GO, graphene oxide; SPVA, Sulfonated; PEGDA, polyethylene glycol diacrylate; PVP, polyvinylpyrrolidone; ADMH, 3-allyl-5,5-dimethylhydantoin; PVA, polyvinyl alcohol; HEMA, hydroxyethyl methacrylate; MPC, 2-methacryloyloxyethyl phosphorylcholine; SMBA, [2-(methacryloyloxy)ethyl]-dimethyl- (3-sulfopropyl)ammonium hydroxide.
Table 10.
Novel membrane materials.
| Modifier | Test Conditions | Permeate flux (Lm−2 h−1) | Salt rejection (%) | Ref. |
|---|---|---|---|---|
| Carboxylated CNT | 2000 mg/L NaCl and 500 mg/L BSA solutions at 15 bar and 25 °C | - | 94 | [151] |
| CNT | 2000 mg/L NaCl solution at 15 bar and 25 °C | 25.9 | 96 | [145] |
| CNT | 2000 mg/L NaCl solution at 15.5 bar | 128.6 | 98.3 | [152] |
| Magnetic multi-walled CNT | 2 g/L NaCl, 2 g/L Na2SO4, 2 g/L MgSO4 solutions at 1 MPa and 25 °C | 11.39 (NaCl), 10.84 (Na2SO4) and 11.10 (MgSO4) | 97.04 (NaCl), 96 (Na2SO4) and 95.31 (MgSO4) | [153] |
| CNT | 25,000 ppm NaCl solution at 24 bar | 1.78 | 99.91 | [154] |
| Zwitterionic diamine monomer N-aminoethyl piperazine | 2000 ppm NaCl solution at 1.5 MPa and 25 °C | 54.5 | 98.3 | [155] |
| Zwitterionic colloid nanoparticles | 2000 ppm NaCl solution at 1.5 MPa and 25 °C | 37.3 | 96.5 | [156] |
| Zwitterionic polymer | 0.85 wt% NaCl solution at 1.5 MPa and 30 °C | 50.48 | 96.9 | [157] |
| Zwitterionic monomer | 2000 ppm NaCl solution at 15 bar and 25 °C | 24.75 | 98.5 | [158] |
| Zwitterionic GO | 1000 ppm NaCl solution at 12 bar | 17.52 | 94.8 | [159] |
| TiO2 NPs | 2000 ppm NaCl solution at 1.52 MPa and 65 °C | 24.3 | 97 | [160] |
| GO-ZnO | 2000 mg/L NaCl solution at 20 bar and 25 °C | 31.42 | 96.3 | [146] |
| N-GOQD | 2000 ppm NaCl solution at 15 bar | 24.9 | 93 | [147] |
| ZIF-8 | 2 g/L NaCl solution at 15.5 bar and 25 °C | 51.925 | 98.5 | [161] |
| Fe NPs and Cu NPs | 1000mg/L NaCl solution at 300 psi and 25 °C | 8.4 (Fe NPs) and 3 (Cu NPs) | 92.96 (Fe NPs) and 74.36 (Cu NPs) | [162] |
| palygorskite-chitin (PAL-CH) hybrid nanomaterial | 2000 ppm NaCl solution at 15 bar | 2.4 | 93, 95, 98.5, and 96.6 for PA/PSF-PAL-CH1, PA/PSF-PAL-CH2, PA/PSF-PAL-CH3 and PA/PSF-PAL-CH4 | [163] |
| GO | 800 mg/L CaCl2 and Na2SO4 at 25℃ and 20 bar | - | 98 | [164] |
| zirconium metal–organic cages | 2000 ppm NaCl at 25 °C and 15.5 bar | 22.79 | 94.7 | [165] |
| dZIF-8 | 2000 ppm NaCl solution at 20 bar (brackish water) and 32,000 ppm NaCl at 50 bar (seawater) | 52.2 (brackish water), 38 (seawater) | 98.6 (brackish water), 98.8 (seawater) | [166] |
Abbreviations: CNT, carbon nanotubes; GO, graphene oxide; NP, nanoparticles; GOQD, graphene oxide quantum dots.
Publisher’s Note: MDPI stays neutral with regard to jurisdictional claims in published maps and institutional affiliations. |
© 2021 by the authors. Licensee MDPI, Basel, Switzerland. This article is an open access article distributed under the terms and conditions of the Creative Commons Attribution (CC BY) license (https://creativecommons.org/licenses/by/4.0/).
Share and Cite
MDPI and ACS Style
AlSawaftah, N.; Abuwatfa, W.; Darwish, N.; Husseini, G. A Comprehensive Review on Membrane Fouling: Mathematical Modelling, Prediction, Diagnosis, and Mitigation. Water 2021, 13, 1327. https://doi.org/10.3390/w13091327
AMA Style
AlSawaftah N, Abuwatfa W, Darwish N, Husseini G. A Comprehensive Review on Membrane Fouling: Mathematical Modelling, Prediction, Diagnosis, and Mitigation. Water. 2021; 13(9):1327. https://doi.org/10.3390/w13091327
Chicago/Turabian StyleAlSawaftah, Nour, Waad Abuwatfa, Naif Darwish, and Ghaleb Husseini. 2021. "A Comprehensive Review on Membrane Fouling: Mathematical Modelling, Prediction, Diagnosis, and Mitigation" Water 13, no. 9: 1327. https://doi.org/10.3390/w13091327
Note that from the first issue of 2016, this journal uses article numbers instead of page numbers. See further details here.