
Influence of Particle Size of River Sand on the Decontamination Process in the Slow Sand Filter Treatment of Micro-Polluted Water


1
State Key Laboratory of Simulation and Regulation of Water Cycle in River Basin, China Institute of Water Resources and Hydropower Research, Beijing 100038, China
2
Department of Irrigation and Drainage, China Institute of Water Resources and Hydropower Research, Beijing 100038, China
*
Author to whom correspondence should be addressed.
Water 2022, 14(1), 100; https://doi.org/10.3390/w14010100
Submission received: 3 December 2021
/
Revised: 23 December 2021
/
Accepted: 30 December 2021
/
Published: 4 January 2022
(This article belongs to the Special Issue Application of Sustainable Chemical and Biological Methods for Pollutants Removal from Water)
Abstract
:Slow sand filters (SSFs) have been widely used in the construction of water plants in rural areas. It is necessary to find river sand of suitable particle size to improve SSF treatment of micro-polluted water so as to ensure the effective and long-term operation of these plants. In this study, SSF1# (particle size of 0.1–0.5 mm), SSF2# (particle size of 0.5–1 mm), and SSF3# (particle size of 1–1.5 mm) were selected. The physical absorption, CODMn and NH4+-N removal effect, and microbial community were analyzed. According to Langmuir and Freundlich adsorption model fitting, the smaller the particle size of the river sand, the more pollutants are adsorbed under the same conditions. SSF1# has the shortest membrane-forming time, highest CODMn and NH4+-N removal rate, and highest Shannon estimator, indicating that there are more abundant microbial species in the biofilm. Mesorhizobium, Pannonibacter, Pseudoxanthomonas, Aquabacterium, Devosia, and other bacteria have different proportions in each system, each forming its own stable biological chain system. The effluent quality of the three SSFs can meet drinking water standards. However, river sand with a particle size range of 0.1–0.5 mm is easily blocked, and thus the recommended size range for SSF is 0.5–1 mm.
1. Introduction
Waterborne diseases remain a major cause of illness and death in areas without access to safe drinking water [1]. Contaminated water can transmit diseases such as diarrhea, cholera, dysentery, typhoid, and polio. Contaminated drinking water is estimated to cause 485,000 diarrheal deaths each year as a result of 144 million people collecting untreated surface water from lakes, ponds, rivers, and streams [2]. The main characteristics of micro-polluted water are organic matter, ammonia pollution, obvious smell, some water quality indicators beyond the “Surface Water Environmental Quality Standard” (GB3838-2002) class III water quality standard, and difficulty as use as drinking water. Ammonia is ubiquitous in water sources due to human activities. Ammonia nitrogen is the main cause of water eutrophication and an important source of nitrogen in water. Water eutrophication can seriously deteriorate the water environment and is harmful to source water [3,4]. The presence of ammonia nitrogen in the disinfection phase leads to additional chlorine consumption and may negatively affect the disinfection process [5]. Monitoring data in 2021 shows that 19.1% of China’s surface water does not meet the national standards for drinking water sources [6]. Due to the development of aquaculture and the use of various pesticides and fertilizers in agricultural cultivation, some water sources are slightly polluted, with excessive ammonia nitrogen and organic matter. If the water must be used as source water for practical reasons, it should be treated with the appropriate water purification process.
Compared with chemical treatment, biological treatment is more suitable for treating slightly polluted water. The core of the biological method is the use of micro-organisms to remove contaminants. For over 200 years, slow sand filters (SSFs) have been widely used in the construction of water plants in rural areas due to their advantages such as low construction cost, good effluent effect, miniaturization of scale, and simple daily operation [7,8]. As a result, it is recommended by the World Health Organization (WHO) as a point-of-use technology. In 2015, more than 800,000 SSFs were implemented in at least 60 countries, potentially helping more than 5 million people [9]. The operation of SSFs does not require any chemicals or electricity, which is attributable to the naturally occurring processes in the filter.
The operation of water supply projects in rural areas is usually poorly managed, and it is very important to select the appropriate filter material and particle size range for a good treatment effect and long-term operation. Multiple filter types have been used to enhance SSF performance in drinking water, including iron oxide-coated sand [10], silver-coated zeolite [11], and poly (vinyl alcohol)/peat composite beads [12]. However, these filter materials are not cost-efficient choices in poorer areas. River sand as a SSF filter material can be used in local mountainous areas such as the Yunyang district as it is convenient, economic, and easy to process and transport. The particle size of the filter material is an important parameter of SSF treatment effect and operation. Fine sand particle sizes (d10) of 0.11 mm [13], 0.13 mm [14], 0.153 mm [15], 0.17 mm [16], and 0.19 mm [17] have been selected for slow sand filters. However, the influence of the particle size of river sand on the decontamination process in slow sand filters treating CODMn and NH4+-N micro-polluted water is not clear.
As the raw water percolates through the sand, organic matter and pathogenic bacteria are removed by both physical (e.g., absorption) and biological processes (e.g., predation, natural death, and metabolic breakdown) [18,19,20]. Schmutzdecke (the German word for dirty layer) is a biological layer or biofilm covering the first 5 cm of the sand-water interface within a SSF [21]. Recently, a number of studies attempted to characterize the biological mechanisms of SSFs using different methods. A standard chloroform fumigation-extraction technique [22] was adapted to measure microbial biomass concentrations routinely in the schmutzdecke. Calvo-bado used the PCR amplification of 16S rRNA genes and denaturing gradient gel electrophoresis to study the bacterial community of SSFs [23]. Flow cytometry (FCM) with cytometric histogram image comparison (CHIC) analysis has also been used to monitor SSF performance [24]. Next-generation sequencing technology (NGS), also known as high throughput sequencing (HTS), is widely used in microbial diversity studies due to its advantages of high throughput, fast detection speed, and low sequencing cost, and the fact that it is possible to identify bacterial community taxa fully and understand the relationship between the bacterial community structure and the water quality [25,26]. Additionally, a lack of understanding of the micro-ecological function of SSFs impedes design and performance optimization.
Although these studies were important for SSF development, there are still gaps in the SSF literature that require specific studies due to their application in specific regions of China. In this study, the physical adsorption effect of river sand on pollutants was discussed and the removal efficiencies of three SSFs with different particle sizes of river sand were determined. HTS was used to monitor global changes in the microbial communities. According to the treatment effect, the appropriate filter material size range was chosen. This will not only reveal patterns and processes in microbial communities but could also greatly improve the design of SSF systems. It may also provide guidance for drinking water safety in mountainous areas.
2. Materials and Methods
2.1. Design of SSF Units
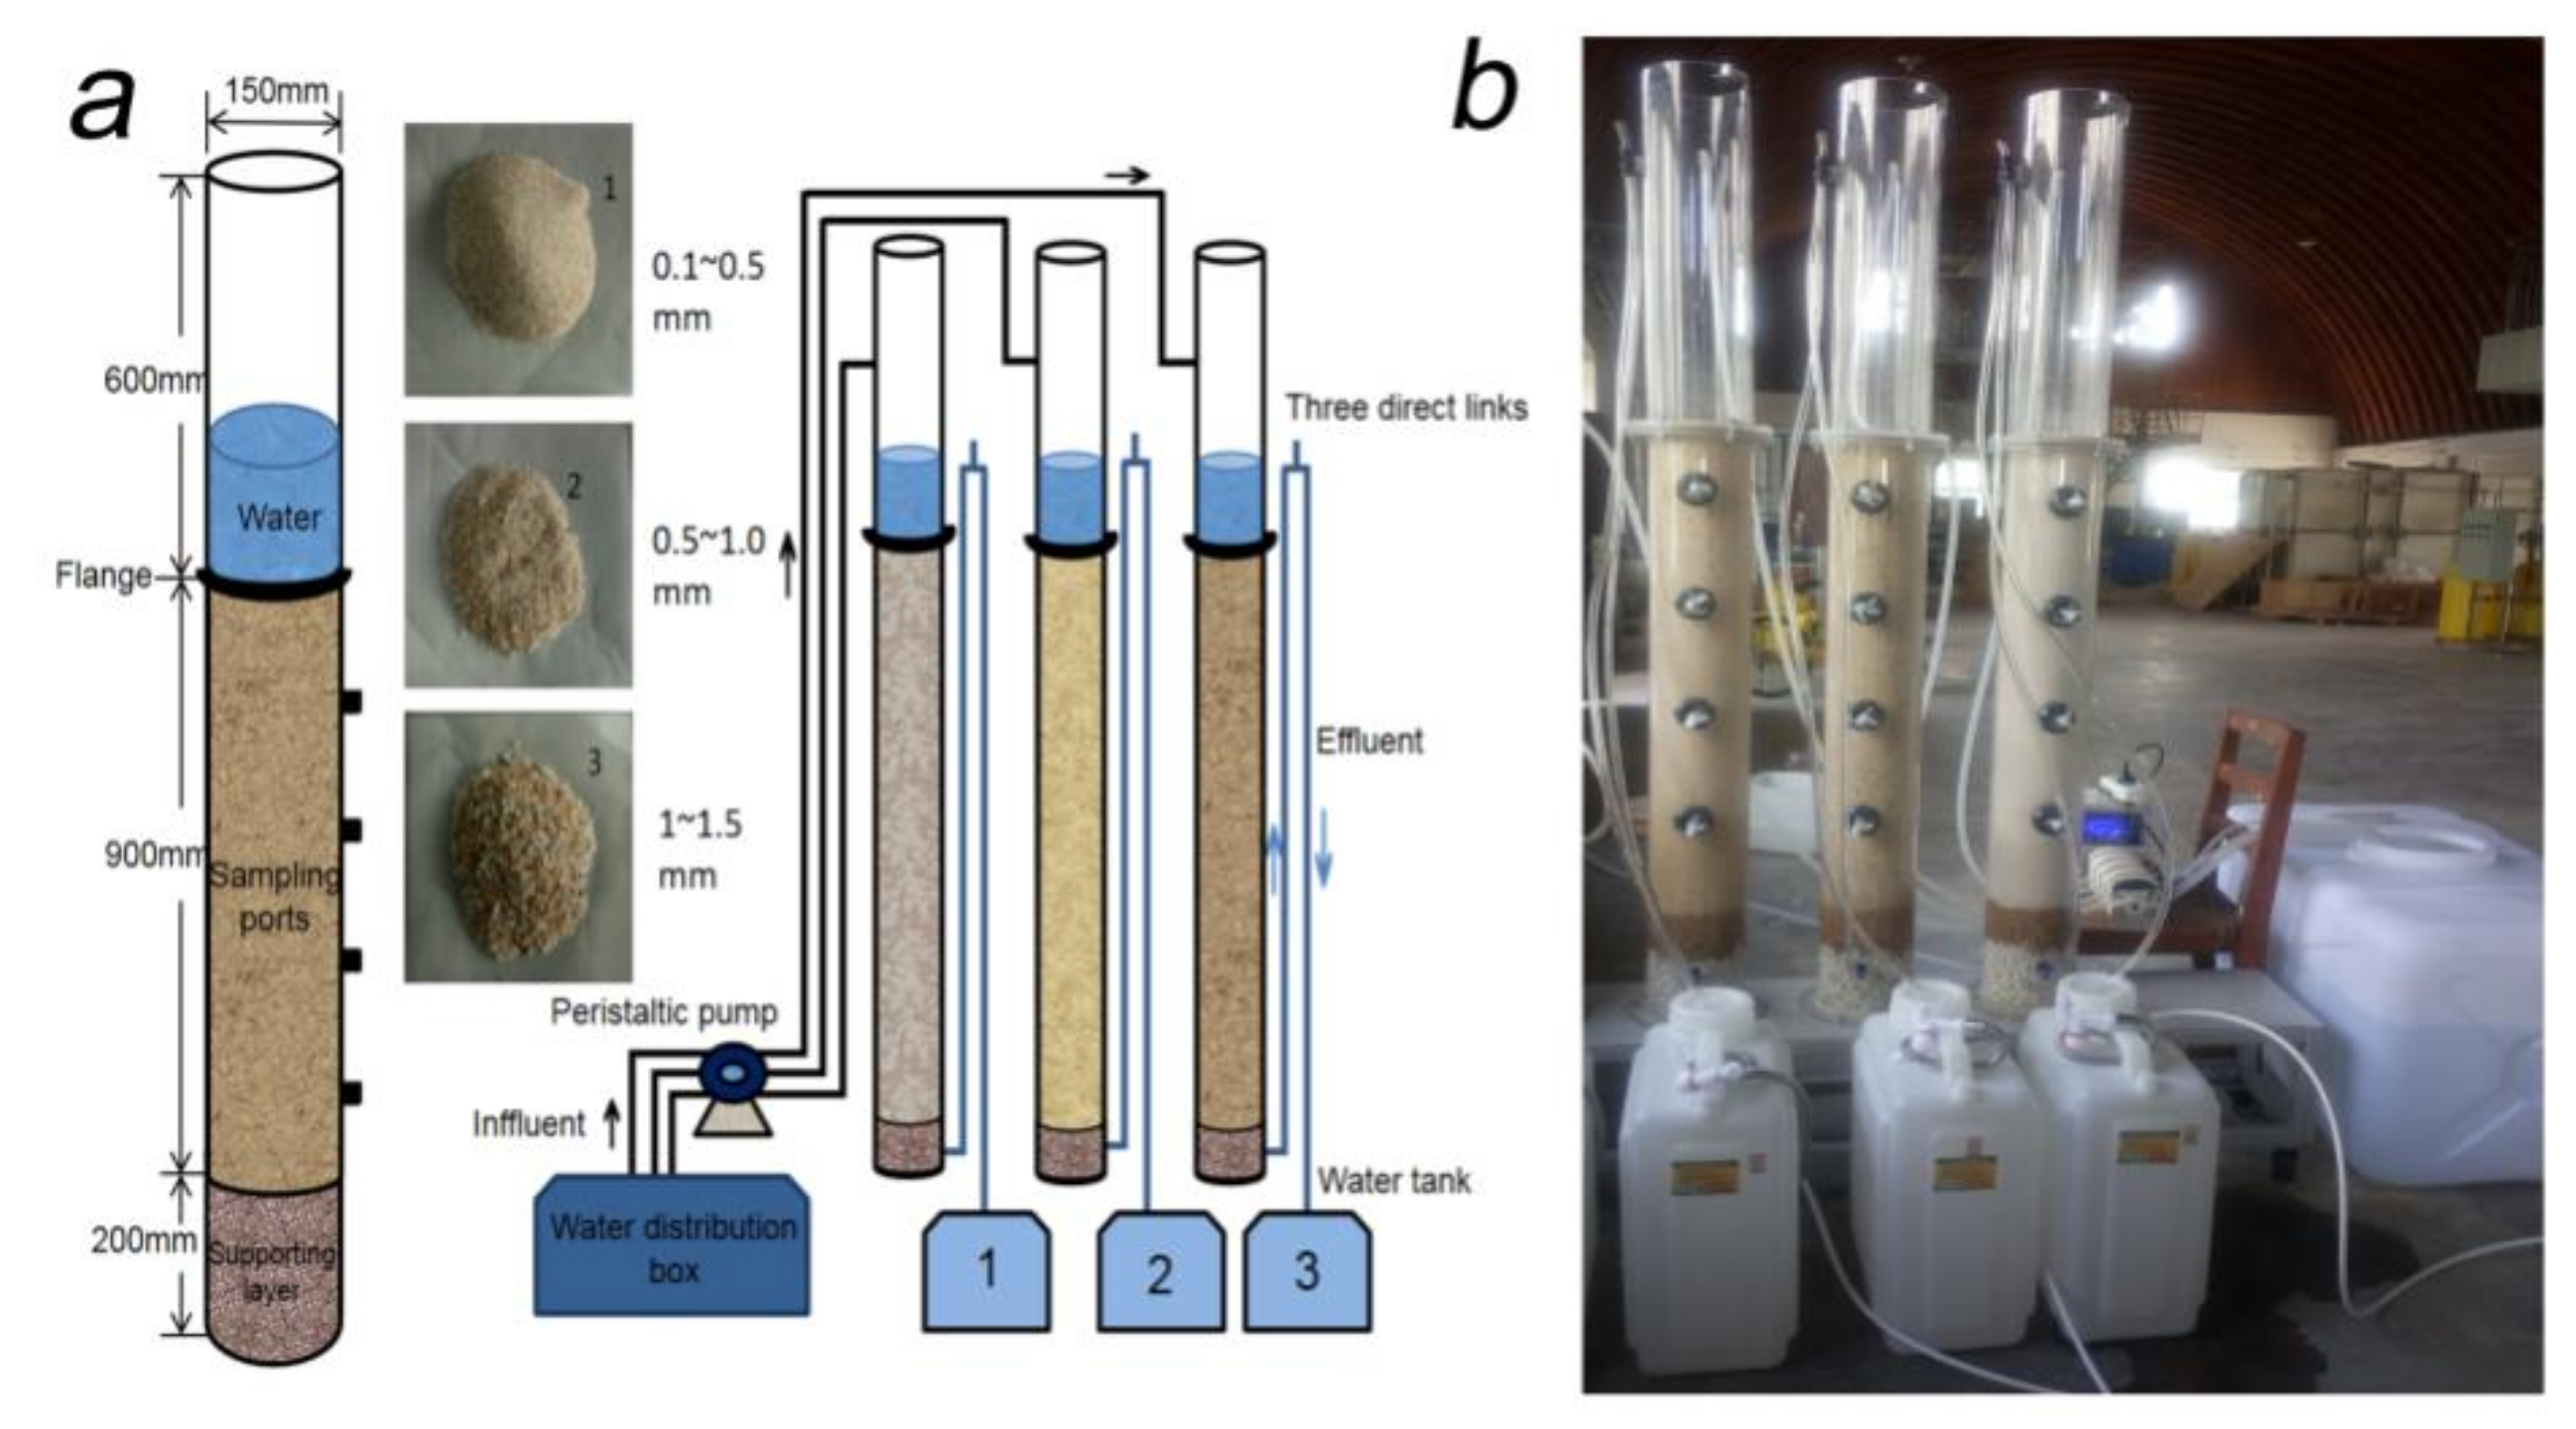
Three slow sand filters of laboratory scale were used to compare the effect of different particle sizes of river sand on raw water treatment in this experiment. The river sand had particle size ranges of 0.1–0.5 mm, 0.5–1 mm, and 1–1.5 mm, which were labelled SSF1#, SSF2#, and SSF3#, respectively. A recent study [27] demonstrated that scaled-down SSFs can accurately reproduce the water quality and microbial consortia of full-scale SSFs. The design and physical drawing of the experimental device are shown in Figure 1. It is mainly composed of four parts: a raw water distribution box, a peristaltic pump, a SSF (900 mm filter material layer and 200 mm supporting layer), and a water tank. Oxygen content is very important for the growth and reproduction of bacteria, which affects the activity of nitrification bacteria, thereby affecting the purification effect of the whole reactor. The experimental device is equipped with water drop aeration. In order to control the height of the water layer above the filter material layer and ensure the protection of the biological mucous membrane on the surface of the filter material, a three-way pipe controller is set. When the water level of the filter is higher than the fixed part of the three-way connection, the water flow in the water pipe rises because of the principle of the connector, and at the same time it falls into the water outlet through the outlet pipe due to the gravity action of the water flow. When the water level in the filter is lower than the fixed part of the three-way connection, the flow in the pipe will automatically be cut off and restored to the established water level.
2.2. Feed Water
The water quality of 10 water samples in the Yunyang District, Chongqing City, China was tested as a reference. In this experiment, the raw water in the water distribution box was filled with water prepared in a laboratory. The carbon and the nitrogen were supplied by glucose and ammonium chloride. Dry tree leaves, grass, and yellow soil were used to simulate natural water. A large number of micro-organisms are attached to the dead leaves. After soaking, the micro-organisms will degrade the organic matter in the dead leaves and destroy their cell walls and cell membranes. The intracellular substances are dissolved into the water after being released, increasing the content of ammonia nitrogen, organic matter, and other substances in the water. The detailed information of the water quality is shown in Table 1.
2.3. Methods
2.3.1. Adsorption Isotherm
In this adsorption isotherm test, the river sand of three particle size ranges (0.1–0.5 mm, 0.5–1.0 mm, and 1.0–1.5 mm) were used. The river sand should be as uniform as possible. When the uneven coefficient (UC) of the river sand is expressed as K80 (K80 = d80/d10), it should not exceed 2. Nine portions of river sand weighing 0.1 kg in each size range were poured into nine 250 mL tapered vials. Deionized water was added to one conical flask as a blank sample, and different masses of glucose were added to the water samples (0.15 L) of the other eight conical bottles to obtain water samples with different concentrations of CODMn. Eight water samples with different concentrations of ammonia nitrogen were obtained by adding different masses of ammonia chloride to the water samples. The conical flasks with stoppers were placed on a thermostatic shaker and oscillated for 24 h at 120 r·min−1 at 25 ± 1 °C. Firstly, the solution in the conical flask was taken to measure the concentration of CODMn and NH4+-N, and then the adsorption capacity q (mg·kg−1) of the water from the river sand was calculated according to Equation (1) [28].
in which P0 (mg·L−1) is the initial concentration of CODMn or NH4+-N (mg·L−1); Pt (mg·L−1) is the equilibrium concentration of the supernatant after centrifugation; V (L) is the volume of solution; and M (kg) is sand dosage.
Langmuir’s adsorption isotherm model assumes that adsorption takes place in the monolayer on a uniform surface, ignoring the transverse interaction between adsorbed molecules. The equation [29] is as follows:
in which q (mg·kg−1) is the sand adsorption capacity; p (mg·L−1) is the concentration of CODMn or NH4+-N in the solution after adsorption equilibrium; a (mg·kg−1) is the saturated adsorption capacity of unit adsorbent; and b (L·mg−1) is the adsorption equilibrium constant. The Freundlich adsorption isotherm model assumes that the paired number law of adsorption heat on non-uniform surfaces decreases with an increase in surface coverage, and it is shown in Equation (3) [30]:
in which K and 1/n are constants that depend on the type of adsorbents, adsorbents, and adsorption temperature.
The result of p was taken as X and q as Y to establish Langmuir and Freundlich adsorption isotherm models. The nonlinear fitting function of Origin software was used to carry out nonlinear curve fitting for the parameters of these two models.
2.3.2. Experimental Set-Up and Operation
For the three slow sand filters, the continuous low filtration rate was 0.1 m/h in the natural inoculation process. When the membrane was successfully attached, the flow rate increased to 0.2 m·h−1. The room temperature was 24.2–27.3 °C.
2.3.3. Water Quality Measurement
During the experiment, the CODMn and NH4+-N concentrations of influent and effluent were detected on alternate days. For water quality measurement, the concentration of CODMn was determined by acidic potassium permanganate titration, and the concentration of NH4+-N was determined by Nasser reagent spectrophotometry.
2.3.4. Sample Collection, DNA Extraction, and Illumina Sequencing
When the biofilm was successfully suspended for a period of time, the flanges of three SSFs were opened to collect the microbial biofilm in the Schmutzdecke. Microbial samples from SSF1#, SSF2#, and SSF3# correspond to sample 1, sample 2, and sample 3, respectively. The biofilm was put into a centrifuge tube. The centrifuge speed was set at 15,000 r·min−1 for 15 min. All samples were stored in sterile plastic containers on ice and analyzed within 24 h.
PCR amplification of 16S rRNA genes and Illumina MiSeq-high throughput sequencing were used to study the bacterial community dynamics in detail. The detailed process was as follows:
Total DNA extraction. Total DNA for each sample was isolated using the EZNA Soil DNA extraction kit (Omega Bio-Tek, Norcross, GA, USA) and was detected using 1% agar gel electrophoresis.
Polymerase Chain Reaction (PCR). The 16S rRNA gene amplicons of three samples were collected and then amplified using the primer sets 338F (5′-ACTCCTACGGGAGGCAGCA-3′) and 806R (5′-GGACTACHVGGGTWTCTAAT-3′). These primers target the V4–V5 hypervariable regions of bacterial 16S rRNA genes. The PCR reactions were performed according to the following program: initial denaturation for 3 min at 95 °C, 29 cycles of denaturation for 30 s at 95 °C, annealing for 30 s at 55 °C, and extension for 30 s at 72 °C, with a final extension for 10 min at 72 °C and cooling to 10 °C. Amplified PCR products were measured by 2% agarose gel electrophoresis. Selected bands were excised from the gel and stored using gel extraction kits (AXYGEN, Glendale, AZ, USA). Amplified samples were pooled (equimolar concentrations). According to the preliminary quantitative results of electrophoresis, the fluorescent reagent was a Quant-It Picogreen dsDNA Assay Kit (Thermo Fisher Scientific, Waltham, MA, USA), and the quantitative instrument was a Microplate Reader-FLX800 (BioTek, Santa Clara, CA, USA).
MiSeq-high throughput sequencing. MiSeq-high throughput sequencing of the PCR products was carried out at Biogenro Biotechnology Co., Ltd., Beijing, China. Sequencing was performed on an Illumina MiSeq. The generated raw sequences of all samples were assigned using the Ribosomal Database Project (RDP) (http://rdp.cme.msu.edu/, accessed on 14 August 2020) to trim off the adapters and barcodes roughly. Technical duplicate reads and raw reads containing three or more undetermined bases or contaminated with adaptors were removed from the dataset by custom scripts. To compare all the samples at the same sequencing depth, the number of sequences was normalized by randomly extracting 175,919 effective reads from the two samples, which were then subjected to bioinformatics analyses. Accession to cite for these SRA data: PRJNA740350.
3. Results
3.1. Nonlinear Fitting of Adsorption Isotherm
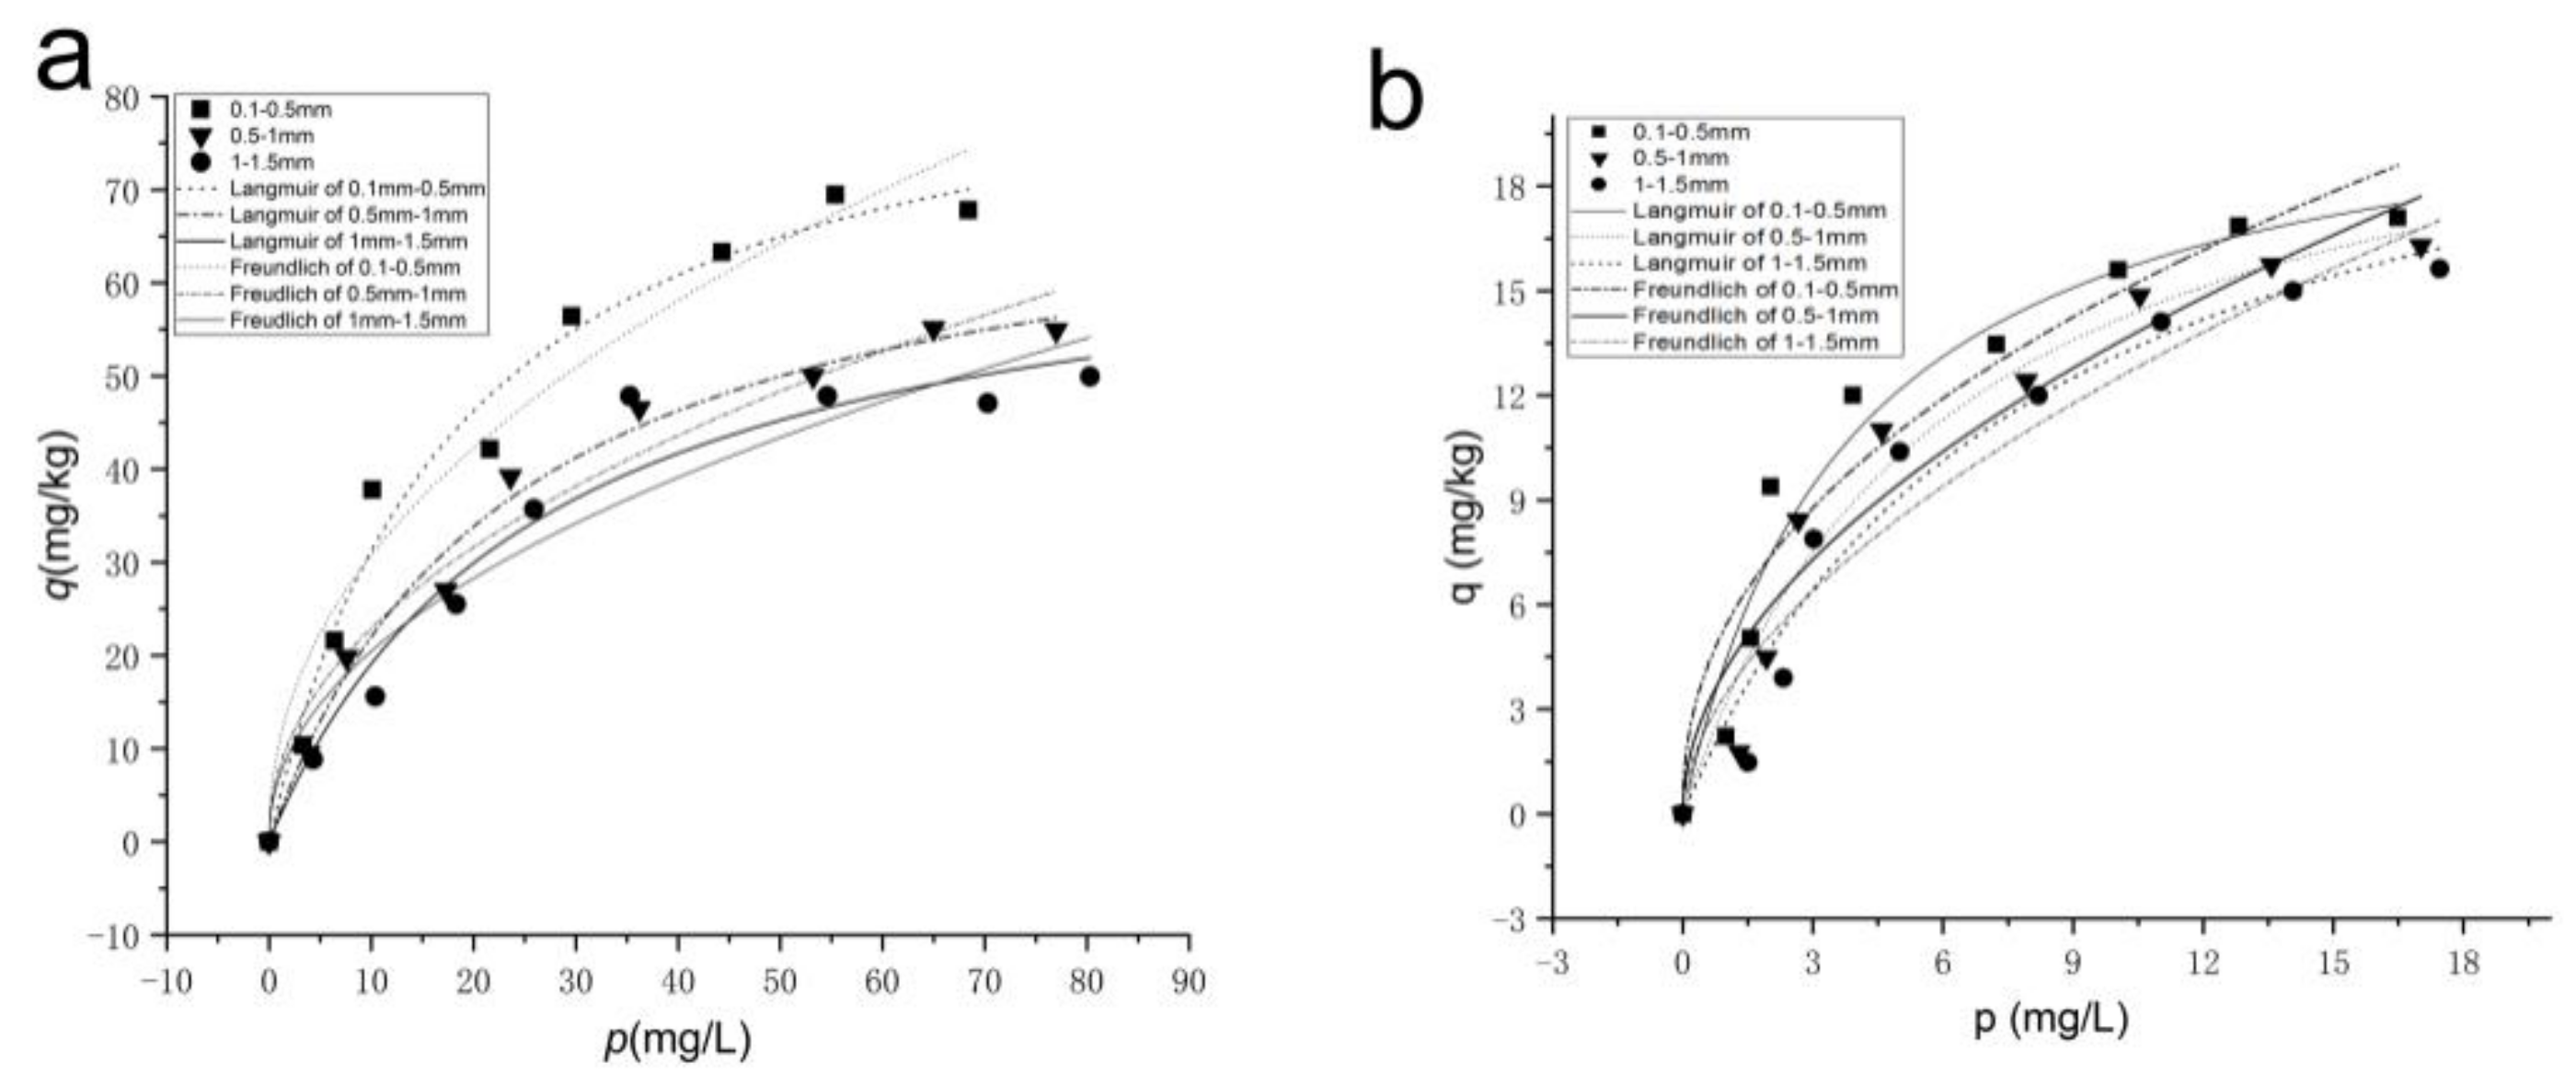
The nonlinear fitting curves of Langmuir and Freundlich adsorption isotherms of CODMn (Figure 2a) and NH4+-N (Figure 2b) were obtained. It can be seen that the curves of the adsorption experiment of river sand with three particle sizes are basically the same. With the increase in pollutant concentration, the adsorption curve of river sand first rises and then flattens. The results of fitting parameters are shown in Table 2. With respect to R2, the Langmuir adsorption model has a higher fitting degree than the Freundlich model and better describes the adsorption process of pollutants.
According to the parameters fitted by the Langmuir model, the adsorption equilibrium constant b is greater than 0, which indicates that CODMn and ammonia nitrogen can be adsorbed spontaneously in the water [31]. For the Freundlich model fitting, the parameter 1/n values of CODMn and NH4+-N adsorption are within the range of 0.1–0.5 and 0.1–0.6, respectively, indicating that it is easy to realize the adsorption function (1/n between 0.1–0.5: easy adsorption, 1/n >1: not easy adsorption) [32]. The 1/n values of ammonia nitrogen adsorption were 0.44, 0.51, and 0.56, respectively. Thus, the adsorption performance decreases with an increase in particle size. With the decrease in particle size, the specific surface area of pores increases, leading to an increase in adsorption capacity. The pore structure of river sand will change with different particle sizes, which will eventually lead to differences in the adsorption characteristics of the colloidal particles [33]. When the particle size of river sand becomes smaller, the connectivity of its pores is enhanced, and the adsorption path of pollutants is smoother.
3.2. Removal Efficiency of Pollutants Using SSF with Different Particle Size
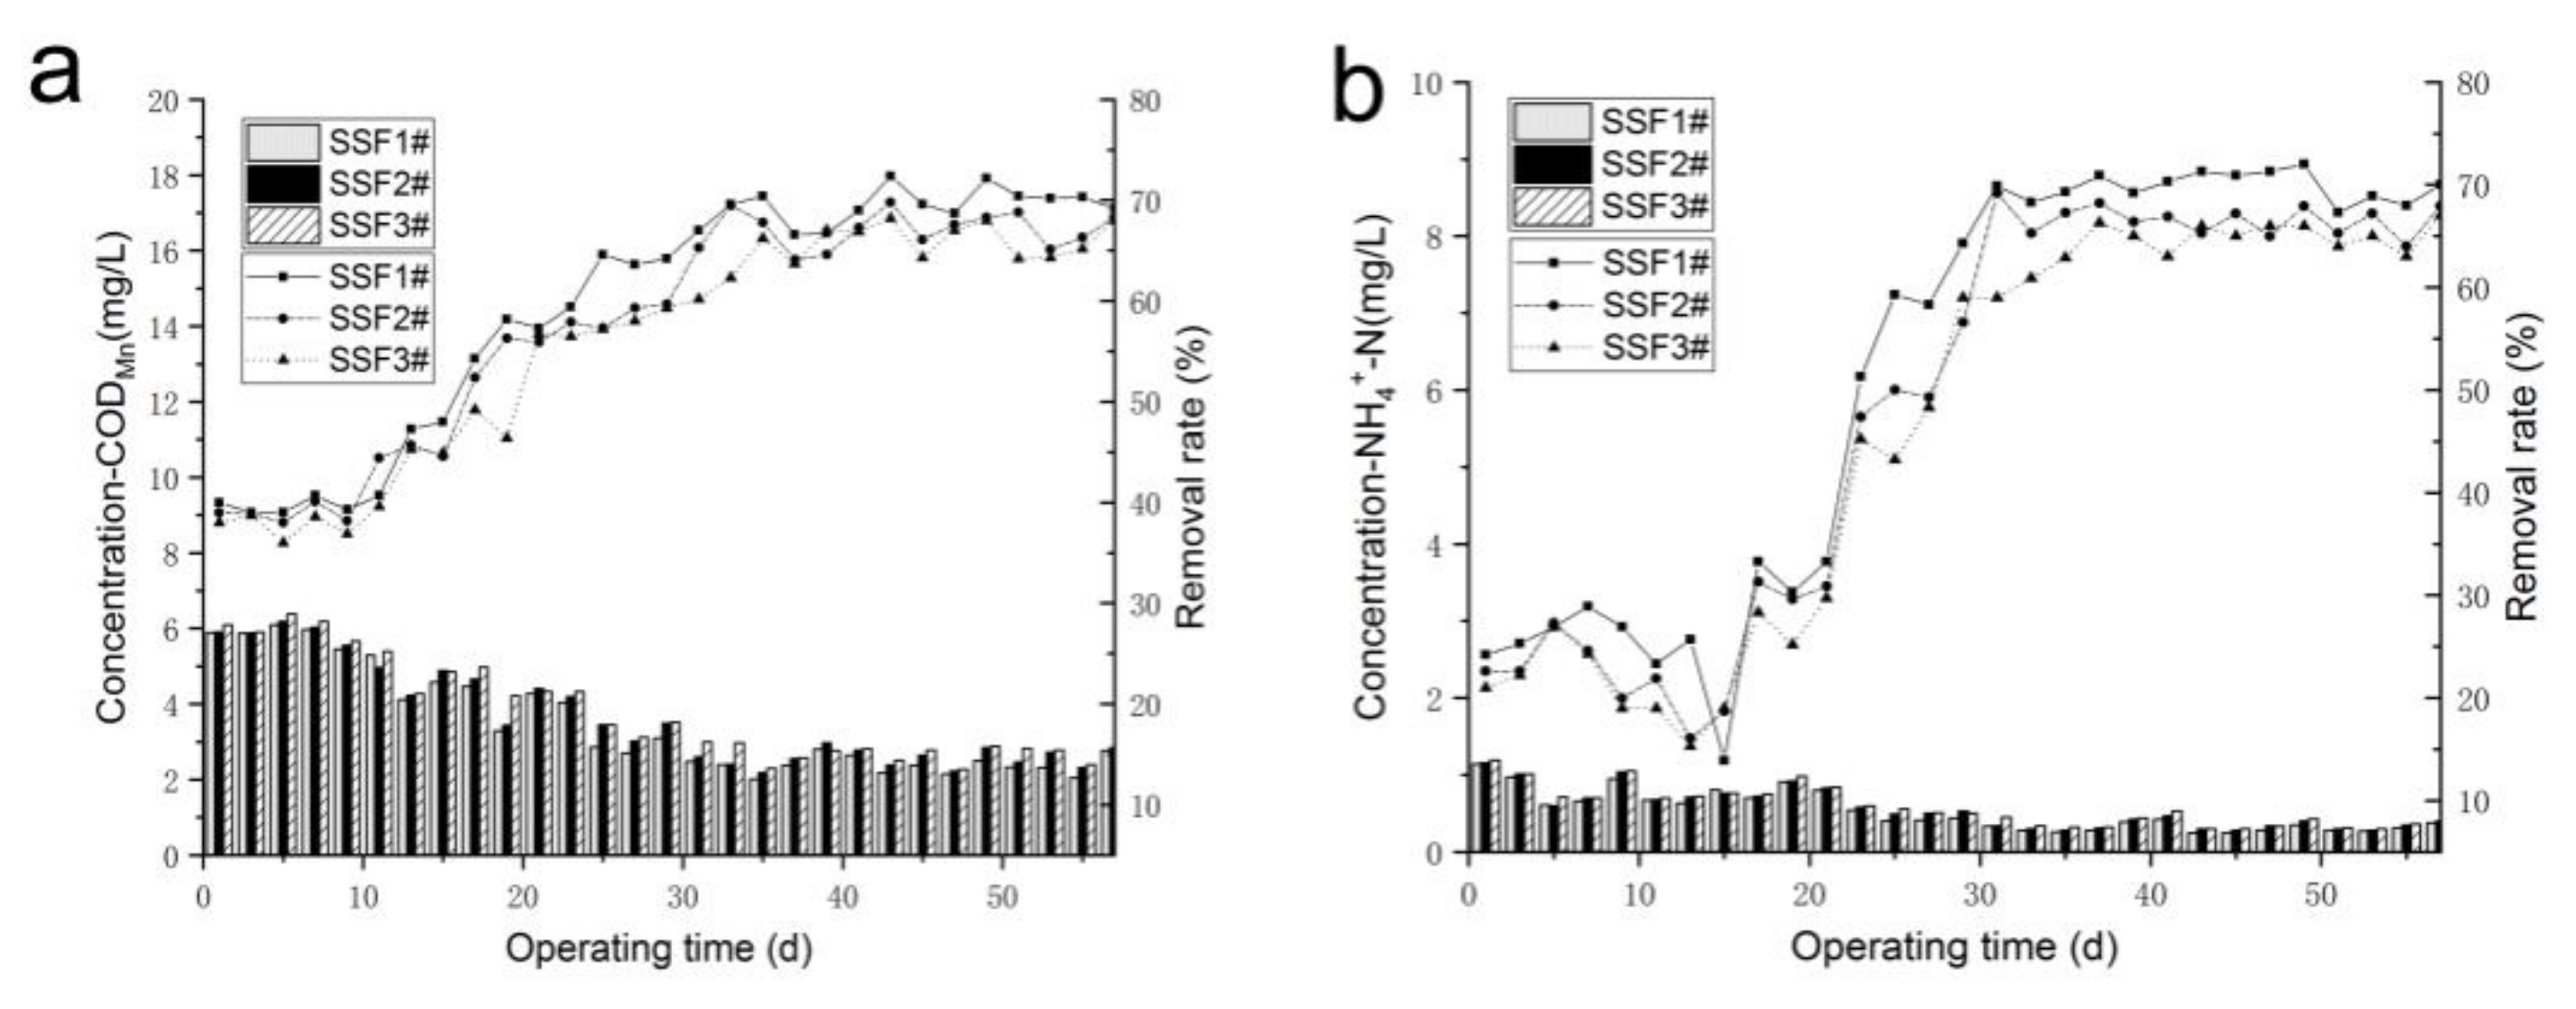
It can be seen from Figure 3a that CODMn has a removal rate of 37.2% to 42.3% when the SSF is put into operation (0 d–10 d). Its removal effect was the same as the previous physical adsorption results, and the removal effect is SSF1# > SSF2# > SSF3#. With the passage of time, the removal rate showed a gradually increasing trend. The removal rate of SSF1# reached 64% at 25 d. When the removal rate shows a steady trend, the membrane-forming has been completed. SSF2# and SSF3# formed stable biofilms at 31 d and 35 d, respectively. Among them, SSF1# had the best removal effect, with an average removal rate of 70.2%, followed by SSF2# (67.5%) and SSF3# (66.2%).
The removal efficiency of ammonia nitrogen is shown in Figure 3b. At the initial stage of operation (0 d–15 d), the three SSFs had poor and unstable removal effects on ammonia nitrogen. When a mature and stable biofilm was formed on the surface of the filter material, the average removal rate of the three SSFs reached 67.5%. Compared with the SSFs without the biofilm, the removal rate of ammonia nitrogen was 44.9% higher. The average removal rates of the three SSFs were 69.8%, 66.4%, and 65.1%, respectively.
For the removal efficiency of CODMn, the SSFs had a certain removal rate when they were put into operation, which is due to the adsorption and retention of river sand. This condition occurred because of different particle charges between the suspended particles and media filter surface. Colloidal particles are positively charged, whereas sand is negatively charged. The positive charge of particles is accumulated on the sand surface [34]. With the passage of time, the removal rate showed a gradually increasing trend. When the removal rate shows a steady trend, the membrane-forming is complete. It took a long time to start when using the natural hanging membrane method, but the cultivated and domesticated biofilm is fully adapted to the characteristics of this kind of water quality, with a strong anti-impact load capacity and stable effluent effect in the later period of operation. During this period, micro-organisms gradually generate polysaccharides and other organic structures to adhere themselves to the filter material to form biological links, and the combination of biofilm and river sand became very firm. As the water flows, organic matter is adsorbed, favoring the development of a biofilm around the sand granules [35]. SSF1# was the first to complete the film hanging at 25 d, and the stable removal rate reached 64%. SSF2# and SSF3# formed a stable biofilm at 31 d and 35 d, respectively. The results are consistent with [22] where the biolayer formation in SSFs was expected to happen within 40 days. Thus, the smaller the particle size, the smaller the porosity between the filter materials, meaning that the micro-organism under the hydraulic shear cannot be washed away easily. As a result, the denser the biofilm, the easier it is to form [36]. Each SSF has a good effect on the removal of CODMn; the average removal rate reached 64.9%, and the effluent concentration of CODMn was below 5 mg/L, which is in line with the requirements of “Standards for Drinking Water Quality” (GB5749-2006). Among them, SSF1# had the best removal effect, with an average removal rate of 70.2%, followed by SSF2# (67.5%) and SSF3# (66.2%). Although there are differences between the removal rates of the three SSFs, the difference is relatively small. When the biofilm formed by the SSF was mature, the average removal rate of the COD can be increased by 25.2%, indicating that the formation of a biofilm in the schmutzdecke played a key role in the removal of pollutants [37]. The removal of organic matter using a SSF is mainly dependent on three functions: the adsorption and interception of filter media, flocculation, and microbial oxidative degradation.
The removal effects of ammonia nitrogen from the three SSFs were poor and unstable at the beginning of the operation. At this stage, the biofilm was attached to the surface of river sediment, but the attachment was not firm, and it was a two-way dynamic process between separation and adsorption. There were various forces between micro-organisms and the river sediment—mainly physical and chemical forces. At this point, the micro-organisms were easily washed off by the current. The nitrifying bacteria’s growth rate was slow, and the generation cycle was long, so longer residence time and a larger specific surface area were required for the growth and reproduction of nitrifying bacteria in the reactor. When a mature and stable biofilm was formed on the surface of the filter material, the average removal rate of the three SSFs reached 67.5%. Compared with the SSF without a biofilm, the removal rate of ammonia nitrogen was 44.9% higher. Thus, it can be seen that the removal of ammonia nitrogen was more obvious by micro-biological degradation and nitrification. The effluent of ammonia nitrogen concentration was lower than 0.5 mg/L, which was in line with the hygienic standard of drinking water. This is consistent with the results of another study [38], which showed that ammonia removal gradually became stable when the ammonia concentration was around 0.26 mg/L. The average removal rates of the three SSFs were 69.8%, 66.4%, and 65.1%, respectively. The NH4+-N removal effect of the river sand with different particle sizes was similar to that of CODMn.
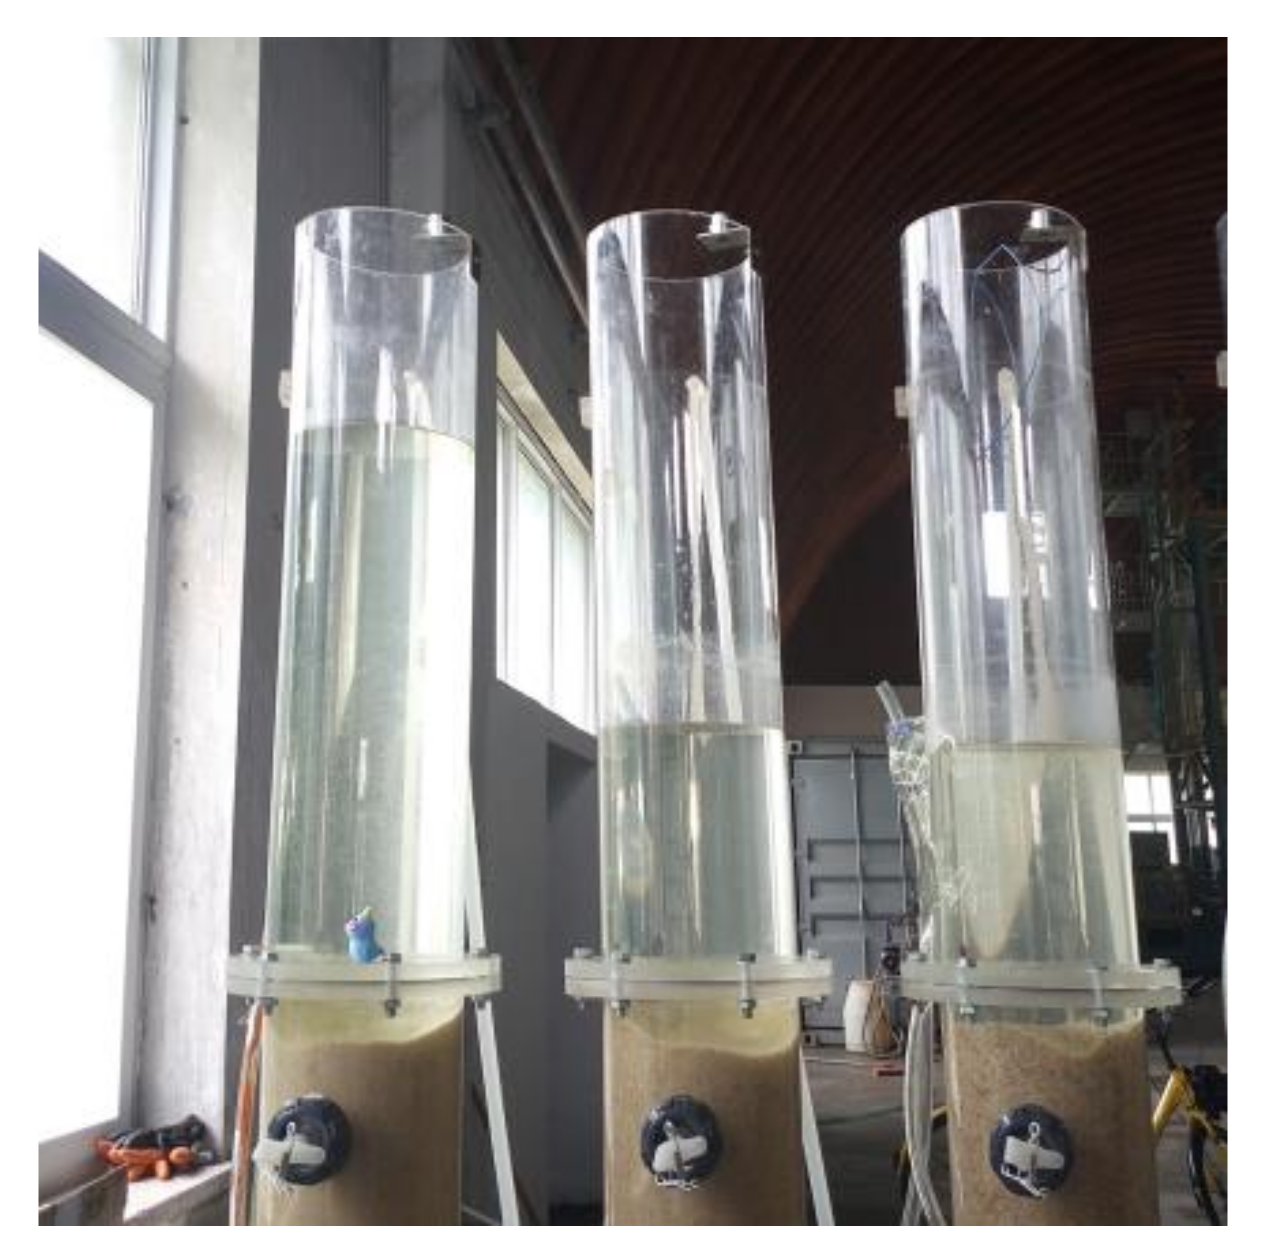
With the operation of the SSF, we uncovered a phenomenon: after 56 days of operation, the outflow flow rate decreased, and clogging became evident in SSF1# (Figure 4). SSF2# and SSF3# could run for three months without any blockages. Although SSF1# had the best removal effect of contaminants, blockages occurred within a short period. Plugging is a process of decreasing porosity and permeability of porous media caused by material accumulation in porous media. Different plugging mechanisms include physical plugging, chemical plugging [39], and biological plugging [40]. Physical clogging may result from compaction due to loads on the surface of the filter and migration of the fine media into the filter. When the exceptionally fine filter material was used, a filter cake at the filter material-water interface was formed, resulting in a physical blockage [41]. When the SSF ran for a long period of time, pollutant particles were trapped in the upper filter layer, and the membrane structure of micro-organisms became more compact, resulting in a decrease in the permeability coefficient. If organic carbon is part of the water intake, a blockage will occur [42], which may be due to the extracellular polymer substances (EPS) in organic matter. These may form a gel-like hydrophilic structure as the organic matter accumulates [43], increasing the retardation of flow within the filter. A larger filler size can effectively promote the migration of particles.
It is suggested that the particle size of the river sand was the factor that led to clogging, and it was not suitable to choose a filter particle size in the 0.1–0.5 mm range; otherwise it plugs easily; the operation cycle of the SSF is short; the frequency of the cleaning of the sand scraping in the daily maintenance is increased; and the difficulty and cost of operation and maintenance improve [44]. Frequent maintenance activities can affect the biological layer stability and the SSF’s overall efficiency [45]. Considering the removal effects, the size range of 0.5–1 mm is optimal for SSFs.
3.3. Microbial Community Structure
3.3.1. Simplification and Classification of OTU
In order to compare the diversity of different microbial samples, unified random sampling (also known as “sequence amount flattening”) is needed. When analyzing microbial community diversity through the 16S rRNA gene, the OTU threshold is usually divided by a 97% sequence similarity, which represents the level of the species at the level of taxonomy. Then, QIIME software was used to calculate the diversity index of the above three samples, and the classification was conducted from phylum to species successively. After processing the original paired-end results and removing the query sequences, the effective sequence quantities of three samples that passed quality screening and fully matched the index were 72,636, 54,532, and 48,751, with a total of 175,919 items. As is shown in Figure 5, 4357 OTUs were produced in the three samples, and the number of OTUs present in all three samples was 779. The number of unique OTUs in sample 1 was up to 1257, which was much higher than the other two samples. The number of OTUs divided into different classification statuses (Phylum, Class, Order, Family, Genus, Species) is shown in Table 3, and the OTU number of Sample 1 was larger than the other two.
The number of unique OTUs in sample 1 was up to 1257, which indicated that there were more abundant microbial species in the biofilm. It was inevitable that there would thus be more populations with different biological and ecological characteristics leading to strong system stability.
3.3.2. The Analysis of Alpha Diversity
In the study of microbial community structures, there are various indexes that can be used to calculate alpha diversity, which have different emphases for measuring community diversity. Commonly used metrics include the Chao estimator [46] and ACE estimator [47], which focus on community richness, and the Shannon estimator [48] and Simpson estimator [49], which take community evenness into account. The Shannon index is more sensitive to community richness and rare OTUs, while the Simpson index is more sensitive to community evenness and dominant OTUs [50]. The larger the Shannon estimator, the higher the community diversity, while the smaller the Simpson estimator, the higher the community diversity. It can be seen from Table 4 that the ACE index and the Chao index of the three samples were both sample 1 > sample 2 > sample 3, indicating that the sequencing results were accurate and that the order of community richness was sample 1 > sample 2 > sample 3. The order of the Simpson estimator was sample 3 > sample 2 > sample 1, and the Shannon estimator was sample 1 > sample 3 > sample 2, which indicated that sample 1 had the highest microbial species and more rare OTUs. The CODMn and NH4+-N removal rate of SSF1# was higher than that of the other two SSFs, which indicates that the SSF1# had the best bacterial community diversity and the best purifying capability. These results suggest that the alpha diversity index was correlated with water quality. The better the diversity of bacterial communities, the richer the environmental function [51]. It also promotes the formation of blockages. Moreover, the more diverse the bacterial community, the more stable the environmental function, because the coexistence of rich species makes it more likely that some species will perform a particular function when others fail [52].
3.3.3. The Analysis of Taxonomic Composition
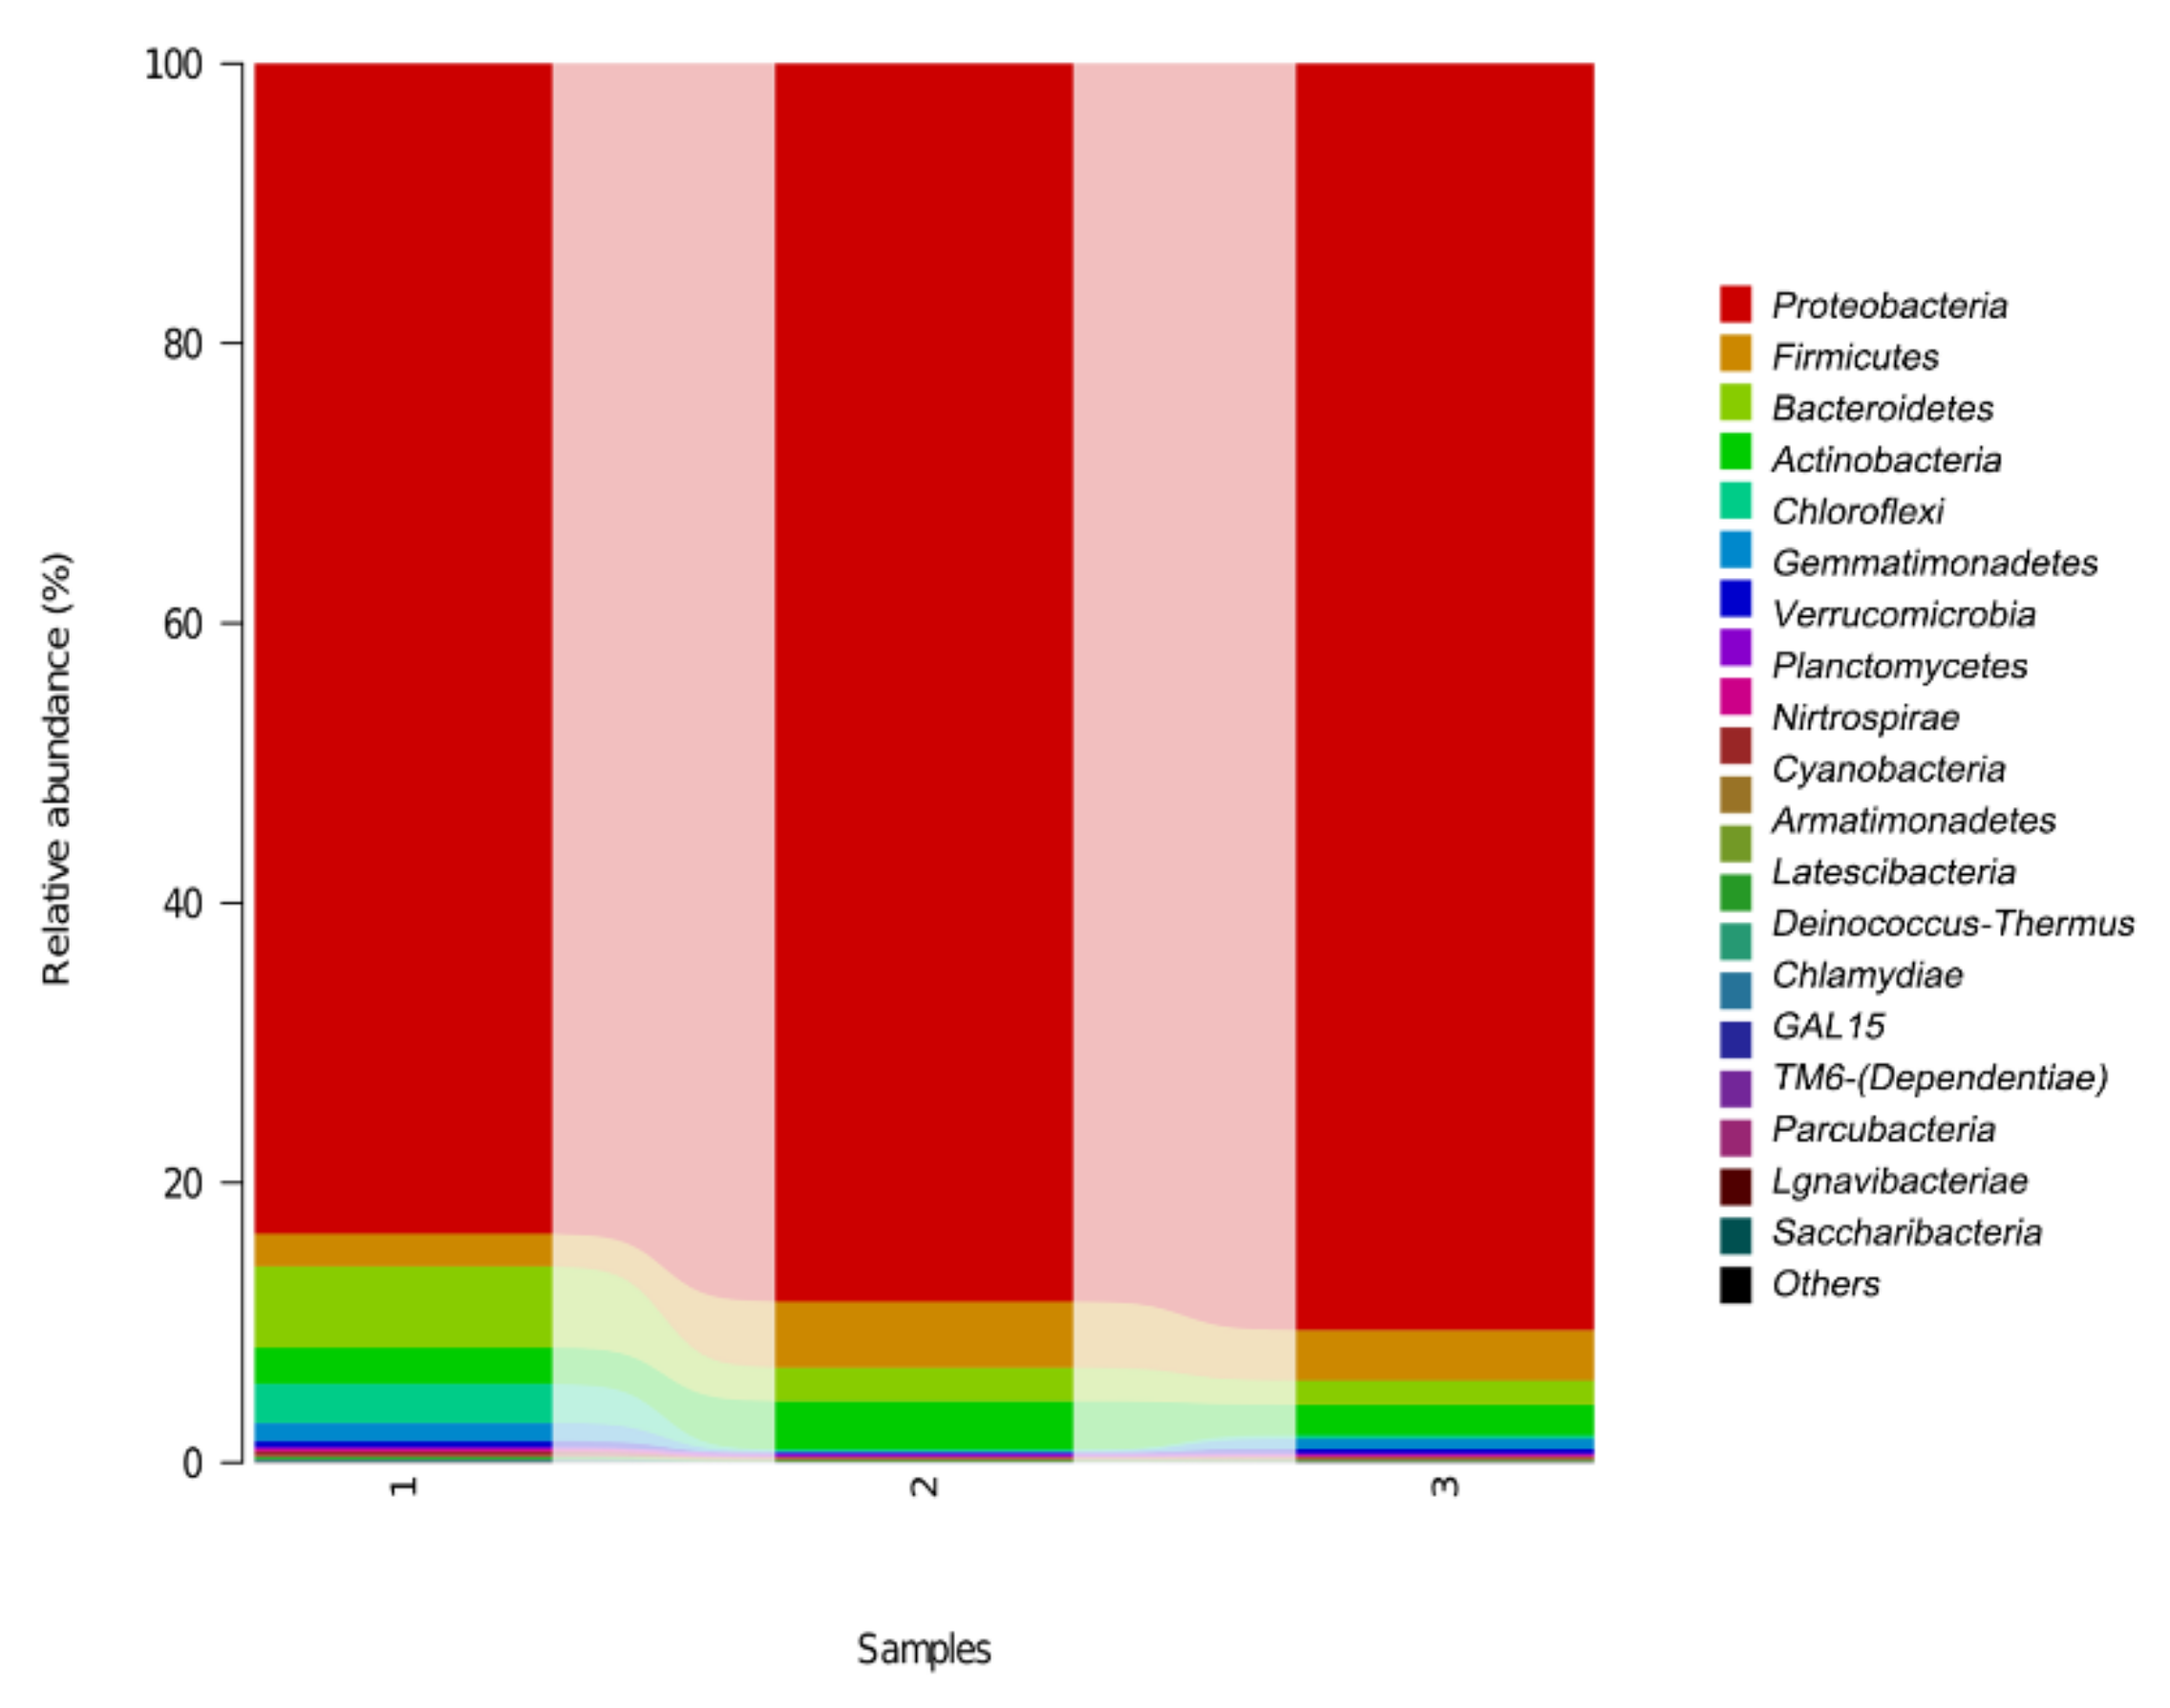
The sequencing results were analyzed and classified at the level of phylum, class, order, family, and genus so as to analyze the community structure and function of bacteria according to the species annotation results. The microbial community composition of the three samples at the phylum level is shown in Figure 6, including Proteobacteria, Firmicutes, Bacteroidetes, Actinobacteria, Acidobacteria, Chloroflexi, Verrucomicrobia, Planctomycetes, Nitrospirae, Cyanobacteria, and Armatimonadetes, accounting for 87.6%, 3.5%, 3.3%, 2.7%, 1.1%, 0.7%, 0.2%, 0.2%, 0.2%, and 0.1% of microbes in the samples, respectively. The community distribution of Proteobacteria was further analyzed (Table 5). Alpha-Proteobacteria, Beta-Proteobacteria, Gamma-Proteobacteria, and Delta-Proteobacteria were relatively dominant Proteobacteria. In terms of sample 1, their relative abundance ratios were 47.23%, 26.10%, 7.41%, and 2.89%; in terms of sample 2, their relative abundance ratios were 56.08%, 11.23%, 12.52%, and 8.65%; and in terms of sample 3, their relative abundance ratios were 63.57%, 12.46%, 12.69%, and 1.78%, respectively.
At the phylum level, there were no significant differences between the distribution of microbial communities in SSF1#, SSF2#, and SSF3#. The dominant species of the microbial communities in the three samples were similar, but their proportions were different. Proteobacteria was the dominant bacterium in the SSF system. This is consistent with [53], which found a high abundance of Pseudomonas sp. in sand samples; these were able to oxidize carbohydrates (e.g., glucose) to produce exopolysaccharides for biofilm formation. The Proteobacteria identified were mainly Alphaproteobacteria (55.6%), Betaproteobacteria (16.6%), Gammaproteobacteria (10.9%), and Deltaproteobacteria (4.4%). Sphingobacteriia is a human opportunistic pathogen, whose abundance was higher in Sample 1 than the other two. These trends suggest that SSF1# is effective at removing pathogens and reducing the risk of waterborne diseases [21]. Different particle sizes of river sand also create different adhesion conditions for microbial growth and propagation and produce selectivity for types of microbial growth, leading to differences in micro-organism structure and classification in biofilms [54].
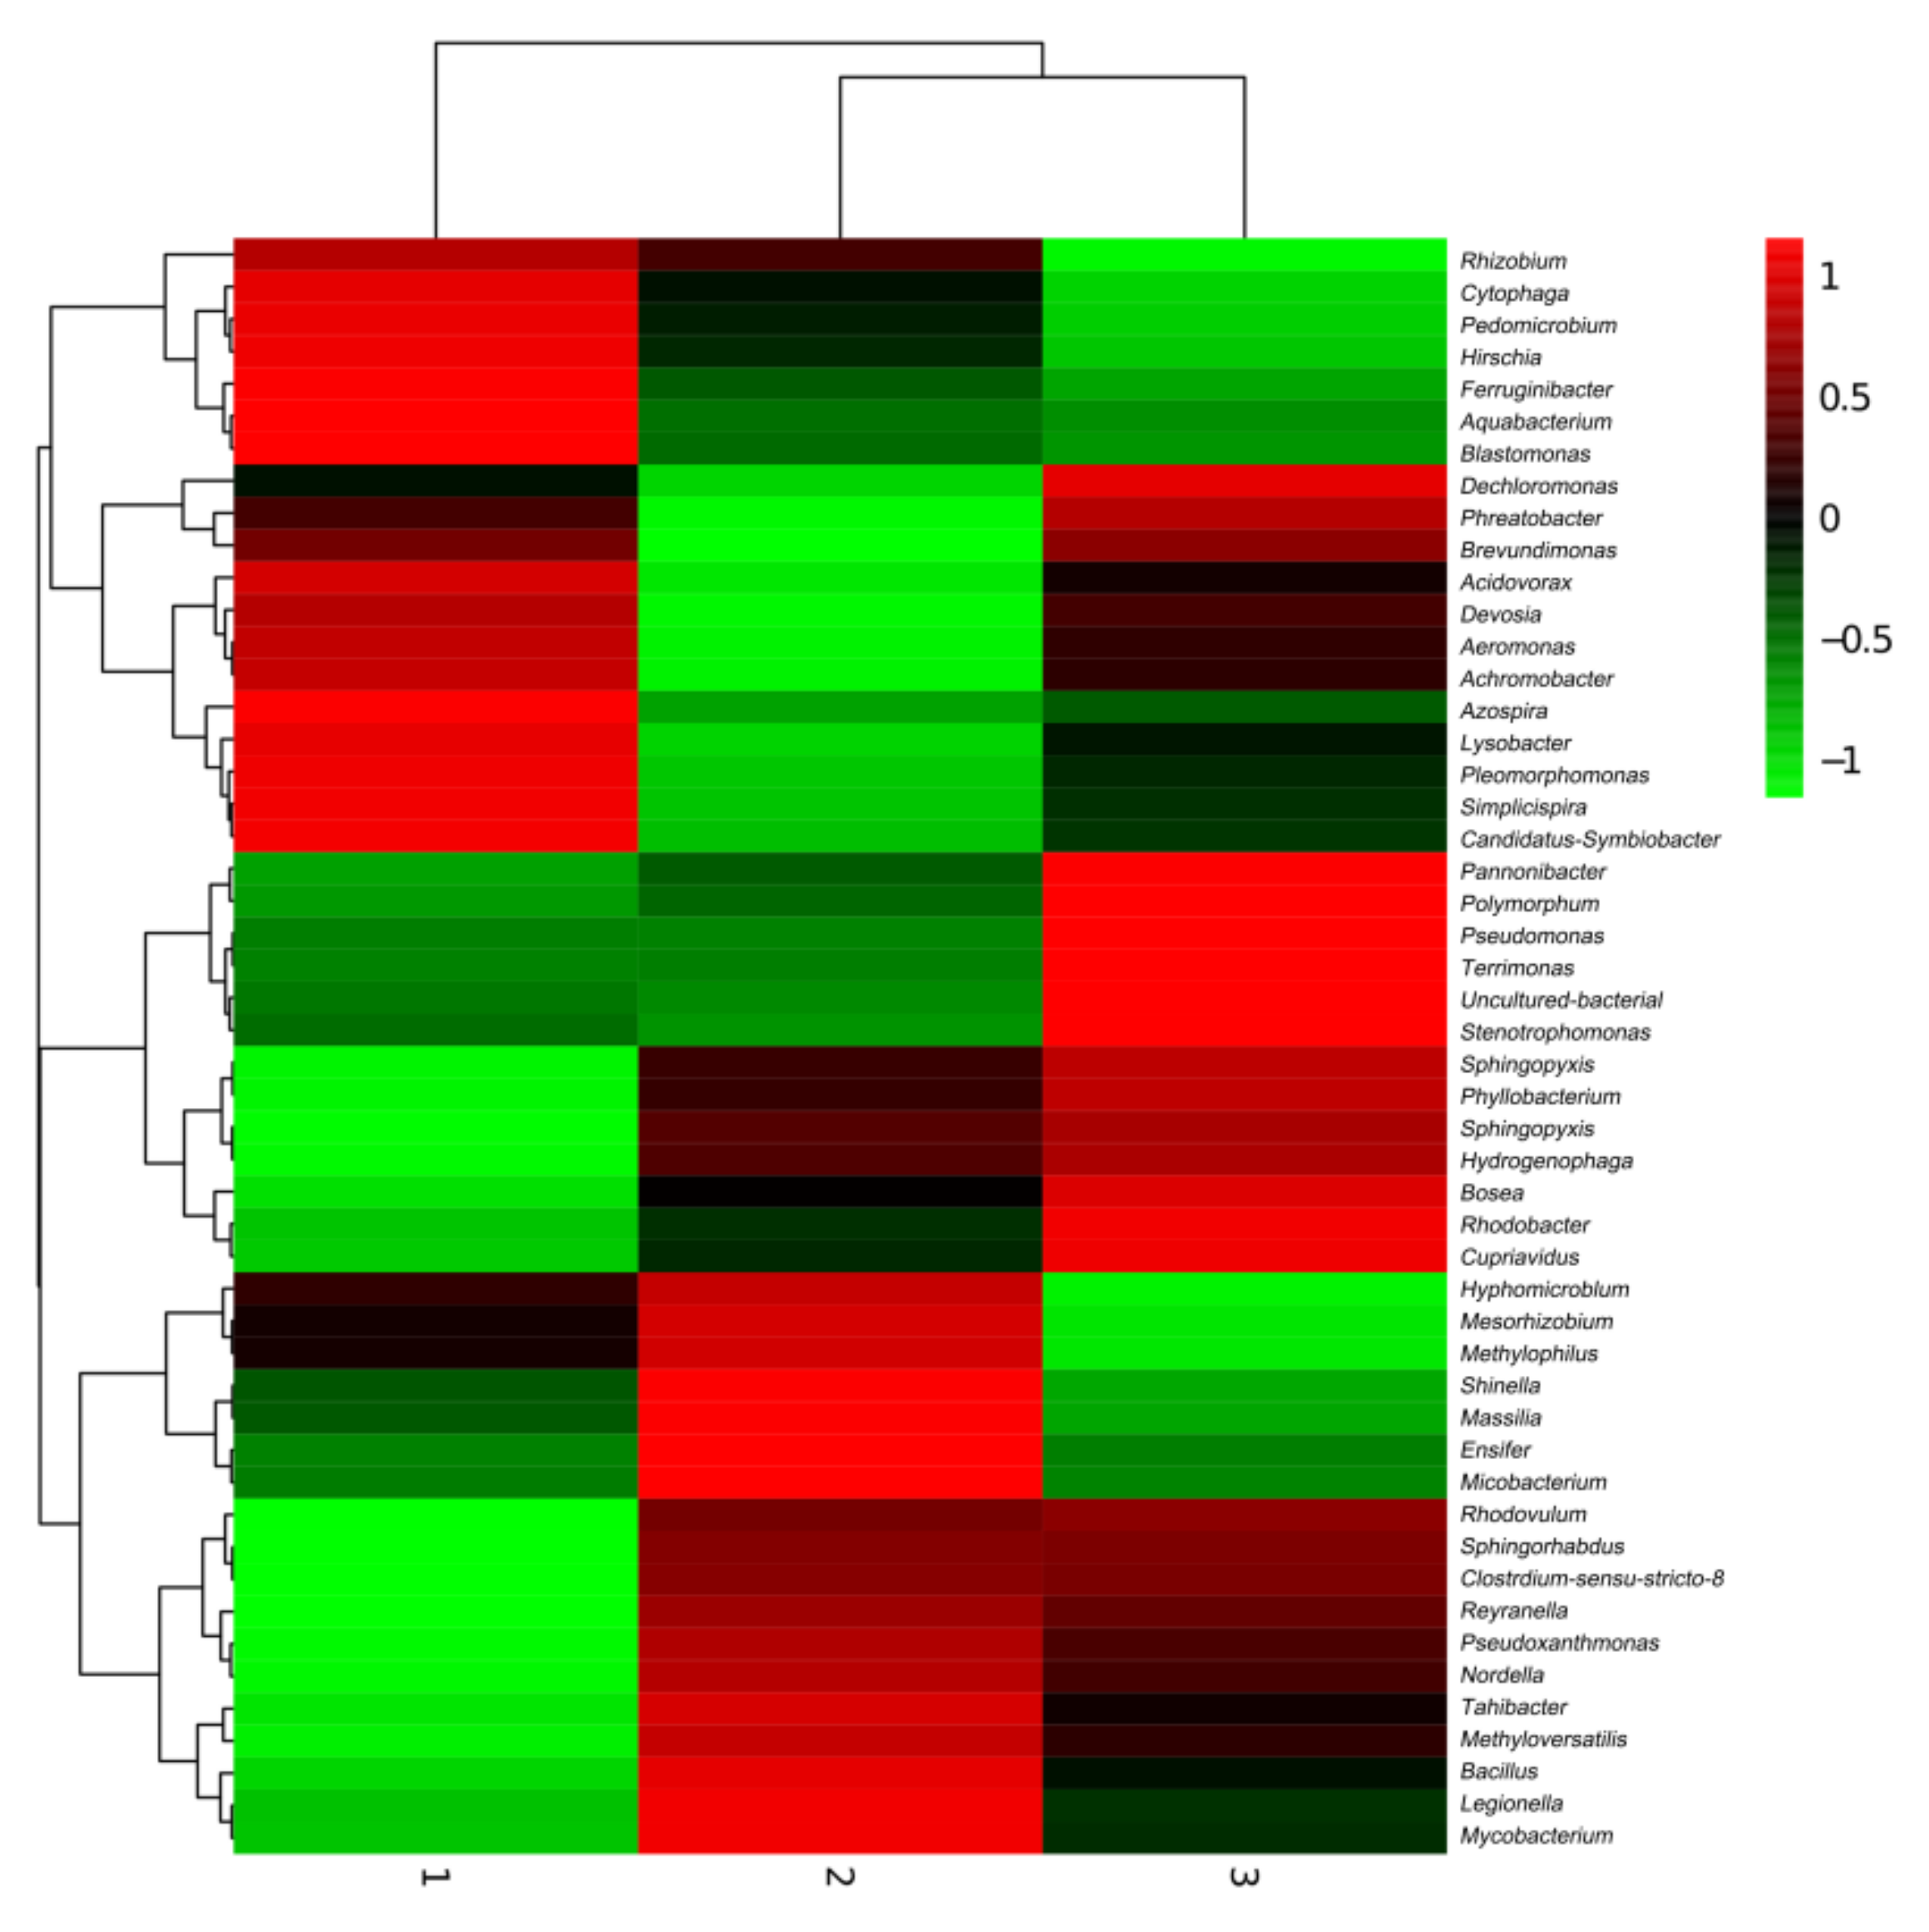
The heat map of 50 genera in each of the three SSFs is shown in Figure 7, in which the common genera accounted for more than 2.0% of the total number of samples. These included Mesorhizobium (9.03%, 11.54%, and 5.80%), Pannonibacter (4.19%, 5.5%, and 12.07%), Pseudoxanthomonas (3.93%, 8.51%, and 7.41%), Aquabacterium (12.4%, 3.66%, and 2.93%), Devosia (7.21%, 4.78%, and 6.57%), Bosea (2.06%, 5.16%, and 8.10%), Rhodobacter (3.67%, 4.16%, and 5.11%), Sphingopyxis (1.43%, 3.97%, and 4.62%), Acidovorax (4.02%, 0.79%, and 2.62%), Bacillus (1.51%, 3.37%, and 2.34%), Phreatobacter (2.57%, 1.62%, and 2.91%), and unidentified. However, the abundance of micro-organisms of each genus varied greatly in each SSF. As the raw water contained soil and grass, and the test sample contained Rhizobium (a nitrite oxidizer [55]), we found that Mesorhizobium can use glucose, rhamnose, and sucrose to produce acid. Pannonibacter can realize efficient removal of inorganic nitrogen [56]. A bacterial strain of Pseudoxanthomonas was isolated from a denitrification biofilter reactor, and it has denitrification ability and can reduce nitrate and nitrite [57]. The denitrification gene nirK was detected in Devosia sp. [58]. Rhodobacteraceae is a kind of purple non-sulfur bacteria that can use a variety of organic carbon sources in water for heterotrophic metabolic reactions [59]. Its concentration was significantly related to the concentration of ammonia nitrogen, nitrite, and nitrate in the water, and it can realize a heterotrophic nitrification-aerobic denitrification mechanism. The emergence of these and other bacteria formed a stable microbial ecosystem through the complex food chain, which stabilized the biofilm structure of the SSF system and provided shock resistance to the treatment of various pollutants in raw water.
4. Conclusions
In terms of physical adsorption, the smaller the particle size of the river sand is, the more pollutants are adsorbed under the same conditions. The Langmuir adsorption model has a higher fitting degree than the Freundlich model. River sand with a particle size of 0.1–0.5 mm has the shortest membrane-forming time, higher removal rates of CODMn and NH4+-N, and more abundant microbial species in the biofilm. Mesorhizobium, Pannonibacter, Pseudoxanthomonas, Aquabacterium, Devosia, and other bacteria have different proportions in each system, each forming its own stable biological chain system. However, this particle size range appears to be blocked in the short run. Considering all kinds of factors, the optimum size of the river sediment size is 0.5–1 mm.
Author Contributions
X.J. designed and performed the experiments and wrote the manuscript; C.Z., Y.L., J.Y. and B.L. edited the paper. All authors have read and agreed to the published version of the manuscript.
Funding
This study was funded by the National Key Research and Development Program of China sponsored by the Ministry of Science and Technology of the PRC (grant number 2018YFC0408102).
Institutional Review Board Statement
Not applicable.
Informed Consent Statement
Not applicable.
Data Availability Statement
The datasets generated and/or analyzed during the current study are available from the corresponding author upon reasonable request. Accession to cite for these SRA data: PRJNA740350.
Acknowledgments
We thank Beijing Biogenro Biotechonlogy Co., Ltd., where emulsion PCR and sequencing were performed. This study was funded by, the National Key Research and Development Program of China (grant number 2018YFC0408102) sponsored by the Ministry of Science and Technology of the PRC.
Conflicts of Interest
The authors have no relevant financial or non-financial interest to disclose.
References
- Ferreira, D.C.; Graziele, I.; Marques, R.C.; Gonçalves, J. Investment in drinking water and sanitation infrastructure and its impact on waterborne diseases dissemination: The Brazilian case. Sci. Total Environ. 2021, 779, 146279. [Google Scholar] [CrossRef]
- Word Health Organization (WHO). Drinking-Water. Fact Sheet. Available online: http://www.who.int/mediacentre/factsheets/fs391/en/ (accessed on 14 June 2019).
- Rodriguez-Caballero, A.; Ramond, J.-B.; Welz, P.J.; Cowan, D.A.; Odlare, M.; Burton, S.G. Treatment of high ethanol concentration wastewater by biological sand filters: Enhanced COD removal and bacterial community dynamics. J. Environ. Manag. 2012, 109, 54–60. [Google Scholar] [CrossRef]
- Huggett, R.D.; Haigh, I.D.; Purdie, D.A. Modelling the impact of river flow, macronutrients and solar radiation on the eutrophication status of small shallow estuaries. J. Mar. Syst. 2021, 222, 103606. [Google Scholar] [CrossRef]
- Feng, S.; Xie, S.; Zhang, X.; Yang, Z.; Ding, W.; Liao, X.; Liu, Y.; Chen, C. Ammonium removal pathways and microbial community in GAC-sand dual media filter in drinking water treatment. J. Environ. Sci. 2012, 24, 1587–1593. [Google Scholar] [CrossRef]
- Ministry of Ecology and Environment of the People’s Republic of China. Environment Quality. Water Environment Quality. National Surface Water Quality. Available online: https://www.mee.gov.cn/hjzl/shj/qgdbszlzk/ (accessed on 11 November 2021).
- Tellen, V.; Nkeng, G.; Dentel, S. Improved Filtration Technology for Pathogen Reduction in Rural Water Supplies. Water 2010, 2, 285–306. [Google Scholar] [CrossRef]
- Li, J.; Zhou, Q.; Campos, L.C. The application of GAC sandwich slow sand filtration to remove pharmaceutical and personal care products. Sci. Total Environ. 2018, 635, 1182–1190. [Google Scholar] [CrossRef]
- Centre for Affordable Water and Sanitation Technology (CAWST). Key Performance Indicators 2015; Centre for Affordable Water and Sanitation Technology: Calgary, AB, Canada, 2016. [Google Scholar]
- Ahammed, M.M.; Davra, K. Performance evaluation of biosand filter modified with iron oxide-coated sand for household treatment of drinking water. Desalination 2011, 276, 287–293. [Google Scholar] [CrossRef]
- Mpenyana-Monyatsi, L.; Mthombeni, N.H.; Onyango, M.S.; Momba, M.N. Costeffective filter materials coated with silver nanoparticles for the removal of pathogenic bacteria in groundwater. Int. J. Environ. Res. Public Health. 2012, 9, 244–271. [Google Scholar] [CrossRef]
- Chan, W.C.; Lu, M.C. A new type synthetic filter material for biofilter: Poly(vinyl alcohol)/peat composite bead. J. Appl. Polym. Sci. 2010, 88, 3248–3255. [Google Scholar] [CrossRef]
- Duran Romero, D.A.; de Almeida Silva, M.C.; Chaúque, B.J.M.; Benetti, A.D. Biosand Filter as a Point-of-Use Water Treatment Technology: Influence of Turbidity on Microorganism Removal Efficiency. Water 2020, 12, 2302. [Google Scholar] [CrossRef]
- Maciel, P.M.F.; Sabogal-Paz, L.P. Household slow sand filters with and without water level control: Continuous and intermittent flow efficiencies. Environ. Technol. 2020, 41, 944–958. [Google Scholar] [CrossRef]
- Terin, U.C.; Sabogal-Paz, L.P. Microcystis aeruginosa and microcystin-LR removal by household slow sand filters operating in continuous and intermittent flows. Water Res. 2019, 150, 29–39. [Google Scholar] [CrossRef]
- Jenkins, M.W.; Tiwari, S.K.; Darby, J. Bacterial, viral and turbidity removal by intermittent slow sand filtration for household use in developing countries: Experimental investigation and modeling. Water Res. 2011, 45, 6227–6239. [Google Scholar] [CrossRef]
- Andreoli, F.C.; Sabogal-Paz, L.P. Household slow sand filter to treat groundwater with microbiological risks in rural communities. Water Res. 2020, 186, 116352. [Google Scholar] [CrossRef]
- Haig, S.J.; Collins, G.J.; Davies, R.L.; Dorea, C.; Quince, C. Biological aspects of slow sand filtration: Past, present and future. Water Sci. Technol. 2011, 11, 468–472. [Google Scholar] [CrossRef]
- Lee, E.; Oki, L.R. Slow sand filters effectively reduce Phytophthora after a pathogen switch from Fusarium and a simulated pump failure. Water Res. 2013, 47, 5121–5129. [Google Scholar] [CrossRef]
- Zhang, B.; Fazal, S.; Gao, L.; Mahmood, Q.; Laghari, M.; Sayal, A. Biosand Filter Containing Melia Biomass Treating Heavy Metals and Pathogens. Pol. J. Environ. Stud. 2016, 25, 859–864. [Google Scholar] [CrossRef]
- Young-Rojanschi, C.; Madramootoo, C. Intermittent versus continuous operation of biosand filters. Water Res. 2014, 49, 1–10. [Google Scholar] [CrossRef]
- Campos, L.C.; Su, M.F.J.; Graham, N.J.D.; Smith, S.R. Biomass development in slow sand filters. Water Res. 2002, 36, 4543–4551. [Google Scholar] [CrossRef]
- Calvo-Bado, L.A.; Pettitt, T.R.; Parsons, N.; Petch, G.M.; Morgan, J.A.W.; Whipps, J.M. Spatial and Temporal Analysis of the Microbial Community in Slow Sand Filters Used for Treating Horticultural Irrigation Water. Appl. Environ. Microbiol. 2003, 69, 2116–2125. [Google Scholar] [CrossRef] [Green Version]
- Prest, E.I.; Hammes, F.; Kötzsch, S.; van Loosdrecht, M.C.M.; Vrouwenvelder, J.S. Monitoring microbiological changes in drinking water systems using a fast and reproducible flow cytometric method. Water Res. 2013, 47, 7131–7142. [Google Scholar] [CrossRef]
- Sun, H.; Shi, B.; Bai, Y.; Wang, D. Bacterial community of biofilms developed under different water supply conditions in a distribution system. Sci. Total Environ. 2014, 472, 99–107. [Google Scholar] [CrossRef]
- Ng, T.W.; Huang, G.; Wong, P.K. Investigation of drinking water bacterial community through high-throughput sequencing. J. Environ. Sci. 2015, 37, 154–156. [Google Scholar] [CrossRef]
- Haig, S.-J.; Quince, C.; Davies, R.L.; Dorea, C.C.; Collins, G. Replicating the microbial community and water quality performance of full-scale slow sand filters in laboratory-scale filters. Water Res. 2014, 61, 141–151. [Google Scholar] [CrossRef]
- Mittal, A.; Kurup, L.; Mittal, J. Freundlich and Langmuir adsorption isotherms and kinetics for the removal of Tartrazine from aqueous solutions using hen feathers. J. Hazard. Mater. 2007, 146, 243–248. [Google Scholar] [CrossRef] [Green Version]
- Syers, J.K.; Browman, M.G.; Smillie, G.W.; Corey, R.B. Phosphate Sorption by Soils Evaluated by the Langmuir Adsorption Equation. Soil Sci. Soc. Am. J. 1973, 37, 358–363. [Google Scholar] [CrossRef]
- Jeppu, G.P.; Clement, T.P. A modified Langmuir-Freundlich isotherm model for simulating pH-dependent adsorption effects. J. Contam. Hydrol. 2012, 129, 46–53. [Google Scholar] [CrossRef]
- Okeola, F.O.; Odebunmi, E.O. Comparison of Freundlich and Langmuir Isotherms for Adsorption of Methylene Blue by Agrowaste Derived Activated Carbon. Adv. Environ. Biol. 2010, 4, 329–335. [Google Scholar]
- Ge, D.; Shi, W.; Ren, L.; Zhang, F.; Zhang, G.; Zhang, X.; Zhang, Q. Variation analysis of affinity-membrane model based on Freundlich adsorption. J. Chromatogr. A 2006, 1114, 40–44. [Google Scholar] [CrossRef]
- French, D. Granular filter media: Evaluating filter bed depth to grain size ratio. Filtr. Sep. 2012, 49, 34–36. [Google Scholar] [CrossRef]
- Matuzahroh, N.; Fitriani, N.; Ardiyanti, P.E.; Kuncoro, E.P.; Budiyanto, W.D.; Isnadina, D.R.M.; Wahyudianto, F.E.; Mohamed, R.M.S.R. Behavior of schmutzdecke with varied filtration rates of slow sand filter to remove total coliforms. Heliyon 2020, 6, e03736. [Google Scholar] [CrossRef]
- Wang, H.; Narihiro, T.; Straub, A.P.; Pugh, C.R.; Tamaki, H.; Moor, J.F.; Bradley, I.M.; Kamagata, Y.; Liu, W.-T.; Nguyen, T.H. MS2 Bacteriophage Reduction and Microbial Communities in Biosand Filters. Environ. Sci. Technol. 2014, 48, 6702–6709. [Google Scholar] [CrossRef]
- Weber-Shirk, M.L.; Chan, K.L. The role of aluminum in slow sand filtration. Water Res. 2007, 41, 1350–1354. [Google Scholar] [CrossRef]
- Muhammad, N.; Hooke, A.M. Biomass characterization of slow sand filtration schmutzdecke and its effects on filter performance. Environ. Technol. 2003, 24, 43–50. [Google Scholar] [CrossRef]
- Yang, H.; Tang, X.; Luo, X.; Li, G.; Liang, H.; Snyder, S. Oxidants-assisted sand filter to enhance the simultaneous removals of manganese, iron and ammonia from groundwater: Formation of active MnOx and involved mechanisms. J. Hazard. Mater. 2021, 415, 125707. [Google Scholar] [CrossRef]
- Leverenz, H.L.; Tchobanoglous, G.; Darby, J.L. Clogging in intermittently dosed sand filters used for wastewater treatment. Water Res. 2009, 43, 695–705. [Google Scholar] [CrossRef]
- Thullner, M.; Mauclaire, L.; Schroth, M.; Kinzelbach, W.; Zeyer, J. Interaction between water flow and spatial distribution of microbial growth in a two-dimensional flow field in saturated porous media. J. Contam. Hydrol. 2002, 58, 169–189. [Google Scholar] [CrossRef]
- Baveye, P.; Vandevivere, P.; Hoyle, B.L.; DeLeo, P.; De Lozada, D.S. Environmental Impact and Mechanisms of the Biological Clogging of Saturated Soils and Aquifer Materials. Crit. Rev. Environ. Sci. Technol. 1998, 28, 123–191. [Google Scholar] [CrossRef] [Green Version]
- McKinley, J.W.; Siegrist, R.L. Soil Clogging Genesis in Soil Treatment Units Used for Onsite Wastewater Reclamation: A Review. Crit. Rev. Environ. Sci. Technol. 2011, 41, 2186–2209. [Google Scholar] [CrossRef]
- Tanner, C.C.; Sukias, J.; Upsdell, M. Organic matter accumulation during maturation of gravel-bed constructed wetlands treating farm dairy wastewaters. Water Res. 1998, 32, 3046–3054. [Google Scholar] [CrossRef]
- Singer, S.; Skinner, B.; Cantwell, R.E. Impact of surface maintenance on BioSand filter performance and flow. J. Water Health 2017, 15, 262–272. [Google Scholar] [CrossRef] [Green Version]
- Freitas, B.L.S.; Terin, U.C.; Fava, N.M.N.; Maciel, P.M.F.; Garcia, L.A.T.; Medeiros, R.C.; Oliveira, M.; Fernandez-Ibañez, P.; Byrne, J.; Sabogal-Paz, L. A critical overview of household slow sand filters for water treatment. Water Res. 2021, 208, 117870. [Google Scholar] [CrossRef]
- Chao, A.; Shen, T.-J. Nonparametric prediction in species sampling. J. Agric. Biol. Environ. Stat. 2004, 9, 253–269. [Google Scholar] [CrossRef] [Green Version]
- Yang, C.M.C.K. Stopping rules and estimation for recapture debugging with unequal failure rates. Biometrika 1993, 80, 193–201. [Google Scholar]
- Shannon, C.E. A mathematical theory of communication. Bell Syst. Tech. J. 1948, 27, 379–423. [Google Scholar] [CrossRef] [Green Version]
- Simpson, E.H. Measurement of diversity. Nature 1949, 163, 688. [Google Scholar] [CrossRef]
- Elliott, M.; DiGiano, F.; Sobsey, M. Virus attenuation by microbial mechanisms during the idle time of a household slow sand filter. Water Res. 2011, 45, 4092–4102. [Google Scholar] [CrossRef]
- Li, J.; Wang, J.-T.; Hu, H.-W.; Cai, Z.-J.; Lei, Y.-R.; Li, W.; Zhang, M.-Y.; Li, Z.-M.; Zhu, Y.-N.; Cui, L.-J. Changes of the denitrifying communities in a multi-stage free water surface constructed wetland. Sci. Total Environ. 2019, 650, 1419–1425. [Google Scholar] [CrossRef]
- Wittebolle, L.; Marzorati, M.; Clement, L.; Balloi, A.; Daffonchio, D.; Heylen, K.; De Vos, P.; Verstraete, W.; Boon, N. Initial community evenness favours functionality under selective stress. Nat. Cell Biol. 2009, 458, 623–626. [Google Scholar] [CrossRef]
- White, R.A., 3rd; Power, I.M.; Dipple, G.M.; Southam, G.; Suttle, C.A. Metagenomic analysis reveals that modern microbialites and polar microbial mats have similar taxonomic and functional potential. Front. Microbiol. 2015, 6, 966. [Google Scholar] [CrossRef] [Green Version]
- Langenbach, K.; Kuschk, P.; Horn, H.; Kästner, M. Modeling of slow sand filtration for disinfection of secondary clarifier effluent. Water Res. 2010, 44, 159–166. [Google Scholar] [CrossRef]
- Fu, J.; Lee, W.-N.; Coleman, C.; Meyer, M.; Carter, J.; Nowack, K.; Huang, C.-H. Pilot investigation of two-stage biofiltration for removal of natural organic matter in drinking water treatment. Chemosphere 2017, 166, 311–322. [Google Scholar] [CrossRef]
- Bai, H.; Liao, S.; Wang, A.; Huang, J.; Shu, W.; Ye, J. High-efficiency inorganic nitrogen removal by newly isolated Pannonibacter phragmitetus B1. Bioresour. Technol. 2019, 271, 91–99. [Google Scholar] [CrossRef]
- Meng, X.; Niu, G.; Yang, W.; Cao, X. Di(2-ethylhexyl) phthalate biodegradation and denitrification by a Pseudoxanthomonas sp. strain. Bioresour. Technol. 2015, 180, 356–359. [Google Scholar] [CrossRef]
- Falk, S.; Liu, B.; Braker, G. Isolation, genetic and functional characterization of novel soil nirK-type denitrifiers. Syst. Appl. Microbiol. 2010, 33, 337–347. [Google Scholar] [CrossRef]
- Bai, Y.; Liu, R.; Liang, J.; Qu, J. Integrated Metagenomic and Physiochemical Analyses to Evaluate the Potential Role of Microbes in the Sand Filter of a Drinking Water Treatment System. PLoS ONE 2013, 8, e61011. [Google Scholar] [CrossRef] [Green Version]
Figure 1.
Experimental equipment. (a) Design drawing. (b) Physical apparatus.

Figure 2.
Adsorption isotherms of river sand with different particle sizes and pollutants. (a) CODMn. (b) NH4+-N.
Figure 2.
Adsorption isotherms of river sand with different particle sizes and pollutants. (a) CODMn. (b) NH4+-N.

Figure 3.
Relationship between different particle sizes and removal rate. (a) CODMn. (b) Ammonia nitrogen.
Figure 3.
Relationship between different particle sizes and removal rate. (a) CODMn. (b) Ammonia nitrogen.

Figure 4.
Photos of equipment in operation; SSF1#, SSF2#, and SSF3# (from left to right). Clogging became evident in SSF1#.
Figure 4.
Photos of equipment in operation; SSF1#, SSF2#, and SSF3# (from left to right). Clogging became evident in SSF1#.

Figure 5.
OTU Venn diagram. Each circle represents a sample; the overlap between the circles indicates the common OTUs between the samples, and the number of each block indicates the number of common or unique OTUs of the samples contained in the block.
Figure 5.
OTU Venn diagram. Each circle represents a sample; the overlap between the circles indicates the common OTUs between the samples, and the number of each block indicates the number of common or unique OTUs of the samples contained in the block.

Figure 6.
Bacterial community structure and distribution at the phylum level.

Figure 7.
Generic level community composition heat map with cluster analysis. Samples are first clustered according to their composition similarity and then arranged horizontally according to the clustering results. Similarly, taxa are also clustered according to their distribution similarity in different samples and are arranged vertically according to the clustering results. In the figure, red represents the genera with high abundance in the corresponding sample, and green represents the genera with low abundance.


Table 1.
Water quality of inflow.
| Parameter | Concentration Range | Average | Standards for Drinking Water Quality (GB5749-2006) in China |
|---|---|---|---|
| CODMn (mg/L) | 8.48–12.3 | 10.4 | 3 (5) 1 |
| Ammonia Nitrogen (mg/L) | 0.84–1.5 | 1.1 | 0.5 |
| Turbidity (NTU) | 7.5–12.1 | 9.9 | 1 (3) |
| pH | 7.5–8.2 | 7.7 | 6.5–9.5 |
| Trace elements 2 | - | - | - |
1 The numbers in parentheses are used when the technical conditions of the water source and water purification are limited. 2 Nutrient solution of trace elements (1 L) includes 1 g of FeSO4·7H2O, 0.12 g of ZnSO4·7H2O, 0.12 g of MnSO4·H2O, 0.03 g of CuSO4·5H2O, 0.06 g of NaMoO4·2H2O, 0.18 g of KI, and 2.5 g of EDTA.
Table 2.
Adsorption model parameters of CODMn and NH4+-N.
| Adsorbent | CODMn | NH4+-N | |||||
|---|---|---|---|---|---|---|---|
| Langmuir adsorption model | particle size range (mm) | 0.1–0.5 | 0.5–1 | 1–1.5 | 0.1–0.5 | 0.5–1 | 1–1.5 |
| R2 | 0.9702 | 0.9829 | 0.9401 | 0.9435 | 0.9486 | 0.9414 | |
| a | 88.9281 | 73.2674 | 68.7745 | 21.6058 | 22.77677 | 23.67681 | |
| b | 0.0542 | 0.0429 | 0.0385 | 0.2573 | 0.16427 | 0.12456 | |
| Freundlich adsorption model | R2 | 0.9593 | 0.9693 | 0.9221 | 0.9269 | 0.9332 | 0.9285 |
| k | 6.9740 | 7.8695 | 6.9740 | 5.41278 | 4.16285 | 3.46424 | |
| 1/n | 0.4674 | 0.4642 | 0.4674 | 0.4406 | 0.5107 | 0.5567 | |
Table 3.
The number of OTU divisions for different classification statuses.
| Sample | Phylum | Class | Order | Family | Genus | Species | Unclassified |
|---|---|---|---|---|---|---|---|
| 1 | 2621 | 2602 | 2442 | 2344 | 1768 | 192 | 0 |
| 2 | 1707 | 1706 | 1699 | 1663 | 1348 | 150 | 0 |
| 3 | 1856 | 1852 | 1813 | 1764 | 1422 | 152 | 0 |
Table 4.
Alpha diversity of the different samples.
| Sample | ACE | Chao | Simpson | Shannon |
|---|---|---|---|---|
| 1 | 3614.31 | 3425.27 | 0.975296 | 8.13 |
| 2 | 2091.49 | 1967.24 | 0.978057 | 7.69 |
| 3 | 1857.00 | 1857.00 | 0.979462 | 8.09 |
Table 5.
Percentages of the major classes in each SSF (%).
| Plum | Class | Total | Sample 1 | Sample 2 | Sample 3 |
|---|---|---|---|---|---|
| Proteobacteria | Alphaproteobacteria | 55.6 | 47.23 | 56.08 | 63.57 |
| Proteobacteria | Betaproteobacteria | 16.6 | 26.10 | 11.23 | 12.46 |
| Proteobacteria | Gammaproteobacteria | 10.9 | 7.41 | 12.52 | 12.69 |
| Proteobacteria | Deltaproteobacteria | 4.4 | 2.89 | 8.65 | 1.78 |
| Firmicutes | Bacilli | 2.6 | 1.59 | 3.57 | 2.52 |
| Actinobacteria | Actinobacteria | 2.5 | 2.22 | 3.41 | 1.86 |
| Bacteroidetes | Sphingobacteriia | 2.1 | 3.61 | 1.46 | 1.31 |
| Bacteroidetes | Cytophagia | 1.1 | 2.09 | 0.90 | 0.38 |
| Firmicutes | Clostridia | 1.0 | 0.72 | 1.14 | 1.05 |
| Acidobacteria | Holophagae | 0.6 | 1.74 | 0.01 | 0.05 |
| Chloroflexi | Anaerolineae | 0.3 | 0.55 | 0.12 | 0.29 |
| Gemmatimonadetes | Gemmatimonadetes | 0.2 | 0.42 | 0.00 | 0.27 |
| Acidobacteria | Subgroup_6 | 0.2 | 0.50 | 0.01 | 0.12 |
| Chloroflexi | KD4-96 | 0.2 | 0.34 | 0.00 | 0.18 |
| Acidobacteria | Blastocatellia | 0.2 | 0.34 | 0.08 | 0.05 |
| Verrucomicrobia | Verrucomicrobiae | 0.2 | 0.10 | 0.23 | 0.13 |
| Actinobacteria | Acidimicrobiia | 0.1 | 0.19 | 0.03 | 0.19 |
| Nitrospirae | Nitrospira | 0.1 | 0.27 | 0.10 | 0.04 |
| Armatimonadetes | Armatimonadia | 0.1 | 0.04 | 0.15 | 0.08 |
| others | 1 | 1.6 | 0.4 | 0.96 | |
Publisher’s Note: MDPI stays neutral with regard to jurisdictional claims in published maps and institutional affiliations. |
© 2022 by the authors. Licensee MDPI, Basel, Switzerland. This article is an open access article distributed under the terms and conditions of the Creative Commons Attribution (CC BY) license (https://creativecommons.org/licenses/by/4.0/).
Share and Cite
MDPI and ACS Style
Ji, X.; Zhao, C.; Lv, Y.; Yang, J.; Li, B. Influence of Particle Size of River Sand on the Decontamination Process in the Slow Sand Filter Treatment of Micro-Polluted Water. Water 2022, 14, 100. https://doi.org/10.3390/w14010100
AMA Style
Ji X, Zhao C, Lv Y, Yang J, Li B. Influence of Particle Size of River Sand on the Decontamination Process in the Slow Sand Filter Treatment of Micro-Polluted Water. Water. 2022; 14(1):100. https://doi.org/10.3390/w14010100
Chicago/Turabian StyleJi, Xuemei, Cui Zhao, Yufeng Lv, Jifu Yang, and Bin Li. 2022. "Influence of Particle Size of River Sand on the Decontamination Process in the Slow Sand Filter Treatment of Micro-Polluted Water" Water 14, no. 1: 100. https://doi.org/10.3390/w14010100
Note that from the first issue of 2016, this journal uses article numbers instead of page numbers. See further details here.