Article

A SEEC Model Based on the DPSIR Framework Approach for Watershed Ecological Security Risk Assessment: A Case Study in Northwest China

1
Engineering Research Center of Groundwater Pollution Control and Remediation of Ministry of Education, College of Water Sciences, Beijing Normal University, Beijing 100875, China
2
State Environmental Protection Key Laboratory of Eco-Environmental Damage Identification and Restoration, Chinese Academy of Environmental Planning, Beijing 100012, China
3
Hebei Institute of Water Science, Shijiazhuang 050051, China
*
Authors to whom correspondence should be addressed.
Water 2022, 14(1), 106; https://doi.org/10.3390/w14010106
Submission received: 30 November 2021 / Revised: 31 December 2021 / Accepted: 31 December 2021 / Published: 4 January 2022
(This article belongs to the Special Issue River Ecological Restoration and Groundwater Artificial Recharge)

Abstract

:
The DPSIR model is a conceptual model established by the European Environment Agency to solve environmental problems. It provides an overall framework for analysis of environmental problems from five aspects: driving force (D), pressure (P), state (S), impact (I), and response (R). Through use of the DPSIR model framework, this paper presents the SEEC model approach for evaluating watershed ecological security. The SEEC model considers four aspects: socioeconomic impact (S), ecological health (E), ecosystem services function (E), and control management (C). Through screening, 38 evaluation indicators of the SEEC model were determined. The evaluation results showed that the ecological security index of the study area was >80, indicating a generally safe level. The lowest score was mainly attributable to the low rate of treatment of rural domestic sewage. The water quality status was used to evaluate the applicability of the SEEC model, and the calculation results indicated that the higher the score of the ecological security evaluation results, the better the water quality status. The findings show that the SEEC model demonstrates satisfactory applicability to evaluation of watershed ecological security.

1. Introduction

The footprints of human activities have covered the world [1]. In the process of rapid development of both industry and agriculture, the ecological environment has suffered unprecedented damage [2,3]. Globally, the soil [4,5], water [6,7], air [8,9], and other environmental media in areas with frequent human activity are in a state of continuous deterioration [10,11]. Ecosystem degradation and environmental pollution are gradually threatening and destroying human socioeconomic progress, survival, and development [12,13]. In recent years, researchers have attempted to evaluate the consequences and degree of risk associated with current changes of the ecological environment but without reaching consensus [14,15].
China remains in the process of rapid economic growth and urbanization. However, various ecological and environmental problems continue to emerge, threatening to destroy China’s sustainable development and affecting the living conditions of the population [16]. China has experienced ecological and environmental crises in the past and it now faces many new challenges regarding environmental protection. Therefore, President Xi proposed the idea of an ecological civilization, which means that China’s model of development has changed from that of “grow first, clean up later” to one of sustainable development [17,18]. At the policy level and in everyday life, the expectation is for a safer and cleaner living environment. In the past, researchers often used the concept of environmental risk to assess whether the environment of a region might pose a threat to human health. Specifically, such assessments can be used to evaluate whether the current ecological situation of an area in which humans survive continues to be safe and whether it can ensure the environmental needs of human life and development. Therefore, evaluation of ecological safety is vital.
The main objective of ecological security assessment is to determine the ecological status and ecological pressure faced by a region under normal human activities [19]. It was formally proposed by the International Institute for Applied Systems Analysis in 1989 [20]. Evaluation results can be expressed using the ecological security index (ESI). A high ESI value indicates that the ecological state of the evaluation receptor is able to not only ensure the needs of human survival and development but also resist the pressures brought by human development. Therefore, through scientific evaluation of the factors on which the ESI is based, policies can be formulated to improve the situation. This approach also makes the work of ecological protection more refined and targeted, which is of great importance considering China’s current state of development and environmental protection [21,22].
In accordance with different evaluation objects, ecological security can be divided into water ecological security [23], land ecological security [24], coastal ecological security [25], and urban ecological security [26], and all these aspects of ecological security assessment have been widely studied and applied. Broadly, ecological security includes natural ecological security, economic ecological security, and social ecological security, which mainly refers to a state in which human life, health, and resources are not threatened in terms of the above aspects. In this study, we were interested in the ecological security of a watershed, which refers to the ecological state of the lakes, rivers, and other areas within a catchment, and its ability to resist the ecological pressure brought by human activities.
Currently, model evaluation methods are used in ecological security assessment, and the most commonly used evaluation models include the PSR model, DSR model, and DPSIR model [27]. In 1979, Rapport and Friend proposed a model framework for analyzing and describing the interaction between socioeconomic development and the ecological environment, which was further improved by the Organization for Economic Co-operation and Development and United Nations Environment Programme, forming the PSR model framework [28]. The basic connotation of the PSR model is that human activities exert pressure on the environment and its natural resources (P-pressure), which changes the state of both the environment and the quality of the natural resources (S-state), forcing human society to respond to these state changes through adoption of policies, decisions, or management measures that affect the environment, economy, and land (R-response) [29]. The PSR model is suitable for ecological security evaluation on a small spatial scale and with few influencing factors. However, because it simplifies the causal relationship between indicators, it ignores the complexity of the system, especially the driving force factors of ecological security [30]. To overcome this weakness, the United Nations Conference on Sustainable Development established the DSR framework in 1996, in which the driving force factors (D) refer to the regional socioeconomic objectives which represent the fundamental environmental pressure. The DSR model can better characterize the impact of the driving force factors on ecosystem evolution, but the definitions of the driving force factors and the response factors in the model were vague. Therefore, to improve the applicability of the DSR model, in 1999, the European Environment Agency officially adopted the DPSIR model (driving force–pressure–state–influence–response), in which influence refers to the impact of changes in environmental status on environmental receptors [31]. The model combines the characteristics of the PSR and DSR frameworks. It has the advantages of comprehensiveness, systematicness, and flexibility, and covers five assessment factors and constructs a causal network between them to reflect the impact of socioeconomic development and human activities on the system state and the human response to adverse impacts [32].
In the DPSIR model framework suitable for watershed ecological security assessment, factor D generally includes population, socioeconomic, and other indicators; factor P generally includes pollutant discharge and other indicators; factor S generally includes water quality status, sediment status, and other indicators; factor I generally includes water service function and other indicators; and factor R generally includes river protection policy, ecological restoration, and other indicators. Generally, the DPSIR model framework is a circular system, i.e., the driving force leads to pressure, then the pressure changes the state, and the change of state has a consequential impact, which promotes a response that leads to adjustment of the driving force [33]. In recent years, the DPSIR model has been widely accepted and used in the process of ecological security research because it can reveal causal relationships between ecology and human activities [33,34,35,36,37,38,39,40]. It provides a conceptual model for a research scheme for evaluation of human activities, resources, the ecology, and sustainable development [41,42] and is also applied to interdisciplinary research [36,43]. Through application of the DPSIR model framework, many studies have performed ecological security evaluation of lakes, rivers, land, and oceans, thereby providing a scientific basis for further expansion of the connotation and application of the DPSIR model framework [44,45].
Although the DPSIR model has been used widely in many fields, applicability of the evaluation method has been limited owing to inconsistent selection of indicators, poor analysis of the reasons for the selection of indicators, and unclear determination of the process of index weighting [27,46,47,48]. Additionally, in previous watershed ecological security assessments, factors D and P were usually evaluated using socioeconomic and other related indicators, and ecological indicators were ignored, which resulted in overestimation of the impact of policy and economic development and underestimation of the ability of the ecosystem to deal with the pressure (factor P). Furthermore, the existing evaluation method lacks verification of the evaluation results, thereby diminishing the reliability and guidance of the evaluation results [49,50]. To resolve the problems of poor applicability of the DPSIR model to watershed ecological security evaluation and lack of a verification method, this study adopted the following research methods. By identifying the key factors affecting the ecological security of a watershed, and through analyzing the DPSIR model framework, the SEEC model including the process of indicator selection and the determination of weights was established. A study area was selected for application of the new model, and a method of water quality evaluation and analysis was innovatively used to evaluate the applicability of the SEEC model. The study area, located in an arid area in Northwest China, comprised a watershed that represents an important water supply source for a large city. However, owing to the specific geographical location and the harsh natural environment of the watershed, research data were scant, and therefore a watershed ecological security assessment was not undertaken. The ESI of the study area was obtained, and the reasons for low ESI values were analyzed, on the basis of which, suggestions for improvement of the ESI of the watershed were proposed. The results could serve both as a reference for subsequent environmental planning and management and as a scientific basis for comprehensive pollution control and ecological environmental protection of the study area.

2. Materials and Methods

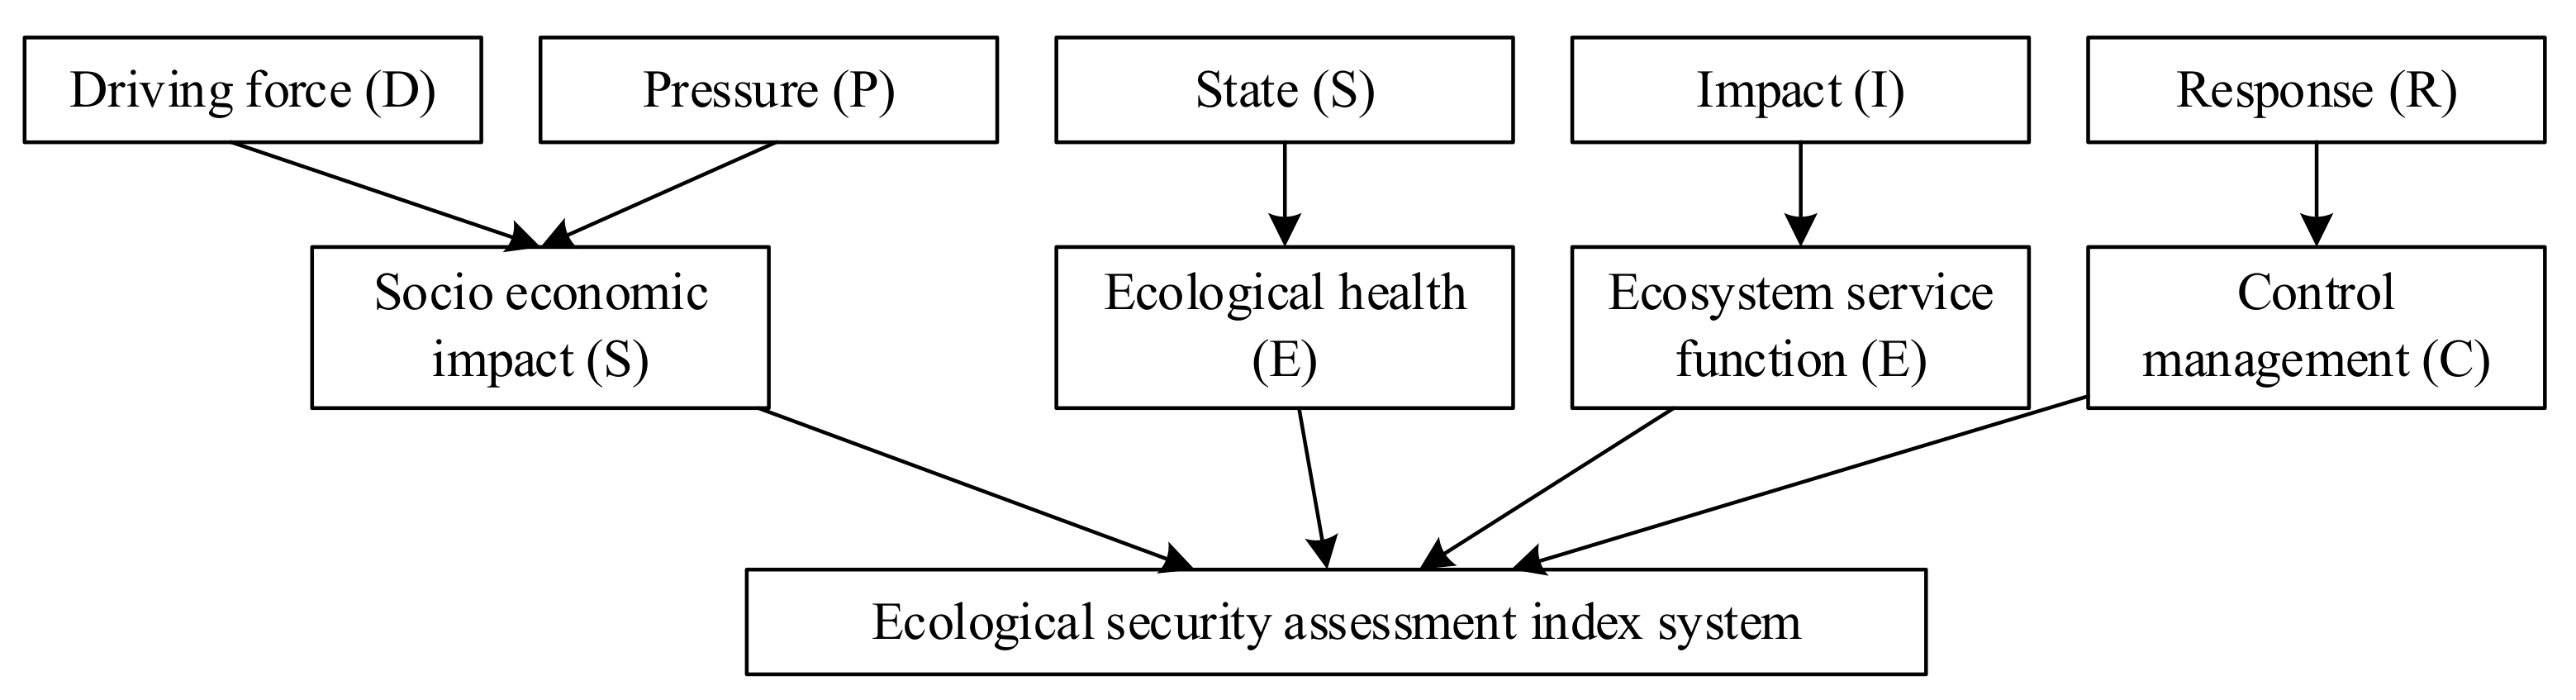
2.1. Construction of the Evaluation Model

2.1.1. Identification of the Model

Currently, methods used for watershed ecological security assessment are not unified. By identifying the connotation of the model, this article established a method suitable for watershed ecological security assessment under the framework of the DPSIR model. However, the DPSIR model only provides an evaluation framework, and it does not offer methods for selecting and evaluating the applicability of indicators. Therefore, using the DPSIR model framework, this study identified the primary indicators of each factor and, in combination with consideration of the key issues of watershed ecological security assessment, the SEEC model was constructed. The essence of the SEEC model is that it is a representation of the DPSIR model framework specifically suited to watershed ecological security assessment. Therefore, in building the SEEC model, the connotation of the DPSIR model should be identified first, and an index system suitable for watershed ecological security assessment should also be established.
The essence of the DPSIR model is to identify the main factors affecting ecological security under the influence of human activities. It needs to determine the ecological state under the action of these factors, identify the impact, select relevant indicators of the response, evaluate the state of ecological security in terms of the five aspects, and obtain the ESI. Therefore, the key to using the DPSIR model to evaluate watershed ecological security is to accurately identify representative indicators that can characterize watershed ecological security.
The driving force factors (D) in the DPSIR model mainly represent social development and economic growth, reflecting the trends of population change, socioeconomic activity, and industrial economic development. These factors represent potential causes of environmental change, and they are also the most primitive and important indicators of change of the water environment security system.
Pressure factors (P) refer to the pressure applied directly to the water ecosystem through the driving force (D). Similar to D, P is an external force that affects the development and change of water ecosystem security. In previous research on urban ecological security, D and P were regarded as two separate factors, because the driving force and pressure can directly affect urban ecological security [51]. However, it is difficult to observe and calculate the impact of driving forces on watershed ecological security, mainly because most areas of many watersheds are not located in urban built-up areas and there are few human activities around. In this case, it needs to redefine the meaning of P used for watershed ecological security assessment under the DPSIR framework. Therefore, P mainly reflects the pollution load in this article.
State factors (S) refer to the state of the water ecosystem under the influence of both D and P. Thus, S can be illustrated directly through the characteristics of environmental media such as water quality and sediment, which are indicators of ecological health.
Impact factors (I) refer to the impact of the state of the water environment ecosystem on the economy and the livelihood and health of the population, which is the inevitable result of the interaction of the first three factors (D, P, and S). The ecological state changes caused by the above factors are mainly reflected in changes of the watershed ecological service functions. Therefore, the impact factors mainly include watershed ecological service functions such as water resources supply and the cultural landscape.
Response factors (R) refer to the countermeasures taken by humans to improve or adapt to the ecological state, which reflect the process of human regulation and management. Therefore, R mainly includes supervision of the ecological environment, pollution control, and industrial adjustment.
Because the DPSIR model overestimates nonecological factors such as the economy and population change, it is considered that the nature of the ecosystem itself is a more direct factor of ecological security, and thus it should receive greater attention. Moreover, with improvement of the level of ecological management, government departments also consider ecological factors when determining economic and population objectives, resulting in gradual closing of the relationship between the driving force (D) and pressure (P) factors. Considering D and P as a comprehensive factor (i.e., S—socioeconomic impact) allows more detailed analysis of the impact of human social activities on ecology. At the same time, by choosing ecological health (E) as the characterizing factor of S, ecosystem services function (E) as the characterizing factor of I, and control management (C) as the characterizing factor of R, the SEEC model can be established. The framework of the SEEC model is shown in Figure 1.

2.1.2. Construction of the System of Indicators

After determining the four factors of the SEEC model, the representative indicators must be screened to obtain the evaluation results of the SEEC model.
(1) Socioeconomic impact
As mentioned in the introduction, the factors D and P in the original DPSIR model were generally related to the socioeconomic factors in the conventional sense [52,53]. However, when assessing the ecological security of the watershed, the particularity of this assessment objective needs to be considered, that is, for the ecological security of the watershed, the driving force and pressure are not very intuitive in the general sense. This paper needs to consider the driving force and pressure indicators that have a more significant impact on the ecological security of the watershed. Moreover, in the assessment of watershed ecological security, the applicability of each assessment factor should be considered in a balanced manner, and the original DPSIR model cannot be relied on completely, which will over amplify the impact of D and P. Therefore, socioeconomic impact factors mainly include the socioeconomic development and pollution load attributable to human activities in this article. Socioeconomic development mainly includes population, economic, and social indicators. Population indicators include the quantity, density, and natural growth rate of the population. Economic indicators are mainly used to determine the level of economic development and the intensity of economic activities. Therefore, economic indicators that can fully represent the structure and scale of the economy should be selected, e.g., GDP, per capita GDP, and total industrial and agricultural output value. Social indicators are relatively comprehensive and can be expressed by the urbanization rate.
Watershed pollution load is the primary way in which human activities affect water ecology. Generally, point source or nonpoint source discharge of pollutants can have serious impact on a watershed.
(2) Ecological health
Ecological health is reflected by the water quality and water ecology. In the process of watershed monitoring, water quality is commonly assessed using dissolved oxygen, total nitrogen, total phosphorus, the permanganate index, ammonia nitrogen, transparency, suspended solids, chlorophyll a, and heavy metal indicators.
In addition to the above indexes, water ecological indicators also include zooplankton, phytoplankton, and the benthic biomass. However, because it is very difficult to monitor the above indicators within many watersheds, the quality of sediment is often used to characterize the ecological status of water.
(3) Ecosystem services
The ecological services function of a watershed is mainly reflected in purifying the water quality, providing aquatic products, and providing cultural tourism services. Considering that aquaculture and fishing are no longer allowed in many watersheds, inclusion of this indicator was dependent on the specific situation of the watershed. The water purification function of a watershed is generally realized through natural shoreline filtration on both banks of the river. Cultural tourism services are also related to the geographical location of the watershed.
(4) Control management
Control management is mainly reflected in policies related to the economy, ecology, and environment, including ecological protection capital investment, industrial structure adjustment, and ecological supervision capacity building.
Through analysis of the connotation, scientificity, representativeness, and applicability of each indicator and following literature-based research, 34 evaluation indicators were determined. See Table A1 for the definition, reasons for selection, and calculation or acquisition method of each indicator.

2.1.3. Data Processing

(1) Data standardization
All indicators must be standardized to facilitate ecological security assessment. The concept of a reference standard should be introduced, meaning the value of each evaluation index in the ideal state (conducive to ecological security) or at the average level in a large-scale region [54].
The process of standardization of the indicators is conducted as follows:
Positive indicator: Rij = Xij/Sij,
Negative indicator: Rij = Sij/Xij,
where positive indicator means that the larger the value of the indicator, the more favorable it is to ecological security; negative indicator means that the larger the value of the indicator, the more unfavorable it is to ecological security; Xij is the measured value of indicator i at sampling point j; Sij is the reference standard of indicator i; and Rij is the dimensionless value of the evaluation indicator, where 0 < Rij < 1; when Rij > 1, we take Rij = 1.
(2) Weight calculation
The main methods used to determine the weights are the subjective weight method and the objective weight method. The most common subjective weighting method is the Delphi method, also known as the expert scoring method [55]. Its advantages are its clear concept, simplicity, and ease of operation, which can grasp the main factors of ecological security assessment, but it needs a certain number of experts with experience to produce the scores. The objective weighting method determines the index weights using a judgment matrix composed of evaluation index values. The most commonly used objective weighting method is the entropy method, which uses the utility values of the index information in the calculation; the higher the utility value, the more important it is to the evaluation. The SEEC model involves four factors, each of which contains information with differing complexity. Thus, the objective weighting method will lead to some factors with less impact on ecological security obtaining higher weighting, making it difficult to truly reflect the importance of the factors. Therefore, the weights of the four factors were determined using the expert scoring method. The full score was set at 10 and the higher the score, the more important the factor. Using a judgment matrix after sorting the consultation results, the weighting coefficient of the index was calculated, and the entropy method was used to determine the weights of the 34 indicators.
The process of application of the entropy method is as follows [56]:
(a)
Construct the judgment matrix Z for n samples and m evaluation indicators:
Z = X 11 X 12 ...... X 1 m X 21 X 22 ...... X 2 m ...... ...... ...... ...... X n 1 X n 2 ...... X n m
(b)
The dimensionless data are used to obtain a new judgment matrix, in which the expression of the element is:
R = ( r i j   n × m )
(c)
According to the definition of entropy, for n samples and m evaluation indicators, the entropy of the evaluation indicators can be determined as follows:
H i = 1 l   n ( n ) i = 1 n f i j   l n f i j
f i j = r i j i = 1 n r i j
where 0 ≤ Hi ≤ 1.
To make lnfij meaningful, it is assumed that fij = 0, fijlnfij = 0, i = 1,2,…,m, and j = 1,2,…,n.
(d)
Calculate the entropy weight (Wi) of the evaluation indicators:
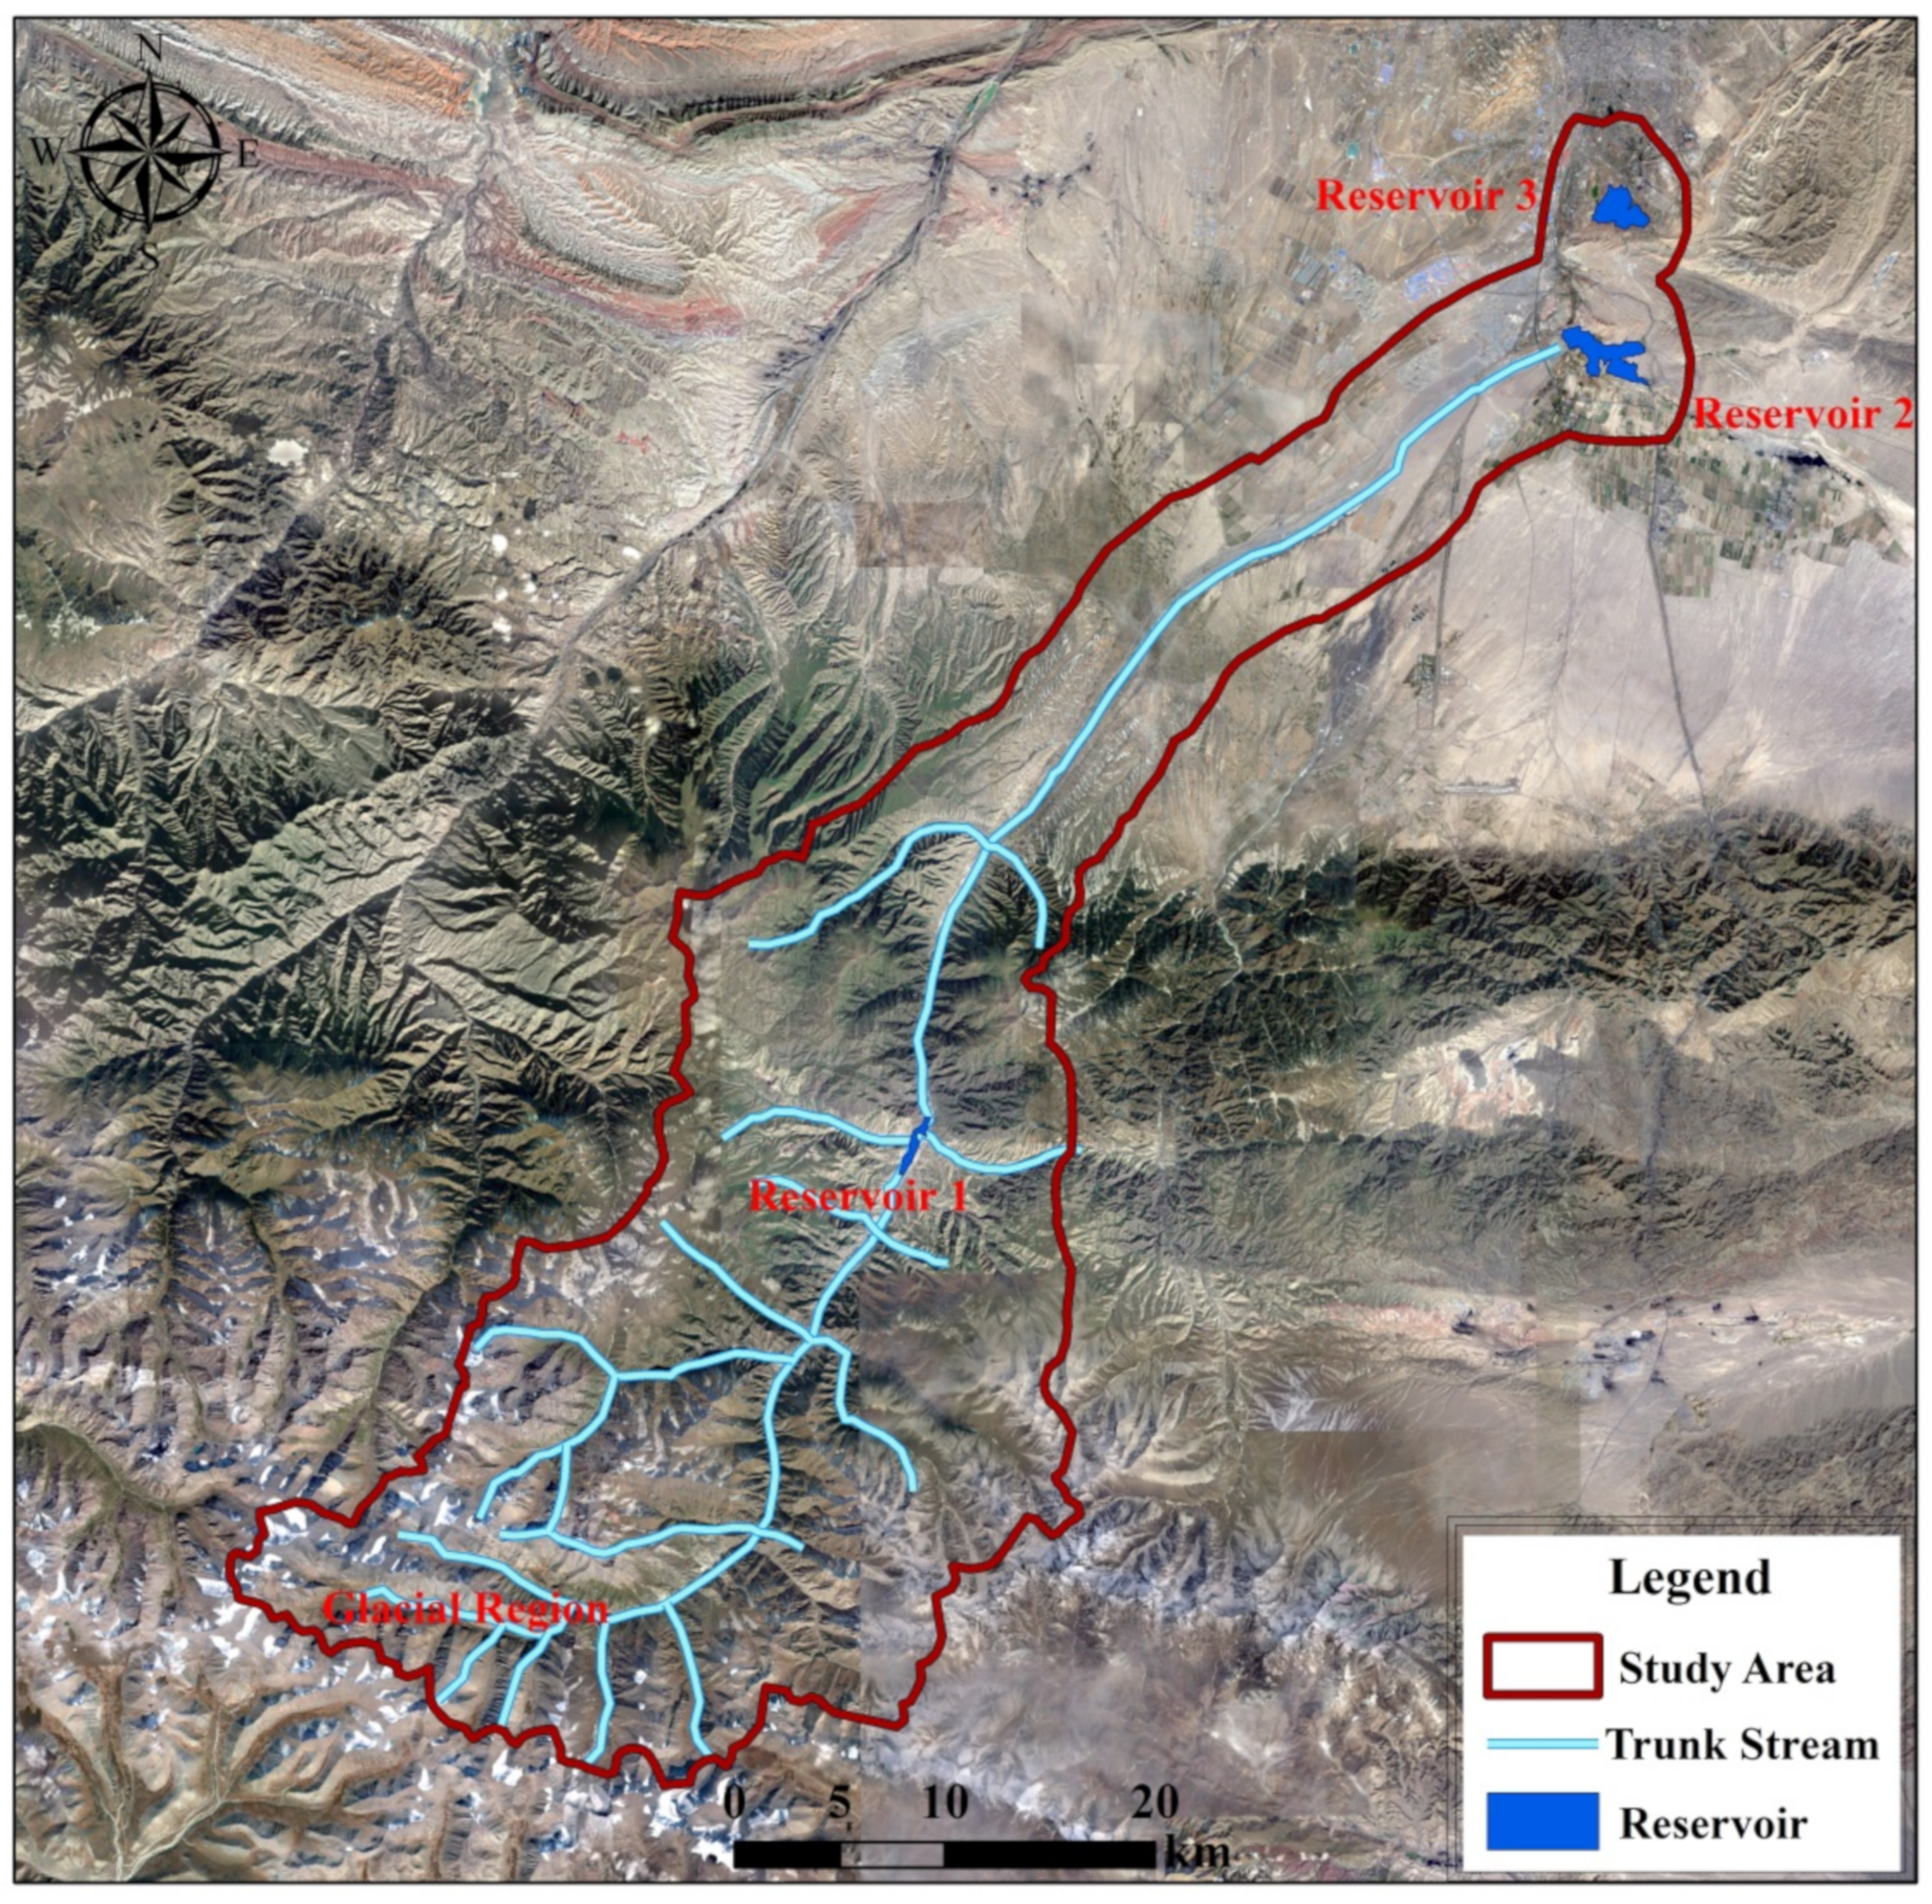
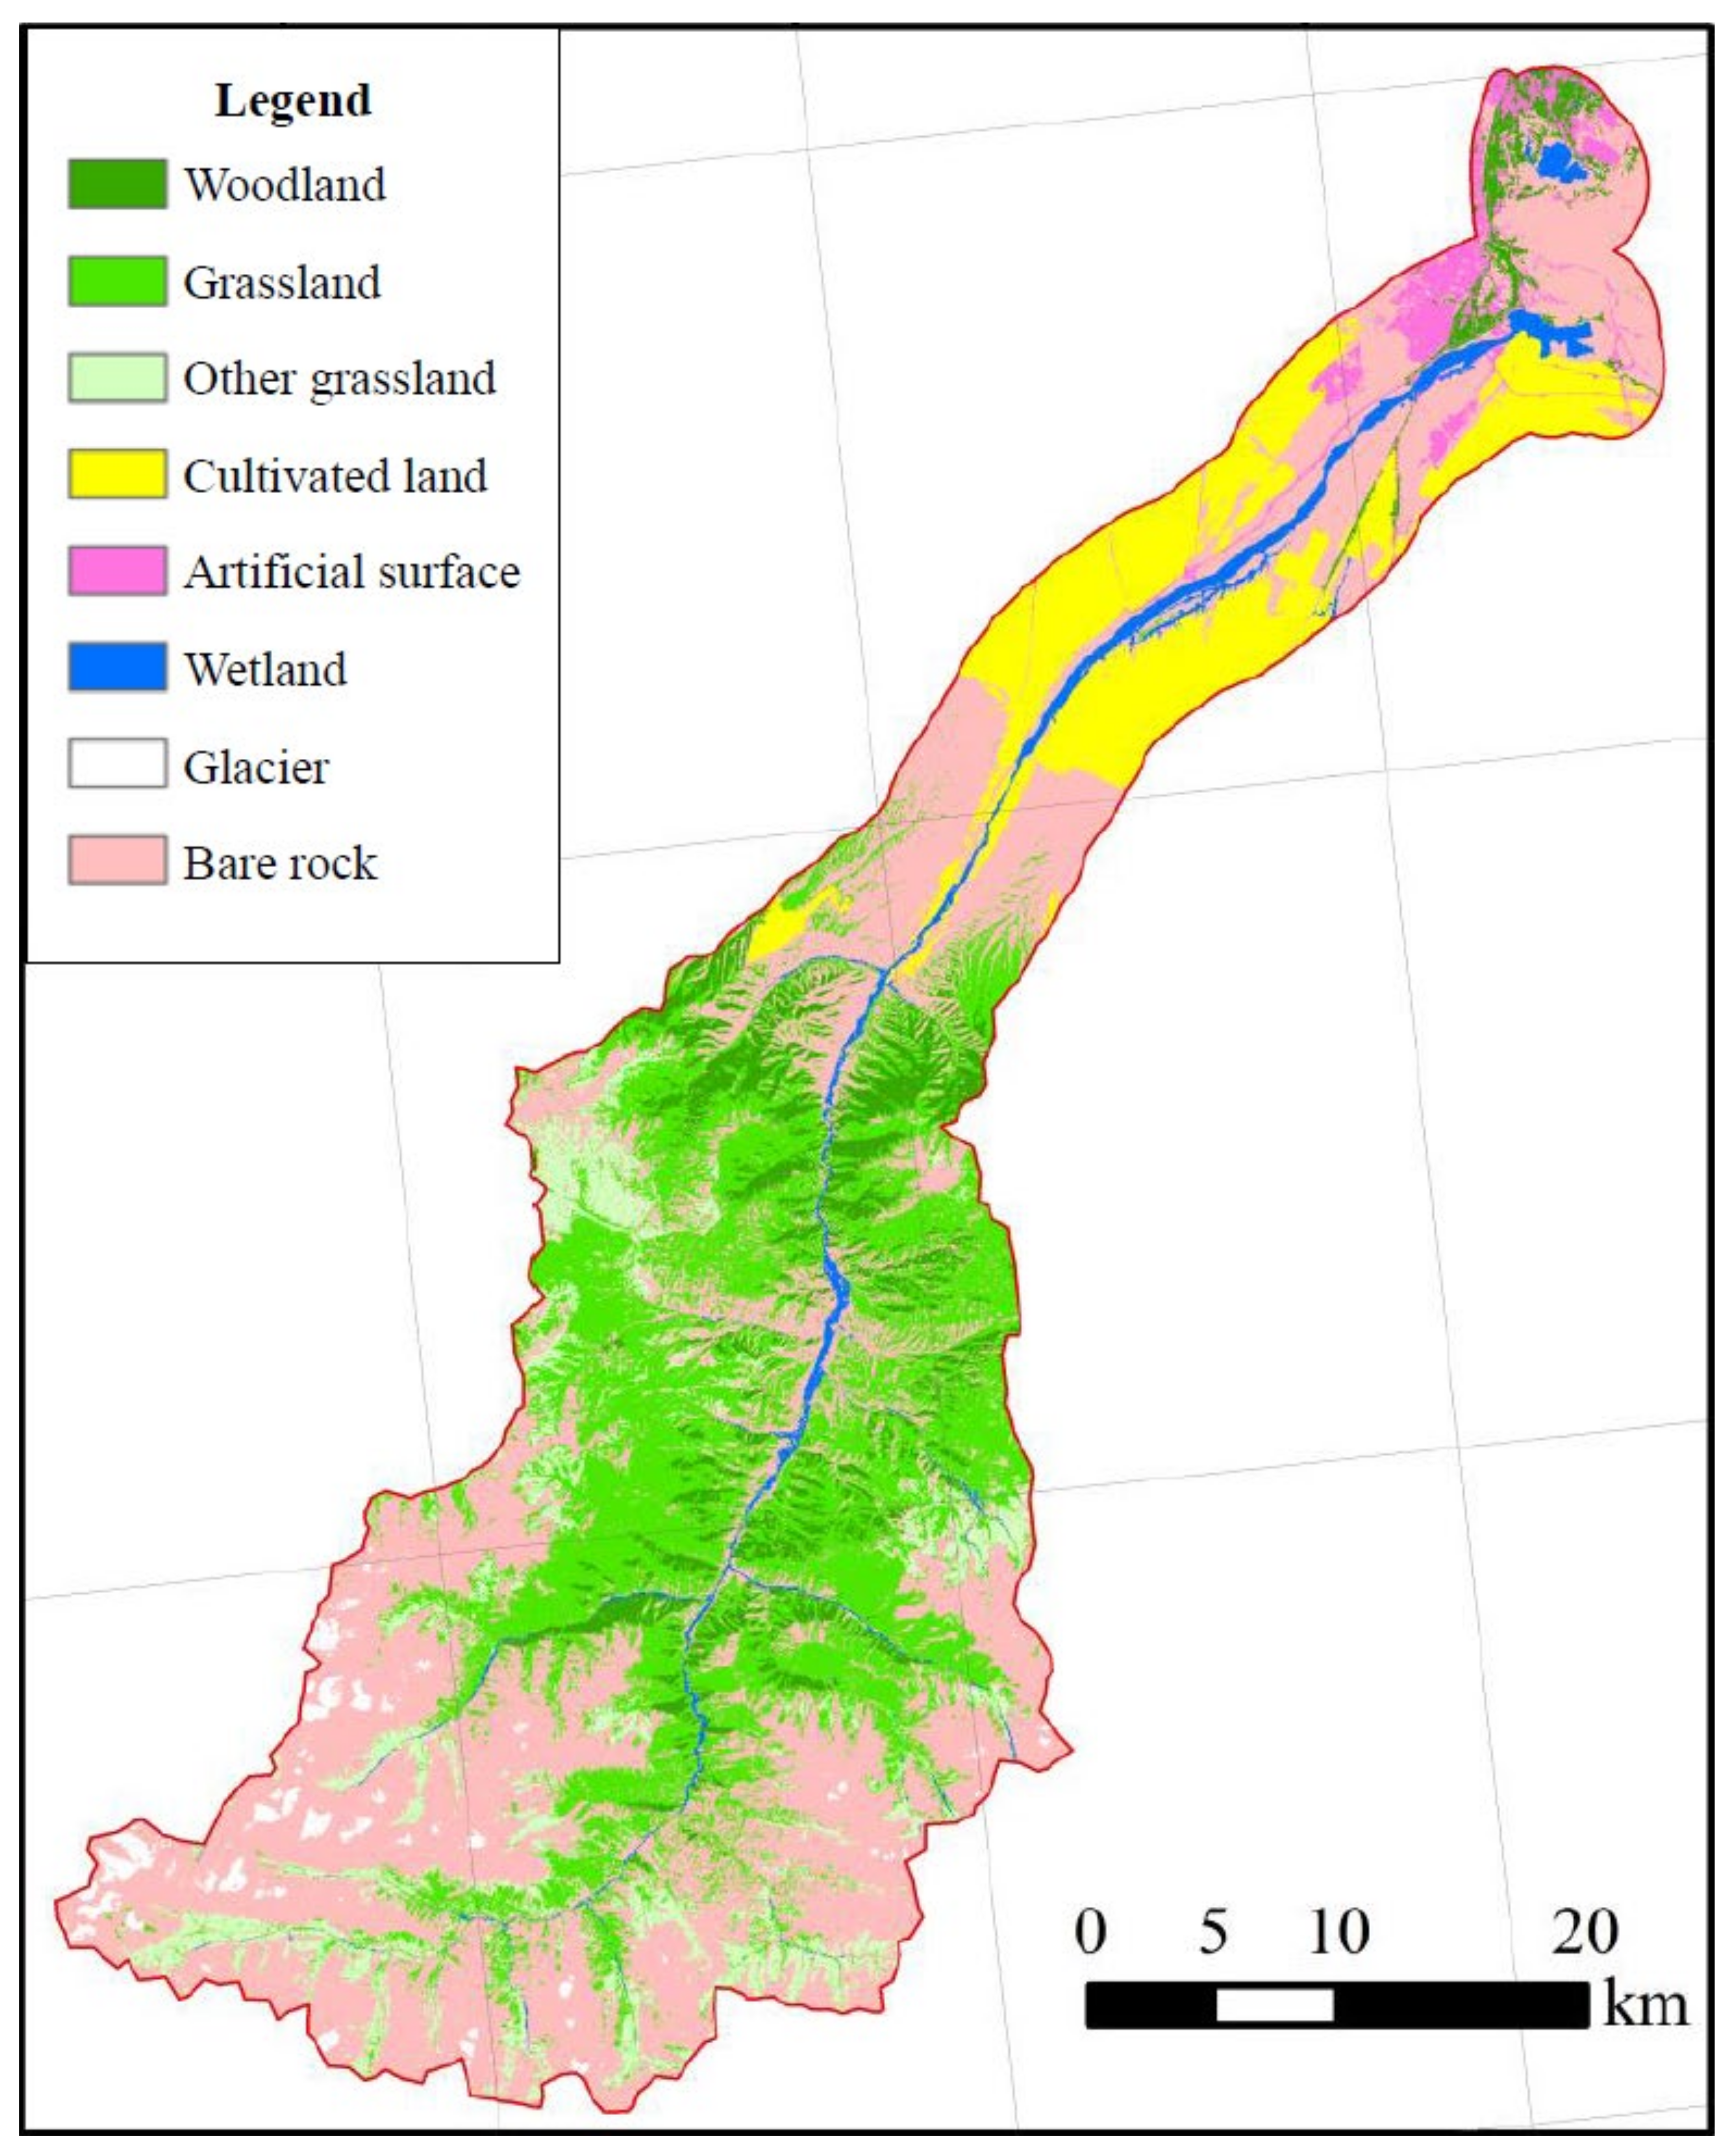
W i = 1 H i m Σ H i
where Wi is the weighting coefficients of the evaluation indicators that meet the following requirement:
Σ W i = 1
(3) Expression of the evaluation results
The evaluation results are expressed using the ESI; the higher the ESI value, the safer the ecological status. On the basis of the general expression of river and lake ecosystem assessment results in China, the ESI is divided into five levels from 0–100, as shown in Table 1.

2.2. Study Area

The study area is located in Northwest China. The watershed is 214 km long and 25–50 km wide from east to west. The drainage area is 4684 km2 and the annual runoff is 237 million m3. The average elevation is 2545.63 m (Figure 2).
The study area is affected mainly by the mid-latitude near-surface atmospheric circulation. The annual average temperature of the watershed is 3.5 ℃. The temporal distribution of precipitation is uneven, falling mainly in June–August. The annual average precipitation of the watershed is approximately 420 mm, and its spatial distribution is very uneven. Solid precipitation accounts for approximately 54.2% of the annual total precipitation. According to the results of the “Water Resources Bulletin,” the average annual precipitation in the study area was 1.28 billion m3 during 2006–2013, with no obvious trend of increase or decrease. In 2015, the amount of surface water resources within the study area was 1.160 billion m3, and the amount of groundwater resources was 574 million m3. The total amount of the water supply was maintained at more than 1.1 billion m3, and more than half of the water supply was derived from surface water.
The soil distribution in the upper reaches of the study area has vertical zonation. In addition to ice and snow cover, at elevations above 3600 m, exposed rocks and stone mounds are widely distributed, although some areas have poorly developed soil. The soil in the elevation range of 3100–3400 m is mainly alpine meadow soil; 2000–3100 m is mainly subalpine meadow soil; 1700–2000 m is mountain chernozem; 1200–1700 m is mountain chestnut soil; and 800–1200 m is brown calcareous soil. The soil at 1700–2900 m has mosaic distribution characteristics. Taupe forest soil is mainly found on shady slopes at elevation of 1700–2900 m, and it is distributed in a compound area with chernozem and subalpine meadow soil. The climate and terrain in the watershed vary markedly, and the corresponding vegetation types are relatively complete with obvious regularity in terms of geographical distribution. The main vegetation types are coniferous forest, broadleaved forest, shrub, grassland, meadow, and desert grassland. We used ArcGIS 10.3 to interpret the land use of the study area in 2014, and the results showed that grassland was the main vegetation cover type, followed by woodland and cultivated land (Figure 3).
In addition to the main stream, the study area includes one main glacier and three reservoirs (Figure 2). The main glacier, which is the source of the river, presently covers an area of 1.62 km2. Taking this glacier as the center, 109 large and small modern glaciers are developed within an area of 300 km2, comprising a total glacier area of 38.3 km2. Among them, 22 glaciers are distributed within the study area, covering a total area of 9.7 km2. The annual runoff of glacier meltwater into the trunk stream is 17.69 million m3. Therefore, glaciers are not only an important water source in the study area but they also represent a “solid reservoir” regulating runoff. Reservoir 1 (Figure 2) is located in the upper reaches of the study area. It is a water conservancy project that has flood control and irrigation as its primary and secondary purposes. Its operation is mainly divided into reservoir closure, dam flood control, and sluice water storage. The dam crest elevation is 2189.2 m, and the total storage capacity is 69.9 million m3. The highest dam height is 98 m. Reservoir 1 can exploit its flood-retention capability to cut the peak flood and regulate and store the flood during the flood season. Reservoir 2 (Figure 2) is located in a mountain depression of the middle reaches of the study area. It is a series regulating reservoir upstream of the urban area. It undertakes the three tasks of flood control, drought relief, and urban water supply for the city. The catchment area above the section of Reservoir 1 is 2596 km2, including 1070 km2 in the mountainous area of the main stream, 950 km2 in the piedmont plain area, and 576 km2 in the mountainous area of tributary gullies. Reservoir 3 (Figure 2) is located 6 km downstream of Reservoir 2. It is a through-injection reservoir built using natural depressions. The current water surface area is 4.5 km2 and the maximum storage capacity is 53 million m3. It is a large reservoir for comprehensive flood discharge irrigation, power generation, fish aquaculture, and urban water supply.
To obtain accurate data, a number of investigations were conducted in the study watershed during 2016–2017. These investigations included discussion with local research departments, data acquisition through visits to local government departments, collection of water and sediment samples, and investigation of pollution sources. Thus, data regarding the 34 evaluation indicators were obtained. Details were given in Table A2, which described the source of original data. Table A3 and Table A4, respectively, introduced the weights and reference standards of each indicator.

3. Results and Discussion

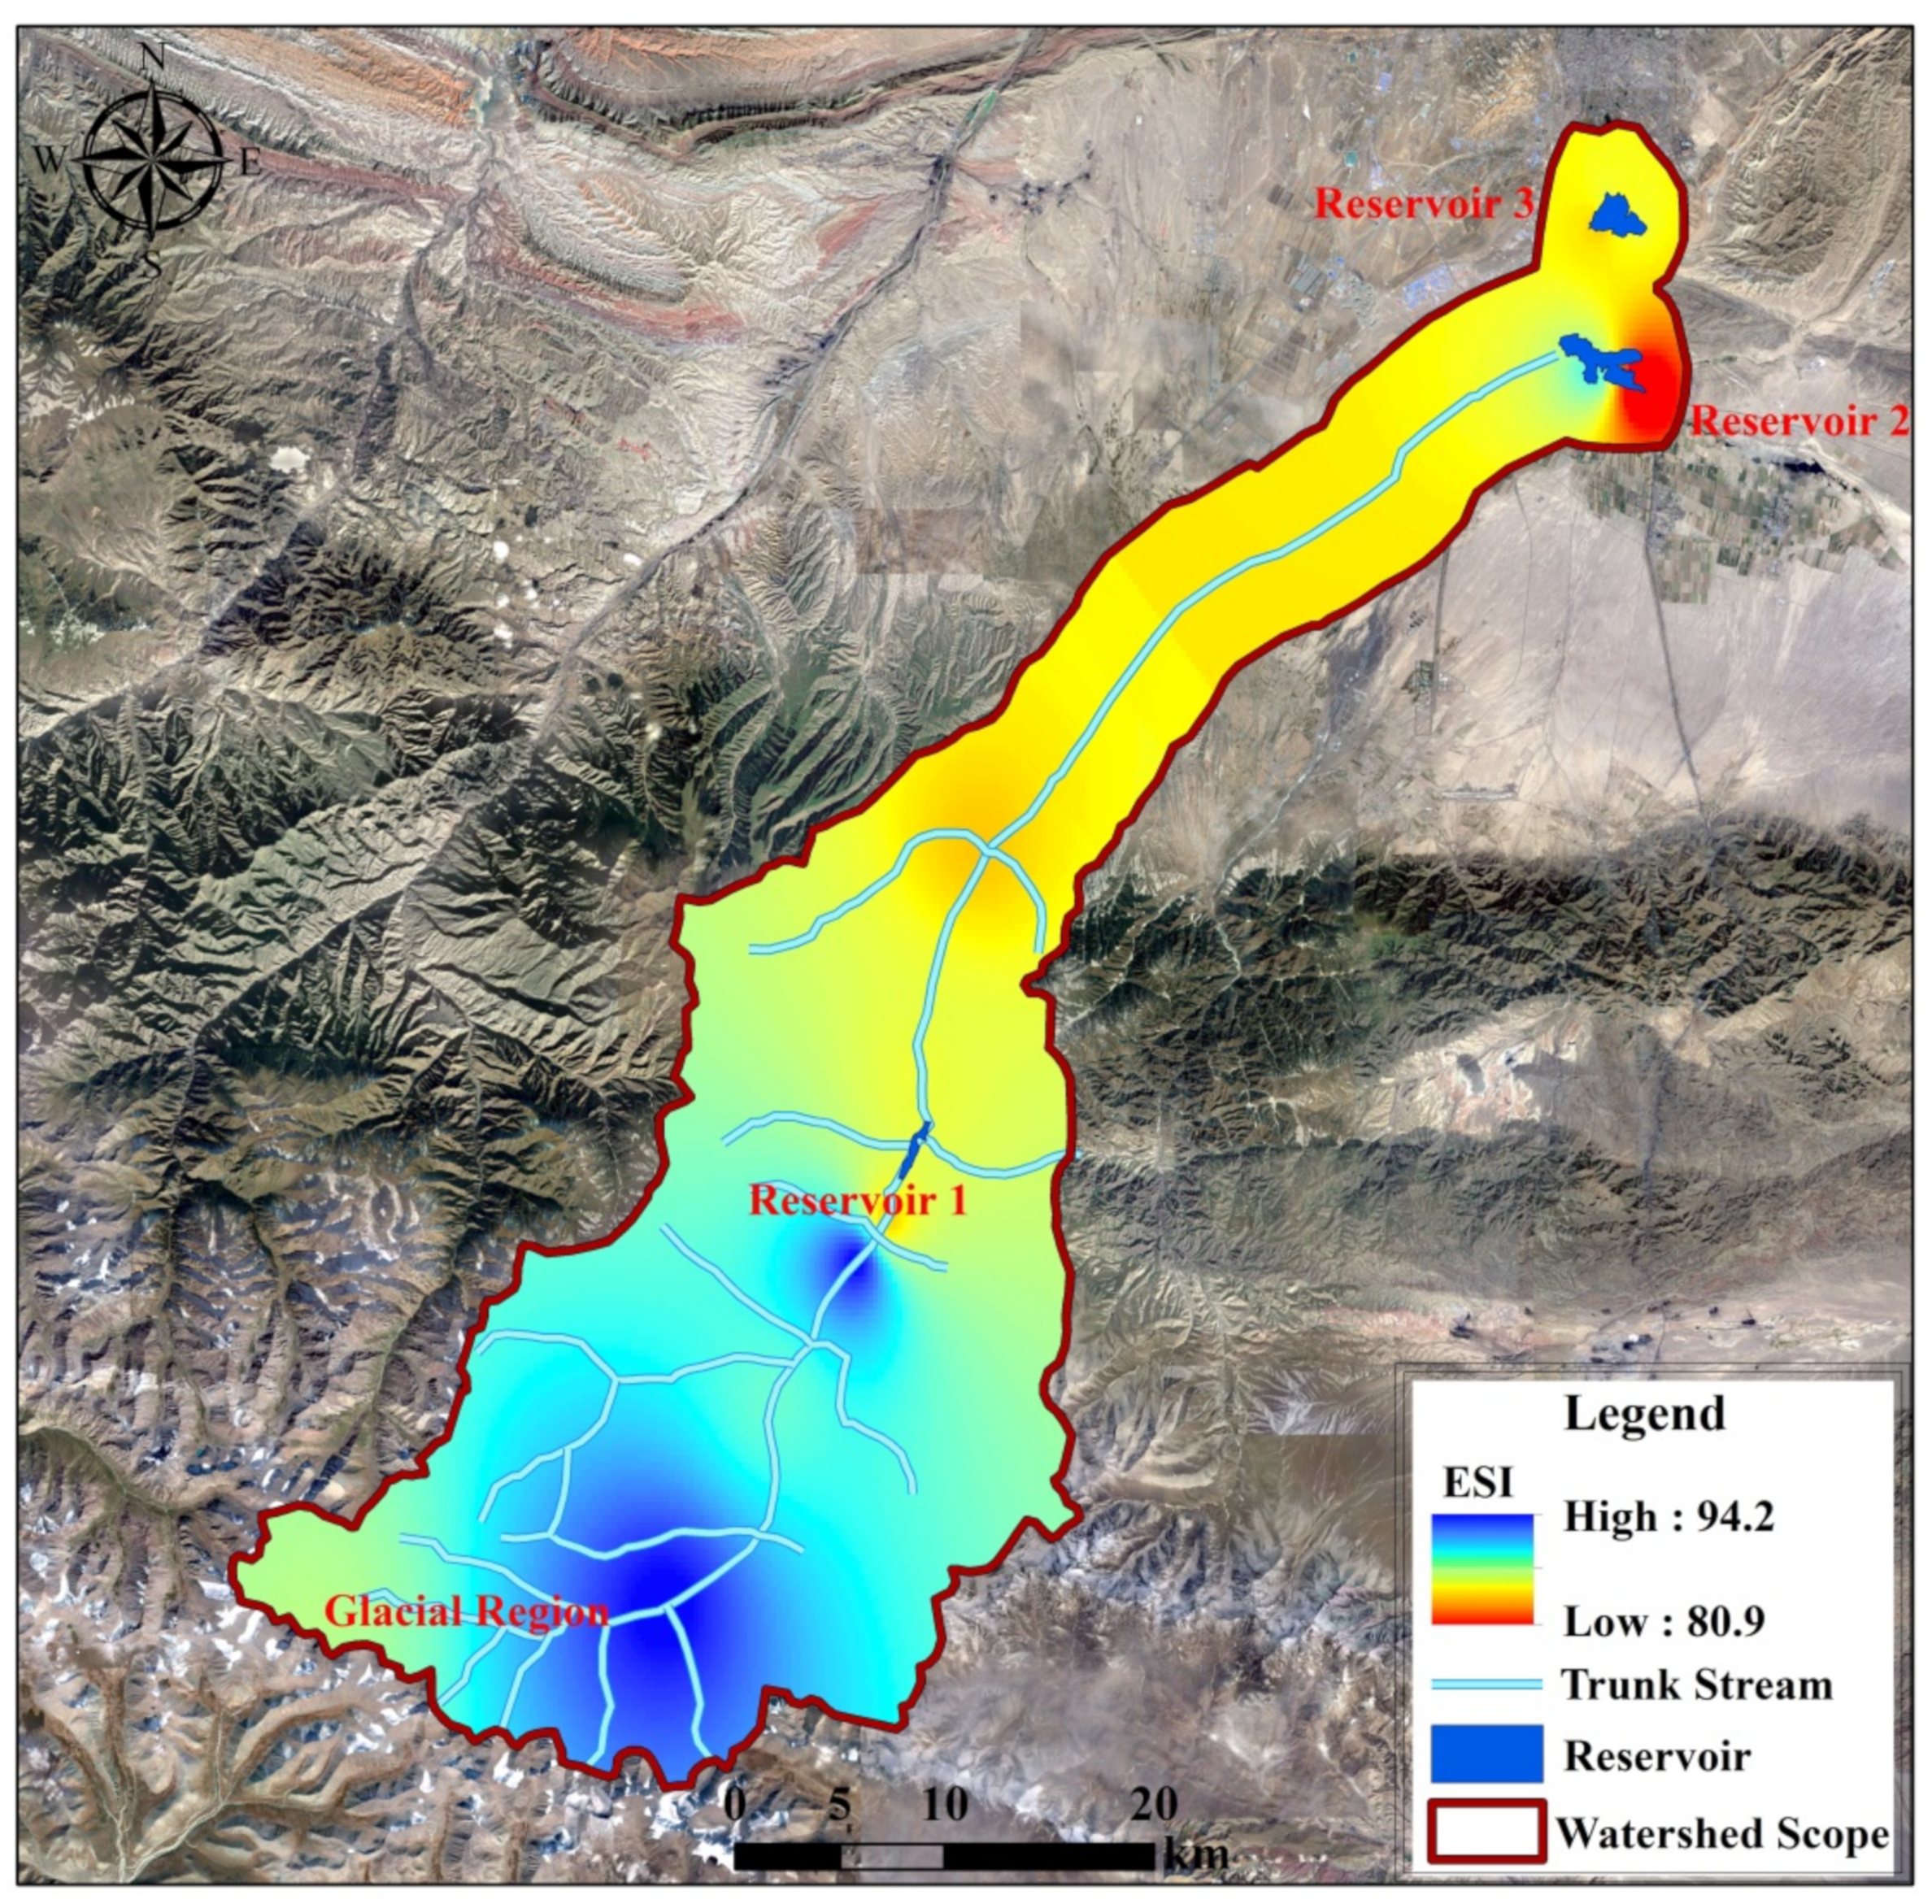
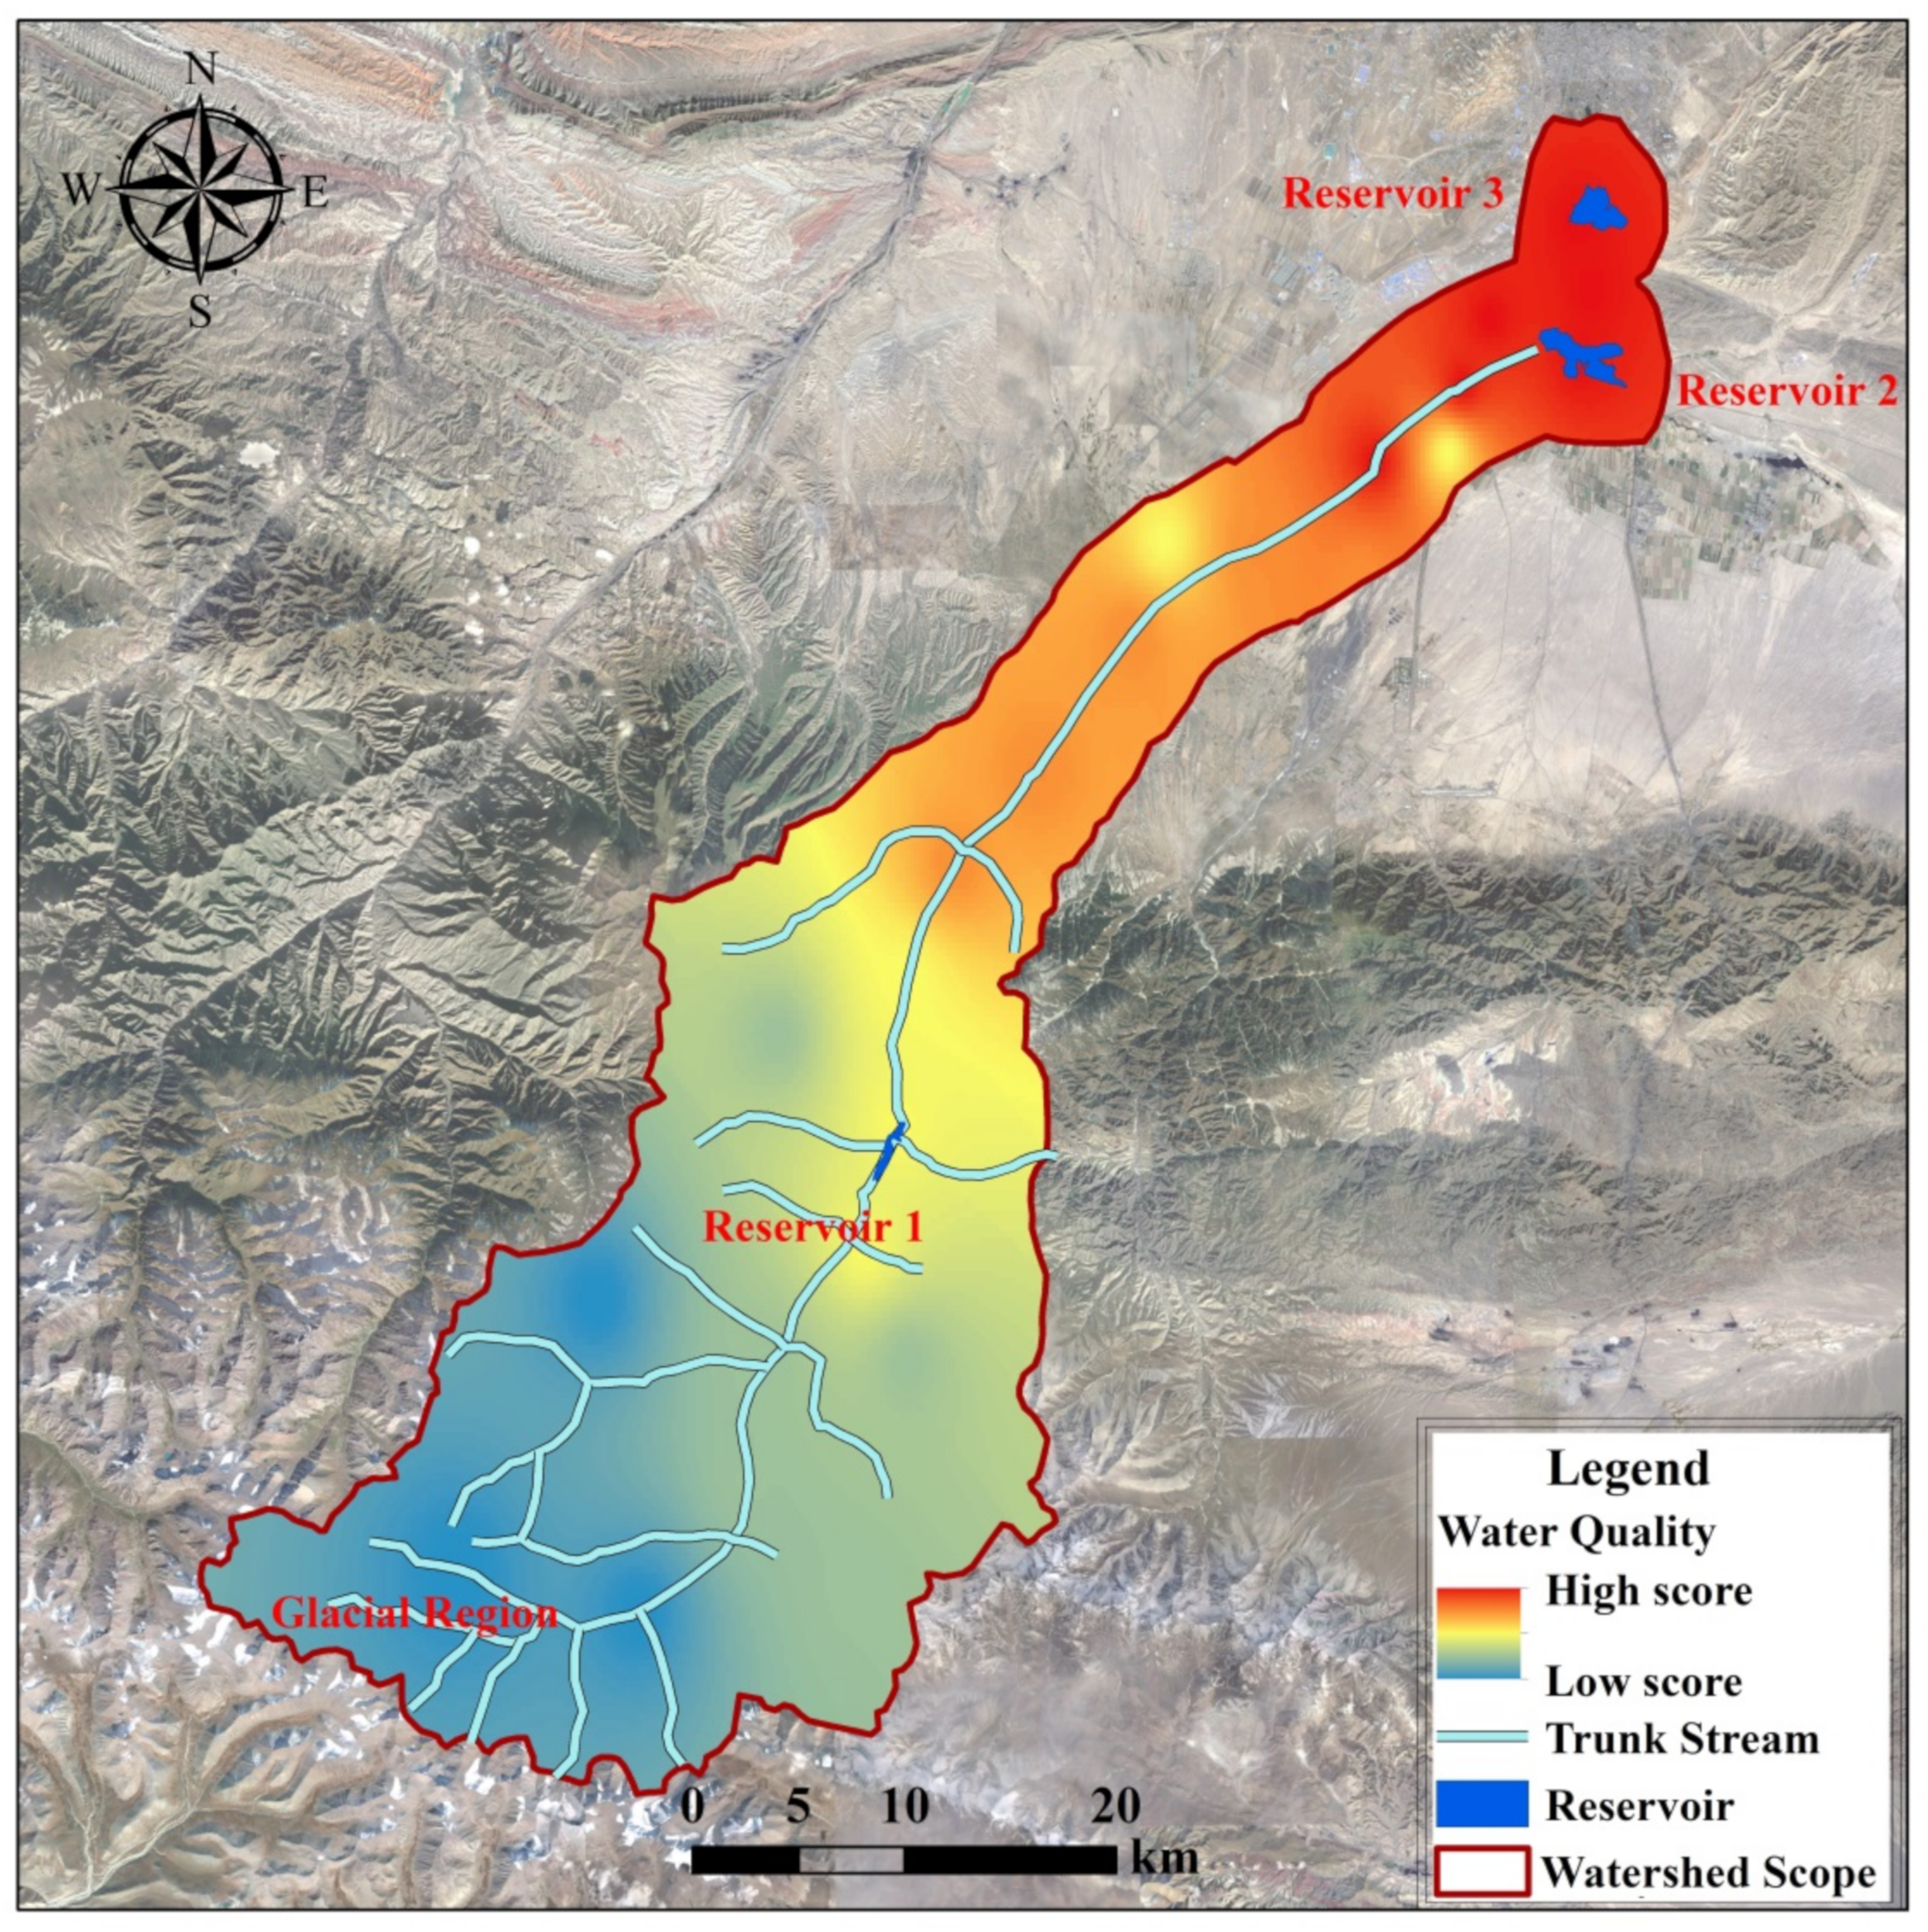
3.1. Results of the Ecological Security Assessment

Through evaluation of the SEEC model, it was determined that the ESI value of the study area is 80.9–94.2. In accordance with the geographical characteristics, the watershed was divided into three sections:
  • Upstream area: the section from Glacier No. 1 to the region downstream of Reservoir 1 (hereafter, the upstream area);
  • Midstream area: downstream of Reservoir 1 to the region upstream of Reservoir 2 (hereafter, the midstream area);
  • Downstream area: the section from the region upstream of Reservoir 2 to Reservoir 3 (hereafter, the downstream area).
The assessment results indicate that the status of the entire watershed was in the “safe” state, as defined in Table 1, indicating that the ecological security level was high. The ESI values of the entire study area are shown in Figure 4. It can be seen that the highest ESI values in the entire watershed are in the upstream area, and that the lowest ESI values are near Reservoir 2 in the downstream area. The ESI values of the midstream area are at an intermediate level. To identify the causes of the low ESI scores, we examined the scores for the four evaluation factors in the SEEC model using radar charts, as shown in Figure 5. It can be seen that the scores for the four evaluation factors are uneven. The lowest score is for C, indicating deficiencies in watershed regulation and management, and the second lowest value is for E (ecological health), indicating the need for attention to improve the state of ecological health. The scores for S and E (ecological services function) are high, indicating that the current socioeconomic factors have not impacted negatively on the ecological security of the watershed. Although the score for ecological health is low, it might not have affected the ecological services function of the watershed. Nevertheless, to improve the ESI score of the watershed, factors C and E (ecological health) need to be the focus of attention.

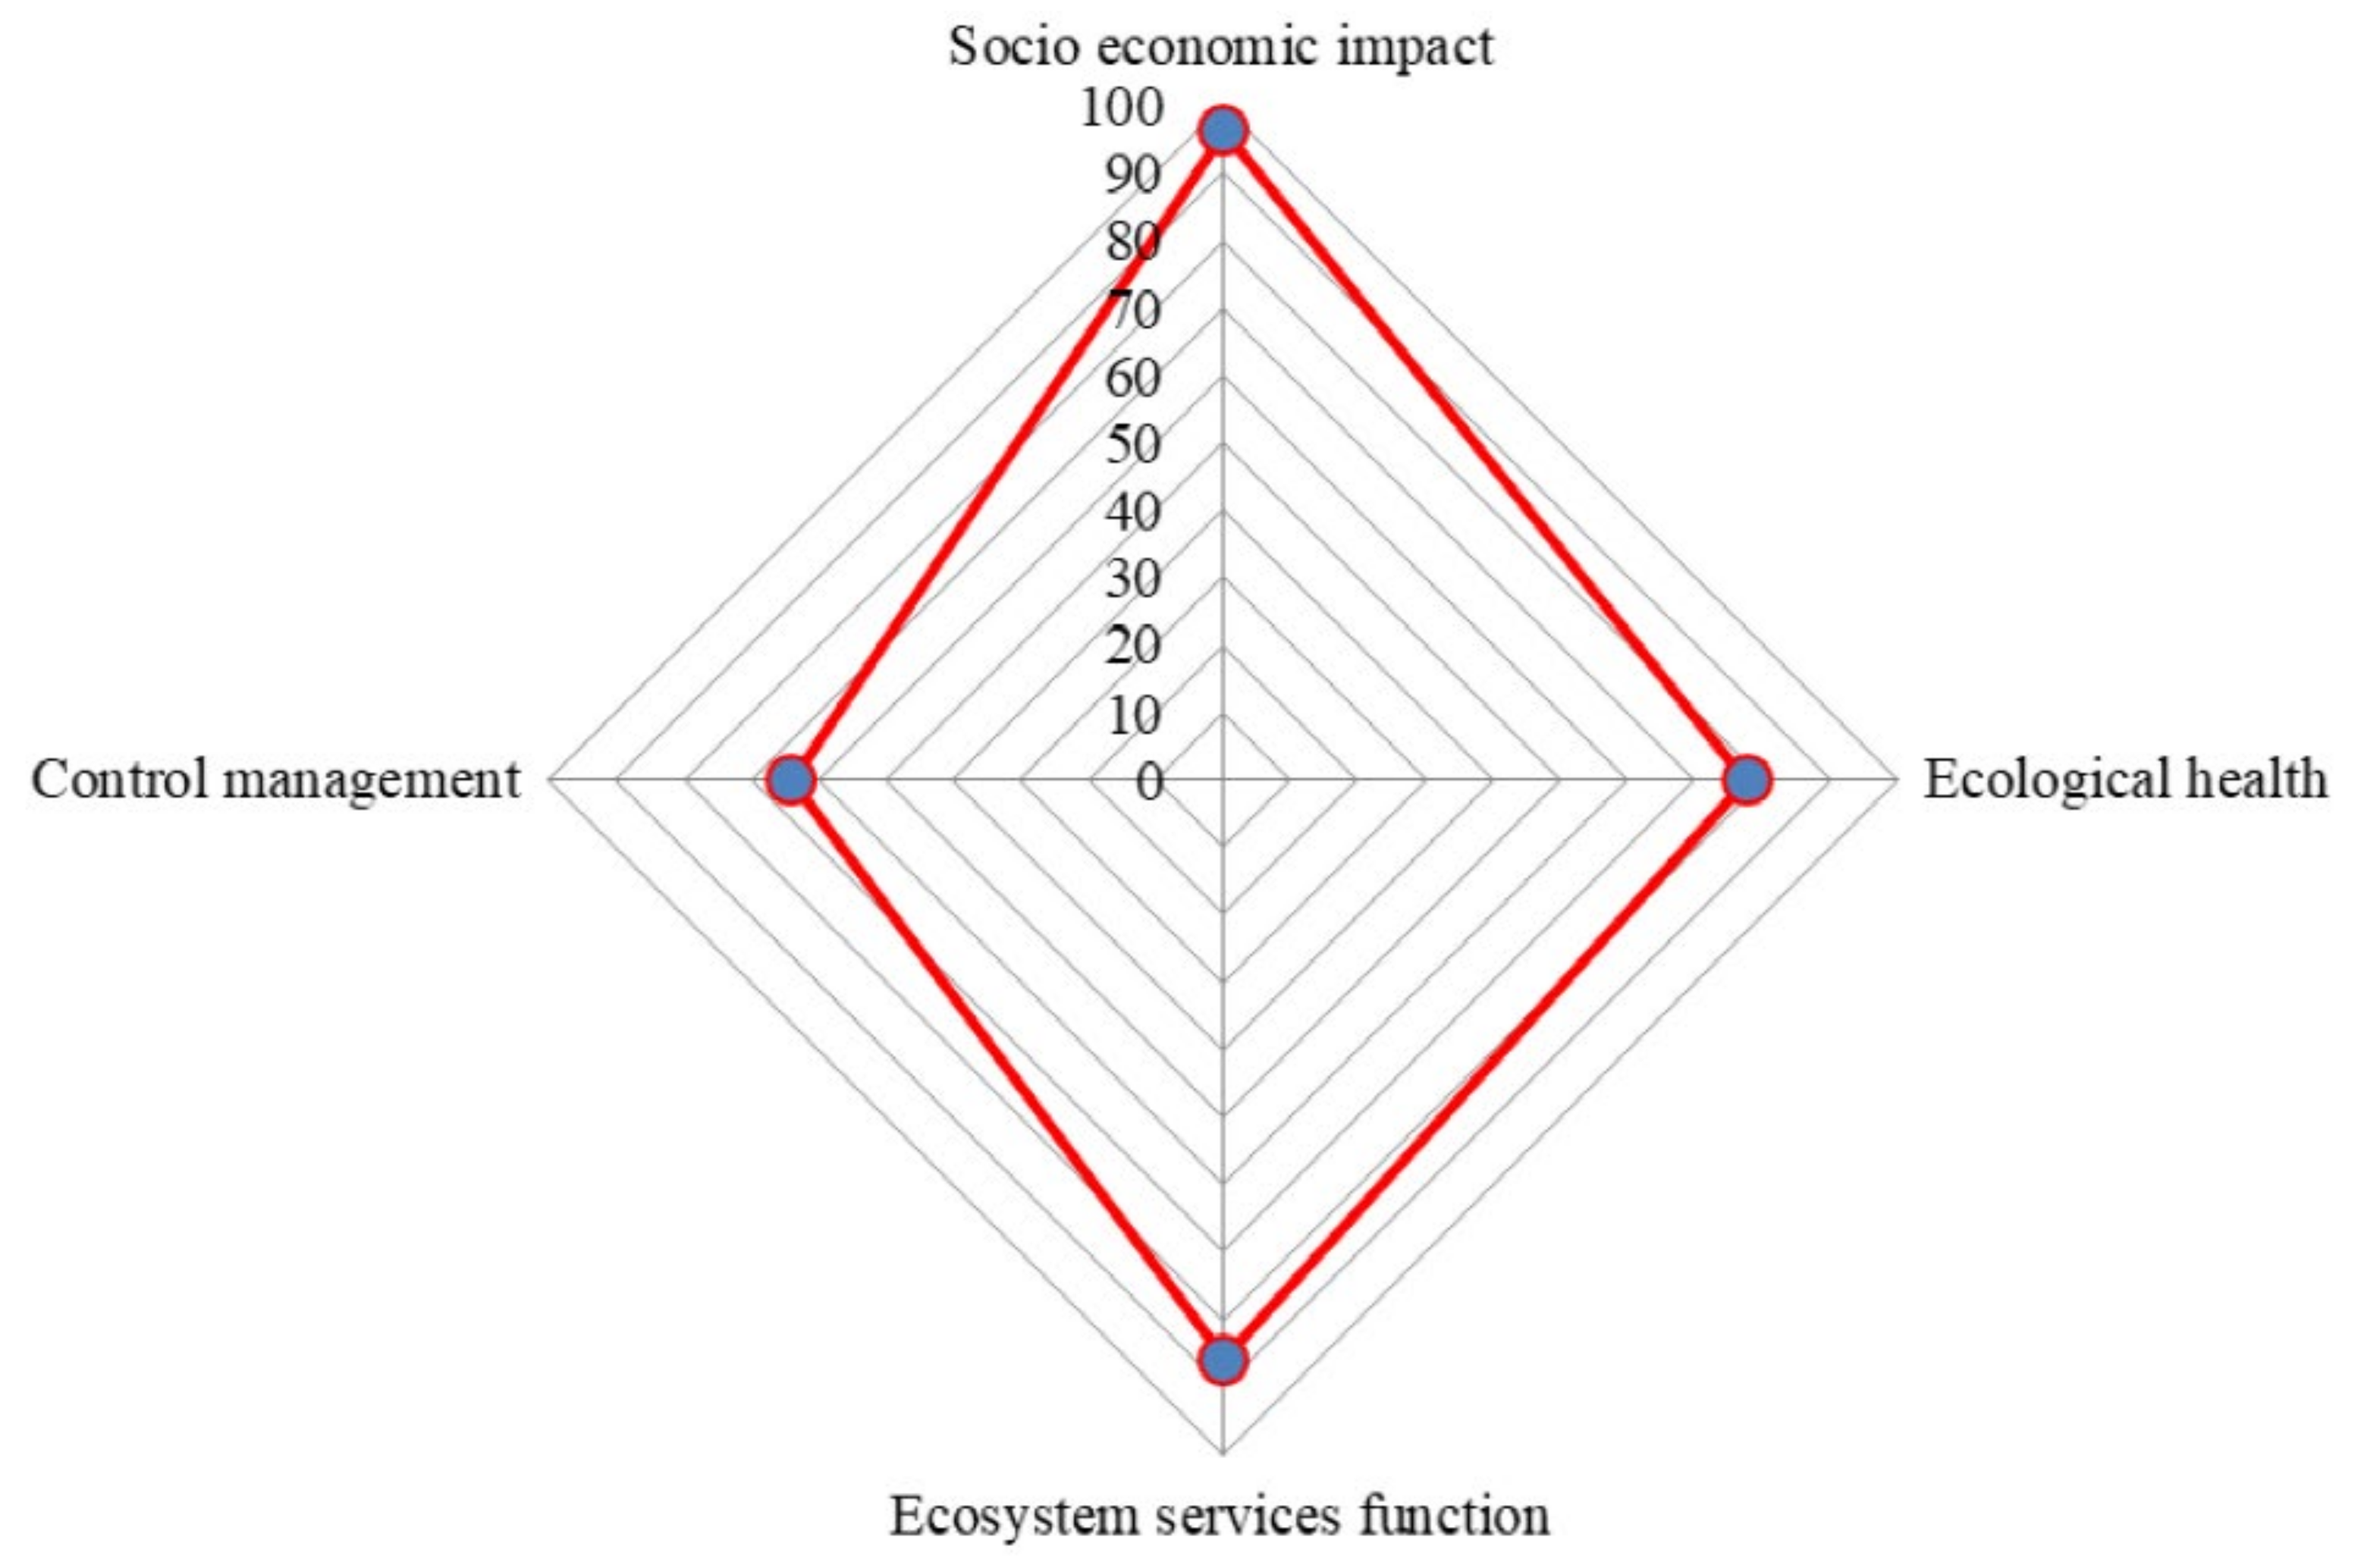
3.2. Score for Each Evaluation Factor

(a)
Assessment Results of Socioeconomic Impact (S)
The score for S is approximately 96, indicating the positive role it plays in ensuring ecological security. The score distribution of the 10 indicators is shown in Figure 6a. Among the 10 indicators, those with relatively low scores are population growth rate and per capita GDP. The lowest values of both are in the upstream and midstream areas, which are regions with poor natural conditions, sparse population, and low per capita GDP. In the past, it was often believed that if the population growth rate and per capita GDP were low, the pressure on ecology would be small and ecological security would not be threatened. The assessment reveals that levels of population growth rate and per capita GDP that are too low are not conducive to ecological security and thus they should be maintained at reasonable levels.
(b)
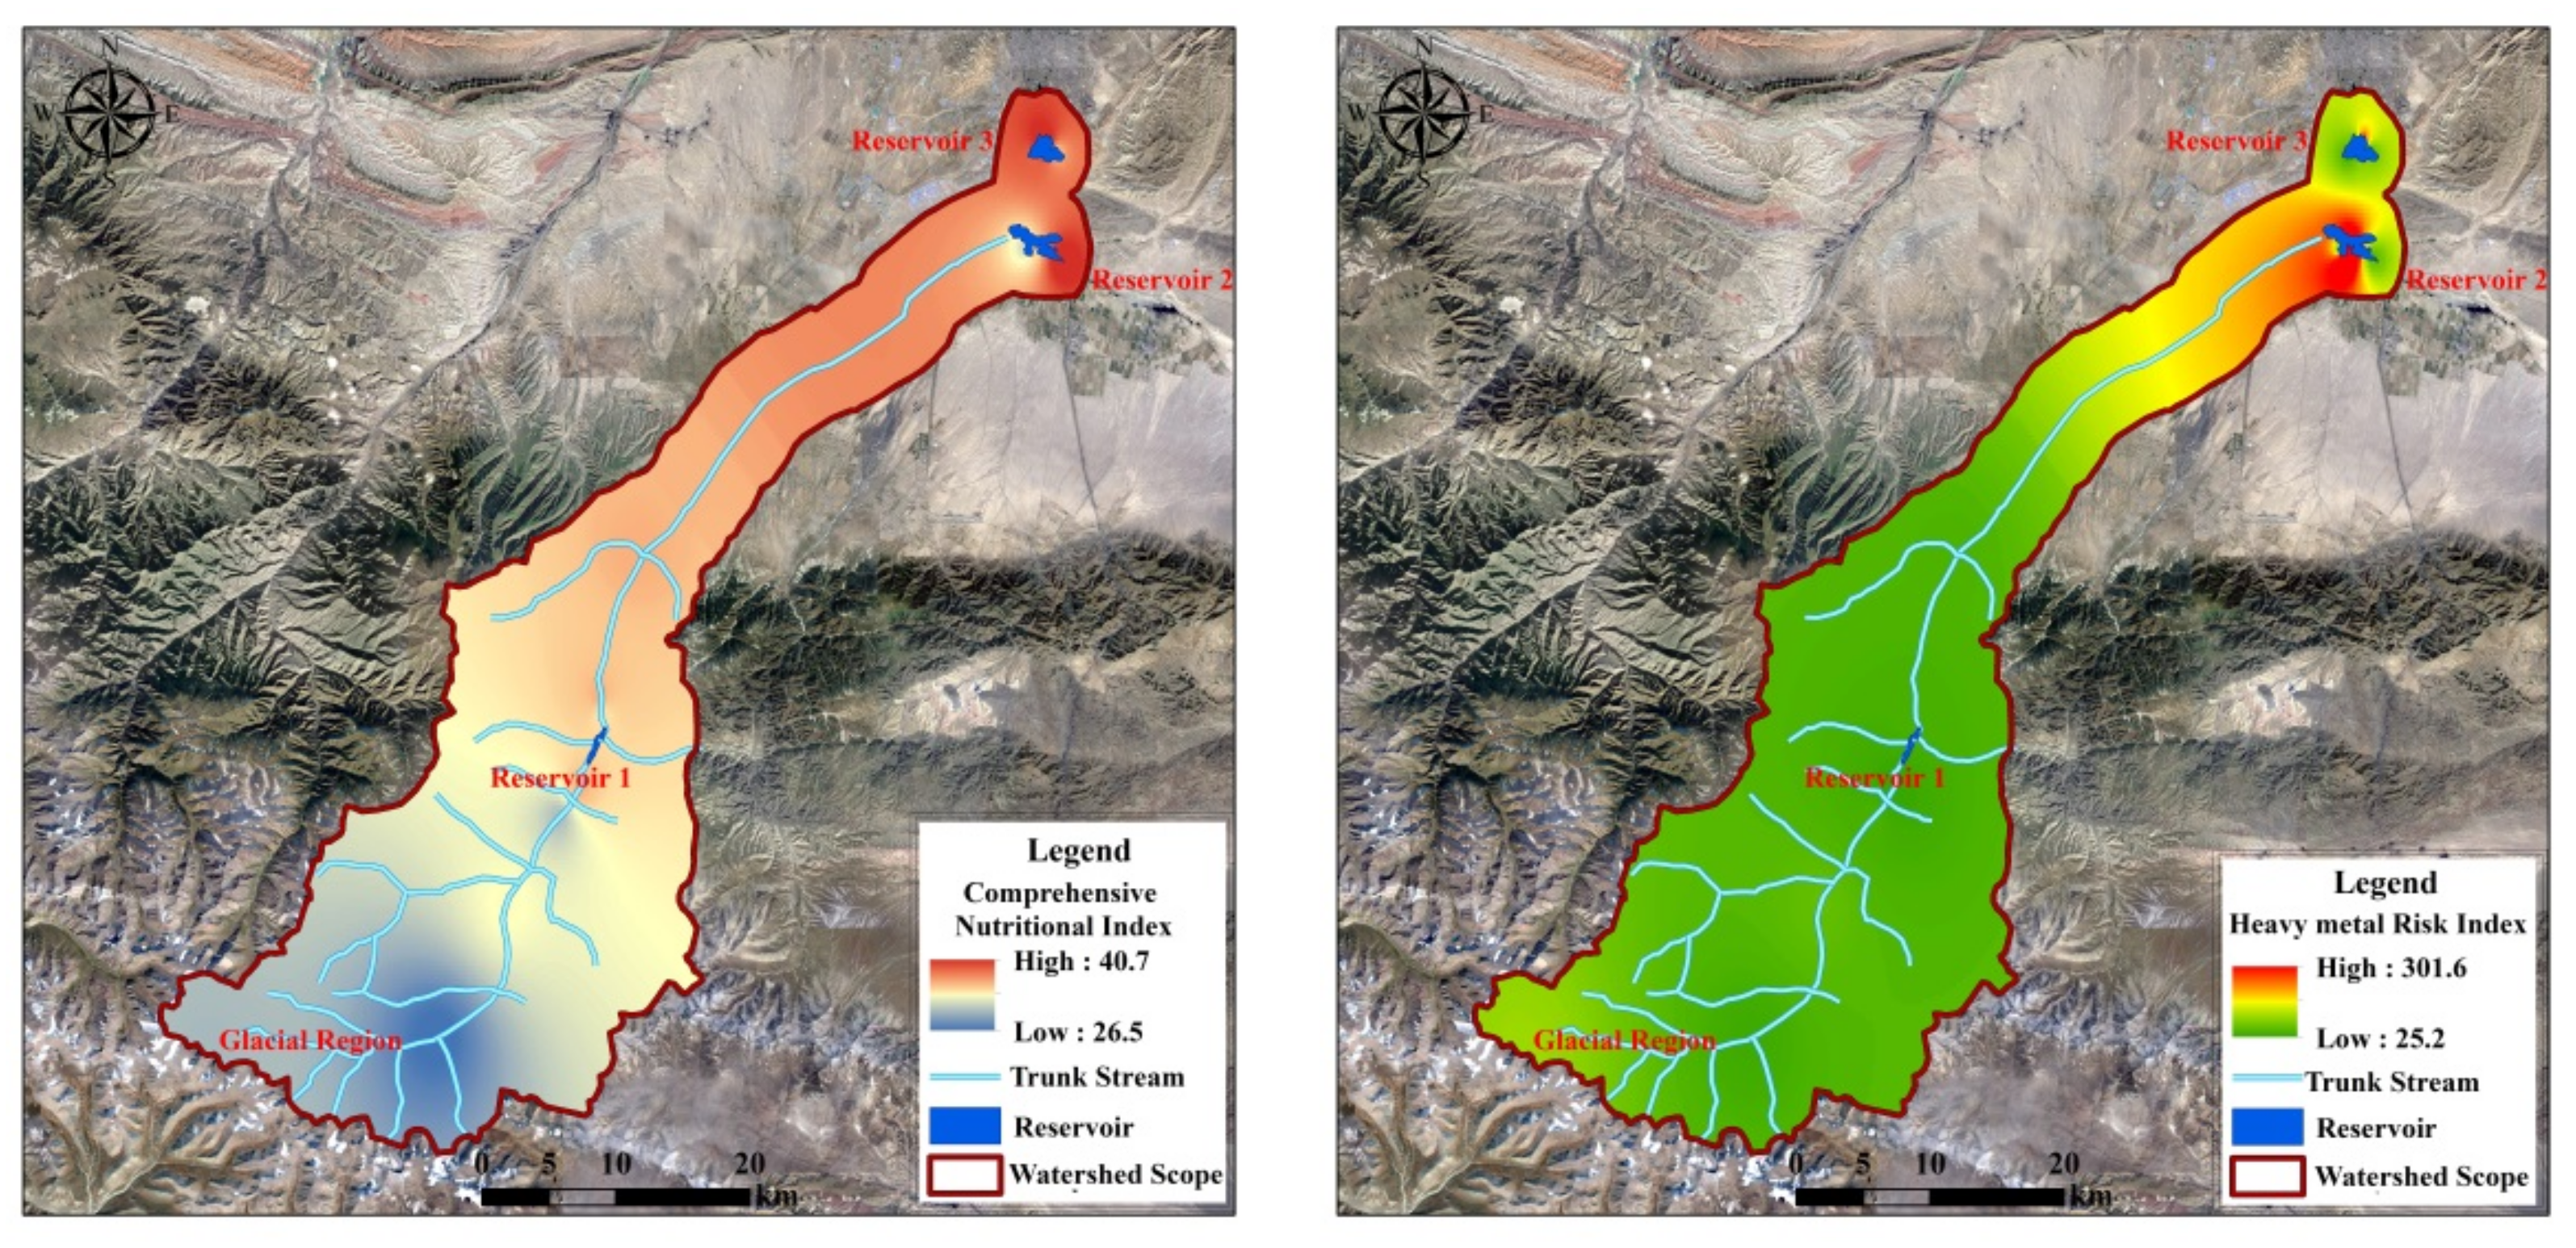
Assessment Results of Ecological Health (E)
The score for E (ecological health) is about 78, indicating the negative role it has in ecological security. The score distribution of the 13 indicators is shown in Figure 6b. Among the 13 indicators, the value for the total nitrogen in the water is too high, followed by the comprehensive nutritional index, organic matter, and heavy metal risk index. In terms of the spatial distribution, the comprehensive nutritional index in the upstream area is relatively low, but it increases gradually from the midstream area to the downstream area, reaching its highest value near Reservoir 3, which mainly reflects the intensity of human activity and tourism development [57]. The heavy metal risk index in the upstream and midstream areas is low, while the highest value is near Reservoir 2. The evaluation results of the comprehensive nutritional index and heavy metal risk index are shown in Figure 7.
(c)
Assessment Results of Ecosystem Services Function (E)
The calculation result of E (ecosystem services function) is approximately 86, indicating its negative role in ecological security. The score distribution for the four indicators is shown in Figure 6c. The main reason for the low score for E is the low coverage of forest and grass, especially in the upstream and midstream areas, which mainly reflects the relatively intense water and soil erosion in these areas in recent years. Moreover, human activities such as livestock grazing and free-range poultry breeding have aggravated grassland degradation [58]. Additionally, the natural shoreline rate of the river is also low, which is mainly attributable to the construction of embankments, diversion channels, and other human projects in the downstream area [59].
(d)
Assessment Results of Control Management (C)
The score for C is approximately 64, indicating its negative role in ecological security. The score distribution for the seven indicators is shown in Figure 6d. The low rate of treatment of rural domestic sewage is the main problem in relation to the low C score. The population of the watershed is sparse and scattered, meaning that the high cost of construction of environmental infrastructure make it difficult to collect and treat domestic sewage. The score for the soil and water erosion control rate is the second biggest problem in relation to the low C score. Water and soil erosion in the upstream and midstream areas is serious, and the grassland is deteriorating steadily. The effect of implemented mitigation measures has been limited because the dry climate and steep terrain in the upstream and midstream areas are not conducive to the control of water and soil erosion.

3.3. Applicability Evaluation of the SEEC Model

To evaluate the applicability of the SEEC model, factors that could characterize the level of watershed ecological security were selected. If the assessment results of the SEEC model indicated that these factors were relevant, then the evaluation method could be considered to have satisfactory applicability. In assessment of watershed ecology, water quality status is often used as an important comprehensive assessment factor with which to characterize whether the current ecology is threatened, i.e., whether the ecological status is safe. Therefore, the water quality of the study watershed was selected as the assessment factor for evaluation of the applicability of the SEEC method. To keep the assessment independent, we gave priority to the correlation analysis between the selected water quality indicators for evaluation (hereafter, the water evaluation indicators) and the water quality indicators participating in the evaluation of the SEEC model (hereafter, the water model indicators). The water evaluation indicators comprised pH, conductivity, biochemical oxygen demand, petroleum, volatile phenol, mercury, lead, copper, zinc, fluoride, selenium, arsenic, cadmium, hexavalent chromium, cyanide, anionic surfactant, sulfide, fecal Escherichia coli, sulfate, chloride, nitrate, and suspended solids. The water model indicators comprised dissolved oxygen, transparency, ammonia nitrogen, total phosphorus, total nitrogen, the permanganate index, mineralization of water, chlorophyll a, and the comprehensive nutritional index. The water quality data of the evaluation indicators were obtained from the local environmental monitoring department.
First, the monitoring data at the same point and for the same period were selected, and IBM SPSS 20.0 software was used to calculate the Pearson correlation coefficient of the two datasets (i.e., water evaluation indicators and water model indicators). Evaluation indicators that showed obvious correlation with the water model indicators were eliminated. Additionally, because the SEEC model included the heavy metal risk index of sediment, the heavy metal indicators were also removed from the water evaluation indicators to avoid affecting the independence of the index. Through the screening process, the evaluation indicators were determined as follows: pH, petroleum, volatile phenol, fluoride, cyanide, anionic surfactant, sulfide, fecal Escherichia coli, sulfate, chloride, and suspended solids. There was no obvious correlation between the final water evaluation indicators and the water model indicators, indicating that the final water evaluation indicators were independent and could be used to evaluate the applicability of the SEEC model.
Second, using the water evaluation indicators, the Nemero index method [60] was used to evaluate water quality, and the evaluation results were expressed in terms of China’s surface water environmental quality standard. The evaluation results were characterized as the higher the score, the worse the water quality. Obviously, when the water quality of the watershed is poor, its ecological security level is low. In other words, under natural conditions, the water quality score results should be negatively correlated with the watershed ecological security index. If the evaluation result of this paper also conforms to the above rules, it shows that the evaluation result of this paper is relatively accurate, and the evaluation method has good applicability.
Then, ArcGIS 10.3 was used for spatial interpolation to obtain the spatial distribution characteristics of water quality, as shown in Figure 8. Finally, the Pearson correlation coefficient between the data illustrated in Figure 8 and the SEEC evaluation results (Figure 4) was calculated using the ArcGIS 10.3 spatial analysis module. Through calculation, the Pearson correlation coefficient was determined to be approximately −0.4, which was consistent with the rules described above, indicating that the comprehensive evaluation results of water quality were better in areas with high ecological security scores. The evaluation results showed that the SEEC model has satisfactory performance when applied to evaluation of watershed ecological security.

4. Conclusions

Using the framework of the DPSIR model, and considering the connotation of watershed ecological security assessment, this article established the SEEC model that incorporates four factors: socioeconomic impact (S), ecological health (E), ecosystem services function (E), and control management (C). The SEEC model contains 34 evaluation indicators. We selected a watershed in the arid region of Northwest China for application of the research method. Through evaluation, the ESI value of the study area was approximately 81–94. Through analysis of the evaluation results, it was elucidated that the factors leading to the low score were mainly the low rate of treatment of rural domestic sewage and the low rate of mitigation of soil and water erosion. The results of the evaluation of the applicability of the SEEC model showed that the SEEC model has satisfactory performance in evaluation of watershed ecological security.
This article is successful from these aspects: it puts forward the method approach for watershed ecological security assessment and gives the specific evaluation index, index weight, and other key information; through application, it identifies the key factors affecting the ecological security of the study area, which has good guiding significance for local environmental management and can also provide reference for similar studies. However, owing to limited research funds and other reasons, this article fails to verify the SEEC model, such as through comparison of analysis of the ecological security status in different years. Therefore, more in-depth research is needed regarding the applicability and verification of the SEEC model.

Author Contributions

Conceptualization, F.Y., B.W. and G.C.; methodology, B.W. and F.Y.; software, B.W.; validation, B.W.; formal analysis, B.W.; investigation, B.W.; data curation, Y.T.; writing—original draft preparation, B.W.; writing—review and editing, Y.T. and M.Z.; visualization, B.W. and D.Z.; supervision, Y.T.; project administration, G.C. and D.Z.; funding acquisition, M.Z. All authors have read and agreed to the published version of the manuscript.

Funding

This research was funded by the National Key Research and Development Program of China (2019YFC1804404), Beijing Advanced Innovation Program for Land Surface Science of China and Hebei Province Water Conservancy Science and Technology Project (2018-09).

Institutional Review Board Statement

Not applicable.

Informed Consent Statement

Not applicable.

Data Availability Statement

Not applicable.

Acknowledgments

During the investigation, the local Environmental Protection Bureau, local environmental monitoring station, local Agriculture and Animal Husbandry Bureau, local Water Affairs Bureau, local Health Bureau, local water industry group, local Institute of Ecology and Geography, and the Chinese Academy of Sciences provided help regarding the data used in the study. In the process of establishing research methods and analyzing data, experts in environmental science, hydrology, water ecology, biology, and statistics from the local Institute of Ecology and Geography, Chinese Academy of Sciences, Ecological Center of the Chinese Academy of Sciences, Chinese Academy of Environmental Sciences, and other institutions provided assistance. We thank James Buxton, from Liwen Bianji (Edanz) (accessed on 29 November 2021), for editing the English text of a draft of this manuscript.

Conflicts of Interest

The authors declare no conflict of interest.

Appendix A

Table A1. Definition, reasons for selection, and calculation or acquisition method of each indicator.
FactorsInvolved AspectsIndicatorsDefinition and Reasons for SelectionMethod of Calculation (within the Study Area)
Socioeconomic impactPopulationPopulation densityPopulation of per unit area. It is an important factor in the impact of social economy on the environment. It affects the allocation of resources and the surplus of environmental capacity.Total population/area
Population growth rateThe ratio of population growth to the total population in a given period of time (usually one year). It is an important indicator of population growth.(Population at the end of the year - population at the beginning of the year)/annual average population × 1000‰
EconomyPer capita GDPRegional GDP per capita in the study area. It is the most common indicator to measure the level and pressure of social and economic development. It can not only reflect the development of social economy but also indirectly reflect the pressure of social and economic activities on the environment to a certain extent.Total GDP/total population
SocialHuman activity intensity indexProportion of the sum of construction land area and agricultural land area in the total land area, which are the main land types reflecting the intensity of human activities, which can reflect the pressure of social and economic activities on the environment at present and in the next few years.(Construction land area + agricultural land area)/total area
Watershed pollution loadArea source chemical oxygen demand (COD) load per unit areaCOD load per unit land area, which mainly includes COD emissions from area sources such as livestock and poultry free range breeding, planting, rural residents’ life, and so on. It is one of the most important evaluation indexes of environmental pollution. Considering the horizontal comparison between different watersheds and different statistical units, the COD load per unit area is used as the evaluation index.(COD emission of livestock and poultry free range breeding + COD emission of planting + COD emission of rural residents’ life)/total area
Area source TN load per unit areaTN load per unit land area, which mainly includes TN emissions from area sources such as livestock and poultry free range breeding, planting, rural residents’ life, and so on. It is one of the main factors leading to river eutrophication.(TN emission of livestock and poultry free range breeding + TN emission of planting + TN emission of rural residents’ life)/total area
Area source TP load per unit areaTP load per unit land area, which mainly includes TP emissions from area sources such as livestock and poultry free range breeding, planting, rural residents’ life, and so on. It is one of the main factors leading to river eutrophication.(TP emission of livestock and poultry free range breeding + TP emission of planting + TP emission of rural residents’ life)/total area
Point source COD load of per unit areaPoint source COD load of per unit area, which mainly includes urban industrial COD emission and urban living COD emission. The reason for selection is similar to area source but point source and area source characterize different processes of pollution.(Urban industrial COD emission and urban living COD emission)/total area
Point source TN load of per unit areaPoint source TN load of per unit area, which mainly includes urban industrial TN emission and urban living TN emission. The reason for selection is same as above.(Urban industrial COD emission and urban living COD emission)/total area
Point source TP load of per unit areaPoint source TP load of per unit area, which mainly includes urban industrial TP emission and urban living TP emission. The reason for selection is same as above.(Urban industrial COD emission and urban living COD emission)/total area
Ecological healthWater qualityDissolved oxygenMolecular oxygen dissolved in water is an important index to judge water quality and an important item of water quality monitoring. The growth and reproduction of phytoplankton in water and pollutants in water will affect dissolved oxygen. It is an important indicator of water quality.Field measurement
TransparencyIt reflects the clarification degree of the water body, which is related to the content of suspended solids and colloids in the water. It is an important indicator for evaluating water eutrophication.Field measurement
Ammonia nitrogenRefers to nitrogen in the form of free ammonia (NH3) and ammonium ion (NH4+) in water. It is an important indicator for evaluating water quality.Testing
Total phosphorusThe total amount of various organic and inorganic phosphorus in water, which is generally expressed by the determination results after various forms of phosphorus are transformed into orthophosphate after digestion. It is the key indicator to evaluate the degree of water eutrophication and water quality.Testing
Total nitrogenThe total amount of various forms of inorganic and organic nitrogen in water. The reason for selection is same as above.Testing
Permanganate indexIt refers to the amount of oxidant consumed when treating water samples with potassium permanganate (KMnO4) as oxidant under certain conditions. It is an important indicator to evaluate water quality.Testing
Mineralization of waterIt refers to the amount of carbonate, bicarbonate, chloride, sulfate, nitrate, and various sodium salts containing calcium, magnesium, aluminum, manganese, and other metals in water. The reason for selection is same as above.Testing
Water eutrophicationChlorophyll aIt is an important photosynthetic pigment in plant photosynthesis. By measuring chlorophyll a of phytoplankton, it can master the primary productivity of water. At the same time, chlorophyll a content is also one of the indicators of water eutrophication. It is an important indicator to reflect eutrophication and algal biomass of water.Testing
Comprehensive nutritional indexIt is a comprehensive indicator to reflect water eutrophication.Taking the state index TLI (Chla) of chlorophyll a as the benchmark, the nutritional state indexes of TP, TN, COD, SD, and other parameters close to the benchmark parameters (with small absolute deviation) are selected for weighted synthesis with TLI (Chla). The comprehensive weighted index model is:
T L I ( Σ ) = j = 1 M W j · T L I ( j )
where: TLI (å) is the comprehensive weighted nutritional status index;
TLI (j) is the nutritional status index of the j-th parameter;
Wj is weight of nutritional status index of the j-th parameter.
W j = R i j 2 j = 1 M R i j 2
where: Rij means correlation coefficient between the jth parameter and the benchmark parameter, M is number of main parameters close to the benchmark parameter.
SedimentTotal nitrogenNitrogen content in sediments. It is an important indicator for evaluating sediment quality.Testing
Total phosphorusPhosphorus content in sediments. The reason for selection is same as above.Testing
Organic matterIt generally refers to substances derived from life in sediments, including sediment. Microorganisms, benthos, and their secretions, as well as plant residues and plant secretions in soil. The reason for selection is same as above.Testing
Heavy metal risk indexIt is a relatively fast, simple, and standard method to classify the degree of sediment pollution and its potential ecological risk. The reason for selection is same as above.The Hakandson risk index method [61] is used for calculation. For detailed method introduction, please refer to the references cited here.
Ecosystem services functionDrinking water service functionStandard rate of centralized drinking water qualityIt refers to the inspection frequency of the water quality monitoring of all centralized drinking water sources in the watershed that meets or exceeds the class II water quality standard of the “environmental quality standard for surface water” (GB 3838-2002), accounting for the proportion of the total inspection frequency in the whole year. It is important data of drinking water service function survey.(Sum of compliance frequency of all monitoring sections/total monitoring frequency of all sections throughout the year) × 100%
Water conservation functionForest and grass coverageIt refers to the proportion of the sum of forest and grass vegetation areas such as arbor forest, shrub forest, and grassland in the regional land area. It is an important indicator to reflect the function of water conservation.(Forest land area + grassland area)/total land area × 100%
Interception and purification functionNatural shoreline rate of River (reservoir)The riverbank zone is divided into natural zone (undeveloped or natural shoreline length) and artificial zone. Here, it refers to the proportion of the length of natural riverbank zone in the total length of riverbank shoreline. It is an important indicator reflecting the interception and purification function of the riverbank.Length of natural zone/(length of natural zone + length of artificial riverside zone) × 100%
Cultural landscape functionHabitat representation of rare speciesIt mainly refers to whether the habitat reflects the characteristics of rare fish and important cultural landscape within the region, and whether it includes key species, rare and endangered species, and key protected species of natural ecosystem. It is an important indicator to reflect the function of cultural landscape.Expert opinion method (Delphi method)
Control managementEcological protection investmentEcological protection investment indexProportion of environmental protection investment in regional GDP. According to the experience of developed countries, in the period of rapid economic growth, if a country wants to effectively control pollution, the investment in environmental protection should continuously and stably account for 1.5% of the gross national product within a certain period of time. Only when the investment in environmental protection reaches a certain proportion can it maintain good and stable environmental quality while rapid economic development.Environmental protection investment/regional GDP × 100%
Pollution control and environmental protectionStandard rate of industrial wastewater dischargeIt refers to the proportion of the total amount of industrial wastewater discharged by key industrial enterprises within the scope of towns and townships through the sewage outlet and stably reaching the pollution discharge standard in the total amount of discharged industrial wastewater. It is an important indicator to reflect pollution control.(Up to standard discharge of industrial wastewater/discharge of industrial wastewater) × 100%
Centralized treatment rate of urban domestic sewageThe proportion of domestic sewage treated by the sewage treatment plant and meeting the discharge standard in the total discharge of urban domestic sewage. The reason for selection is same as above.Treatment capacity of urban sewage treatment plant/total urban sewage generationer) × 100%
Rural domestic sewage treatment rateIt refers to the proportion of rural domestic sewage treated by sewage treatment facilities and meeting the discharge standards in the total discharge of rural domestic sewage. The reason for selection is same as above.Rural domestic sewage treatment capacity/total rural domestic sewage discharge × 100%
Water and soil erosion control rateWater and soil erosion refers to the migration and deposition process of water and soil caused by flowing water, gravity, or human action. The water and soil erosion control rate refers to the water and soil loss control area divided by the original water and soil loss area within a certain area and a certain period of time. It is an important indicator to reflect environmental protection.Control area of water and soil erosion in a certain period/original water and soil erosion area × 100%
Regulatory capacityRegulatory capacity indexThe ability to supervise and manage the ecological environment in the watershed. It is mainly composed of the degree of standardized construction of drinking water sources, environmental monitoring capacity, environmental monitoring standardization construction capacity, scientific and technological support capacity, etc. It is an important index to reflect human protection of the environment through regulation and management.Expert opinion method (Delphi method)
Long term mechanismConstruction of long-term management mechanismAn institutional system that can ensure the normal operation of the environmental protection system and play its expected functions for a long time. It is mainly composed of laws, regulations, policies, unified management institutions in the watershed, market-oriented long-term investment, and financing system, etc. The reason for selection is same as above.Expert opinion method (Delphi method)
Table A2. Data acquisition process.
IndicatorsData Sources and ProcessingSource of Original Data
Population densityStatistical yearbook 2016 of study areaData available from government departments.
Population growth rateSame as aboveSame as above.
Per capita GDPSame as aboveData available from government departments.
Human activity intensity indexGraphic translation of land use typesPurchased satellite images from the satellite remote sensing image Department and used Arc GIS 10.3 for remote sensing interpretation.
Area source COD load of per unit areaStatistical yearbook 2016 of study area, data calculationWe took the data published by government departments as the basis and reference and calculated it by the method in Table A1.
Area source TN load of per unit areaSame as aboveSame as above.
Area source TP load of per unit areaSame as aboveSame as above.
Point source COD load of per unit areaSame as aboveSame as above.
Point source TN load of per unit areaSame as aboveSame as above.
Point source TP load of per unit areaSame as aboveSame as above.
Dissolved oxygen (water)Sampling, detection, and analysisIn June 2017, 16 surface water samples were collected on site and tested in field (Hereinafter referred to as “sampling and test in field”). The test method was electrochemical probe method.
Transparency (water)Same as aboveSampling and test in field, and the test method was Saybolt Disk Method.
Ammonia nitrogen (water)Same as aboveIn June 2017, 16 surface water samples were collected on site, which were tested in the Analysis and Testing Center of Beijing Normal University (Hereinafter referred to as “sampling and test in laboratory”), and the test method was salicylic acid spectrophotometry.
Total phosphorus (water)Same as aboveSampling and test in laboratory. The test method was molybdic acid spectrophotometry.
Total nitrogen (water)Same as aboveSampling and test in laboratory. The test method was alkaline potassium persulfate digestion UV spectrophotometry.
Permanganate index (water)Same as aboveSampling and test in laboratory. The test method was acid method.
Mineralization (water)Same as aboveSampling and test in laboratory. The test method was 180 ℃ dry gravimetric method.
Chlorophyll a (water)Same as aboveSampling and test in laboratory. The test methods were acetone extraction and spectrophotometer determination.
Comprehensive nutritional index (water)Calculated according to the test resultsAccording to the test results of the samples, it was calculated by the method in attached Table A1.
Total nitrogen (sediment)Sampling, detection, and analysisSampling and test in laboratory. The test method was the Kai’s Nitrogen Determination Method.
Total phosphorus (sediment)Same as aboveSampling and test in laboratory. The test methods were perchloric acid and sulfuric acid digestion.
Organic matter (sediment)Same as aboveSampling and test in laboratory. The test method was potassium dichromate method.
Heavy metal risk index (sediment)Calculated according to the test resultsAccording to the test results of the samples, it was calculated by the method in attached Table A1.
Standard rate of centralized drinking water qualityLocal water resources bulletin of study area 2015Data available from government departments.
Forest and grass coverageInterpretation of satellite remote sensing imagesPurchased satellite images from the satellite remote sensing image Department and used Arc GIS 10.3 for remote sensing interpretation.
Natural shoreline rate of River (or reservoir)Same as aboveSame as above.
Habitat representation of rare speciesResearch data of the Chinese Academy of SciencesData from the Chinese Academy of Sciences.
Ecological protection investment indexCompilation of performance evaluation data of study area eco-environmental protection project in 2015–2016Data from local environmental protection department and financial department.
Standard rate of industrial wastewater dischargeCalculated according to the environmental system data of study areaData from local environmental protection department.
Centralized treatment rate of urban domestic sewageSame as aboveSame as above.
Rural domestic sewage treatment rateSame as aboveSame as above.
Water and soil erosion control rateLocal water and soil conservation BulletinData available from government departments.
Regulatory capacity indexCompilation of performance evaluation data of study area eco-environmental protection project in 2015–2016Data from local environmental protection department.
Construction of long-term management mechanismSame as aboveSame as above.
Table A3. Weight of each factor and indicator.
FactorsWeightIndicatorsWeight
Socioeconomic impact0.21Population density0.020
Population growth rate0.020
Per capita GDP0.020
Human activity intensity index0.027
Area source COD load of per unit area0.020
Area source TN load of per unit area0.020
Area source TP load of per unit area0.020
Point source COD load of per unit area0.020
Point source TN load of per unit area0.020
Point source TP load of per unit area0.020
Water ecological health0.36Dissolved oxygen (water)0.001
Transparency (water)0.022
Ammonia nitrogen (water)0.026
Total phosphorus (water)0.046
Total nitrogen (water)0.009
Permanganate index (water)0.009
Mineralization (water)0.025
Chlorophyll a (water)0.042
Comprehensive nutritional index (water)0.001
Total nitrogen (sediment)0.025
Total phosphorus (sediment)0.114
Organic matter (sediment)0.014
Heavy metal risk index (sediment)0.027
Ecological service function0.23Standard rate of centralized drinking water quality0.058
Forest and grass coverage0.058
Natural shoreline rate of River (or reservoir)0.058
Habitat representation of rare species0.058
Regulation and management0.2Ecological protection investment index0.029
Standard rate of industrial wastewater discharge0.029
Centralized treatment rate of urban domestic sewage0.029
Rural domestic sewage treatment rate0.029
Table A4. Reference standard and basis for determination of each indicator.
IndicatorsReference ValueUnitDetermination Basis
Population density193.5person/km2Statistical bulletin of local national economic and social development in 2016, regional level
Population growth rate6.08Same as above
Per capita GDP69565¥Same as above
Human activity intensity index0.2DimensionlessConsulting experts, regional level
Area source COD load of per unit area20kg/(hm2·a)Lake ecological security strategy
Area source TN load of per unit area5kg/(hm2·a)Same as above
Area source TP load of per unit area0.5kg/(hm2·a)Same as above
Point source COD load of per unit area40kg/(hm2·a)Same as above
Point source TN load of per unit area1.5kg/(hm2·a)Same as above
Point source TP load of per unit area0.1kg/(hm2·a)Same as above
Dissolved oxygen (water)7.5mg/LEnvironmental quality standard for surface water, Class Ⅰ
Transparency (water)1mSame as above
Ammonia nitrogen (water)0.15mg/LSame as above
Total phosphorus (water)0.02mg/LSame as above
Total nitrogen (water)0.2mg/LSame as above
Permanganate index (water)2mg/LSame as above
Mineralization (water)1μg/LLake ecological security strategy
Chlorophyll a (water)300mg/LComprehensive background value, groundwater standards, and drinking water standards
Comprehensive nutritional index (water)30DimensionlessComprehensive nutritional index classification, take the poor nutrition level
Total nitrogen (sediment) 700mg/kgConsulting experts, take a very safe level
Total phosphorus (sediment)500mg/kgSame as above
Organic matter (sediment)1.69%Same as above
Heavy metal risk index (sediment)150DimensionlessClassification of heavy metal ecological risk index, take the level of slight ecological hazard
Standard rate of centralized drinking water quality100%Consulting experts, take a very safe level
Forest and grass coverage 75%Same as above
Natural shoreline rate of River (or reservoir)100%Same as above
Habitat representation of rare species0.7DimensionlessSame as above
Ecological protection investment index3%Environmental and economic benefit analysis data
Standard rate of industrial wastewater discharge100%Consulting experts, take a very safe level
Centralized treatment rate of urban domestic sewage 90%The 13th five-year plan for environmental protection
Rural domestic sewage treatment rate80%Same as above
Water and soil erosion control rate2.45%2014 water and soil conservation Bulletin
Regulatory capacity index 5DimensionlessConsulting experts, regional level
Construction of long-term management mechanism5DimensionlessSame as above

References

  1. Zambrano-Monserrate, M.A.; Ruano, M.A.; Ormeno-Candelario, V.; Sanchez-Loor, D.A. Global ecological footprint and spatial dependence between countries. J. Environ. Manag. 2020, 272, 111069. [Google Scholar] [CrossRef]
  2. Saxena, G.; Chandra, R.; Bharagava, R.N. Environmental Pollution, Toxicity Profile and Treatment Approaches for Tannery Wastewater and Its Chemical Pollutants. Rev. Environ. Contam Toxicol. 2017, 240, 31–69. [Google Scholar] [CrossRef]
  3. Suk, W.A.; Ahanchian, H.; Asante, K.A.; Carpenter, D.O.; Diaz-Barriga, F.; Ha, E.H.; Huo, X.; King, M.; Ruchirawat, M.; da Silva, E.R.; et al. Environmental Pollution: An Under-recognized Threat to Children’s Health, Especially in Low- and Middle-Income Countries. Environ. Health Perspect. 2016, 124, A41–A45. [Google Scholar] [CrossRef] [Green Version]
  4. Qu, C.; Shi, W.; Guo, J.; Fang, B.; Wang, S.; Giesy, J.P.; Holm, P.E. China’s Soil Pollution Control: Choices and Challenges. Environ. Sci. Technol. 2016, 50, 13181–13183. [Google Scholar] [CrossRef]
  5. Hou, D.; Ok, Y.S. Soil pollution—Speed up global mapping. Nature 2019, 566, 455. [Google Scholar] [CrossRef] [Green Version]
  6. Schwarzenbach, R.P.; Egli, T.; Hofstetter, T.B.; von Gunten, U.; Wehrli, B. Global Water Pollution and Human Health. Annu. Rev. Environ. Resour. 2010, 35, 109–136. [Google Scholar] [CrossRef]
  7. Mekonnen, M.M.; Hoekstra, A.Y. Global Anthropogenic Phosphorus Loads to Freshwater and Associated Grey Water Footprints and Water Pollution Levels: A High-Resolution Global Study. Water Resour. Res. 2018, 54, 345–358. [Google Scholar] [CrossRef] [Green Version]
  8. Jáuregui, E.; Luyando, E. Global radiation attenuation by air pollution and its effects on the thermal climate in Mexico City. Int. J. Climatol. 1999, 19, 683–694. [Google Scholar] [CrossRef]
  9. Li, X.; Jin, L.; Kan, H. Air pollution: A global problem needs local fixes. Nature 2019, 570, 437–439. [Google Scholar] [CrossRef] [Green Version]
  10. Rieuwerts, J. The Elements of Environmental Pollution; Nutritional Management of Digestive Disorders: London, UK, 2015. [Google Scholar] [CrossRef]
  11. Cooke, C.A.; Bindler, R. Lake Sediment Records of Preindustrial Metal Pollution; Springer: Singapore, 2015; pp. 101–119. [Google Scholar] [CrossRef]
  12. Wang, Z.; Deng, X.; Song, W.; Li, Z.; Chen, J. What is the main cause of grassland degradation? A case study of grassland ecosystem service in the middle-south Inner Mongolia. Catena 2017, 150, 100–107. [Google Scholar] [CrossRef]
  13. Tudorache, D. Sustainable Development in European Union as Expression of Social, Human, Economic, Technological and Environmental Progress; ZBW-Leibniz Information Centre for Economics: Berlin, Germany, 2020. [Google Scholar]
  14. Bai, Y.; Wong, C.; Jiang, B.; Hughes, A.; Wang, M.; Wang, Q. Developing China’s Ecological Redline Policy using ecosystem services assessments for land use planning. Nat. Commun. 2018, 9, 3034. [Google Scholar] [CrossRef] [Green Version]
  15. Nguyen, K.A.; Liou, Y.A. Global mapping of eco-environmental vulnerability from human and nature disturbances. Sci. Total Environ. 2019, 664, 995–1004. [Google Scholar]
  16. Zhang, H.; Xu, E. An evaluation of the ecological and environmental security on China’s terrestrial ecosystems. Sci. Rep. 2017, 7, 811. [Google Scholar] [CrossRef]
  17. Luo, Y.W.; Wei, M. Integrated Reform Plan for Promoting Ecological Progress and its Enlightment to the Establishment of China’s National Park System. Landsc. Archit. 2016, 12, 90–94. [Google Scholar] [CrossRef]
  18. Zhang, Q.; Bai, D.; Peng, X. Research status and future trends of natural resources and sustainable development in China: Visual analysis based on citespace. J. Resour. Ecol. 2021, 12. [Google Scholar] [CrossRef]
  19. Liu, J.; Raven, P.H. China’s Environmental Challenges and Implications for the World. Crit. Rev. Environ. Sci. Technol. 2010, 40, 823–851. [Google Scholar]
  20. Norton, S.B.; Rodier, D.J.; Schalie, W.; Wood, W.P.; Slimak, M.W.; Gentile, J.H. A framework for ecological risk assessment at the EPA. Environ. Toxicol. Chem. 2010, 11, 1663–1672. [Google Scholar]
  21. Han, B.; Liu, H.; Wang, R. Urban ecological security assessment for cities in the Beijing-Tianjin-Hebei metropolitan region based on fuzzy and entropy methods. Ecol. Model. 2015, 318, 217–225. [Google Scholar]
  22. Zhang, X.; Chen, M.; Guo, K.; Liu, Y.; Liu, Y.; Cai, W.; Wu, H.; Chen, Z.; Chen, Y.; Zhang, J. Regional Land Eco-Security Evaluation for the Mining City of Daye in China Using the GIS-Based Grey TOPSIS Method. Land 2021, 10, 118. [Google Scholar]
  23. Wang, S.R.; Meng, W.; Jin, X.C.; Zheng, B.H.; Zhang, L.; Xi, H.Y. Ecological security problems of the major key lakes in China. Environ. Earth Sci. 2015, 74, 3825–3837. [Google Scholar]
  24. Liu, C.; Wu, X.; Wang, L. Analysis on land ecological security change and affect factors using RS and GWR in the Danjiangkou Reservoir area, China. Appl. Geogr. 2019, 105, 1–14. [Google Scholar]
  25. Nathwani, J.; Lu, X.; Wu, C.; Fu, G.; Qin, X. Quantifying security and resilience of Chinese coastal urban ecosystems. Sci. Total Environ. 2019, 672, 51–60. [Google Scholar]
  26. Gao, Y.; Zhang, C.; He, Q.; Liu, Y. Urban Ecological Security Simulation and Prediction Using an Improved Cellular Automata (CA) Approach—A Case Study for the City of Wuhan in China. Int. J. Environ. Res. Public Health 2017, 14, 643. [Google Scholar]
  27. Gari, S.R.; Newton, A.; Icely, J.D. A review of the application and evolution of the DPSIR framework with an emphasis on coastal social-ecological systems. Ocean Coast. Manag. 2015, 103, 63–77. [Google Scholar]
  28. Levrel, H.; Kerbiriou, C.; Couvet, D.; Weber, J. OECD pressure-state-response indicators for managing biodiversity: A realistic perspective for a French biosphere reserve. Biodivers. Conserv. 2009, 18, 1719. [Google Scholar]
  29. Borja, Á.; Galparsoro, I.; Solaun, O.; Muxika, I.; Tello, E.M.; Uriarte, A.; Valencia, V. The European Water Framework Directive and the DPSIR, a methodological approach to assess the risk of failing to achieve good ecological status. Estuar. Coast. Shelf Sci. 2006, 66, 84–96. [Google Scholar]
  30. Kelble, C.R.; Loomis, D.K.; Lovelace, S.; Nuttle, W.K.; Ortner, P.B.; Fletcher, P.; Cook, G.S.; Lorenz, J.J.; Boyer, J.N. The EBM-DPSER Conceptual Model: Integrating Ecosystem Services into the DPSIR Framework. PLoS ONE 2013, 8, e70766. [Google Scholar] [CrossRef] [Green Version]
  31. Cooper, P. Socio-ecological accounting: DPSWR, a modified DPSIR framework, and its application to marine ecosystems. Ecol. Econ. 2013, 94, 106–115. [Google Scholar]
  32. Pinto, R.; Jonge, V.; Neto, J.M.; Domingos, T.; Marques, J.C.; Patricio, J. Towards a DPSIR driven integration of ecological value, water uses and ecosystem services for estuarine systems. Ocean Coast. Manag. 2013, 72, 64–79. [Google Scholar]
  33. Pirrone, N.; Trombino, G.; Cinnirella, S.; Algieri, A.; Bendoricchio, G.; Palmeri, L. The Driver-Pressure-State-Impact-Response (DPSIR) approach for integrated catchment-coastal zone management: Preliminary application to the Po catchment-Adriatic Sea coastal zone system. Reg. Environ. Change 2005, 5, 111–137. [Google Scholar]
  34. Lewison, R.L.; Rudd, M.A.; Al-Hayek, W.; Baldwin, C.; Beger, M.; Lieske, S.N.; Jones, C.; Satumanatpan, S.; Junchompoo, C.; Hines, E. How the DPSIR framework can be used for structuring problems and facilitating empirical research in coastal systems. Environ. Sci. Policy 2016, 56, 110–119. [Google Scholar]
  35. Svarstad, H.; Petersen, L.K.; Rothman, D.; Siepel, H.; Wätzold, F. Discursive biases of the environmental research framework DPSIR. Land Use Policy 2008, 25, 116–125. [Google Scholar]
  36. Kohsaka, R. Developing biodiversity indicators for cities: Applying the DPSIR model to Nagoya and integrating social and ecological aspects. Ecol. Res. 2010, 25, 925–936. [Google Scholar]
  37. Binimelis, R.; Monterroso, I.; Rodríguez-Labajos, B. Catalan agriculture and genetically modified organisms (GMOs)—An application of DPSIR model. Ecol. Econ. 2009, 69, 55–62. [Google Scholar] [CrossRef]
  38. Sun, S.; Wang, Y.; Jing, L.; Cai, H.; Xu, L. Sustainability Assessment of Regional Water Resources Under the DPSIR Framework. J. Hydrol. 2016, 532, 140–148. [Google Scholar]
  39. Tscherning, K.; Helming, K.; Krippner, B.; Sieber, S.; y Paloma, S.G. Does research applying the DPSIR framework support decision making? Land Use Policy 2012, 29, 102–110. [Google Scholar]
  40. Newton, A.; Weichselgartner, J. Hotspots of coastal vulnerability: A DPSIR analysis to find societal pathways and responses. Estuar. Coast. Shelf Sci. 2014, 140, 123–133. [Google Scholar]
  41. Atkins, J.P.; Burdon, D.; Elliott, M.; Gregory, A.J. Management of the marine environment: Integrating ecosystem services and societal benefits with the DPSIR framework in a systems approach. Mar. Pollut. Bull. 2011, 62, 215–226. [Google Scholar] [CrossRef]
  42. Rudy, V. Using DPSIR and Balances to Support Water Governance. Water 2018, 10, 118. [Google Scholar]
  43. Akbari, M.; Memarian, H.; Neamatollahi, E.; Shalamzari, M.J.; Zakeri, D. Prioritizing policies and strategies for desertification risk management using MCDM–DPSIR approach in northeastern Iran. Environ. Dev. Sustain. 2021, 23, 2503–2523. [Google Scholar]
  44. Bidone, E.; Lacerda, L.D. The use of DPSIR framework to evaluate sustainability in coastal areas. Case study: Guanabara Bay basin, Rio de Janeiro, Brazil. Reg. Environ. Change 2004, 4, 5–16. [Google Scholar]
  45. Jun, K.S.; Chung, E.S.; Sung, J.Y.; Lee, K.S. Development of spatial water resources vulnerability index considering climate change impacts. Sci. Total Environ. 2011, 409, 5228–5242. [Google Scholar]
  46. Kristensen, P. The DPSIR Framework; National Environmental Research Institute: Roskilde, Denmark, 2004. [Google Scholar]
  47. Barton, D.N.; Kuikka, S.; Varis, O.; Uusitalo, L.; Henriksen, H.J.; Borsuk, M.; Hera, A.; Fa Rmani, R.; Johnson, S.; Linnell, J.D. Bayesian networks in environmental and resource management. Integr. Environ. Assess. Manag. 2012, 8, 418–429. [Google Scholar]
  48. Hepelwa, A. Dynamics of Watershed Ecosystem Values and Sustainability: An Integrated Assessment Approach. Int. J. Ecosyst. 2014, 4, 43–52. [Google Scholar]
  49. Skoulikidis, N.T. The environmental state of rivers in the Balkans—A review within the DPSIR framework. Sci. Total Environ. 2009, 407, 2501–2516. [Google Scholar]
  50. Ness, B. Erratum to “Integrated research on subsurface environments in Asian urban areas”. Sci. Total Environ. 2009, 409, 3076–3088. [Google Scholar]
  51. Zhao, R.; Fang, C.; Liu, H.; Liu, X. Evaluating urban ecosystem resilience using the DPSIR framework and the ENA model: A case study of 35 cities in China. Sustain. Cities Soc. 2021, 72, 102997. [Google Scholar]
  52. Jago-On, K.; Kaneko, S.; Fujikura, R.; Fujiwara, A.; Imai, T.; Matsumoto, T.; Zhang, J.; Tanikawa, H.; Tanaka, K.; Lee, B. Urbanization and subsurface environmental issues: An attempt at DPSIR model application in Asian cities. Sci. Total Environ. 2009, 407, 3089–3104. [Google Scholar]
  53. Maxim, L.; Spangenberg, J.H.; O’Connor, M. An analysis of risks for biodiversity under the DPSIR framework. Ecol. Econ. 2009, 69, 12–23. [Google Scholar]
  54. Alexakis, D.; Kagalou, I.; Tsakiris, G. Assessment of pressures and impacts on surface water bodies of the Mediterranean. Case study: Pamvotis Lake, Greece. Environ. Earth Sci. 2013, 70, 687–698. [Google Scholar]
  55. Skulmoski, G.J.; Hartman, F.T.; Krahn, J. The Delphi Method for Graduate Research. J. Inf. Technol. Educ. 2007, 6, 1–21. [Google Scholar]
  56. Zou, Z.H.; Yun, Y.; Sun, J.N. Entropy method for determination of weight of evaluating indicators in fuzzy synthetic evaluation for water quality assessment. J. Environ. Sci. 2006, 18, 1020–1023. [Google Scholar] [CrossRef]
  57. Zhang, E.; Liu, E.; Jones, R.; Langdon, P.; Yang, X.; Shen, J. A 150-year record of recent changes in human activity and eutrophication of Lake Wushan from the middle reach of the Yangze River, China. J. Limnol. 2010, 69, 235–241. [Google Scholar]
  58. Yang, G.; Ding, Y.; Zhou, L. Impact of Land-Use Changes on Intensity of Soil Erosion in the Mountainous Area in the Upper Reach of Shiyang River in Arid Northwest China. Geosci. Remote Sens. Symposium Igarss IEEE Int. 2008, 4, 639–642. [Google Scholar]
  59. El Banna, M.M.; Frihy, O.E. Natural and anthropogenic influences in the northeastern coast of the Nile delta, Egypt. Environ. Geol. 2009, 57, 1593–1602. [Google Scholar]
  60. Córdoba, E.; Martínez, A.; Ferrer, E.V. Water quality indicators: Comparison of a probabilistic index and a general quality index. The case of the Confederación Hidrográfica del Júcar (Spain). Ecol. Indic. 2010, 10, 1049–1054. [Google Scholar]
  61. Hakanson, L. An ecological risk index for aquatic pollution control.a sedimentological approach. Water Res. 1980, 14, 975–1001. [Google Scholar]
Figure 1. Framework of the SEEC model.
Water 14 00106 g001
Figure 2. Overview of the study area.
Water 14 00106 g002
Figure 3. Land use types within the study area (2014).
Water 14 00106 g003
Figure 4. Ecological security index (ESI) values throughout the entire study area.
Water 14 00106 g004
Figure 5. Radar diagram for the four factors in the SEEC model.
Water 14 00106 g005
Figure 6. Radar diagrams for the four factors in the SEEC model: (a) socioeconomic impact assessment results, (b) ecological health assessment results, (c) ecological services function assessment results, and (d) control management assessment results.
Water 14 00106 g006
Figure 7. Scoring results for the comprehensive nutritional index (left) and potential heavy metals ecological risk index (right).
Water 14 00106 g007
Figure 8. Comprehensive evaluation results of water quality in the study area in 2014 (the lower the score, the better the water quality).
Water 14 00106 g008
Table 1. Classification standard of the ESI.
ClassificationEcological Security Index (ESI)Safety Status
80 ≤ ESI ≤ 100Safe
60 ≤ ESI < 80Relatively safe
40 ≤ ESI < 60Generally safe
20 ≤ ESI < 40Relatively unsafe
ESI < 20Unsafe
Publisher’s Note: MDPI stays neutral with regard to jurisdictional claims in published maps and institutional affiliations.

