
Climate Change Attribution in the Lena and Selenga River Runoff: An Evaluation Based on the Earth System and Regional Hydrological Models


Water Problems Institute, Russian Academy of Sciences, 119333 Moscow, Russia
Water 2022, 14(1), 118; https://doi.org/10.3390/w14010118
Submission received: 30 November 2021
/
Revised: 23 December 2021
/
Accepted: 1 January 2022
/
Published: 5 January 2022
(This article belongs to the Special Issue Climate Change and Human Impact on Freshwater Water Resources: Rivers and Lakes)
Abstract
:The main goal of this study was to obtain the attribution results of a physical assessment of the modern hydrological consequences of separately natural and anthropogenic components of climate change, based on the synthesis of detailed process-based models of river runoff formation and an ensemble of Earth system models (ESMs) within the large river basins in Eastern Siberia. This approach allows calculating the river flow using ESM-based data over the observation period under two scenarios, considering: (1) the anthropogenic impact of increasing greenhouse gas emissions and (2) only internal fluctuations of the climate system and natural external forcing. According to the results of the numerical experiments, the attributions of anthropogenic components of climate change in the dynamics of the Lena runoff are weak, i.e., during the observation period, the Lena River flow statistically significantly increases, but it occurs mainly due to natural climate variability. The changes in the Selenga runoff are intensely influenced by the anthropogenic component of climate change. Since the 1970s, the Selenga runoff increased under natural climatic conditions, but since the mid-1980s, it decreased under anthropogenic greenhouse gas emissions, due to reduced summer precipitation. This was the main reason for the last low-water period of 1996–2017 in the Selenga basin.
1. Introduction
Among the methods used to estimate the hydrological consequences of climate change are those based on statistical analyses of long-term hydrometeorological observations (e.g., [1,2]) and elasticity criteria [3,4], to identify trends in features and their significance.
The assessments of river flow changes based on calculation results using only Earth system models (ESMs) or global hydrological models, which have simplified parameterizations of land hydrological cycle processes, do not take into account regional features of runoff formations. Such approaches with significant errors reproduce seasonal features of intra-annual runoff related to snow accumulation and snowmelt processes in the watershed and flow routing. In addition, the spatial resolution of climate models and global hydrological models is challenging when assessing the hydrological consequences of climate change in parts of the river basin.
More reliable estimates of climate change impacts on the water regime can be obtained using spatially distributed process-based models of the land hydrological cycle [5,6]. The values of most parameters of such models are set from global databases of land surfaces, which, in combination with the physical description of hydrological processes, allows detailed spatial and temporal analyses of the runoff formation conditions.
In recent years, methods used to assess the climate change impact on the water regimes of large rivers, using regional spatially-distributed hydrological models, in which scenarios of hydrometeorological impacts on the watersheds, according to the ESM-based data, are set as boundary conditions, have become increasingly common (e.g., [7,8,9]). However, the vast majority of scientific articles on the hydrological implications of climate change are concerned with determining the cumulative impact of climate change on river runoff, using variously detailed runoff formation models. Moreover, the main research focus is related to calculations of the future water regime, when the anthropogenic component of climate change is strongly manifested according to the Representative Concentration Pathway (RCP) 8.5 scenario or by the end of the 21st century, especially for high latitudes. At the same time, it is important to determine the climate-driven causes of current changes in river flow, which may have both natural and anthropogenic genesis, i.e., the so-called method of detection and attribution (D&A).
The main goal of this study was to obtain the attribution results of a physical assessment of the modern hydrological consequences of the natural and anthropogenic components of climate change, based on the synthesis of detailed process-based models of river runoff formation and ESMs within large river basins in Eastern Siberia. This approach allows calculating the river flow using ESM-based data over the observation period under two scenarios, considering: (1) the anthropogenic impacts of increasing greenhouse gas emissions and (2) only internal fluctuations of the climate system and natural external forcing. A review of publications on this topic showed that there are very few studies of the effects of climate change components on streamflow based on runoff formation modeling using ESM-based data, and they were conducted for individual river basins (e.g., [10,11]).
In this study, the Coupled Model Intercomparison Project (CMIP5) [12] ESM-based data from 1861 to 2005 were used to attribute the hydrological consequences of natural and anthropogenic components of climate change, according to two sets: (1) the piControl (pre-industrial) dataset, considering only variations in the climate system, mainly due to ocean heat redistribution and natural external, including changes in solar radiation and volcanic activity, when it was assumed that the anthropogenic impact on climate change associated with greenhouse gas emissions was negligible. (2) The Historical dataset, when the impact of anthropogenic activities (greenhouse gases, aerosols, and the resulting changes in clouds change in the albedo of the Earth’s surface associated with land use) became more intense.
At the same time, the rate of increase in greenhouse gas emissions of CO2, CH4, and N2O, as a result of fossil fuel use, agriculture, energy, forest, and fire, etc., normalized to the CO2 content in the atmosphere, was forced in ESMs, according to the CO2 concentration observations at the Mauna Loa station since 1958, and prior to that, according to the recovered values from the ice cores. This approach made it possible to estimate both the natural climate variability during the development of industrialization and to determine the anthropogenic component of climate change (the greenhouse gases (GHG) dataset) from the difference between the Historical and piControl datasets. Calculations of the water regime using various datasets of ESMs as boundary conditions of a spatially distributed process-based hydrological model made it possible to attribute observed changes in river flow and identify natural and anthropogenic components of climate change. Thus, the influence of physically-based earth system dynamics processes on regional changes in river flow was investigated.
2. Data and Methods
2.1. Study Area
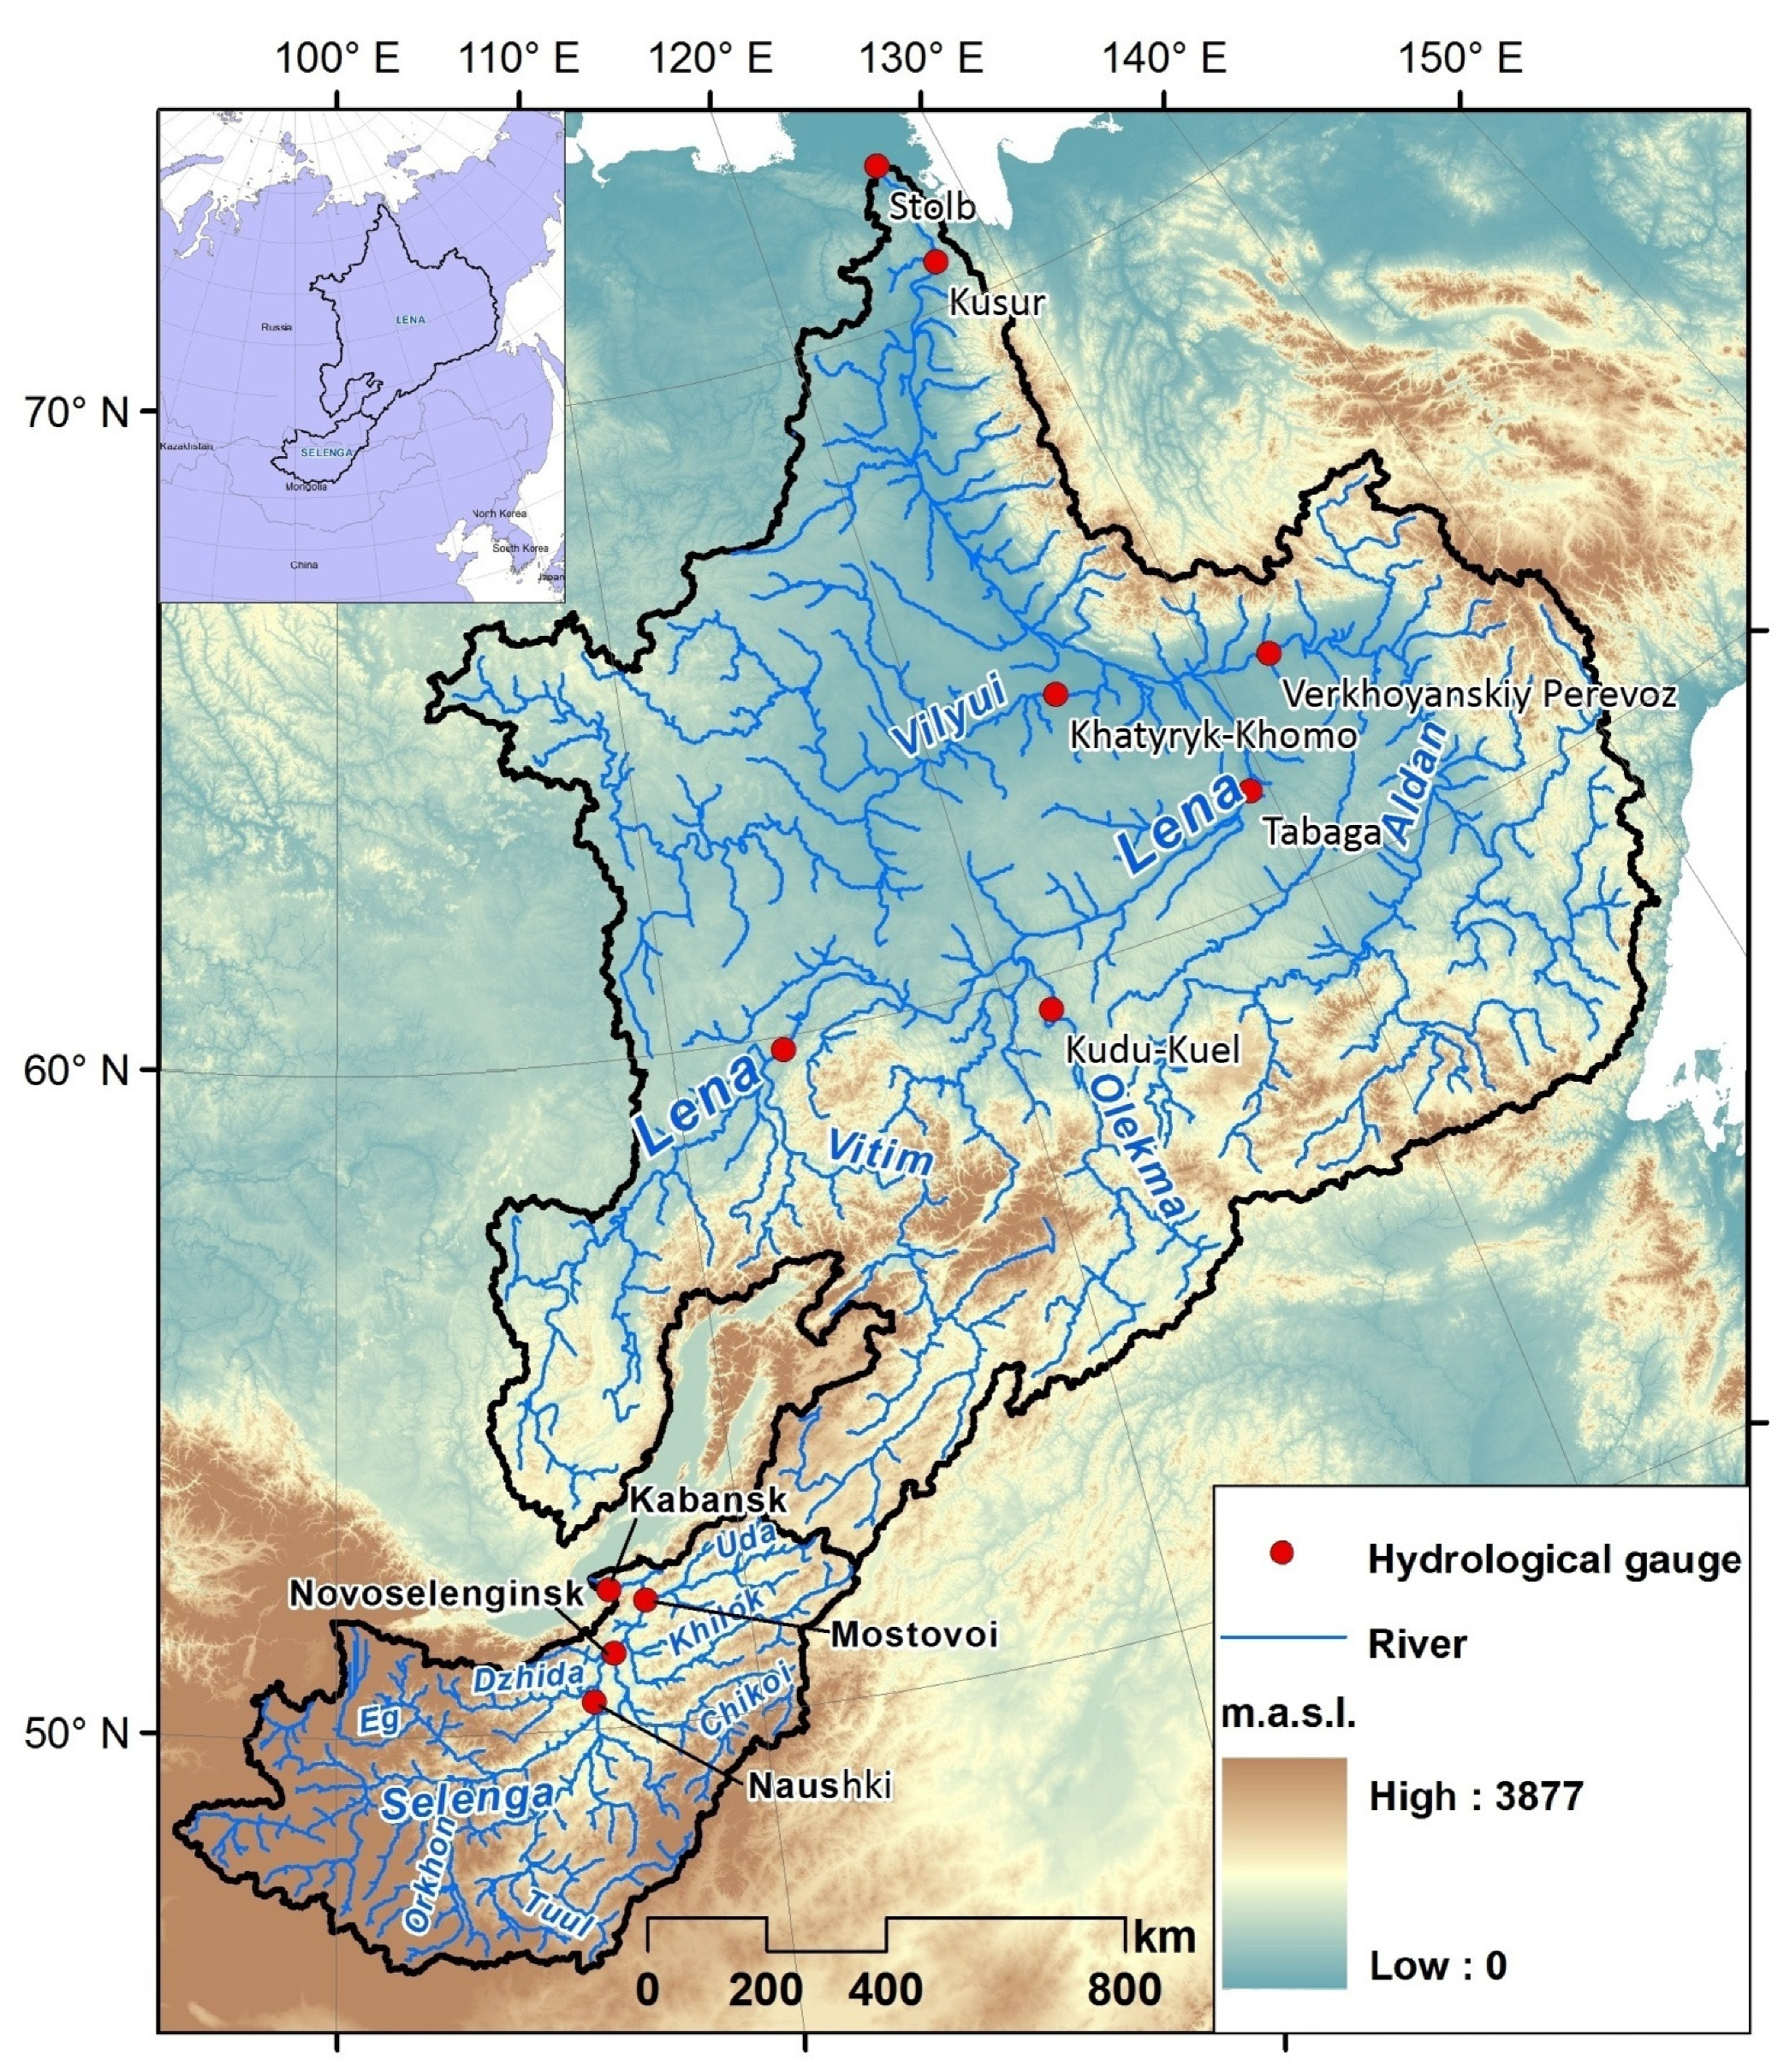
The study is based on the major river basins in Eastern Siberia: the Lena and Selenga (Figure 1). The Lena basin is the eighth largest river basin in the world (2,490,000 km2) and is located in a cold continental climate and permafrost. The water regime of the Lena River is characterized by high spring flood, summer–autumn floods, and winter runoff due to groundwater. The highest water month is June. The mean annual discharge is 16,970 m3 s−1. The main tributaries of the Lena River are the Aldan, Vilyui, Vitim, and Olekma rivers. The top three land use/land cover (LULC) by area are: deciduous conifer forest, deciduous and mixed boreal forest, and small leaf mixed woods.
The Selenga is the largest tributary of Lake Baikal, providing about 50% of the river flow into the lake. The Selenga basin (445,000 km2) is about 80% of Lake Baikal’s catchment area. The water regime is characterized by low spring floods, a series of high summer–autumn floods, and winter low-water periods. The highest water month is August. The mean annual runoff is 880 m3 s−1. The main tributaries of the Selenga River are the Orkhon, Eg, Chikoi, Khilok, Uda, and Dzhida Rivers. Two-thirds of the Selenga Basin in Mongolia generates about one-third of its river flow. The top three LULCs by area: herbaceous with sparse tree and shrubs, needleleaf deciduous forest, needleleaf evergreen forest.
2.2. Changes in the Water Regime According to Observation Data
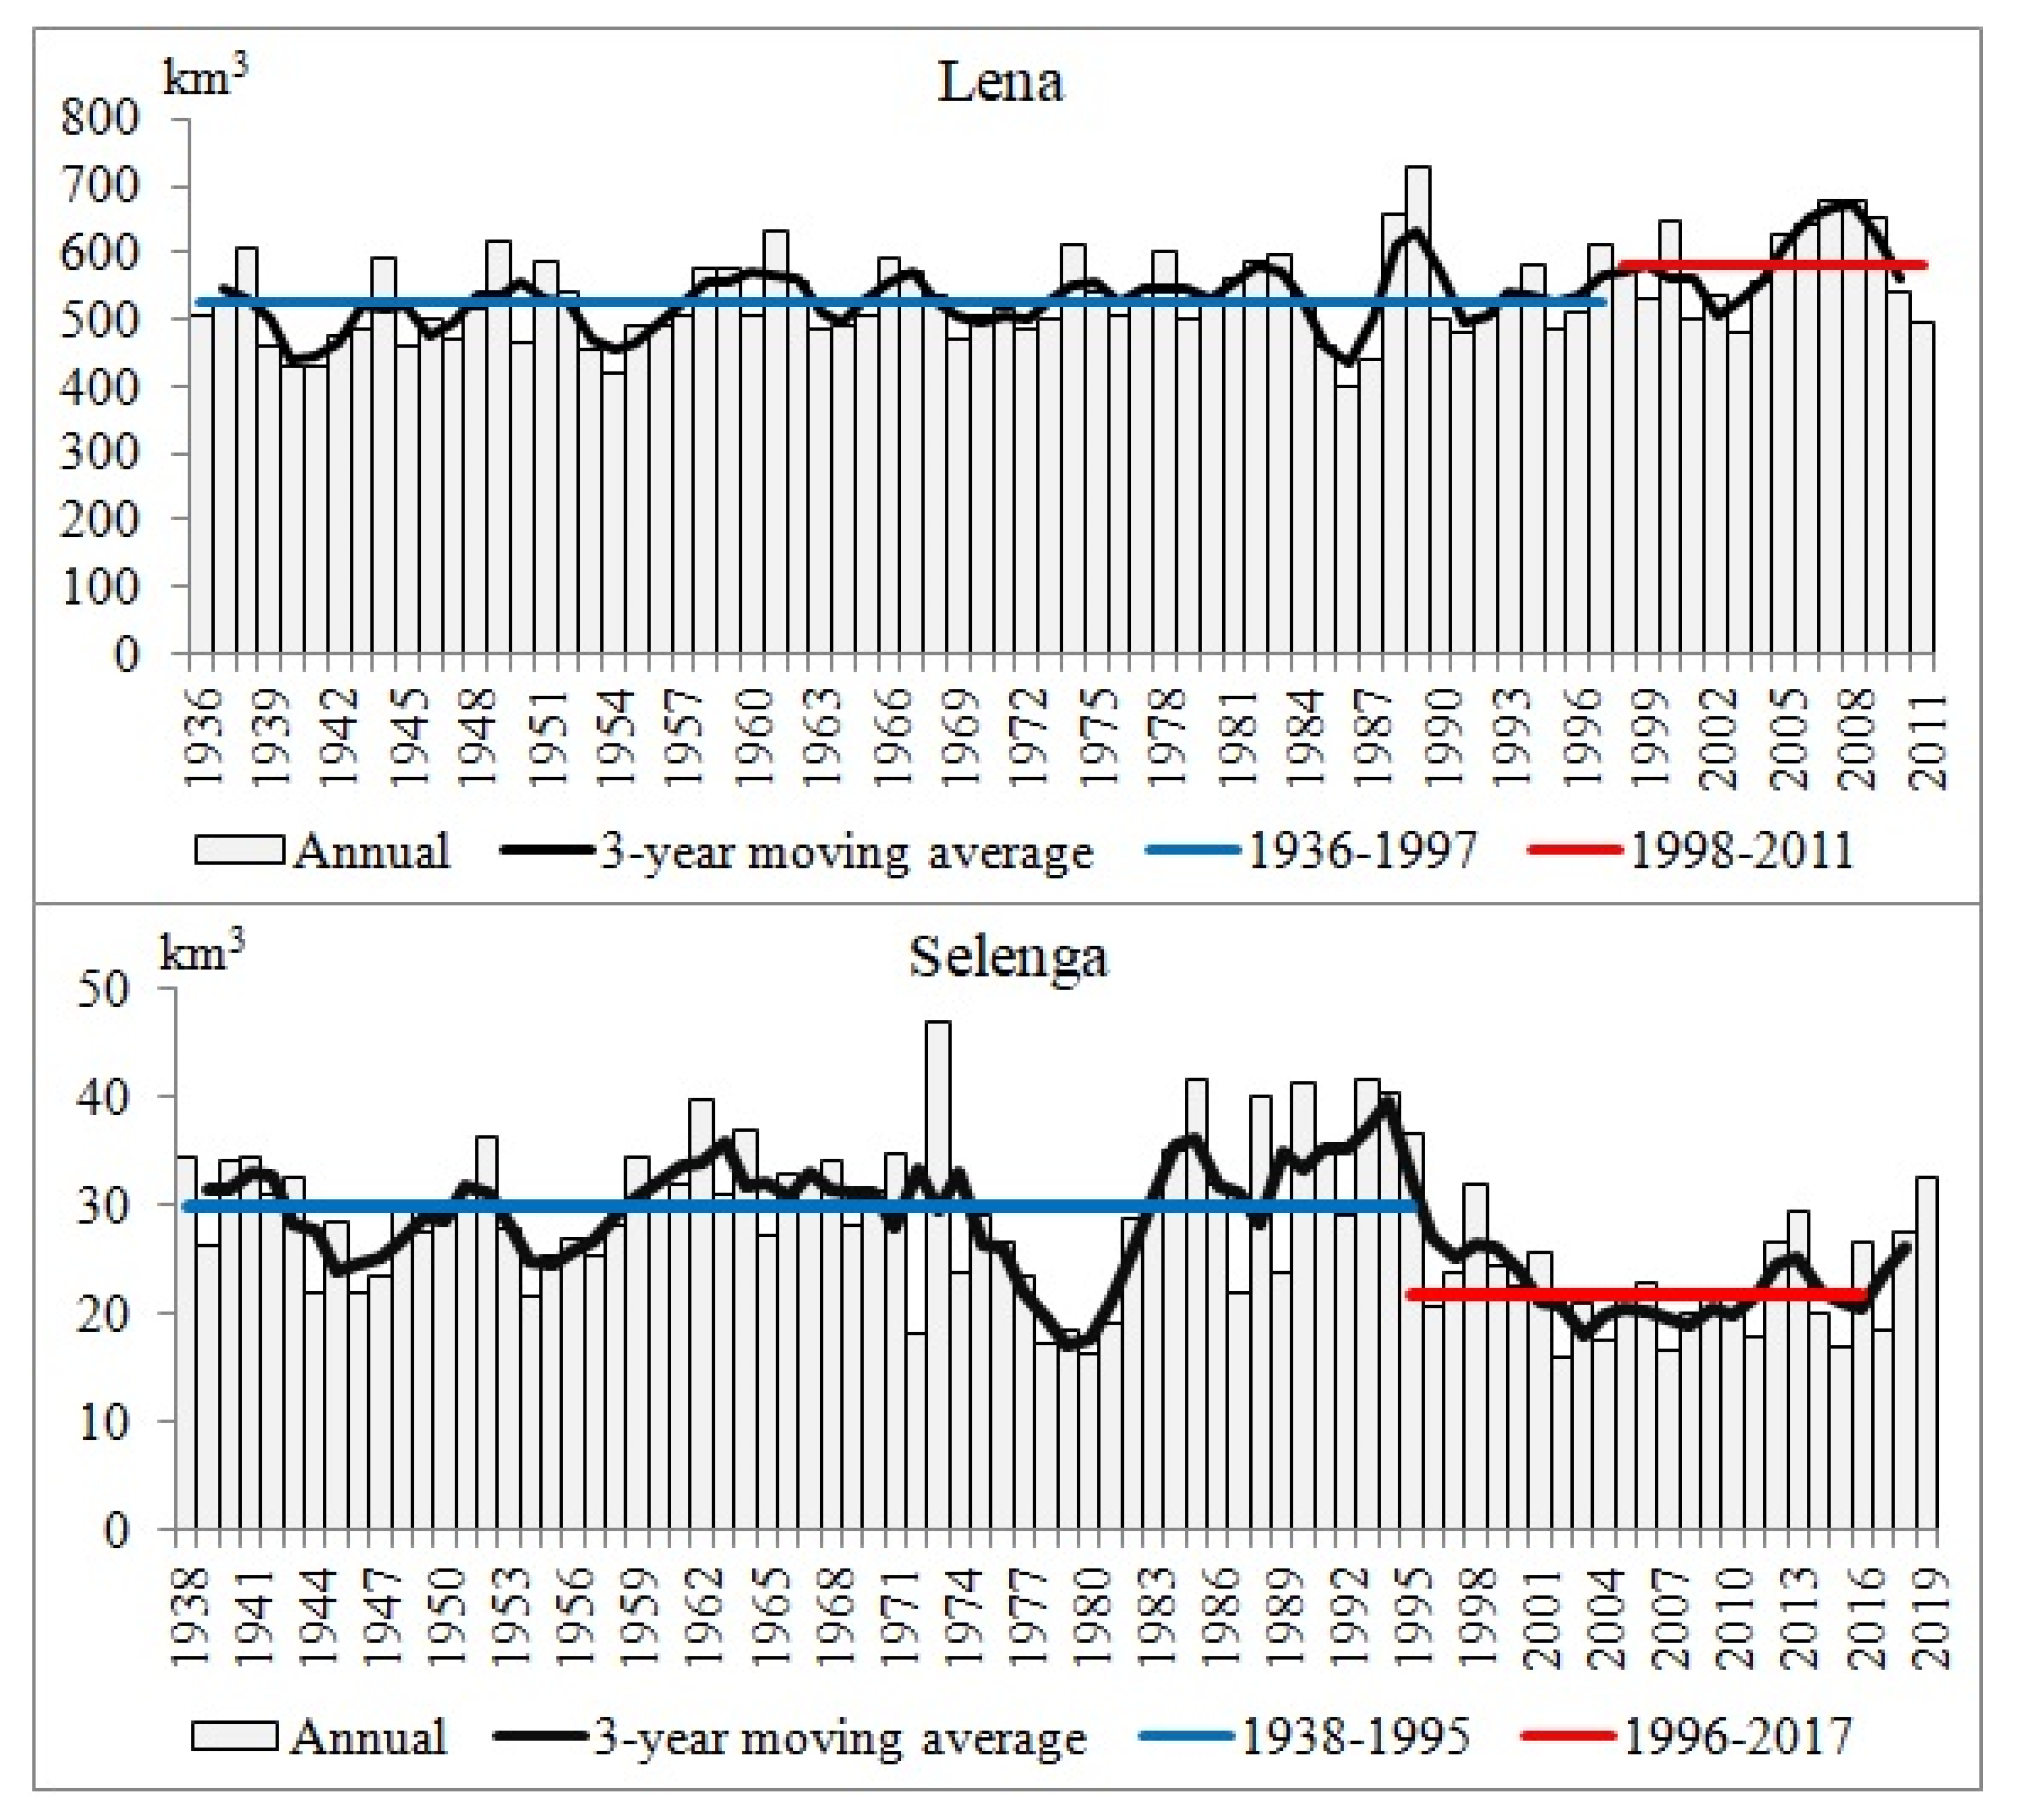
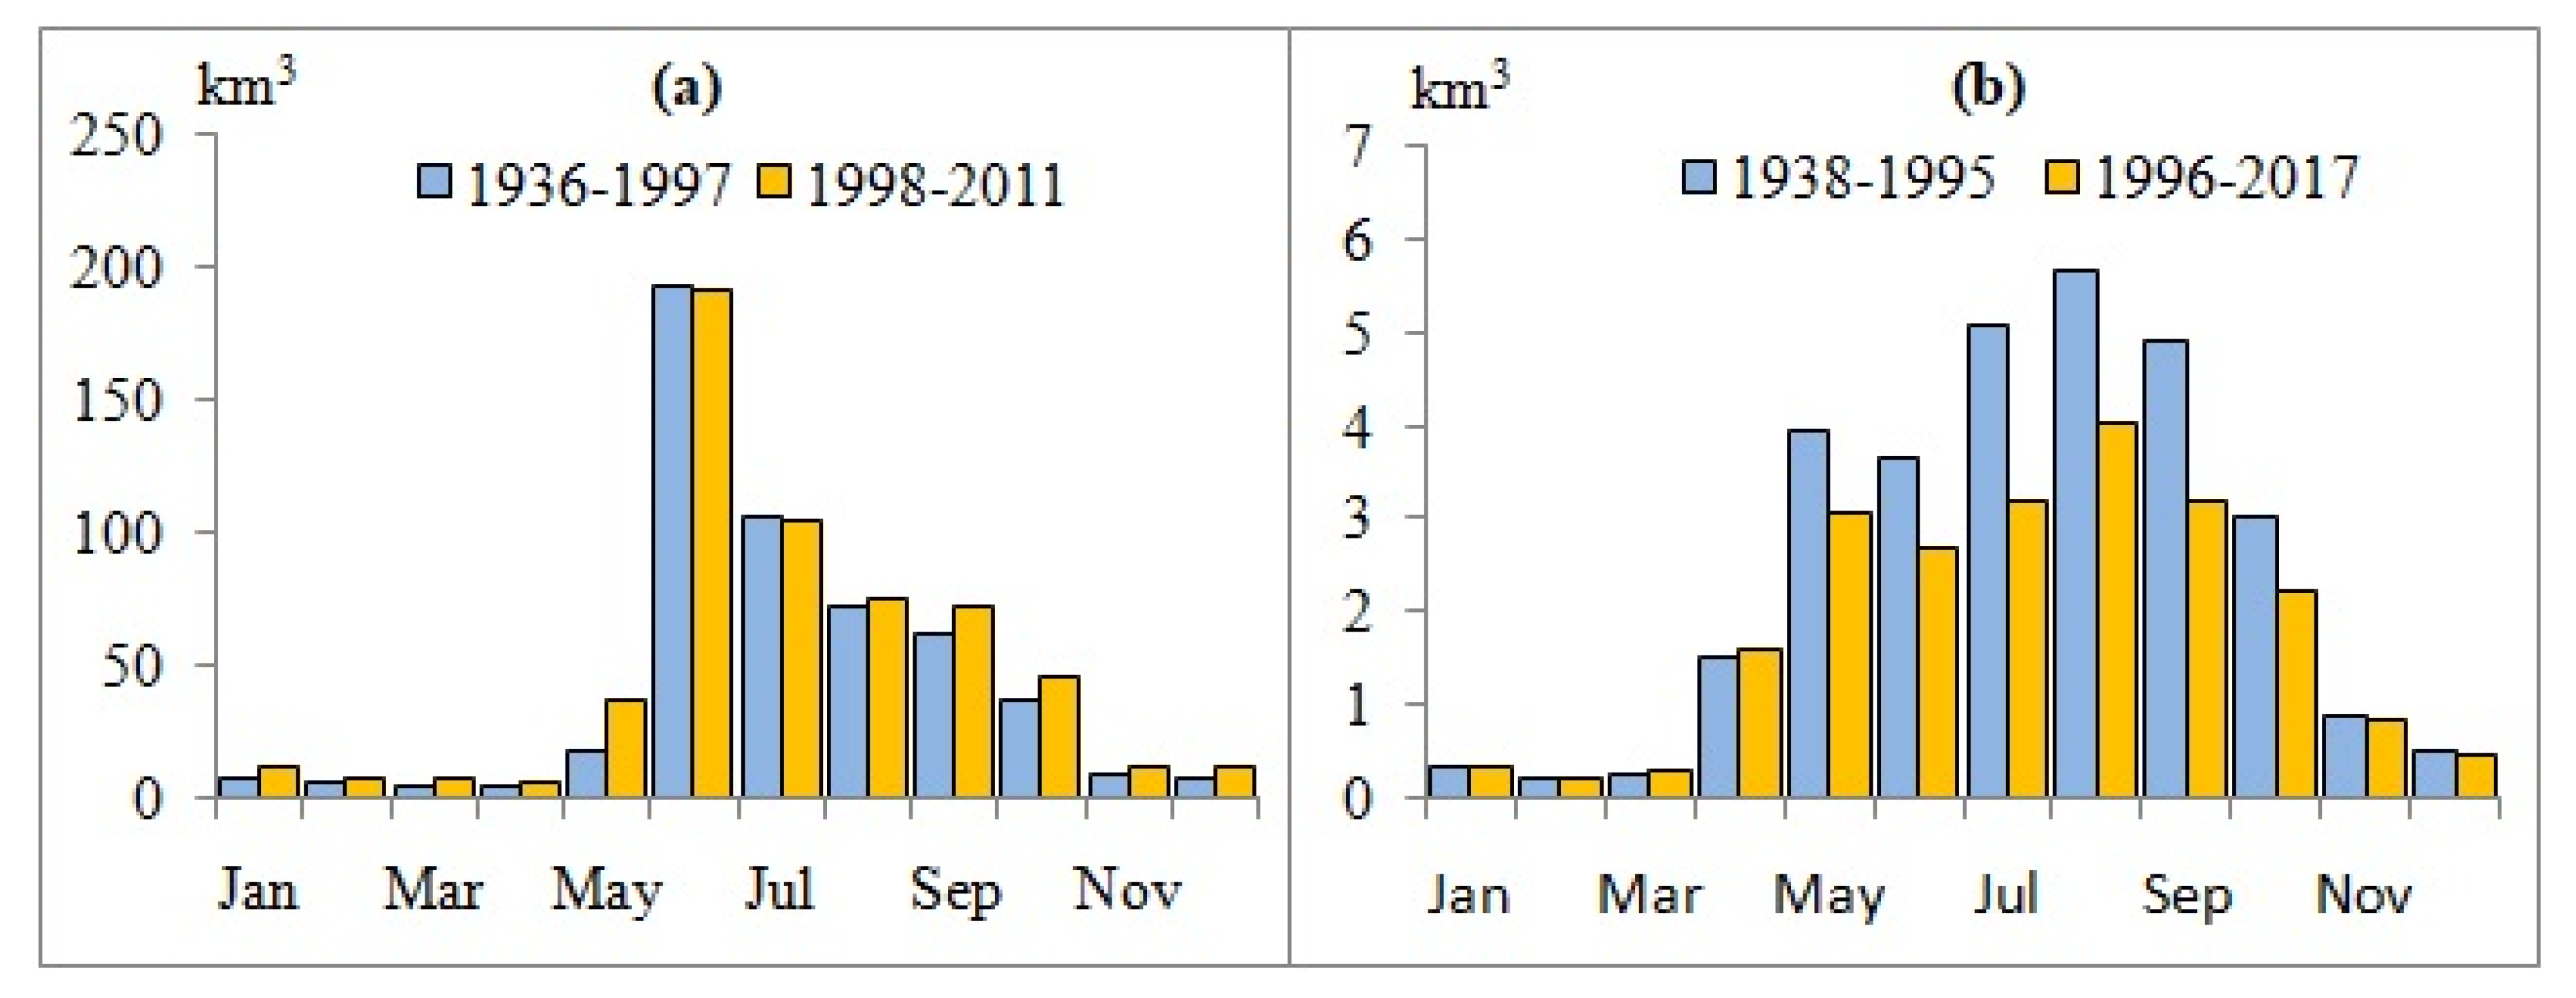
During the 20th and 21st centuries, the Lena River basin experienced some of the most intense changes in climate and river flow [13]. Since the early 21st century, the Lena River has been characterized by high-water availability [14]. Analyses of the annual Lena River runoff over the observation period, since 1936, at the outlet gauge Kusur, using the Mann–Kendall test, showed a statistically significant increase in flow at the 5% level after 1997. During the period 1936–1997, the mean annual runoff of the Lena River was 525 km3; during the period 1998–2011 (since 2012, discharge was not measured), it was 582 km3, i.e., 11% more (Figure 2). An analysis of the intra-annual flow distribution showed that the increase in the Lena River runoff could be explained by the 37% increase in the runoff from September to May (Figure 3). At the same time, the greatest increase in runoff was noted for May, September, and October. The magnitude of annual flow fluctuations was from 401 km3 in 1986 to 727 km3 in 1989.
The Selenga runoff corresponds to an extremely low-water period after 1995 [15,16]. Analyses of the annual Selenga River runoff over the observation period, since 1938, at the outlet gauge Mostovoi, using the Mann–Kendall test, showed a statistically significant decrease in flow at the 5% level after 2008. During the period 1938–1995, the mean annual runoff of the Selenga River was 29.9 km3, and during the low-water period (1996–2017), it was 21.9 km3, i.e., 27% less (Figure 2). An analysis of the intra-annual flow distribution showed that the decrease in the Selenga runoff was explained by a 30% decrease in runoff from May to October, which accounts for over 85% of the annual runoff (Figure 3). At the same time, the greatest decrease in runoff was noted for July. The magnitude of annual flow fluctuations was from 16 km3 in 2002 to 46.7 km3 in 1973. Such contrasting changes in the large rivers in Eastern Siberia may be caused by global climatic processes affecting precipitation and evaporation under global warming.
2.3. Hydrological Modeling
Hydrological models of river runoff formation previously developed for the Lena [17] and Selenga [18,19] basins, based on ECOlogical Model for Applied Geophysics (ECOMAG) software [20,21], were used as the main research tool. The models take into account the basic processes of runoff generation, including infiltration of precipitation, snow melting, freezing, and thawing of the soil, evapotranspiration, pre-channel, subsurface and groundwater flow, and streamflow transformation in the channel system. A more detailed description of the model structure and mathematical description of the flow generation processes in the ECOMAG model is presented in [20,22,23,24]. The Harmonized World Soil Database (HWSD) and the global land cover characterization (GLCC) database were used in the Lena and Selenga models to set the land surface parameters. Schematization of the catchment and river network were performed based on the HYDRO1k digital elevation model (DEM). As a result, river basins were divided into hydrological response units (HRUs). The Lena basin was divided into 664 HRUs with an average area of 3700 km2, and the Selenga basin was divided into 469 HRUs with an average area of 970 km2.
The data from 203 weather stations by the RIHMI-WDC database (http://meteo.ru/english/climate/cl_data.php, accessed on 30 November 2021) were used as meteorological inputs in the Lena basin model. Due to the lack of homogeneous observation data in the Russian and Mongolian parts of the Selenga basin, the model used the EWEMBI reanalysis data with a spatial resolution of 0.5° × 0.5°, prepared by the Potsdam Institute for Climate Impact Research (Germany) based on the ERA-Interim reanalysis [25]. The initial meteorological data in the runoff formation models were the daily air temperature and vapor pressure deficit, and precipitation, according to the location of weather stations or the reanalysis grid. Based on the prepared information component of the models, they were calibrated by various parameters, among which, the most sensitive were the soil moisture evaporation coefficient, snow-melting coefficient, horizontal and vertical hydraulic conductivity of soil, critical temperature for transformation of the precipitation phase, and snow melting.
Model parameters were calibrated and verified by comparing the accuracy of the simulated daily runoff to the observed values in different gauges according to the statistical criteria Nash–Sutcliffe efficiency (NSE) and percent bias (PBIAS). The model for the Lena basin was calibrated for the period 1994–2003 and verified for the period 2004–2013. The periods of model calibration 1984–1993 and verification 1994–2003 were chosen for the Selenga basin, to evaluate the performance of the runoff formation model for the high-water period (before 1995) and for the following low-water period.
Before proceeding to numerical experiments with the ESMs data, it is necessary to evaluate the accuracy of simulation of mean annual and monthly normal runoff by hydrological models relative to observational data for long-term periods, including beyond the periods of model calibration and verification. The period of the late 20th century (1970–1999) was chosen for the Lena basin, and the 25-year period (1981–2005) was chosen for the Selenga basin, due to the limited duration of reanalysis data.
2.4. Calculations Using the ESMs Data
The ensemble of four ESMs (GFDL-ESM2M, HadGEM2-ES, IPSL-CM5A-LR, and MIROC5) of the Inter-Sectoral Impact Model Intercomparison Project (ISIMIP) were used for the climatic calculations within the Lena and Selenga basins. The ESM output data were downscaled to a regular grid of 0.5°, and bias-correction procedure was carried out relative to the EWEMBI reanalysis [26]. Two datasets (Historical and piControl) were used as boundary conditions in the hydrological models of the Lena and Selenga river basins. The hydrological simulations were performed for each of the four ESMs, and then the averaged-ensemble was obtained for the Historical and piControl datasets. Hydrological modeling using ESM data was performed at the parameter set for the calibration period. As a result, the corresponding ensemble of long-term hydrographs of daily runoff was calculated.
According to [27,28], for extrapolation calculations from the ESM data, we need to assess the accuracy of their reproduction of meteorological and hydrological values simulated by runoff formation models for the Lena basin (from 1970 to 1999) and for the Selenga basin (from 1981 to 2005). In addition, we verified the annual runoff calculations at the outlet gauges for the observation period at Kusur gauge (from 1936) and Mostovoi gauge (from 1938 to 2005) using the hydrological modeling based on the ESM Historical dataset, and smoothing the series by a 30-year moving average.
Anomalies of meteorological and hydrological parameters using the piControl dataset were estimated relative to the baseline (reference) period, which was chosen as a 30-year period of the late 20th century (1970–1999) for both river basins. For this purpose, the mean value determined for the baseline period was subtracted from the mean annual and seasonal values calculated for each year. Then the obtained anomalies were averaged to a 30-year moving average. Anomalies of meteorological parameters and runoff using the GHG dataset were estimated by subtracting the piControl value from the Historical value for each year. Then the obtained anomalies were averaged to a 30-year moving average. The air temperature anomalies were estimated in degrees Celsius, and in terms of precipitation and river runoff—in percent.
To compare the two river basins by meteorological characteristics, there was a unified division of the year into seasons: winter (November–March), spring (April–May), summer (June–August), autumn (September–October). The division of runoff into seasons was as follows: spring flood on the Lena (May–June) and Selenga (April–May), summer–autumn floods on the Lena (July–October) and Selenga (June–October), winter low-water period on the Lena (November–April) and Selenga (November–March). Such a choice is explained by both climatic parameters and the size of the river catchments, as well as the time flow routing up to outlet gauges.
To assess the climate change impact on the high and low river flow, we used the approach of determining the discharges corresponding to the probability of exceedance by the daily flow duration curve, averaged for the 30-year periods of the late 19th, and middle and late 20th centuries. The high flow (Q10) corresponded to a 10% probability value, and the low flow (Q90) corresponded to a 90% probability value. Based on the performed numerical experiments using hydrological models and ESMs, a spatial analysis of the attribution of anthropogenic component of climate change to changes in the mean annual air temperature and precipitation, as well as the annual runoff depth in the Lena and Selenga basins for the late 20th century (1970–1999), was carried out. Differential integral curves of the Lena and Selenga annual runoff under a natural climate variability (the piControl dataset)—taking into account anthropogenic greenhouse gas emissions (the Historical dataset)—were used to determine periods of increased and decreased water availability in the river basins.
3. Results and Discussion
3.1. Calibration and Verification of Hydrological Models
The results of calibration and verification of runoff formation models (Table 1) showed that 85% of the calculated criteria values for gauges in the Lena and Selenga river basins, according to [29], corresponded to good modeling quality (NSE > 0.70, |PBIAS| < 15%), and the remaining values were satisfactory. In addition, model robustness was noted for the verification period.
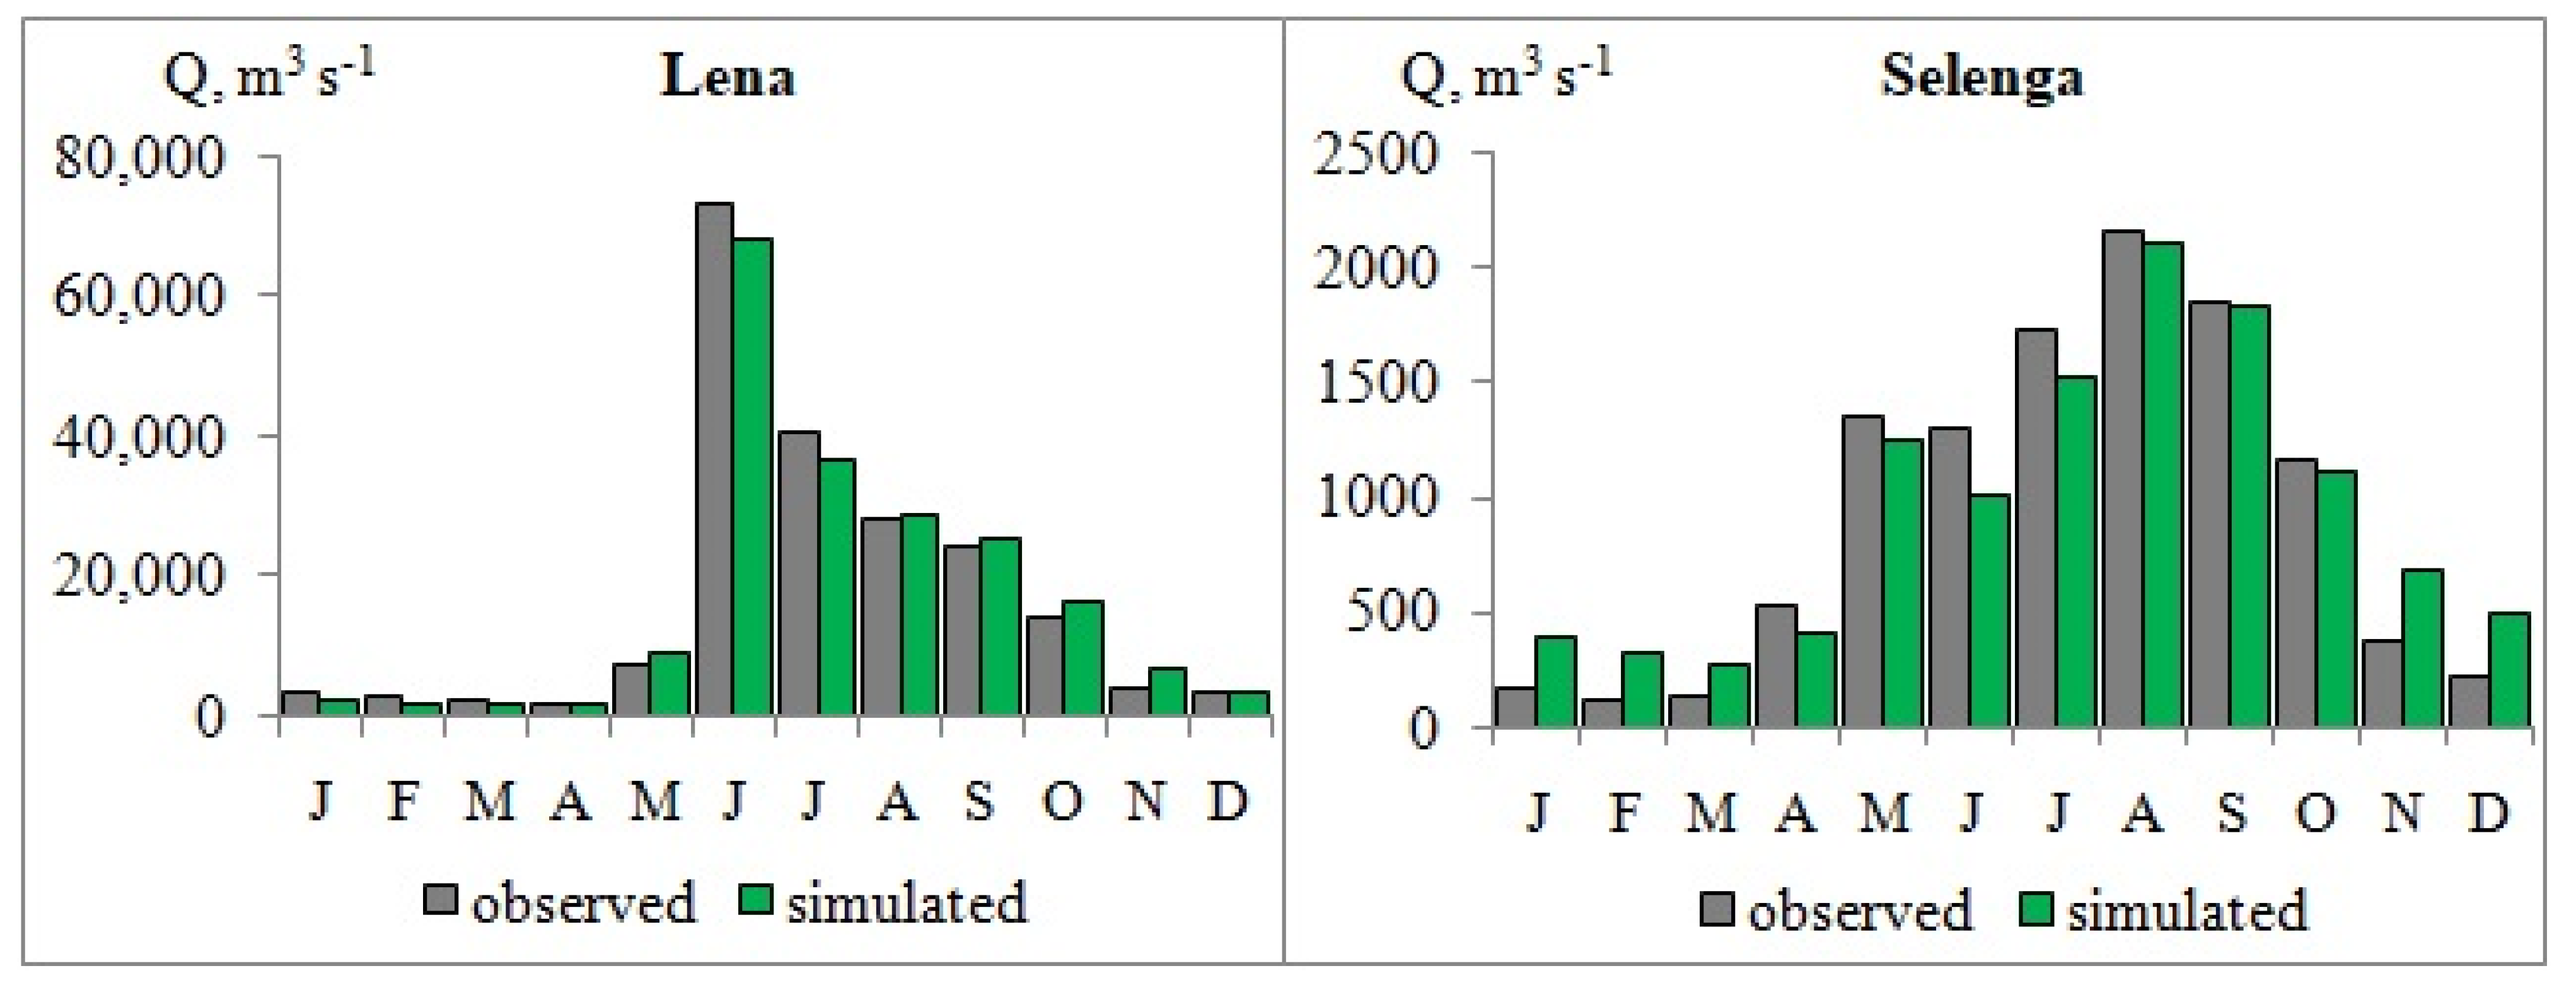
The error in calculating the normal annual runoff of the Lena River using data of weather stations for the period 1970–1999 was −2%, the normal annual runoff of the Selenga River using reanalysis data for the period 1981–2005 was 3% compared with the observed runoff (Figure 4). The Lena was characterized by an underestimation of the normal runoff in June. There was an overestimation of the normal winter runoff and an underestimation of the normal spring runoff for the Selenga River.
3.2. Testing Results of Hydrological Models Using the ESMs Data
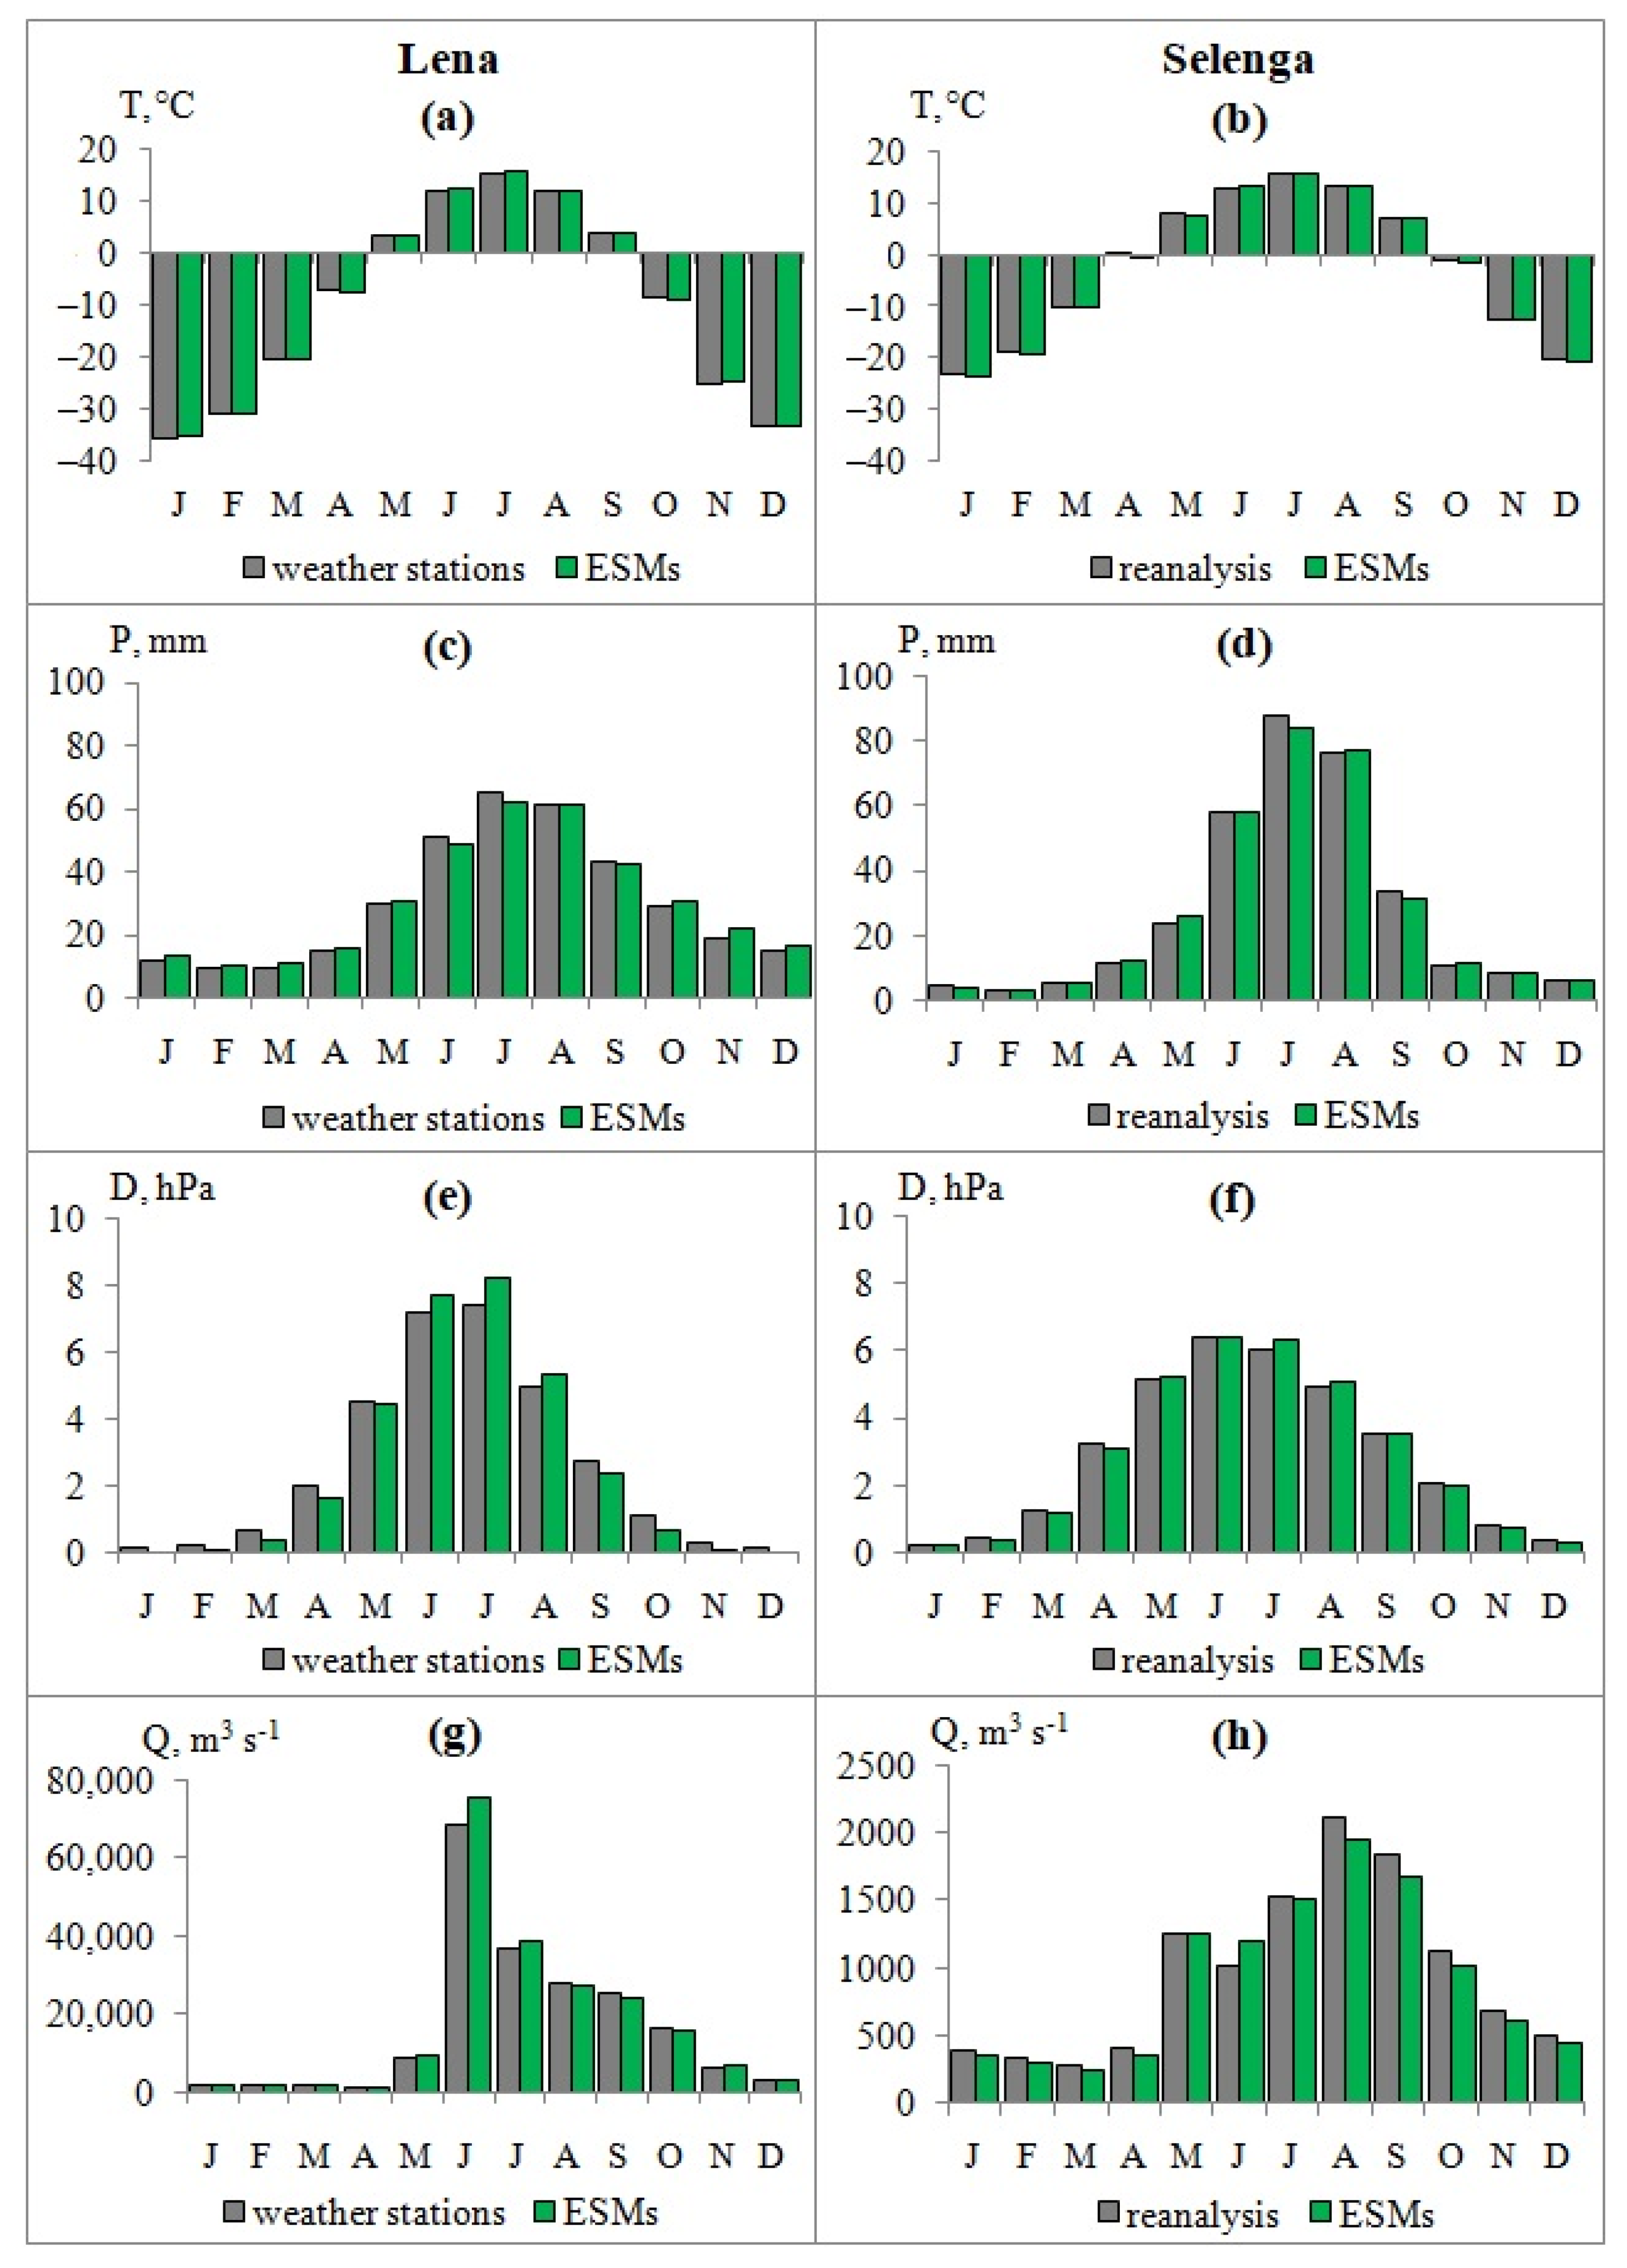
The error in calculating the mean annual air temperature for the Lena and Selenga basins using the ESM data compared to weather stations or reanalysis data was 0.1–0.2 °C, precipitation up to 3%, and vapor pressure deficit up to 5%. For two river basins, seasonal air temperature variations are reproduced most accurately by ESMs (Figure 5). According to ESMs, precipitation in the Lena basin is overestimated in winter by 14% and underestimated from June to September by 3%, compared to weather stations. Precipitation in the Selenga basin is overestimated by 9% in May and underestimated by 5% in July and September. Vapor pressure deficit is overestimated in the warmest months (July, August) for the Lena by 9% and the Selenga by 4%.
According to ESMs, the Lena River is characterized by an overestimation of runoff in June by 10%, relative to observational data (Figure 5). For the Selenga River, there was an overestimation of runoff in June by 16% and an underestimation from August to October by 10%. The calculations of the normal annual runoff using the ESMs data were more accurate. The PBIAS was 4% for the Lena and 5% for the Selenga.
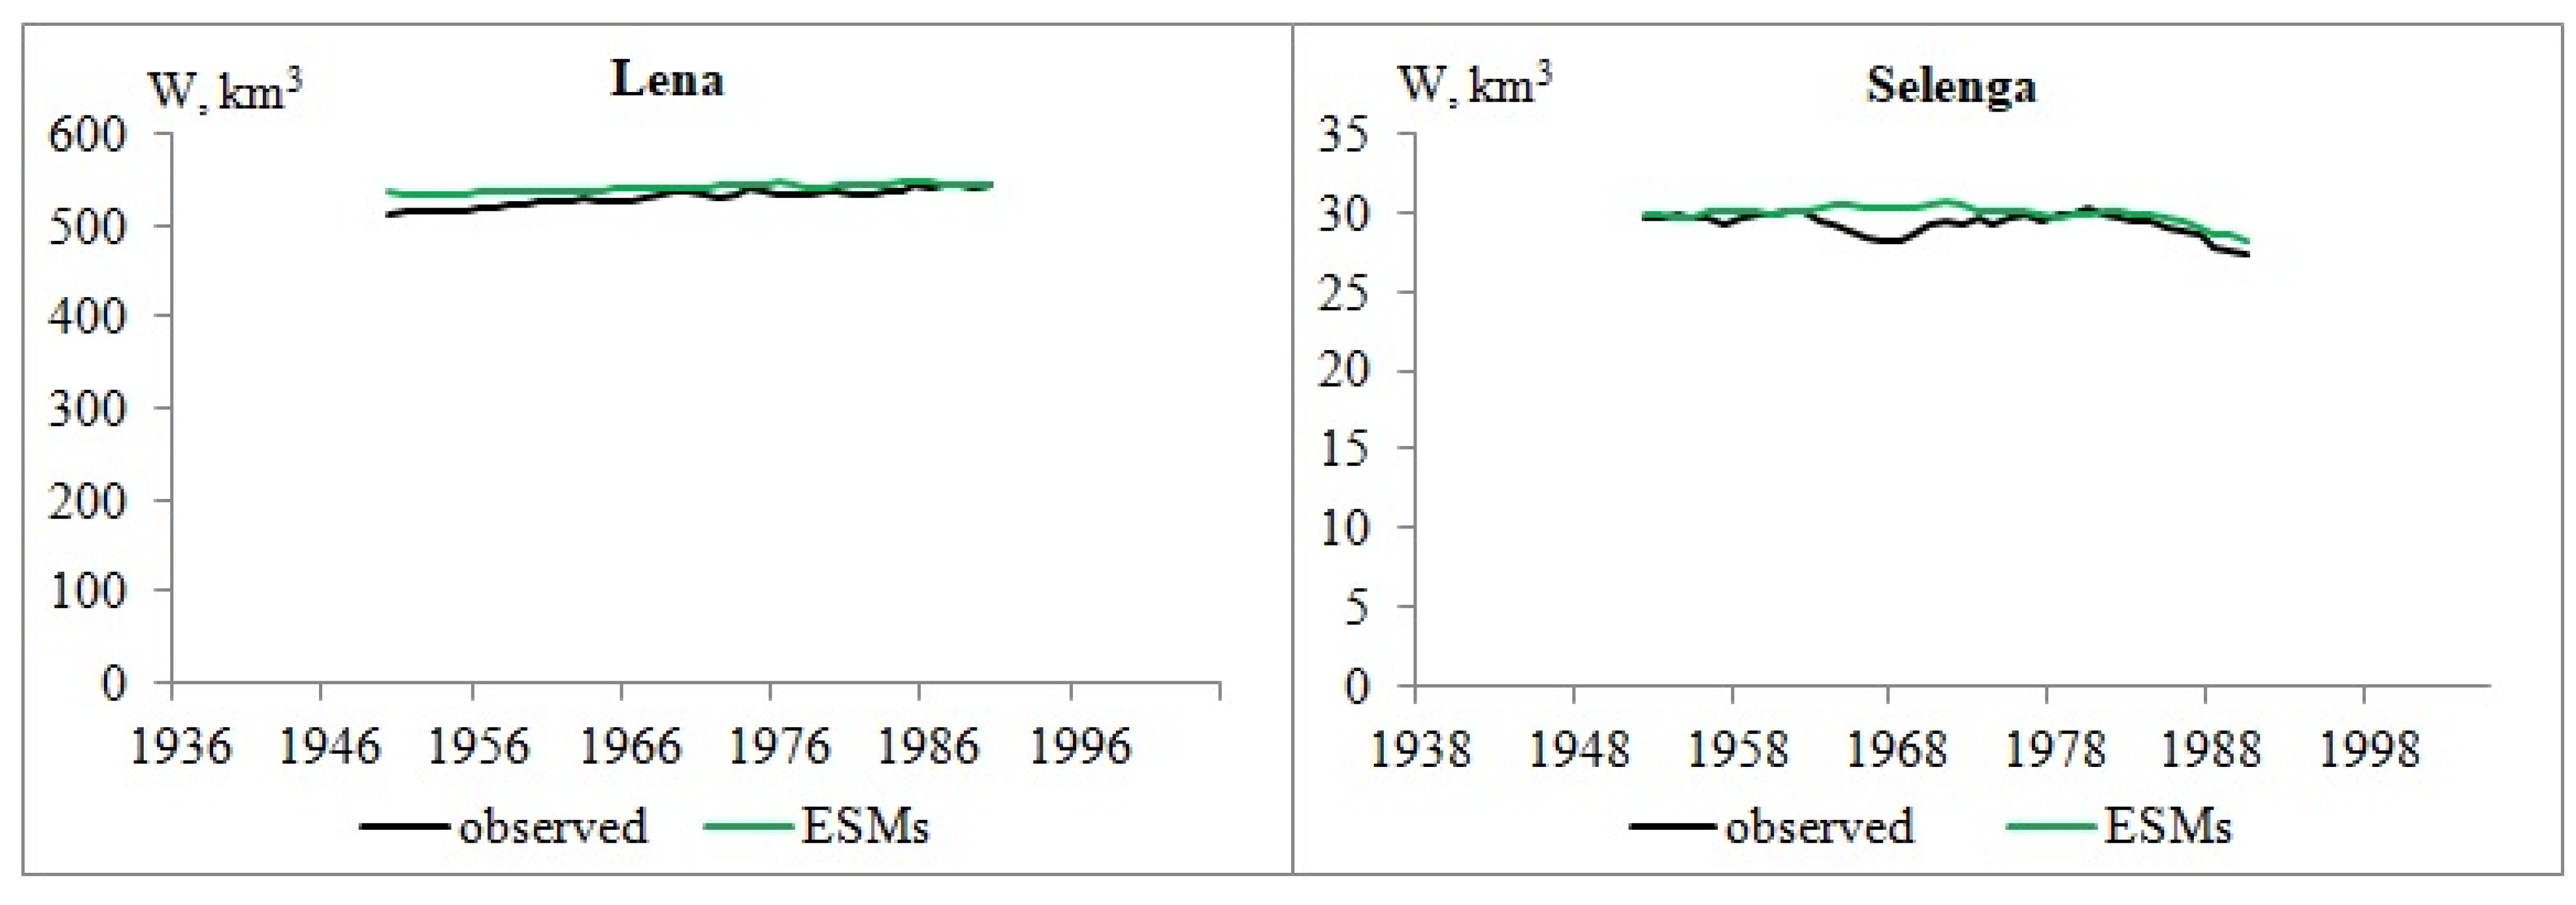
As a long-term verification of the Lena and Selenga annual runoff calculations for the observation period at the Kusur gauge (since 1936) and Mostovoi gauge (since 1938), the runoff was calculated by hydrological models using the Historical ESMs dataset, and smoothing the series by a 30-year moving average (Figure 6). For the Lena runoff, the error did not exceed 5%, consistently decreasing from the beginning of the observation period, and for the Selenga runoff, up to 7%, because ESMs did not reproduce the low-water period of 1976–1982, but successfully reproduced the runoff decrease during the long low-water period since 1996. At the next stage, the attribution of impact of the natural and anthropogenic components of climate change on river runoff was carried out.
3.3. Impact of Natural and Anthropogenic Components of Climate Change on Air Temperature and Precipitation
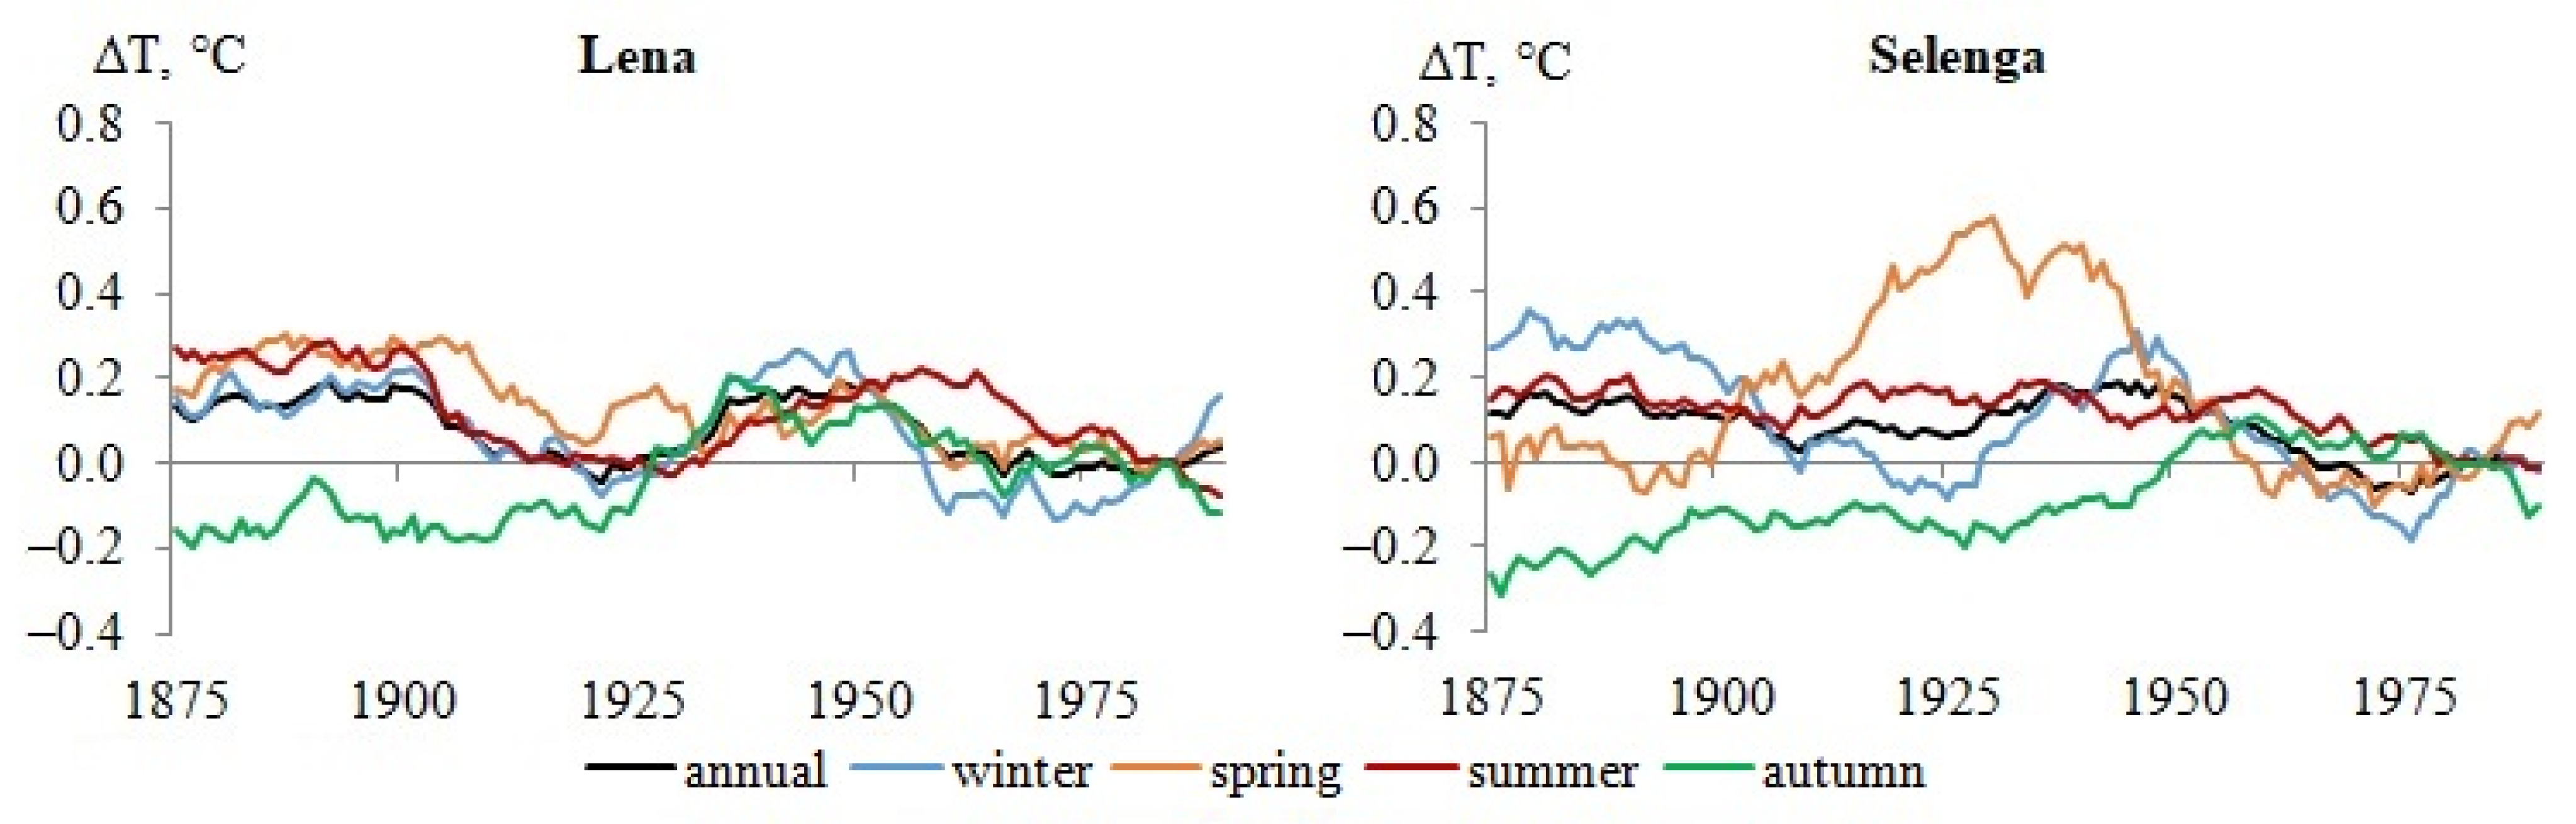
During the calculation period from 1861 to 2005, analyses of air temperature anomalies using the 30-year moving average for the Lena and Selenga basins showed that the mean annual air temperature decreased by 0.1 °C, and by 0.2 °C for some seasons under natural climate variability (Figure 7). The anthropogenic component of climate change was very pronounced in the increase in the mean annual air temperature in the Lena basin, by 1 °C during the 20th century, especially in winter and spring (Figure 8). Anthropogenic warming for the Selenga basin has been expressed in an increase in the mean annual temperature since the mid-1980s, by 0.3 °C, especially in the summer and autumn.
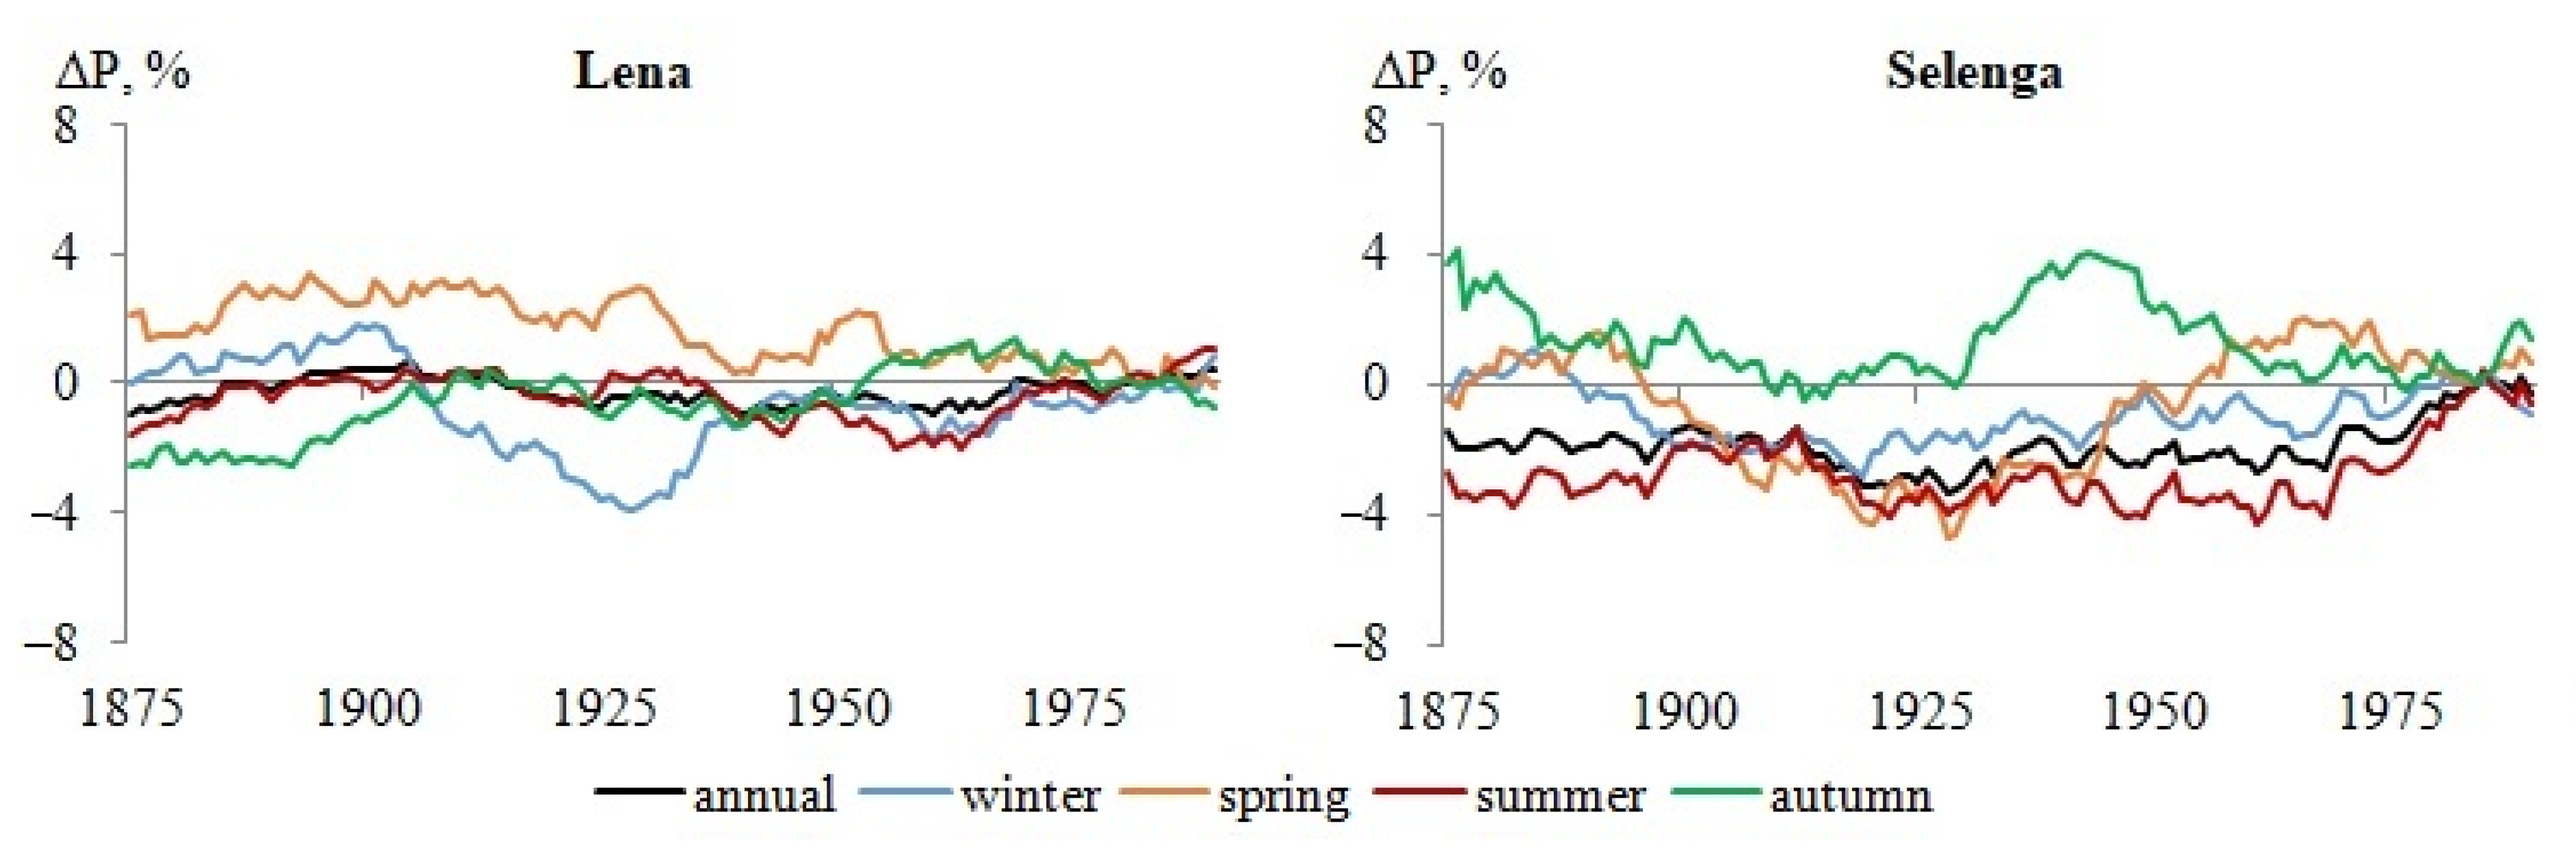
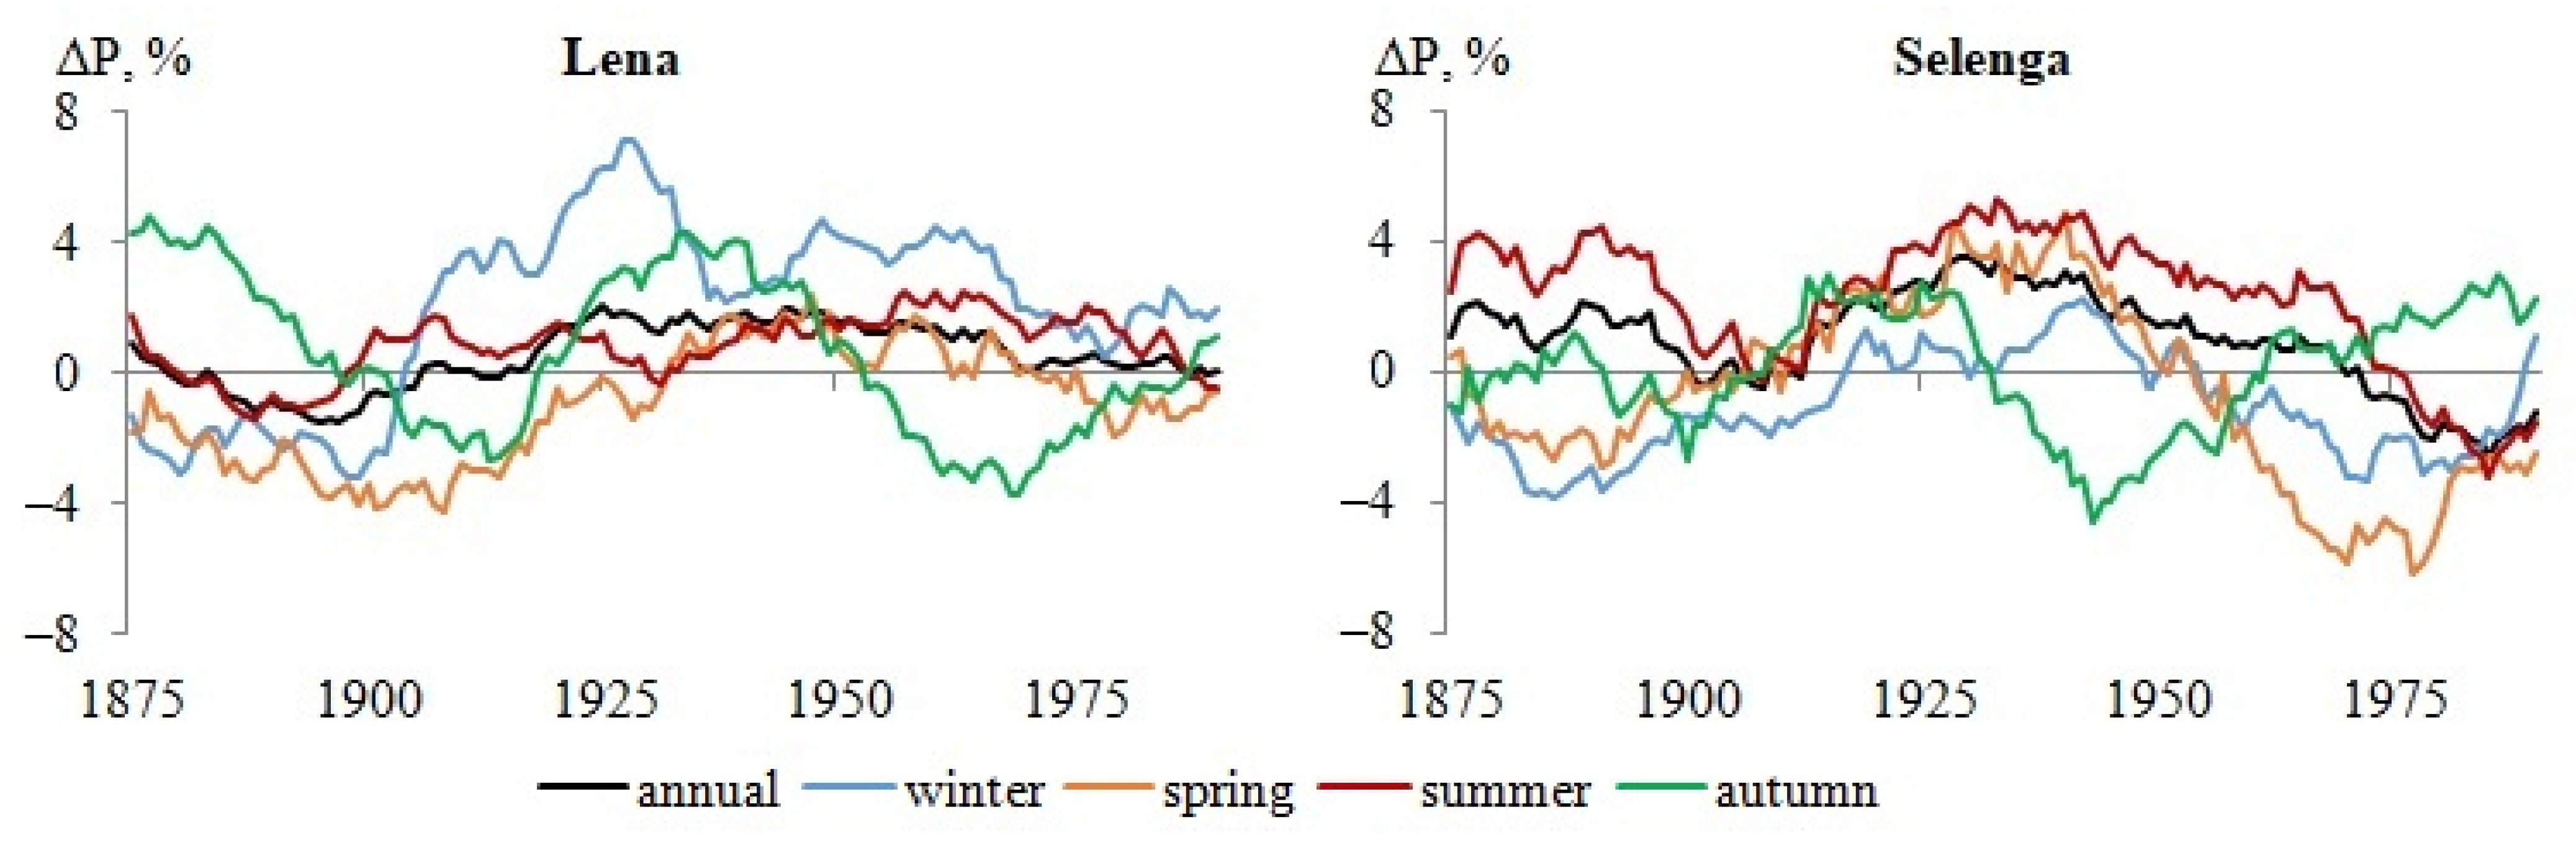
An analysis of precipitation anomalies for the Lena basin showed that annual precipitation almost did not change under natural variability. The trend of winter precipitation decreasing by 6% was noted in the first two decades of the 20th century as well as a monotonic increase in autumn precipitation by 5% during the calculation period (Figure 9). For the Selenga basin, there was a 3% increase in annual precipitation in the last two decades of the 20th century due to an increase in summer precipitation, which was about 70% of the annual total.
The anthropogenic component of climate change on the dynamics of annual precipitation in the Lena basin was almost unaffected; the variations were within 2%, as well as for summer precipitation, which was about half of the annual total. There was a tendency to increase for winter and spring precipitation in the 1910s and 1920s. The anthropogenic component of climate change is mainly expressed in the gradual decrease in the annual (especially summer) precipitation in the Selenga basin during the second half of the 20th century, and more pronounced in the 1980s and 1990s, up to 6% (Figure 10).
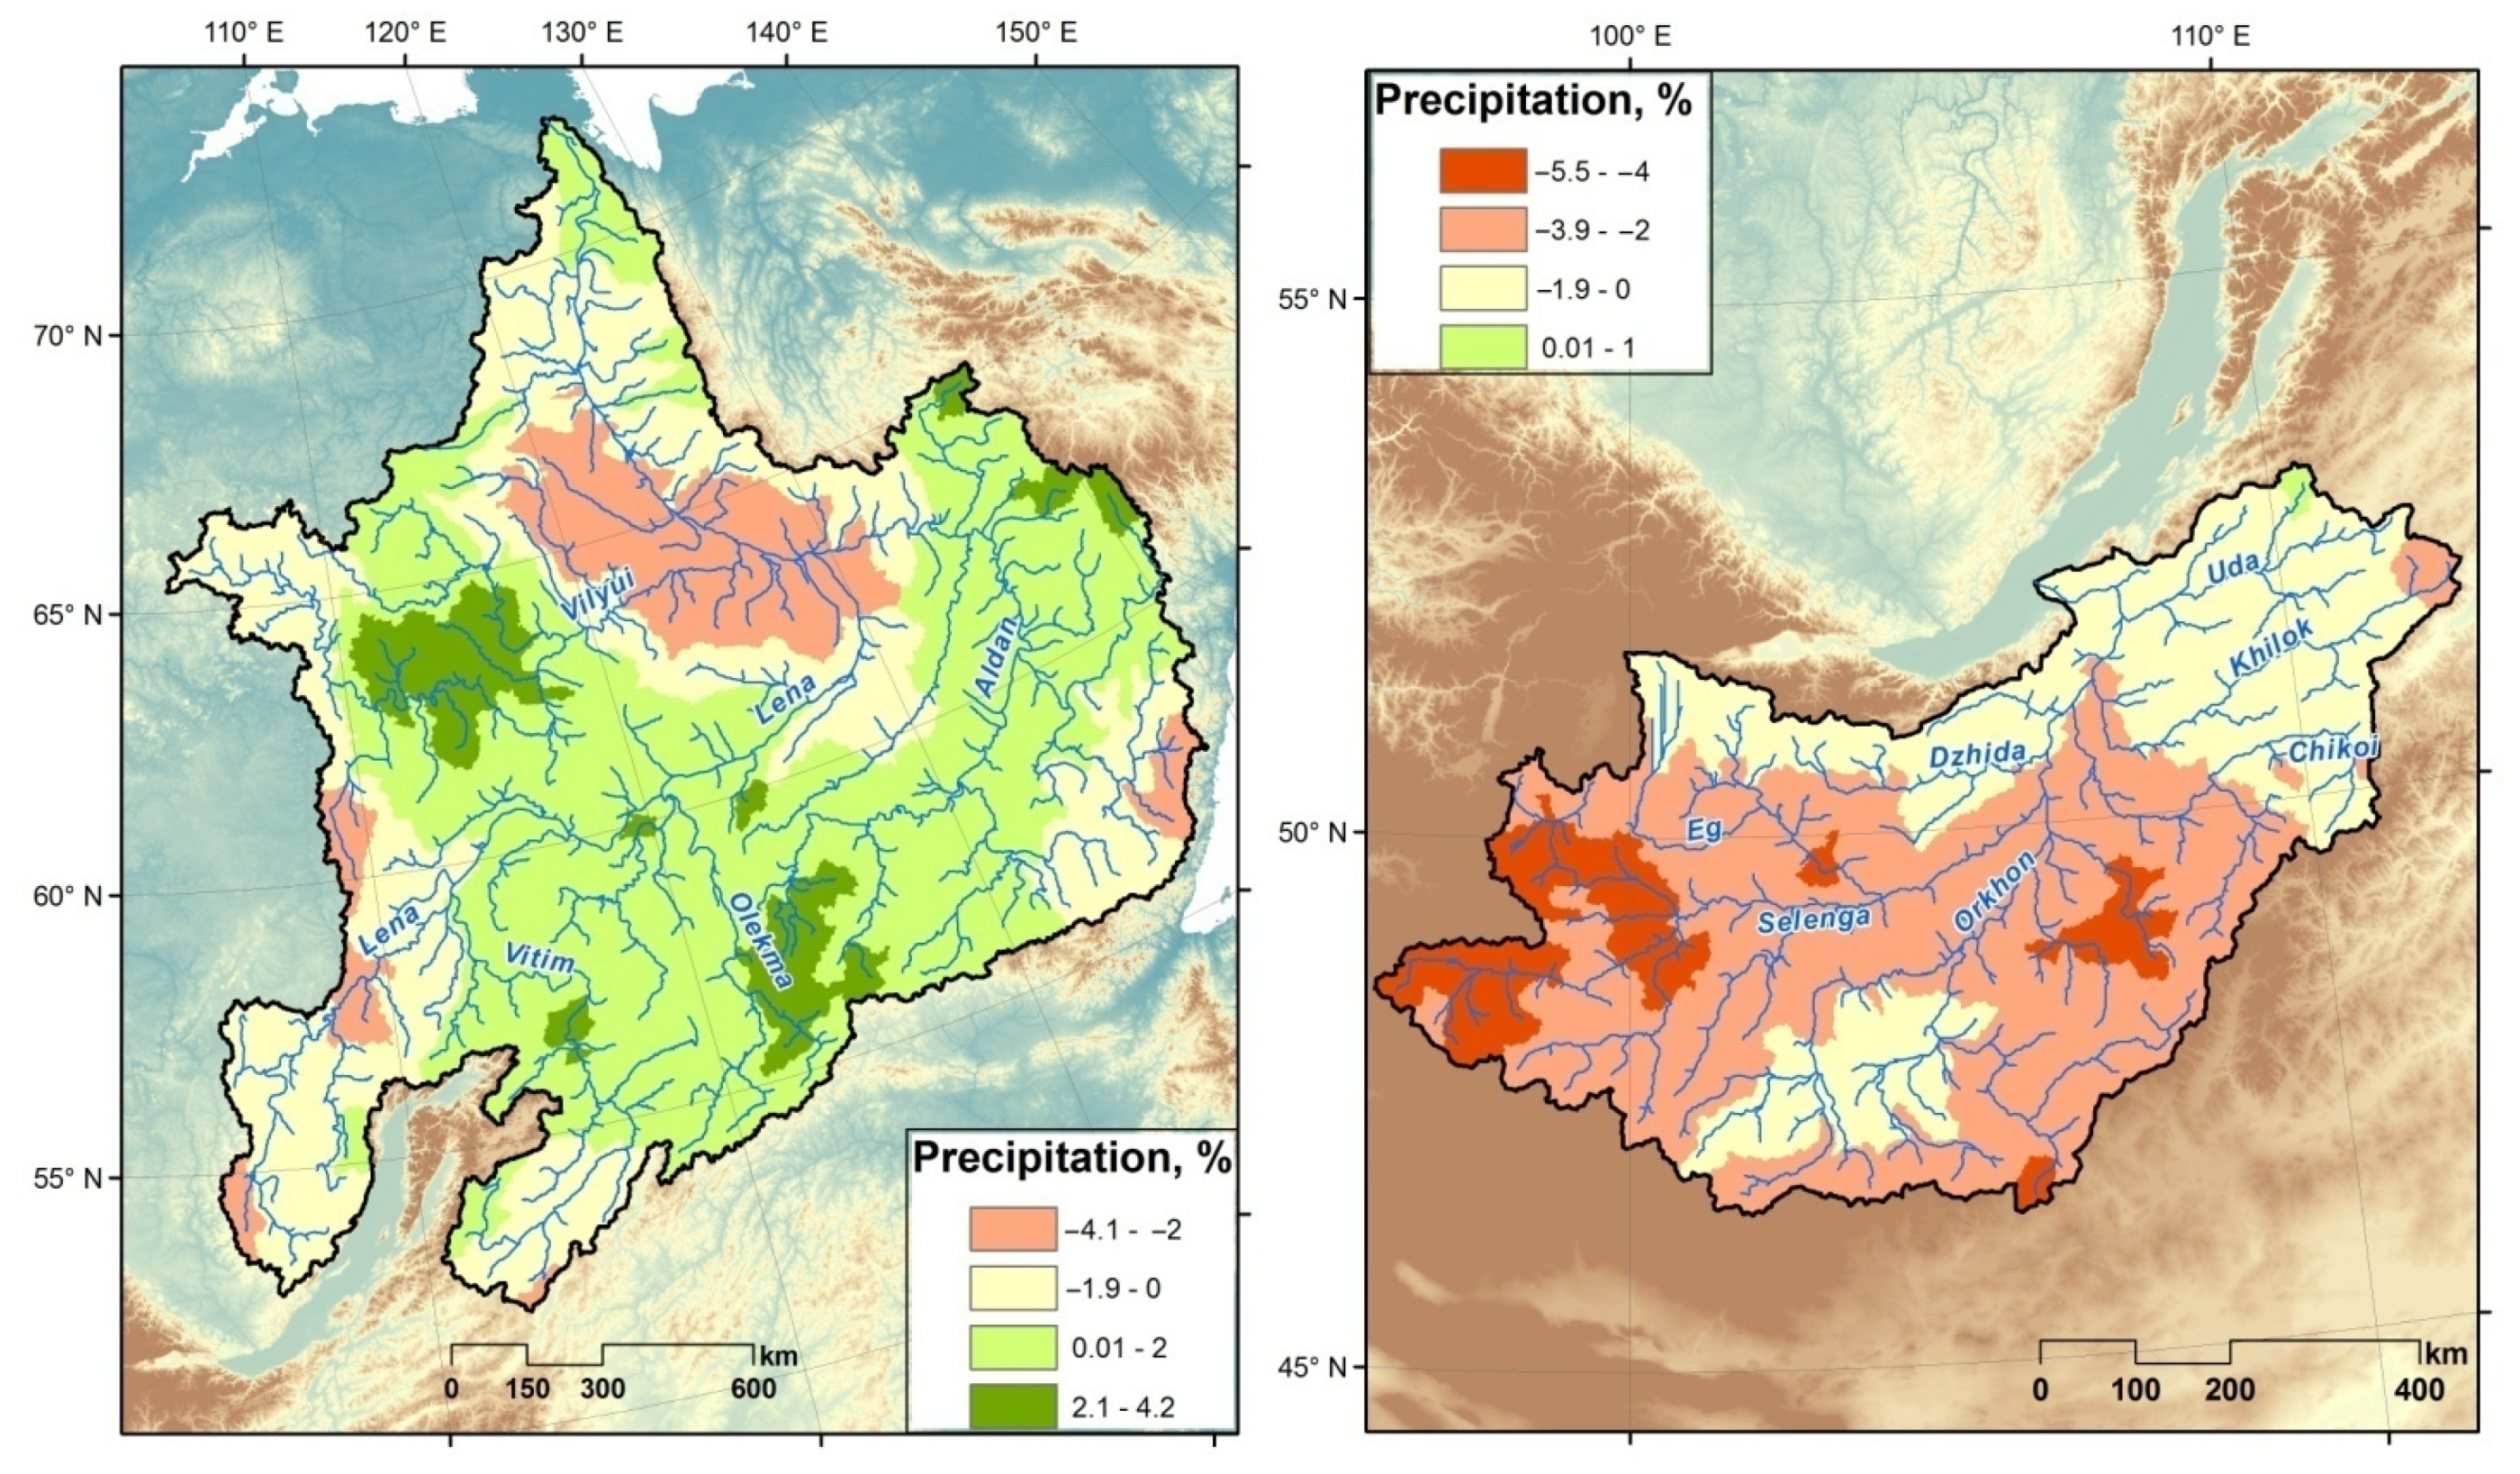
The spatial analysis results of the attribution of anthropogenic climate change to changes in the mean annual air temperature and precipitation showed that an increase in warming from south to north, due to an increase in greenhouse gas emissions, was noted for both river basins. During the late 20th century (1970–1999), the most intensive warming in the Lena basin was in the Vilyui, by 0.7–0.9 °C; in the Selenga basin, it was in its tributaries, Khilok and Uda by 0.2–0.3 °C (Figure 11). At the same time, for the most Mongolian part of the Selenga basin, it was characterized by cooling relative to conditions of natural climate variability. The impact of anthropogenic climate change on precipitation in the Lena basin was expressed as follows: there was a negative trend of up to 2–4% in the Upper Lena, Vilyui, Vitim, and especially in the Central Yakutian Lowland, for the remaining part of the basin, in general, an increase in precipitation of 2%. The Mongolian and Russian parts of the Selenga basin are characterized by a decrease in precipitation by 4–6% and 2%, respectively (Figure 12).
3.4. Impact of Natural and Anthropogenic Components of Climate Change on River Runoff
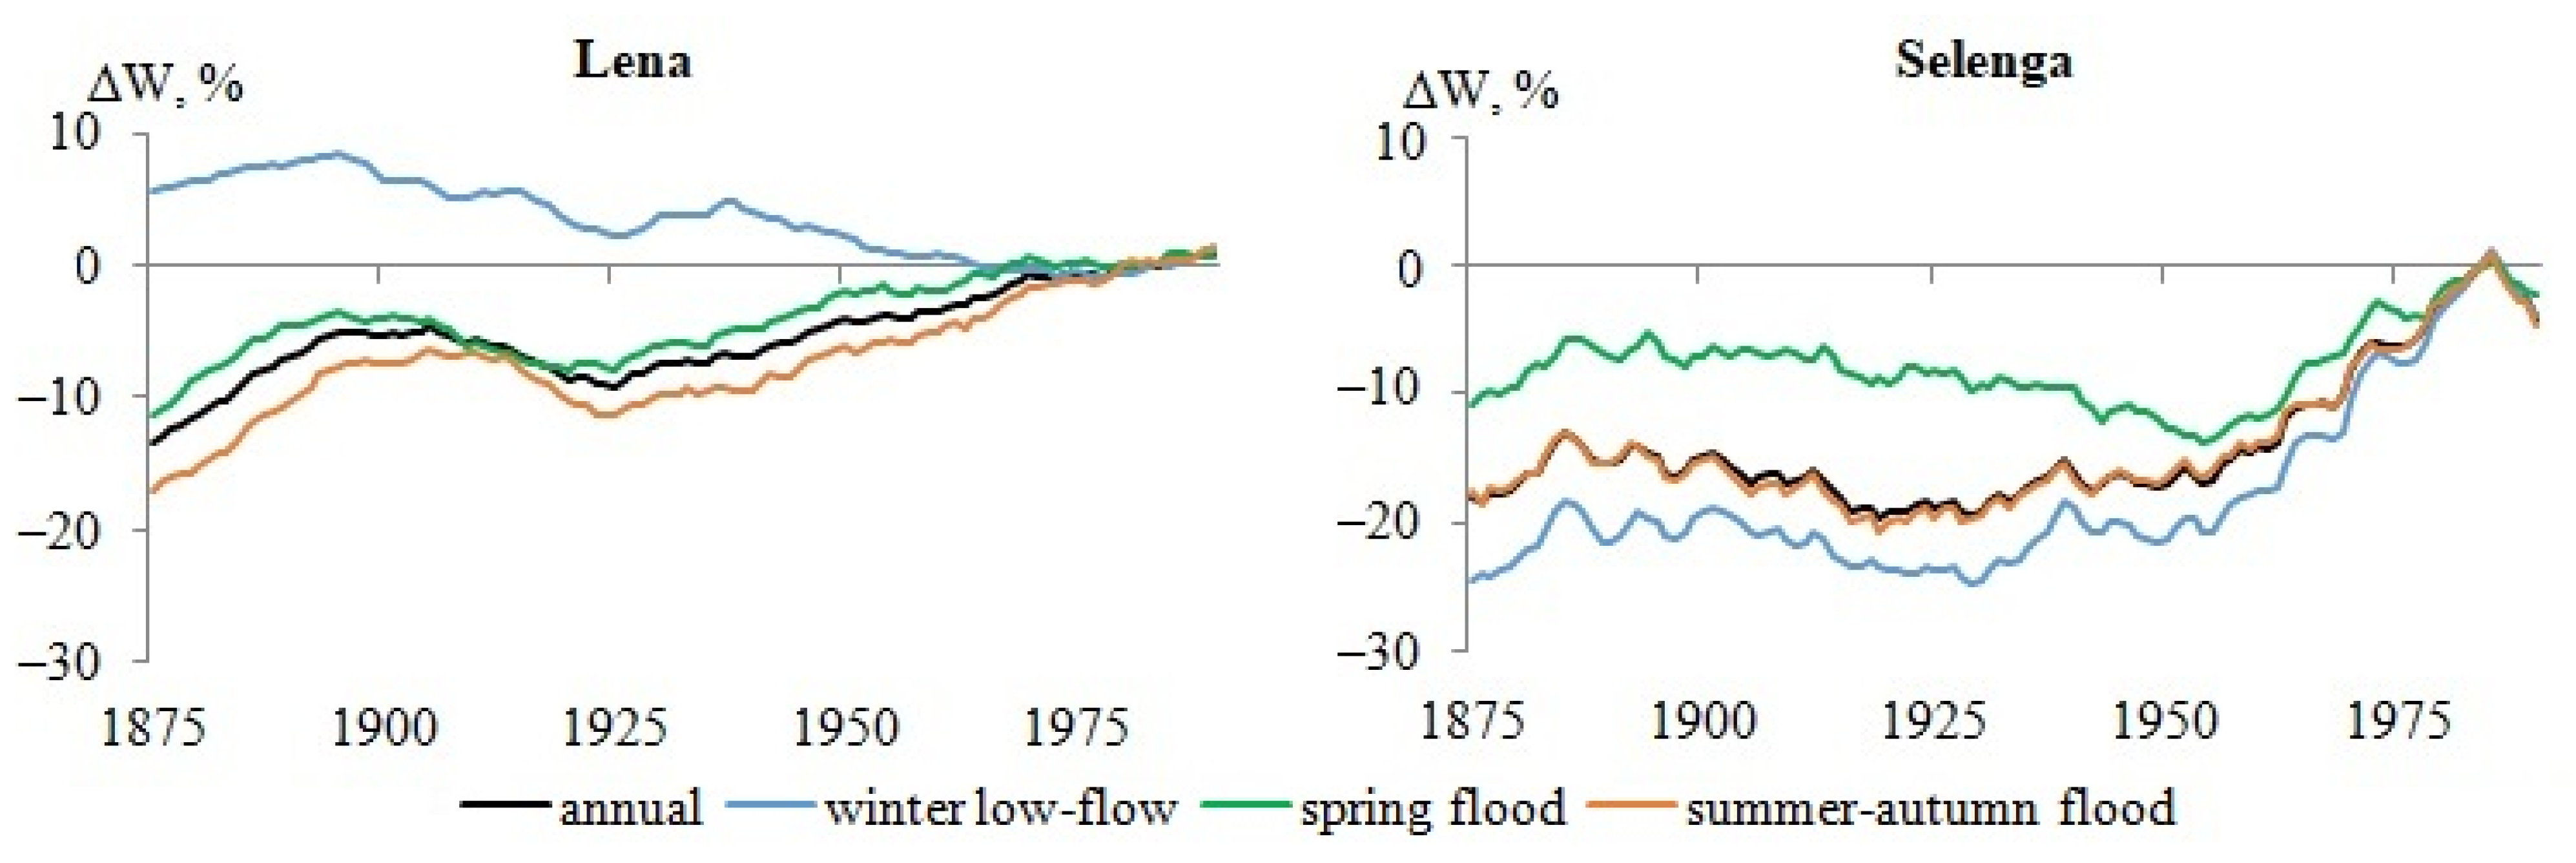
Annual runoff of the Lena River under natural climate variability, over the historical period, tended to increase, with some decrease in spring flood runoff and, respectively, annual runoff during the first two decades of the 20th century, due to a decrease in winter precipitation by 6%. In particular, a monotonic increase in runoff has been noted for the runoff observation period since the 1930s, by 10% (Figure 13). This was because of a gradual increase in snowmelt and summer–autumn runoff due to increased precipitation in autumn and winter. The Selenga runoff under natural climatic conditions was almost unchanged until the early 1970s; after that, there was an intense increase in flow due to increased precipitation.
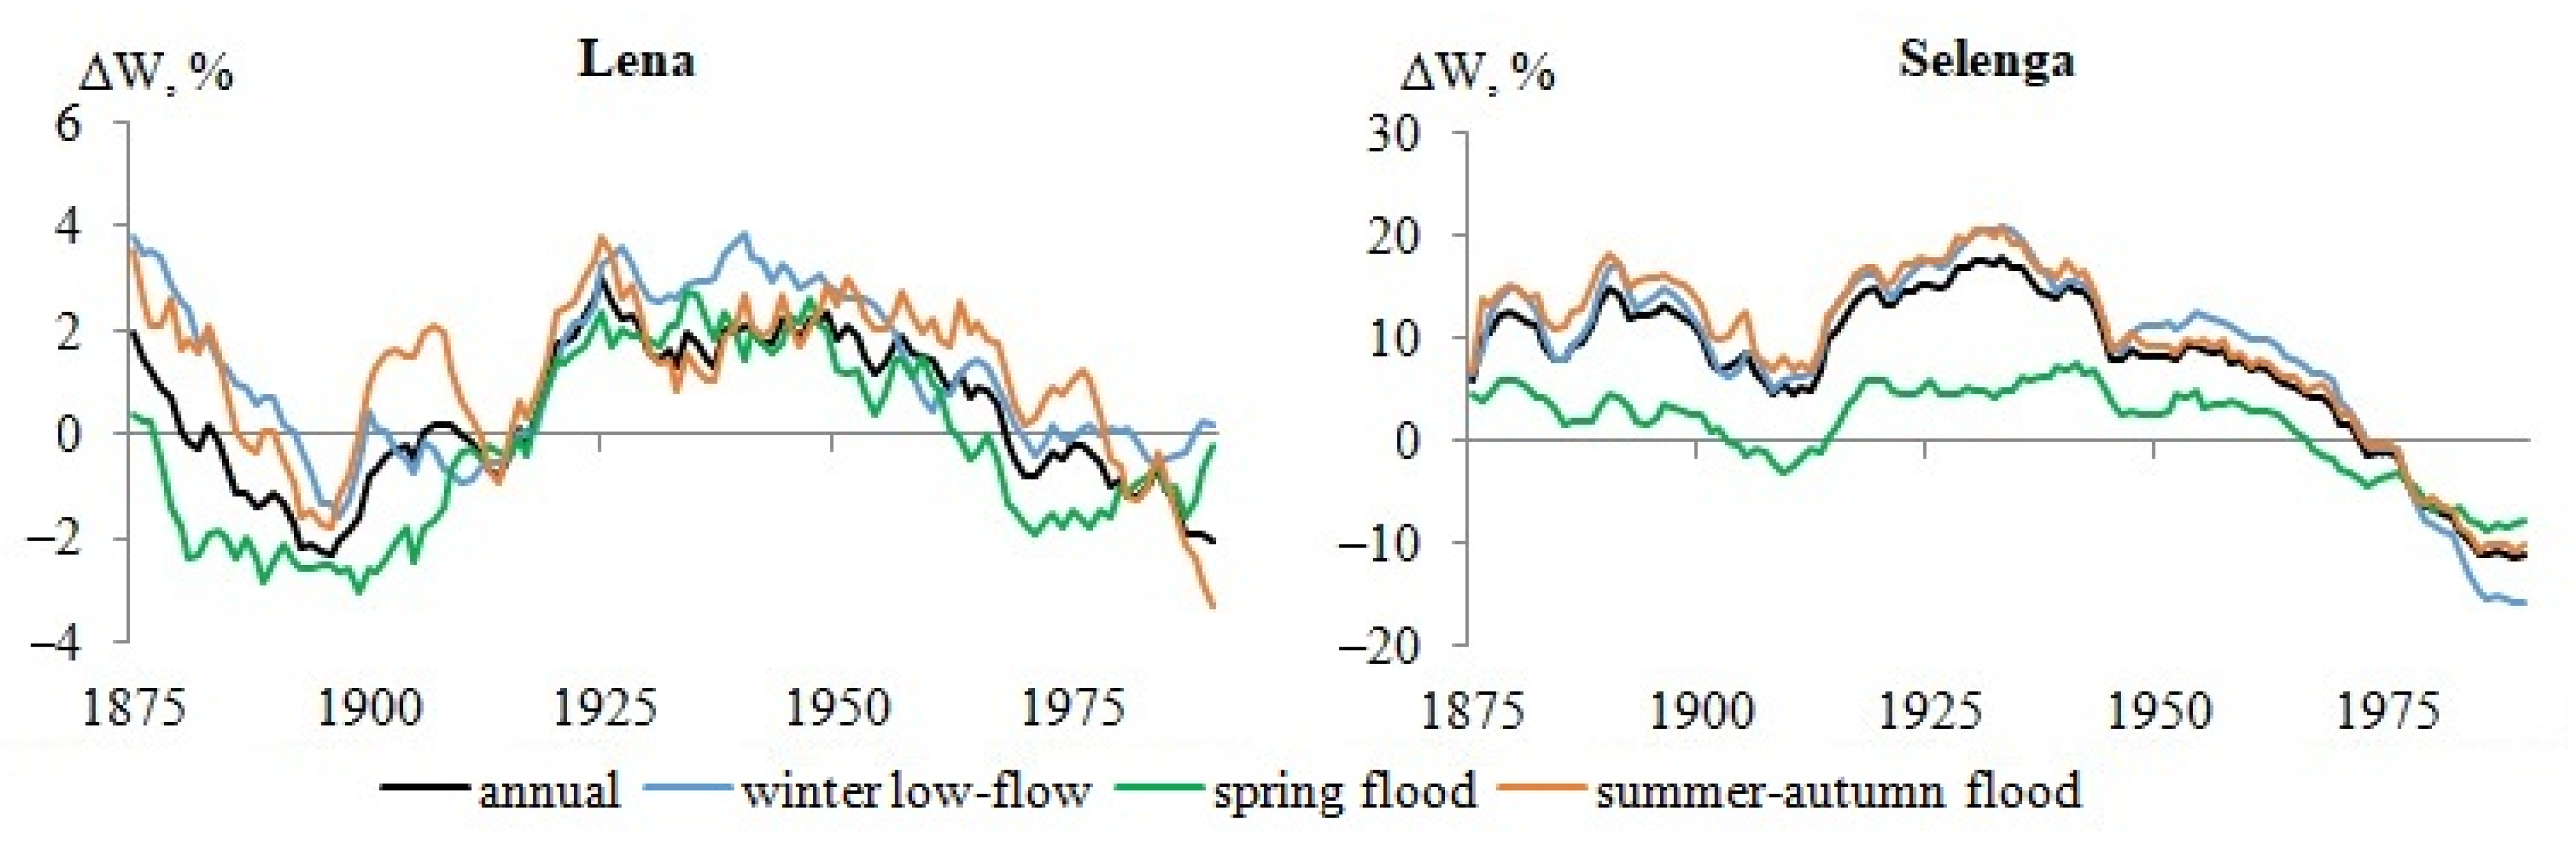
The anthropogenic component of climate change on the dynamics of the Lena River runoff was weak: the changes did not exceed 2–3% (Figure 14). The anthropogenic component of climate change was clearly pronounced in the Selenga runoff: the runoff calculated using the Historical dataset, taking into account anthropogenic greenhouse gas emissions, was, before the early 1970s, on average 10% higher than that calculated under natural climatic conditions. Then the natural Selenga runoff increased, while the runoff, taking into account the anthropogenic impact on climate, on the contrary, decreased on average by 11%, and has been more pronounced since the mid-1980s, due to a decrease in the annual (especially summer) precipitation in the river basin.
It should be noted that, variability since the 1970s, the runoff calculated under natural climates of both the Lena and Selenga prevailed over the runoff calculated using the Historical dataset. However, while both scenarios were positive for the Lena River, the natural Selenga runoff increased, and the runoff under the anthropogenic impact decreased. The reasons for the excess of the natural runoff of the Lena and Selenga over the runoff under anthropogenic greenhouse gas emissions were different. The slowdown in the Lena runoff increase calculated using the Historical dataset was explained by an increase in evaporation due to intense warming compared to the piControl dataset, while the decrease in the Selenga runoff relative to that calculated under natural climate variability was due to a decrease in precipitation.
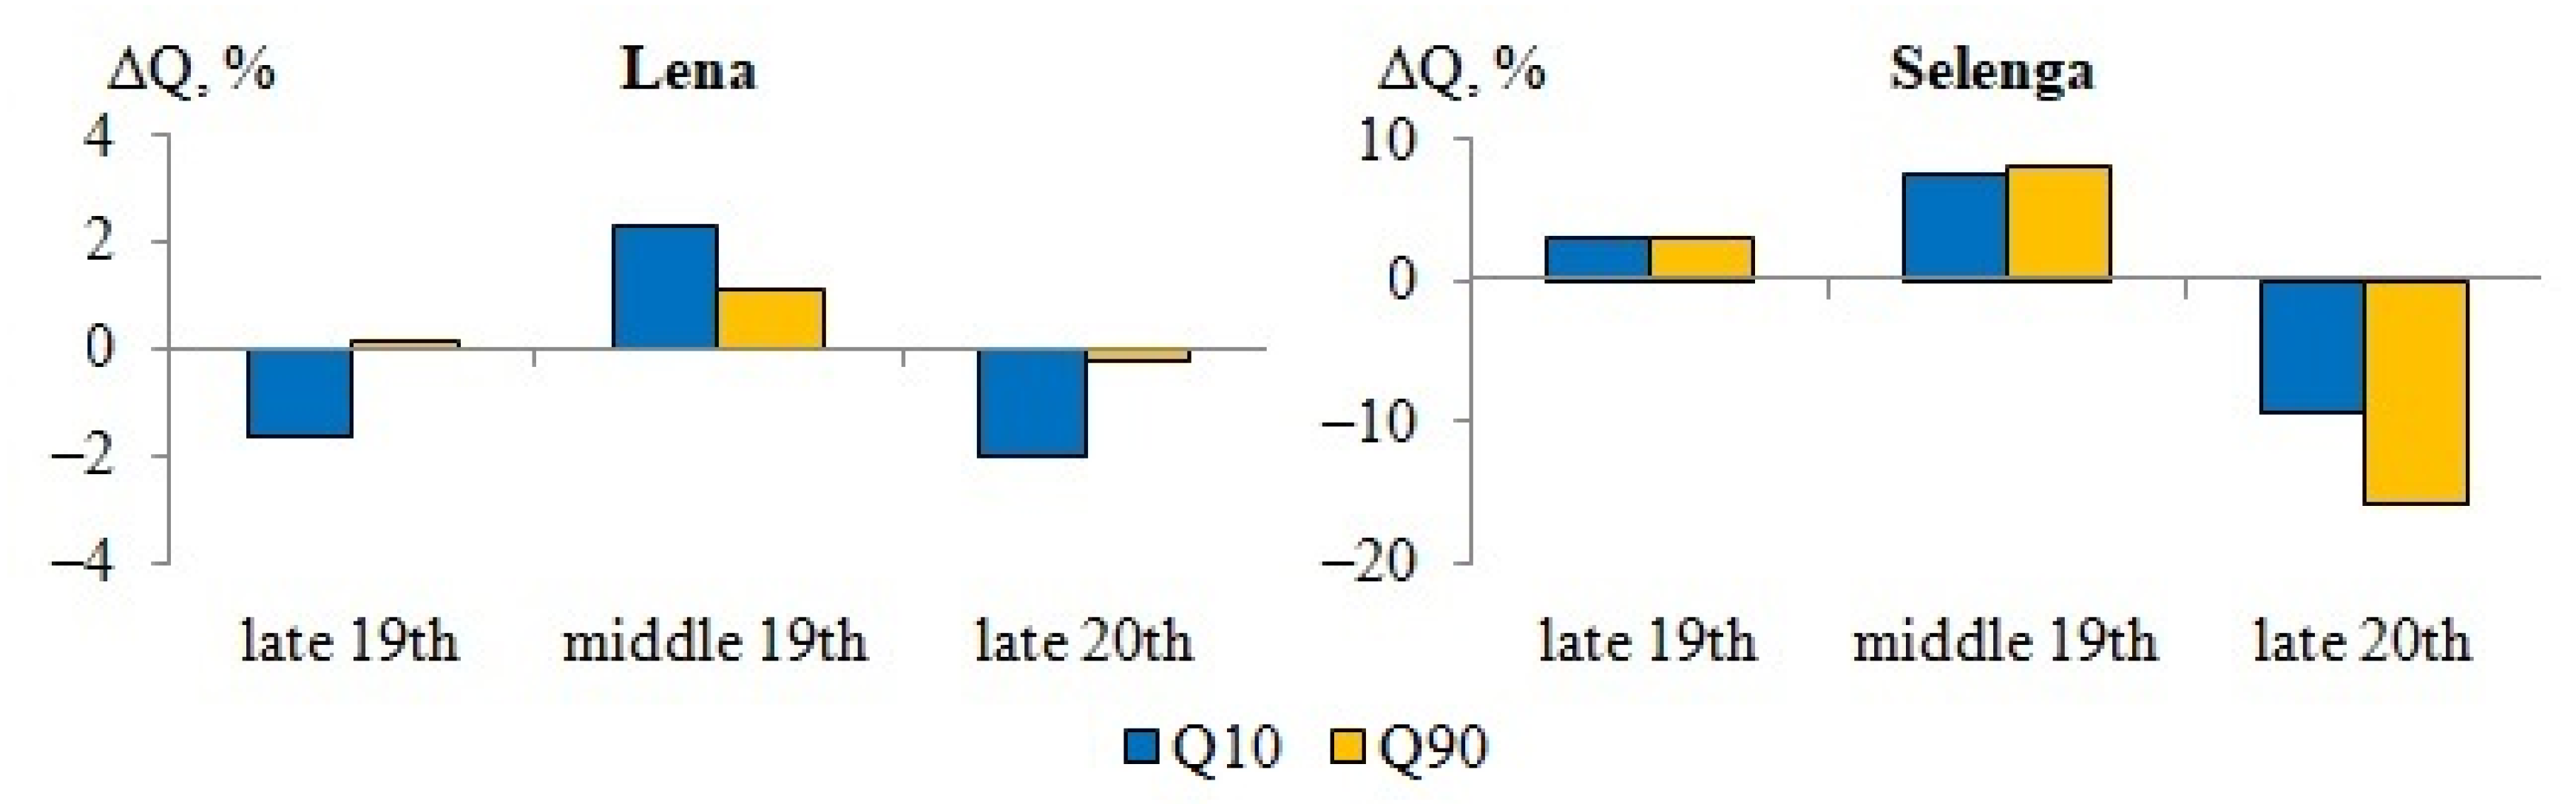
The anthropogenic component of climate change did not affect the changes in high (Q10) and low (Q90) flow of the Lena River; the variation did not exceed ±2%. The high and low flow of the Selenga River under the anthropogenic climate change impact tended to increase in the late 19th and middle 20th centuries, while in the late 20th century, the Q10 and Q90 decreased by 10% and 15%, respectively (Figure 15).
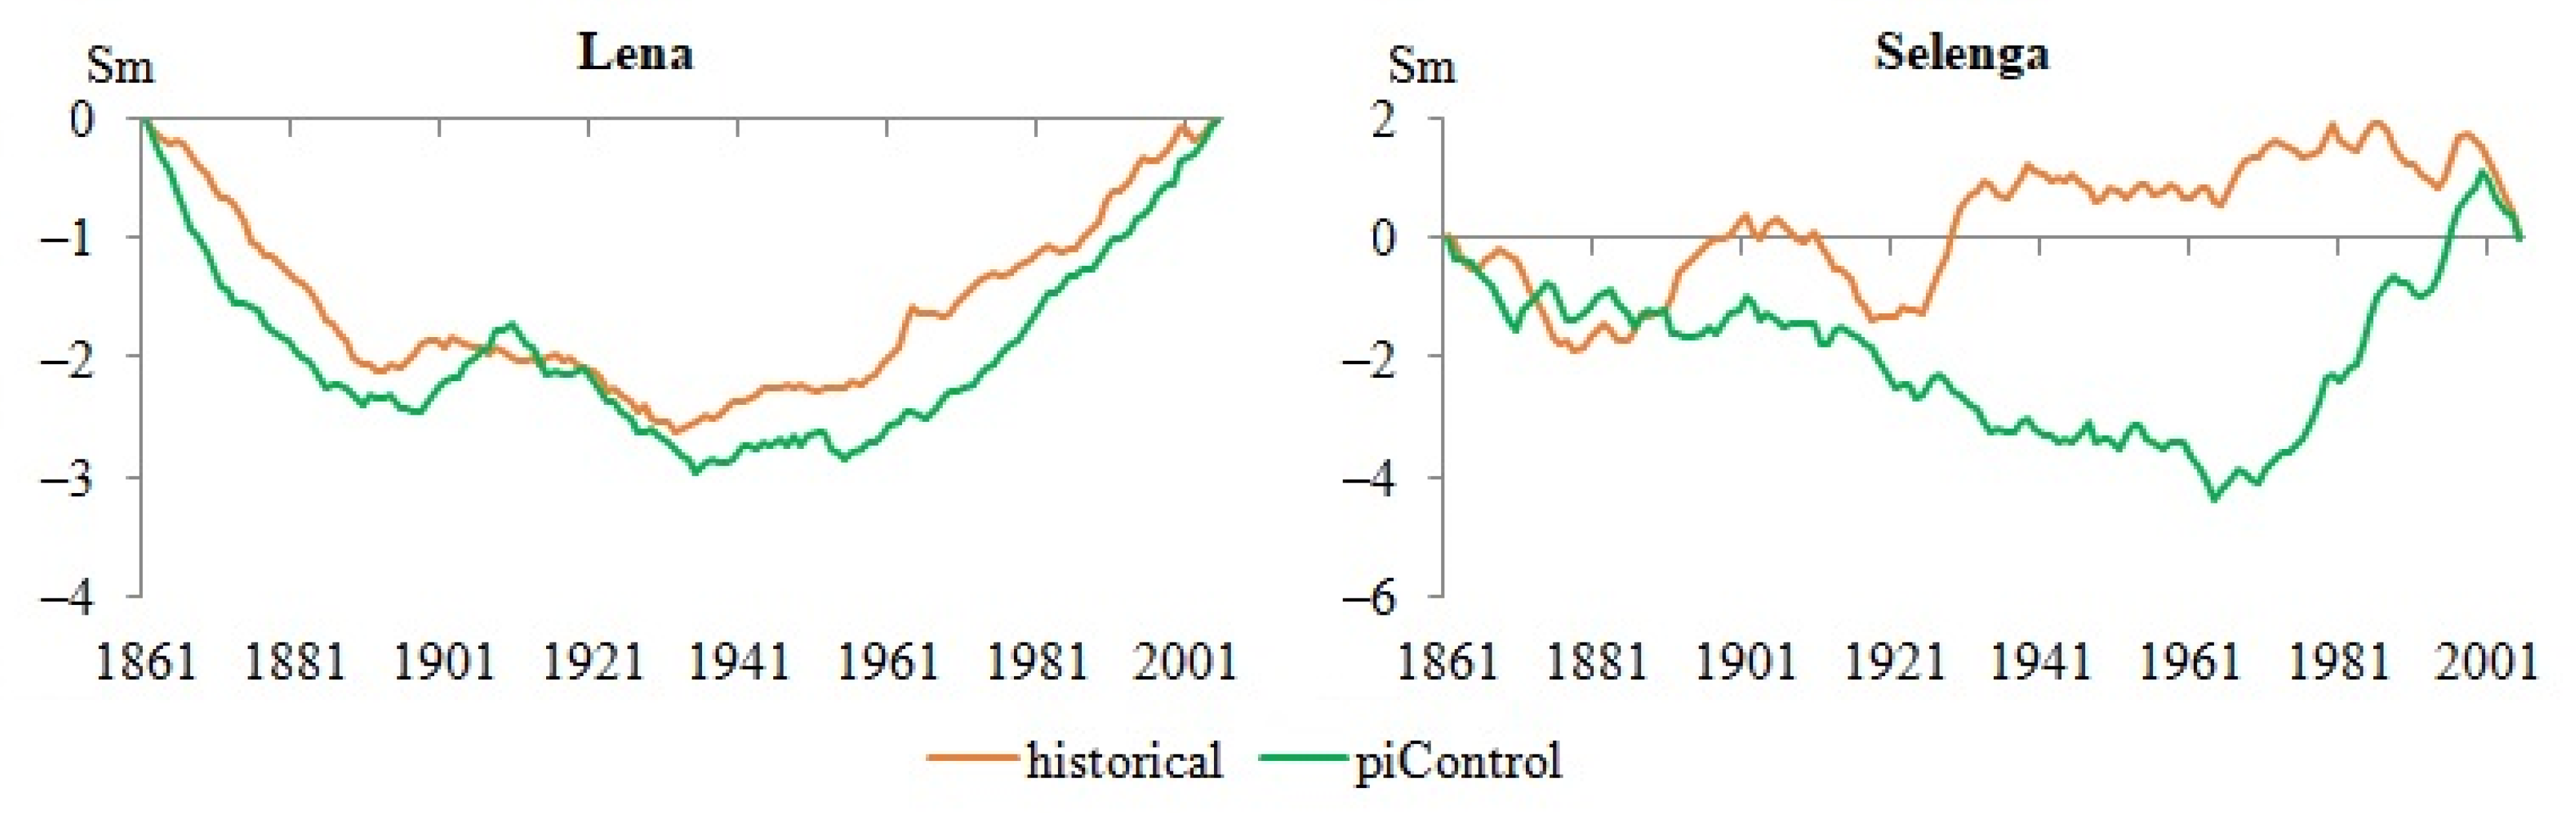
Differential integral curves of the Lena and Selenga annual runoff for the period 1861–2005 showed that the Lena runoff tended to increase under natural climate variability (the piControl dataset) and taking into account anthropogenic greenhouse gas emissions (the Historical dataset) over the observation period (Figure 16). Since the 1970s, the Selenga runoff has clearly increased under natural climate variability. This conclusion is confirmed by the values of annual runoff coefficients calculated for the 30-year periods of the late 19th, and the middle and late 20th centuries (Table 2).
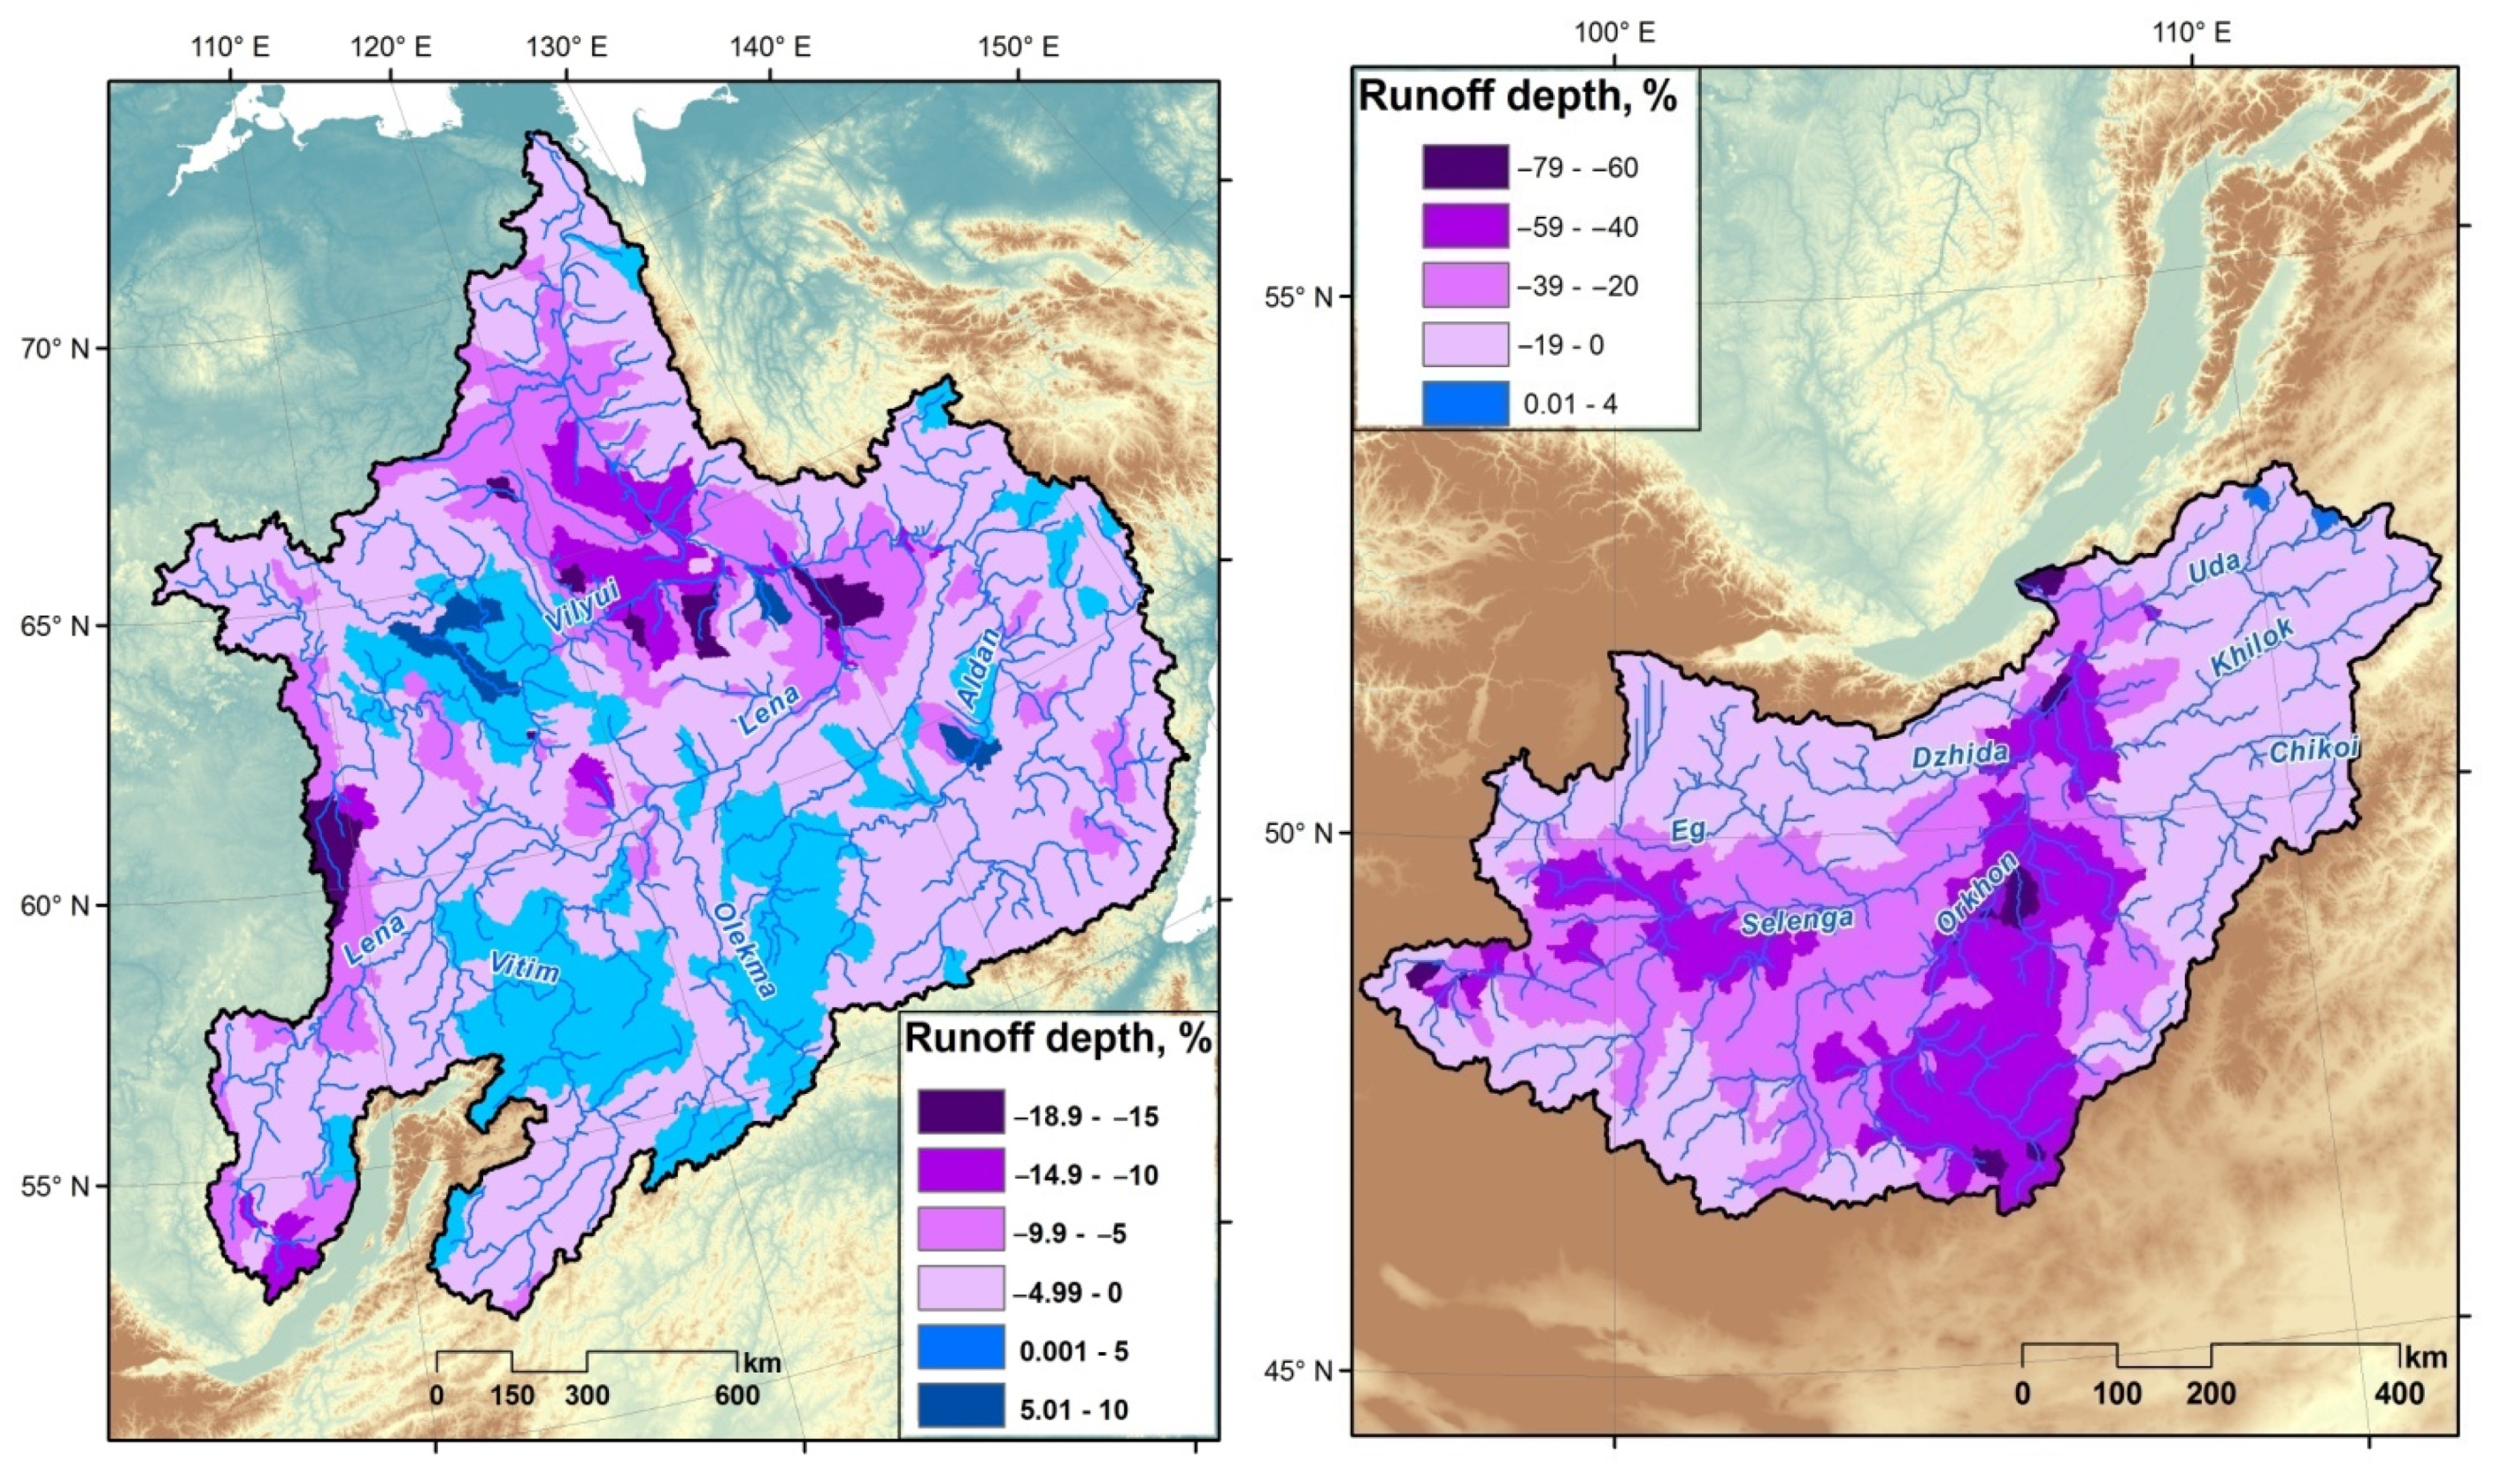
The spatial analysis results of the attribution of anthropogenic climate change to changes in the annual runoff depth in the Lena and Selenga basins showed that the anthropogenic component of climate change in the late 20th century generally affected the reduction of runoff depth for both river basins (Figure 17). The intense decrease in the Selenga runoff from the Mongolian part of the catchment was mainly due to contrasting changes in precipitation. Changes in the spatial distribution of runoff were more heterogeneous for the Lena basin. A slight increase in the runoff depth was noted in some, mostly mountainous areas, but a negative runoff trend was characteristic for most of the basin, with higher values for the area of reduced precipitation in the Upper Lena, Vilyui, Vitim, and Central Yakutian Lowland, for which this effect was more clearly expressed due to increased evaporation caused by more intense air temperature increases.
4. Conclusions
The ensemble of four ESMs (GFDL-ESM2M, HadGEM2-ES, IPSL-CM5A-LR, and MIROC5) satisfactorily reproduces annual and seasonal values of both air temperature and precipitation and river runoff, calculated using hydrological models. The PBIAS in the calculation of annual runoff was 4% and 5% for the Lena and Selenga rivers, respectively. Annual runoff of the Lena River under natural climate variability, over the historical period, tended to increase. In particular, a monotonic increase in runoff has been noted for the runoff observation period since the 1930s, by 10%. This was because of a gradual increase in snowmelt and summer–autumn runoff. The Selenga runoff under natural climate variability has been almost unchanged until the early 1970s; after that, there was an intense increase in flow due to increased precipitation.
The anthropogenic component of climate change on the dynamics of the Lena River runoff was weak. The changes did not exceed 2–3%, i.e., the Lena River runoff increased statistically significantly over the observation period, but this was mainly due to natural climate variability. The anthropogenic component of climate change was clearly pronounced in the Selenga runoff. This has been particularly pronounced since the 1970s, when the runoff should have increased under natural climatic conditions, but under the anthropogenic impact, given the increase in greenhouse gas emissions, it decreased, especially since the mid-1980s, due to decreased summer precipitation, which was caused by the last low-water period of 1996–2017 in the Selenga River basin. In the late 20th century, the anthropogenic component of climate change influenced a more intense decrease in the Selenga runoff from the Mongolian part of the catchment compared to the Russian part, which was mainly due to contrasting changes in precipitation. Changes in the spatial distribution of runoff were more heterogeneous for the Lena basin. A slight increase in the runoff depth was noted in some mostly mountainous areas, but a negative runoff trend was characteristic for most of the basin, with higher values for the areas of reduced precipitation in the Upper Lena, Vilyui, Vitim, and Central Yakutian Lowland.
Thus, this study focused on the attributions of observed changes in the runoff of large rivers in Eastern Siberia by separating the influence of natural and anthropogenic components of climate change. However, one direction of further research, on the effects of natural and anthropogenic components of climate change, should be a detailed analysis of changes in atmospheric circulation processes, formation of atmospheric blocking, and the main climatic indices, which affect the processes of land hydrological cycle. Another direction of research development could be to consider, in addition to climate change, the dynamics of LULC, which is more relevant to the Selenga basin. However, this approach is complicated by the limited period of availability of initial satellite data of the land surface in the context of runoff modeling since the middle of the 19th century, as well as by the possibilities of dynamic (annual, and not only for individual periods) accounting of the LULC parameters in hydrological models. The study of the impact of climate change components is particularly relevant for Eastern Siberia, given the projected changes in the runoff of large rivers. For example, according to [30,31], the Lena River runoff is expected to increase by 15% and 21% by the middle and end of the 21st century, respectively, relative to the end of the 20th century. According to [19], the Selenga River runoff is expected to decrease by 25–30% by the middle and end of the 21st century under scenarios RCP 6.0 and RCP 8.5.
Funding
This research was funded by the Ministry of Science and Higher Education of the Russian Federation (project MK-1753.2020.5—calculations of runoff changes using the ESMs output data) and the Governmental Order to Water Problems Institute, Russian Academy of Sciences (subject no. FMWZ-2022-0001—calculations of runoff changes using the data of weather stations).
Institutional Review Board Statement
Not applicable.
Informed Consent Statement
Not applicable.
Data Availability Statement
The ESM output data are available on the ISIMIP ESGF server (data link https://esg.pik-potsdam.de/projects/isimip/, accessed on 30 November 2021).
Acknowledgments
The author is grateful to the ISIMIP for the ESM output data and the RIHMI-WDC for the data of weather station used for hydrological modeling.
Conflicts of Interest
The author declares no conflict of interest.
References
- Bates, B.; Kundzewicz, Z.; Wu, S.; Palutikof, J. Climate Change and Water; IPCC Secretariat: Geneva, Switzerland, 2008; p. 210. [Google Scholar]
- Lins, H.; Slack, J. Streamflow trends in the United States. Geophys. Res. Lett. 1999, 26, 227–230. [Google Scholar] [CrossRef] [Green Version]
- Sankarasubramanian, A.; Vogel, R.; Limbrunner, J. Climate elasticity of streamflow in the United States. Water Resour. Res. 2001, 37, 1771–1781. [Google Scholar] [CrossRef]
- Vano, J.; Lettenmaier, D. A sensitivity-based approach to evaluating future changes in Colorado River discharge. Clim. Chang. 2014, 122, 621–634. [Google Scholar] [CrossRef]
- Peel, M.; Blöschl, G. Hydrological modeling in a changing world. Prog. Phys. Geogr. Earth Environ. 2011, 35, 249–261. [Google Scholar] [CrossRef]
- Krysanova, V.; Hattermann, F.; Kundzewicz, Z. How evaluation of hydrological models influences results of climate impact assessment—An editorial. Clim. Chang. 2020, 163, 1121–1141. [Google Scholar] [CrossRef]
- Huang, S.; Kumar, R.; Florke, M.; Yang, T.; Hundecha, Y.; Kraft, P.; Gao, C.; Gelfan, A.; Liersch, S.; Lobanova, A.; et al. Evaluation of an ensemble of regional hydrological models in 12 large-scale river basins worldwide. Clim. Chang. 2017, 141, 381–397. [Google Scholar] [CrossRef]
- Hattermann, F.; Krysanova, V.; Gosling, S.; Dankers, R.; Daggupati, P.; Donnelly, C.; Huang, S.; Motovilov, Y.; Buda, S.; Yang, T.; et al. Cross-scale intercomparison of climate change impacts simulated by regional and global hydrological models in eleven large river basins. Clim. Chang. 2017, 141, 561–576. [Google Scholar] [CrossRef]
- Krysanova, V.; Vetter, T.; Eisner, S.; Huang, S.; Pechlivanidis, I.; Strauch, M.; Gelfan, A.; Kumar, R.; Aich, V.; Arheimer, B.; et al. Intercomparison of regional-scale hydrological models and climate change impacts projected for 12 large river basins worldwide-a synthesis. Environ. Res. Lett. 2017, 12, 105002. [Google Scholar] [CrossRef]
- Mondal, A.; Mujumdar, P. On the basin-scale detection and attribution of human-induced climate change in monsoon precipitation and streamflow. Water Resour. Res. 2012, 48, W10520. [Google Scholar] [CrossRef] [Green Version]
- Najafi, M.; Zwiers, F.; Gillett, N. Attribution of observed streamflow changes in key British Columbia drainage basins. Geophys. Res. Lett. 2017, 44, 11012–11020. [Google Scholar] [CrossRef]
- Stocker, T.F.; Qin, D.; Plattner, G.-K.; Tignor, M.; Allen, S.K.; Boschung, J.; Nauels, A.; Xia, Y.; Bex, V.; Midgley, P.M. IPCC, 2013: Summary for Policymakers in Climate Change 2013: The Physical Science Basis, Contribution of Working Group I to the Fifth Assessment Report of the Intergovernmental Panel on Climate Change; Cambridge University Press: Cambridge, UK; New York, NY, USA, 2013. [Google Scholar]
- Tananaev, N.; Makarieva, O.; Lebedeva, L. Trends in annual and extreme flows in the Lena River basin, Northern Eurasia. Geophys. Res. Lett. 2016, 43, 764–772. [Google Scholar] [CrossRef]
- Magritsky, D.; Frolova, N.; Evstigneev, V.; Povalishnikova, E.; Kireeva, M.; Pakhomova, O. Long-term changes of river water inflow into the seas of the Russian Arctic sector. Polarforschung 2017, 87, 177–194. [Google Scholar] [CrossRef]
- Törnqvist, R.; Jarsjö, J.; Pietron, J.; Bring, A.; Rogberg, P.; Asokanb, S.; Destouni, G. Evolution of the hydro-climate system in the Lake Baikal basin. J. Hydrol. 2014, 519, 1953–1962. [Google Scholar] [CrossRef] [Green Version]
- Frolova, N.; Belyakova, P.; Grigorev, V.; Sazonov, A.; Zotov, L. Many-year variations of river runoff in the Selenga basin. Water Resour. 2017, 44, 359–371. [Google Scholar] [CrossRef]
- Kalugin, A. Variations of the present-day annual and seasonal runoff in the Far East and Siberia with the use of regional hydrological and global climate models. Water Resour. 2018, 45, S102–S111. [Google Scholar] [CrossRef]
- Karthe, D.; Chalov, S.; Moreydo, V.; Efimov, V.; Romanchenko, A.; Batbayar, G.; Kalugin, A.; Westphal, K.; Malsy, M.; Flörke, M. Assessment of runoff, water and sediment quality in the Selenga river basin aided by a web-based geoservice. Water Resour. 2017, 44, 399–416. [Google Scholar] [CrossRef]
- Moreido, V.; Kalugin, A. Assessing possible changes in Selenga River water regime in the XXI century based on a runoff formation model. Water Resour. 2017, 44, 390–398. [Google Scholar] [CrossRef]
- Motovilov, Y.; Gottschalk, L.; Engeland, K.; Rodhe, A. Validation of a distributed hydrological model against spatial observations. Agric. For. Meteorol. 1999, 98-99, 257–277. [Google Scholar] [CrossRef]
- Motovilov, Y. ECOMAG, Rospatent no. 2013610703; Water Problems Institute, Russian Academy of Sciences: Moscow, Russia, 9 January 2013. [Google Scholar]
- Motovilov, Y. Hydrological simulation of river basins at different spatial scales: 1. Generalization and averaging algorithms. Water Resour. 2016, 43, 429–437. [Google Scholar] [CrossRef]
- Kalugin, A.; Motovilov, Y. Runoff formation model for the Amur River basin. Water Resour. 2018, 45, 149–159. [Google Scholar] [CrossRef]
- Kalugin, A. Process-based modeling of the high flow of a semi-mountain river under current and future climatic conditions: A case study of the Iya River (Eastern Siberia). Water 2021, 13, 1042. [Google Scholar] [CrossRef]
- Frieler, K.; Lange, S.; Piontek, F.; Reyer, C.; Schewe, J.; Warszawski, L.; Zhao, F.; Chini, L.; Denvil, S.; Emanuel, K.; et al. Assessing the impacts of 1.5 °C global warming—Simulation protocol of the Inter-Sectoral Impact Model Intercomparison Project (ISIMIP2b). Geosci. Model Dev. 2017, 10, 4321–4345. [Google Scholar] [CrossRef] [Green Version]
- Hempel, S.; Frieler, K.; Warszawski, L.; Schewe, J.; Piontek, F. A trend-preserving bias correction—The ISI-MIP approach. Earth Syst. Dyn. 2013, 4, 219–236. [Google Scholar] [CrossRef] [Green Version]
- Gelfan, A.; Kalugin, A.; Krylenko, I.; Nasonova, O.; Gusev, Y.; Kovalev, E. Does a successful comprehensive evaluation increase confidence in a hydrological model intended for climate impact assessment? Clim. Chang. 2020, 163, 1165–1185. [Google Scholar] [CrossRef]
- Krysanova, V.; Donnelly, C.; Gelfan, A.; Gerten, D.; Arheimer, B.; Hattermann, F.; Kundzewicz, Z. How the performance of hydrological models relates to credibility of projections under climate change. Hydrol. Sci. J. 2018, 63, 696–720. [Google Scholar] [CrossRef]
- Moriasi, D.; Arnold, J.; Van Liew, M.; Bingner, R.; Harmel, R.; Veith, T. Model evaluation guidelines for systematic quantification of accuracy in watershed simulations. Trans. Asabe 2007, 50, 885–900. [Google Scholar] [CrossRef]
- Gelfan, A.; Gustafsson, D.; Motovilov, Y.; Arheimer, B.; Kalugin, A.; Krylenko, I.; Lavrenov, A. Climate change impact on the water regime of two great Arctic rivers: Modeling and uncertainty issues. Clim. Chang. 2017, 141, 499–515. [Google Scholar] [CrossRef]
- Eisner, S.; Florke, M.; Chamorro, A.; Daggupati, P.; Donnelly, C.; Huang, J.; Hundecha, Y.; Koch, H.; Kalugin, A.; Krylenko, I.; et al. An ensemble analysis of climate change impacts on streamflow seasonality across 11 large river basins. Clim. Chang. 2017, 141, 401–417. [Google Scholar] [CrossRef]
Figure 1.
Location of hydrological gauges used in the models of the Lena and Selenga river basins.

Figure 2.
Annual runoff of the Lena and Selenga Rivers during the observation period and average values for multi-year periods.
Figure 2.
Annual runoff of the Lena and Selenga Rivers during the observation period and average values for multi-year periods.

Figure 3.
Monthly runoff of the Lena (a) and Selenga (b) Rivers during contrasting periods.

Figure 4.
Modeling of the normal monthly runoff at the outlet gauges of the Lena River for the period 1970–1999 and the Selenga River for the period 1981–2005.
Figure 4.
Modeling of the normal monthly runoff at the outlet gauges of the Lena River for the period 1970–1999 and the Selenga River for the period 1981–2005.

Figure 5.
Normal monthly averaged-basin values of air temperature (a,b), precipitation (c,d), vapor pressure deficit (e,f), and runoff (g,h) of the Lena and Selenga Rivers, based on hydrological modeling, using the data of weather stations or reanalysis and the Historical Earth System Models (ESMs) dataset for the period 1970–1999 and 1981–2005, respectively.

Figure 6.
The 30-year moving average of the observed annual runoff of the Lena (Kusur gauge) and Selenga (Mostovoi gauge), calculated by hydrological models using the Historical ESMs dataset.
Figure 6.
The 30-year moving average of the observed annual runoff of the Lena (Kusur gauge) and Selenga (Mostovoi gauge), calculated by hydrological models using the Historical ESMs dataset.

Figure 7.
Anomalies of mean annual and seasonal air temperature in the Lena and Selenga basins, calculated using the piControl dataset relative to the reference period 1970–1999.
Figure 7.
Anomalies of mean annual and seasonal air temperature in the Lena and Selenga basins, calculated using the piControl dataset relative to the reference period 1970–1999.

Figure 8.
Anomalies of mean annual and seasonal air temperature in the Lena and Selenga basins, calculated using the greenhouse gases (GHG) dataset relative to the piControl dataset.
Figure 8.
Anomalies of mean annual and seasonal air temperature in the Lena and Selenga basins, calculated using the greenhouse gases (GHG) dataset relative to the piControl dataset.

Figure 9.
Anomalies of annual and seasonal precipitation in the Lena and Selenga basins, calculated using the piControl dataset relative to the reference period 1970–1999.
Figure 9.
Anomalies of annual and seasonal precipitation in the Lena and Selenga basins, calculated using the piControl dataset relative to the reference period 1970–1999.

Figure 10.
Anomalies of annual and seasonal precipitation in the Lena and Selenga basins, calculated using the GHG dataset relative to the piControl dataset.
Figure 10.
Anomalies of annual and seasonal precipitation in the Lena and Selenga basins, calculated using the GHG dataset relative to the piControl dataset.

Figure 11.
Anomalies of mean annual air temperature in the Lena and Selenga basins, calculated using the GHG dataset for the period 1970–1999, relative to the piControl dataset.
Figure 11.
Anomalies of mean annual air temperature in the Lena and Selenga basins, calculated using the GHG dataset for the period 1970–1999, relative to the piControl dataset.

Figure 12.
Anomalies of annual precipitation in the Lena and Selenga basins, calculated using the GHG dataset for the period 1970–1999, relative to the piControl dataset.
Figure 12.
Anomalies of annual precipitation in the Lena and Selenga basins, calculated using the GHG dataset for the period 1970–1999, relative to the piControl dataset.

Figure 13.
Anomalies of annual and seasonal runoff of the Lena and Selenga, calculated using the piControl dataset relative to the reference period 1970–1999.
Figure 13.
Anomalies of annual and seasonal runoff of the Lena and Selenga, calculated using the piControl dataset relative to the reference period 1970–1999.

Figure 14.
Anomalies of annual and seasonal runoff of the Lena and Selenga, calculated using the GHG dataset relative to the piControl dataset.
Figure 14.
Anomalies of annual and seasonal runoff of the Lena and Selenga, calculated using the GHG dataset relative to the piControl dataset.

Figure 15.
Anomalies of the high (Q10) and low (Q90) flow of the Lena and Selenga, calculated using the GHG dataset for 30-year periods of the late 19th, and the middle and late 20th centuries, relative to the piControl dataset.
Figure 15.
Anomalies of the high (Q10) and low (Q90) flow of the Lena and Selenga, calculated using the GHG dataset for 30-year periods of the late 19th, and the middle and late 20th centuries, relative to the piControl dataset.

Figure 16.
Differential integral curves of the Lena and Selenga annual runoff under natural climate variability (piControl) and taking into account anthropogenic greenhouse gas emissions (Historical).
Figure 16.
Differential integral curves of the Lena and Selenga annual runoff under natural climate variability (piControl) and taking into account anthropogenic greenhouse gas emissions (Historical).

Figure 17.
Annual runoff anomalies in the Lena and Selenga basins, calculated using the GHG dataset for the period 1970–1999 relative to the piControl dataset.
Figure 17.
Annual runoff anomalies in the Lena and Selenga basins, calculated using the GHG dataset for the period 1970–1999 relative to the piControl dataset.


Table 1.
Statistical criteria for calculating daily runoff in the Lena and Selenga river basins for the period of calibration and verification of hydrological models.
Table 1.
Statistical criteria for calculating daily runoff in the Lena and Selenga river basins for the period of calibration and verification of hydrological models.
| River–Gauge | Catchment Area, km2 | Calibration | Verification | ||
|---|---|---|---|---|---|
| NSE | PBIAS, % | NSE | PBIAS, % | ||
| Lena–Stolb | 2,460,000 | 0.94 | −0.2 | 0.92 | 2.3 |
| Lena–Kusur | 2,430,000 | 0.91 | −6.9 | 0.90 | −2.7 |
| Lena–Tabaga | 897,000 | 0.85 | −16 | 0.82 | −15 |
| Lena–Krestovskiy | 440,000 | 0.76 | −25 | 0.73 | −25 |
| Aldan–Verkhoyanskiy Perevoz | 696,000 | 0.87 | −2.7 | 0.83 | 10 |
| Vilyui–Khatyryk-Khomo | 452,000 | 0.78 | 17 | 0.56 | 25 |
| Olekma–Kudu-Kuel | 115,000 | 0.79 | 8.5 | 0.82 | 8.1 |
| Selenga–Naushki | 282,000 | 0.76 | 9.7 | 0.56 | −12 |
| Selenga–Novoselenginsk | 360,000 | 0.87 | 10 | 0.82 | −13 |
| Selenga–Mostovoi | 440,000 | 0.84 | 11 | 0.80 | −6.4 |
| Selenga–Kabansk | 445,000 | 0.85 | 8.8 | 0.82 | −8.7 |
Table 2.
Annual runoff coefficient of the Lena and Selenga rivers, calculated using the piControl and Historical datasets for the 30-year periods of the late 19th, and the middle and late 20th centuries.
Table 2.
Annual runoff coefficient of the Lena and Selenga rivers, calculated using the piControl and Historical datasets for the 30-year periods of the late 19th, and the middle and late 20th centuries.
| Period | Lena River | Selenga River | ||
|---|---|---|---|---|
| piControl | Historical | piControl | Historical | |
| The late 19th century | 0.57 | 0.57 | 0.20 | 0.20 |
| The middle 20th century | 0.60 | 0.60 | 0.19 | 0.20 |
| The late 20th century | 0.62 | 0.61 | 0.23 | 0.21 |
Publisher’s Note: MDPI stays neutral with regard to jurisdictional claims in published maps and institutional affiliations. |
© 2022 by the author. Licensee MDPI, Basel, Switzerland. This article is an open access article distributed under the terms and conditions of the Creative Commons Attribution (CC BY) license (https://creativecommons.org/licenses/by/4.0/).
Share and Cite
MDPI and ACS Style
Kalugin, A. Climate Change Attribution in the Lena and Selenga River Runoff: An Evaluation Based on the Earth System and Regional Hydrological Models. Water 2022, 14, 118. https://doi.org/10.3390/w14010118
AMA Style
Kalugin A. Climate Change Attribution in the Lena and Selenga River Runoff: An Evaluation Based on the Earth System and Regional Hydrological Models. Water. 2022; 14(1):118. https://doi.org/10.3390/w14010118
Chicago/Turabian StyleKalugin, Andrey. 2022. "Climate Change Attribution in the Lena and Selenga River Runoff: An Evaluation Based on the Earth System and Regional Hydrological Models" Water 14, no. 1: 118. https://doi.org/10.3390/w14010118
Note that from the first issue of 2016, this journal uses article numbers instead of page numbers. See further details here.