Article

Response of Physicochemical and Microbiological Properties to the Application of Effective Microorganisms in the Water of the Turawa Reservoir

by
Jakub Dobrzyński
*,
Iryna Kulkova
,
Paweł Stanisław Wierzchowski
and
Barbara Wróbel
Institute of Technology and Life Sciences–National Research Institute, Falenty, 3 Hrabska Avenue, 05-090 Poznan, Poland
*
Author to whom correspondence should be addressed.
Water 2022, 14(1), 12; https://doi.org/10.3390/w14010012
Submission received: 15 November 2021 / Revised: 17 December 2021 / Accepted: 19 December 2021 / Published: 22 December 2021
(This article belongs to the Special Issue Biological Monitoring of Pollution in Water Environment)

Abstract

:
Effective microorganisms (EM) technology was used to find the optimal method of water restoration in the designated experimental area. The study aimed to evaluate the impact of EM biopreparation on selected physicochemical and microbiological properties using ISO methods. A week after the application of biopreparations, a slight decrease in the nitrates content (0.375–0.531 mg L−1) and a significant decrease in the content of phosphorus compounds (0.130–0.304 mg L−1) compared to the control date were observed. Moreover, on the second date, the decrease in most values of microbiological properties was noted. Two weeks after the application, in most cases, the values of water quality properties were shaped close to values obtained in the control date (before EM application). The EM effect was rather short-term, but optimization of application properties may prolong the effect and thus, include the EM technology among the best eco-friendly technologies used for freshwater ecosystem restoration.

1. Introduction

Reservoirs play a large role in water retention. There are about 100 retention reservoirs in Poland and Turawa is one of the largest. Turawa and other reservoirs were built to control the water flow, inland navigation, hydro-energy obtaining, and recreation [1,2]. Total storage capacity of Polish reservoirs is 106 m3 [3]. Moreover, Turawa reservoir and its surroundings are of great natural interest. Within its 2125 ha area, two legally protected sites were established to protect birds and their habitats—“Natura 2000 Turawa Lake (PLB160004)” and “Stobrawsko–Turawskie Forest” [4].
Causing a problem on a global scale, progressive urbanization, industrial development, and intensive agriculture contribute to water quality deterioration in reservoirs [5]. The increase in nutrient pollution (including nitrogen and phosphorus) comes mainly from agricultural runoff or point pollution of domestic wastewater [6]. This phenomenon may lead to eutrophication, increased amounts of toxic substances, algae growth, and biodiversity reduction. Furthermore, deterioration of water quality usually causes a decrease in the recreational attractiveness of the reservoir [7,8,9]. In Poland, most of the reservoirs have a bad ecological status of water resources, including Kozłowa Góra, Mietków, Pilchowice, Nysa, Rybnik, Sulejów Włocławek, and Zegrze. One of the most polluted reservoir is the Turawa reservoir [3,10]. The importance of the pollution by biogens of the Turawa reservoir has previously been described by other authors [11,12]. The authors found that the Mała Panew catchment is the main source of pollution of the Turawa reservoir. So far, many methods for freshwater ecosystem restoration have been used—namely technical, chemical, and biological [13]. Chemical methods include techniques based on chemical substances that reduce the excessive biological activity of water. However, there is a risk that such techniques may be harmful to humans and, through accumulation in water and sediments, may cause too much interference in the biological life of lake ecosystems. Moreover, chemical methods may be ineffective in the long term and generate high costs [14,15]. Technical methods include, e.g., dredging based on removal of sediments from the bottom. These sediments (top layer) may contain even approx. 90% of total phosphorus in the whole lake ecosystem [16]. However, physical restoration of water has many disadvantages, for instance, high costs and significant effects on the whole lake ecosystem or reduced diversity of macrofauna [17,18]. One of the biological methods is using effective microorganisms (EM), which was proposed for lake restoration as an eco-friendly and cost-effective technology. The EM concept was originally developed by Dr. Teruo Higa in Japan. It is a combination of aerobic and anaerobic species commonly found in all ecosystems. The EM consortium contains approximately 80 microorganism species, including actinomycetes, lactic acid bacteria, phototrophic bacteria, yeast, and fermenters fungi. This microorganism consortium is intended to work synergistically to inhibit the growth of harmful bacteria through competitive exclusion, which results in the dominance of beneficial species [19].
The study aimed to evaluate the impact of the EM technology on water quality–selected physicochemical microbiological parameters, including pH, dissolved oxygen content (DO), electrical conductivity (EC), nitrogen and phosphorus compounds, heterotrophic bacteria number, coliform bacteria, fecal enterococci, and Salmonella spp.

2. Materials and Methods

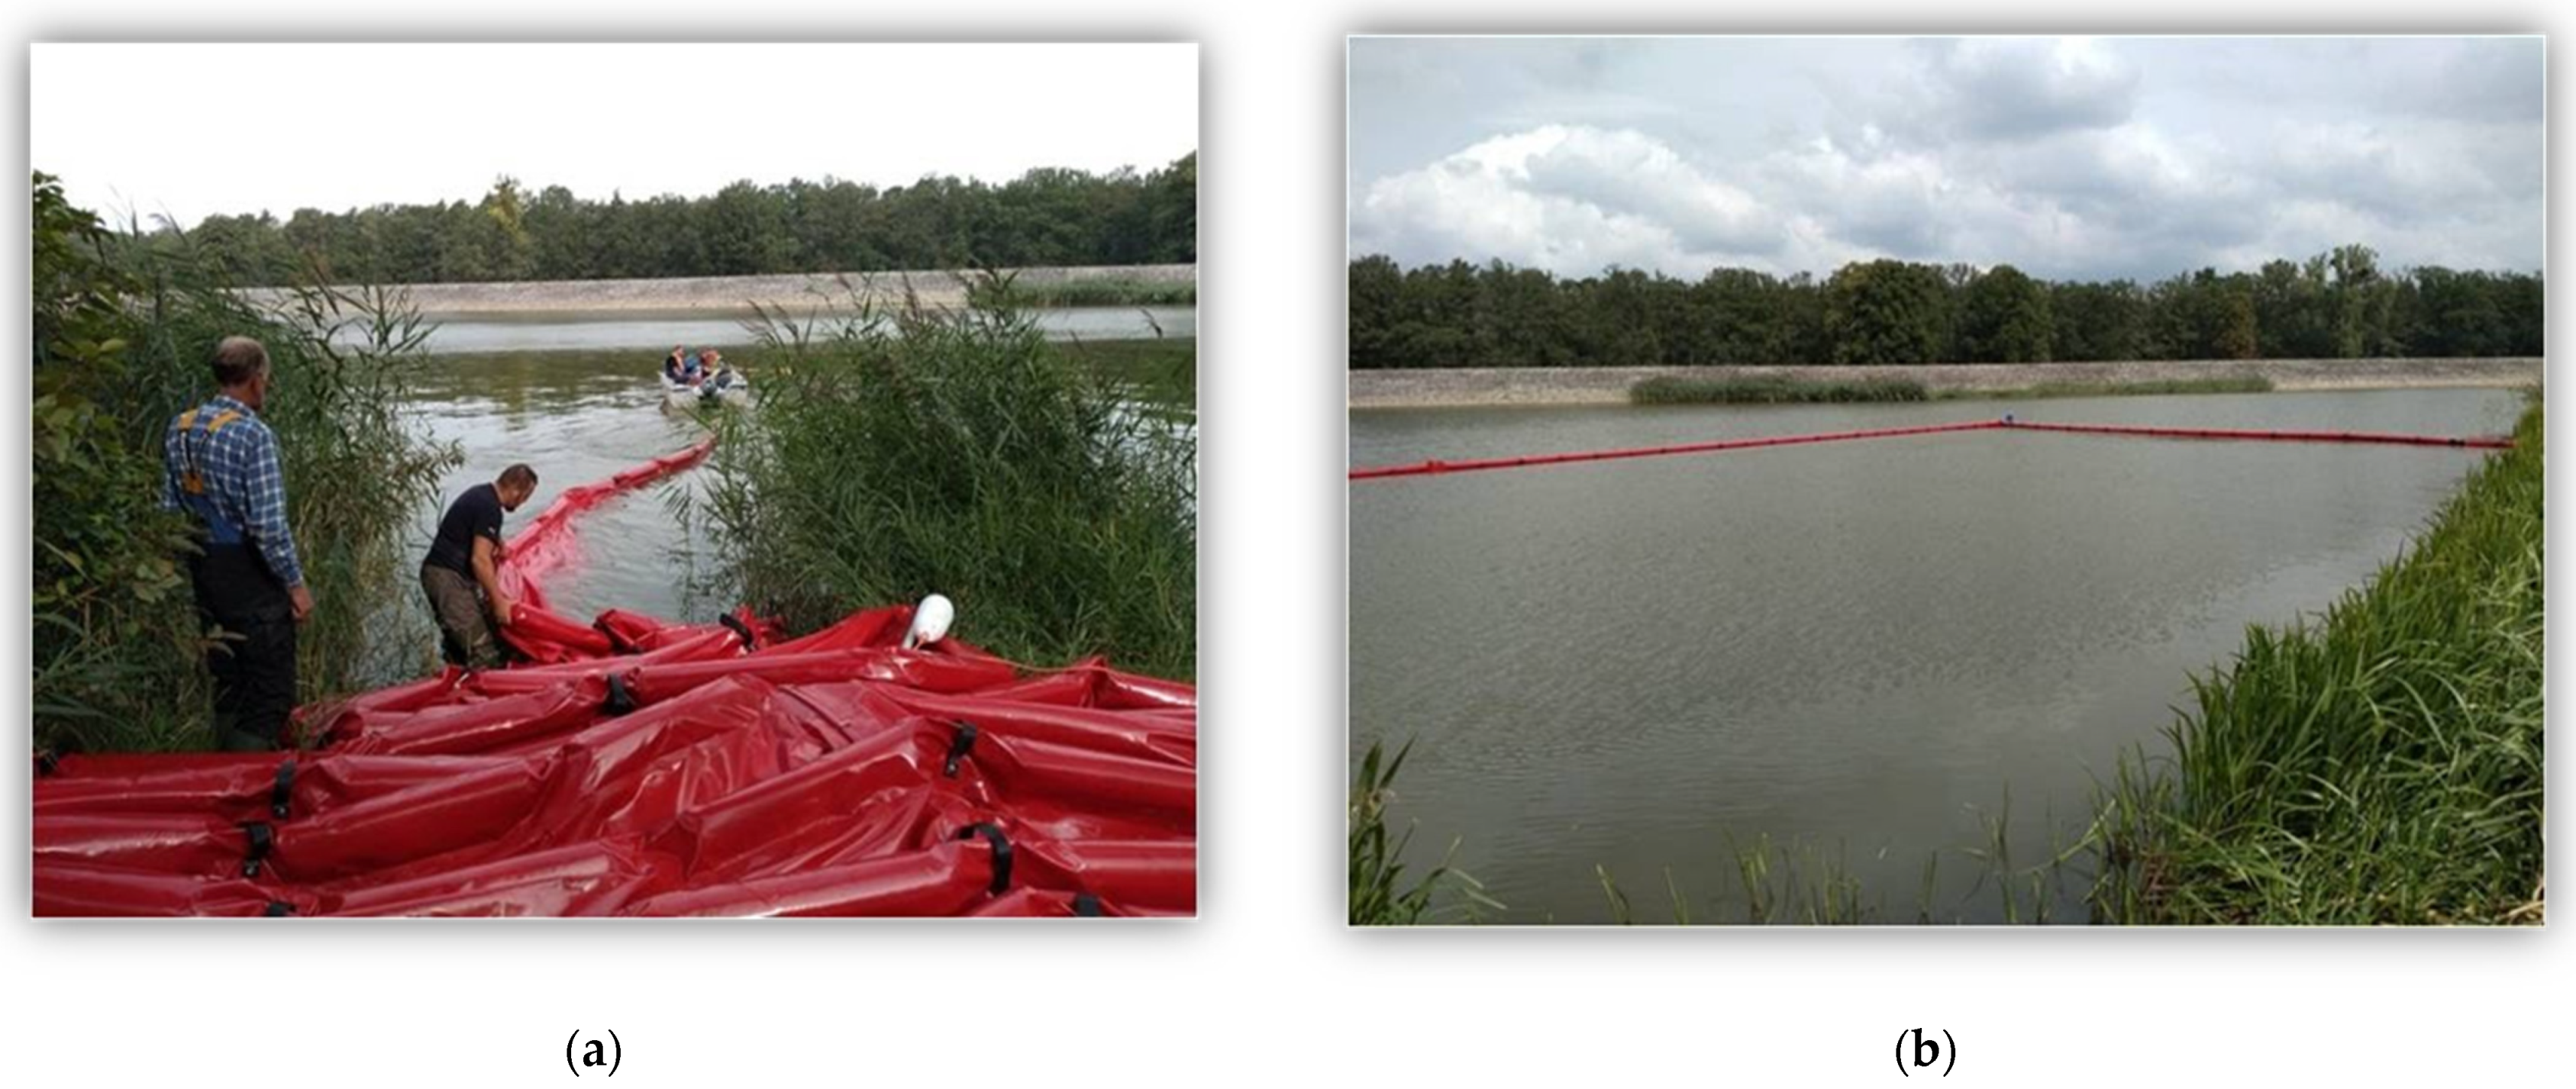
2.1. Characteristics of the Study Area

The Turawa reservoir (50°43′25″ N, 18°07′13″ E) is one of the largest water reservoirs in Poland, located on the Mała Panew river in the south-western part of Poland, about 15 km from the city of Opole. Turawa is a multifunctional reservoir that was built from 1933 to 1939. The average depth in the reservoir is about 4–5 m. The reservoir’s bottom contains approximately 4 million m3 of sapropelic mud and sandy sediments [20]. The reservoir’s catchment area is about 1423 km2. The forests cover 59% of the whole area. Agricultural land covers an area of approximately 25%. The catchment area of Turawa reservoir is covered with sandy, clay, and organic soils, characterized by poor suitability for agricultural production.
The climate in the area is temperate. According to data from meteorological stations, the average annual temperature in 2020–2021 ranges from −0.2 to +5 °C in the coldest months and from +17.8 to +21.1 °C in the hottest months, with an average annual rainfall of 735.04 mm in 2021, and average monthly rainfall in August (2021) was 87.37 mm.
To determine the impact of the effective microorganisms on the water quality, a research area was separated using an anti-spill floating dam (FINBOOM) with dimensions of 50 m (length) × 15 m (width) × 2 m (height). Figure 1a shows assembly of the anti-spill floating dam and Figure 1b shows the designated research area. According to the information from the manufacturer (Lower Silesian Technology and Innovation Accelerator Ltd., Długołęka, Wrocław County, Poland), the EM biopreparation contained bacteria of the genus Lactobacillus, Bifidobacterium, Pediococcus, Lactococcus, Streptococcus (lactic acid bacteria), Rhodopseudomonas (photosynthetic bacteria), Aspergillus, Mucor (anaerobic fermenting fungi), and Streptomyces (actinomycetes). Biopreparation was used in the form of bokashi balls (SD ProBio Original) and applications on and below the water surface (ProBio Sanit). The preparation of bokashi balls consisted of mixing clay and bottom sediment with microbiological preparation with the addition of wheat bran. Subsequently, the balls weighing about 270 g were shaped and stored in a dry and warm place for 7 days. A total of 2000 bokashi balls were made per application (two balls per m2). The preparation of EM liquid involved making the stock solution concentration of the preparation by diluting it with water in a 1:10 ratio. The EM liquid preparation was spread with a sprayer on the water surface in the amount of 10 L per m2 and pumped 0.5 m below the surface in the amount of 10 L per m2. The application area was 750 m2 and the number of EM was in the range of 1.0·108–1.0·1010 CFUg−1 in both biopreparations. The application of the EM technology was conducted on 8 August 2021.
In August 2021, a total of 54 water samples were collected from the reservoir. Sampling was carried out on dry days. Water samples were taken from three selected points (A, B, C) 10 m apart (Figure 2) of the study area (50°43′28.9′′ N, 18°07′01.1′′ E) in three replications once a week for three consecutive weeks–9 August 2021 (I–control date, before EM application), 16 August 2021 (II–second sampling date), and 24 August 2021 (III–third sampling date). At each point, the samples were taken at a depth of 30 cm below the water surface using a water sampler (Denios). Water samples for microbiological and physicochemical analyses were collected in sterilized plastic bottles with a capacity of 500 mL. After sampling, all water samples were immediately placed in a transport refrigerator, transported to the laboratory, and stored at 4 °C. Microbiological and physicochemical analyses were performed within 24 h of taking the samples.

2.2. Physicochemical Analysis

Water temperature (°C; accuracy: ±0.3), pH (resolution: 0.01), dissolved oxygen content (mg L−1; resolution: 0.1 mg L−1), and electrical conductivity (μS cm−1; resolution: 0.01 μS cm−1) were measured at the sampling area using a HACH portable meter (HQ40D Digital Multimeter).
The content of nitrogen (NO3-N and NH4-N), phosphorus (total phosphorus, PO4-P) were determined using the automated method with segmented flux flow in accordance with the Skalar methods (SFA, Skalar Analytical B.V., Breda, The Netherlands) and PN-EN ISO 13395:2001 [21], ISO 15681-2:2018 [22].

2.3. Microbiological Analysis

The number of heterotrophic microorganisms was determined by the serial dilution method according to ISO 6222:1999 [23]. Ten-fold dilution of samples were performed in saline buffer (0.85% NaCl) to be analyzed by pour plate method in nutrient agar (Merck). The dilutions (1 mL) were deep streaked in Petri dishes, and incubated at 36 ± 2 °C for 44 ± 4 h and 22 ± 2 °C for 68 ± 4 h. The culture was read by macroscopic evaluation. The heterotrophic bacteria number was expressed in colony-forming units per ml (CFU mL−1).
The coliform bacteria number was determined by the membrane filtration method described in ISO 9308-1:2014 [24] using two water sample volumes (100 and 10 mL). Membrane filters were incubated on TTC Chapman Agar at 36 ± 2 °C for 24 h. All characteristic yellow colonies extending on the filter were observed, counted with a magnifying glass as coliform bacteria, and recorded as CFU per 100 mL.
The fecal enterococci number was determined by the method according to ISO 7899-2: 2002 [25]. Membrane filters were incubated on Slanetz and Bartley agar at 36 ± 2 °C for 44 ± 4 h, followed by incubation on bile esculin agar (BEA) at 44 ± 0.5 °C for 2 h. All light brown to black colonies were classified as fecal enterococci.
To detect Salmonella spp., 1 L of water samples were tested by membrane filtration and then processed according to ISO 19250: 2010 with using selective broths including Rappaport–Vassiliadis (RVS), liquid Muller-Kauffmann with tetrathionate and novobiocin (MKTTn), and Xylose–Lysine–Desoxycholate Agar (XLD) (qualitative analysis) [26].

2.4. Statistical Analysis

The obtained results were processed statistically using Statistica 6.0. In order to evaluate the physico-chemical parameters in water, a one-way ANOVA variance analysis was performed. The significance of the differences between the sampling dates was checked with the Tukey’s HSD (honest significant difference test) level of p = 0.05.

3. Results and Discussion

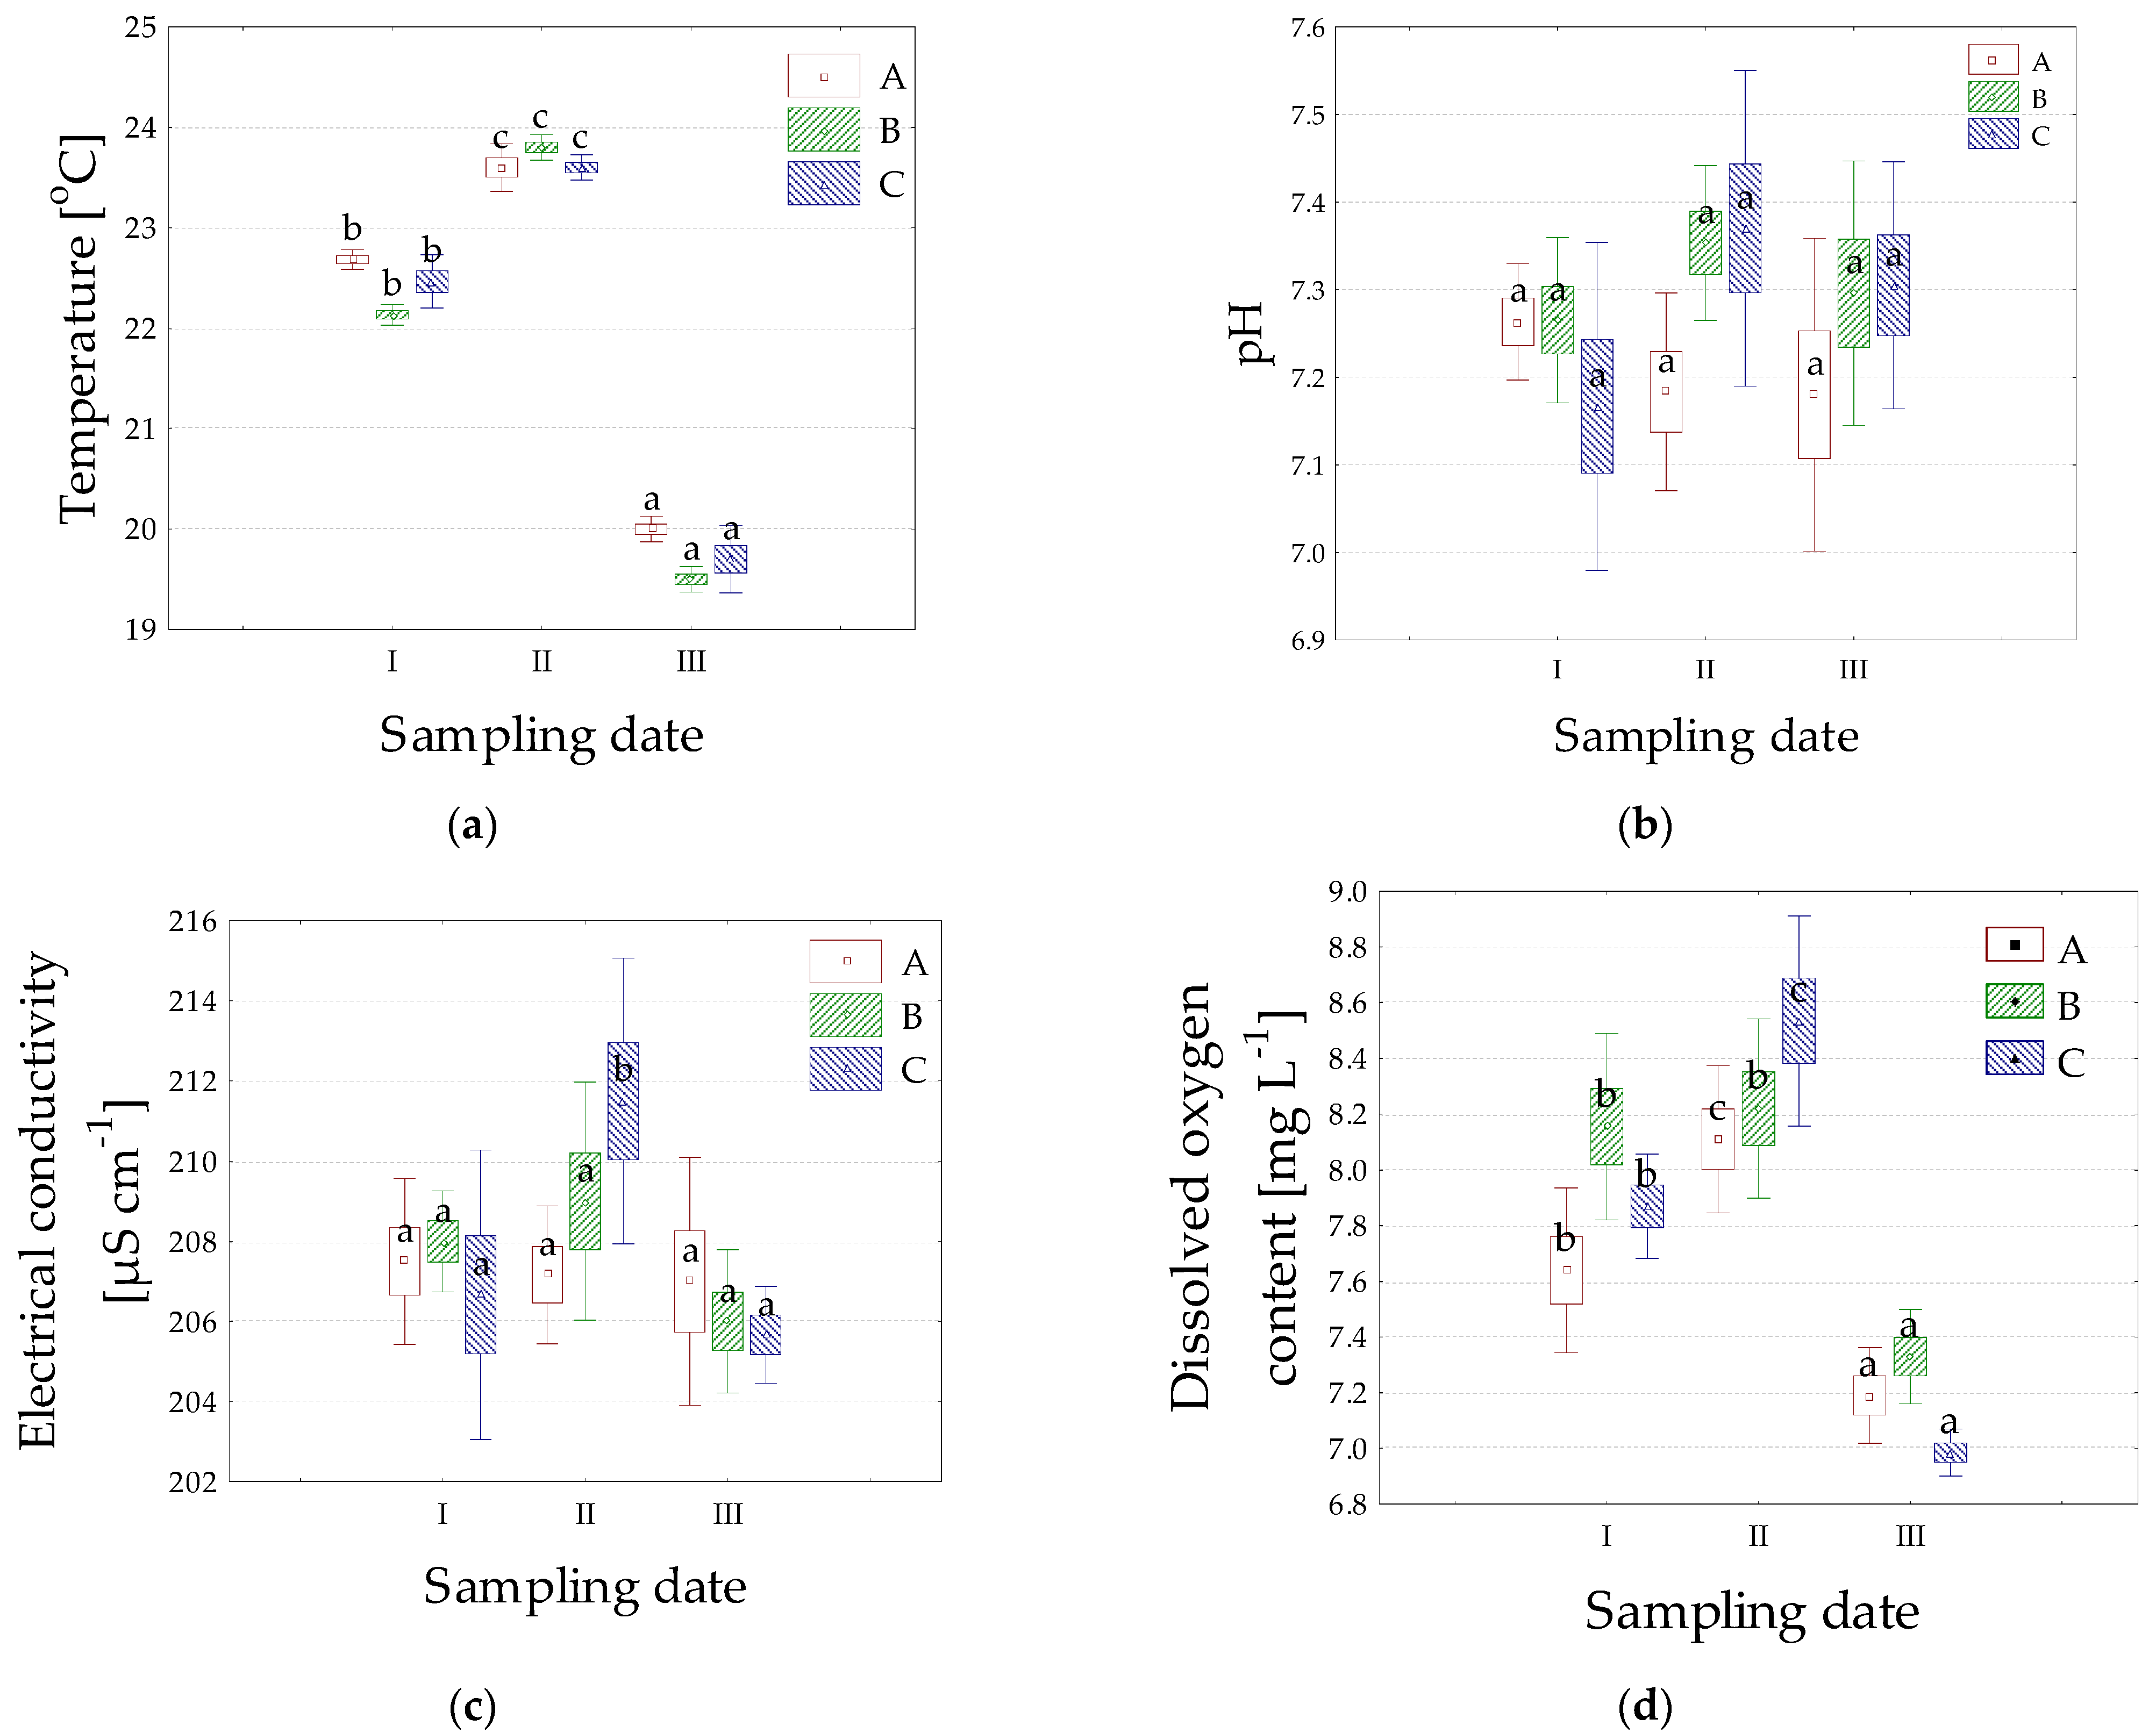
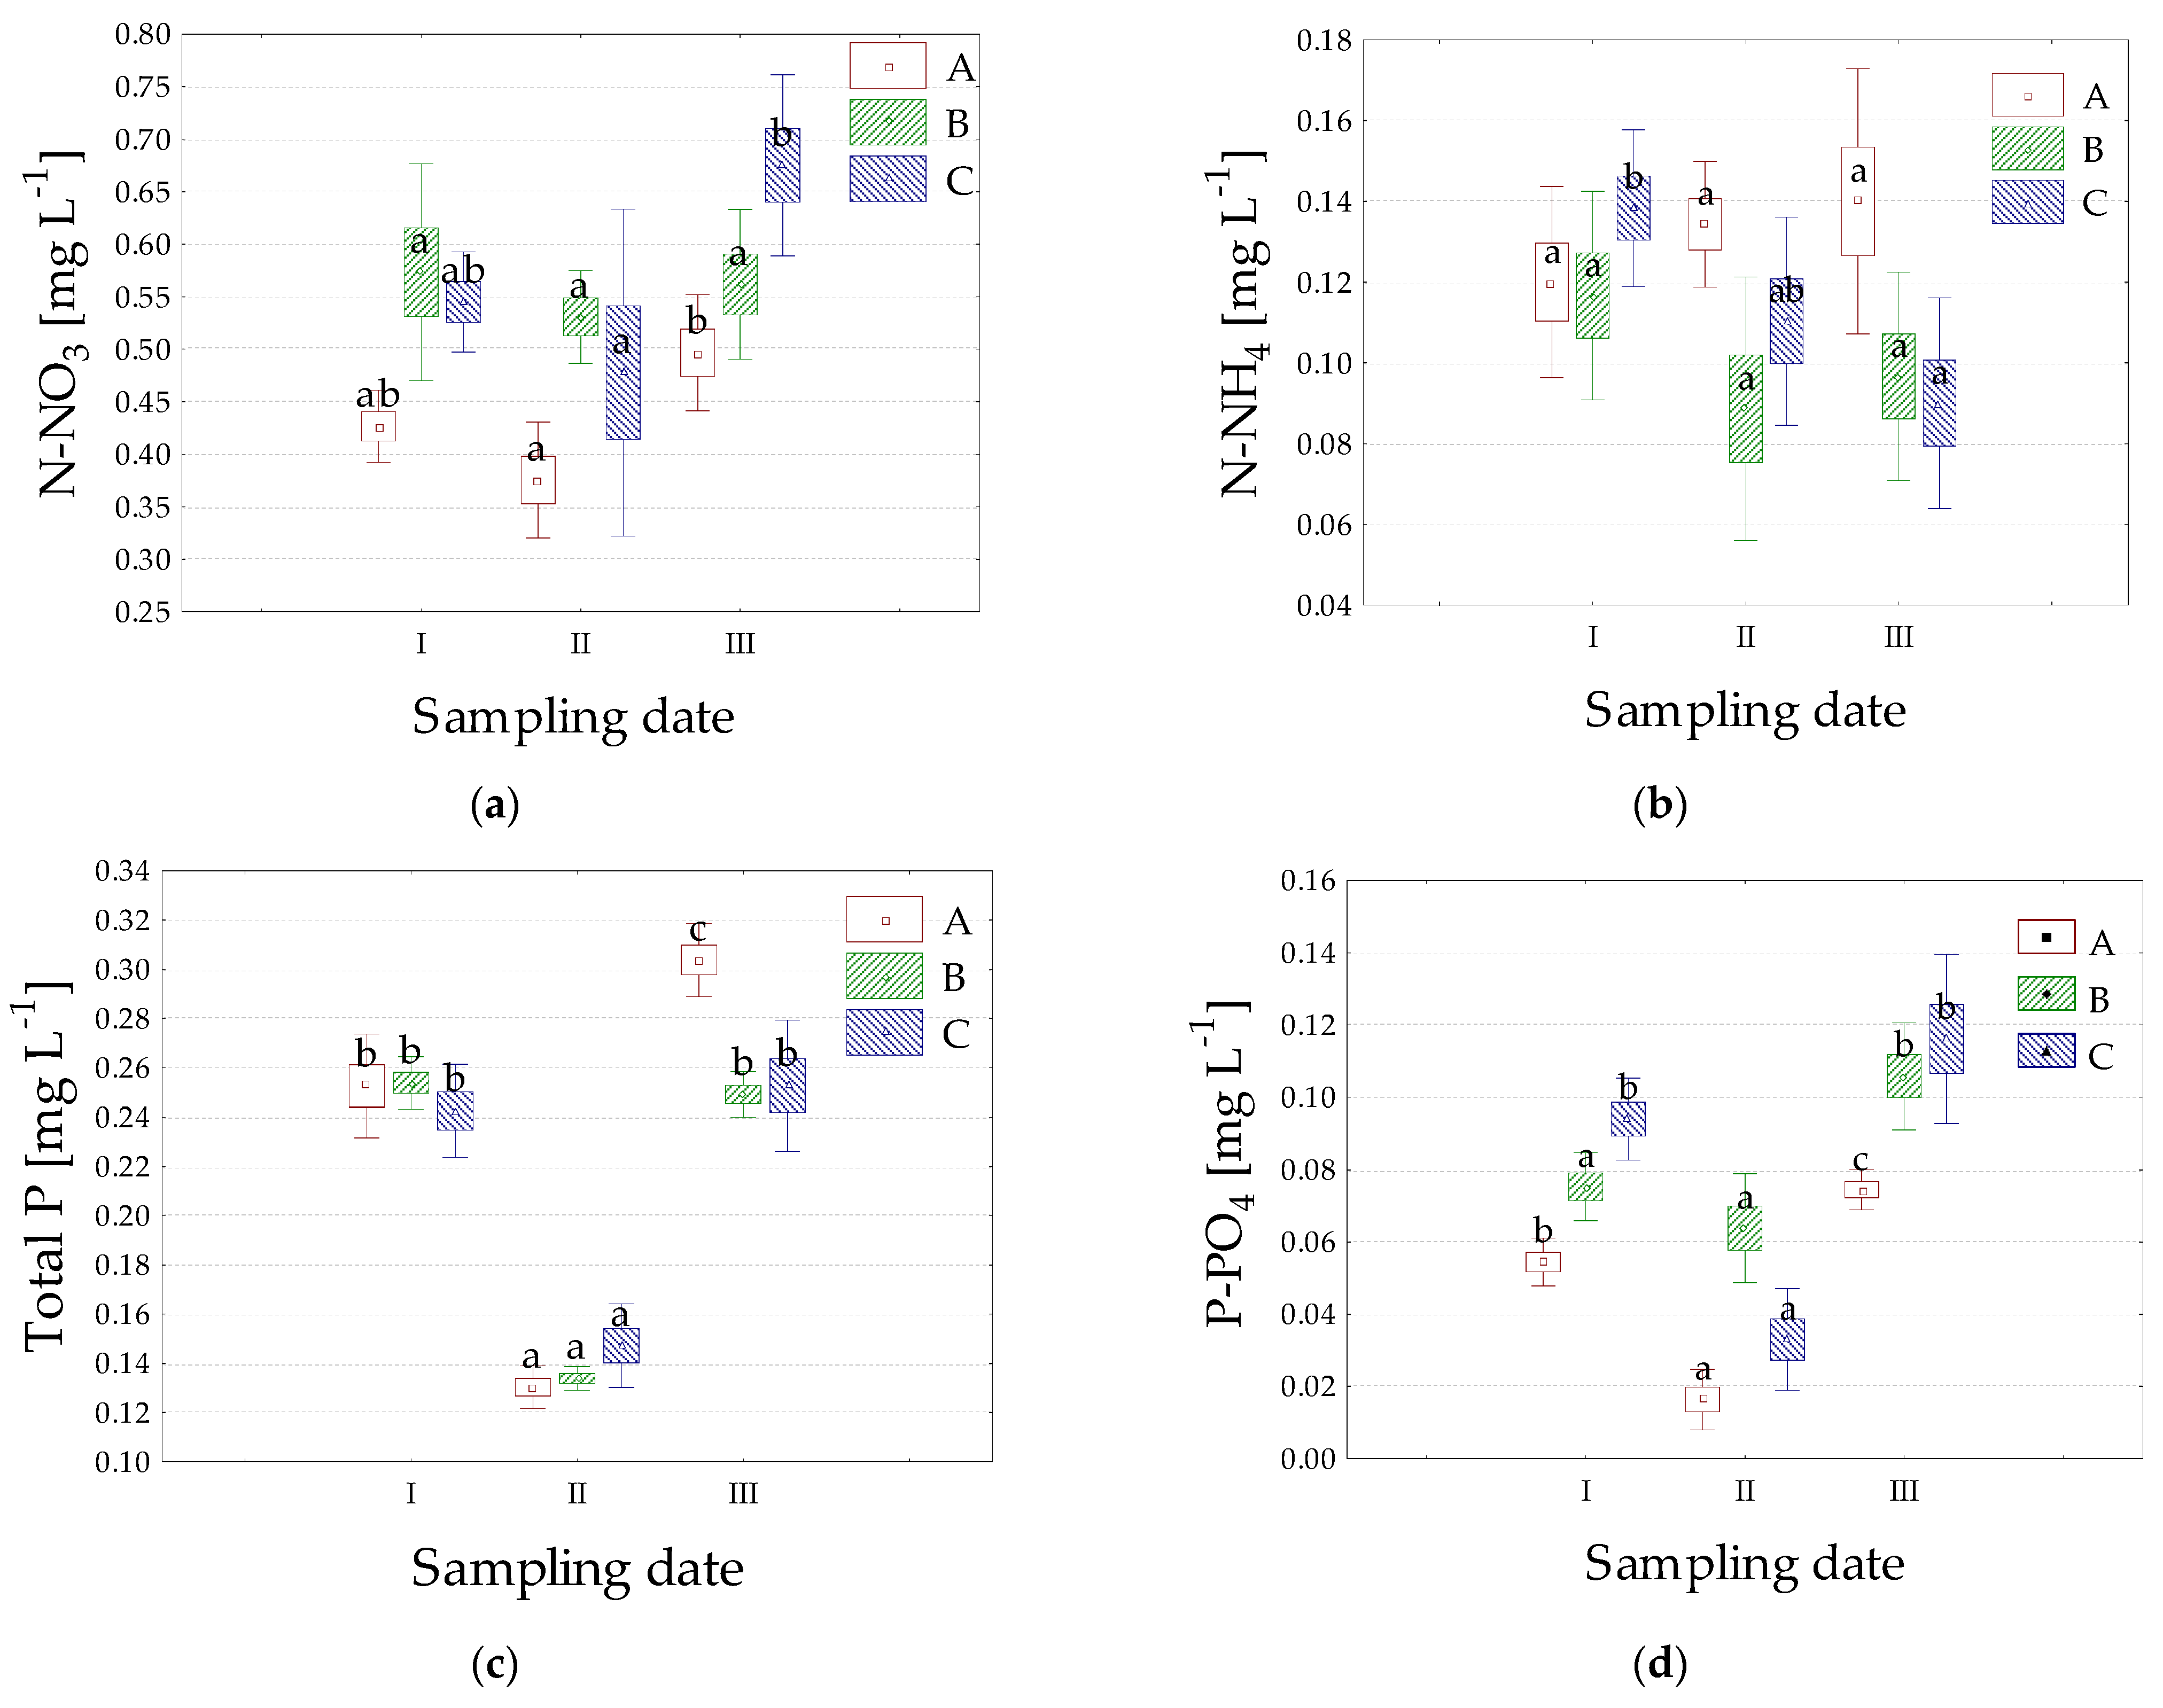
3.1. Physicochemical Properties

Temperature values ranged from approximately 20 to 24 °C and depended on air temperature in the studied period (Figure 3).
In the study, values of pH were on a relatively stable level and did not significantly differ. pH values were in the range of 6.82 to 7.86 (Figure 3). The optimum pH range for the freshwater ecosystem is at 6.8 to 7.6, and the pH range appropriate for aquatic life varies from 6.5 to 9.0 [27]. The obtained results are consistent with Mazurkiewicz et al. [10] who also showed no effect of EM on pH values in reservoir water (Słoneczko reservoir, Poland). Furthermore, these authors suggested that pH values on a stable level may positively impact the adaptation and development of microorganisms introduced from biopreparations. On the other hand, Szymanski and Patterson [28] showed a slight effect of the EM biopreparation on pH. Also, other authors documented an increase of pH values in the studied water after EM technology application [29,30,31]. This phenomenon may be caused by the increased growth of cyanobacteria, their photosynthetic activities causing assimilation of carbon dioxide, and the increase of the hydroxide contained in the water [32].
Electrical conductivity (EC) values did not differ statistically in most cases and were shaped in the range of 206–212 μS cm−1 (Figure 3). The lack of differences may be explained by a relatively small experimental area. Hanekom et al. [33] noted similar results after using EM technology in the water of fishponds. EC values obtained by these authors oscillated on the level of approximately 200 μS cm−1. In contrast, Szymanski and Patterson [28] recorded a slight impact of EM technology on the electrical conductivity of water. The discrepancies between the studies are likely due to the varied physicochemical properties of the studied freshwater ecosystem and the size of the experimental area.
DO concentrations were in the range of 6.98 to 8.54 mg L−1 and slightly differed statistically (Figure 3). In most cases, the highest DO values were noted in water samples collected in the second sampling date (8.11 to 8.54 mg L−1). These results may be caused by a slightly smaller presence of algae blooms. There is limited information about the effect of EM technology on dissolved oxygen in the literature, but similar patterns were observed by Mazurkiewicz et al. [10]. In contrast, Dunalska et al. [34] observed no significant shifts in the DO concentration in the studied water samples after applying a few biopreparations. These preparations, unlike EM solution, contained spores.
Nitrate values slightly decreased one week after EM application (0.375–0.531 mg L−1), but rather did not differ statistically in comparison with nitrate values obtained in other sampling dates (Figure 4). The highest nitrate value was noted in the measurement point C in the third sampling date (0.675 mg L−1) and the lowest nitrate value was recorded in the second point, one week after EM technology application (0.375 mg L−1).
In the studied water, ammonia concentration was also at similar levels and had no statistical significance; the values were in the range of 0.09–0.140 mg L−1 (Figure 4). Similar results were noted by Sharip et al. [35]. These authors observed a lack of significant differences in nitrate values between control and experimental sites in the study using EM technology (Putrajaya Lake, Malaysia). The authors explained these results by dilution of the EM on a large experimental area of the lake by significant mixing of water in exposed sites. Previously, also Dunalska et al. [34] showed no significant shifts in total nitrogen concentration in reservoir water. There are also studies showing that EM technology can significantly decrease ammonia and nitrate concentrations in water reservoirs [19,31,36]. The nitrate or ammonia decrease may be caused by the presence of purple photosynthetic bacteria including R. sphaeroides and R. palustris. These species were described as ammonia removal bacteria [37]. Overall, these bacteria may also metabolize a large number of structurally varied substances, which may be components of degrading plant tissues and animal wastes, e.g., lignin, fatty acids, or dicarboxylic acids [38,39,40]. Bacteria R. palustris also may hydrolase nitrogen-containing compounds, including amino acids and chlorinated benzoates [38,41]. Additionally, purple photosynthetic bacteria R. sphaeroides showed a large tolerance to toxic chemical compounds including pesticides and herbicides, and they may also degrade them. This fact seems to be important regarding water restoration in reservoirs exposed to contamination with agricultural run-off [42]. However, the direction of activity and population growth of these bacteria in the water is dependent on many factors including light intensity or organic compounds content [43,44]. Thus, the discrepancy between studies may be caused by the amount of applied EM, specific physicochemical properties of the reservoirs, or the size of the experimental area.
Total phosphorus values ranged from 0.130 to 0.304 mg L−1 and differed depending on the sampling date. The highest total phosphorus concentration was noted in the third sampling date (measurement point A). More than twice the lower values of this indicator were recorded in the second period: 0.130, 0.134, 0.147 mg L−1 (Figure 4). Orthophosphate values ranged from 0.016 to 0.116 mg L−1, depending on the sampling date (Figure 4). In almost every measurement point, values of this parameter were significantly lower in the second sampling date compared to the other dates. There are several studies with similar patterns in the literature. Dondajewska et al. [45] noted the effect of EM mudballs on reducing the phosphorus concentrations in the water of Konin Lake (Poland). Mazur [36] noted a slight decrease of total phosphorus at some sampling points after the application of EM biopreparation in the water of a reservoir in Głuchów (Poland). Moreover, Mazurkiewicz et al. [10] showed significantly decreased levels of total phosphorus in the water of Słoneczko reservoir after application of biopreparation with beneficial microorganisms, which have similar microbiological composition to EM technology. The decrease of phosphorus compounds may be explained likely by the activity of previously described photosynthetic bacteria present in the EM consortium. These photosynthetic bacteria are also naturally ubiquitous in fresh and marine water, soil, wastewater, and activated sludge [18,42]. Liang et al. [46] noted that bacteria R. palustris can accumulate phosphorus compounds. There also have been studies showing different patterns in the literature. For instance, Sitarek et al. [31] documented a lack of EM effect on phosphorus concentration in the water of Muchawka Reservoir (Poland). The discrepancy between results may be the result of, e.g., varied amounts of applied EM and physicochemical properties of the studied freshwater ecosystems.

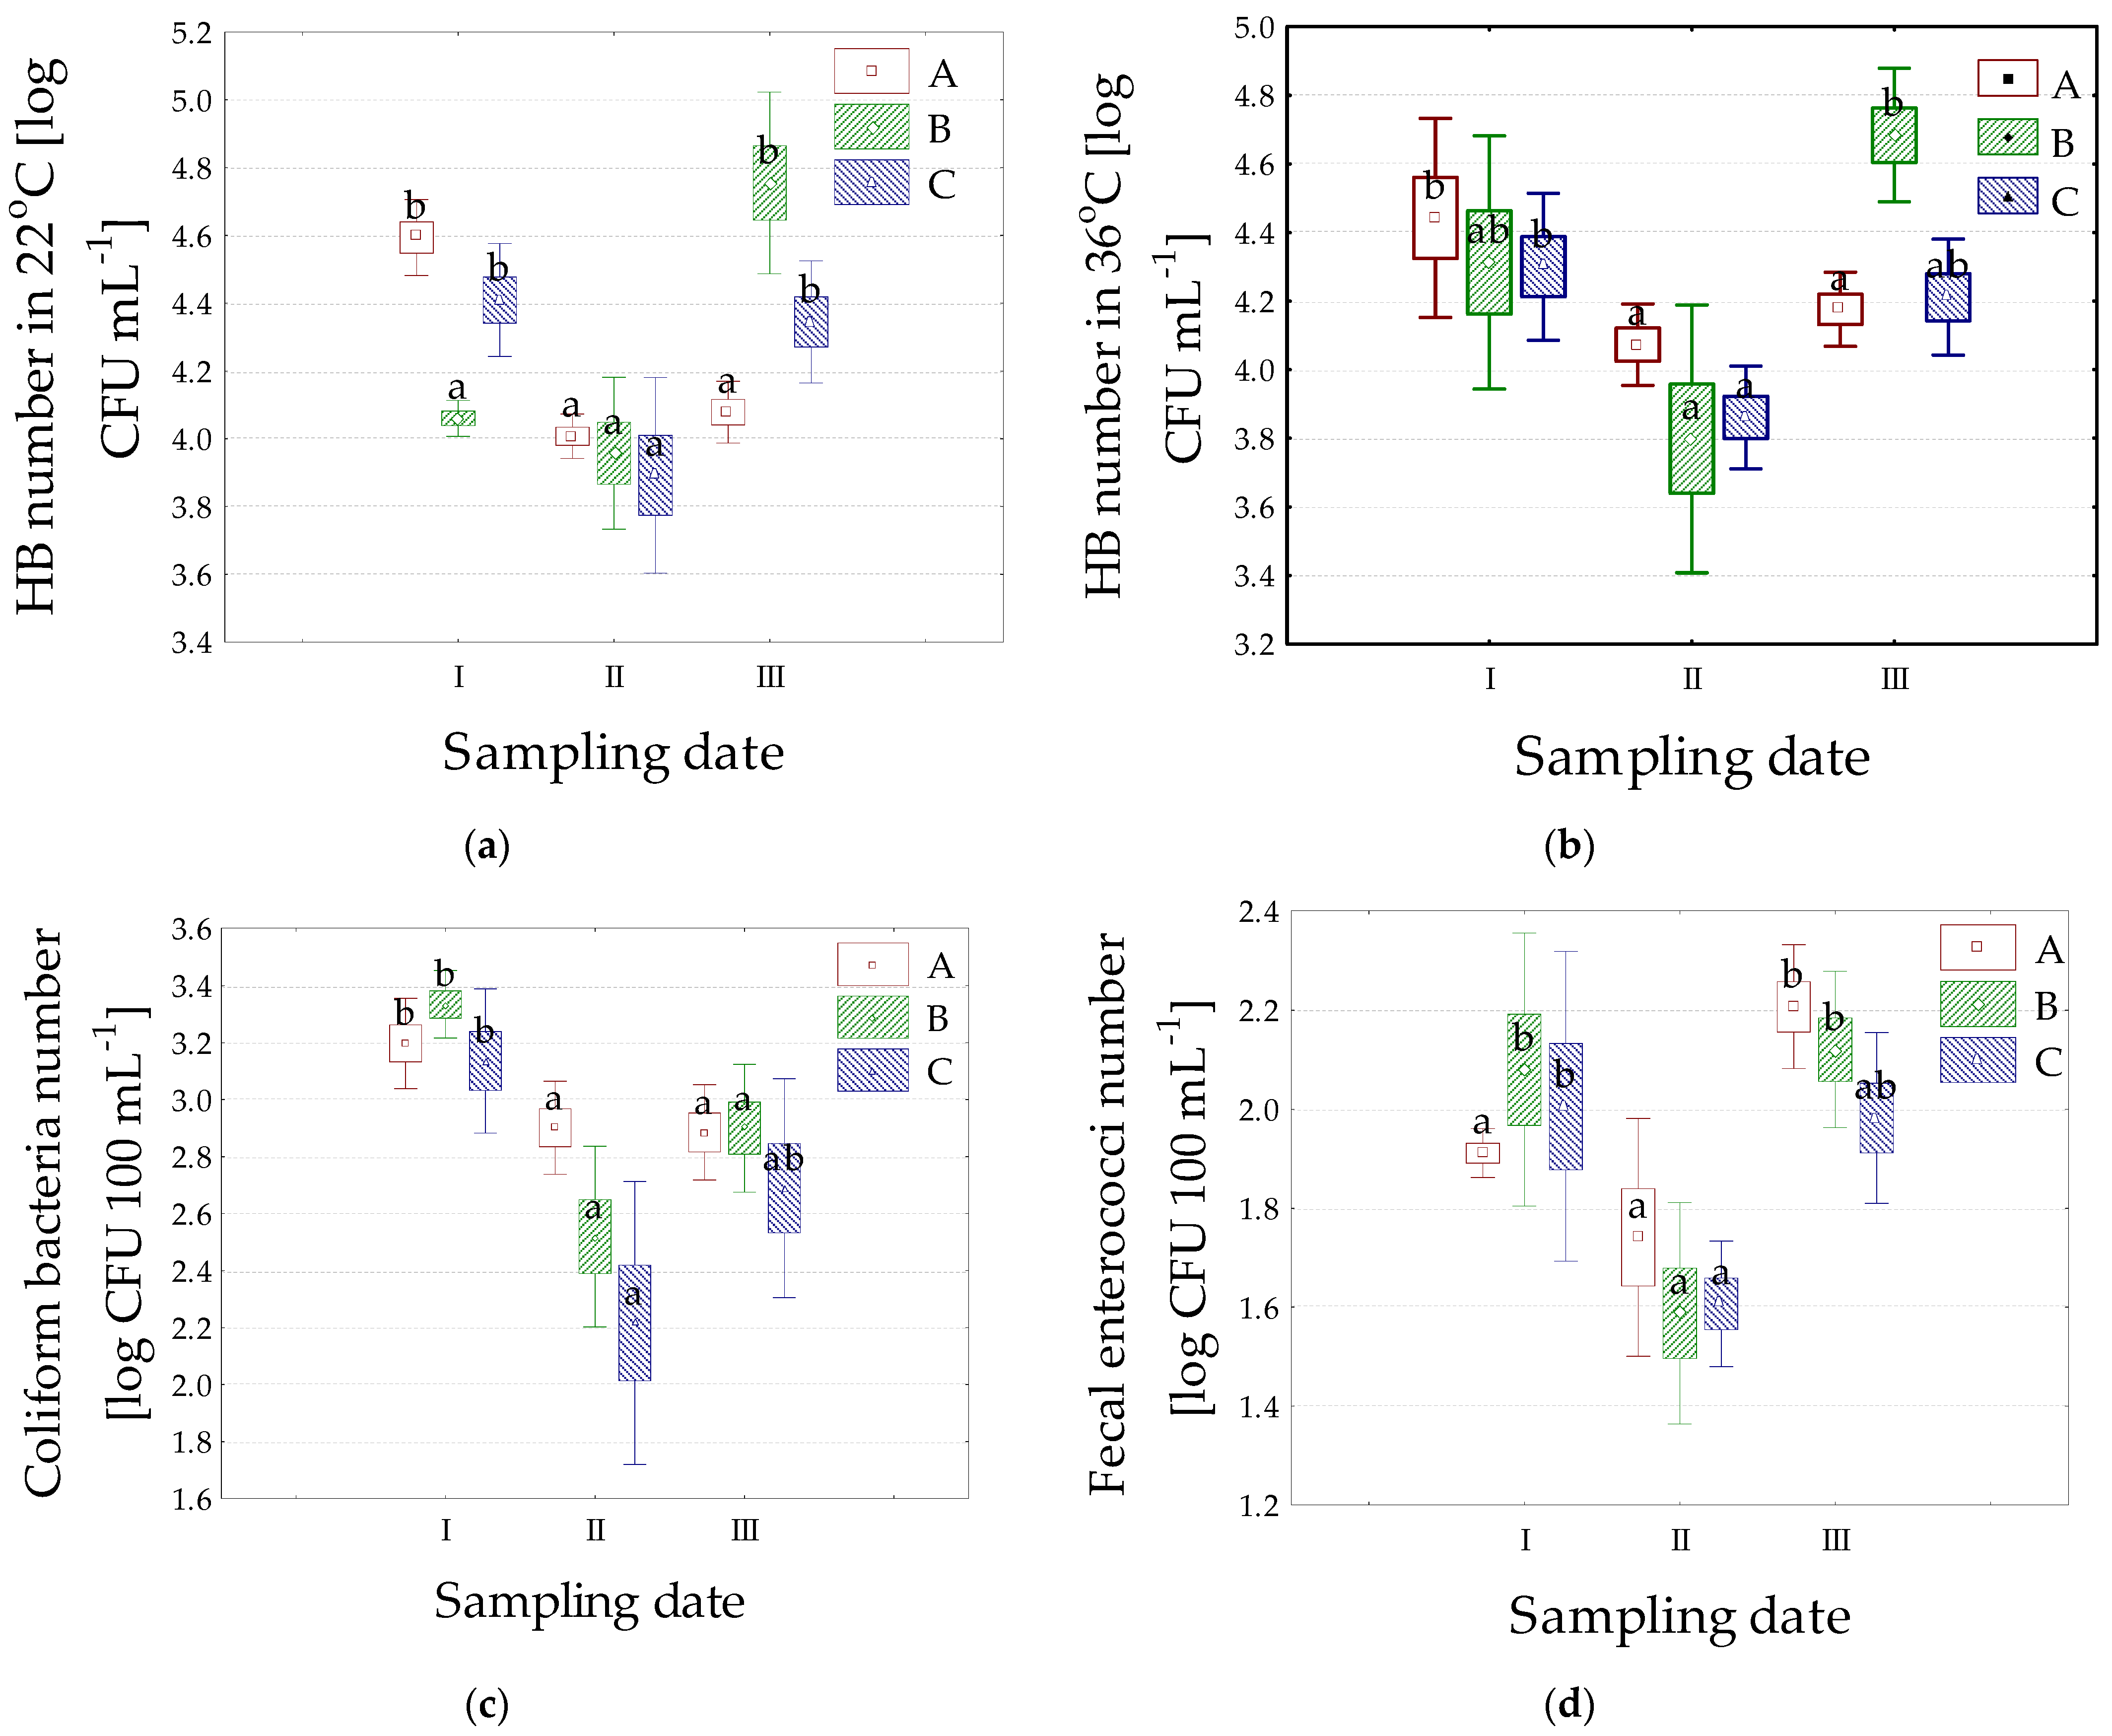
3.2. Microbiological Properties

The number of heterotrophic bacteria ranged from 3.95 to 4.82 log (8925 to 65,500) CFU mL−1 in the studied water—incubation at 22 °C—and from 3.88 to 4.72 log (7617 to 52,000) CFU mL−1 in samples incubated at 36 °C. Compared to other sampling dates, the significantly lowest number of these indicators was recorded a week after EM application in most measurement points. On the other hand, the highest value of this parameter was found in the third sampling date at point B, two weeks after the EM application. Almost the same patterns were found for heterotrophic bacteria incubated at 36 °C (Figure 5). Such results can be caused by the presence of antibiotic synthesizing bacteria in the biopreparation consortium. For instance, B. subtilis can synthesize more than two dozen antibiotic substances with a large variety of structures and activity [47]. In addition, the EM preparation contains bacteria of the species L. plantarum, which produce a bacteriocin called lactoline, which exhibits similar properties to antibiotics [48]. There have been no studies in the literature assessing the effect of EM preparation on the number of heterotrophic bacteria. The lack of information on the reaction of this parameter after EM application may be a result of the fact that most heterotrophic bacteria are natural inhabitants of human and animal bodies, e.g., bacteria from the genus Acinetobacter, Bacillus, Citrobacter, Enterobacter, Flavobacterium, Micrococcus, Proteus, Pseudomonas [49]. Thus, most heterotrophic bacterial species are not the typical pathogenic indicators. However, among heterotrophic bacteria, there are also species of bacteria that may cause skin and respiratory system infections, e.g., bacterial strains from the genus Pseudomonas, and bacteria from the genus Aeromonas, which may cause gastroenteritis [50]. At this point, it is worth adding that the studied parameter concerns culturable bacteria with the capability to grow in the defined culture conditions, and it does not show whether heterotrophic bacteria are allochthonous or autochthonous in origin. Despite this, heterotrophic bacteria plate count is a basic indicator describing water bioactivity [51].
The highest number of coliform bacteria was noted in the studied water collected on the control sampling date in the point B—3.35 log (2215) CFU 100 mL−1. However, the lowest coliform bacteria number was recorded on the second date—2.51 log (325) CFU 100 mL−1. A significant decrease in the number of this parameter (up to five times) was recorded in most studied cases after EM application (Figure 5). The results obtained after the application of EM technology largely fell within the standard described in the Regulation of the Minister of Health on supervising water quality in water bodies used for bathing and at bathing sites [52]. According to this regulation, the acceptable level was at the number of ≤1000 MPN or CFU 100 mL−1. These results may be caused by the presence of L. plantarum in the EM microbial community. These bacterial species can produce antibacterial peptides with inhibitory activity against a large number of Gram-positive and Gram-negative bacteria, including coliform bacteria, e.g., E. coli (including E. coli 0157:H7), Klebsiella sp., and Salmonella sp. [53]. Another example of bacterial species with antibacterial activity in the EM consortium is L. lactis, which can produce bacteriocin–nisin inhibiting the growth of some coliform bacteria. Similar patterns were noted by other authors. Sitarek et al. [31] observed values of coliform bacteria above acceptable levels (described in the above-mentioned regulation)—1373 and 3600 MPN 100 mL−1 in 2013 and 2015, respectively, in the water of Muchawka Reservoir (40 ha). There, liquid EM biopreparation (16,000 L) was applied to the surface water and the water column by a motor pump. Subsequently, these authors noted very low values of this parameter–below 15 MPN 100 mL−1. Moreover, Mazurkiewicz et al. [10] noted a decrease in the value of coliform bacteria to the acceptable level by using beneficial microorganisms containing such dominants as L. casei, L. plantarum, S. cerevisiae. These authors conducted a study in the water of Słoneczko reservoir (Łódź Voivodeship, Poland).
The fecal enterococci number ranged from 1.63 to 2.22 log (43 to 167) CFU 100 mL−1 in the studied water. One week after application, the number of this indicator significantly decreased in most cases. In the B and C measurement points, the values of the fecal enterococci number decreased approximately 300% in comparison with the control. In the last sampling date, the fecal enterococci number was similar to the values of the date before application—2.01–2.22 log (103–167) CFU 100 mL−1 (Figure 5). The obtained values were within the legal limit described in the Regulation of the Minister of Health on supervising water quality in water bodies used for bathing and at bathing sites (≤400 MPN 100 mL−1 or CFU 100 mL−1). A slight decrease in the number of fecal enterococci a week after the application of the biopreparation could be caused by the occurrence of a few dominants of EM. For instance, bacteria L. plantarum can produce bacteriocin-like compounds, which have an antagonistic activity to studied bacteria [54]. Another dominant consortium, L. lactis, may synthesize an antibacterial substance (nisin) that has activity against this bacteria group [55]. Additionally, photosynthetic bacteria—R. sphaeroides may also show a slight decrease in the enterococcal population in water [37]. After application EM, similar patterns were recorded by Sitarek et al. [31] and Mazurkiewicz et al. [10].
Bacteria Salmonella sp. was not detected in any of the studied water samples.

4. Conclusions

In the study, significantly lower content of phosphorus compounds, number of heterotrophic bacteria, coliform, and fecal enterococci was noted one week after the application. On the next sampling date, the values of the parameters were close to the control date. These patterns indicated that the impact of EM technology on the studied water had a rather short-term effect. Thus, there is a need for further research to modify and choose the appropriate amount of introduced EM biopreparation. Regarding the functioning of EM technology in water, a deeper evaluation of their effect on the whole bacterial community with using the Next-Generation Sequencing is also necessary.
It is worth adding that biological technologies for purifying water reservoirs may be one of the key methods in fighting nutrient pollution of water reservoirs. Moreover, they perfectly match the regulations of the Water Framework Directive (WFD, Directive 2000/60/EC), which requires the achievement of good ecological status of water reservoirs in the EU.
In conclusion, both in reservoir restoration in Poland and abroad, the optimization of the application properties leading to better operation of EM technology would undoubtedly have a significant impact on this technology development on a larger scale.

Author Contributions

Conceptualization, J.D. and P.S.W.; Methodology, J.D. and I.K.; Software, J.D. and B.W.; Validation, J.D., P.S.W. and I.K.; Formal analysis, J.D. and I.K.; Investigation, J.D., I.K. and P.S.W.; Resources, J.D. and I.K.; Data curation, J.D. and I.K.; Writing—original draft preparation, J.D. and I.K.; Writing—review and editing, J.D.; Visualization, J.D., I.K. and B.W.; Supervision, B.W.; Project administration, B.W.; Funding acquisition, B.W. All authors have read and agreed to the published version of the manuscript.

Funding

This research was funded by The National Centre for Research and Development, grant number BIOSTRATEG3/343733/15/NCBR/2018.

Institutional Review Board Statement

Not applicable.

Informed Consent Statement

Not applicable.

Data Availability Statement

Not applicable.

Acknowledgments

Many thanks to Katarzyna Rafalska for her help in revising the English version of the manuscript.

Conflicts of Interest

The authors declare no conflict of interest.

References

  1. Wiatkowski, M.; Paul, L. Surface water quality assessment in the Troja River catchment in the context of Włodzienin Reservoir construction. Pol. J. Environ. Stud. 2009, 18, 923–929. [Google Scholar]
  2. de Melo, R.; Rameh Barbosa, I.; Ferreira, A.; Lee Barbosa Firmo, A.; da Silva, S.; Cirilo, J.; de Aquino, R. Influence of extreme strength in water quality of the Jucazinho Reservoir, Northeastern Brazil, PE. Water 2017, 9, 955. [Google Scholar] [CrossRef] [Green Version]
  3. Matysik, M.; Absalon, D.; Habel, M.; Maerker, M. Surface Water Quality Analysis Using CORINE Data: An Application to Assess Reservoirs in Poland. Remote Sens. 2020, 12, 979. [Google Scholar] [CrossRef] [Green Version]
  4. Szczepanek, M. Ptaki Jeziora Turawskiego. Przyr. Górnego Śląska 2003, 32, 16. [Google Scholar]
  5. Nthunya, L.N.; Maifadi, S.; Mamba, B.B.; Verliefde, A.R.; Mhlanga, S.D. Spectroscopic Determination of Water Salinity in Brackish Surface Water in Nandoni Dam, at Vhembe District, Limpopo Province, South Africa. Water 2018, 10, 990. [Google Scholar] [CrossRef] [Green Version]
  6. Ling, T.-Y.; Soo, C.-L.; Liew, J.-J.; Nyanti, L.; Sim, S.-F.; Grinang, J. Application of multivariate statistical analysis in evaluation of surface river water quality of a tropical river. J. Chem. 2017, 2017, 5737452. [Google Scholar] [CrossRef] [Green Version]
  7. Xu, M.; Wang, Z.; Duan, X.; Pan, B. Effects of pollution on macroinvertebrates and water quality bio-assessment. Hydrobiologia 2014, 729, 247–259. [Google Scholar] [CrossRef]
  8. Le Moal, M.; Gascuel-Odoux, C.; Ménesguen, A.; Souchon, Y.; Étrillard, C.; Levain, A.; Moatar, F.; Pannard, A.; Souchu, P.; Lefebvre, A.; et al. Eutrophication: A new wine in an old bottle? Sci. Total Environ. 2019, 651, 1–11. [Google Scholar] [CrossRef] [Green Version]
  9. Jabbar, F.K.; Grote, K. Statistical assessment of nonpoint source pollution in agricultural watersheds in the Lower Grand River watershed, MO, USA. Environ. Sci. Pollut. Res. 2019, 26, 1487–1506. [Google Scholar] [CrossRef] [Green Version]
  10. Mazurkiewicz, J.; Mazur, A.; Mazur, R.; Chmielowski, K.; Czekała, W.; Janczak, D. The process of microbiological remediation of the polluted Słoneczko Reservoir in Poland: For reduction of water pollution and nutrients management. Water 2020, 12, 3002. [Google Scholar] [CrossRef]
  11. Buta, B.; Wiatkowski, M.; Gruss, P. Comparative Analysis of the Loads of Biogens in the Waters of the Turawa Dam Reservoir Within the Installation Improving Water Quality. In Book of Abstracts, Proceedings of the 2nd International Scientific Conference on Ecological and Environmental Engineering, Wrocław, Poland, 30 June–1 July 2021; Bugajski, P., Kotowski, D., Młyński, D., Eds.; Polish Academy of Science: Wrocław, Poland, 2021; pp. 21–22. [Google Scholar]
  12. Wiatkowski, M.; Czerniawska-Kusza, I. Use of the preliminary Jedlice Reservoir for water protection in the Turawa Reservoir on the Mała Panew River. Oceanol. Hydrobiol. Stud. 2009, 38, 83–91. [Google Scholar] [CrossRef]
  13. O’Sullivan, P.; Reynolds, C.S. The Lakes Handbook: Limnology and Limnetic Ecology; Wiley: New York, NY, USA, 2008; Volume 1, p. 712. [Google Scholar]
  14. Wagner, T.; Erickson, L.E. Sustainable management of eutrophic lakes and reservoirs. J. Environ. Prot. 2017, 08, 436–463. [Google Scholar] [CrossRef] [Green Version]
  15. Huser, B.J. Aluminum application to restore water quality in eutrophic lakes: Maximizing binding efficiency between aluminum and phosphorus. Lake Reserv. Manag. 2017, 33, 143–151. [Google Scholar] [CrossRef]
  16. Łopata, M.; Augustyniak, R.; Grochowska, J.; Parszuto, K.; Tandyrak, R. Selected aspects of lake restorations in Poland. In Polish River Basins and Lakes—Part II: Biological Status and Water Management; Korzeniewska, E., Harnisz, M., Eds.; The handbook of environmental chemistry; Springer International Publishing: Cham, Switzerland, 2020; Volume 87, pp. 327–352. ISBN 978-3-030-12138-9. [Google Scholar]
  17. Lewis, M.A.; Weber, D.E.; Stanley, R.S.; Moore, J.C. Dredging impact on an urbanized Florida bayou: Effects on benthos and algal-periphyton. Environ. Pollut. 2001, 115, 161–171. [Google Scholar] [CrossRef]
  18. Bormans, M.; Maršálek, B.; Jančula, D. Controlling internal phosphorus loading in lakes by physical methods to reduce cyanobacterial blooms: A review. Aquat. Ecol. 2016, 50, 407–422. [Google Scholar] [CrossRef]
  19. Zakaria, Z.; Gairola, S.; Shariff, N.M. Effective Microorganisms (EM) Technology for Water Quality Restoration and Potential for Sustainable Water Resources and Management. In Proceedings of the International Congress on Environmental Modelling and Software Modelling for Environment’s Sake, Fifth Biennial Meeting, Ottawa, QC, Canada, 5–8 July 2010; Swayne, D.A., Yang, W., Voinov, A.A., Rizzoli, A., Filatova, T., Eds.; International Environmental Modelling and Software Society (iEMSs): Lancaster, UK, 2010. Available online: http://www.iemss.org/iemss2010/index.php?n=Main.Proceedings (accessed on 10 November 2021).
  20. Rajfur, M.; Kłos, A.; Wacławek, M. Algae utilization in assessment of the Large Turawa Lake (Poland) pollution with heavy metals. J. Environ. Sci. Health Part A 2011, 46, 1401–1408. [Google Scholar] [CrossRef]
  21. International Standardization Organization (ISO). ISO 13395:1996; Water Quality—Determination of Nitrite Nitrogen and Nitrate Nitrogen and the Sum of Both by Flow Analysis (CFA and FIA) and Spectrometric Detection. International Organization for Standardization: Geneva, Switzerland, 1996.
  22. International Standardization Organization (ISO). ISO 15681-2:2018; Determination of Orthophosphate and Total Phosphorus Contents by Flow Analysis (FIA and CFA)—Part 2: Method by Continuous Flow Analysis (CFA). International Organization for Standardization: Geneva, Switzerland, 2018.
  23. International Standardization Organization (ISO). ISO 6222:1999; Water Quality—Enumeration of Culturable Micro-Organisms-Colony Count by Inoculation in a Nutrient Agar Culture Medium. International Organization for Standardization: Geneva, Switzerland, 1999.
  24. International Standardization Organization (ISO). ISO 9308-1:2014; Water Quality—Enumeration of Escherichia coli and Coliform Bacteria—Part 1: Membrane Filtration Method for Waters with Low Bacterial Background Flora. International Organization for Standardization: Geneva, Switzerland, 2014.
  25. International Standardization Organization (ISO). ISO 7899-2: 2002; Water Quality—Detection and Enumeration of Intestinal Enterococci—Part 2: Membrane Filtration Method. International Organization for Standardization: Geneva, Switzerland, 2002.
  26. International Standardization Organization (ISO). ISO 19250:2010; Water Quality—Detection of Salmonella spp. International Organization for Standardization: Geneva, Switzerland, 2010.
  27. Al-Badaii, F.; Shuhaimi-Othman, M.; Gasim, M.B. Water quality assessment of the Semenyih River, Selangor, Malaysia. J. Chem. 2013, 2013, 871056. [Google Scholar] [CrossRef] [Green Version]
  28. Szymanski, N.; Patterson, R.A. Effective Microrganisms (EM) and wastewater systems. In Future Direction for On-Site Systems: Best Management Practice, Proceedings of the On-Site’03 Conference, Armidale, Australia, 30 September–2 October 2003; Patterson, R.A., Jones, M.J., Eds.; Lanfax Laboratories Armidale: Armidale, Australia, 2003; pp. 348–355. [Google Scholar]
  29. Mingjun, S.; Yanqiu, W.; Xue, S. Study on bioremediation of eutrophic lake. J. Environ. Sci. 2009, 21, S16–S18. [Google Scholar] [CrossRef]
  30. Lurling, M.; Tolman, Y.; van Oosterhout, F. Cyanobacteria blooms cannot be controlled by Effective Microorganisms (EM®) from mud- or Bokashi-balls. Hydrobiologia 2010, 646, 133–143. [Google Scholar] [CrossRef] [Green Version]
  31. Sitarek, M.; Napiórkowska-Krzebietke, A.; Mazur, R.; Czarnecki, B.; Pyka, J.P.; Stawecki, K.; Olech, M.; Sołtysiak, S.; Kapusta, A. Application of effective microorganisms’ technology as a lake restoration tool—A case study of Muchawka Reservoir. J. Elem. 2017, 22, 529–543. [Google Scholar] [CrossRef]
  32. Wetzel, R.G. Limnology: Lake and River Ecosystems, 3rd ed.; Academic Press: San Diego, CA, USA, 2001; pp. 1–1006. [Google Scholar]
  33. Hanekom, D.; Prinsloo, J.F.; Schoonbee, H.J. A Comparison of the Effect of Anolyte and Effective Micro-Organisms (Kyusei EMTM) on the Fecal Bacterial Loads in the Water and on Fish Produced in Pig-Cum-Fish Integrated Production Units. Water SA. 2000. Available online: http://www.emturkey.com.tr/eskisite/TR/dosya/1-126/h/02-a-comparison-of-the-effect-of-anolyte-and-effective-.pdf (accessed on 10 November 2021).
  34. Dunalska, J.A.; Sieńska, J.; Szymański, D. The use of biopreparations in lake restoration—Experimental research. Oceanol. Hydrobiol. Stud. 2015, 44, 500–507. [Google Scholar] [CrossRef]
  35. Sharip, Z.; Abd Razak, S.B.; Noordin, N.; Yusoff, F.M. Application of an Effective Microorganism product as a cyanobacterial control and water quality improvement measure in Putrajaya Lake, Malaysia. Earth Syst. Environ. 2020, 4, 213–223. [Google Scholar] [CrossRef]
  36. Mazur, R. The application of microbiological biopreparations in the process of water remediation of the dam reservoir in Głuchów. Acta Sci. Pol. Form. Circumiectus 2020, 19, 81–95. [Google Scholar] [CrossRef]
  37. Peirong, Z.; Wei, L. Use of fluidized bed biofilter and immobilized Rhodopseudomonas palustris for ammonia removal and fish health maintenance in a recirculation aquaculture system. Aquac. Res. 2013, 44, 327–334. [Google Scholar] [CrossRef]
  38. Larimer, F.W.; Chain, P.; Hauser, L.; Lamerdin, J.; Malfatti, S.; Do, L.; Land, M.L.; Pelletier, D.A.; Beatty, J.T.; Lang, A.S.; et al. Complete genome sequence of the metabolically versatile photosynthetic bacterium Rhodopseudomonas palustris. Nat. Biotechnol. 2004, 22, 55–61. [Google Scholar] [CrossRef] [PubMed] [Green Version]
  39. Wu, P.; Liu, Y.; Song, X.; Wang, Y.; Sheng, L.; Wang, H.; Zhang, Y. Rhodopseudomonas sphaeroides treating mesosulfuron-methyl waste-water. Environ. Pollut. 2020, 262, 114166. [Google Scholar] [CrossRef]
  40. Zhang, P.; Sun, F.; Cheng, X.; Li, X.; Mu, H.; Wang, S.; Geng, H.; Duan, J. Preparation and biological activities of an extracellular polysaccharide from Rhodopseudomonas palustris. Int. J. Biol. Macromol. 2019, 131, 933–940. [Google Scholar] [CrossRef] [PubMed]
  41. Egland, P.G.; Gibson, J.; Harwood, C.S. Reductive, coenzyme A-mediated pathway for 3-chlorobenzoate degradation in the phototrophic bacterium Rhodopseudomonas palustris. Appl. Environ. Microbiol. 2001, 67, 1396–1399. [Google Scholar] [CrossRef] [PubMed] [Green Version]
  42. Wu, P.; Xie, L.; Wu, X.; Wang, Y.; Wu, Y.; Li, N.; Zhang, Y.; Chen, Z. Effect of Rhodopseudomonas sphaeroides –Treated wastewater on yield, digestive enzymes, antioxidants, nonspecific immunity, and intestinal microbiota of common carp. N. Am. J. Aquac. 2019, 81, 385–398. [Google Scholar] [CrossRef]
  43. Kuo, F.-S.; Chien, Y.-H.; Chen, C.-J. Effects of light sources on growth and carotenoid content of photosynthetic bacteria Rhodopseudomonas palustris. Bioresour. Technol. 2012, 113, 315–318. [Google Scholar] [CrossRef] [PubMed]
  44. Pechter, K.B.; Gallagher, L.; Pyles, H.; Manoil, C.S.; Harwood, C.S. Essential genome of the metabolically versatile alphaproteobacterium Rhodopseudomonas palustris. J. Bacteriol. 2016, 198, 867–876. [Google Scholar] [CrossRef] [Green Version]
  45. Dondajewska, R.; Kozak, A.; Rosińska, J.; Gołdyn, R. Water quality and phytoplankton structure changes under the influence of Effective Microorganisms (EM) and barley straw—Lake restoration case study. Sci. Total Environ. 2019, 660, 1355–1366. [Google Scholar] [CrossRef]
  46. Liang, C.-M.; Hung, C.-H.; Hsu, S.-C.; Yeh, I.-C. Purple nonsulfur bacteria diversity in activated sludge and its potential phosphorus-accumulating ability under different cultivation conditions. Appl. Microbiol. Biotechnol. 2010, 86, 709–719. [Google Scholar] [CrossRef]
  47. Stein, T. Bacillus subtilis antibiotics: Structures, syntheses and specific functions: Bacillus subtilis antibiotics. Mol. Microbiol. 2005, 56, 845–857. [Google Scholar] [CrossRef]
  48. Hu, C.; Ren, L.; Zhou, Y.; Ye, B. Characterization of Antimicrobial Activity of Three Lactobacillus Plantarum Strains Isolated from Chinese Traditional Dairy Food. Food Sci. Nutr. 2019, 7, 1997–2005. [Google Scholar] [CrossRef] [Green Version]
  49. Bartram, J.; Cotruvo, J.; Exner, M.; Fricker, C.; Glasmacher, A. (Eds.) Heterotrophic Plate Counts and Drinking-Water Safety. The Significance of HPCs for Water Quality and Human Health; IWA Publishing: London, UK, 2003; pp. 1–150. [Google Scholar]
  50. Chopra, A.K.; Houston, C.W. Enterotoxins in aeromonas-associated gastroenteritis. Microb. Infect. 1999, 1, 1129–1137. [Google Scholar] [CrossRef]
  51. Shen, H.; Niu, Y.; Xie, P.; Tao, M.I.N.; Yang, X.I. Morphological and physiological changes in Microcystis aeruginosa as a result of interactions with heterotrophic bacteria. Freshw. Biol. 2011, 56, 1065–1080. [Google Scholar] [CrossRef]
  52. Regulation of the Minister of Health of 17 January 2019 on the Supervision of the Quality of Bathing Water and Places Occasionally Used for Bathing. J. Laws 2019. Available online: https://isap.sejm.gov.pl/isap.nsf/DocDetails.xsp?id=WDU20190000255 (accessed on 10 November 2021).
  53. Dinev, T.; Beev, G.; Tzanova, M.; Denev, S.; Dermendzhieva, D.; Stoyanova, A. Antimicrobial activity of Lactobacillus plantarum against pathogenic and food spoilage microorganisms: A review. BJVM 2018, 21, 253–268. [Google Scholar] [CrossRef]
  54. De Giani, A.; Bovio, F.; Forcella, M.; Fusi, P.; Sello, G.; Di Gennaro, P. Identification of a bacteriocin-like compound from Lactobacillus plantarum with antimicrobial activity and effects on normal and cancerogenic human intestinal cells. AMB Expr. 2019, 9, 88. [Google Scholar] [CrossRef] [Green Version]
  55. Zhao, X.; Yin, Z.; Breukink, E.; Moll, G.N.; Kuipers, O.P. An engineered double lipid II binding motifs-containing lantibiotic displays potent and selective antimicrobial activity against Enterococcus faecium. Antimicrob. Agents Chemother. 2020, 64, e02050-19. [Google Scholar] [CrossRef] [Green Version]
Figure 1. Photo of (a) the anti-spill floating dam assembly and (b) the studied area.
Water 14 00012 g001
Figure 2. (a) Turawa reservoir map and (b) the experimental area map (https://www.google.com/maps; accessed date: 10 November 2021).
Water 14 00012 g002
Figure 3. Changes in (a) water temperature, (b) pH, (c) electrical conductivity, and (d) dissolved oxygen content, in water samples in successive dates of sampling in three measurement points (A, B, C). Different letters (a, b, c) indicate statistically significant differences among sampling dates.
Water 14 00012 g003
Figure 4. Changes in concentration of (a) NO3-N, (b) NH4-N, (c) total phosphorus, and (d) PO4-P in water samples in successive dates of sampling in three measurement points (A, B, C). Different letters (a, b, c) indicate statistically significant differences among sampling dates.
Water 14 00012 g004
Figure 5. Changes in the number of heterotrophic bacteria (HB) incubated in 22 °C, (b) heterotrophic bacteria (HB) incubated in 36 °C, (c) coliform bacteria number and (d) fecal enterococci number in water samples in successive dates of sampling in three measurement points (A, B, C). Different letters (a, b, c) indicate statistically significant differences among sampling dates.
Water 14 00012 g005
Publisher’s Note: MDPI stays neutral with regard to jurisdictional claims in published maps and institutional affiliations.

