
Geomatic-Based Flood Loss Assessment and Its Application in an Eastern City of China


1
State Key Laboratory of Hydrology-Water Resources and Hydraulic Engineering, Nanjing Hydraulic Research Institute, Nanjing 210029, China
2
Nanjing Research Institute of Hydrology and Water Conservation Automation, Ministry of Water Resources, Nanjing 210012, China
3
Research Center for Climate Change, Ministry of Water Resources, Nanjing 210029, China
4
Yangtze Institute for Conservation and Development, Nanjing 210098, China
*
Author to whom correspondence should be addressed.
Water 2022, 14(1), 126; https://doi.org/10.3390/w14010126
Submission received: 16 November 2021
/
Revised: 22 December 2021
/
Accepted: 31 December 2021
/
Published: 5 January 2022
(This article belongs to the Special Issue GIS Application: Flood Risk Management)
Abstract
:Flash-flood disasters pose a serious threat to lives and property. To meet the increasing demand for refined and rapid assessment on flood loss, this study exploits geomatic technology to integrate multi-source heterogeneous data and put forward the comprehensive risk index (CRI) calculation with the fuzzy comprehensive evaluation (FCE). Based on mathematical correlations between CRIs and actual losses of flood disasters in Weifang City, the direct economic loss rate (DELR) model and the agricultural economic loss rate (AELR) model were developed. The case study shows that the CRI system can accurately reflect the risk level of a flash-flood disaster. Both models are capable of simulating disaster impacts. The results are generally consistent with actual impacts. The quantified economic losses generated from simulation are close to actual losses. The spatial resolution is up to 100 × 100 m. This study provides a loss assessment method with high temporal and spatial resolution, which can quickly assess the loss of rainstorm and flood disasters. The method proposed in this paper, coupled with a case study, provides a reliable reference to loss assessment on flash floods caused disasters and will be helpful to the existing literature.
1. Introduction
With the collaborative influences of global climate change and human activity, extreme floods occur frequently, causing tremendous damage to the security of life and property in affected areas [1,2].evere extreme flood events, e.g., the disasters that occurred on 20 June 2021, in Zhengzhou, China, and on 21 July 2012, in Beijing, China, and July 2021 Europe, and September USA, have led to considerable casualties and property losses. EMDAT-CRED statistics show that rainstorms caused disasters account for 43.41% of total disasters in 2008–2018. The Global Risks Report (14th Edition) 2019 released by the World Economic Forum also listed flooding as one of the top global risks [3,4]. Therefore, in addition to flood risk assessment, it is of critical importance to carry out refined flood loss estimation to better support decision making on flood prevention, early warning, and disaster relief [5].
Previous studies have made some achievements on flood risk zoning and assessment. In terms of spatial scale, these research illustrated numerous cases either on the watershed scale [6,7,8], provincial scale [9,10,11,12,13,14], or national scale [15]. However, when it comes to county (or even smaller) scale, due to highly complex requirements on spatial refinement, relevant studies are inadequate.
Previous studies applied tools of cloud models [16], weighted comprehensive evaluation [17], GIS spatial analysis [18,19,20,21,22], prediction of future precipitation patterns [23], and statistical models [24,25]. There is no linear relationship among these studies due to different indicators and scales. Therefore, machine learning is also widely used [26,27]. Most of these studies estimated flood losses based on available cases and empirical evidence [28,29,30,31]. Some researchers have developed integrated systems to assess flood losses with remote sensing, geographic information systems, or coupled hydro-economic models [32,33,34,35]. However, there is a lack of generally applicable methodologies.
After analyzing previous research results and actual situation, we identified some unsolved problems: (1) heterogeneous data from multiple sources are not integrated; (2) the spatial resolution of different types of data varies vastly, and practical approaches to refining small- and medium-scale (city and county level) simulation are rare; and (3) time efficiency remains low.
To address the abovementioned problems, we developed a refined flood loss assessment method on the basis of geographic information integration. It exploits technical advantages of deep fusion of multi-source heterogeneous information and refined space modeling, establishes an index system for risk assessment, and simulates refined assessment factors. Based on the fuzzy comprehensive evaluation (FCE), we calculated the comprehensive risk indices (CRIs) of some historical disaster processes and analyzed corresponding relationships between the CRIs and the actual loss of historical disasters. The direct economic loss rate (DELR) model and the agricultural economic loss rate (AELR) model are established to conduct simulation on flash-flood disaster impacts with high spatial and temporal resolution.
2. Data and Methods
2.1. Data Source
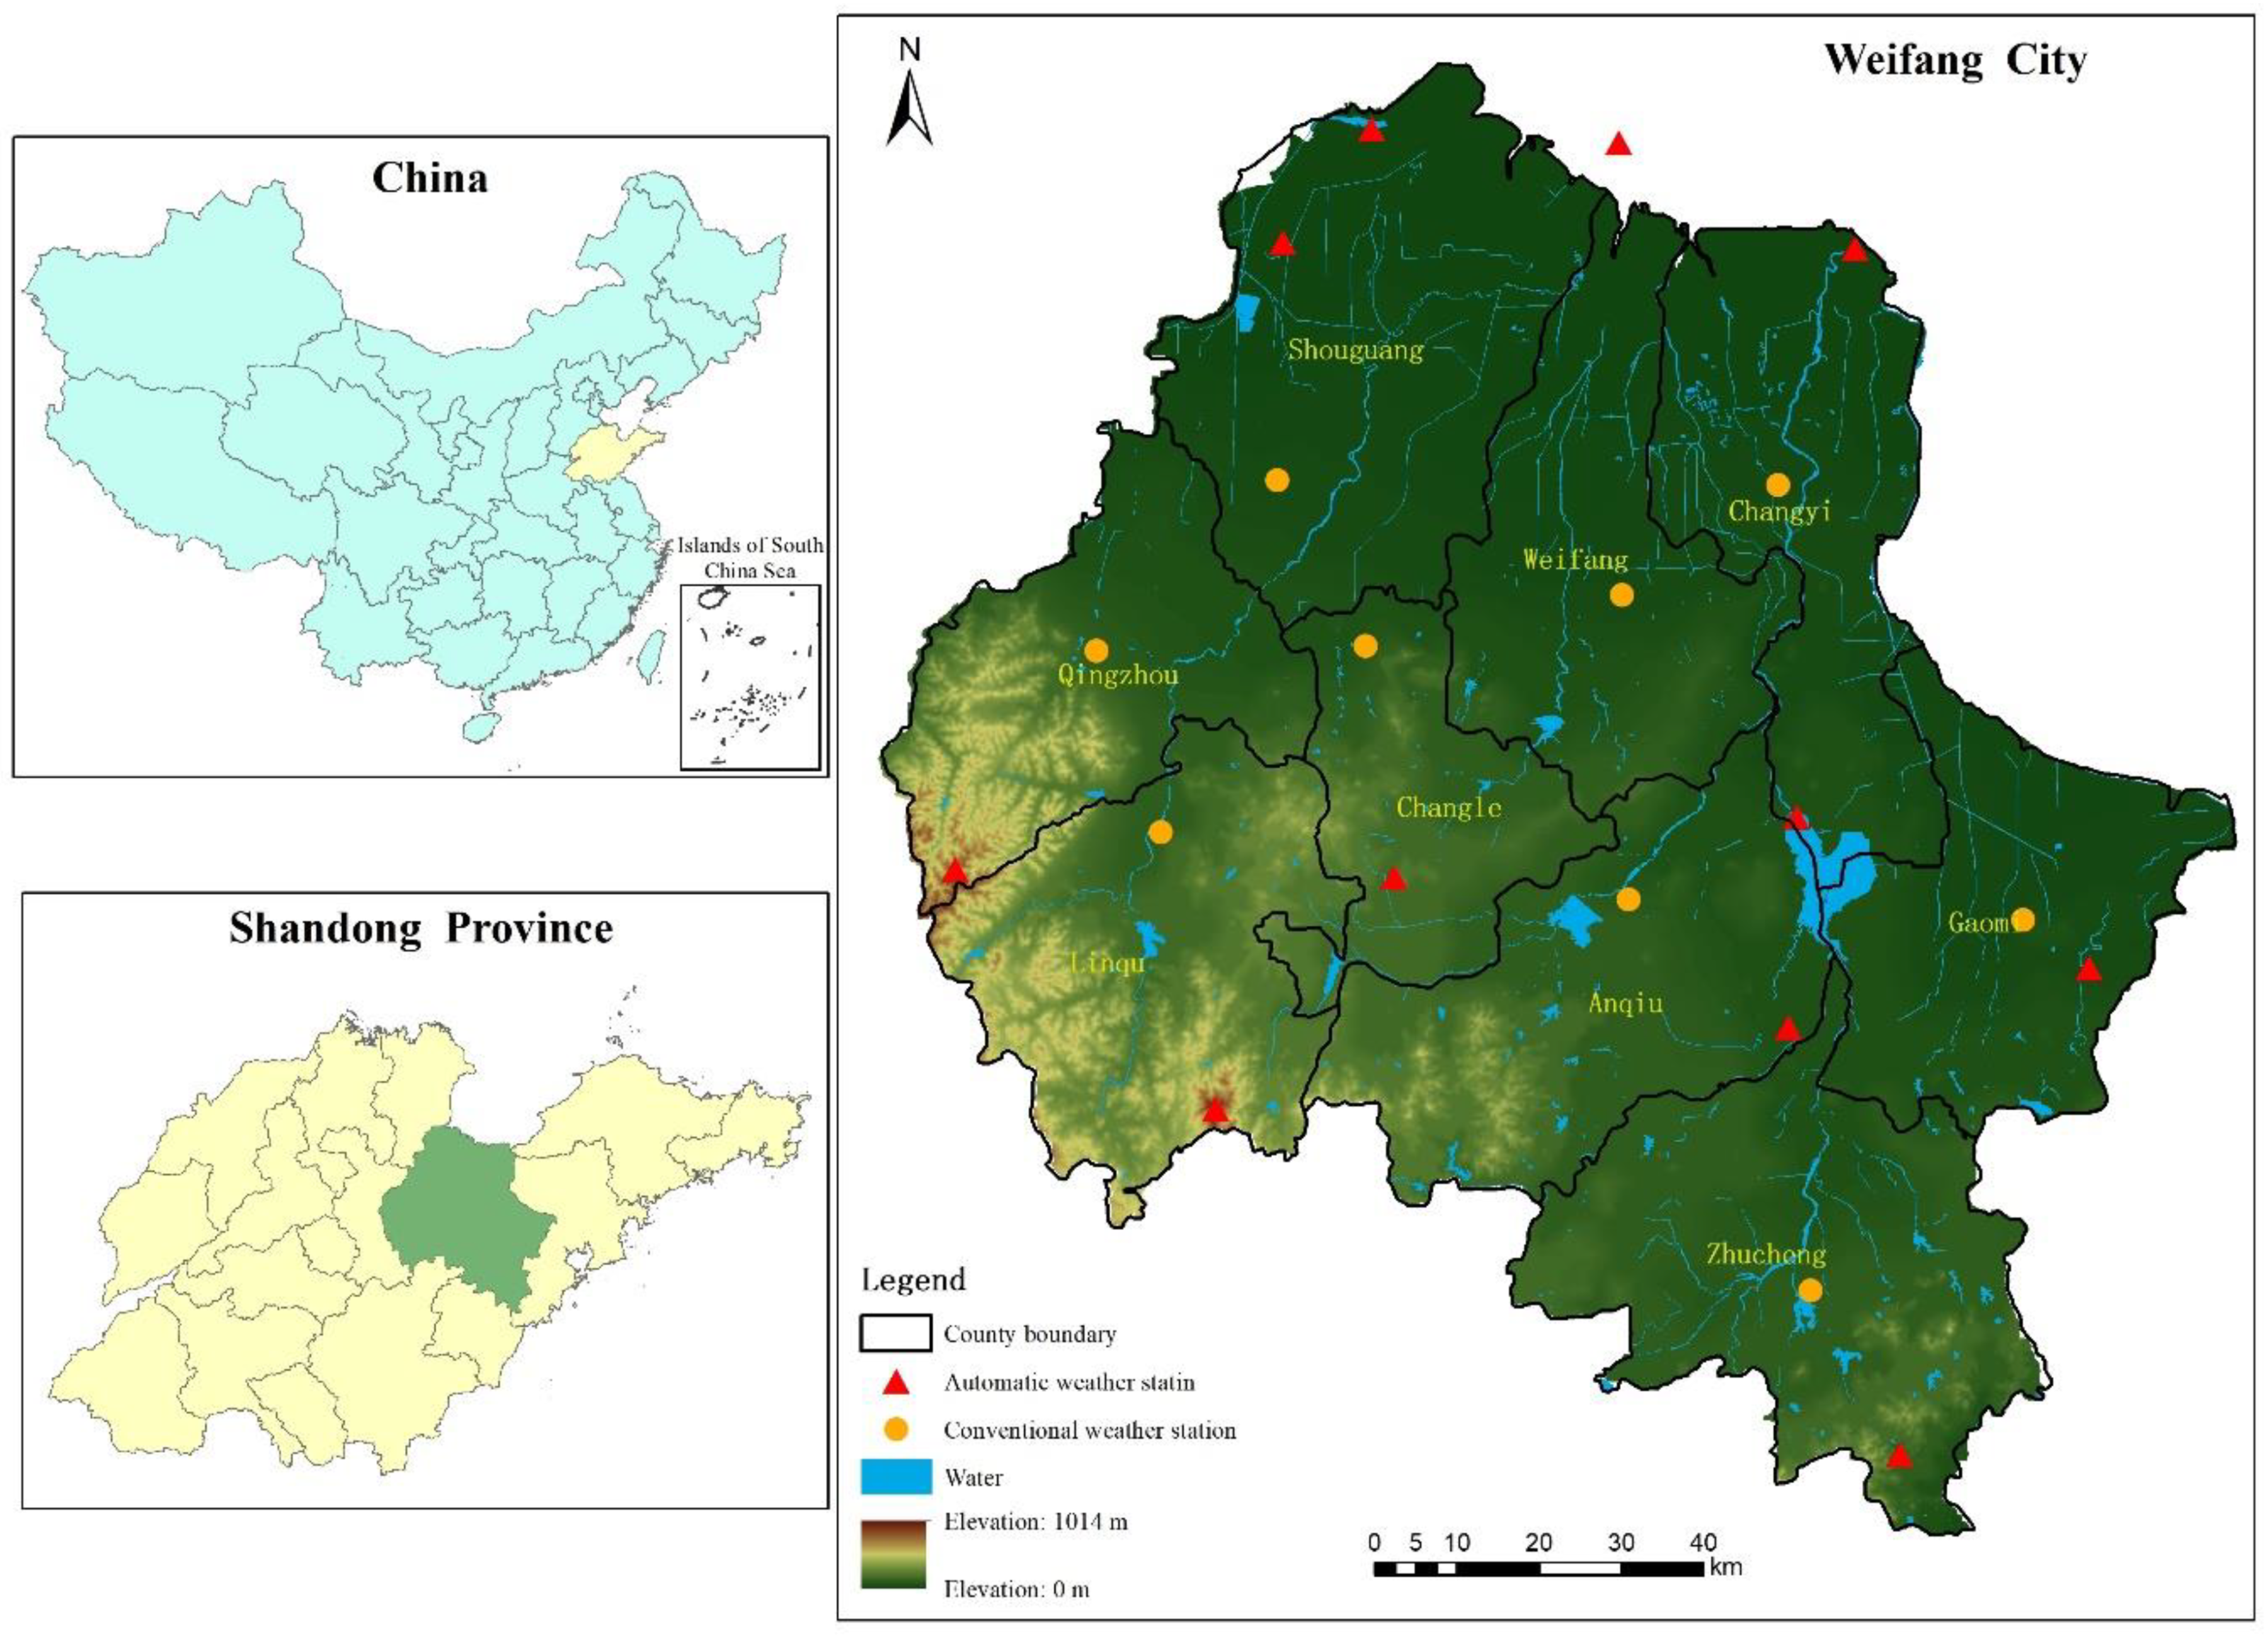
We drew Weifang City of Shandong Province in case study. As shown in Figure 1, Weifang is located in the west of Shandong Peninsula, spanning 118°10′–120°01′ E and 35°41′–37°26′ N, and adjacent to the Laizhou Bay of Bohai Sea in North. Lying in the semi-humid continental zone, Weifang has warm and temperate climate and monsoon, with average annual temperature of 12.3 °C and average annual precipitation of 650 mm. The city is low in North and high in South where small mountains and hills ranging through an area of 15,646 km2, 35.6% of the city. Diluvial and alluvial plains in the center occupy an area of 6597 km2, 41.6% of the city. The coastal North, typical of extensive stretches of shoal, covers 3516 km2, 22.8% of the total area.
In this study, we collected various types of data for flood loss assessment. The first type is fundamental geographic data that (1) can describe administrative boundaries on district, town and village scales, (2) are generated from the digital elevation model (DEM) with a 30-m resolution, and (3) can define reservoirs, lakes and rivers, roads, vegetation, buildings, and land-use.
The second type of data is meteorological, including daily precipitation measured by the Weifang National Station from 1984 to 2018. These data were sourced from the Weifang Meteorological Bureau. We extracted daily precipitation, average temperature, relative humidity, and other major variables from each weather station, eliminated abnormal values, conducted data preprocessing, and obtained qualified data in line with our requirements.
The third type of data come from historical documents reflect disaster impacts and prevention and mitigation measures. From 1984 to 2007, Weifang registered 40 rainstorms-induced flood events. We selected 33 flooding processes with detailed records. The records include the occurrence of events and resulting casualties, crop loss, and property loss. The information related to disaster prevention and mitigation reveals latent flood risks in vulnerable spots, disaster relief supplies inventory, and capacity of temporary shelters.
The last type of data is associated with society and economy, mainly indicators from the Weifang statistical yearbook of 2019, such as populations and land areas of counties and the city, GDP and outputs of industry, agriculture, and services.
In addition, national standards, local standards, and various network resources are referred to in this study.
2.2. Methodology
2.2.1. Risk Assessment Index System
Based on the forming mechanism of those risks that evolved into meteorological disasters [36,37], this paper selects flash flood CRIs from four perspectives: triggering causes, enabling environment, affected objects, and prevention and mitigation capabilities.
We sifted through nearly 20 indicators, such as 2-day maximum precipitation, maximum precipitation of a raining process, extreme values of total precipitation, duration (in days) of a rainstorm event, daily average precipitation and daily maximum precipitation during a rainstorm event, population, GDP, arable area of affected zones, distribution of water bodies, topography of affected zones, vegetation coverage, number of shelters, sluice and pumping stations, and distribution of medical care services. We analyzed their impacts on and correlations with flash floods, respectively, and their interrelations, in which way factors with overlapping contributions to CRI calculation were eliminated to reduce uncertainties caused by excessive or similar factors. Ten evaluation factors eventually constitute the flash flood CPI system. They are duration (in days) of a rainstorm event, 2-day maximum precipitation, extreme values of total precipitation, topography indicators of affected zones, density of water bodies, vegetation coverage, population distribution, GDP of an affected zone, number of shelters, and distribution of medical aid services.
We developed models with GIS and simulated evaluation factors, so as to improve the accuracy of CRI calculation and the resolution of spatial loss distribution. With the adoption of spatial interpolation, buffer analysis, and some mathematical equations [38], we conducted spatial model fitting of data and arranged them into separate combinations for the 10 factors on grid layers (100 × 100 m resolution). These refined data are for CRI calculation and disaster loss estimation.
2.2.2. CRI Calculation Based on the Fuzzy Comprehensive Evaluation (FCE)
Rainstorms caused flood disasters are critically complex, attributed to interactions between socio-economic systems and nature. All varieties of causes need to be considered during CRI calculation, and the process for each one involves objective and subjective uncertainties. The evaluation system proposed in this paper, based on the fuzzy comprehensive evaluation (FCE) [39], calculates CRIs across a flooding process, with the consideration of transitional variation of values, and various importance of factors. We quantify different perspectives on a complex issue in an attempt to avoid subjective assumption. The task consists of following steps.
The CRI calculation process adopts the guard-down membership function [40]. In order to determine the membership function, the determination of evaluation matrix and the weight of impact factors are used to prepare for CRI calculation.
There are n rainstorm and flood disaster processes waiting to be evaluated, and the disaster impact is evaluated by m factors. The evaluation set of each factor is , 1, 2,…m; thus, m influence factor evaluation matrix can be obtained. The comprehensive evaluation matrix can be expressed as the following equation.
After constructing the evaluation matrix by the guard-down membership function and the weighting coefficients of each influencing factor are obtained by using analytic hierarchy process on the basis of weighted average programming method, the comprehensive evaluation index set B can be obtained from the fuzzy transformation principle.
where B represents the fuzzy comprehensive evaluation index set of n disaster process events, and the higher the evaluation index value is, the more serious the disaster is. is the weight set of impact factors, is the disaster evaluation matrix, and is a generalized fuzzy operator. We use the weighted average model to calculate.
where, , , is the fuzzy comprehensive evaluation index of the jth disaster event. depends on the selection of factor u.
2.2.3. Loss Assessment Methods
CRIs can describe the risk level of a rainstorm process, through which the magnitude of disasters can be inferred in a qualitative manner. However, without knowing the correlation between CRIs and economic losses, we cannot quantify impacts of disasters. Fortunately, actual consequences of previous flood disasters can be found in available historical documents. Quantitative samples are also abundant. This paper attempts to identify the correlation between the CRI and direct economic loss rate (DELR) and the the correlation between the CRI and agricultural economic loss rate (AELR). Based on corresponding mathematical relationships between CRI values and specific losses in the process of a rainstorm, we can calculate DELR and AELR indirectly. The equation is as follows:
In Equations (4) and (5), g1 (CRI) and g2 (CRI) are the calculation functions of DELR and AELR, respectively. During the calculation of loss rates, in order to reduce the impact of inflation on the assessment, the economic indicators and the actual values of economic loss from historical disasters are revised according to the price level of 2019.
3. Results
3.1. CRI Calculation and Analysis
We selected 33 flash flood samples from 1985 to 2007 in Weifang City in terms of arrival and departure time of an event as well as affected areas. From records of these events, based on statistical methods, we conduct correlation analysis and similarity analysis on more than 40 factors affecting rainstorm and flood and eliminate the factors with small influence rate and similar sharing degree. Finally, we abstracted three trigging factors: duration (in day) of a rainstorm event, 2-day maximum precipitation, extreme values of total precipitation, and the seven relevant factors of topography features of affected zones, density of water bodies, vegetation coverage, population distribution, GDP of an affected zone, number of shelters, and distribution of medical aid services. According to Equation (1), we established a disaster membership function and a FCE matrix. We calculated the evaluation factors’ contributions to the disaster and determine their impact weight coefficients, respectively, using a combination of weighted average planning and hierarchical analysis, as shown in Table 1.
Table 1 reflects all evaluation factors’ contributions to the CRI system through their weight coefficients and compares their importance. The most relevant factors rank high, followed by socio-economic conditions bearing risks, and geophysical conditions brewing risks, while disaster prevention and mitigation measures rank low. The result is generally consistent with theories related to causes and processes of flash flood disasters and empirical evidence.
After establishing the evaluation matrix with the membership function and determining the weight coefficient of each evaluation factor, Weifang flash flood CRIs derived from Equations (2) and (3) are shown in Table 2.
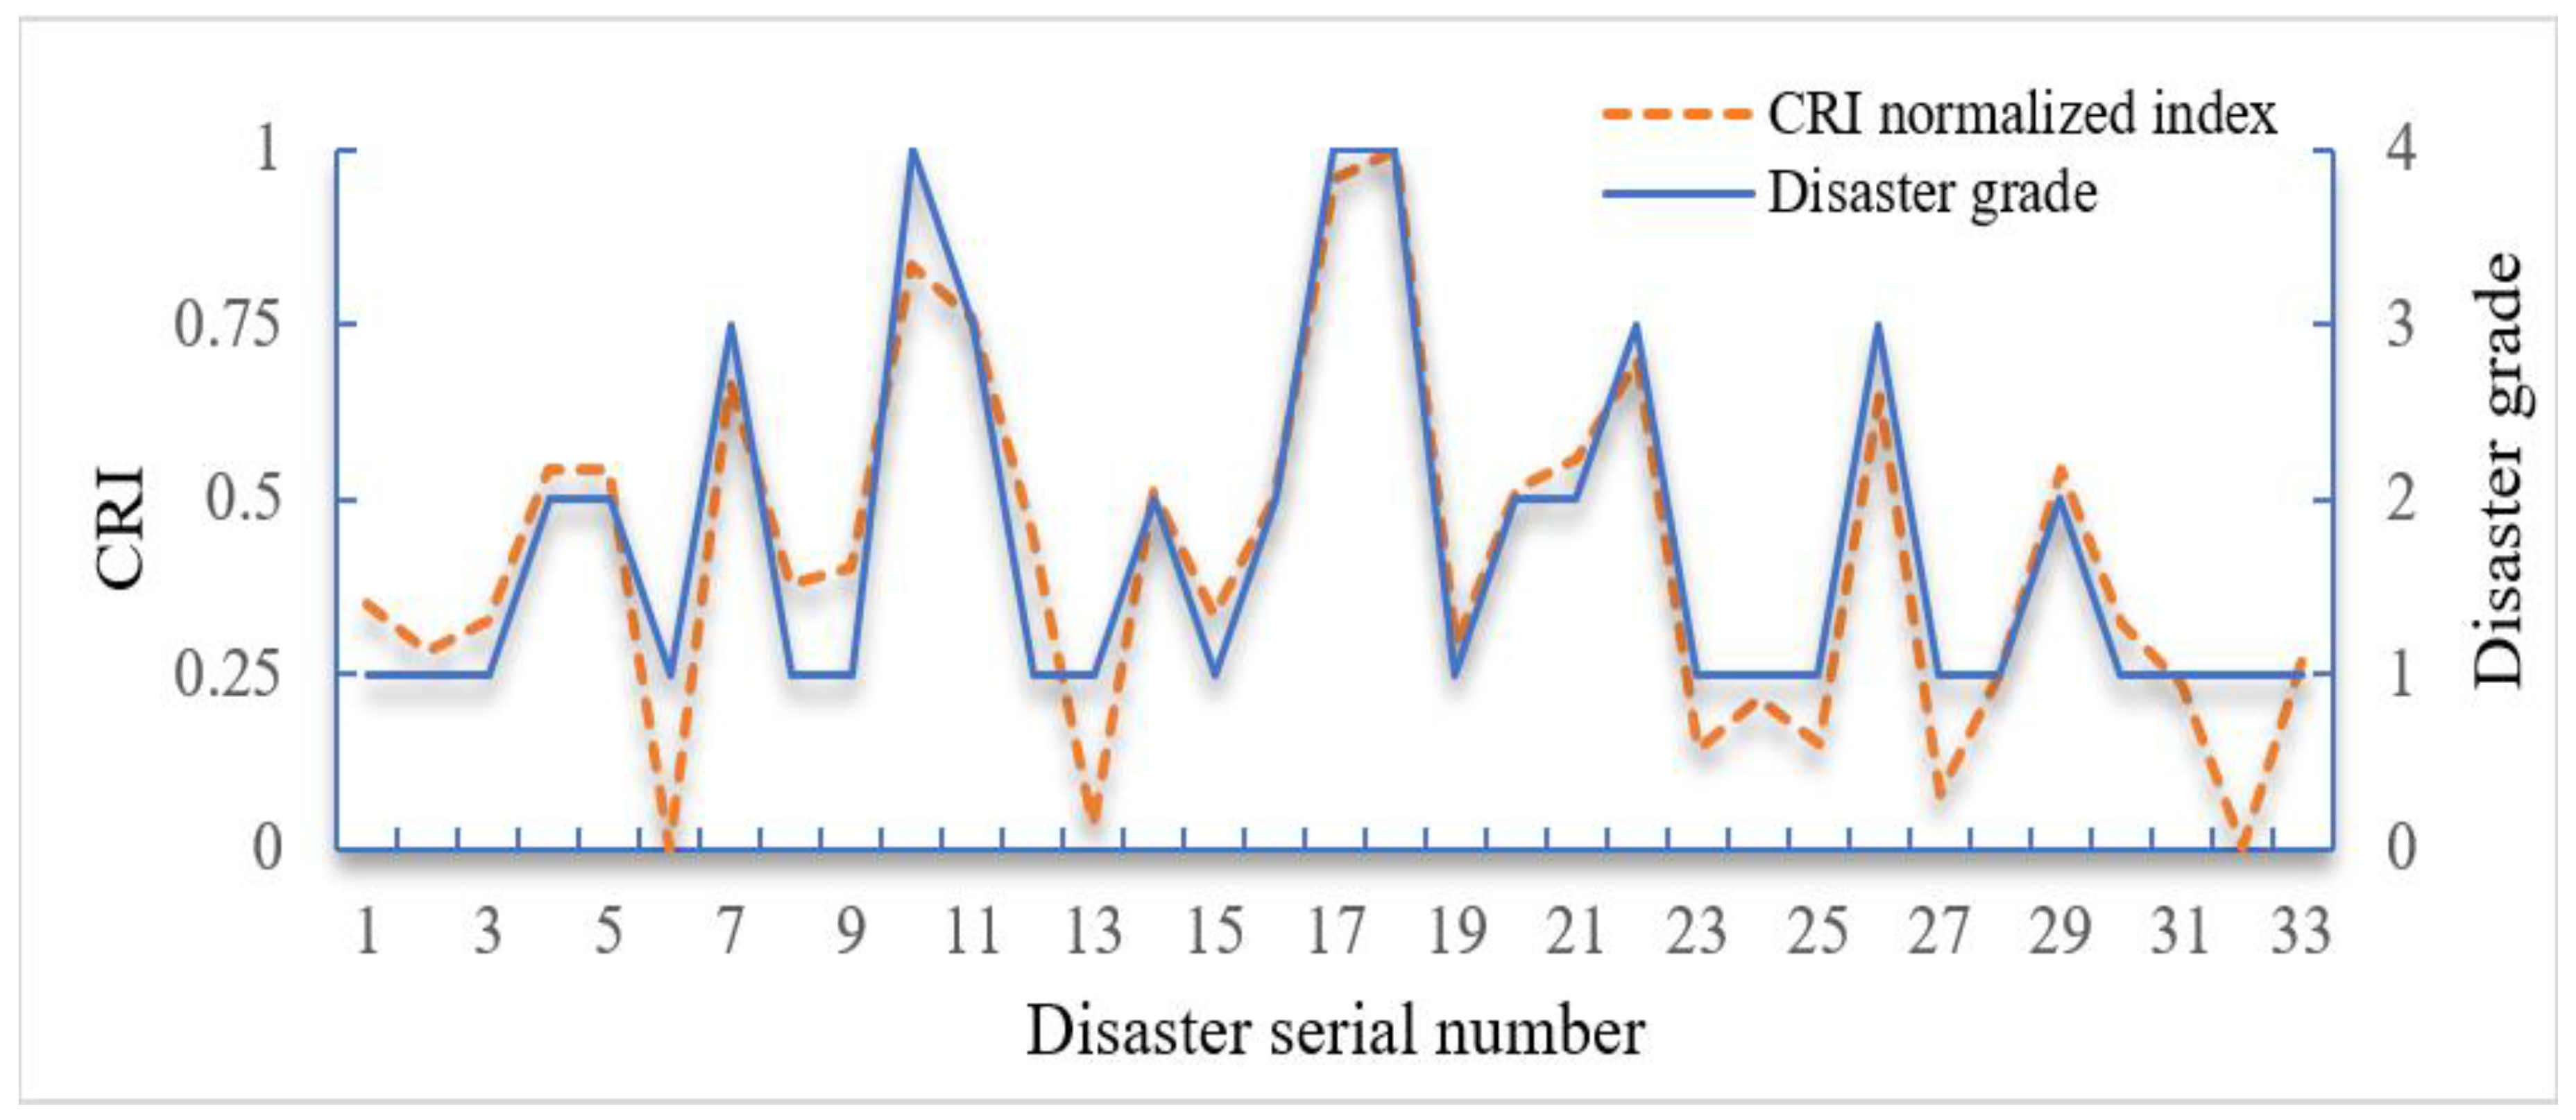
Based on figures on record and with the help of optimal segmentation, actual impacts of 33 disasters were classified into four grades [41]: critical (Grade 4), high (Grade 3), medium (Grade 2), and low (Grade 1). After normalizing CRIs, we compared the simulated severity of disasters with actual severity, and found they were generally consistent. As shown in Figure 2, the accuracy of CRI and actual grade of rainstorm and flood process with disaster serial numbers of 5, 7, 9, 11, 14, 16, 18, 19, 20, 22, 28, 30, and 32 are significant, while the accuracy of 6, 8, 10, 12, 23, 24, 27, and 31 are not significant. Therefore, the CRI system based on FCE is proved to be able to estimate risks for a disaster process.
3.2. Direct Economic Loss Rate (DELR) Model
Rainstorm and flood disasters cause material inundation or moisture damage, which will directly cause economic and property losses. After establishing the direct economic loss rate (DELR) index system, we selected 33 historical disasters caused by heavy rainfall in Weifang City from 1985 to 2007 and extracted 31 pieces of record that registered direct economic losses. We divided them into two categories: (1) 28 pieces as samples for analysis and (2) three pieces as validation. We used FCE to calculate CRI for the 28 samples, respectively. Based on the loss data of historical disaster statistics,, we evaluated DELR for each disaster process. The correlations between CRIs and DELRs for 28 samples are shown in the following figure.
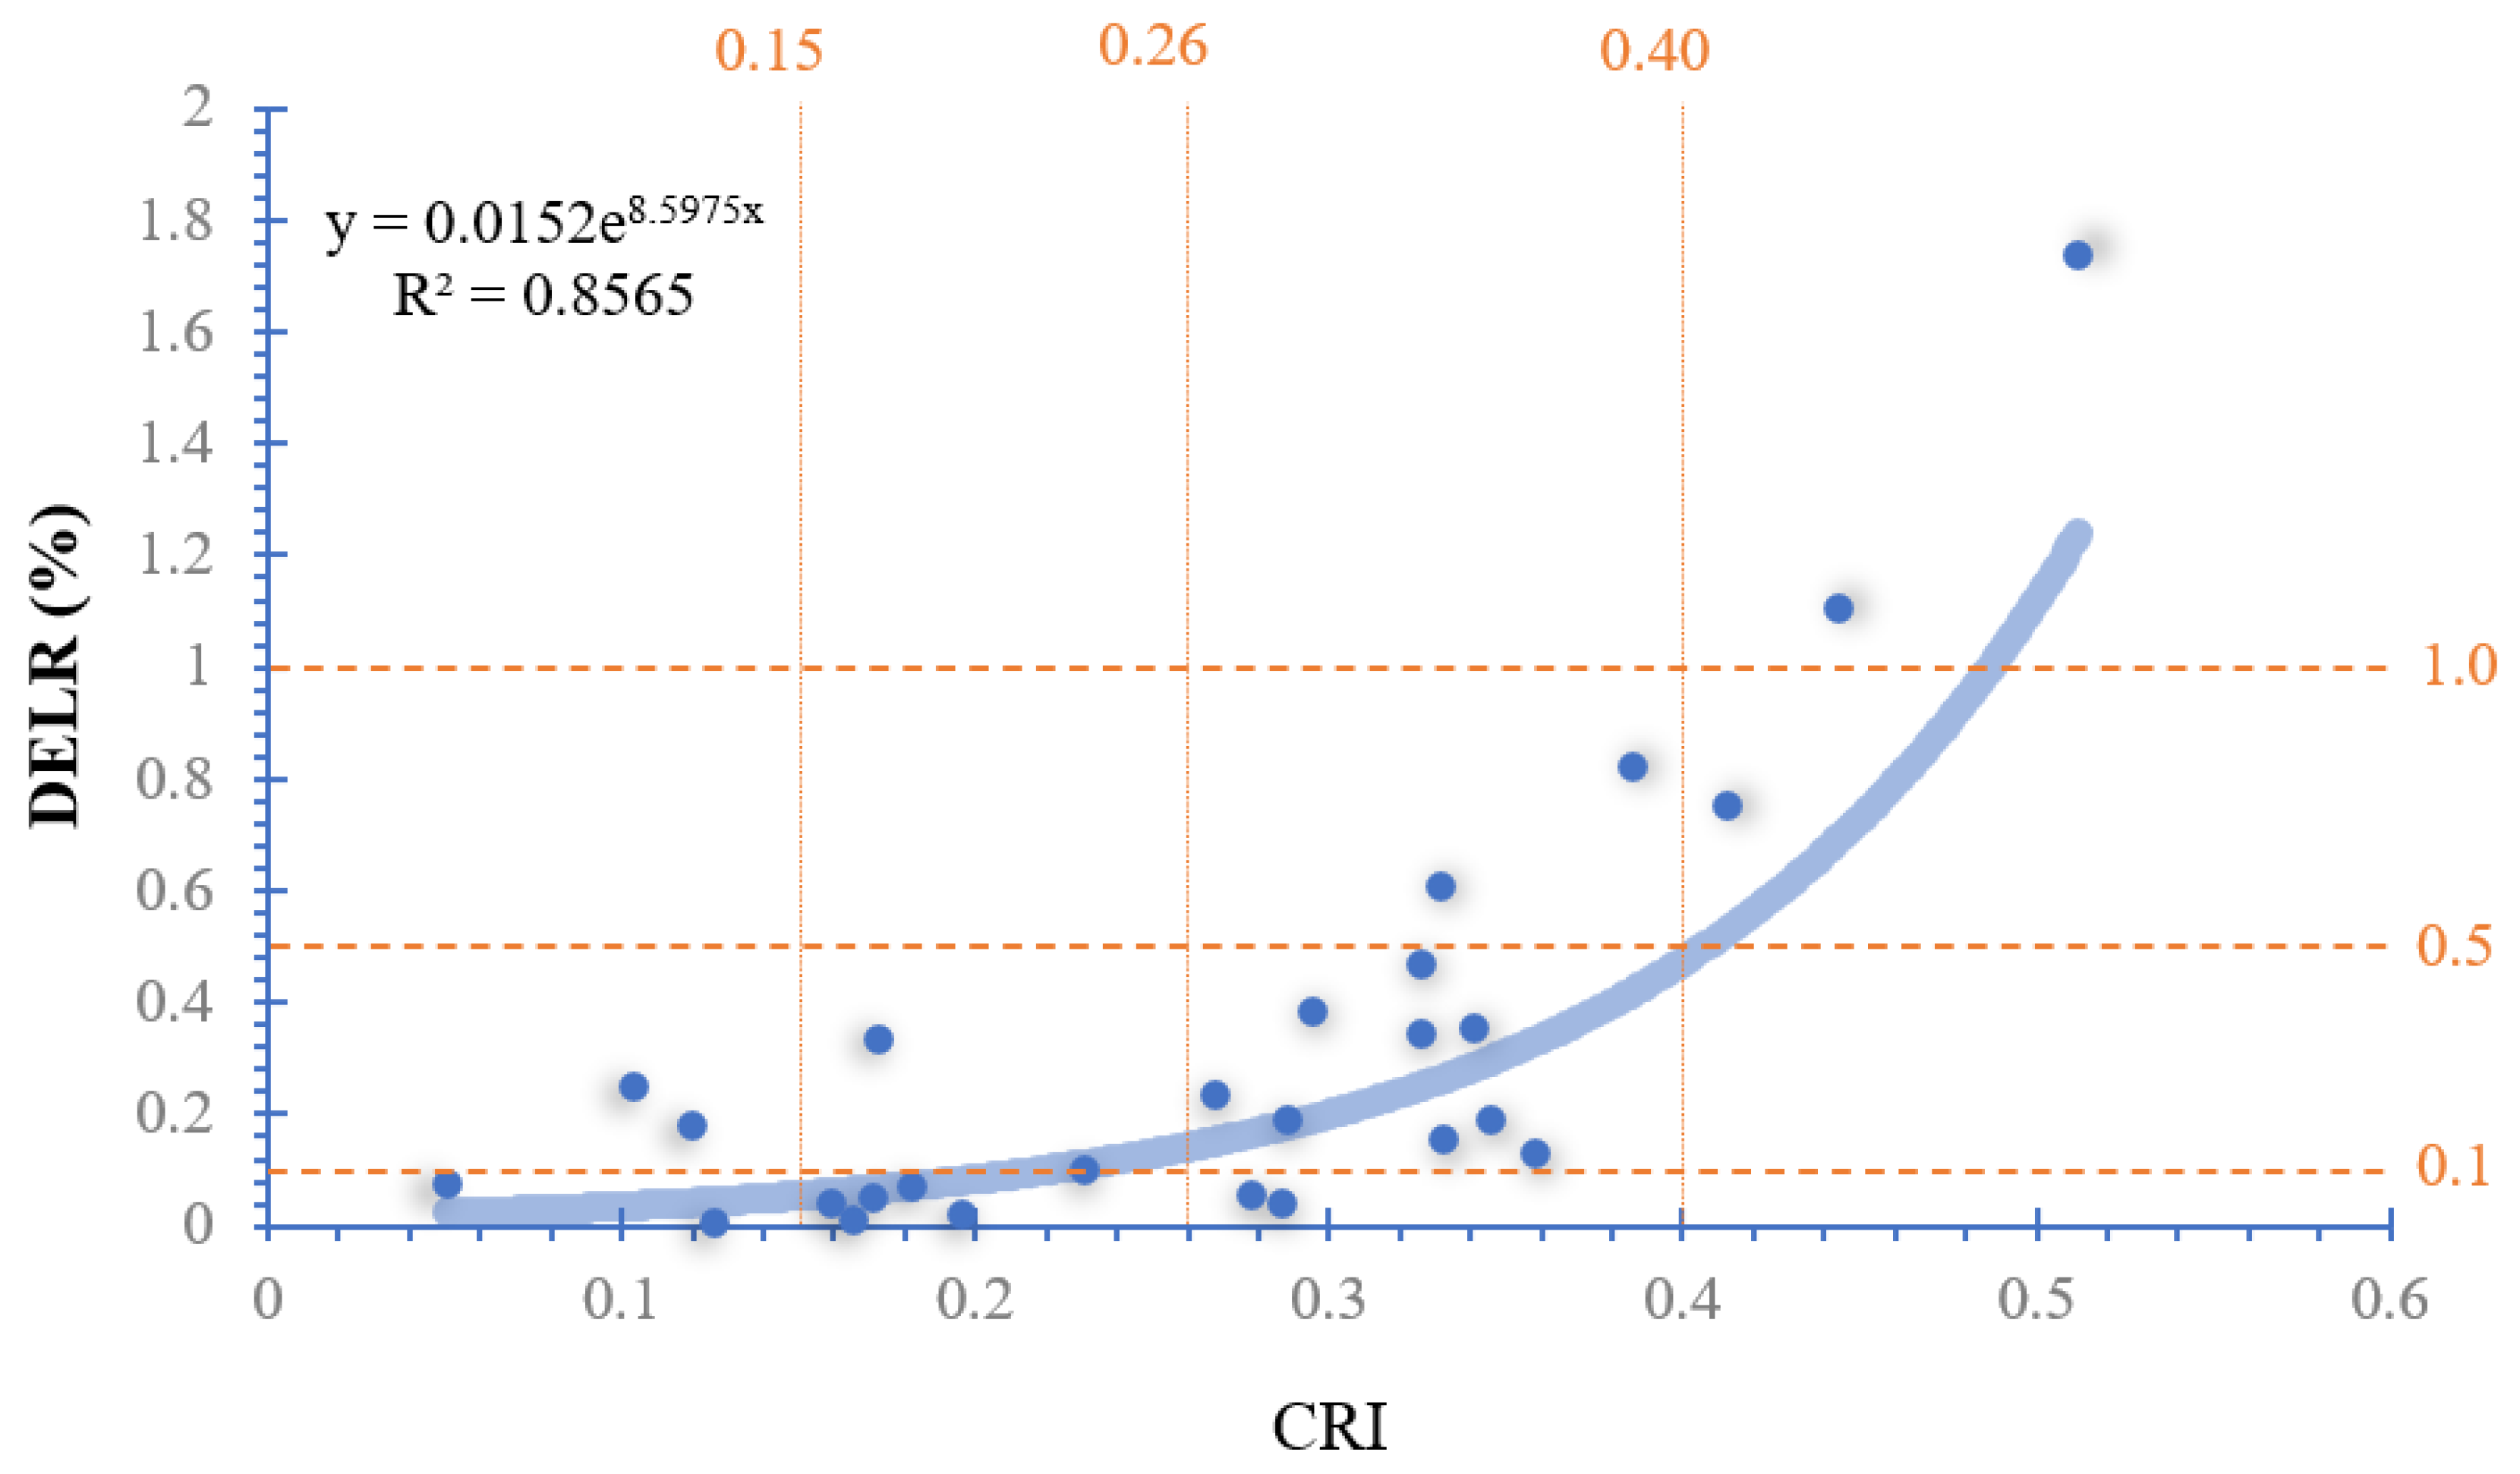
Figure 3 shows that coefficient R2 representing the correlation between CRIs and DELRs reaches 0.8565 at its highest level. Overall, the CRI values vary from 0 to 0.5, and DELR values are mainly below 2%. By comparing them, we found CRIs and DELRs are distributed differently (Table 3).
Table 3 indicates that (1) when CRI values are within the interval of 0 to 0.15, DELR values are concentrated in the interval of 0 to 0.1%, which indicates that lower severity of disasters leads to lower DELR. (2) As the intensity of flooding rises, CRI values vary from 0.15 to 0.26. Correspondingly, DELR values change from 0.1% to 0.5%. (3) As the impact of disaster escalates further, CRI values are in the interval of 0.26 to 0.4, and DELR values surge into the interval of 0.5–1.0%. (4) Samples with CRIs higher than 0.4 are rare, implying that severe rainfall disasters seldom occurred in the region investigated. However, the corresponding DELR soars to nearly 2% at its highest.
In summary, the CRI of heavy rainfall caused flooding in Weifang has a good exponential correlation with DELR. Their correlation is consistent with the variation of real losses caused by different severities of disasters. It quantifies the correlation between the CRI and DELR in a relatively objective way. The simulation equation for this quantifying process is as follows.
where denotes the rate of direct economic loss from heavy rainfall caused flooding. is rainfall and flooding CRI. As a result, once the CRI of a flooding process is determined, the DELR caused by this process can be estimated.
3.3. Agricultural Economic Loss Rate (AELR) Model
In all flood disasters registered in Weifang, 21 have records regarding agricultural economic loss. We extracted 18 of them as samples, with the remaining three for validation. The AELR of each disaster process was calculated based on the loss data of historical disaster statistics. Then, we developed a model by combining flash flood CRIs and AELRs of disaster samples together to analyze their correlation.
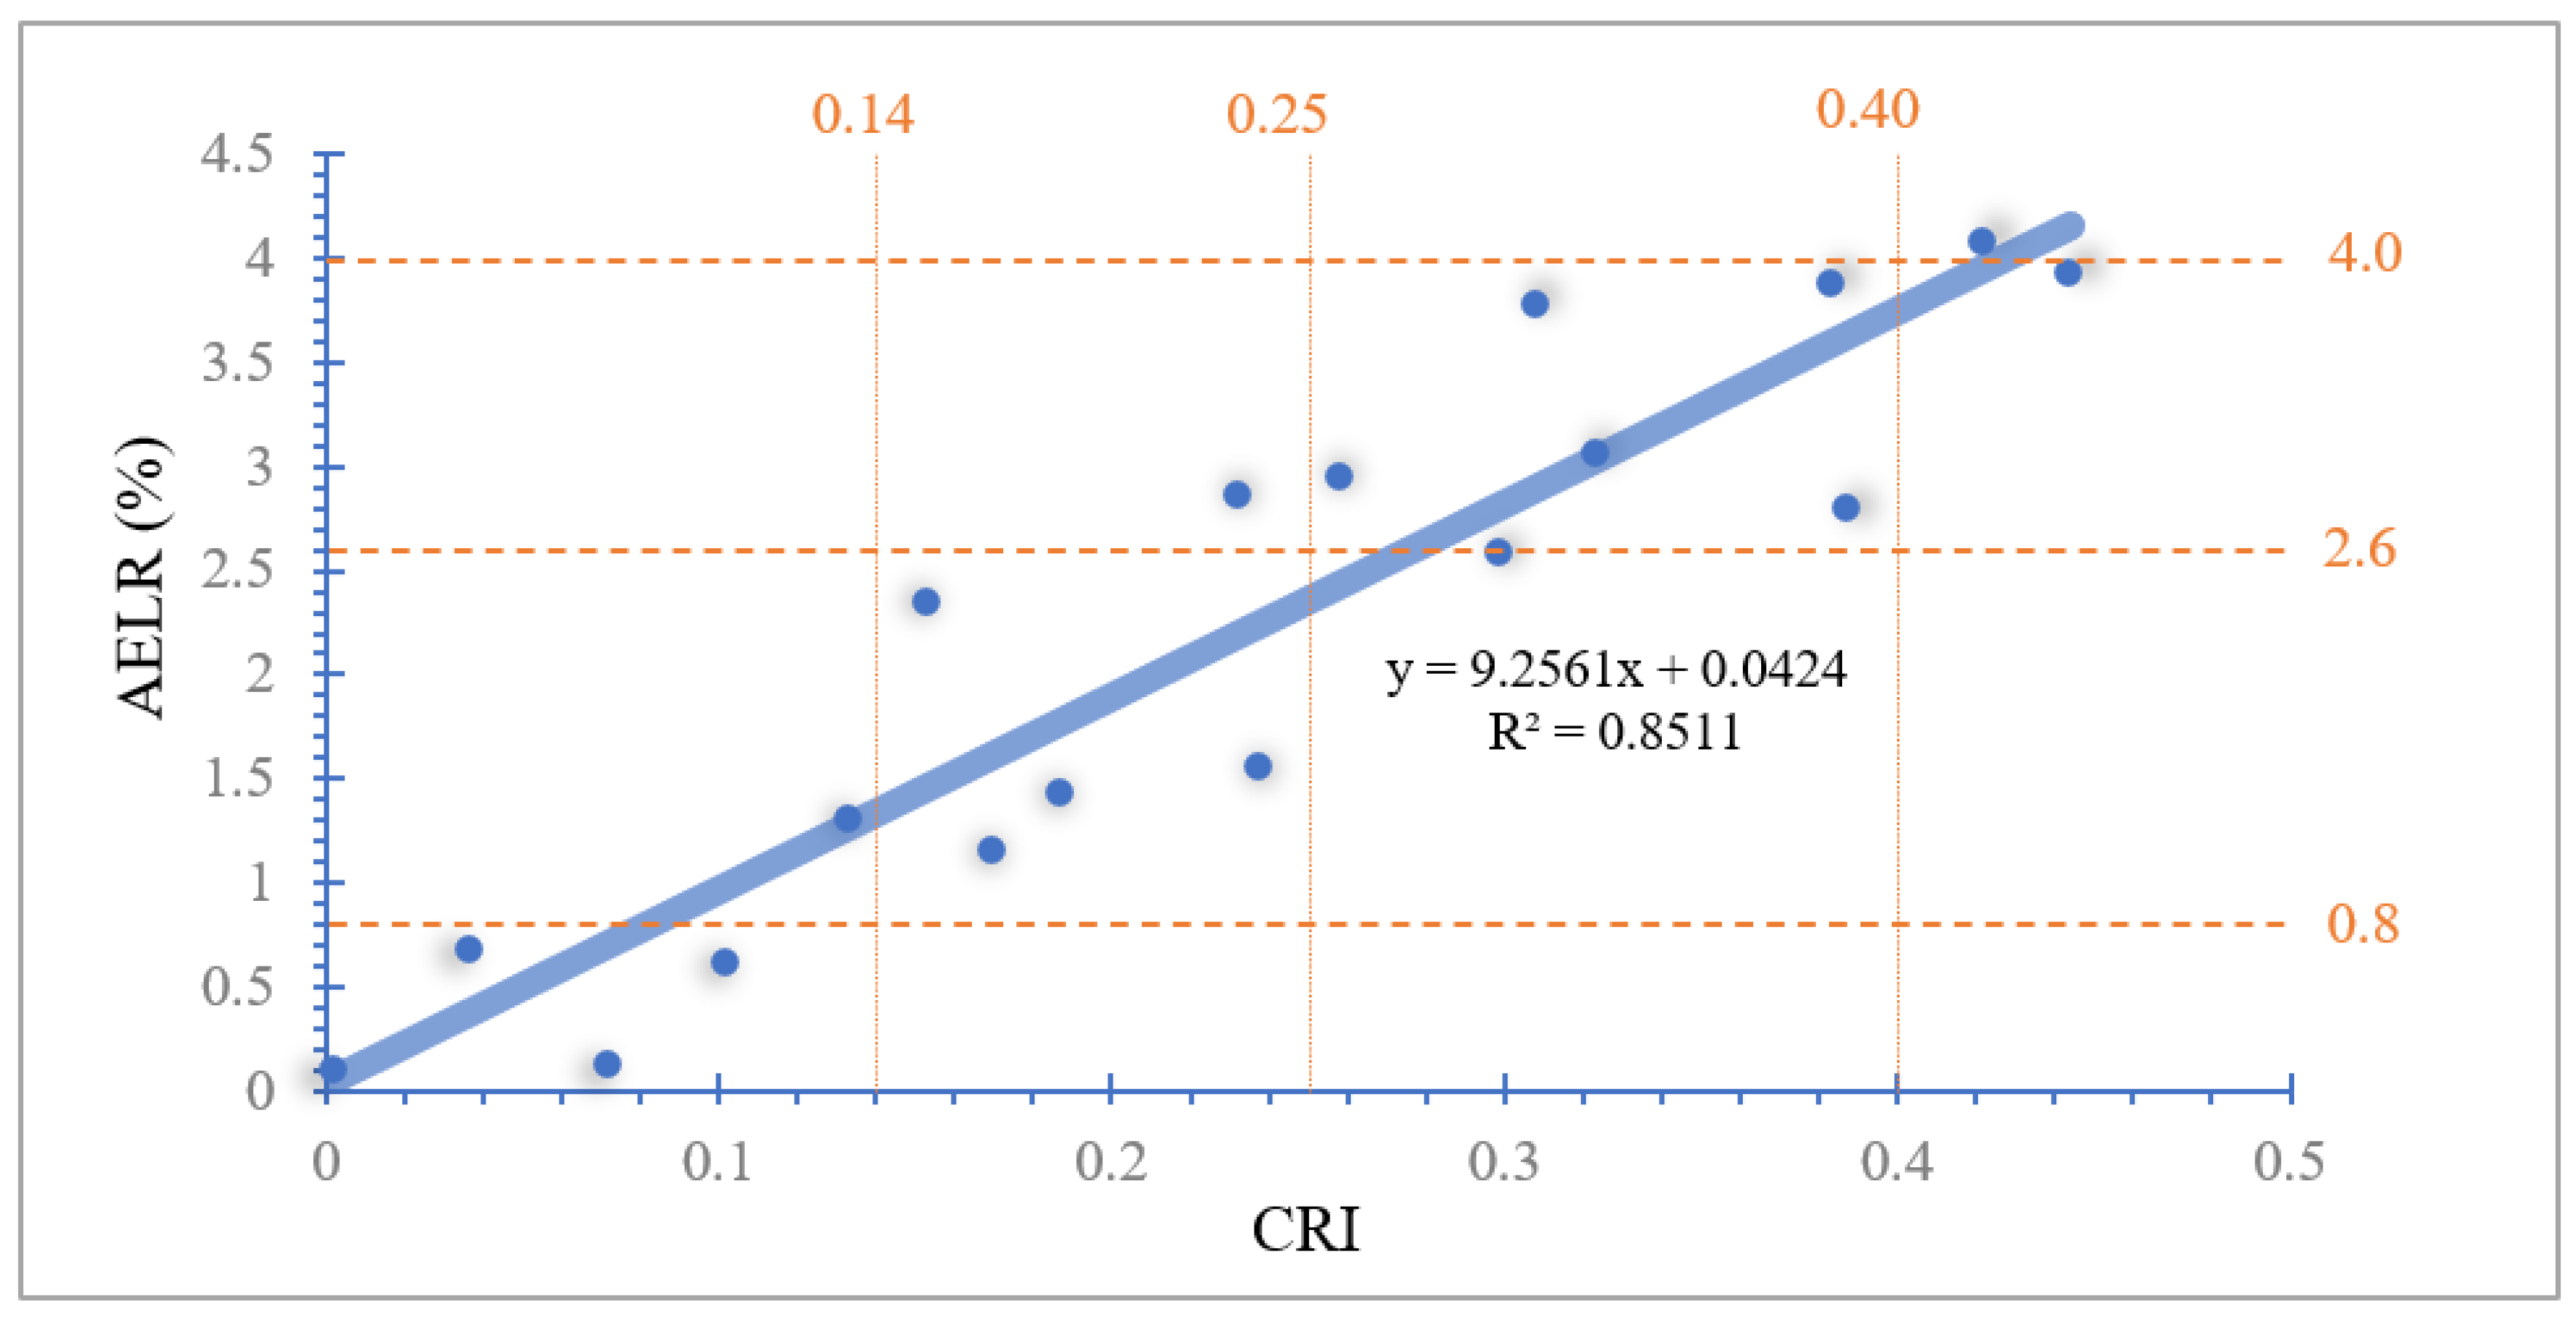
As shown in Figure 4, coefficient R2 representing the correlation between CRI and AELR reaches 0.8511, depicting a consistent linear correlation. Generally, the CRI intervals are distributed from 0 to 0.5, and AELR intervals are between 0% and 4%. As CRI increases, AELR rises steadily with the gradient of 9.2561. The increase rate is moderate.
Similar to DELR, values of AELR are distributed in four distinct intervals, as shown in Table 4. At first, CRI values concentrate within the interval of 0–0.14, where AELR values are evenly distributed from 0% to 0.8%, except for very few samples with CRI higher than 0.4. As CRI rises, AELR follows and even mounts to 4% at its highest. However, the increase rate of AELR values is smooth. In the case study, the linear correlation between Weifang flash flood CRI and AELR is consistent and authentically identified. The simulation equation is as follows:
where, denotes AELR from flash-flood disasters. is flash-flood CRI.
3.4. Validation of Assessment Results
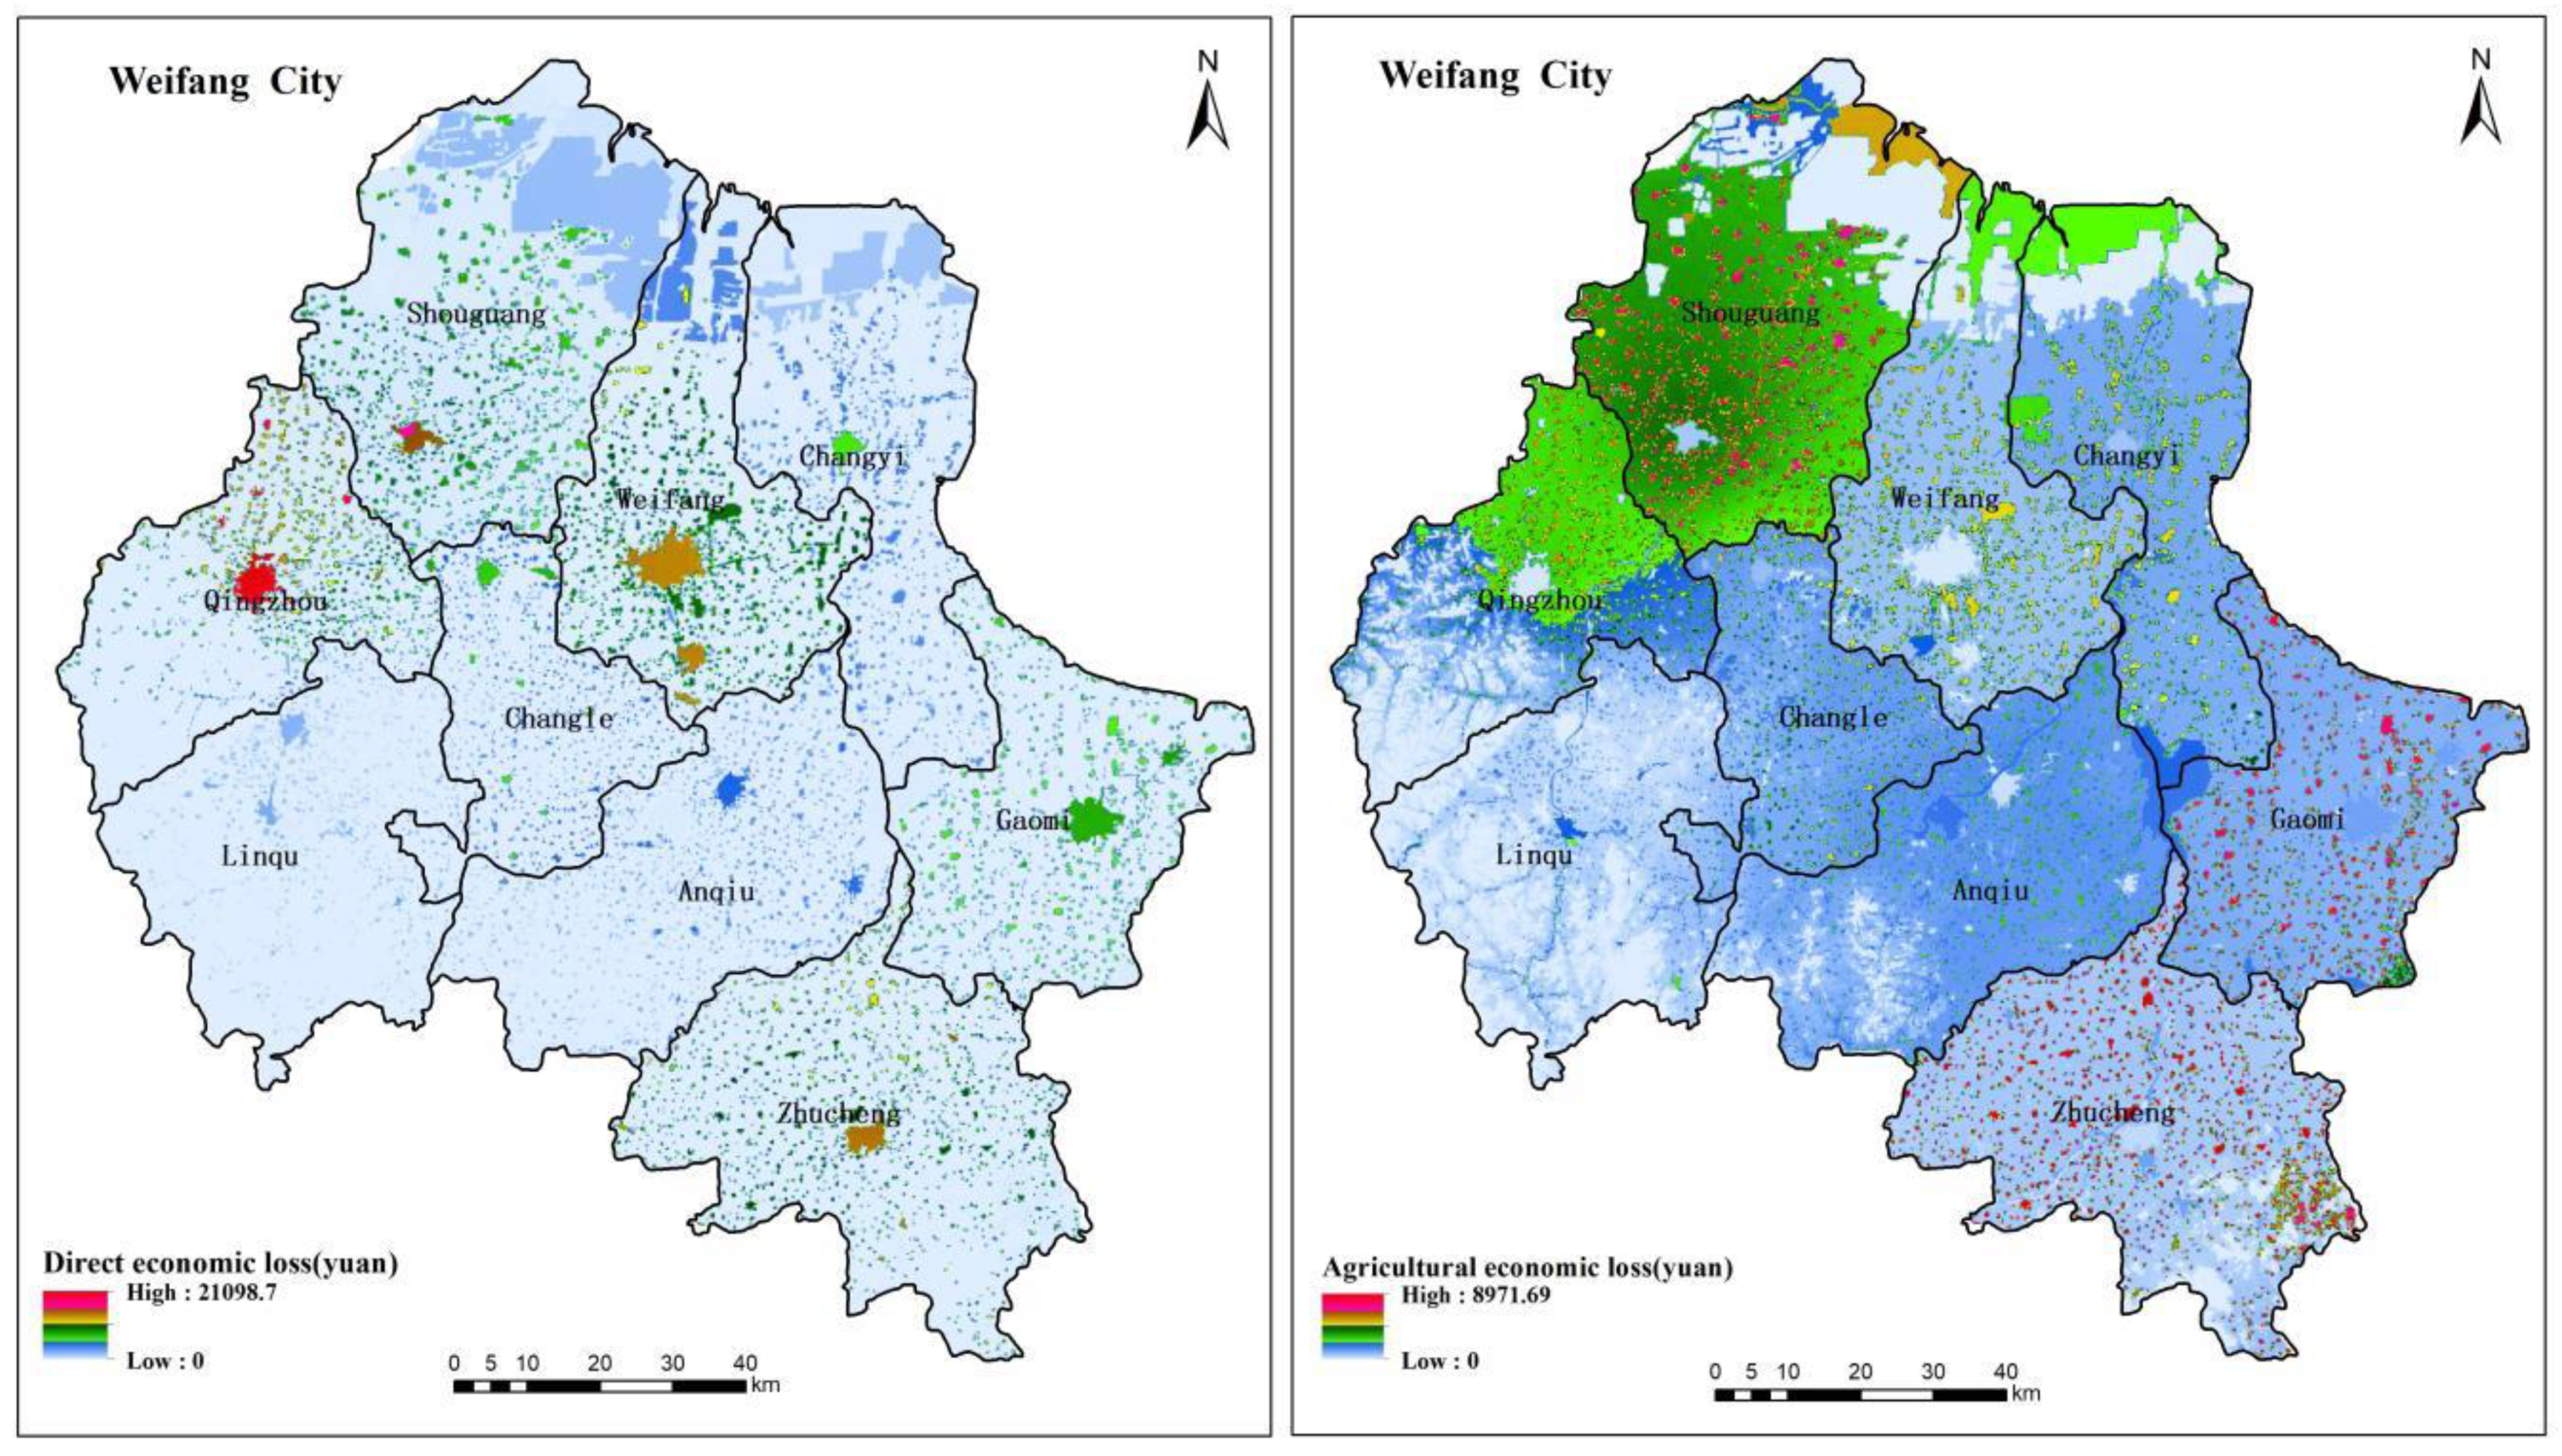
We selected a rainstorm cased flood took place in Weifang on 10 August 2007 to calculate its CRI, and then estimated DELR and AELR for the affected zone. We overlayed both results, respectively, with the spatialized value of 2019 GDP of Weifang and calculated specific losses of this rainstorm process. The spatial distribution of economic losses is shown in Figure 5. Then, we used GIS to identify the boundaries of the affected town and extracted historical records related to actual direct economic loss and agricultural economic loss in the target area. Then, we compared the estimated results with actual figures and conducted error analysis. The statistics are shown in Table 5.
The models developed in this research have authentically simulated the severity of this rainstorm process and generated quantitative losses. The spatial distribution of damage is generally consistent with the actual landscape. The relative errors of DELR values for three affected regions are all less than 30%. Among them, the lowest relative error of 9.8% was derived from Wenjia, Luocheng, Daotian, and Tianliu in Shouguang City. Additionally, the relative error of DELR values in Qingzhou City is the highest, up to 26.51%. The lowest relative error of AELR (compared with statistics) is 15.37%. However, for Shouguang City, that figure is 21.29%, which is relatively high. Due to the lack of agricultural records for this rainstorm in Qingzhou, we could not conduct data simulation and error analysis for the city. In general, differences between the simulated results of DELR or AELR and actual losses are small and manageable. Therefore, the loss rate models built on the relationship between CRI and loss rate proposed in this paper are proved to be reliable.
4. Discussion
Drivers of a flash flood event can be dizzyingly complex, leading to uncertainties in comprehensive flood assessment systems. The extreme floods events that occurred in Beijing on 21 July 2012 caused a total of 79 deaths, affected 1.602 million people, and caused 11.64 billion yuan in economic losses. In September 2021, the rainstorm caused by Hurricane Ida killed at least 60 people and caused serious economic losses in eight states of the United States. In July 2021, continuous rainstorms triggered floods in Europe and Zhengzhou, China, washed away a large number of houses and roads, interrupted communication, and caused heavy casualties and property losses. It can be found from these disaster events that the number of extreme rainstorm events increases, and the impact is greater. Especially for the sudden disaster events in local small-scale space, the public’s request for time-efficient and highly accurate methods has never been so urgent.
This paper provides a refined assessment approach based on geomatic technology, which has obtained a reliable calculation on flash flood CRIs in Weifang City. The models proposed in this paper can quantify the DELR and AELR in a dynamic way. Compared with the current study results, it has the following characteristics.
Firstly, geomatic technology was used for fusing big data covering basic geographic conditions, meteorological variables, historical materials of disasters, and socio-economic status. They are derived from remote sensing by satellites, observed with facilities in ground stations, or collected by manpower. Spatialized simulation on affected zones is aimed to address difficulties in comprehensive computing on numerous factors from various sources and to provide a database for high-resolution (100 × 100 m) CRI calculation on street scale.
Secondly, the CRI calculation based on FCE can realize quantitative calculation on CRIs of a flooding process and simulate its temporal and special distribution. By taking into account the transitional variation of values and the various importance of factors, the CRI calculation minimizes subjective assumptions so as to enhance the accuracy of flood risk assessment. In brief, it provides refined and quantitative results with temporal and special characteristics.
Moreover, this research developed the direct economic loss rate (DELR) model and the agricultural economic loss rate (AELR) model. Based on CRI calculation, they can simulate temporal and spatial distribution of economic loss indicators for any rainstorm disaster process with higher accuracy and provide an approach to quantifying regional flash flood losses. Finally, this paper introduces a methodology for flash flood loss assessment, proved feasible in Weifang City, as well as a new perspective on refined assessment for county-and city-level flood disasters. With higher temporal and spatial accuracy and better calculation automation, it can quickly and objectively model and calculate the risk degree and loss of rainstorm process.
5. Conclusions
Climate change will threaten human life and property, which are already at risk because of flash flood disasters. The main conclusions of this study are as follows:
We used GIS modeling to realize spatial simulation of evaluation factors. Based on the simulated results, we put forward the CRI calculation based on fuzzy comprehensive evaluation (FCE). By analyzing mathematical relations between CRIs and loss rates from historical disasters, we found there is a good exponential correlation between CRI and direct economic loss rate in Weifang City, and the correlation coefficient R2 can reach 0.8565. In addition, there is a good linear correlation between CRI and agricultural economic loss rate, and the correlation coefficient R2 can reach 0.8511. Built on these discoveries, we developed the DELR and AELR models to assess flood losses in Weifang. The simulation with two models can reach 100 × 100 m of spatial resolution. Additionally, the estimated losses are close to the actual figures. All of this indicates the CRI system is proved to be able to present the risk level of a flood process, contributing to a dynamic and refined loss evaluation at city and county level.
The application of this method also has certain uncertainty and restrictive conditions. There is difficulty in obtaining real-time monitoring data and basic data of rainstorm and flood, the loss data source of historical events is mainly manual statistical records, and the selection of model influencing factors varies according to geographical conditions in different regions. There are still some uncertainties in the method.
In order to make the methods in this paper more widely used, we suggest, on the one hand, combining 3S integration technology with machine learning methods; integrating multi-source data information such as satellite remote sensing, ground monitoring, and manual observation; and mining basic data and knowledge in combination with historical similar events and cases in adjacent areas to make up for the uncertainty of data sources On the other hand, GPU and digital twinning technology are used to dynamically screen evaluation factors and simulate evaluation scenarios, so as to further improve the efficiency and objectivity of evaluation with big data twinning.
Author Contributions
Y.J. and G.W.: conceptualization and methodology; J.Z.: review, discussion and suggestion to results; N.L. and C.L.: data curation, formal analysis and visualization. All authors have read and agreed to the published version of the manuscript.
Funding
His research has been supported by the National Natural Science Foundation of China (Grant Nos 41830863, 51879162,), National Key Research and Development Programs of China (Grants: 2017YFA0605002, 2017YFC0404602), The Belt and Road Fund on Water and Sustainability of the State Key Laboratory of HydrologyWater Resources and Hydraulic Engineering (Grant No. 2020nkzd01); and the Postdoctoral Research of Jiangsu Province (Bs510001).
Institutional Review Board Statement
Not applicable.
Informed Consent Statement
Not applicable.
Data Availability Statement
The data presented in this study are available on request from the corresponding author or the first author.
Acknowledgments
All authors do appreciate the journal editors and anonymous reviewers for their great efforts on the manuscript reviewing and constructive comments.
Conflicts of Interest
The authors declare no conflict of interest.
References
- Yu, L.; Xu, Y.; Zhang, Y.X. Temporal and spatial variation of rainstorms and the impact of flood disasters due to rainstorms in China in the past 25 years. Torrential Rain Disasters 2018, 37, 67–72. [Google Scholar]
- Na, W.; Lee, K.E.; Myung, H.N.; Jo, S.N.; Jang, J.Y. Incidences of waterborne and foodborne diseases after meteorologic disasters in South Korea. Ann. Glob. Health 2016, 82, 848–857. [Google Scholar] [CrossRef] [PubMed]
- CRED. Natural Disasters 2018; CRED: Brussels, Belgium, 2019. [Google Scholar]
- WEF. The Global Risks Report, 14th ed.; World Economic Forum: Davos, Switzerland, 2019. [Google Scholar]
- Qiu, X.F.; Wang, P.; Jin, Y.J.; Li, S.J. GIS-based loss assessment of flood disaster in Weifang. J. Meteorol. Sci. 2015, 35, 189–193. [Google Scholar]
- Chen, Z.L. Study on Cause and Prevention Technology of Mountain Torrent Disaster in Small Watershed; South China University of Technology: Guangzhou, China, 2014. [Google Scholar]
- Liu, J.; Li, J.; Liu, J.; Cao, Y. Integrated GIS/AHP-based flood risk assessment: A case study of Huaihe River basin in China. J. Nat. Disaster 2008, 17, 110–114. [Google Scholar]
- Xie, W.; Tian, H.; Lu, Y. Risk evaluation of rainstorm and flood disasters in Datong river basin based on the flood area model. Torrential Rain Disaster 2015, 34, 384–387. [Google Scholar]
- Zhang, L.H. Quantitative assessment of disaster loss caused by rainstorms and floods in Guangdong. Torrential Rain Disasters 2021, 40, 87–93. [Google Scholar]
- Wu, H.Y.; Zou, Y.; Liu, W. Quantitative Assessment of Regional Heavy Rainfall Process in Guangdong and its Climatological Characteristics. J. Appl. Meteorol. Sci. 2019, 30, 233–243. [Google Scholar]
- Duan, W.; He, B.; Nover, D.; Fan, J.; Yang, G.; Chen, W.; Liu, C. Floods and associated socioeconomic damages in China over the last century. Nat. Hazards 2016, 82, 401–413. [Google Scholar] [CrossRef]
- Gan, W.; Fan, J.; Xiao, T.; Jing, F.; Zhan, Z.; Wang, L. Research and establishment of a comprehensive evaluation model of rainstorm process in Sichuan Province. J. Glaciol. Geocryol. 2017, 39, 1336–1344. (in Chinese). [Google Scholar]
- Guan, M.; Chen, X. Research of regional torrent risk zonation in Jiangxi Province. Torrential Rain Disaster 2007, 26, 339–343. [Google Scholar]
- Wang, H.; Mao, W.Y.; Li, Y.P.; Yu, X.J.; Bai, S.Q. Risk zoning of torrential rain which easily causes damage in Xinjiang region. J. Glaciol. Geocryol. 2011, 33, 1407–1413. [Google Scholar]
- Islam, M.M.; Sado, K. Flood hazard assessment in Bangladesh using NOAA AVHRR data with geographical information system. Hydrol. Process. 2000, 14, 605–620. [Google Scholar] [CrossRef]
- Wan, X.; Yin, W.; Sun, P.; Tan, B. Risk division assessment of rainstorm-flood disasters based on cloud model. J. Nat. Disasters 2017, 26, 77–83. [Google Scholar]
- Wu, H.H.; Li, Z.N. Interval numbers fuzzy comprehensive evaluation method of disaster loss assessment. J. Nat. Disasters 2006, 15, 149–153. [Google Scholar]
- Abebe, Y.; Kabir, G.; Tesfamariam, S. Assessing urban areas vulnerability to pluvial flooding using GIS applications and Bayesian Belief Network model. J. Clean. Prod. 2018, 174, 1629–1641. [Google Scholar] [CrossRef]
- Qi, Y.; Liu, Y.; Yang, Z.H.; Xu, Z.; Fang, M. GIS-based analysis of landslide and debris flow hazard in Lanzhou. J. Glaciol. Geocryol. 2012, 34, 96–114. [Google Scholar]
- Tang, C.; Zhu, J. A GIS based regional torrent risk zonation. Acta Geogr. Sin. 2005, 60, 87–94. [Google Scholar]
- Li, J.R.; Ding, Z.X. Research of flood and waterlogging loss assessment model based on spatial distribution social-economic database. J. China Inst. Water Resour. Hydropower Res. 2003, 2, 104–110. [Google Scholar]
- Chakraborty, L.; Thistlethwaite, J.; Minano, A.; Henstra, D.; Scott, D. Leveraging Hazard, Exposure, and Social Vulnerability Data to Assess Flood Risk to Indigenous Communities in Canada. Int. J. Disaster Risk Sci. 2021, 12, 821–838. [Google Scholar] [CrossRef]
- Hu, X.J.; Wang, M.; Liu, K.; Gong, D.Y.; Holger, K. Using Climate Factors to Estimate Flood Economic Loss Risk. Int. J. Disaster Risk Sci. 2021, 12, 731–744. [Google Scholar] [CrossRef]
- Haruyama, S.; Ohokura, H.; Simking, T.; Simking, R. Geomorphological zoning for flood inundation using satellite data. GeoJournal 1996, 38, 273–278. [Google Scholar] [CrossRef]
- Sanyal, J.; Lu, X.X. Remote sensing and GIS-based flood vulnerability assessment of human settlements: A case study of Gangetic West Bengal, India. Hydrol. Process. 2005, 19, 3699–3716. [Google Scholar] [CrossRef]
- Liu, Y.; Lu, X.Y.; Yao, Y.Z.; Wang, N.; Guo, Y.Y.; Ji, C.R.; Xu, J.H. Mapping the risk zoning of storm flood disaster based on heterogeneous data and a machine learning algorithm in Xinjiang. China. J. Flood Risk Manag. 2020, 14, e12671. [Google Scholar] [CrossRef]
- Lai, C.G.; Chen, X.H.; Zhao, S.W.; Wang, Z.L.; Wu, X.S. A flood risk assessment model based on random forest and its application. J. Hydraul. Eng. 2015, 46, 58–66. [Google Scholar]
- Das, S.; Lee, R. A nontraditional methodology for flood stage-damage calculations1. JAWRA J. Am. Water Resour. Assoc. 1988, 24, 1263–1272. [Google Scholar] [CrossRef]
- Yi, C.S.; Lee, J.H.; Shim, M.P. GIS-based distributed technique for assessing economic loss from flood damage: Pre-feasibility study for the Anyang Stream Basin in Korea. Nat. Hazards 2010, 55, 251–272. [Google Scholar] [CrossRef]
- Yin, J.; Yin, Z.E.; Yu, D.P.; Xu, S.Y. Vulnerability analysis for storm induced flood: A case study of Huangpu River Basin. Sci. Geogr. Sin. 2012, 32, 1155–1160. [Google Scholar]
- Zeleňáková, M.; Gaňová, L.; Purcz, P.; Horsky, M.; Satrapa, L. Determination of the potential economic flood damages in Medzev, Slovakia. J. Flood Risk Manag. 2017, 11, S1090–S1099. [Google Scholar] [CrossRef] [Green Version]
- Haq, M.; Akhtar, M.; Muhammad, S.; Paras, S.; Rahmatullah, J. Techniques of remote sensing and GIS for flood monitoring and damage assessment: A case study of Sindh province, Pakistan. Egypt. J. Remote Sens. Space Sci. 2012, 15, 135–141. [Google Scholar] [CrossRef] [Green Version]
- Fernández, D.S.; Lutz, M.A. Urban flood hazard zoning in Tucumán Province, Argentina, using GIS and multicriteria decision analysis. Eng. Geol. 2010, 111, 90–98. [Google Scholar] [CrossRef]
- Carrera, L.; Standardi, G.; Bosello, F.; Mysiak, J. Assessing direct and indirect economic impacts of a flood event through the integration of spatial and computable general equilibrium modelling. Environ. Model. Softw. 2015, 63, 109–122. [Google Scholar] [CrossRef] [Green Version]
- Yang, S.Y.; Chan, M.H.; Chang, C.H.; Chang, L.F. The damage assessment of flood risk transfer effect on surrounding areas arising from the land development in Tainan, Taiwan. Ecol. Environ. Conserv. 2018, 10, 473. [Google Scholar] [CrossRef] [Green Version]
- Wei, Y.M. Theory of Flood Risk Management; Science Press: Beijing, China, 2002; pp. 109–110. [Google Scholar]
- Zhang, G.C. Risk Assessment and Regionalization of Meteorological Disasters; Meteorological Press: Beijing, China, 2009. [Google Scholar]
- Jin, Y.J.; Zeng, Y.; Qiu, X.F. Vulnerability analysis of flood disasters hazard-affected body under the support of spatialization technology of population and GDP. J. Meteorol. Sci. 2014, 34, 522–529. [Google Scholar]
- He, Z.X. Fuzzy Mathematics and Application; Tianjin Science and Technology Press: Tianjin, China, 1988; pp. 15–75. [Google Scholar]
- Zhou, H.L. Basic theory of fuzzy mathematics and its application. Well Constr. Technol. 1994, 21, 70–80. [Google Scholar]
- Huang, J.Y. Meteorological Statistical Analysis and Forecasting Methods; Meteorological Press: Beijing, China, 1990. [Google Scholar]
Figure 1.
Distribution of monitoring stations.

Figure 2.
Comparative analysis of CRI evaluated severity and actual disaster severity.

Figure 3.
Correlation between CRIs and DELRs.

Figure 4.
Correlation between flash flood CRIs and AELRs.

Figure 5.
Spatial distribution of economic losses (10 August 2007).


Table 1.
Weight coefficients of evaluation factors for disaster losses caused by flash floods.
| Evaluation Factors | Weight Coefficients |
|---|---|
| Duration of rainstorm | 0.1396 |
| 2-day maximum precipitation | 0.1679 |
| Extreme values of total precipitation | 0.1701 |
| Topography indexes of affected zones | 0.0753 |
| Density of water bodies | 0.0704 |
| Vegetation coverage | 0.0677 |
| Population density | 0.1066 |
| GDP per km2 | 0.1144 |
| Number of shelters | 0.0471 |
| Distribution of medical aid services | 0.0409 |
Table 2.
CRIs of flash-flood disasters in Weifang.
| No. | Time of the Disaster | Location of the Disaster | Comprehensive Risk Index |
|---|---|---|---|
| 1 | 18–21 August 1985 | The whole city of Gaomi | 0.1631 |
| 2 | 25 August 1987 | Linghe, Dasheng, Huiqiu, etc. in Anqiu City | 0.1321 |
| 3 | 26–27 August 1987 | Tangwu town, Honghe town, Yingqiu town in Changle County | 0.1524 |
| 4 | 26 August 1987 | The whole county of Linqu | 0.2533 |
| 5 | 29 June 1994 | The whole county of Linqu | 0.2533 |
| 6 | 1 August 1994 | Miaozi Town in Qingzhou City | 0.0020 |
| 7 | 24 August 1994 | The whole city of Gaomi | 0.3094 |
| 8 | 1–8 August 1995 | The whole district of Hanting | 0.1762 |
| 9 | 7 July 1996 | Chenggezhuang Town in Zhucheng City | 0.1877 |
| 10 | 19–20 August 1997 | The whole county of Linqu | 0.3884 |
| 11 | 19 August 1997 | The whole city of Qingzhou | 0.3533 |
| 12 | 19–20 August 1997 | Wadian, Changcheng, Zhuxie, Linjiacun, Taoyuan, Xinxing in Zhucheng City | 0.2094 |
| 13 | 23–24 July 1998 | Daguan Town, Jiushan Town in Linqu County | 0.0184 |
| 14 | 4 August 1998 | The whole city of Zhucheng | 0.2378 |
| 15 | 22 August 1998 | The whole county of Changle | 0.1568 |
| 16 | 22 August 1998 | Zhuli, Hetan, Guti, Shuangyang, Nansun, Pozi in Hanting District | 0.2333 |
| 17 | 11–12 August 1999 | The whole city of Gaomi | 0.4448 |
| 18 | 11–13 August 1999 | The whole city of Zhucheng | 0.4642 |
| 19 | 9–10 April 2000 | The whole city of Zhucheng | 0.1368 |
| 20 | 30–31 August 2000 | Taitou Town, Yangkou Town and Yingli Town in Shouguang City | 0.2391 |
| 21 | 31 August 2000 | The whole city of Qingzhou | 0.2605 |
| 22 | 4 August 2001 | The whole city of Shouguang | 0.3248 |
| 23 | 17–18 April 2003 | Yangkou Town in Shouguang City | 0.0672 |
| 24 | 4–6 September 2003 | Daotian Town in Shouguang City | 0.1019 |
| 25 | 29 June 2004 | Shengcheng Street in Shouguang City | 0.0710 |
| 26 | 27–28 July 2004 | Taitou Town, Yangkou Town and Yingli Town in Shouguang City | 0.3005 |
| 27 | 23 May 2007 | The whole district of Hanting | 0.0374 |
| 28 | 10 August 2007 | Chengnan Street, Baocheng Street, Yingqiu Town in Changle County | 0.1197 |
| 29 | 10 August 2007 | Meicun, Mucun, Nanliu Town in Fangzi District | 0.2531 |
| 30 | 10 August 2007 | Wenjia, Luocheng, Daotian, Tianliu in Shouguang City | 0.1502 |
| 31 | 11 August 2007 | Huanglou, Miaozi, Wangmugong, Shaozhuang in Qingzhou | 0.1095 |
| 32 | 18 August 2007 | Taolin town and Linjiacun town in Zhucheng City | 0.0027 |
| 33 | 18–20 September 2007 | The whole city of Zhucheng | 0.1291 |
Table 3.
CRIs and DELRs of flash floods in Weifang.
| Comprehensive Risk Index | Direct Economic Loss Rate (%) |
|---|---|
| 0–0.15 | 0–0.1 |
| 0.15–0.26 | 0.1–0.5 |
| 0.26–0.40 | 0.5–1.0 |
| >0.40 | >1.0 |
Table 4.
Distribution of flash flood CRI intervals and the AELR intervals in Weifang.
| Comprehensive Risk Index | Agricultural Economic Loss Rate (%) |
|---|---|
| 0–0.14 | 0–0.8 |
| 0.14–0.25 | 0.8–2.6 |
| 0.25–0.40 | 2.6–4.0 |
| >0.40 | >4.0 |
Table 5.
Error analysis of flood loss estimation on the flash-flood process in Weifang on 10 August 2007.
Table 5.
Error analysis of flood loss estimation on the flash-flood process in Weifang on 10 August 2007.
| City/District | Affected Town | CRI | Direct Economic Loss (10,000 yuan) | Agricultural Economic Loss (10,000 yuan) | ||||
|---|---|---|---|---|---|---|---|---|
| Simulated Value | Statistics | Relative Error (%) | Simulated Value | Statistics | Relative Error (%) | |||
| Qingzhou City | Huanglou, Miaozi, Wangmu Gong, Shaozhuang | 0.1095 | 272 | 215 | 26.51 | 115 | MISS | NULL |
| Fangzi District | Meicun, Mucun, Nanliu Town | 0.2531 | 915 | 1103 | 17.04 | 748 | 884 | 15.37 |
| Shouguang City | Wenjia, Luocheng, Daotian, Tianliu | 0.1502 | 549 | 500 | 9.80 | 302 | 249 | 21.29 |
Publisher’s Note: MDPI stays neutral with regard to jurisdictional claims in published maps and institutional affiliations. |
© 2022 by the authors. Licensee MDPI, Basel, Switzerland. This article is an open access article distributed under the terms and conditions of the Creative Commons Attribution (CC BY) license (https://creativecommons.org/licenses/by/4.0/).
Share and Cite
MDPI and ACS Style
Jin, Y.; Zhang, J.; Liu, N.; Li, C.; Wang, G. Geomatic-Based Flood Loss Assessment and Its Application in an Eastern City of China. Water 2022, 14, 126. https://doi.org/10.3390/w14010126
AMA Style
Jin Y, Zhang J, Liu N, Li C, Wang G. Geomatic-Based Flood Loss Assessment and Its Application in an Eastern City of China. Water. 2022; 14(1):126. https://doi.org/10.3390/w14010126
Chicago/Turabian StyleJin, Youjie, Jianyun Zhang, Na Liu, Chenxi Li, and Guoqing Wang. 2022. "Geomatic-Based Flood Loss Assessment and Its Application in an Eastern City of China" Water 14, no. 1: 126. https://doi.org/10.3390/w14010126
Note that from the first issue of 2016, this journal uses article numbers instead of page numbers. See further details here.