
Statistical and Hydrological Evaluations of Water Dynamics in the Lower Sai Gon-Dong Nai River, Vietnam
by
 ,
,
Ngo Ngoc Hoang Giang
1 ,
,
Chau Nguyen Xuan Quang
1,*,
Do Tan Long
2,
Pham Dinh Ky
2,
Nguyen Duc Vu
3 and
Dung Duc Tran
4 1
Department of Hydrology and Water Resources, Institute for Environment and Resources, Vietnam National University—Ho Chi Minh City (VNU-HCM), Ho Chi Minh City 700000, Vietnam
2
Center of Infrastructure Management, Department of Construction of Ho Chi Minh City, 3C Thang 2 Street, Ward 11, District 10, Ho Chi Minh City 700000, Vietnam
3
Sub-Department of Water Resources, Department of Agriculture and Rural Development of Ho Chi Minh City, 176 Hai Ba Trung Street, Dakao Ward, District 1, Ho Chi Minh City 700000, Vietnam
4
Center of Climate Change and Water Management, Institute for Environment and Resources, Vietnam National University—Ho Chi Minh City (VNU-HCM), Ho Chi Minh City 700000, Vietnam
*
Author to whom correspondence should be addressed.
Water 2022, 14(1), 130; https://doi.org/10.3390/w14010130
Submission received: 6 December 2021
/
Revised: 25 December 2021
/
Accepted: 1 January 2022
/
Published: 5 January 2022
(This article belongs to the Special Issue Building Water Resilience to Achieve SDGs)
Abstract
:The water levels downstream of the Sai Gon and Dong Nai river in Southern Vietnam have been significantly changed over the last three decades, leading to severe impacts on urban flooding and salinity intrusion and threating the socio-economic development of the region and lives of many local people. In this study, the Mann-Kendall (MK) and trend-free prewhitening (TFPW) tests were applied to detect the water level trends and changepoints based on a water level time series at six gauging stations that were located along the main rivers to the sea over 1980–2019. The results indicated that the water level has rapidly increased by about 0.17 to 1.8 cm/year at most gauge stations surrounding Ho Chi Minh City, strongly relating to urbanization and the dike polder system’s impacts that eliminates the water storage space. In addition, the operation of upstream reservoirs has contributed to water level changes with significant consequences since the high-water level at Tri An station on the Dong Nai river occurs 1000–1500 times compared to 300–500 times before the operation. Although the effects of the flows from the sea are less than the two other factors, the local government should seriously consider water level changes, especially in the coastal regions. Our study contributes empirical evidence to evaluate the water level trends in the planning and development of infrastructure, which is necessary to adapt to future changes in Southern Vietnam’s hydrologic system.
1. Introduction
Urbanization and urban expansion, especially in riparian and coastal areas, are increasing all over the world [1,2]. According to the United Nations, the world’s population has increased rapidly over the last decades, from 751 million in 1950 to 4.2 billion in 2018, with 55 percent of those living in cities in 2018, which was projected to rise to 68 percent by 2050 [3]. Economic development and urbanization in the urban cities will put strain on natural river systems [4,5,6,7,8], altering the hydrological system [9], aquatic ecology [10,11], and in particular, increasing urban flooding [12,13,14], resulting in negative consequences for people, economic losses, social disruption, and environmental pollution [15,16,17]. Along with the urbanization, climate change is one of the most important factors that is influencing the hydrological systems and changes in water levels in many urban regions worldwide, which has been seriously examined by a number of recent studies [18,19,20,21,22].
The lower Sai Gon-Dong Nai river basin (SGDNrb) of Southern Vietnam covering Ho Chi Minh City (HCMC) has a high population density and rapid economic growth and development which has put itself as one of the most national dynamic river basins. Consequently, it is considered a vulnerable area that has been experiencing water-related challenges as a result of urbanization and climate change [23,24,25]. Specifically, the SGDNrb consists of a dense system of canals and small rivers that are distributed around the two major rivers, called the Sai Gon and Dong Nai; therefore, any external impact on these two main rivers usually changes the hydrological characteristics of the whole river basin, particularly those related to water level fluctuations. Furthermore, urbanization and socio-economic development have contributed to changes that have negatively increased flooding in HCMC and the surrounding areas [26] that have partly been driven by the conversion of cropland to urban uses [27]. Therefore, understanding and analyzing water level fluctuations is critical in flood management, flood warning, and sustainable development [28].
Previous studies have explored and evaluated the fluctuations in water levels in the SGDNrb area its relationship to changes in water storage area [29] or its impact on urban flooding [30]. Despite the fact that these studies have put great effort on using various tools and relatively reliable gauging data have been analyzed to present the increase in water levels in the SGDNrb area, most studies overlooked the statistical trends or changepoints without explicitly interpreting the causes of the water level changes, i.e., reducing the storage areas by land-use changes or a changing precipitation that is induced by climate change and the ENSO process. Moreover, these studies have only assessed possible integrated influences of the upstream reservoir systems, the development of the ring dike system, and the urbanization on the river water levels whereas individual effects are often required to be perceived by managers or stakeholders to have adequate measures to address. It is, therefore, essential to explore individual influences on the changes in river water levels because the multiple changepoints are more often detected by analyzing the monitoring data series.
In recent years, identifying multiple breakpoints has increasingly received considerable attention in many fields, particularly in environmental water management and integrated water resources management [31,32,33]. Determining the quantity and location of changepoints in the sequence is one of the most important tasks of data analysis [34]. In the SGDNrb, there have been several events or factors (i.e., dike polder system, hydropower development, or flows from the sea) impacting and altering the hydrological regime during the last decades; therefore, either individual or cumulative impacts should be possibly explored to adopt to the land use planning, water resources management, and strategic urbanization and socio-economic development in the coming years. Of those, the urban flood issue, which has been exacerbated in HCMC in recent years due to the above mentioned impacts, is forcing the government to make a decision at a crossroad: work towards an effective land and water management by strictly establishing the timing of changepoints of water level changes and distinguishing the causes to be addressed, which may force to change the current socio-economic development strategy associated with a transition from structural to nature-based measures; or by retaining the current socio-economic development strategy to undermine the rising urban flood risk.
To analyze the change of a meteorological and hydrological time series, trend testing methods are often applied such as linear regression trend test [35], Mann-Kendall test (MK) [36,37], seasonal MK test [38,39], and the Sen’s innovative trend analysis (ITA) [40]. Updated versions of the MK test (so-called Modified MK test) such as the variance correction [41,42], trend-free prewhitening [43], and the block bootstrap method (BBS) [44] are also widely used to eliminate the effect of autocorrelation in time series data. In particular, trend detection using the MK test has received high attention in recent decades [45,46,47,48]. In the SGDNrb, the MK and Modified MK trend determination methods have been and still are commonly being used in a number of studies on precipitation variability [49,50,51], and water levels [29,52].
This study aims at statistically analyzing the water dynamics in the lower Sai Gon—Dong Nai river, Vietnam by: (i) determining six-station-based water level trends in the downstream of the SGDN using the non-parametric tests (Mann-Kendall and Modified Mann-Kendall (trend-free prewhitening)); (ii) identifying the years that were associated with water level changes by a systematic breakpoints analysis; (iii) reflecting the changepoint years and their relationship to the causes of change with land use change and urbanization analysis in the study area based on remote sensing data; and (iv) examining the relationship between the river water level changes and influencing factors. Our findings contribute evidence to develop more effective water resources management especially with the rising urban flood risk in the SGDNrb.
2. Material and Methods
2.1. Study Area
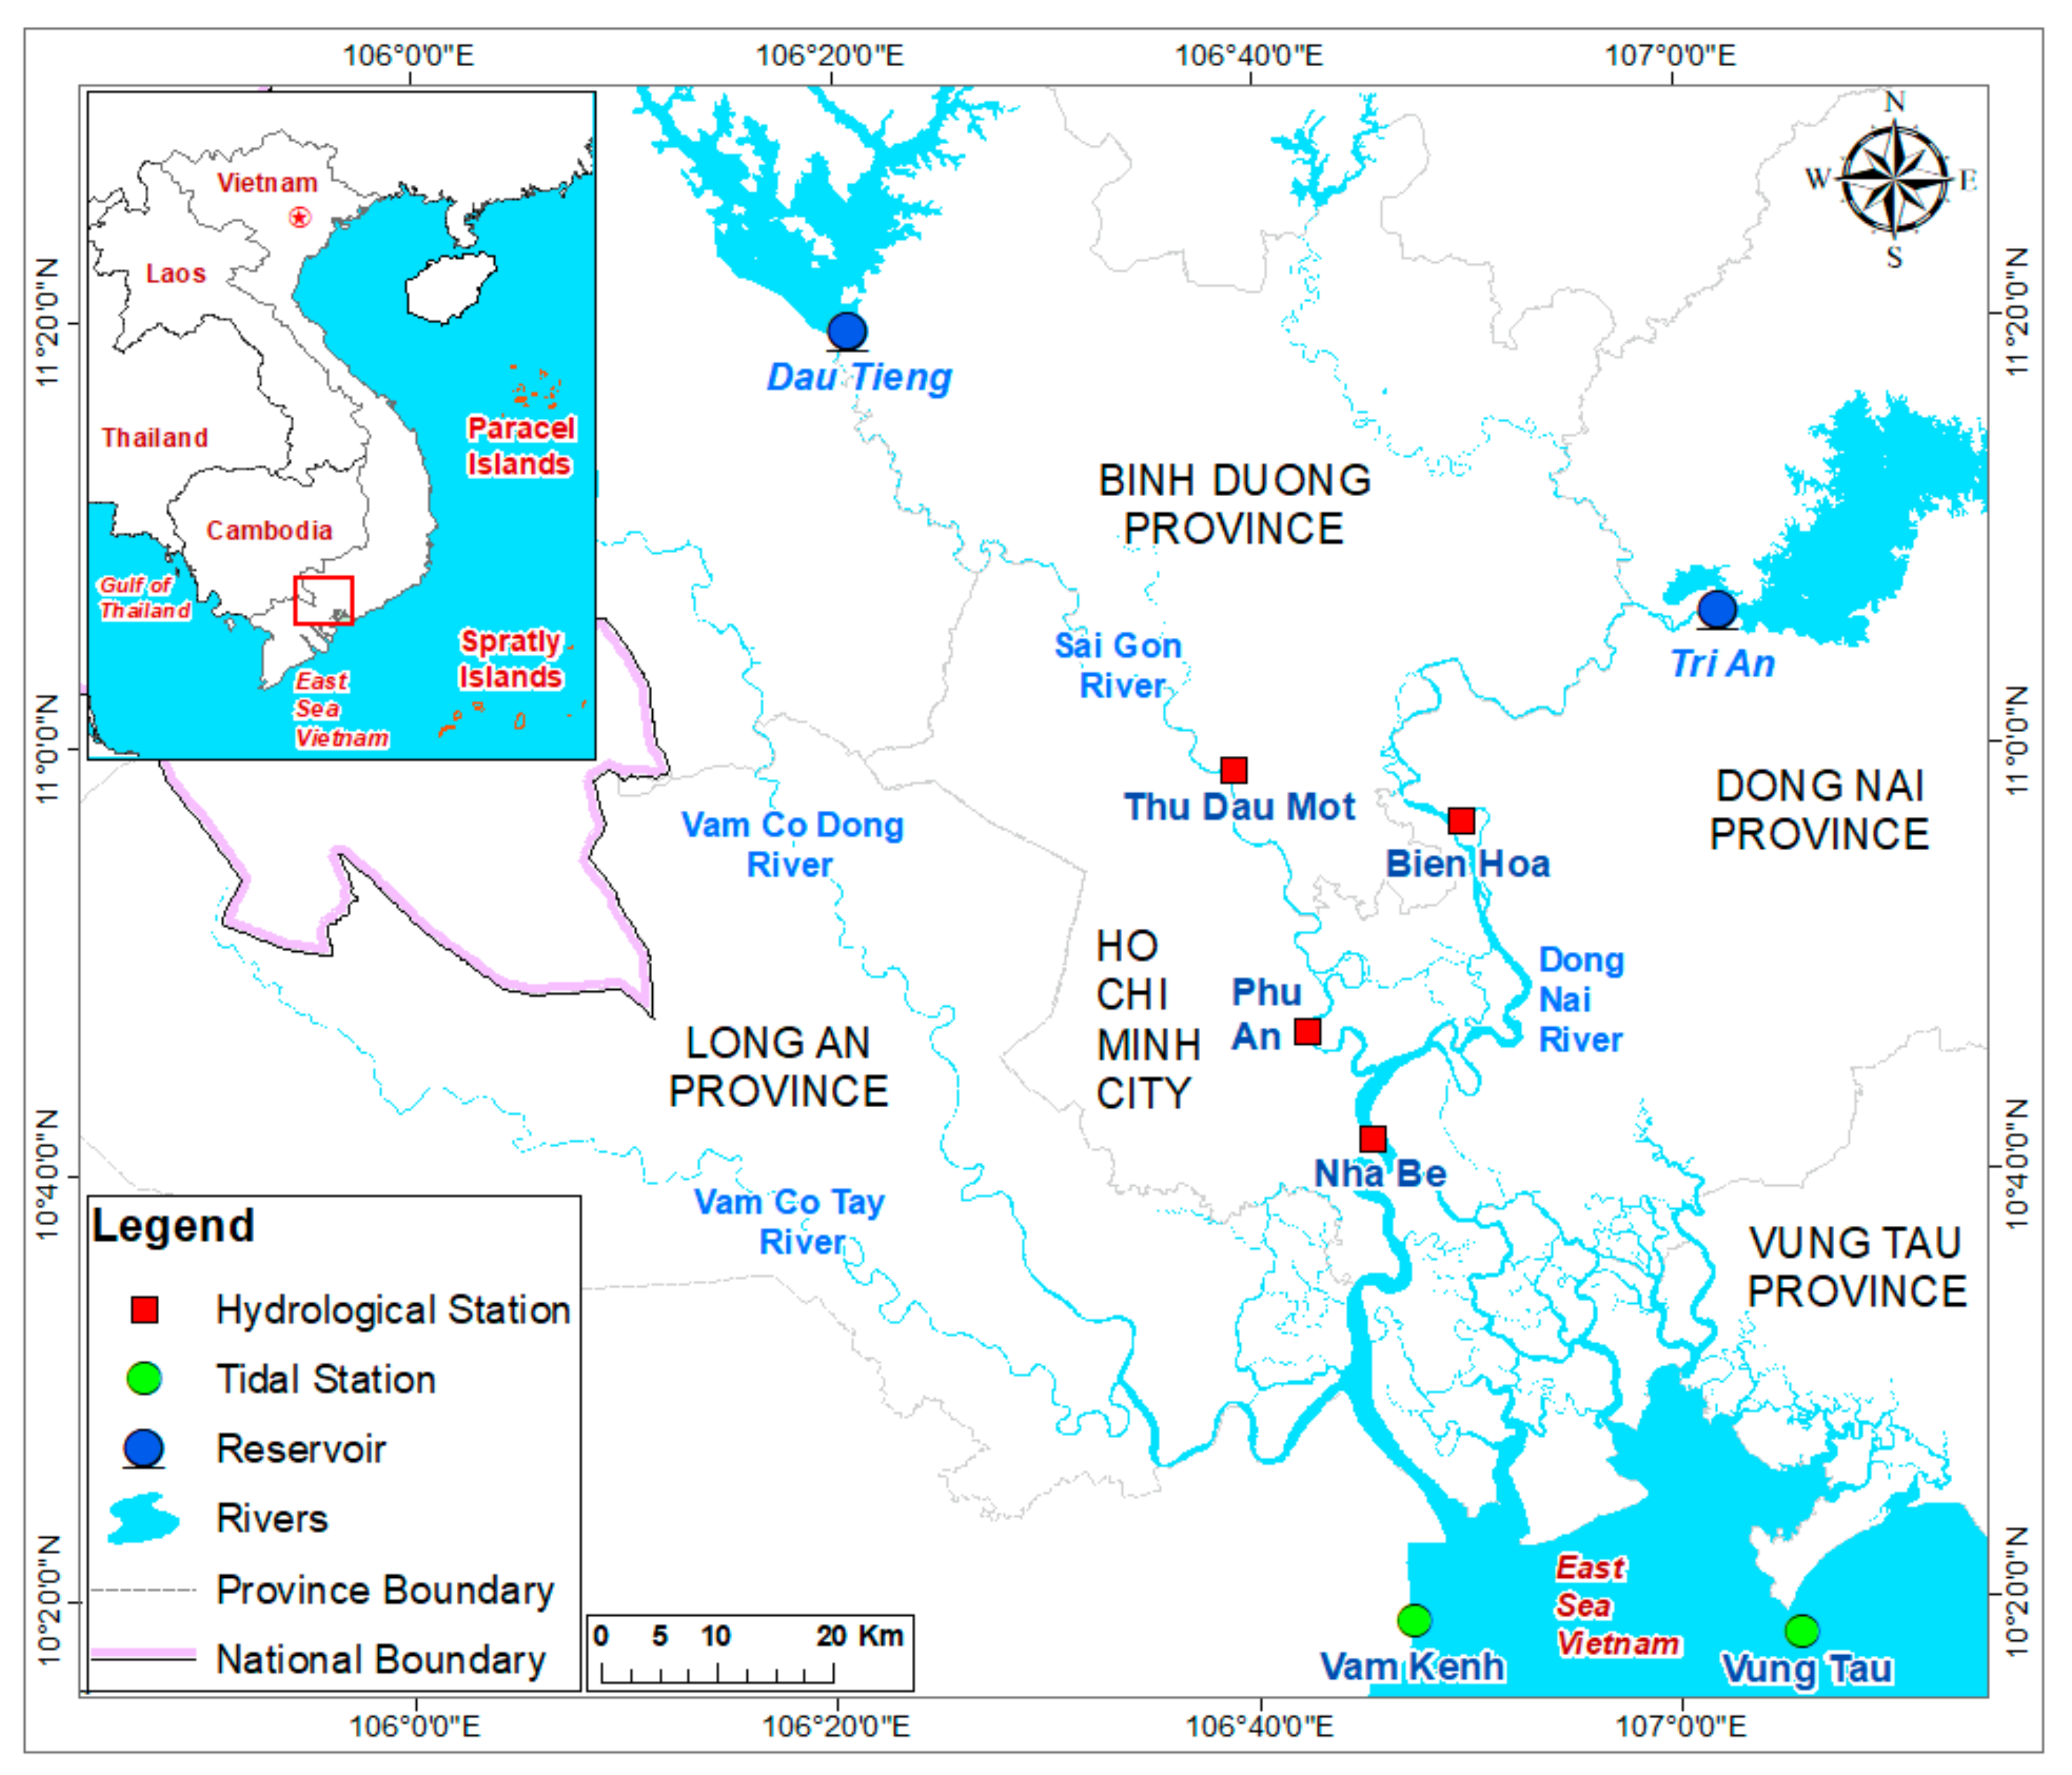
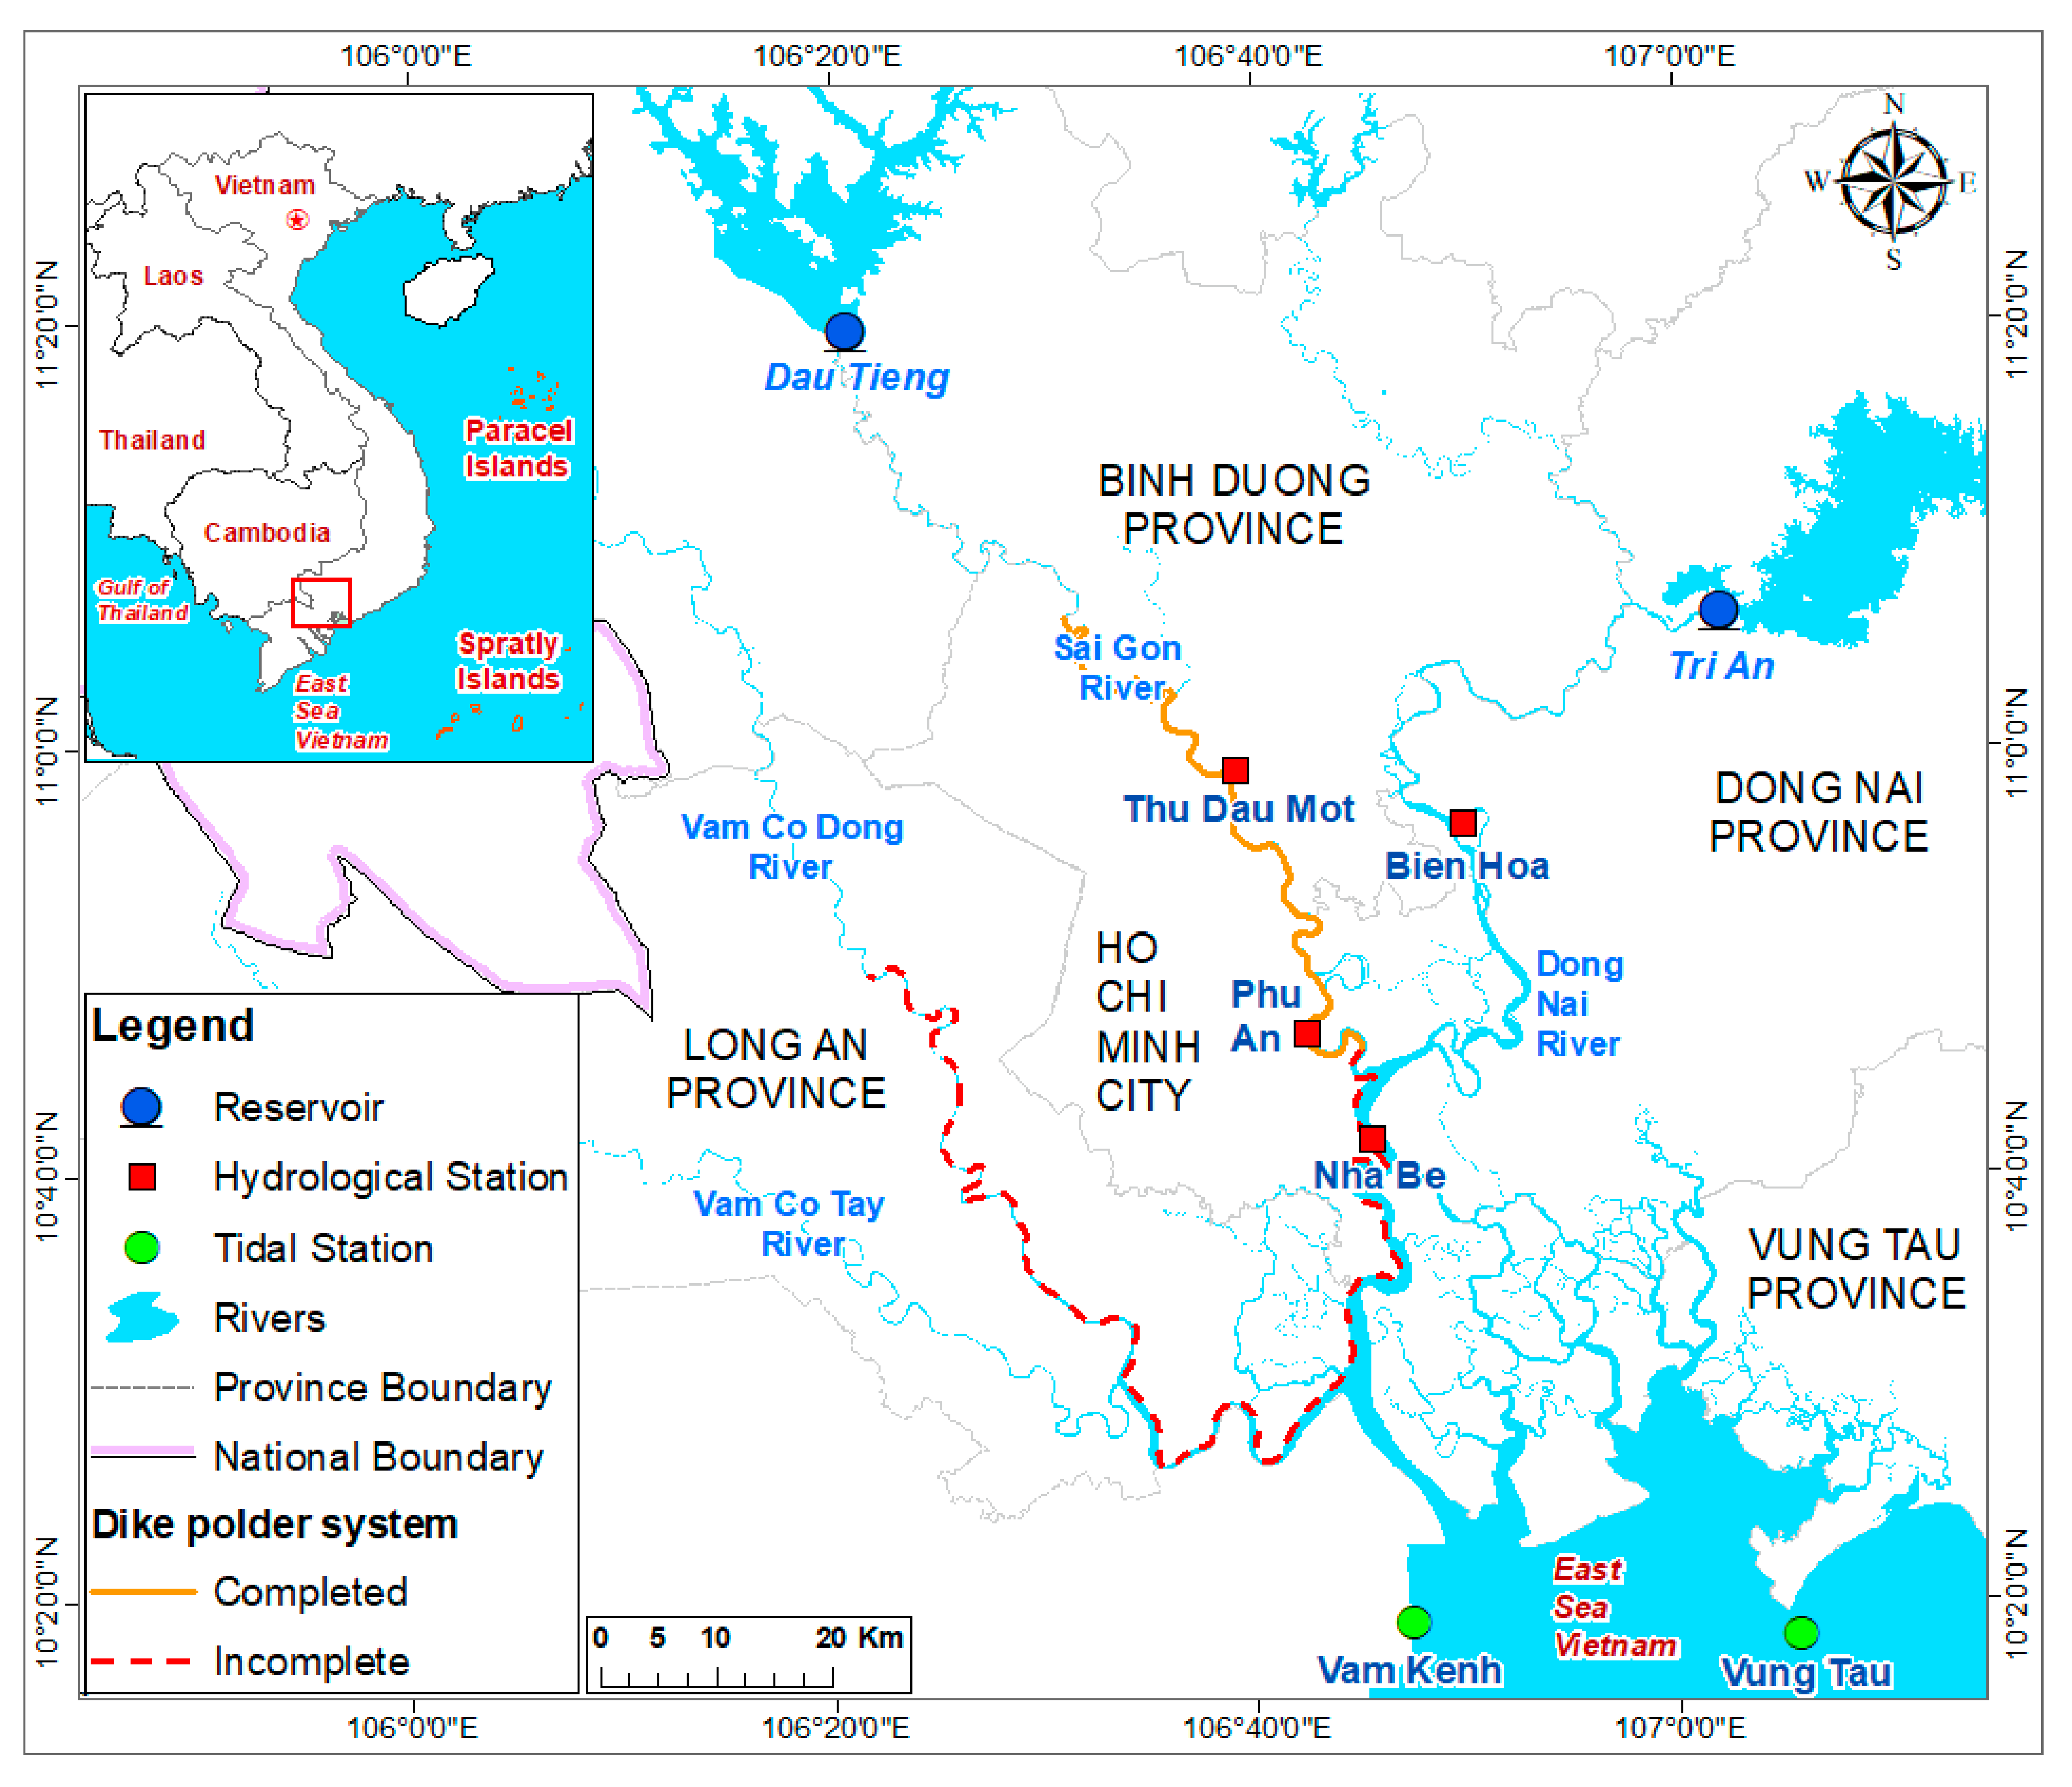
The lower of the Saigon—Dong Nai river basin covers approximately 5352 km2, spanning from 10°37′–11°29′ North latitude and 105°45′–107°0′ East longitude (Figure 1).
Rainfall is unevenly distributed on an annual and monthly basis; the rainy season lasts from May to October annually and that accounts for 85% of total annual rainfall. The average annual rainfall at Nha Be monitoring station is approximately 1500 mm, while approximately 1850 mm is measured at Tan Son Nhat station. The annual average temperature ranges from 27 °C to 29 °C. The average temperature difference between the months of the year ranges from 2 °C to 5 °C. December has the lowest average temperature and April has the highest average temperature. The average wind speed varies from 2 to 3 m/s depending on the month and year, with the southeast direction (in January–April) and the southwest direction (in July-December). The yearly average humidity is 76%, with higher humidity in the rainy than the dry season. From July through November, the humidity is at its maximum (5–9% higher than the annual average). In contrast, the humidity levels are 9–10% lower than the yearly average and even 14–15% lower during the dry season during January to April. The annual average evaporation rate is around 3.7 mm/day, with a maximum evaporation of about 4.5 mm/day in the dry season (February, March, and April) and about 3 mm/day in the rainy season.
The SGDN has two main tributaries, the Sai Gon river (right tributary) and Dong Nai river (left tributary). The Saigon River features modest bends, a slight slope (1.3‰), and a width ranging from 50 to 1000 m throughout HCM city, with a depth of up to 20 m. The Dong Nai river flows from the Tri An reservoir to East Sea Vietnam, is about 145 km long, with an average riverbed slope of 3.2‰. Most of the rivers and canals in the study area are influenced by the semi-diurnal tidal fluctuations of the sea. The amplitude of the tidal oscillation changes along the Saigon River, progressively decreasing from the estuary to Dau Tieng reservoir. The Dong Nai River’s amplitude of fluctuation is much higher than that in the Saigon River.
Although there are many water-level stations, the measured data for the river water level evaluation at six gauging stations were used due to their sufficient long-term records (1980 to 2019), namely Bien Hoa, Nha Be on the Dong Nai river; Thu Dau Mot, Phu An on the Saigon river; and Vung Tau, Vam Kenh (tide monitoring station) on the East Sea Vietnam (see Figure 1). These time series data were collected hourly by at the Southern Region Hydro-Meteorological Centre; which means that each has 24 records per day. Therefore, these data fully reflect the natural fluctuations of the river water level and may be considered as an element for trends and break points analysis. In this study, the following data scenarios were analyzed, including the maximum water level Hmax, the mean water level Hmean, and the minimum water level Hmin. In addition, the average water level percentile 99% (Hp99%) and the percentile 1% (Hp1%) were also investigated.
2.2. Methods
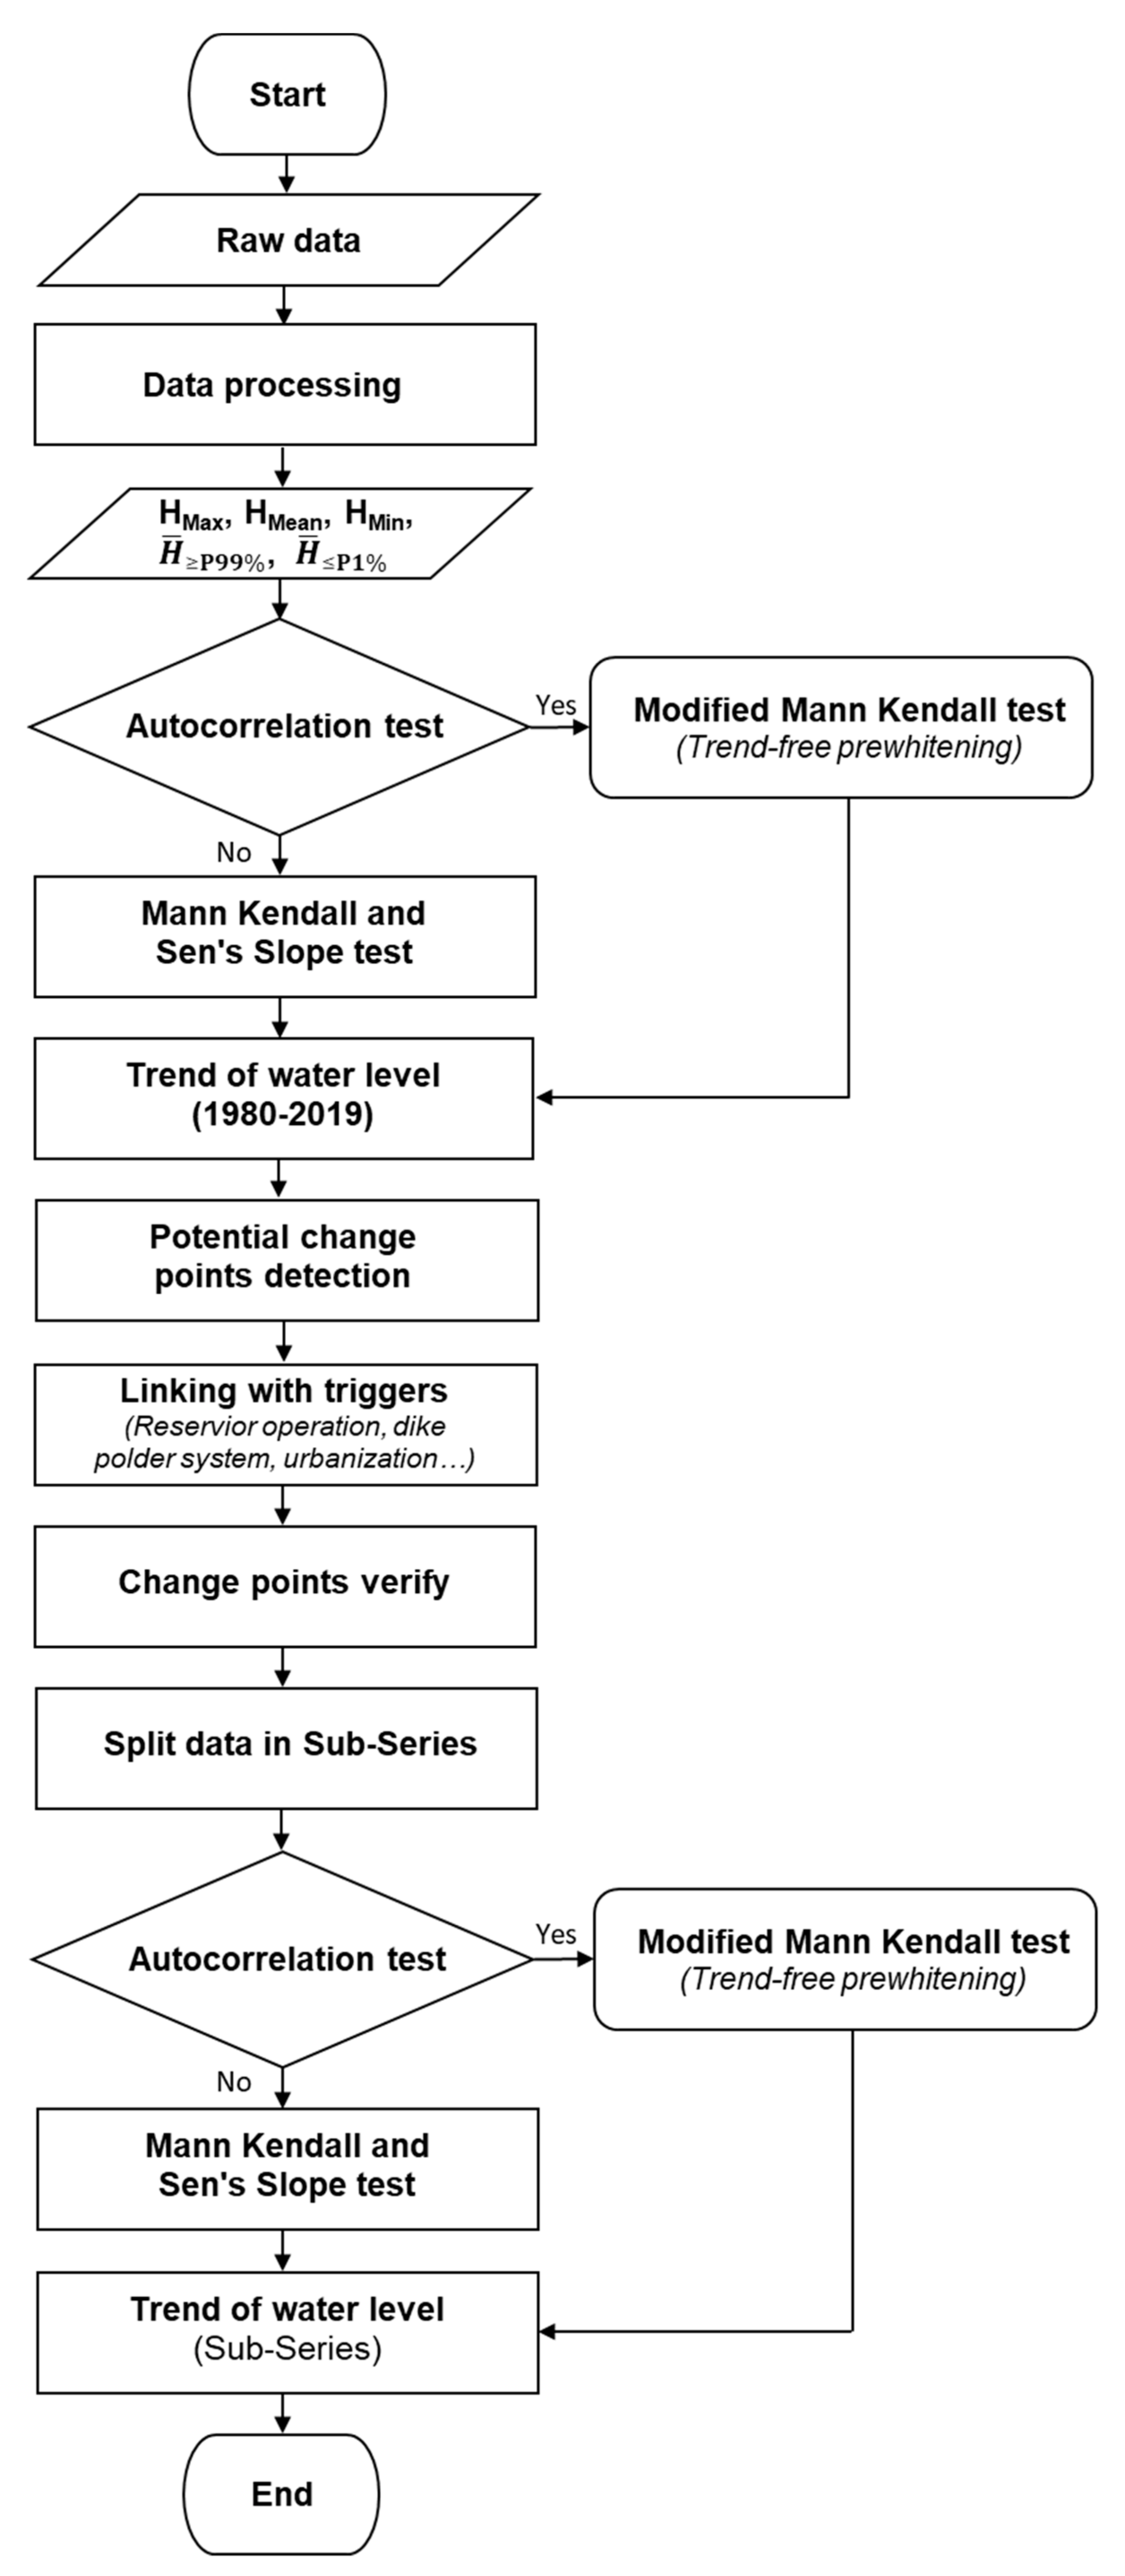
The water level trends of the six monitoring stations downstream of the SGDNrb were determined through three main steps (Figure 2). First, the raw data (shown in Table 1) were processed to exclude outliers before the autocorrelation test was carried out. After that, a Mann-Kendall (MK) and Sen’s slope tests or modified MK test (so-called trend-free prewhitening TFPW test in this paper) were applied to detect the overall trend of the monitoring stations over the entire period 1980–2019. Second, these tests were used to determine breakpoints (changepoint years) as back-testing with historical events, which help to explore the potential cause of the increasing or decreasing water level trends and the so-called changepoint verification. Finally, the changepoint years were examined to double-check whether they occurred before and after the change periods.
2.2.1. Autocorrelation
This study used the formula that was originally derived by Salas [53] for estimating the autocorrelation coefficient (lag-1), which has recently been used in different meteo-hydrological and atmospheric research [54,55,56]. By considering a sample data (x1, x2, …, xn), the lag-1 autocorrelation coefficient is computed by:
where , n are the mean and the length of the sample data, respectively. The following formula can be used to determine if a sequence data autocorrelation exists: where:
If is outside the range above, the time series data are considered to be autocorrelated; otherwise, if is in the center of the upper range, the autocorrelation does not exist.
2.2.2. Mann-Kendall Test
Mann [36] formulated this test and Kendall [37] subsequently developed the test statistic distribution. The Mann-Kendall (MK) test is a non-parametric method for trend detection in a time series without specifying the type of trend (i.e., linear or nonlinear) [36,37]. Therefore, the MK test has the advantage that their significance is not affected by the distribution of the data. This test is an excellent tool and has been extensively used in hydrological time series for trend detection [19,57,58].
Let consider the time series = {t = 1, 2,…, n}, the Mann-Kendall test statistic S is formulated as follows:
In which: and are values in the time series t, t’ with (t’ > t). The mean value of S is 0 and the variance V(S) is calculated:
where n is the number of data, g is the number of tied groups, and ei is the number of data in the ith tied group. A standardized test statistic Z is calculated using the formula below:
If Z > 0 the trend tends to increase, while Z < 0 the trend tends to decrease. The trends are tested at a specific significance level. When |Z| > Z1−α/2, the null hypothesis is rejected, and the time series shows a significant trend. Z1−α/2 is obtained from the standard normal distribution table. In this study, the trend values are shown at the 5% significance level (α = 0.05). At the 5% significance level, the null hypothesis of no trend is rejected if |Z| > 1.96.
If a certain data series is autocorrelated, this will increase the probability that the MK test detects a significant trend whereas the null hypothesis (no trend) is actually true [59]. The effect of serial correlation on the MK test can be neglected by using a trend-free prewhitening (TFPW) approach, as proposed by Yue et al. [43]. First, the new sample data are calculated as: where b is the slope of the trend which estimated by Sen method. Second, it needs to calculate the lag-1 serial correlation coefficient r1 of and determine the residual series: . Third, the identified trend and the residual series are blended by: . Finally, the MK test is applied to the blended series to assess the significance of the trend.
2.2.3. Sen’s Slope Estimator Test
Sen’s Slope estimator test (Sen [60]) is a non-parametric method to quantify the monotone trend in a time series data based on Kenndal’tau. The slope of the trend is estimated by: (for all i < j) where is the slope between data points and ; and are, respectively, observed values at time i-th and j-th (i < j). The positive value of denotes the slope of the upward trend and a negative of for the downward trend.
2.2.4. Breakpoints Analysis/Changepoints Detection
After determining the statistical significance from the water level trend (1980 to 2019) at the monitoring stations, the scenarios (Hmax, Hp99%, Hmean, Hp1%, Hmin) were kept in the break points analysis via the “struccchange” tool in R package. This tool was built by Zeilies et al. for break points analysis [61,62], based on the studies on determining the changepoints in the data series that were based on the regression model of Bai et al. in the period 1994–2003 [63,64,65,66,67].
A standard linear regression model is used:
where: yi is observation of the dependent variable; xi: k × 1 vector of regressors with the first component usually equal to unity; βi: k × 1 vector of regression coefficients, which may vary over time; ui: independent and identically distributed (0, σ2). A null hypothesis “no structural change” that the regression coefficients remain constant against the alternative that at least one coefficient varies over time H0: βi = βo (i = 1, …, n). Taking the assumption that there are m breakpoints, thus, there are m + 1 segments in which the regression coefficients are constant, and the model (1) can be rewritten as:
where j is the segment index, ɠm,n = {i1, …., im} denotes the set of the breakpoints (ɠm,n is also called m-partition), and by convention i0 = 0 and im+1 = n. The breakpoints can be estimated by minimizing the residual sum of squares (RSS) of the equation above.
The resulting minimal residual sum of squares is given by:
where is the usual minimal residual sum of squares in the jth segment. The problem of dating structural changes is to find the breakpoints i1,…im that minimize the objective function: over all partition (i1,…, im) with ij − ij−1 ≥ nh ≥ k.
A dynamic programming approach is used to compute the optimal breakpoints given the number of breaks. The underlying concept is the Bellman principle. The primary computational effort is to compute a triangular RSS matrix, which yields the residual sum of squares for a segment beginning at an observation i and ending at i′ with i < i′.
Breakpoint analysis in the “strucchange package” [68] is used in this study to analyze and determine the change years of the water level data series. Since the number of breakpoints is not known in advance, in this study, the optimal breakpoints (m = 0, 1, …) were chosen by Bayesian information criterion (BIC) method which were developed by Gideon E. Schwarz [69] and is a suitable selection procedure in many situations [61].
2.2.5. Software Packages in R-Language
In this study, the following packages are used, including “trend” for the Mann-Kendall test [70], “modifiedmk” for identifying trends when data series are autocorrelated [71], and “strucchange” for potential changepoints analysis [68]. These packages are available for free via the CRAN repository and the Github version control platform.
3. Results and Discussion
3.1. Trend of Water Level in the SGDNrb
3.1.1. Analysis of the Autocorrelation of Time Series Data
The autocorrelation test-based results for all the analytical options of the six gauging stations almost show lag-1 autocorrelation (Table 2) because all values are out of the range r(f) and r(b). These results allow the use of TFPW to analyze the water level trends. Throughout the paper, result interpretation is based on the TFPW test’s values although the MK’s results are also mentioned for comparison.
3.1.2. Water Level Trend Analysis
Table 3 presents the results of water level trend analysis using the MK and TFPW tests for both data series that were and were not affected by autocorrelation. A total of five components are classified into three groups of maximum water level (Hmax, Hp99%), minimum water level (Hmin, Hp1%), and mean water level (Hmean).
Maximum Water Level: Trend of Hmax, Hp99%
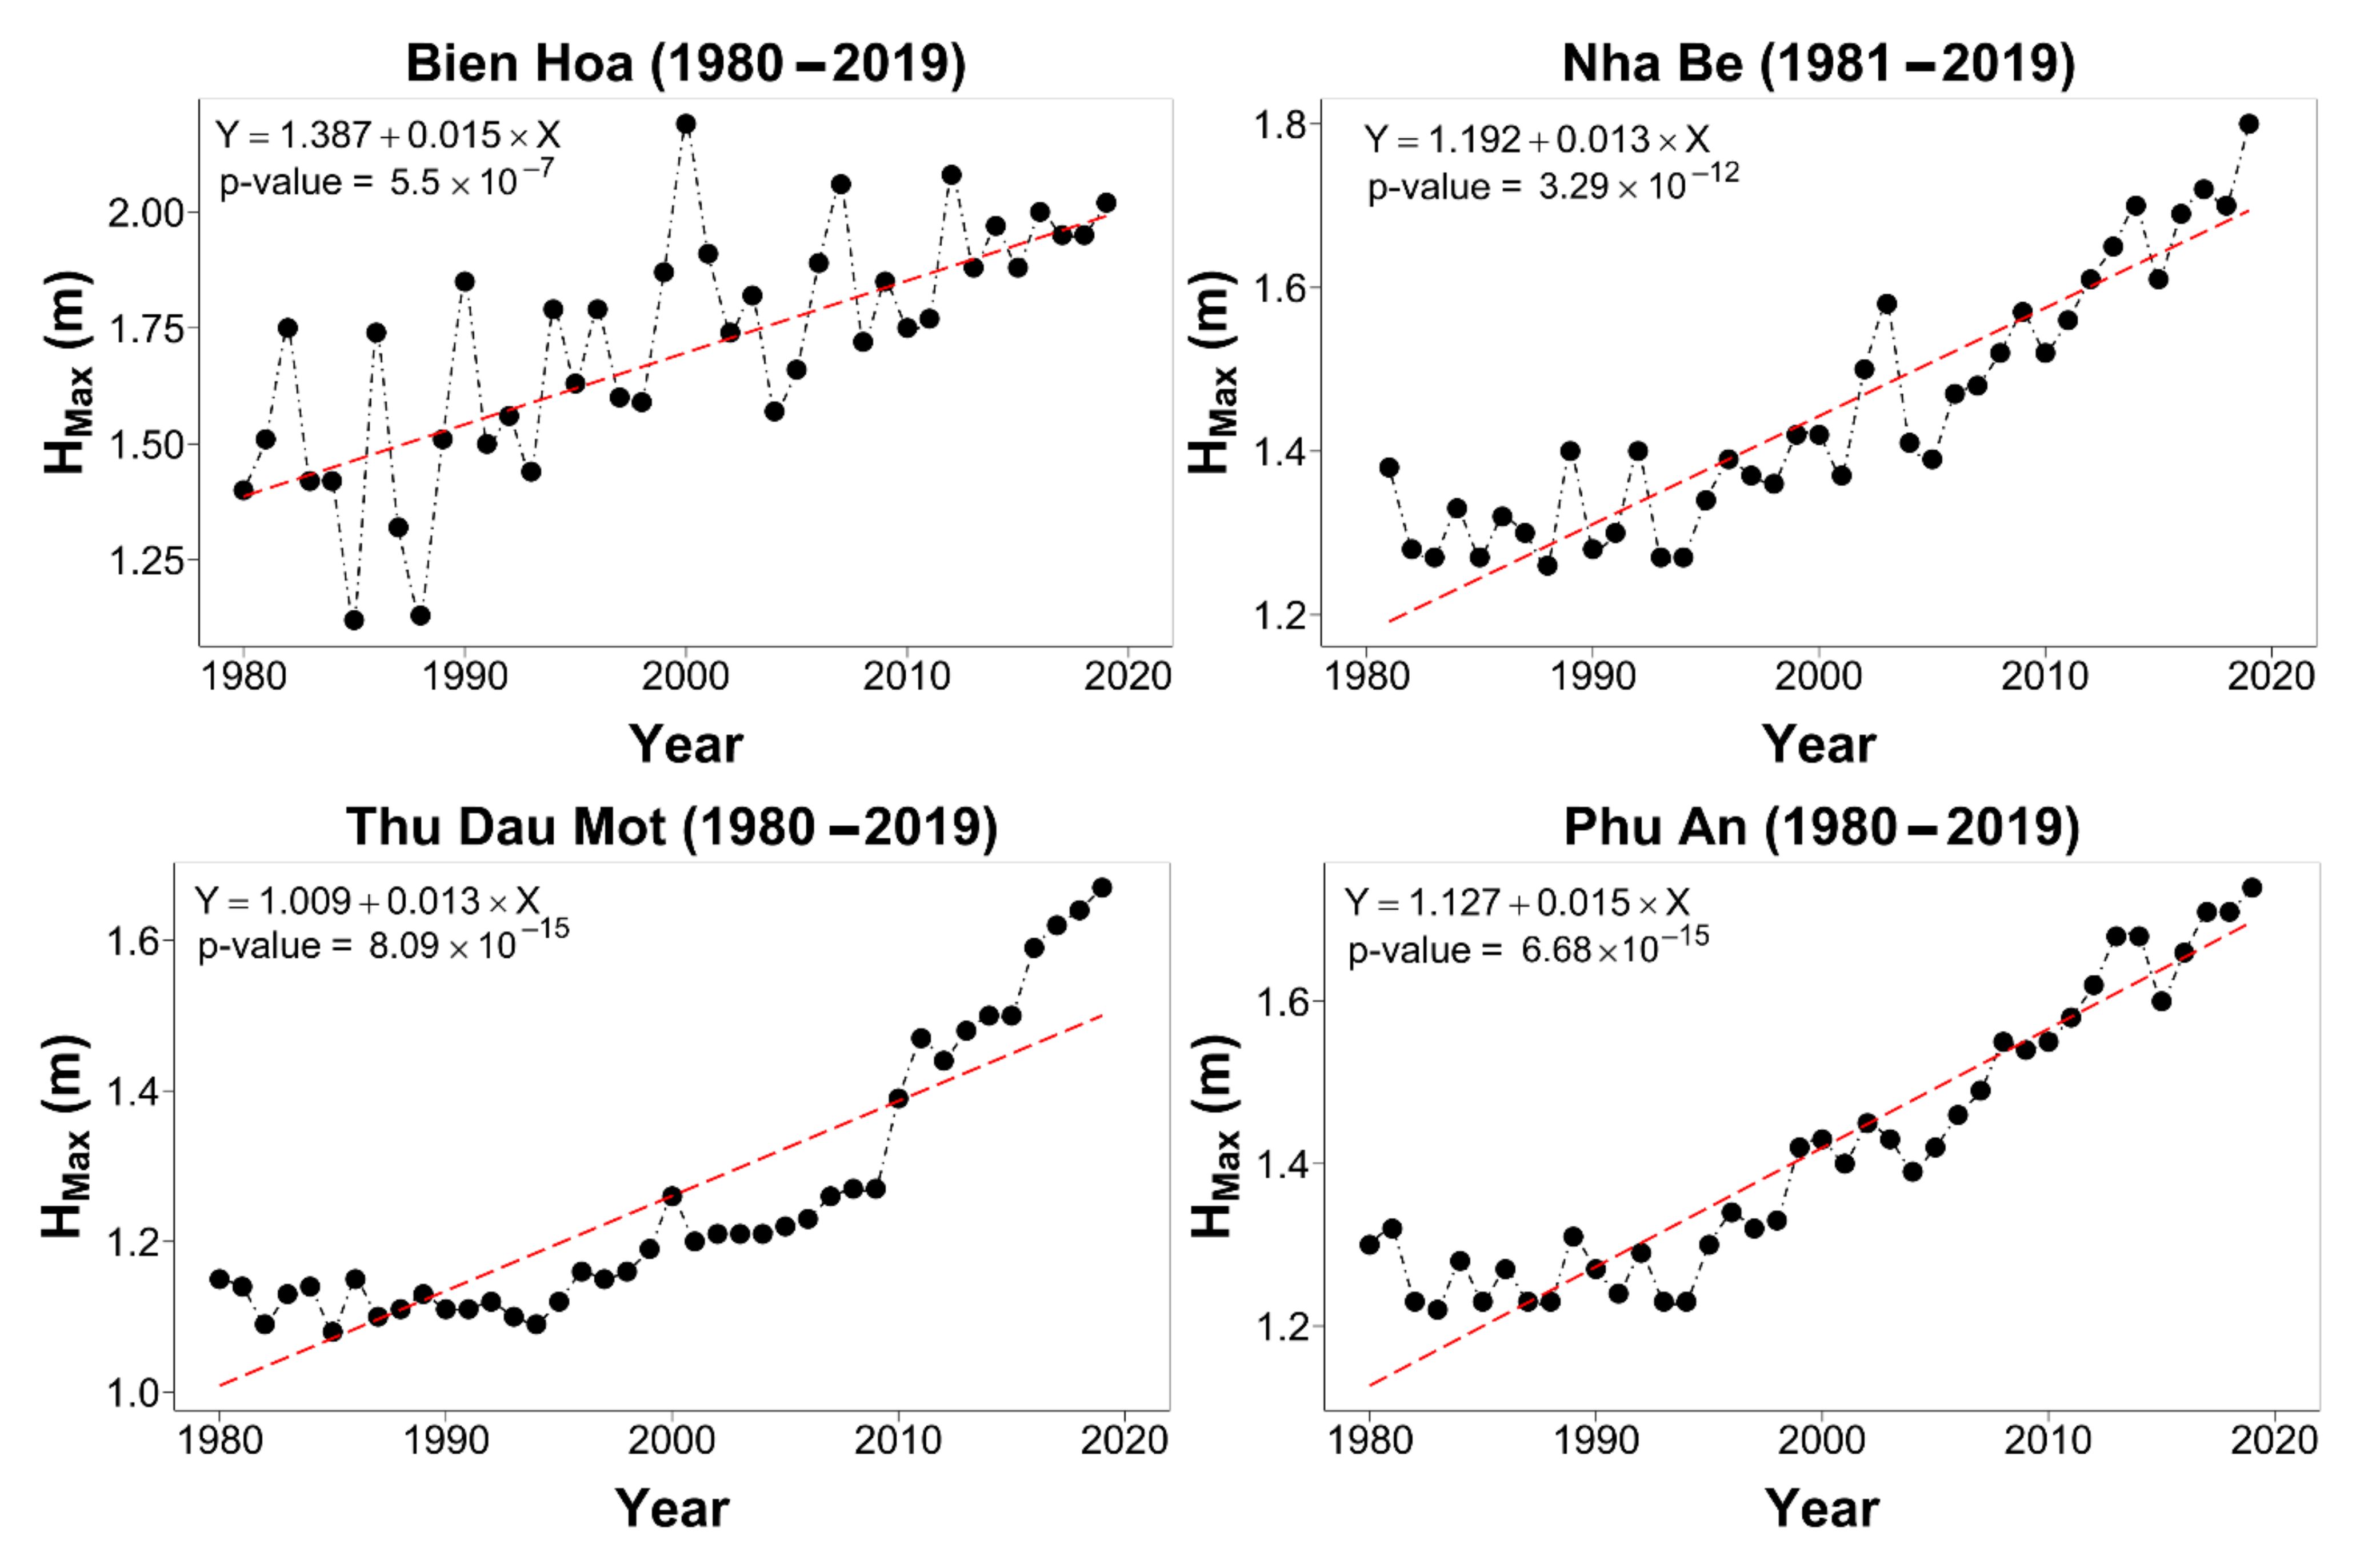
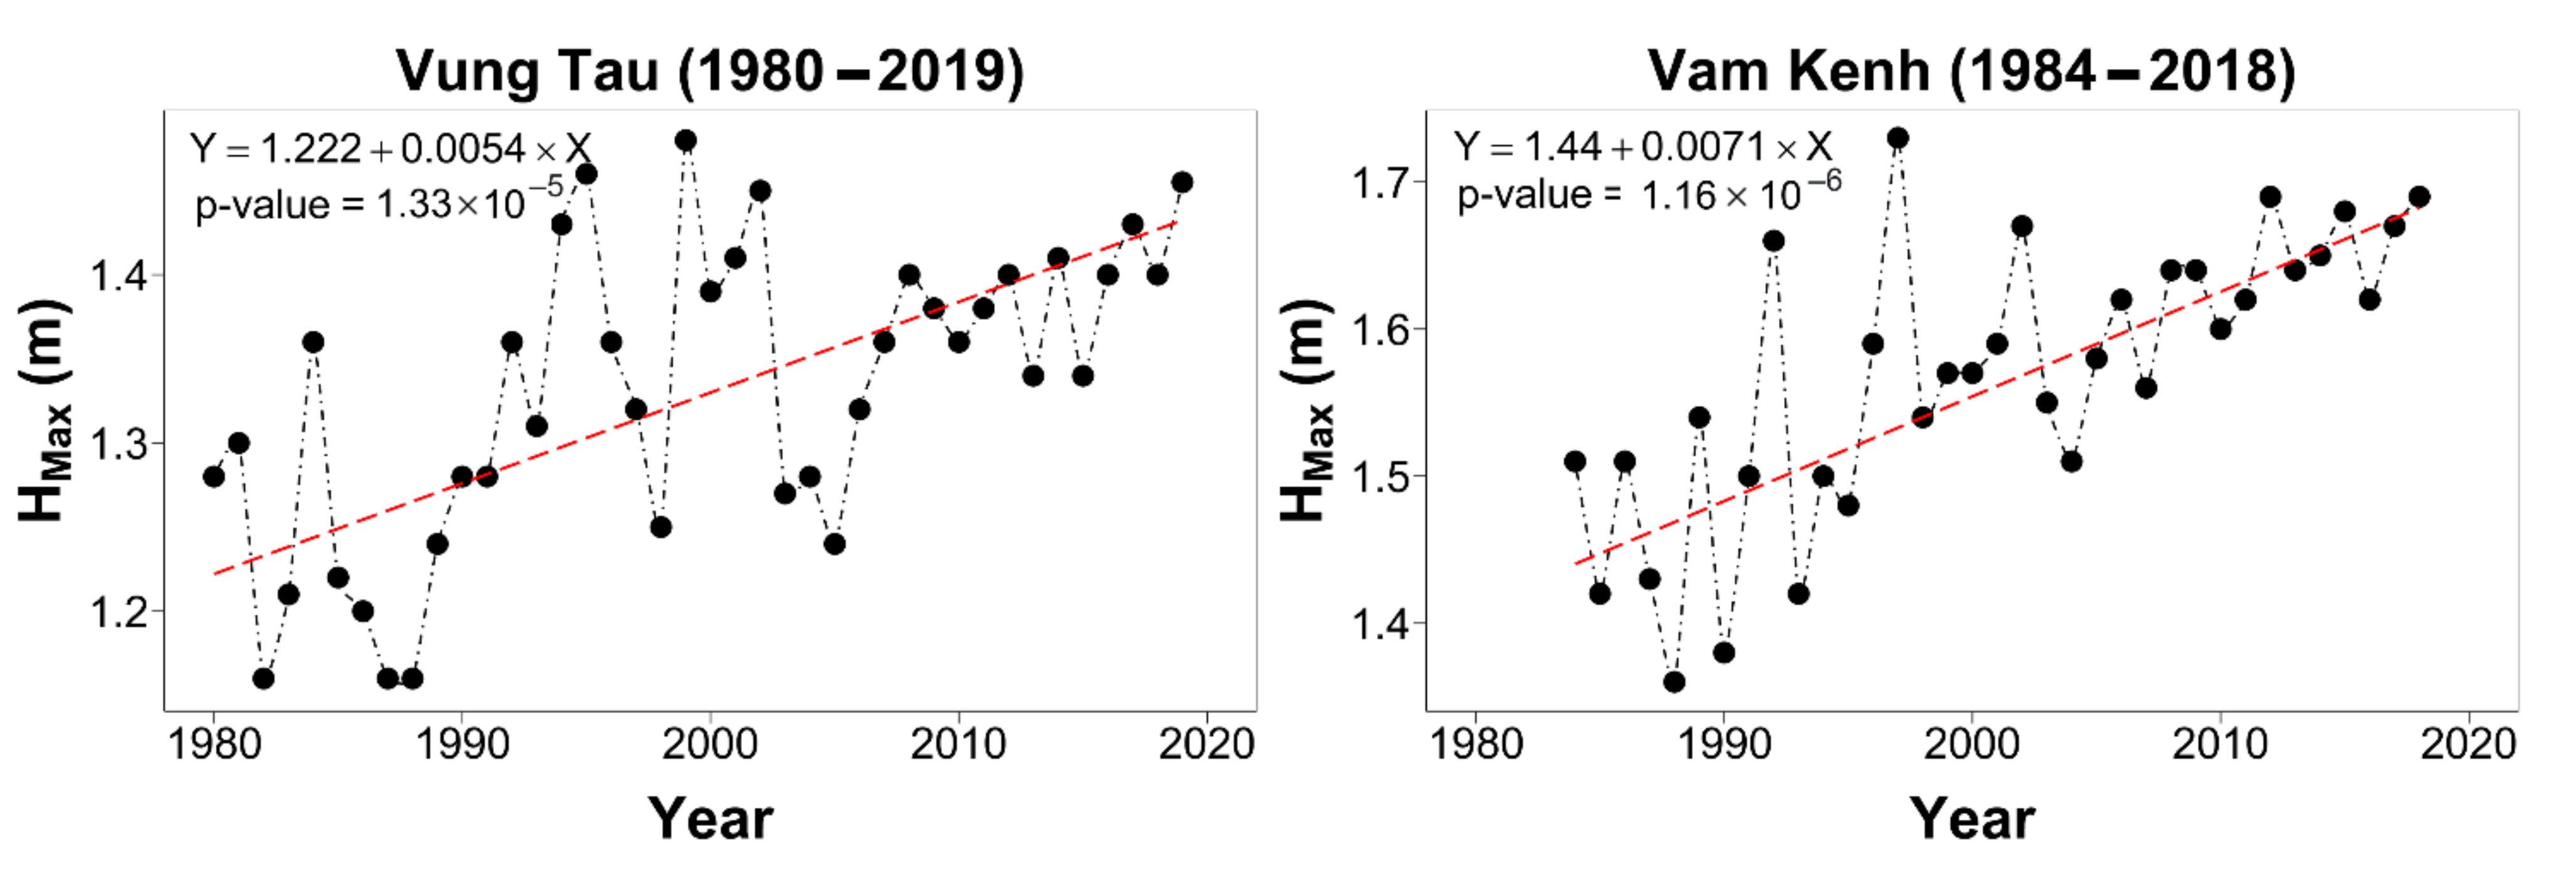
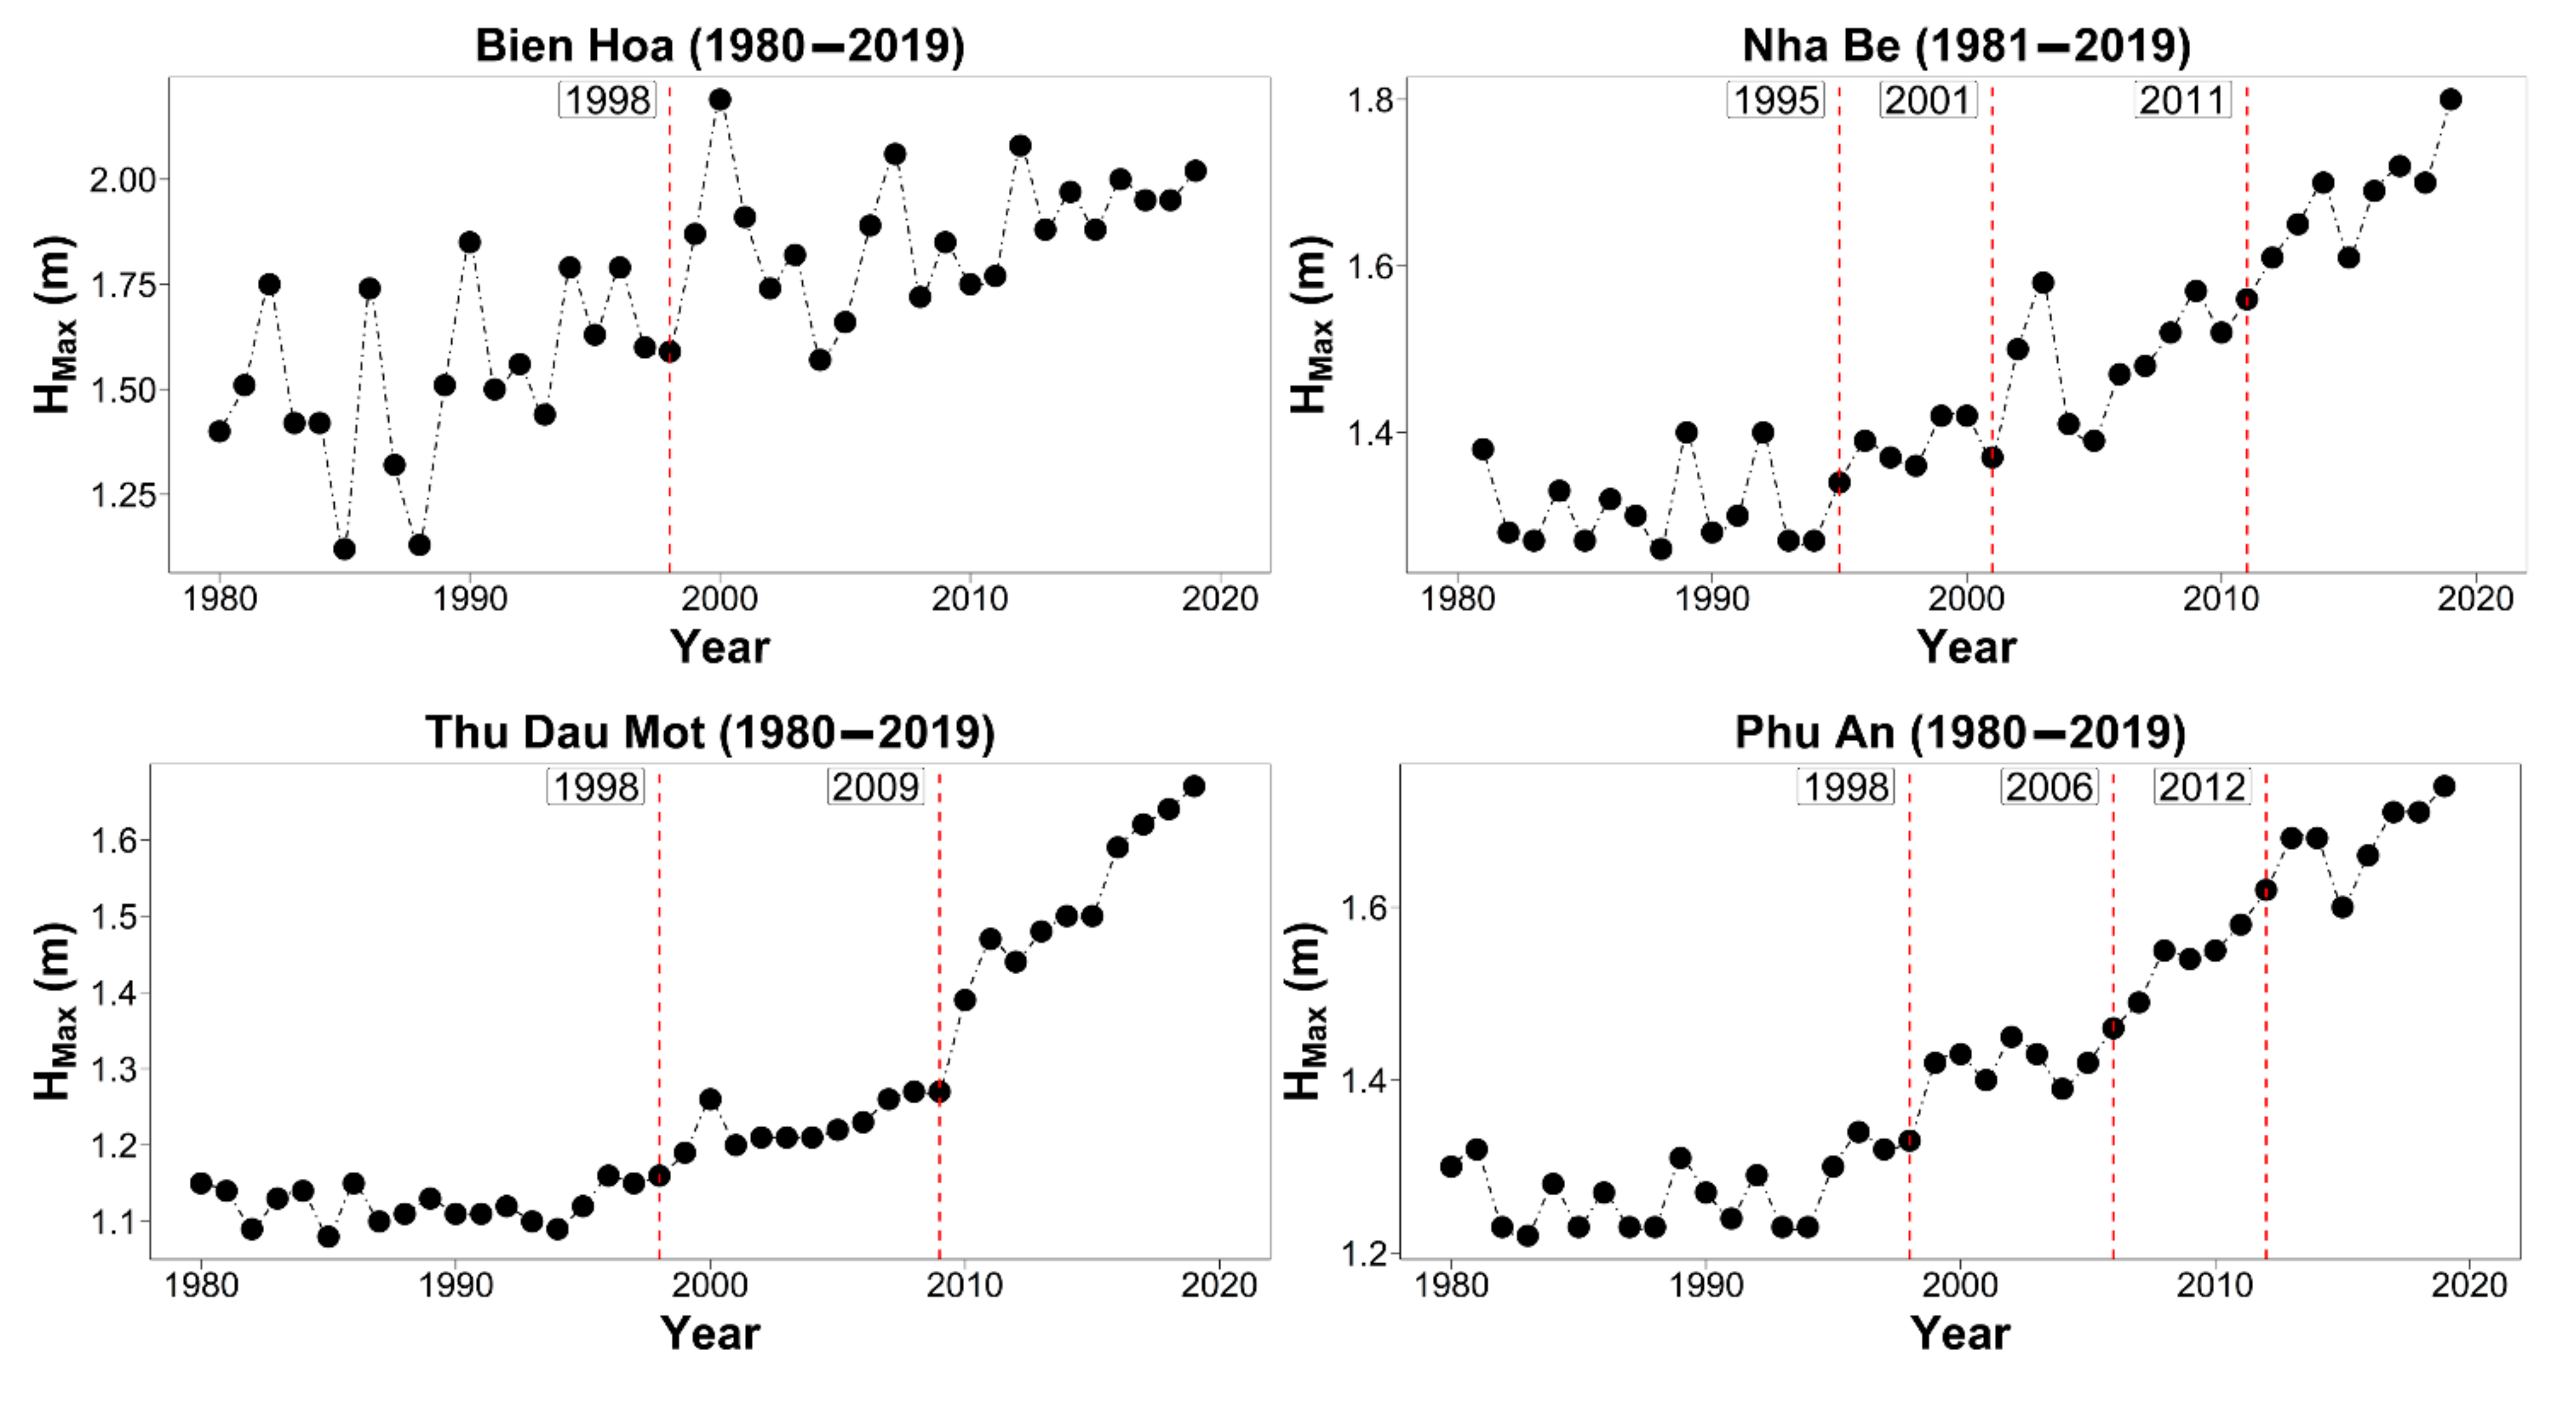
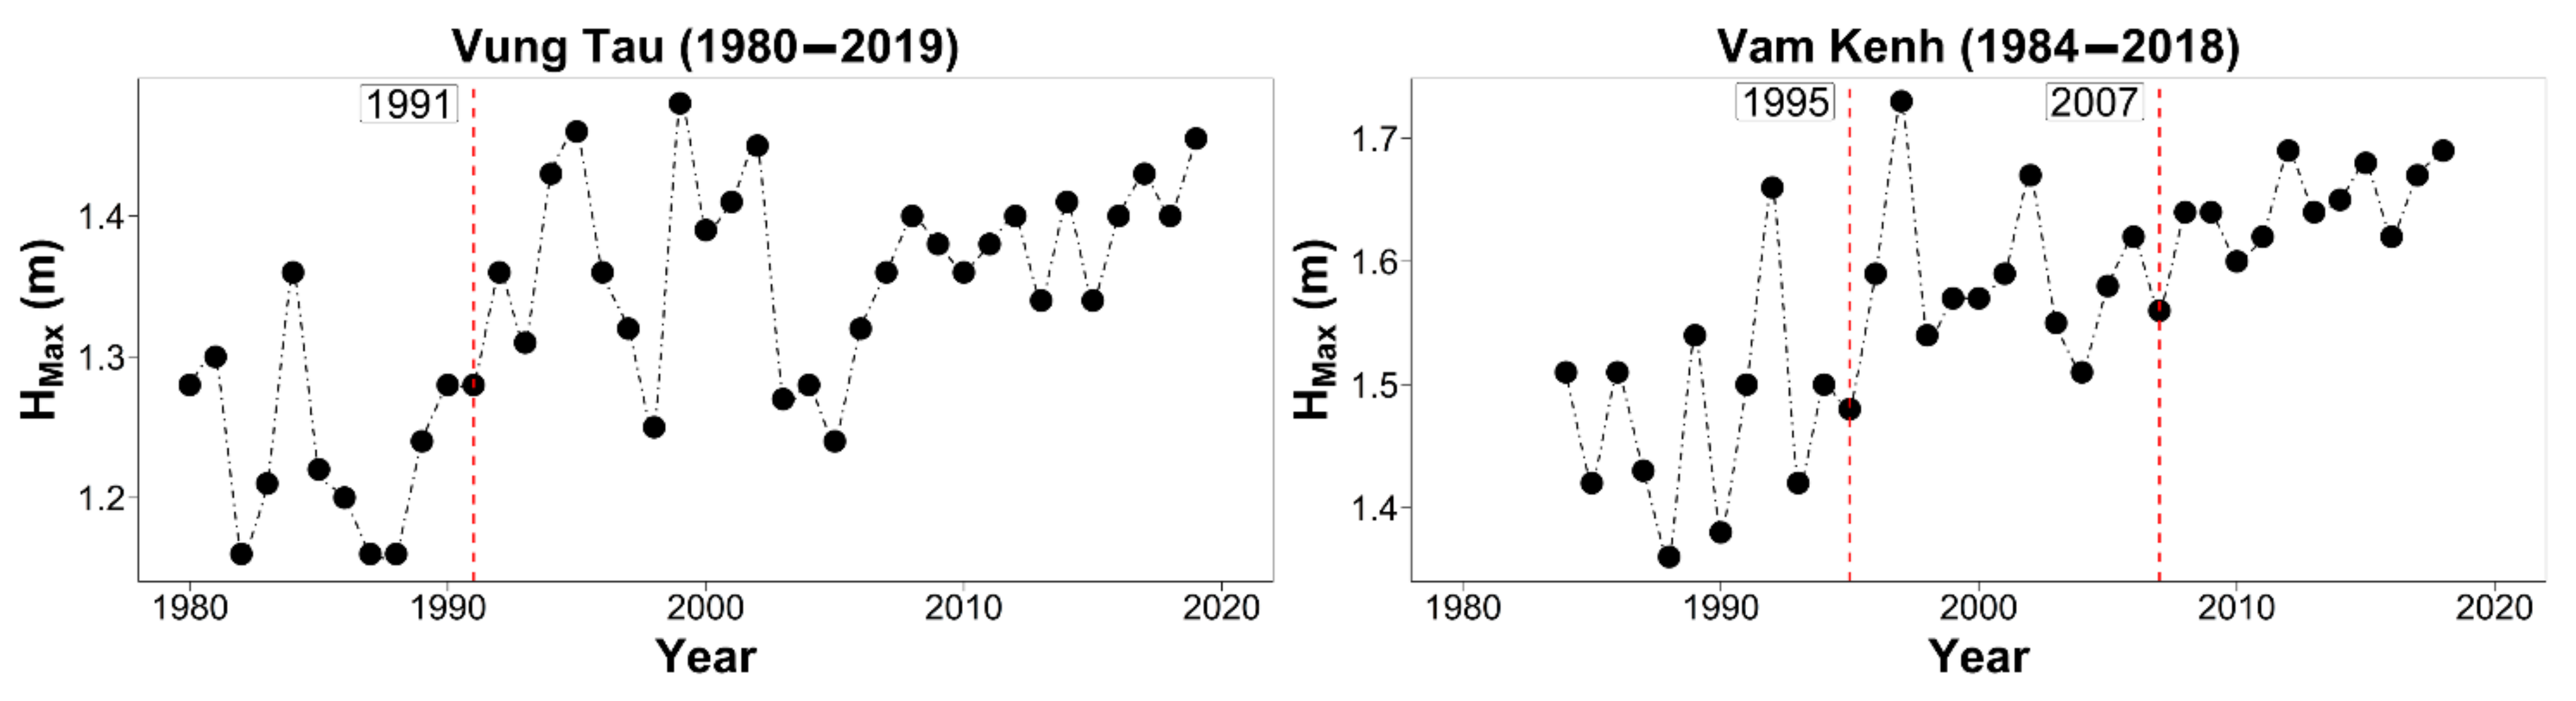
The maximum water levels at the monitoring stations tend to increase and have statistical significance (95% confidence level) when applying both the MK and TFPW testing methods (Figure 3). The trend and rate of water level rise are highest at about 1.55 cm/year, 1.32 cm/year, 1.26 cm/year, and 1.47 cm/year, respectively, at Bien Hoa, Nha Be, Thu Dau Mot, and Phu An stations, respectively (calculated by TFPW). On the other hand, the water level rises slowly at tidal level monitoring stations (Vung Tau, Vam Kenh), ranging from about 0.5 cm/year to 0.71 cm/year.
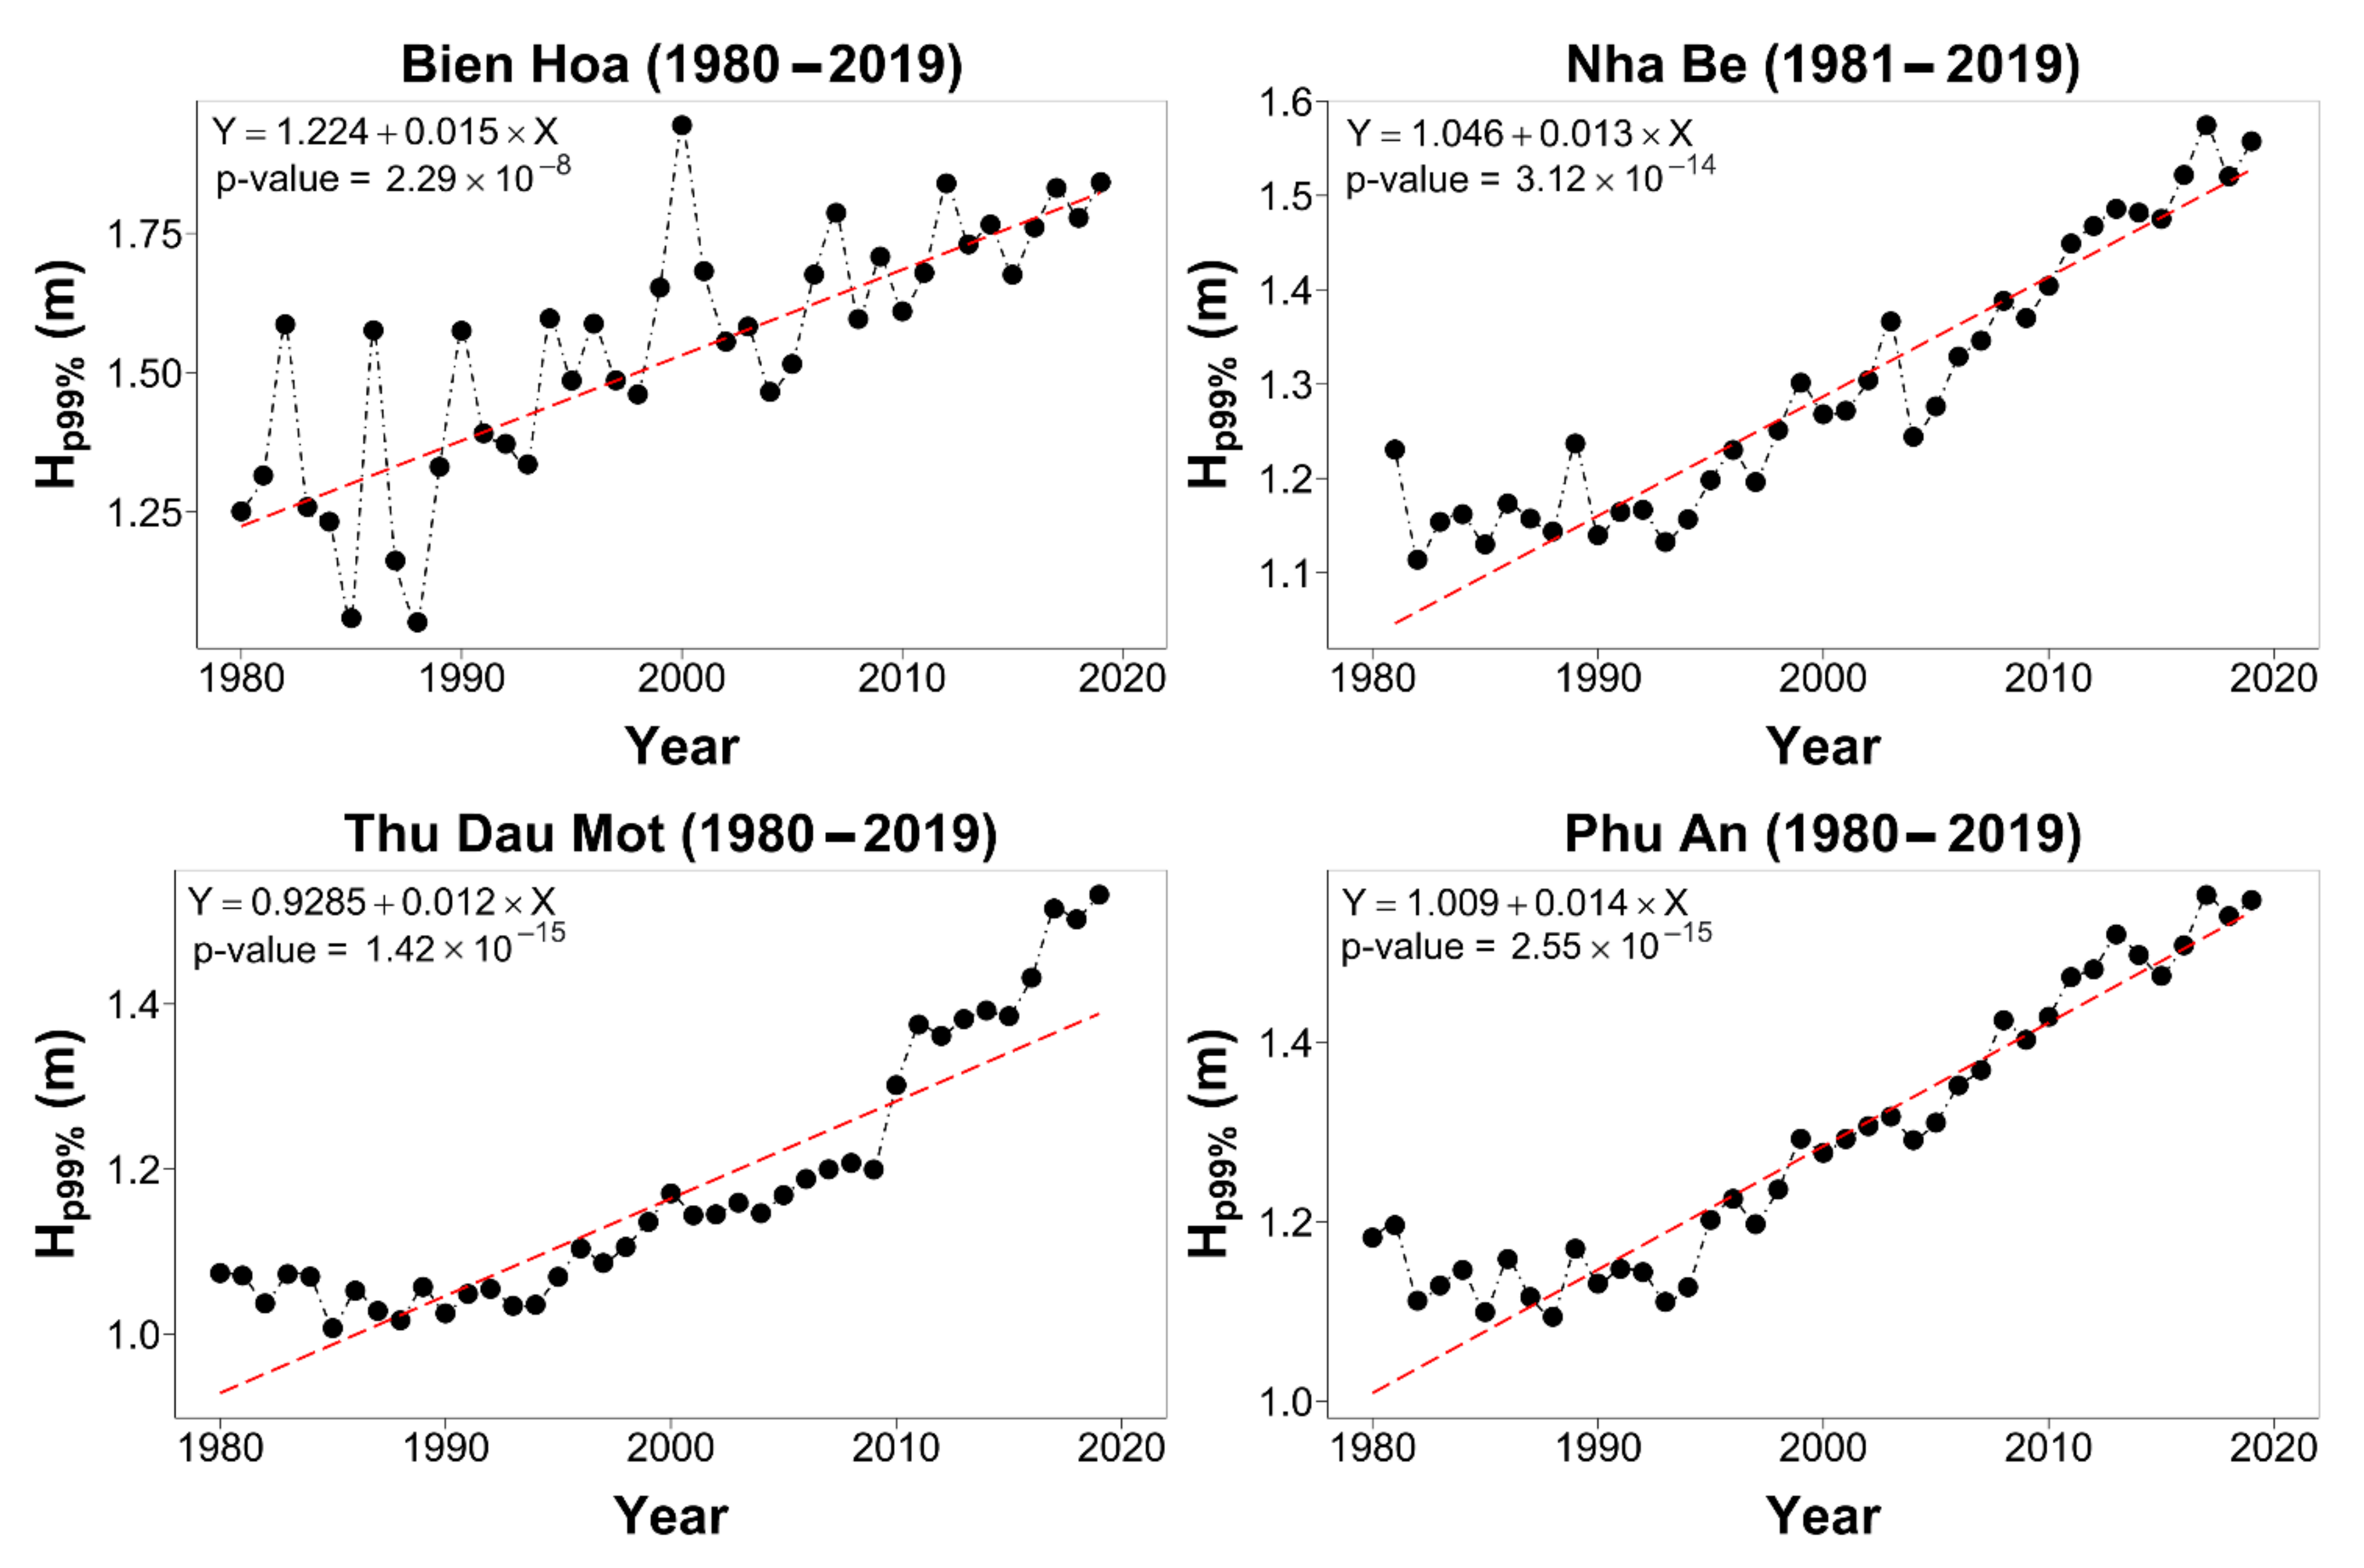
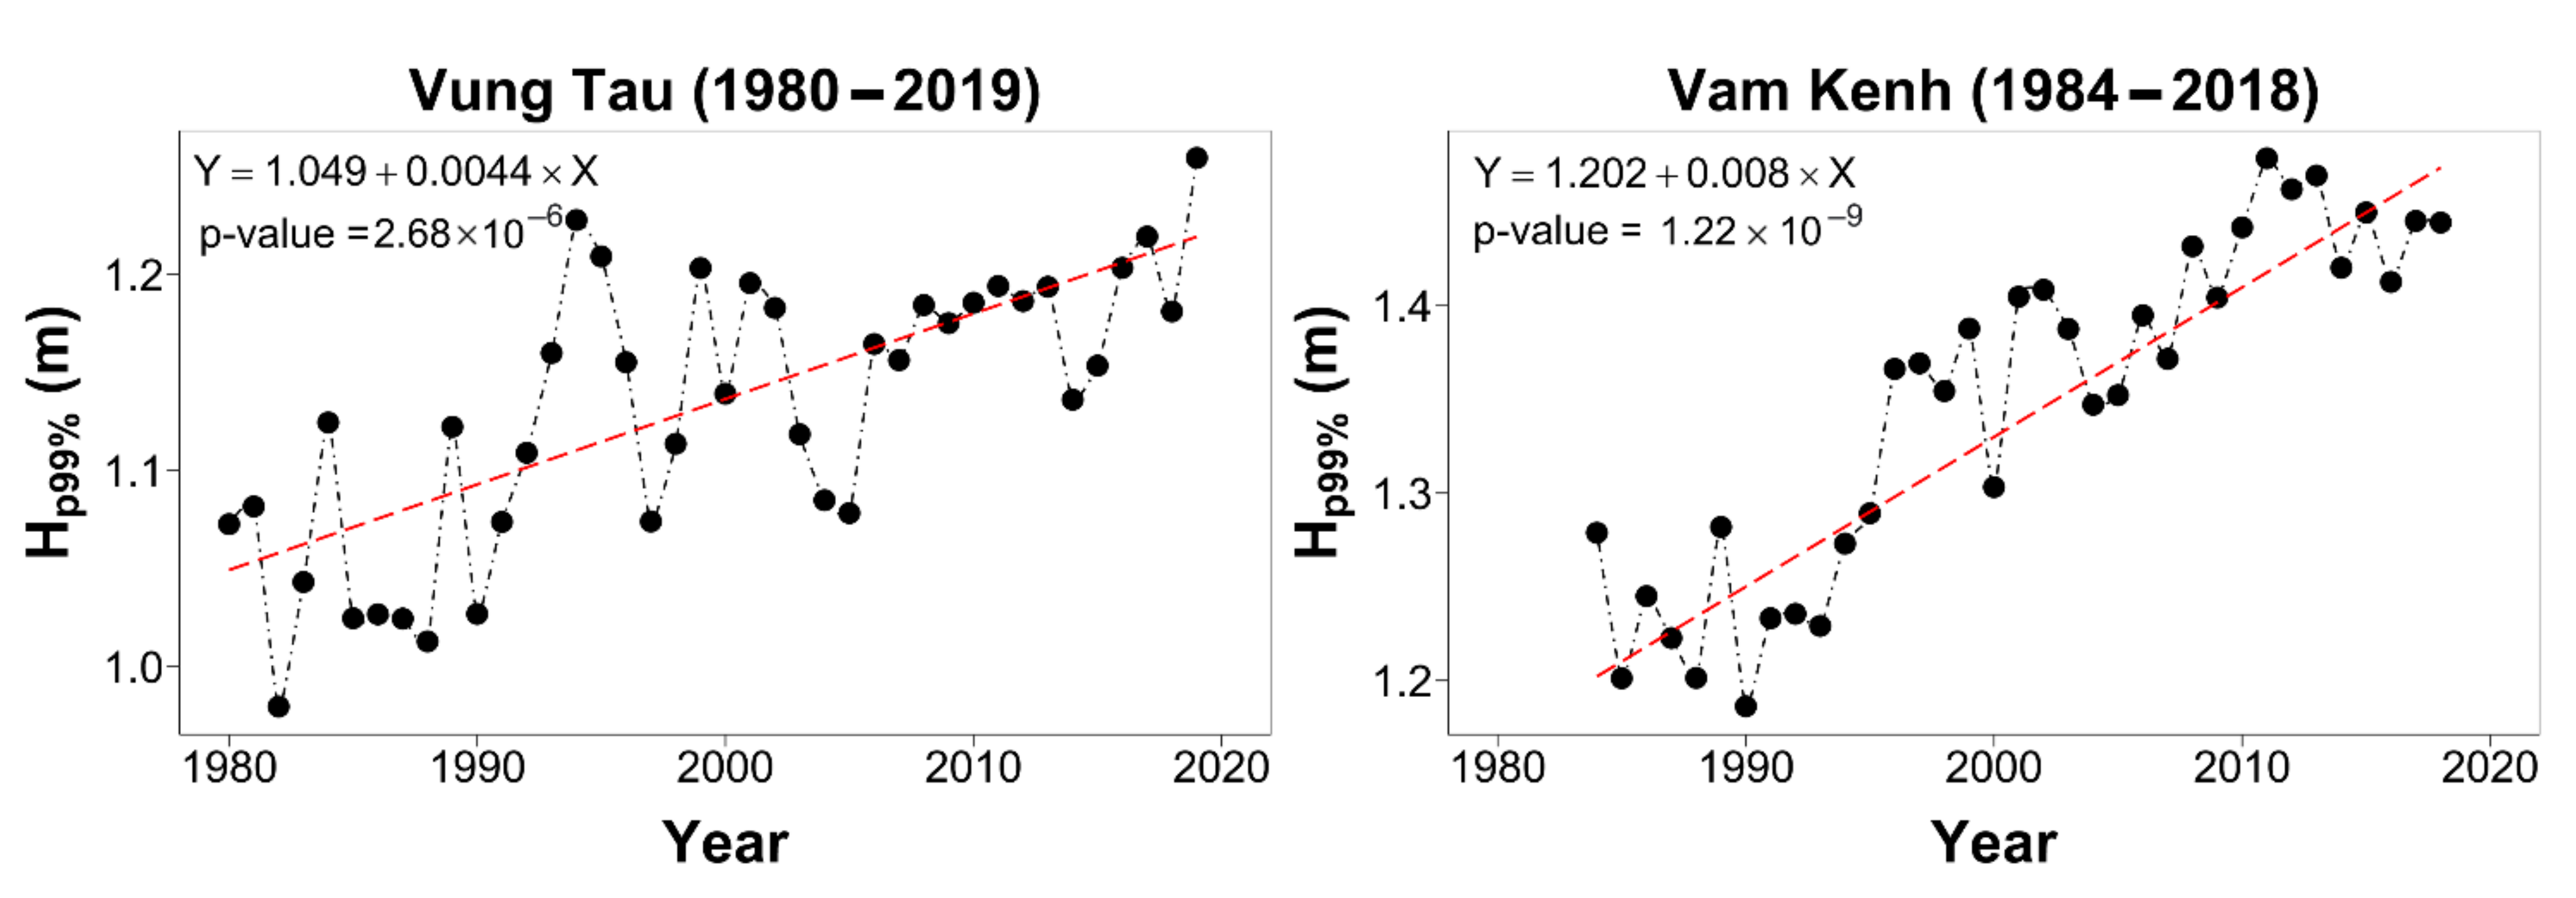
Similarly, the water level trend for Hp99% also increases at all the monitoring stations (Figure A1 in the Appendix A). The rising rate of the water level at the inland stations is always 2–3 times higher than that of the tidal water level monitoring stations.
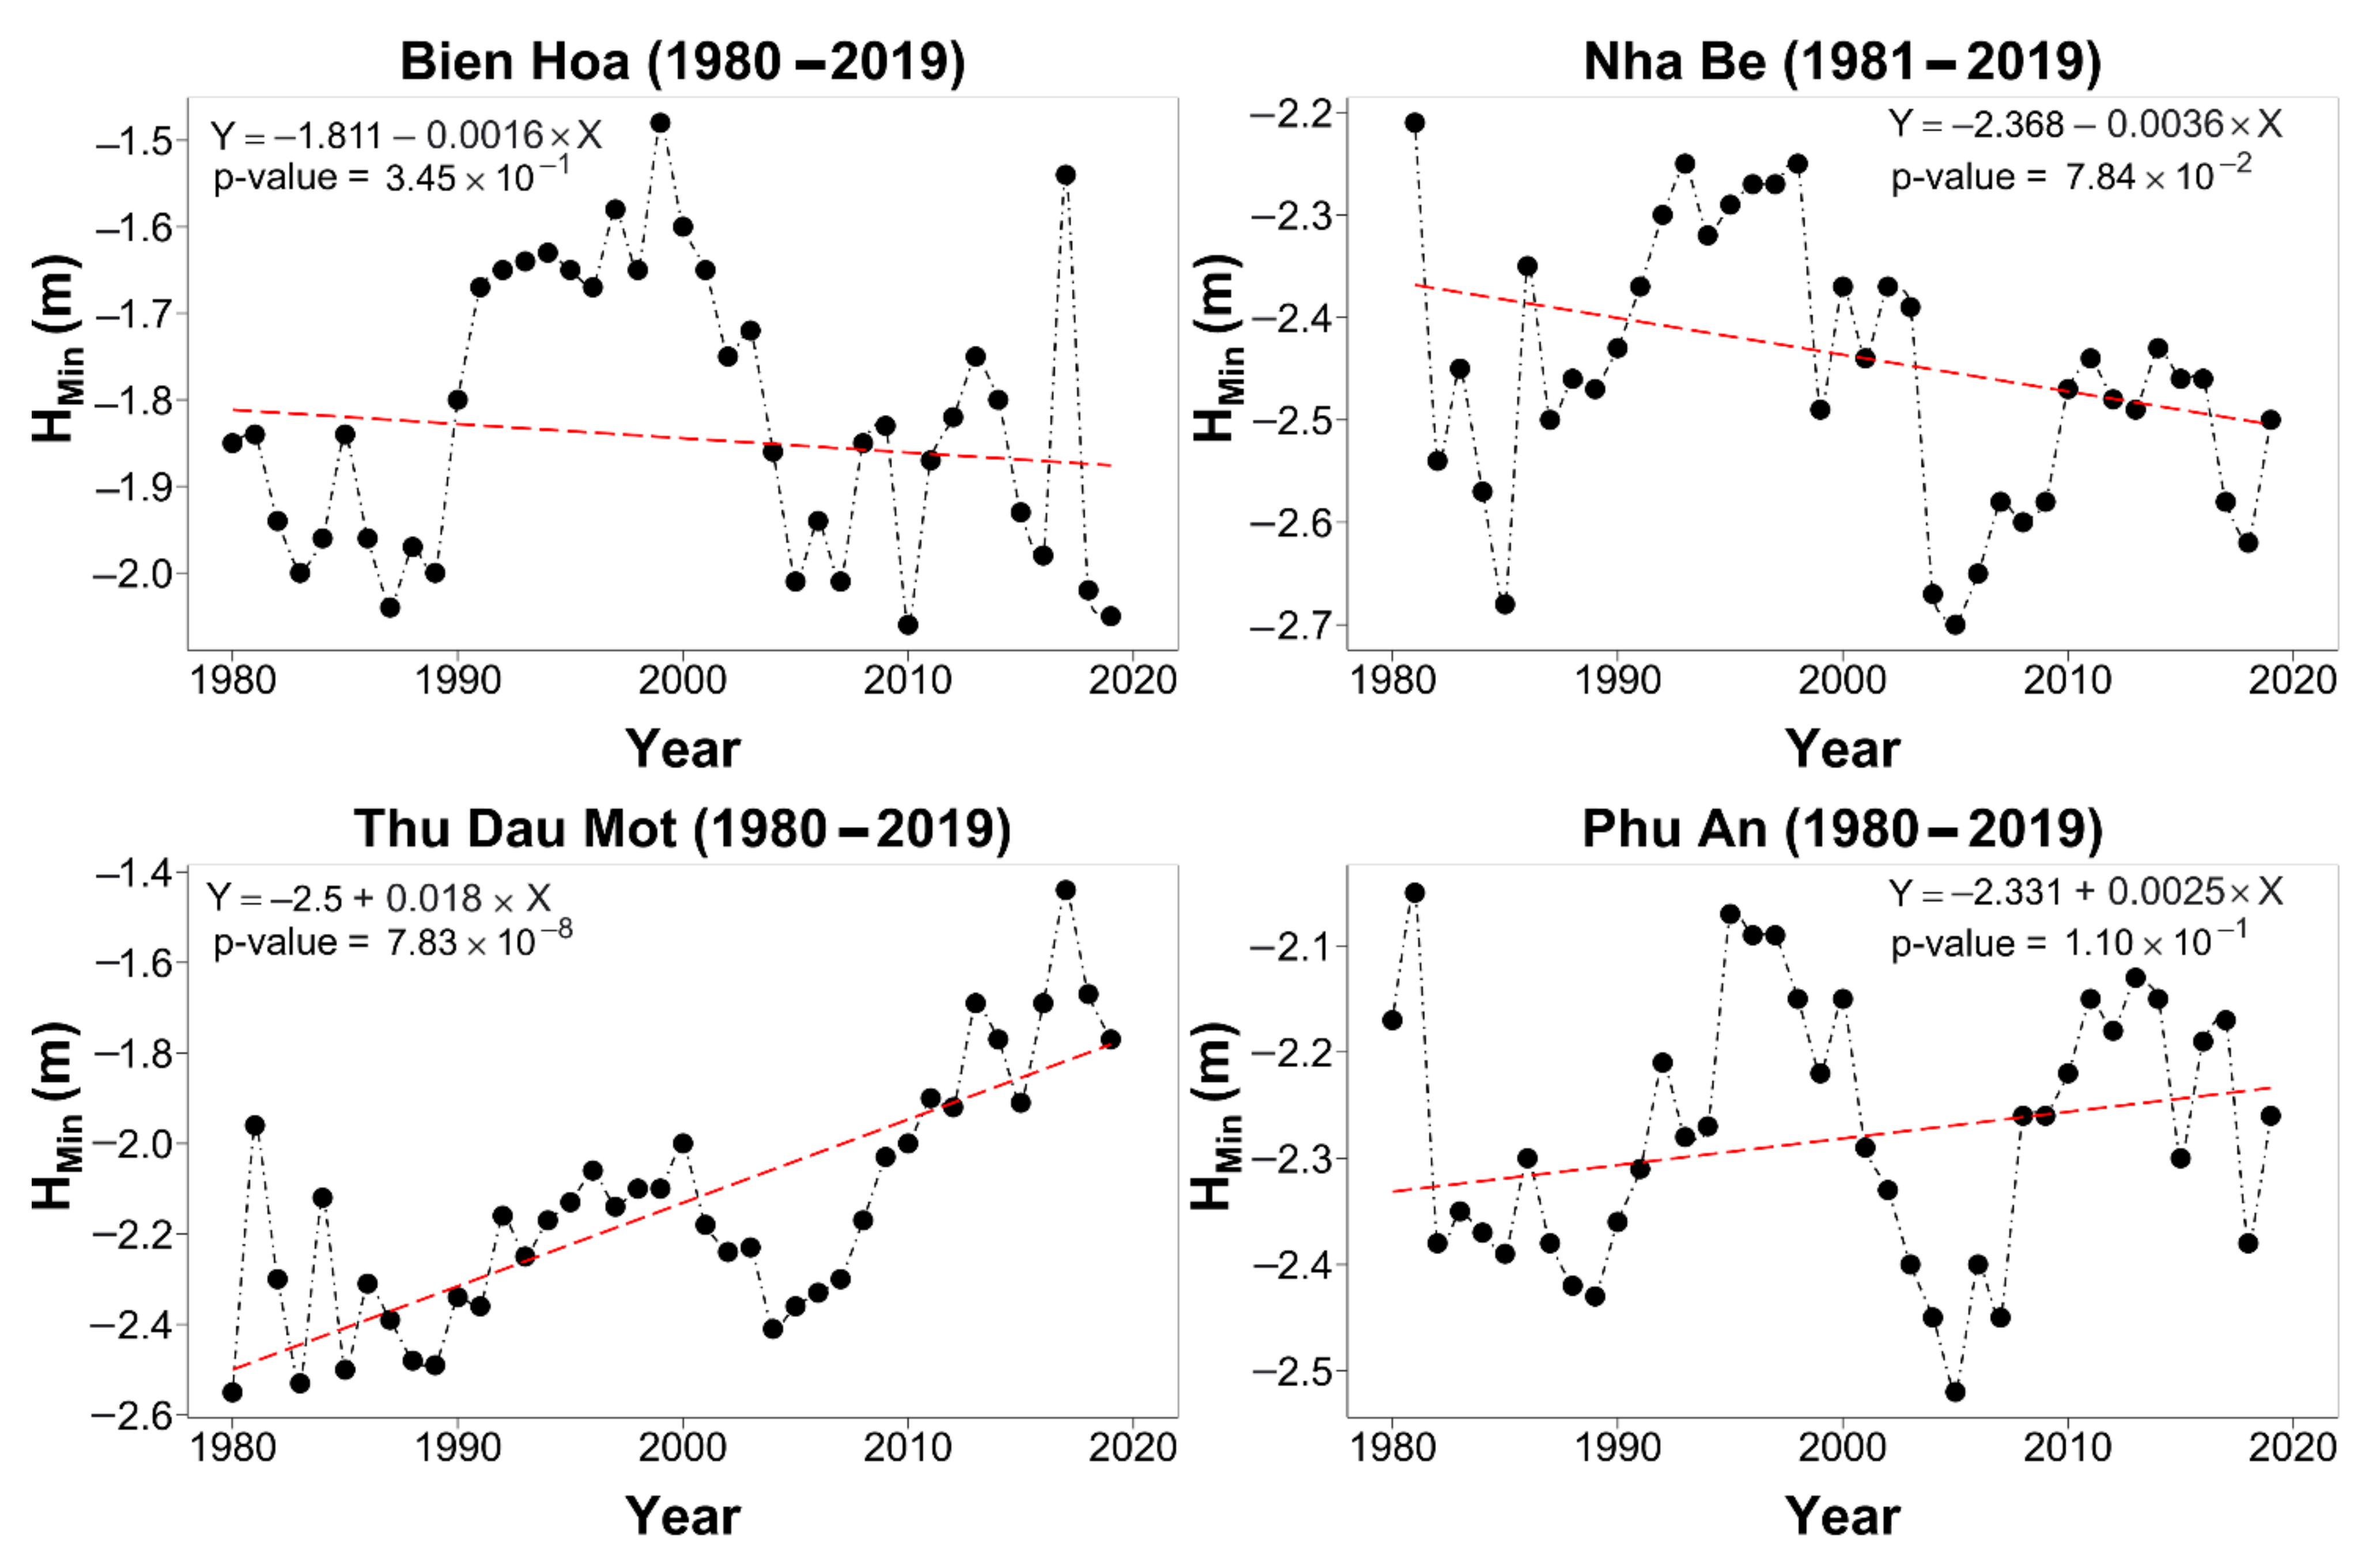
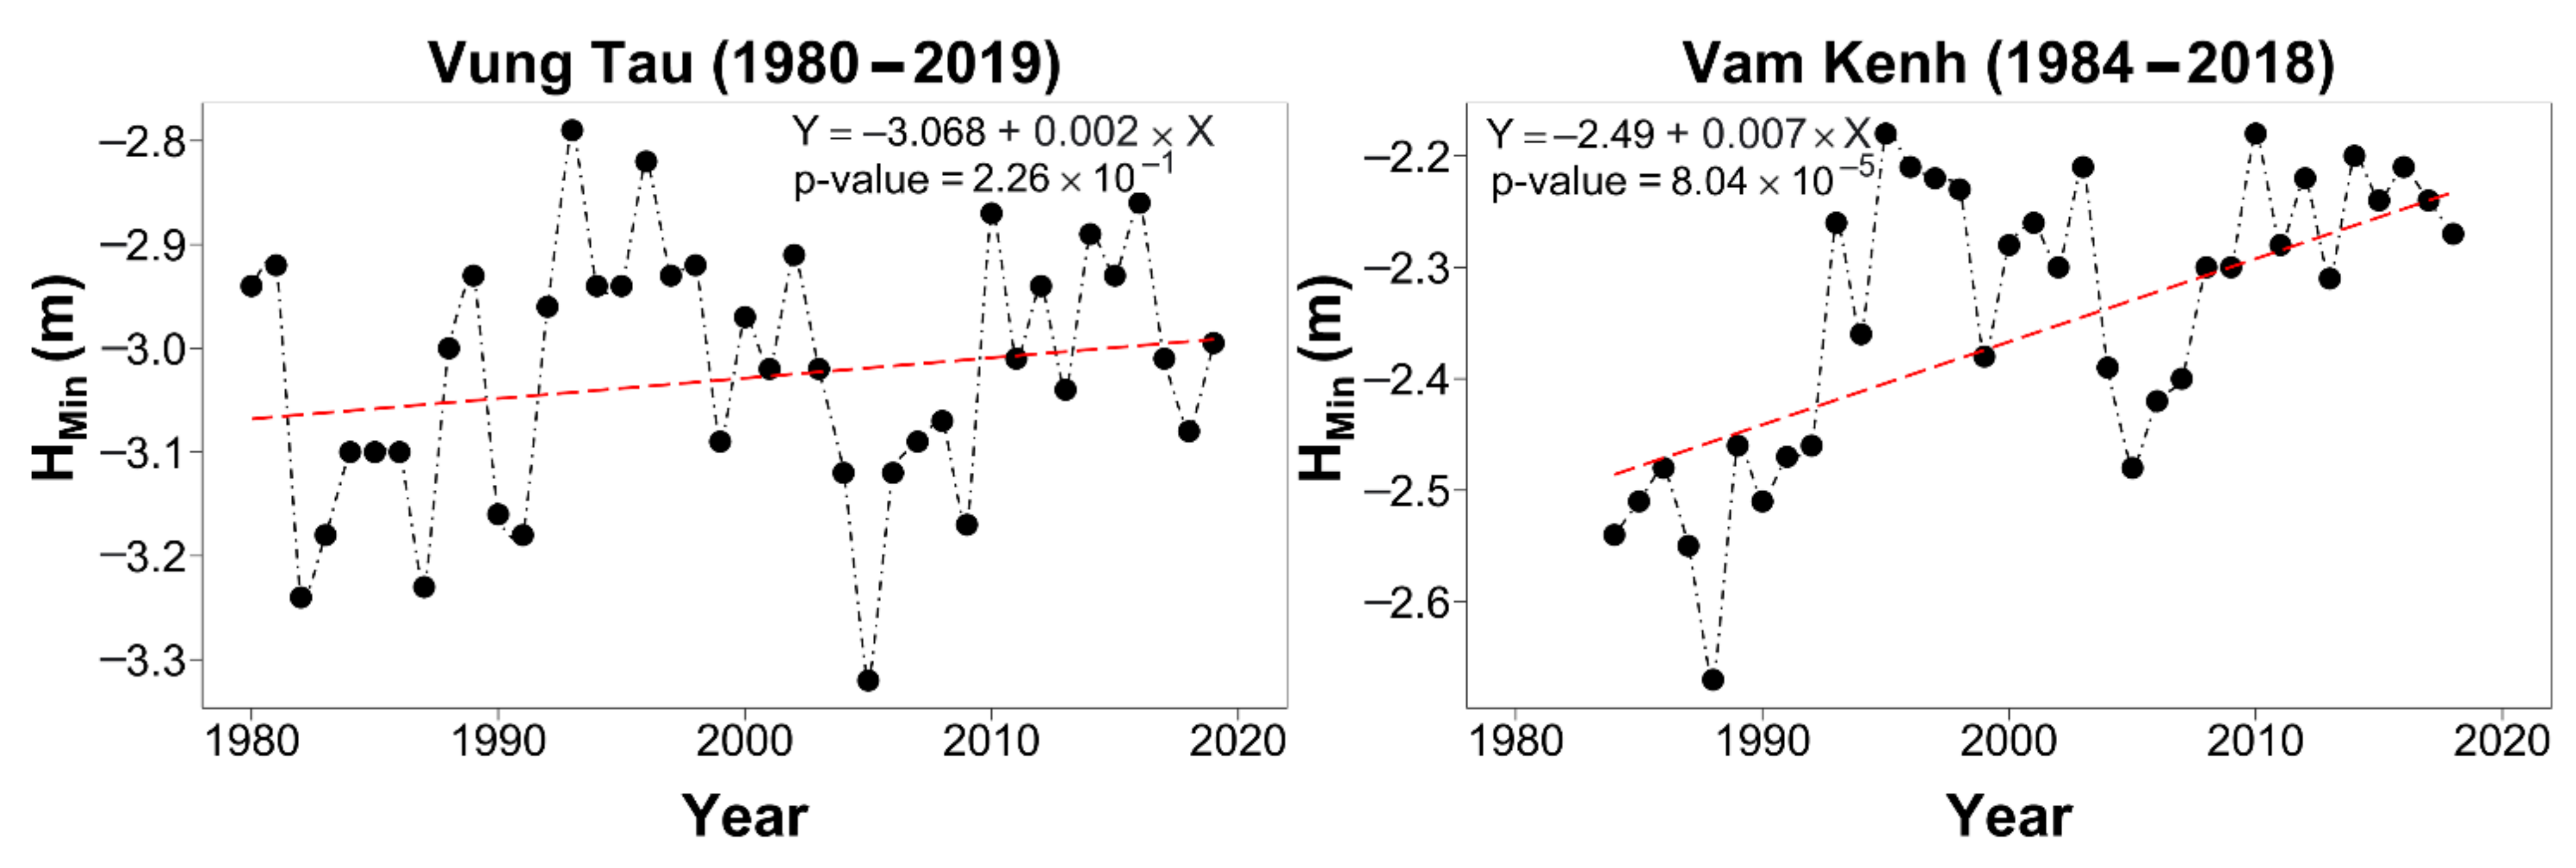
Trend of Hp1%, Hmin (Minimum Water Level)
In general, the Hmin water level trends at the monitoring stations do not show a clear direction except at Thu Dau Mot and Vam Kenh (Figure 4). On the Saigon River, the water level in Thu Dau Mot increased by about 1.8 cm/year. In comparison, the minimum water level in Phu An increased only slightly (0.17 cm/year) and was not statistically significant. On Dong Nai river, the minimum water level at Bien Hoa station did not change much, but there was a slight decrease of about 0.38 cm/year at Nha Be station.
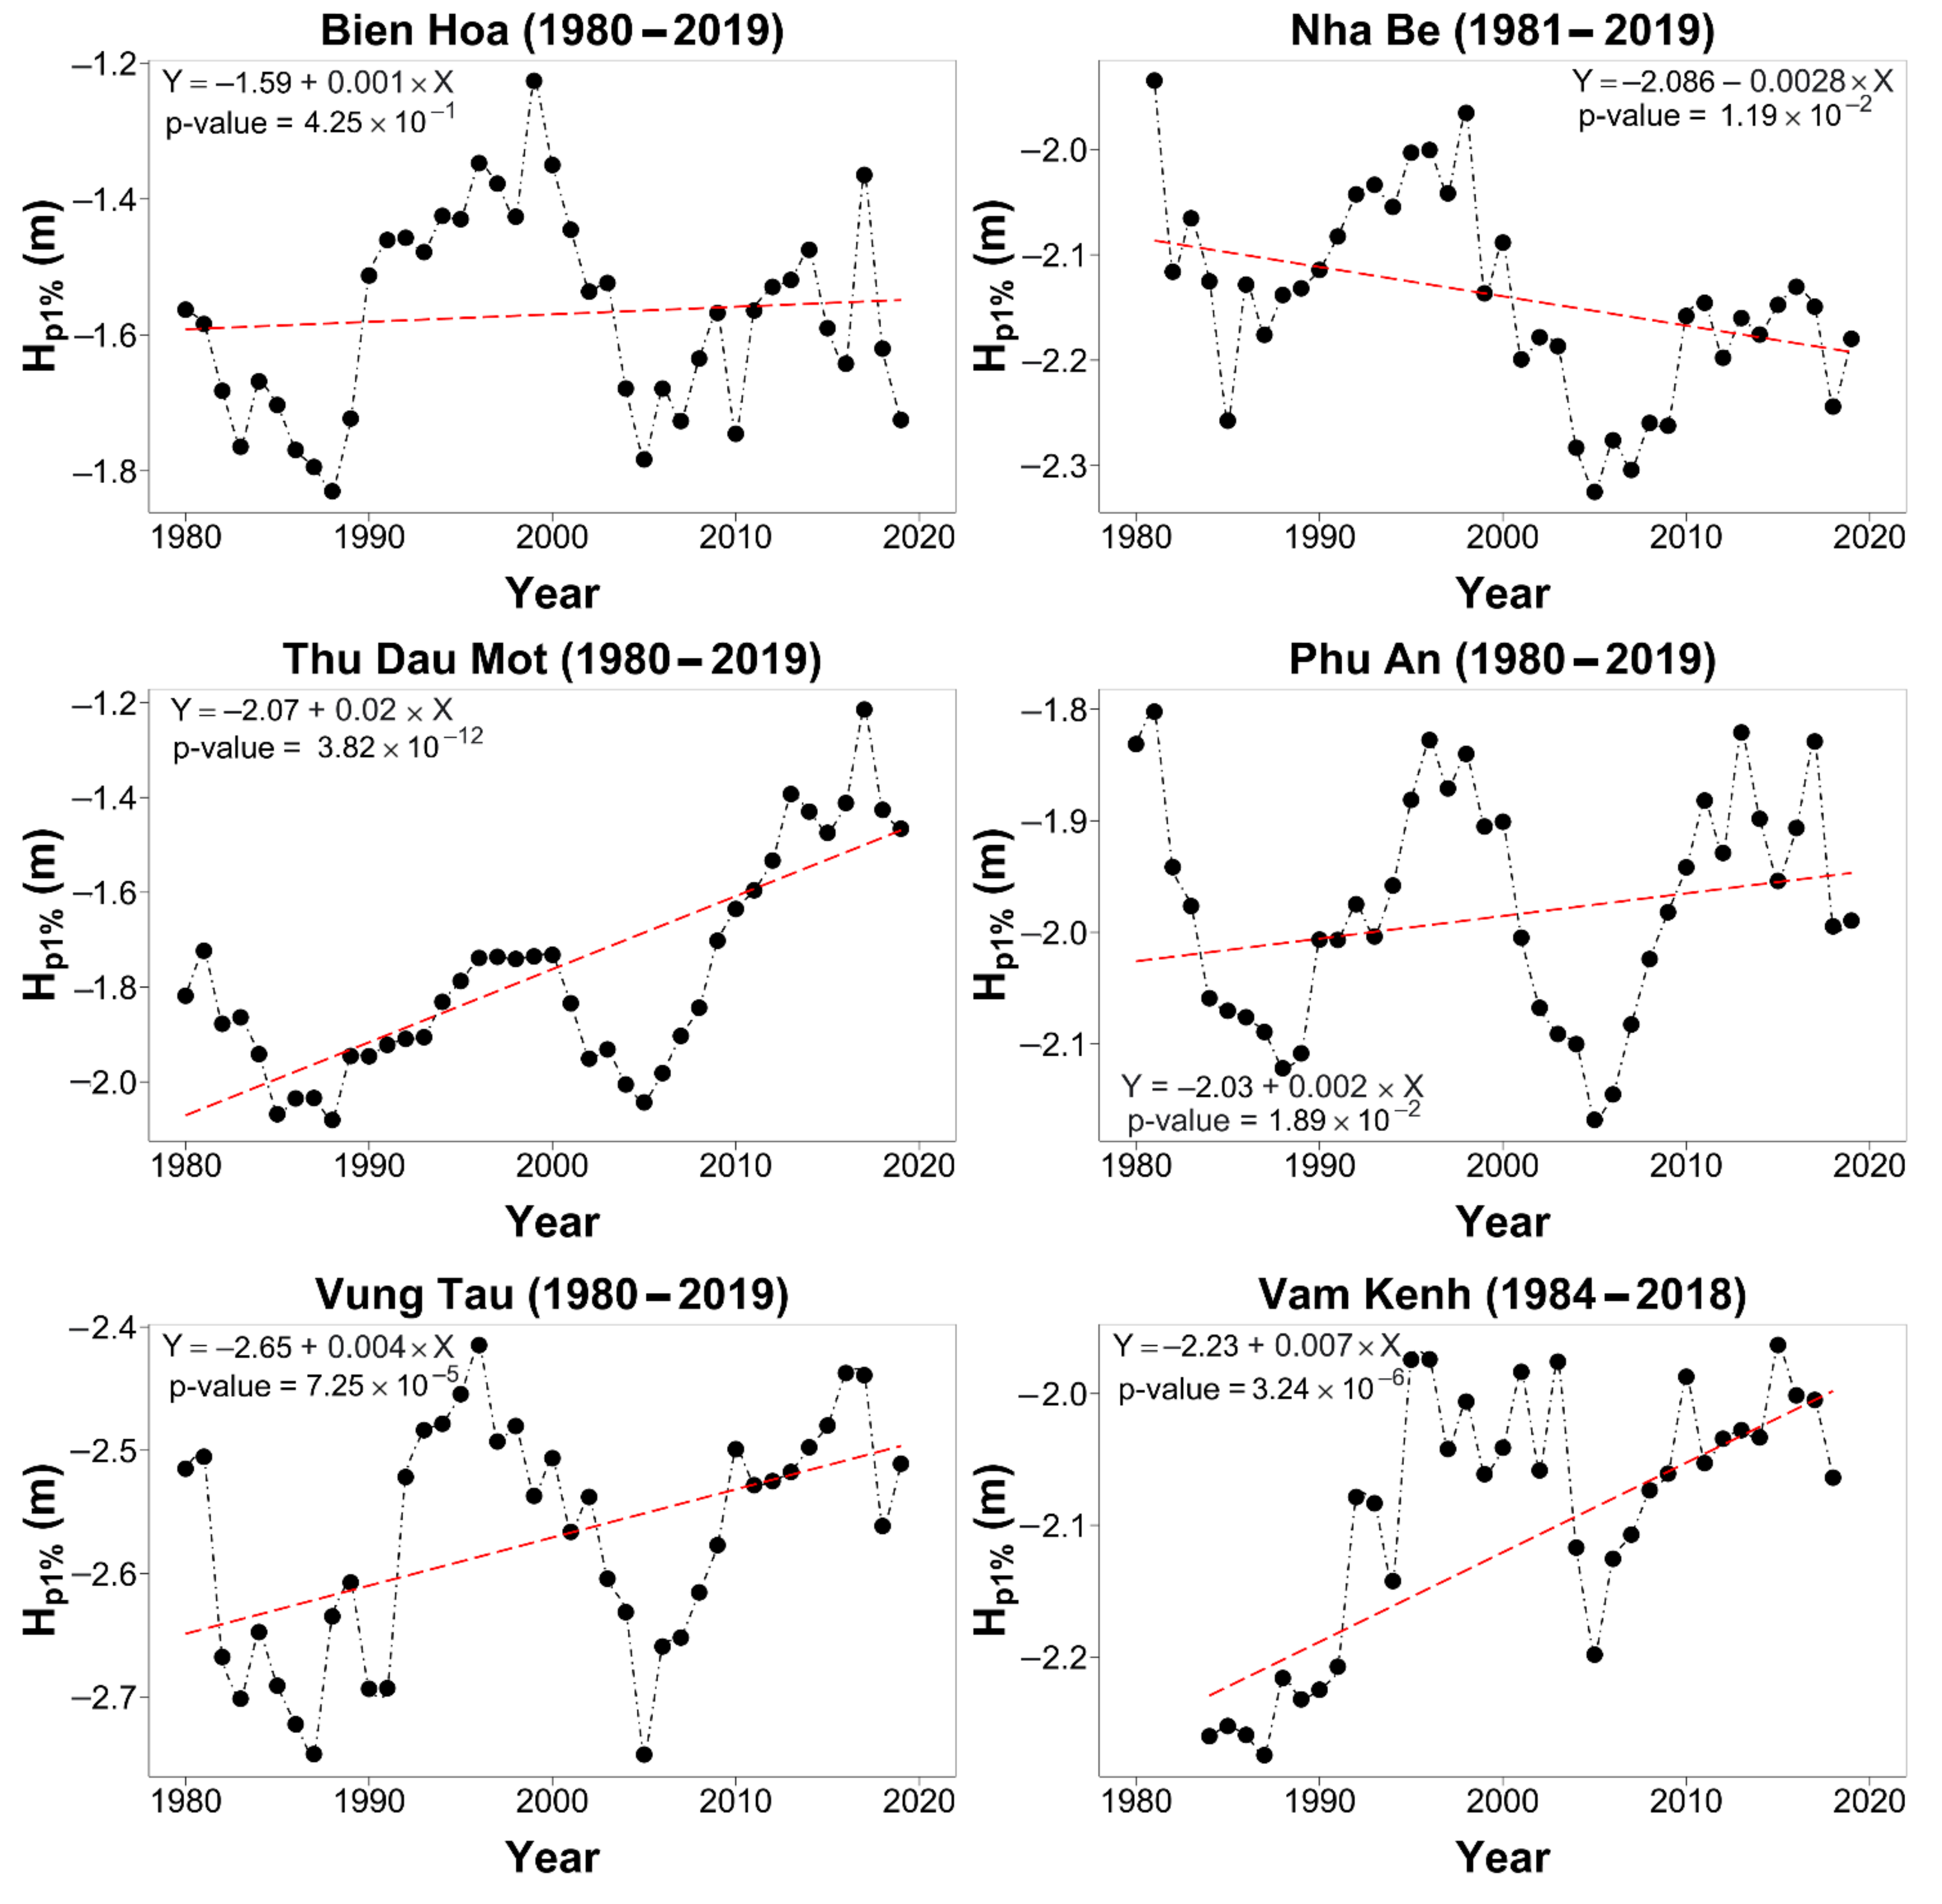
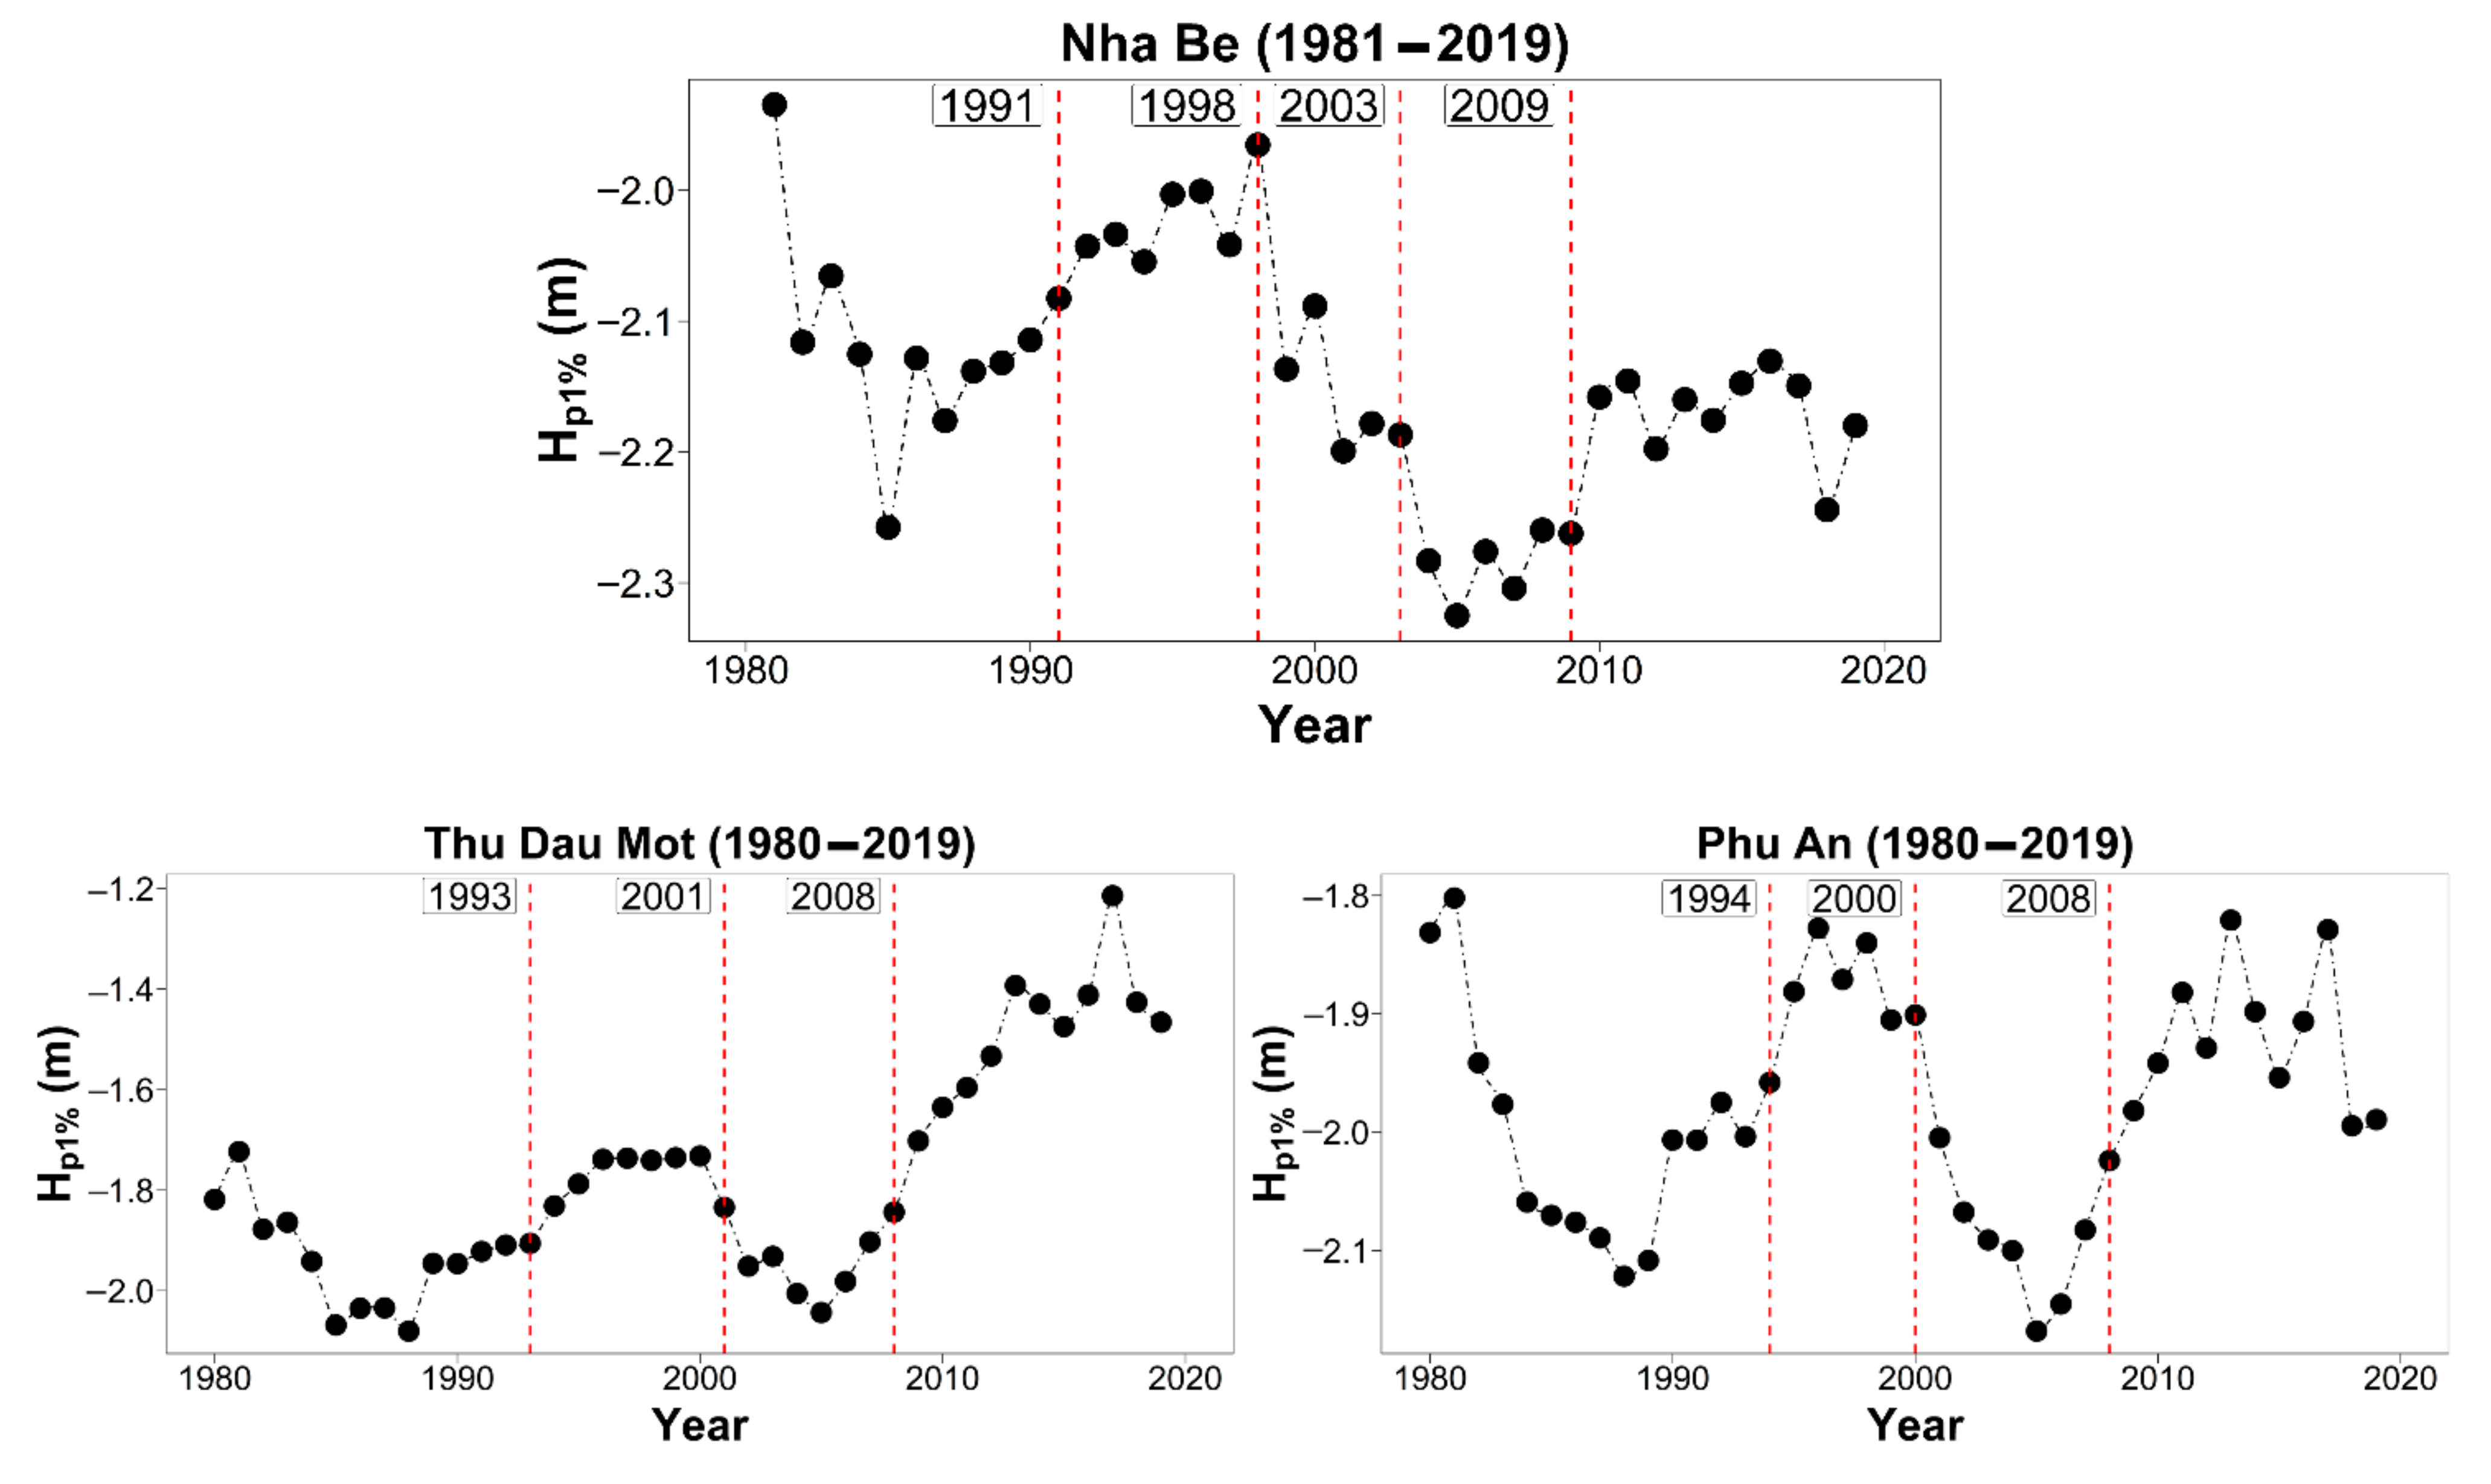
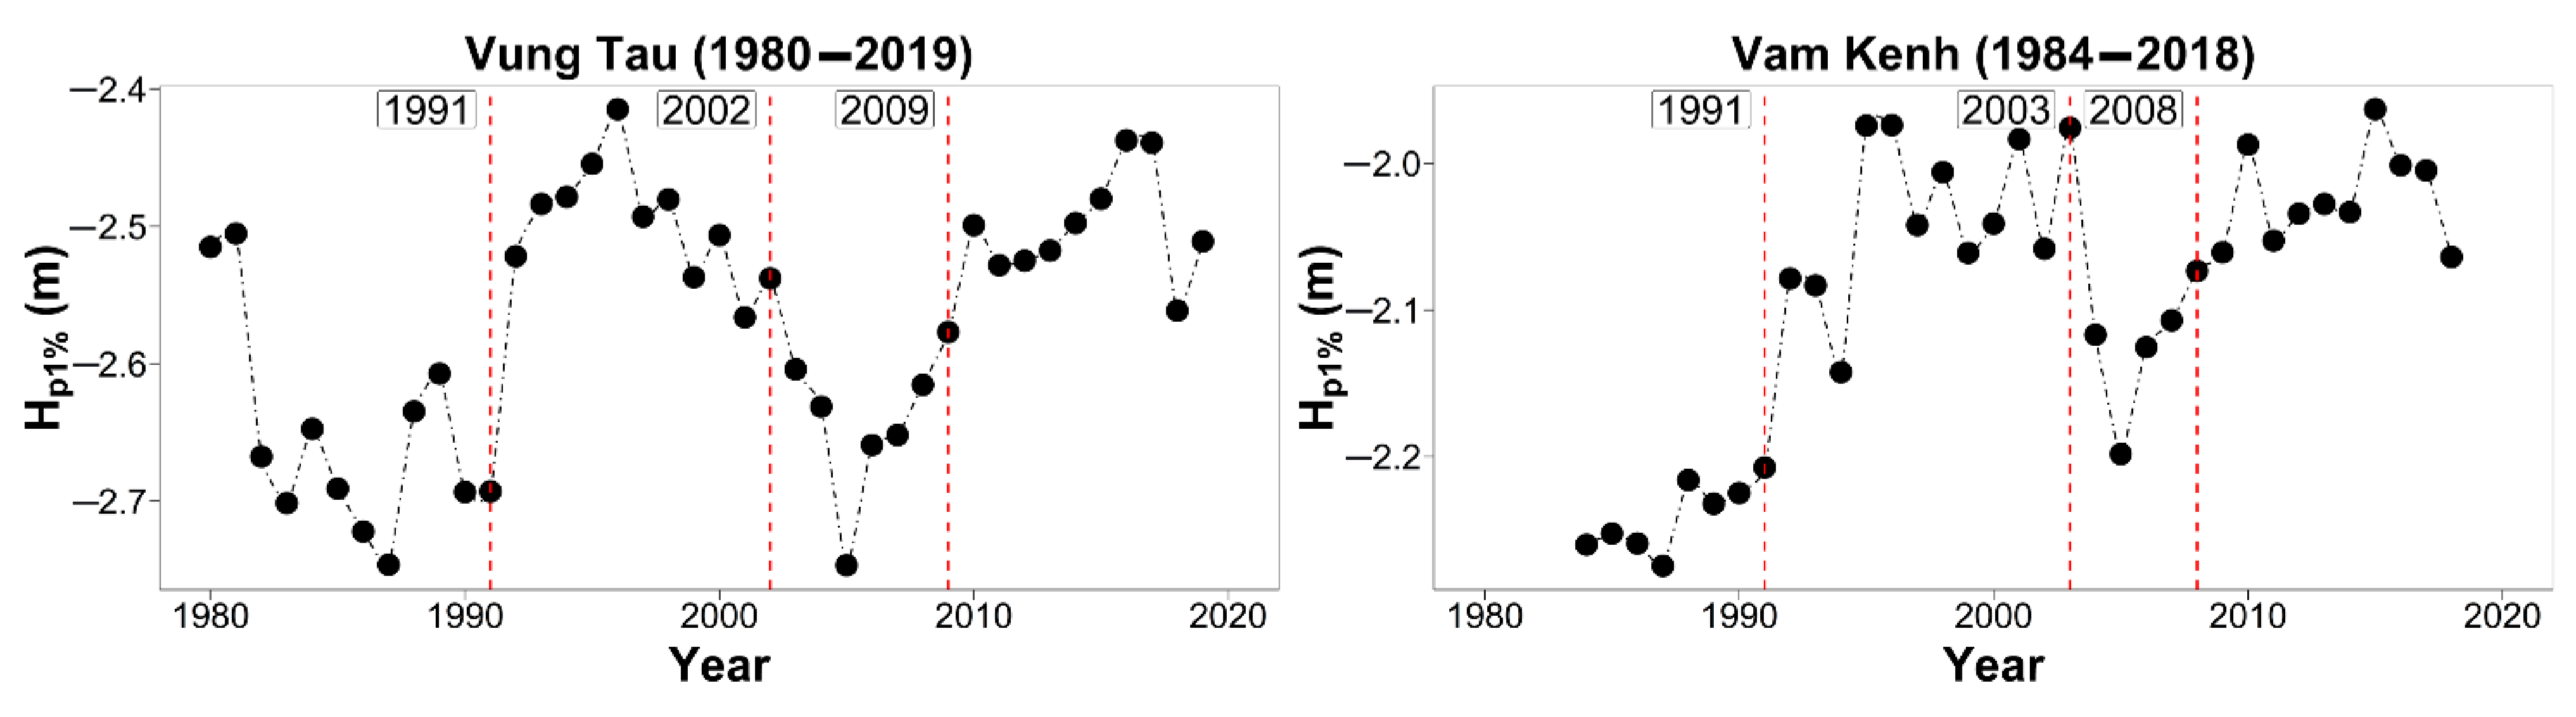
The results of the water level trend at Hp1% showed a decrease in the Dong Nai River and the Saigon River, except at Thu Dau Mot station (Figure A2). On the other hand, the tidal level at two stations of Vung Tau and Vam Kenh increased, but the rate of increase at Vam Kenh station was larger and more pronounced with about 0.7 cm/year.
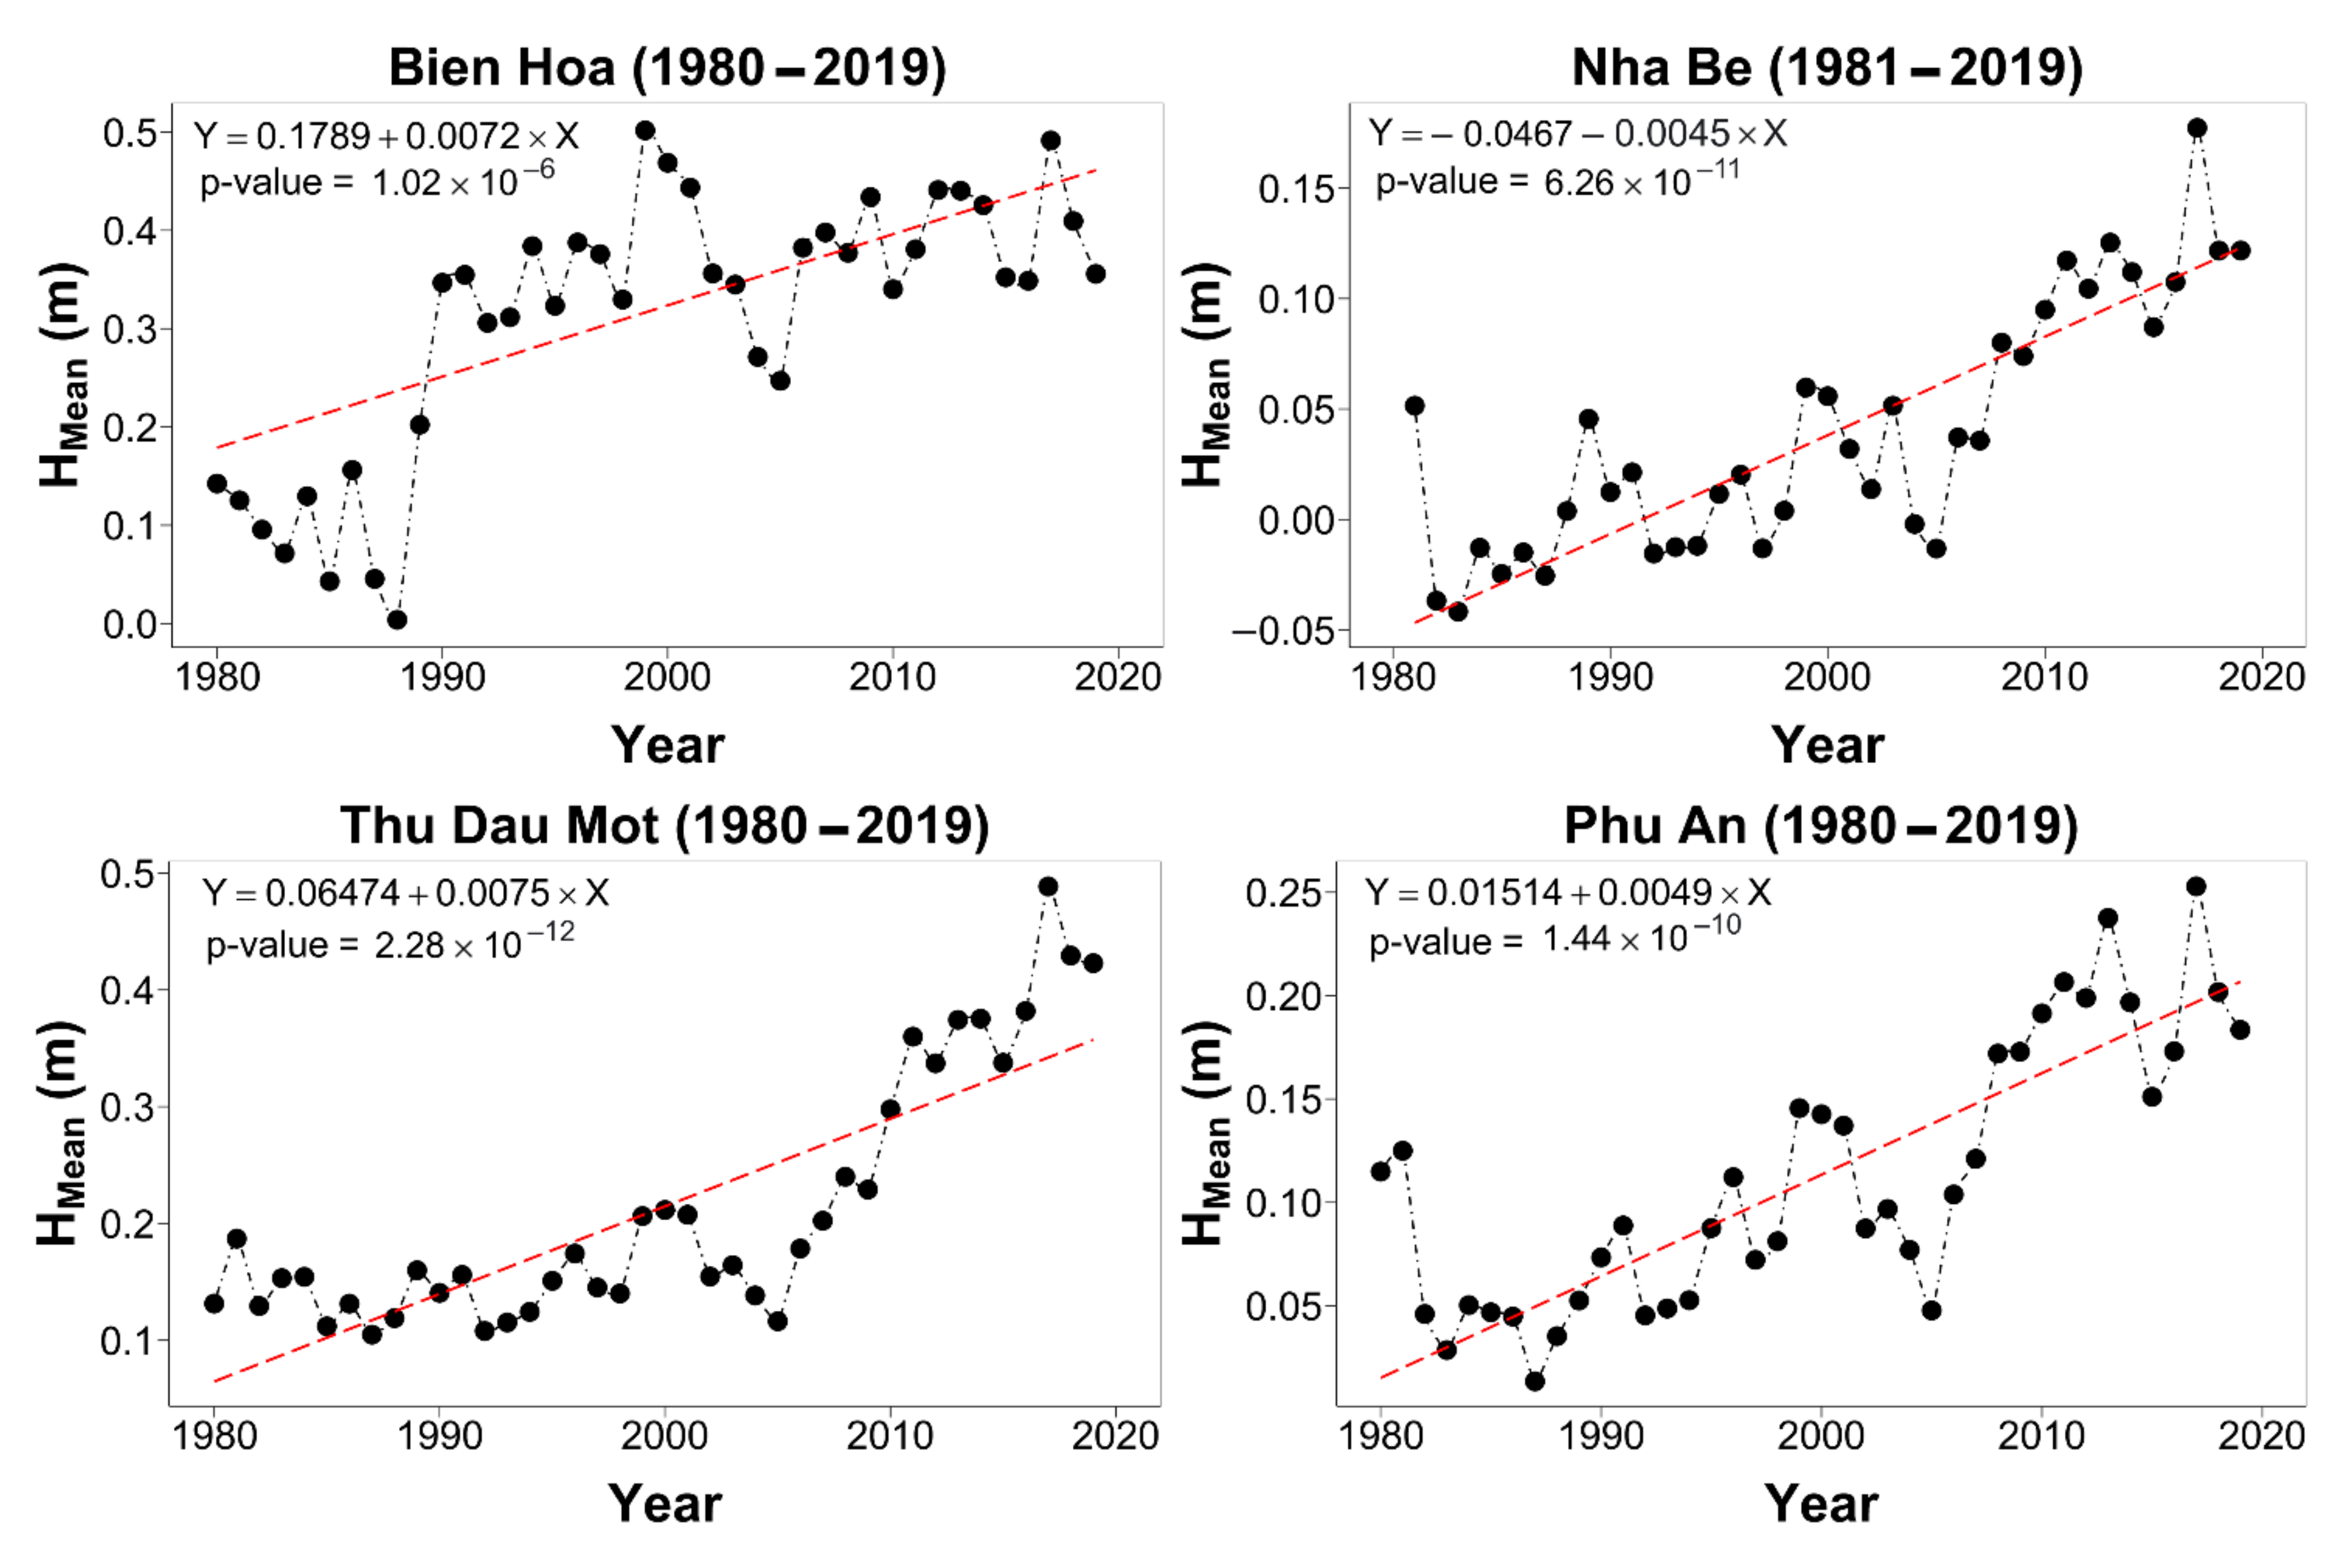
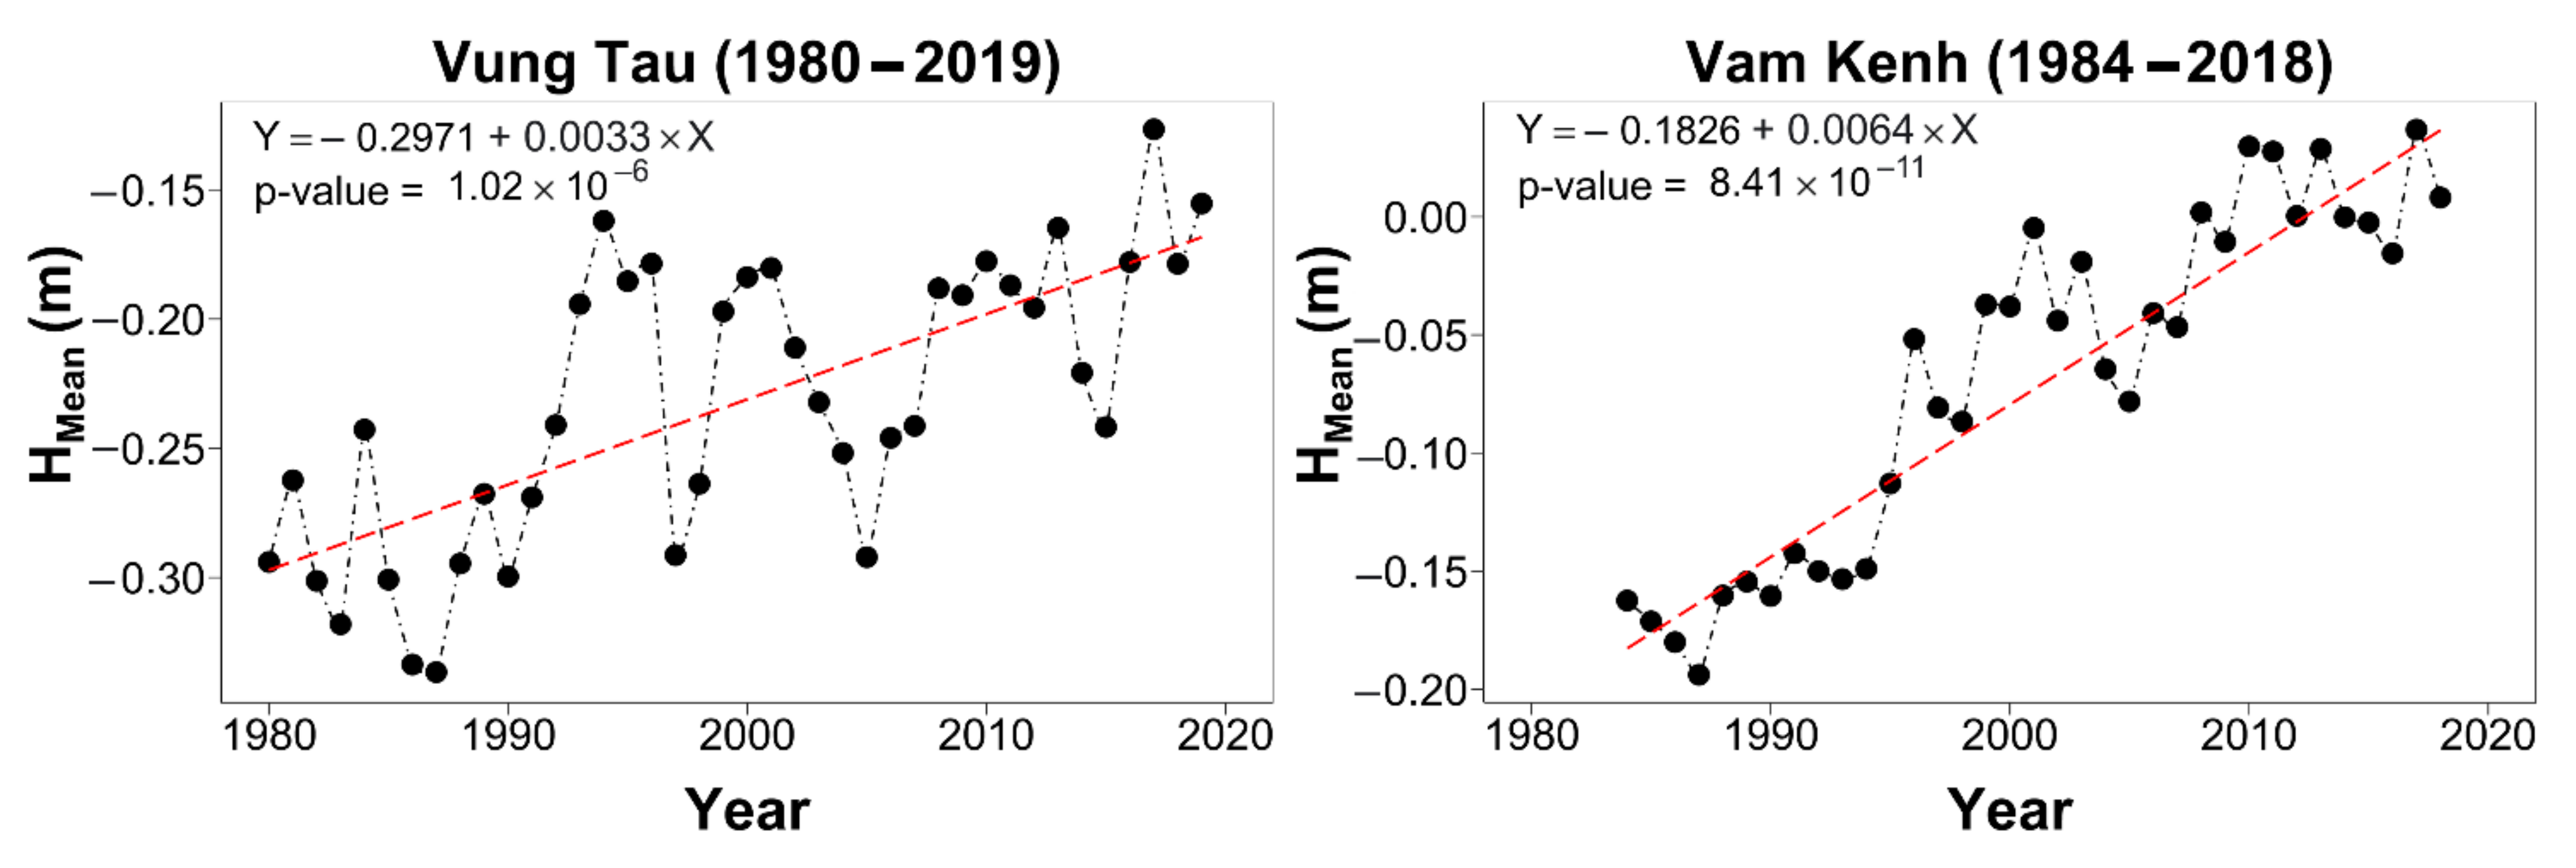
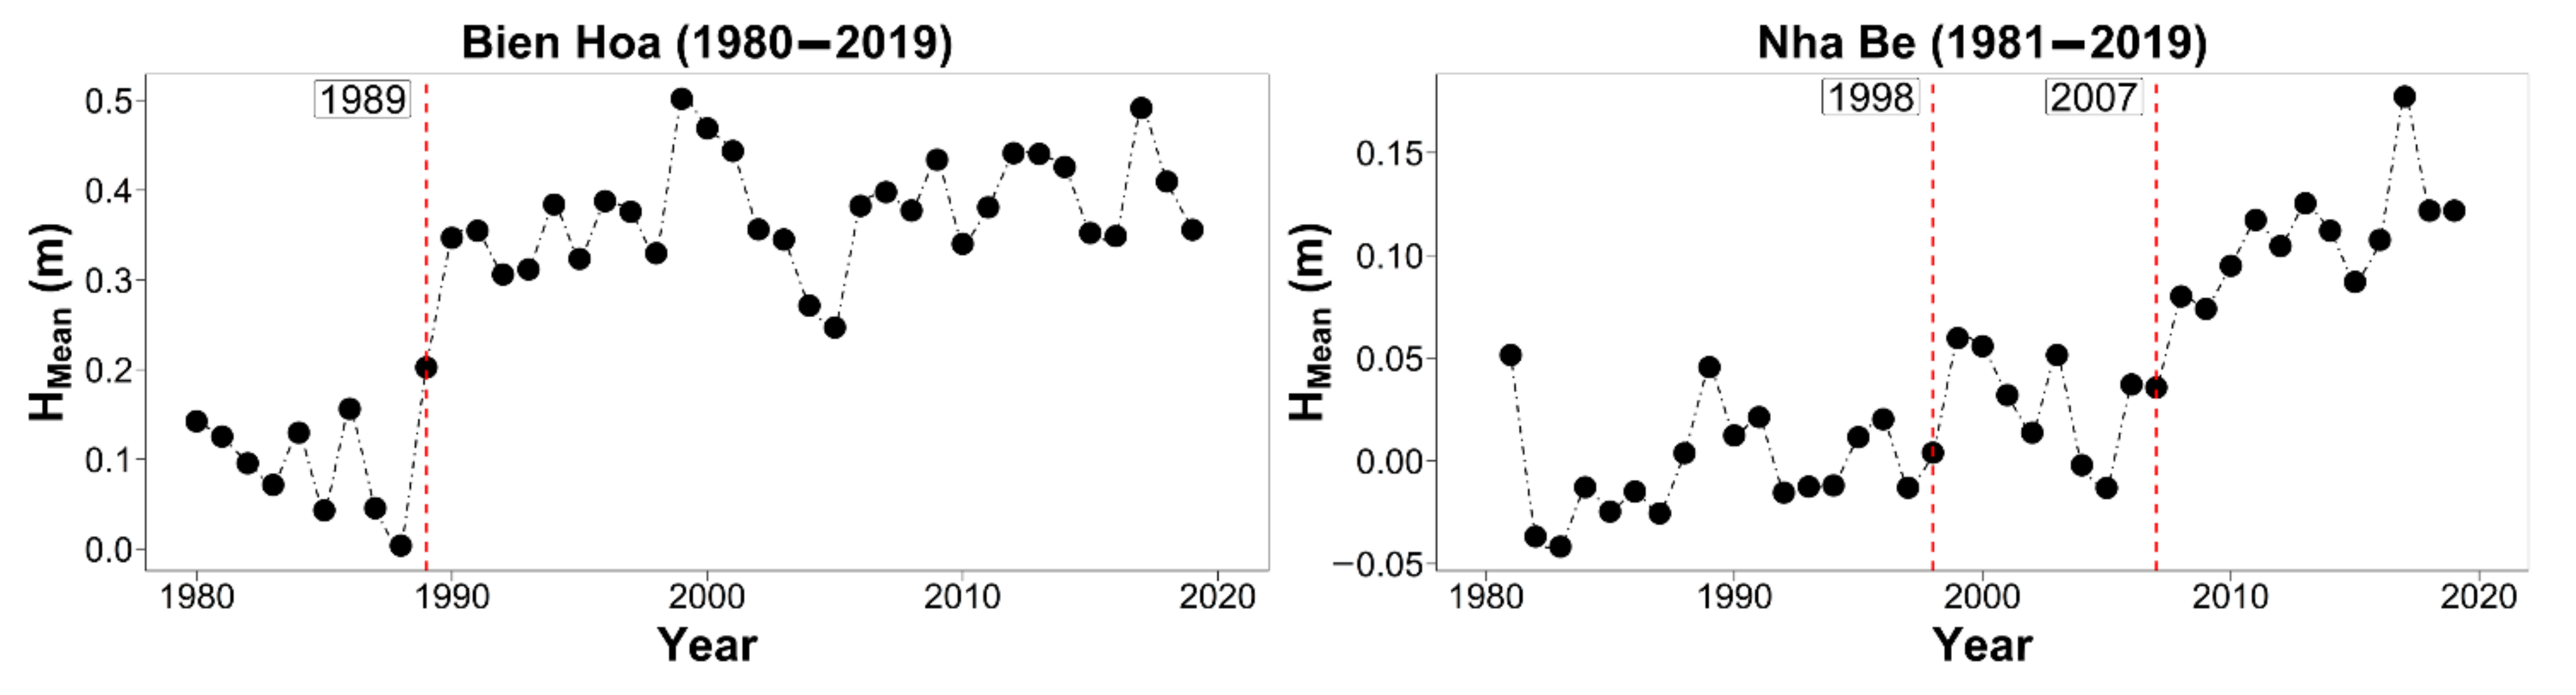
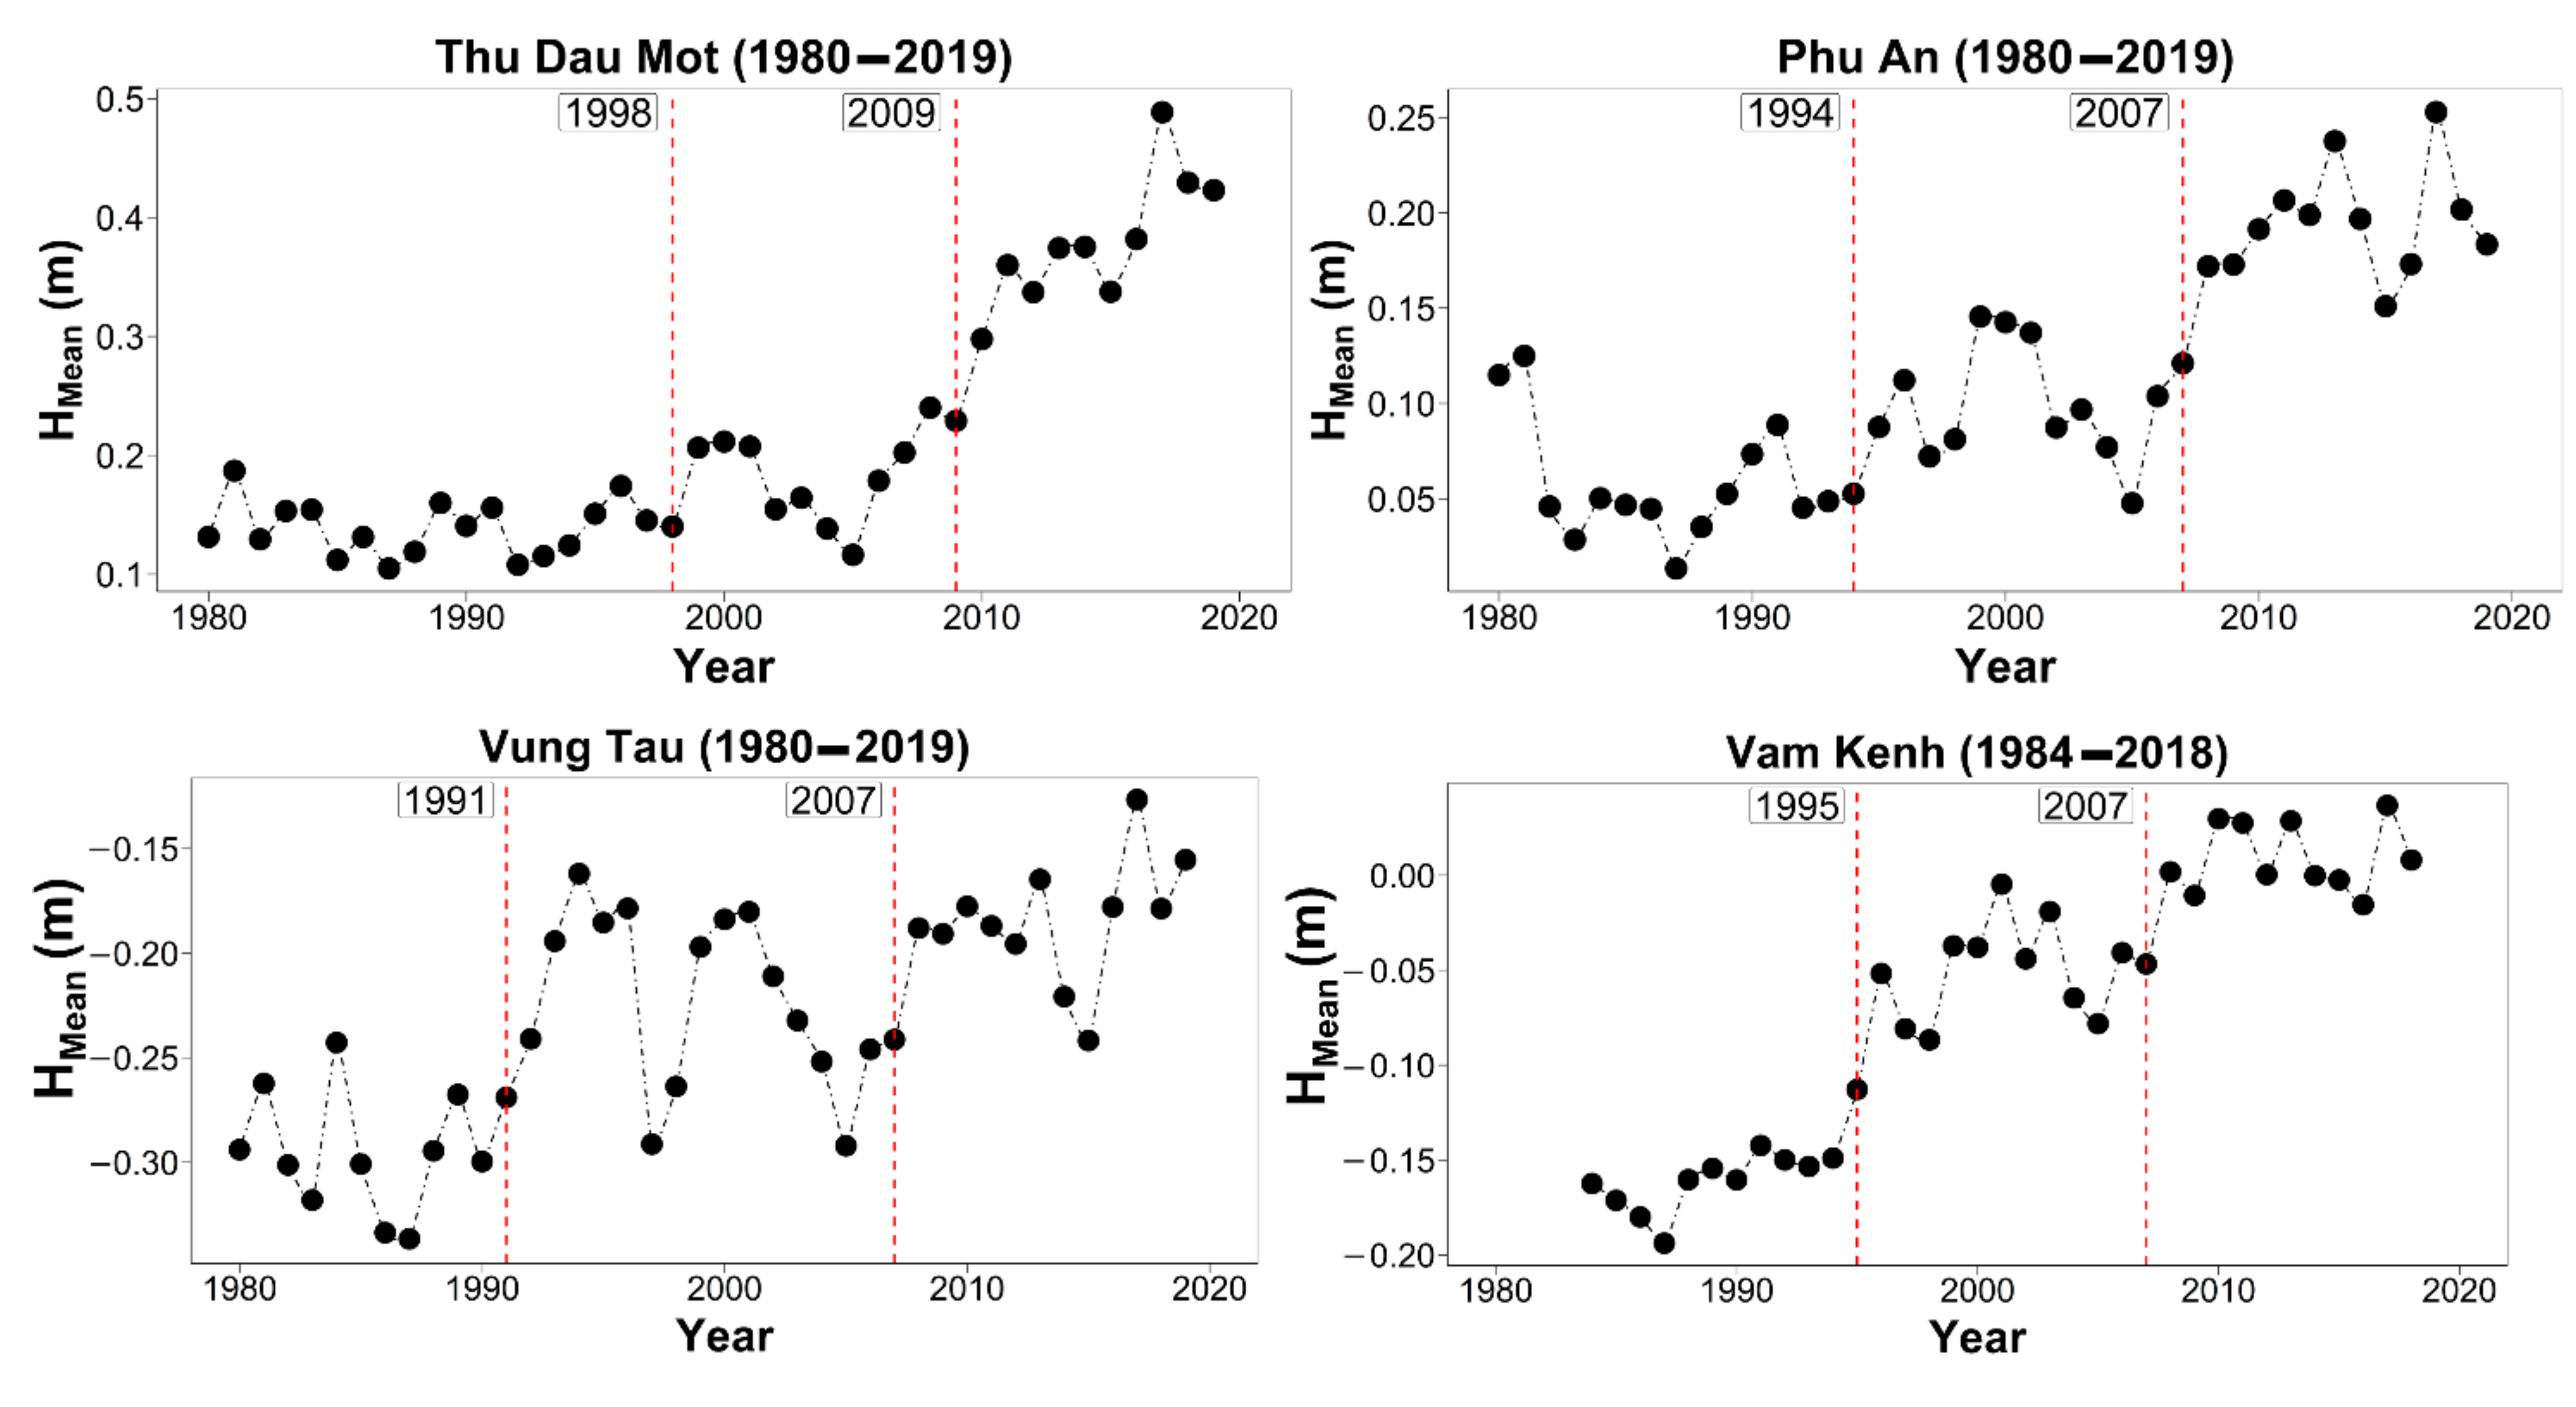
Trend of Hmean (Medium Water Level)
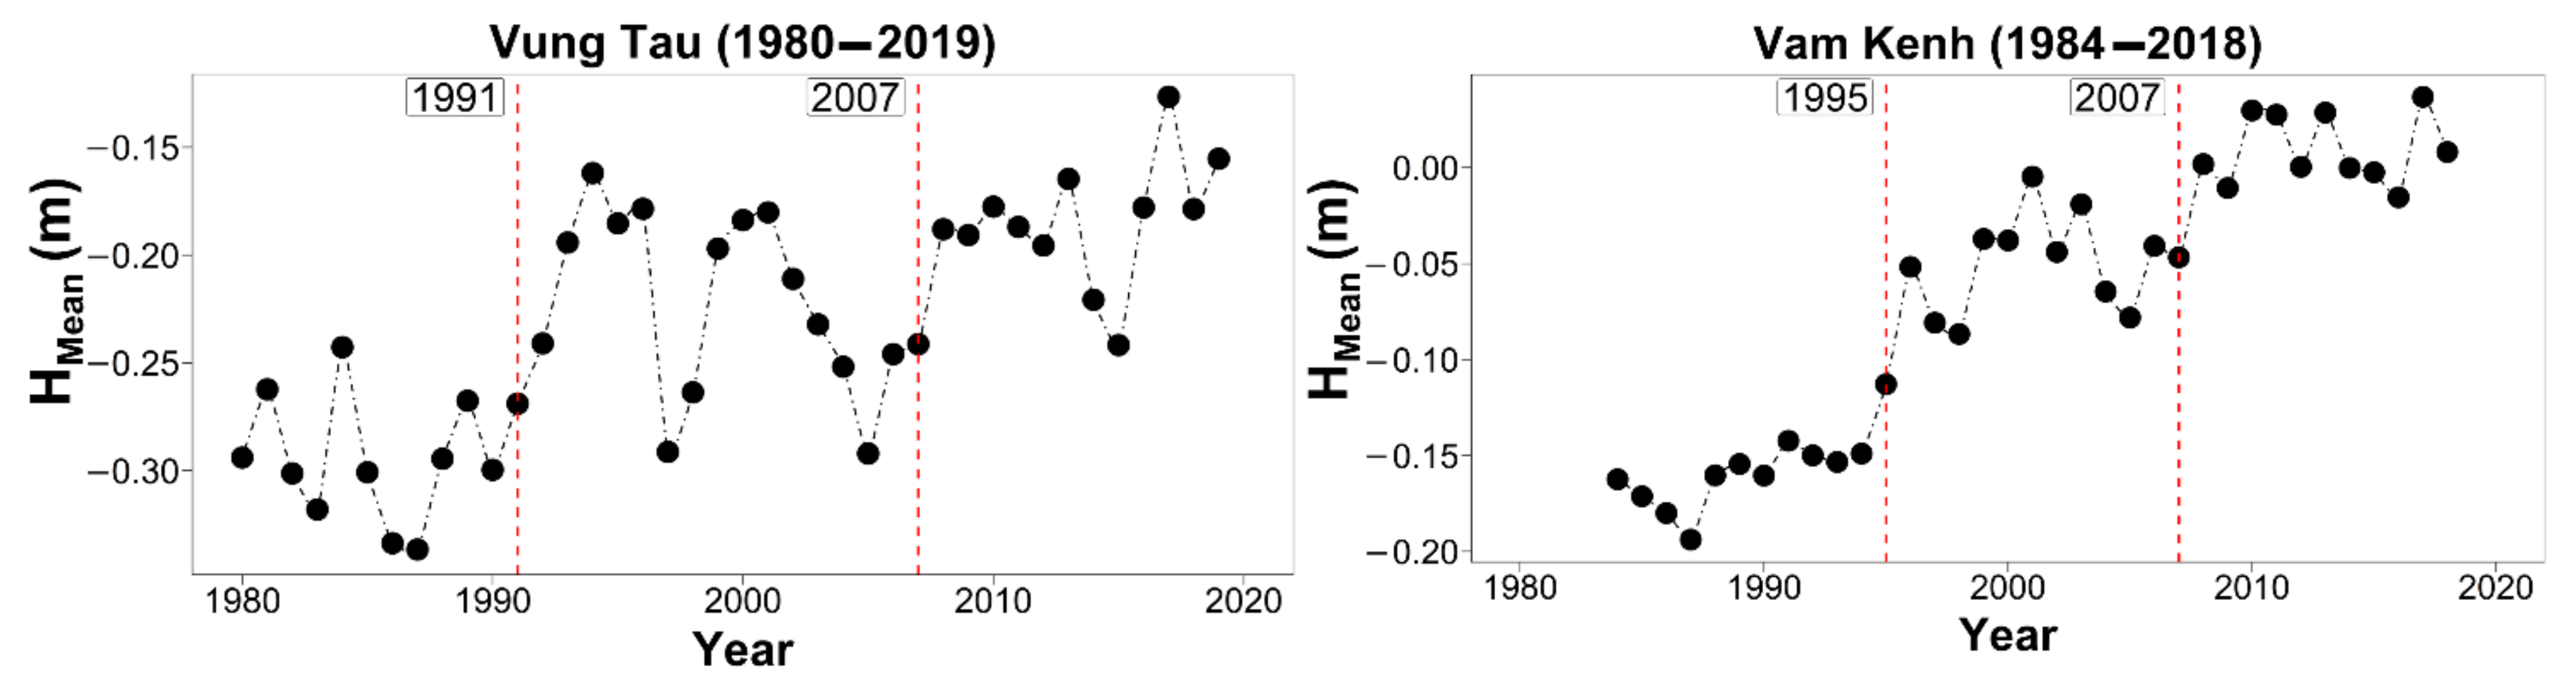
The Hmean water level trend results revealed an increasing trend across all the monitoring stations (Figure 5). On the Dong Nai River, the average mean water level rise rate was about 0.76 cm/year at Bien Hoa station and 0.42 cm/year at Nha Be station. On the Saigon River, the mean water level increased by about 0.7 cm/year in Thu Dau Mot and 0.47 cm/year in Phu An. Similar to the inland stations, the average water level at the tidal stations tended to increase. Notably, the mean water level rise rate of Vam Kenh station was about 0.65 cm/year, which was two times higher than the average water level rise rate at Vung Tau station (0.33 cm/year).
3.2. Breakpoints Analysis/Changepoints Detection
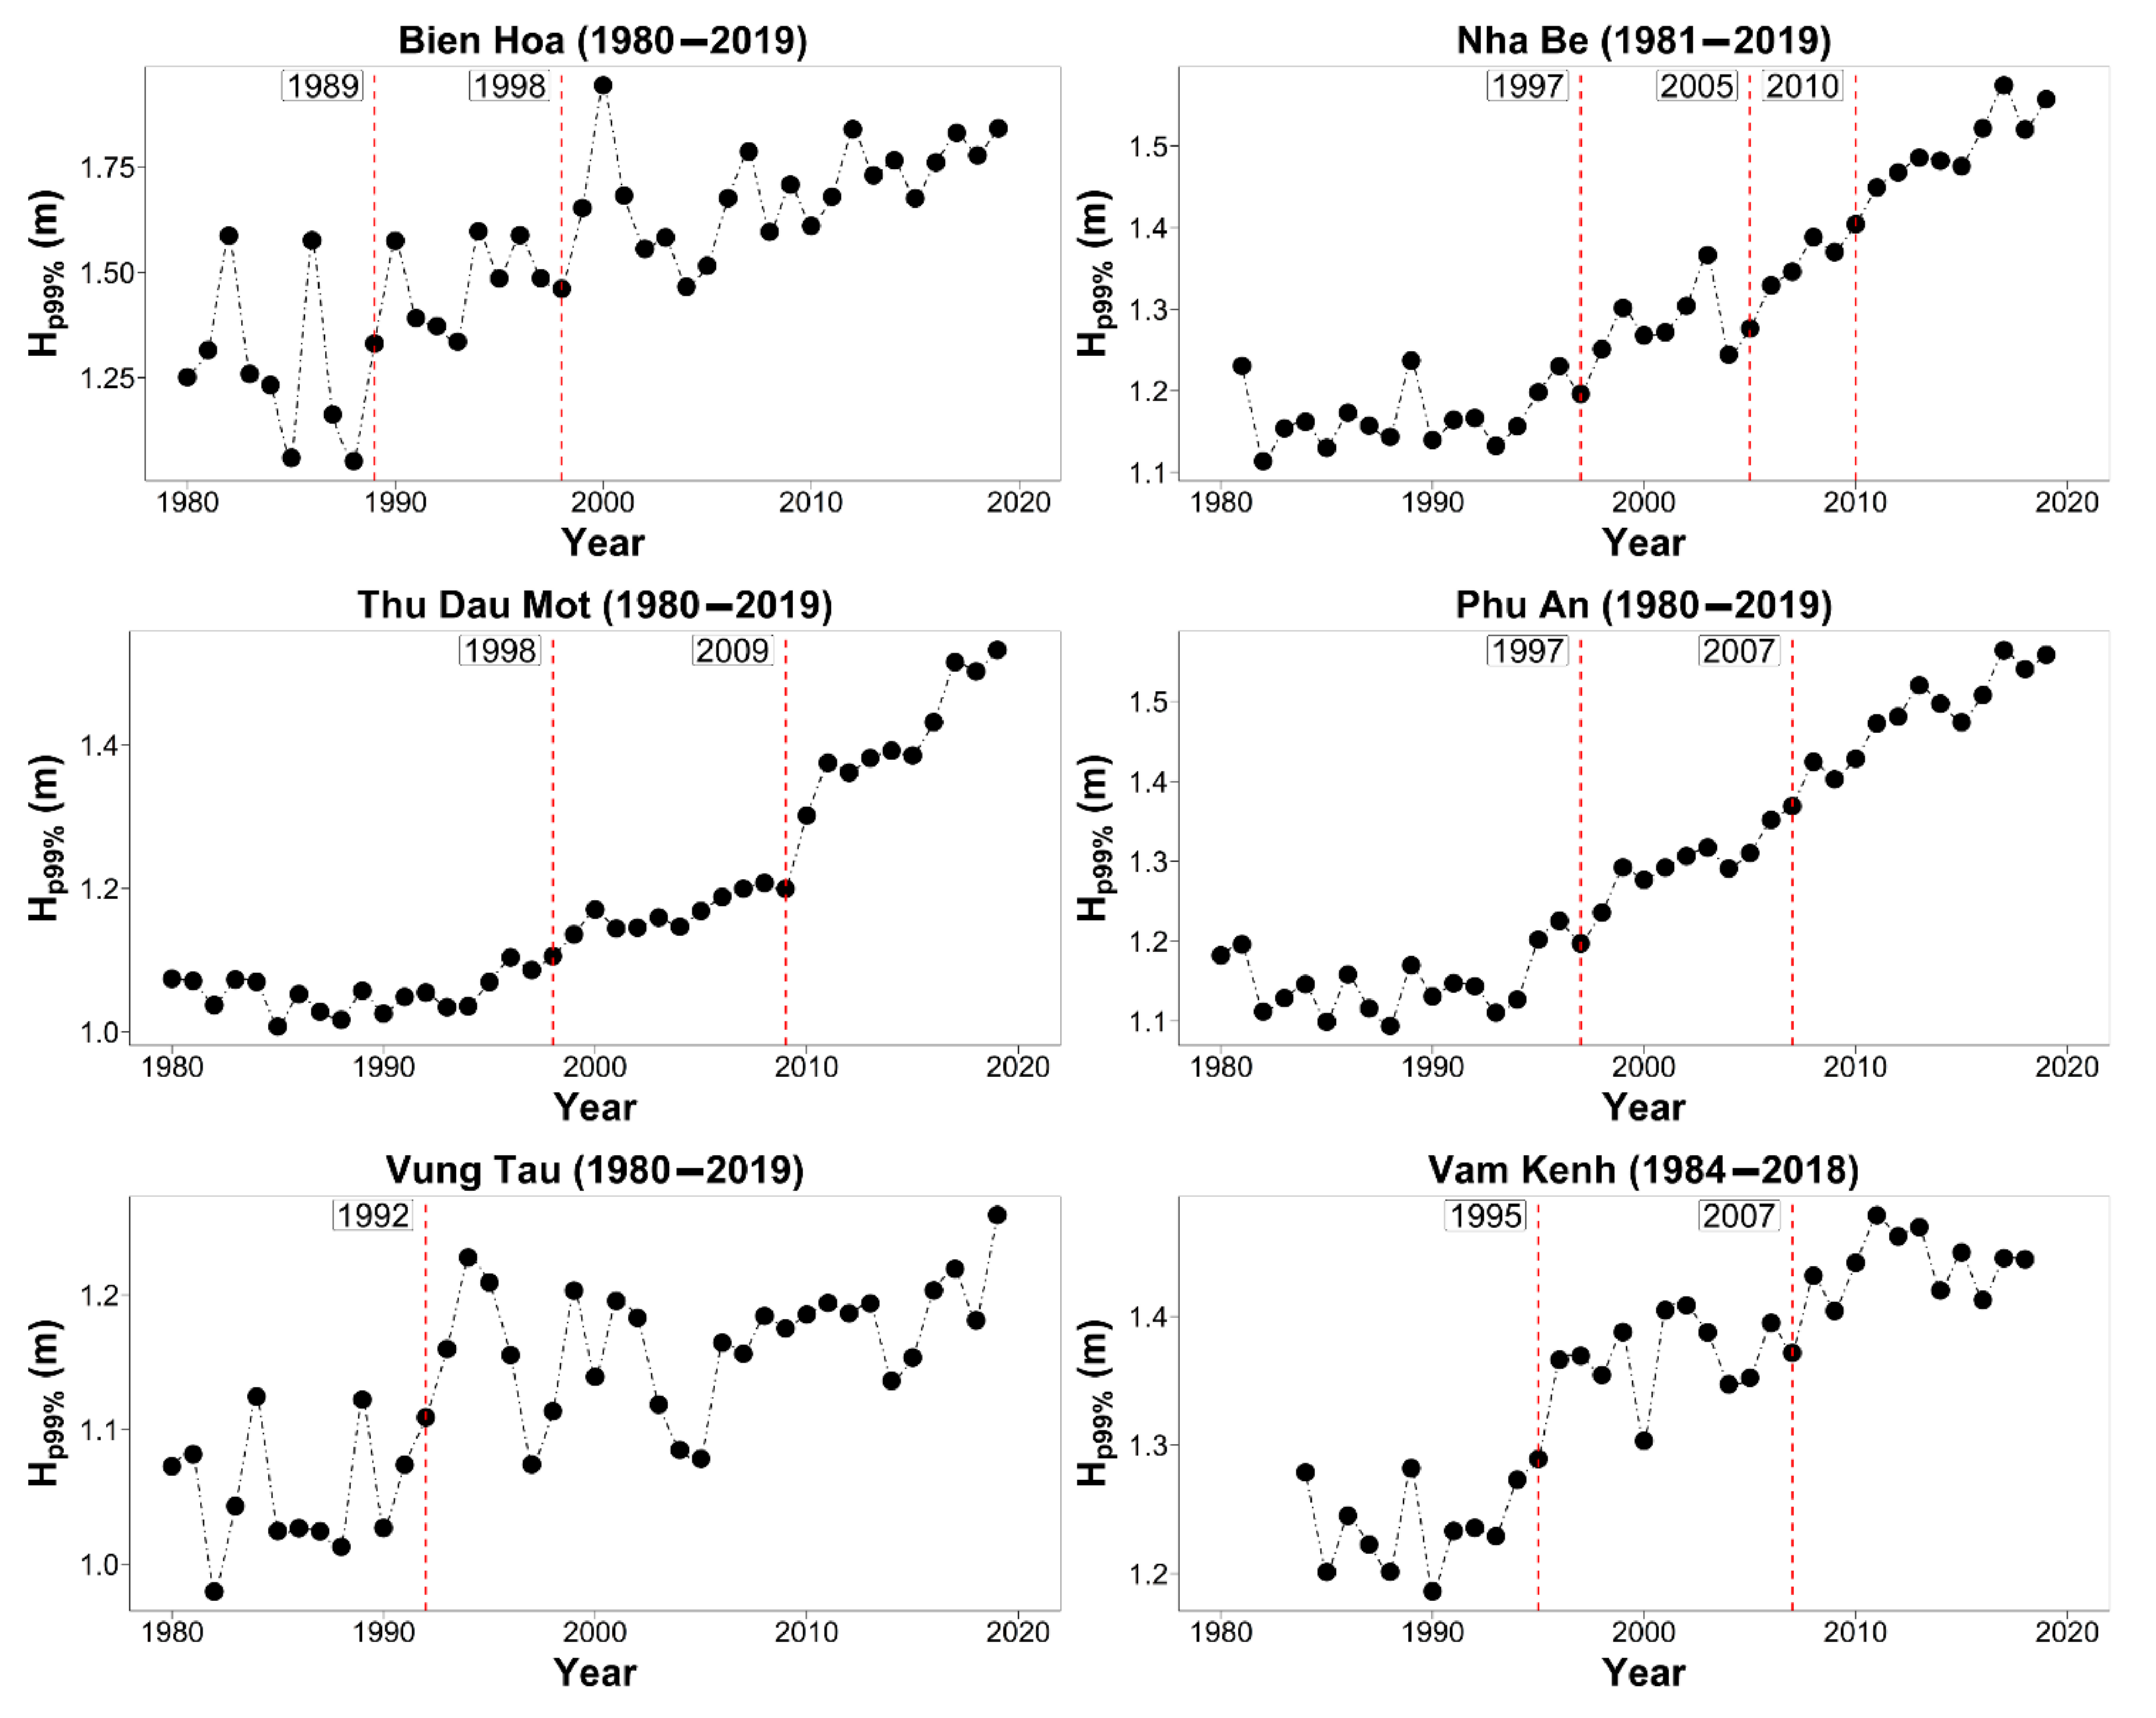
The breakpoints analysis calculation results are summarized in detail in Table 4. Figure 6 shows the charts of changepoint years of Hmax and the remaining (Hp99%, Hmean, Hp1%, Hmin) are presented in the Appendix B (Figure A3, Figure A4, Figure A5 and Figure A6).
On the Dong Nai River, the change in water level trends of Hmax, Hp99% at the gauging stations took place in the period 1995–2001, and mainly in the year 1998 (Table 4). The results also show similar changepoints for the case of Hmean, Hp1%, Hmin. Another changepoints drop happened in the period 2005–2010. Particularly at Bien Hoa station, there was a change in water level in 1989.
On the Saigon River, the change in water level trends Hmax, Hp99%, Hmean dropped during the period of 1994–1998, particularly in 1998. Another changepoint in the water level trends happened in the 2007–2009 period. The results of the water level analysis Hp1%, Hmin showed that the change mainly occurred in 1994 and 2008.
The water level trend in Vung Tau and Vam Kenh had the same changepoints in 1992, 2003, and 2008 under the Hp1% và Hmin analysis. However, for the analysis of Hmean, Hmax, Hp99%, the water level changepoint occurred in 1995 at Vam Kenh, 1991 in Vung Tau, and the same changepoint was found in 2007 for the Hmean case.
3.3. Changepoint Verification
The water level of Hp99%, Hmean at Bien Hoa station changes in 1989, as the Tri An hydropower reservoir began operation [72]. The results of the changepoint years in Table 4 also indicate that the water level under the Hmax, Hp99%, Hmean analysis changed at three periods: (1) the year of 1998; (2) the year of 2007; and (3) after 2009 at Thu Dau Mot and Nha Be stations.
The water level change in 1998 is considered to be when the urbanization process started in the SGDNrb (1993–1998). When the new land law was promulgated in 1993, more accessible access to land use rights for people encouraged people from other provinces moved to live and work in general, promoting construction while urbanization took place faster and was more potent [26,27]. According to research by Van et al. [73], the impermeable land area in HCMC in 1989 was 7.15 × 10³ ha and increased to 18.7 × 10³ ha in 1998, which was 2.6 times as higher. By 2006, the area of impervious soil was 46.5 × 10³ ha (Figure 7).
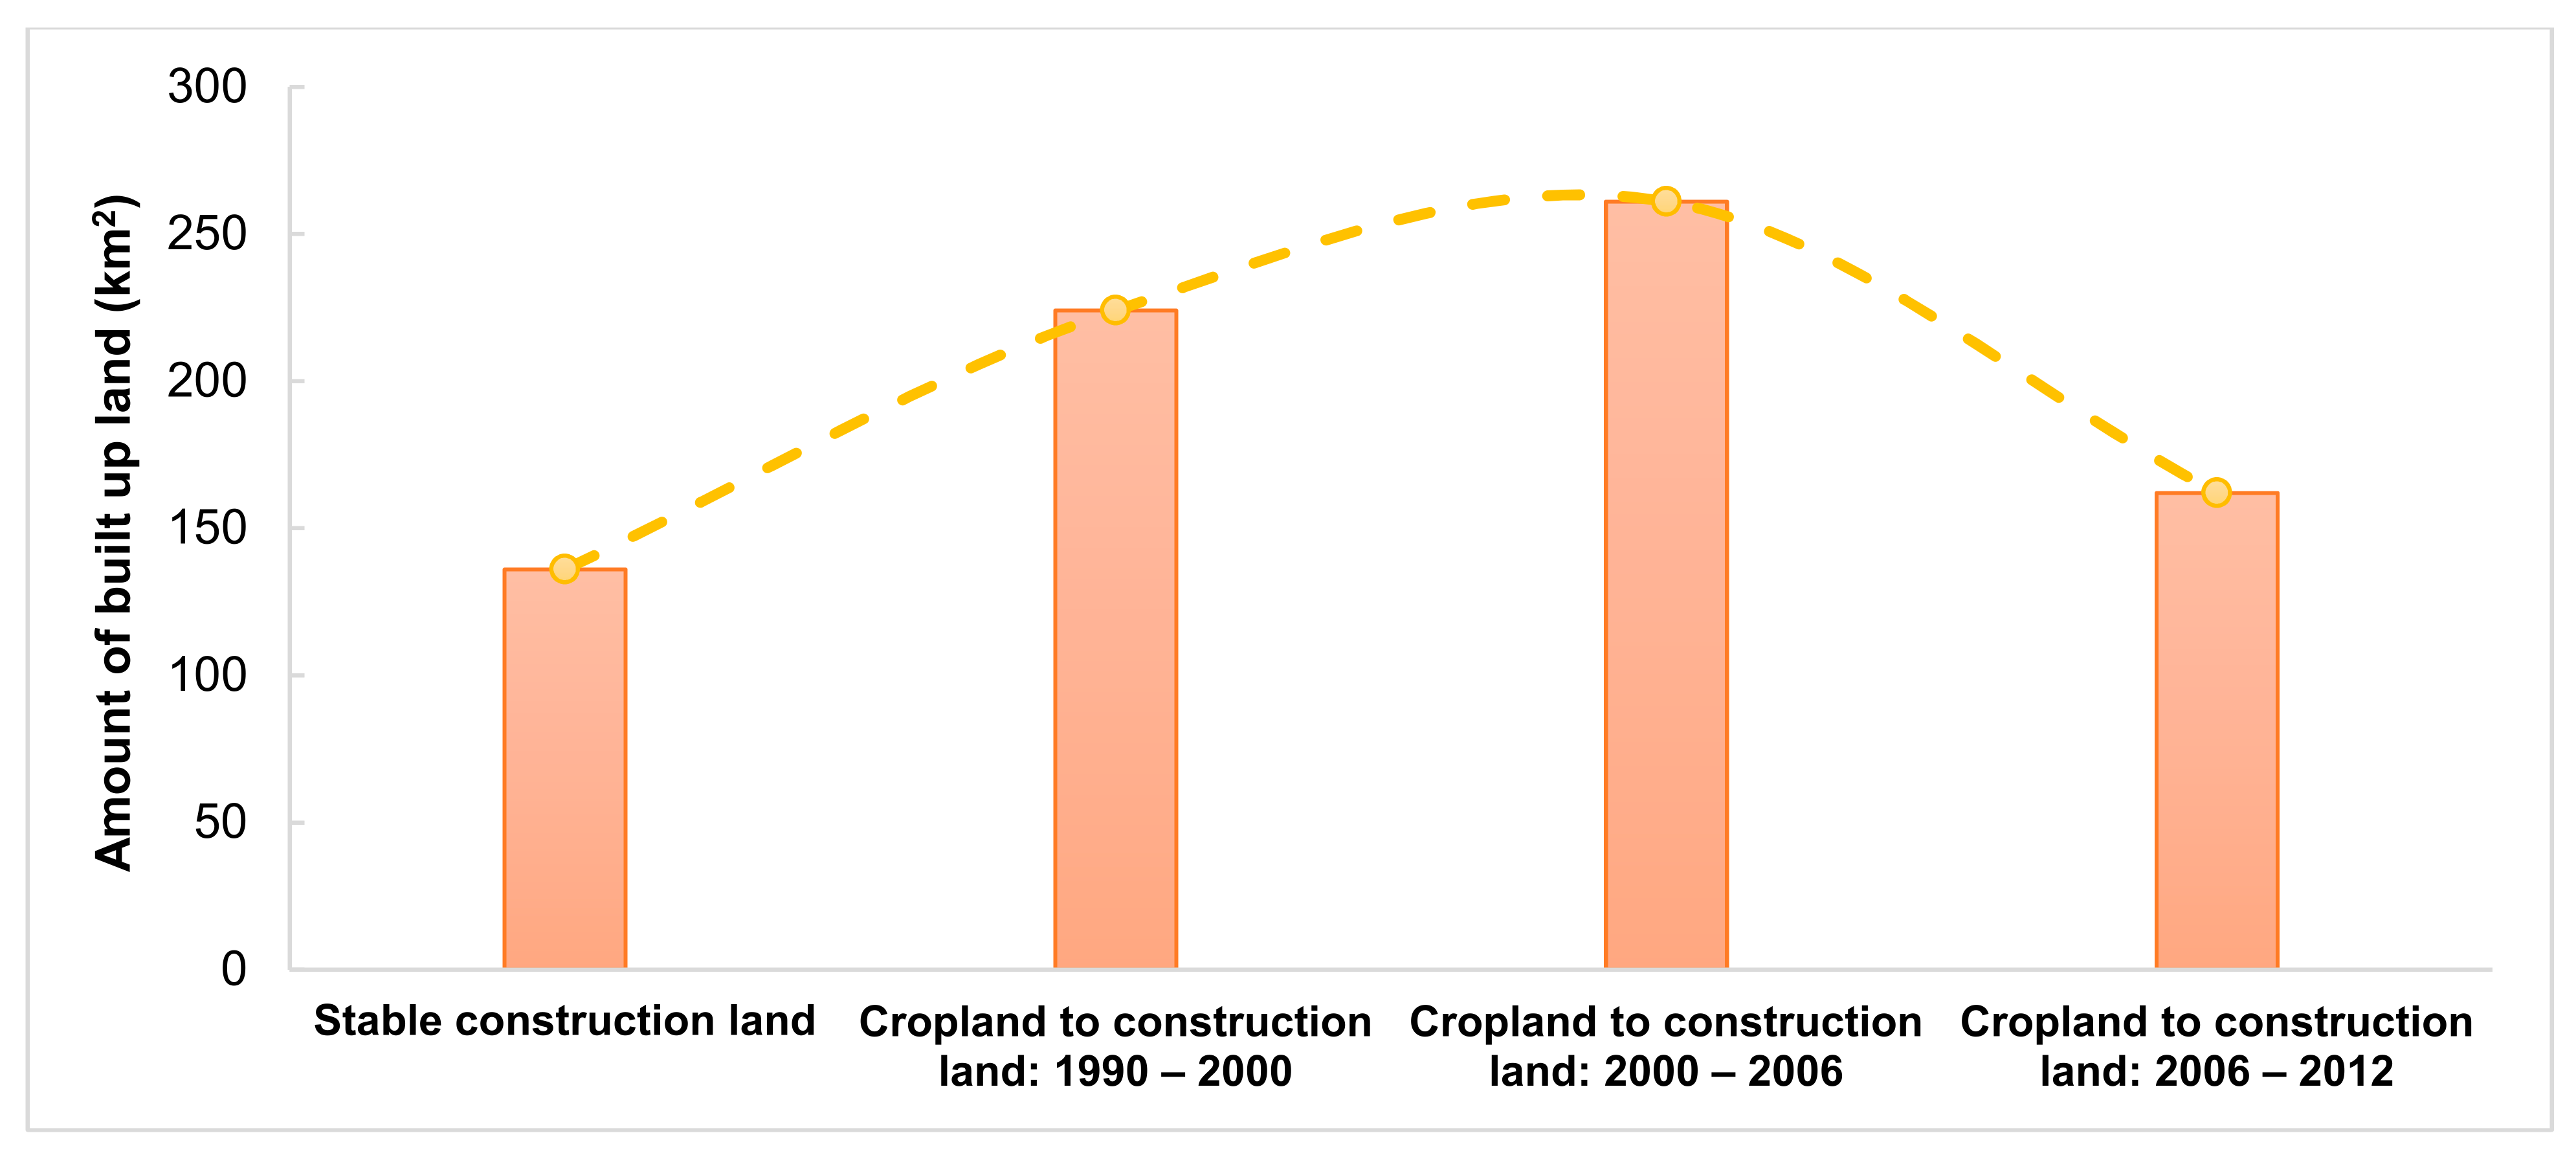
Another study by Kontgis et al. [27] emphasized the problem of converting from arable land to construction land in urban areas of Ho Chi Minh City and the surrounding regions (48 km radius). It is estimated that about 225 km2 and 260 km2 of arable land were converted to construction land in 1990–2000 and 2000–2006 (Figure 8).
Thus, the above evidence indicates that the water level rise and change in the two periods (1) 1998 and (2) 2007 resulted from the continuous urbanization process from the previous years. The increase in construction land is proportional to the decrease in green areas, water surfaces, and the low-lying areas that store water. These results are similar to the those of previous land use change assessment studies.
For the time of change (3) after 2009 by data analysis at the Thu Dau Mot or Nha Be stations, the changepoint is likely due to the impact of the dike system according to planning project No. 1547 [74]. This dike system started construction in 2008 and was completed at about 64 km in 2018 (Figure 9). However, the dike polder system has made it difficult to circulate the flow between the main river and the low-lying tidal areas, which moved the flow only on the main rivers to reach the intertidal areas causing the rising water level.
The tidal change occurred in 1991 at Vung Tau station or in 1995 at Vam Kenh is likely due to the influence of the ENSO process during the period [75]. Remarkably, the results of Hmax, Hp99%, Hmean that were calculated at Vam Kenh in 2007 show the same time as the change in water level at the inland stations. However, there is still no solid evidence that is related to the changes in these years.
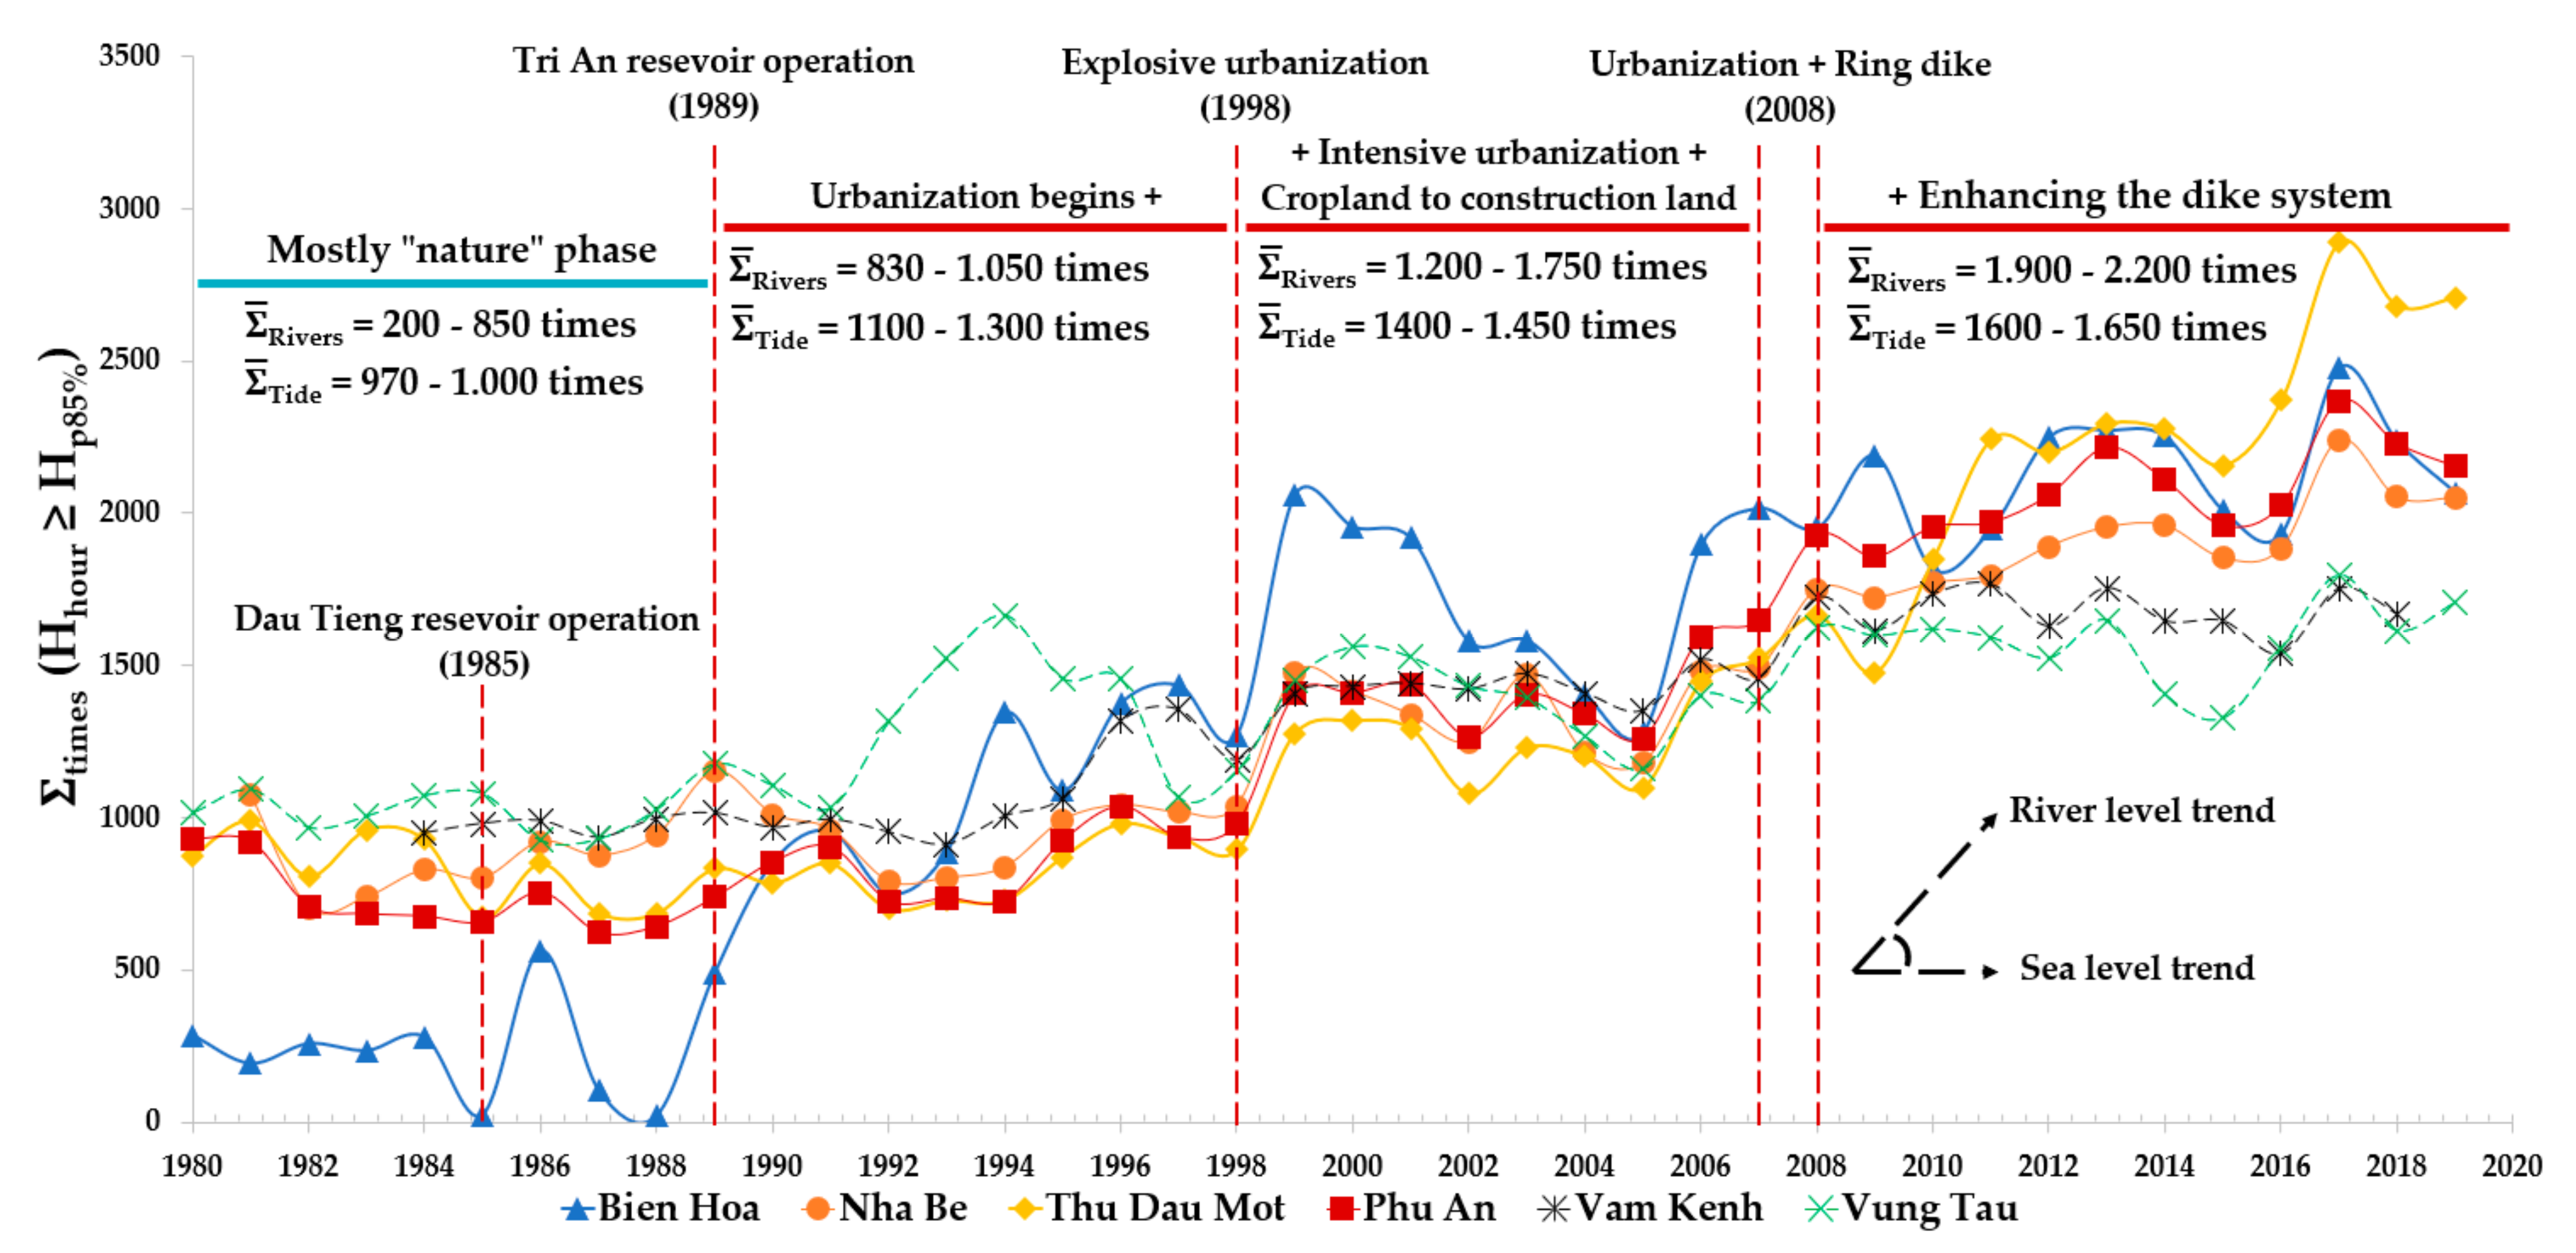
Our study conducts screening of high water level data of all the SGDNrb monitoring stations and counting the times the water level is greater than the 85% percentile to have a more holistic view of the causes of the increase in water levels concerning the socio-development changes by using the formula: ƩH_high = Countif (Hhour ≥ Hp85%) (10). The results are presented in Table 5 whereas Figure 10 shows the water level changes in 1980–2019 corresponding to the socio-development changes.
First, the results of the changepoint at Thu Dau Mot station (downstream of Dau Tieng reservoir, operated in 1985) in Table 4 do not clearly show the influence of the reservoir on the water level. One reason considered is that the Dau Tieng reservoir discharges water not only into the Saigon River but also into three other regions for irrigation purposes, namely East Canal, West Canal, and Tan Hung (Decision 137/2000/QD-BNN-QLN dated 18 December 2000 and 5279/QD-BNN-TCTL dated 10 December 2014 by Vietnam Ministry of Agriculture and Rural Development). In contrast, when analyzing the change of the water level and the characteristic ƩH_high at Bien Hoa station that is downstream of Tri An reservoir, before 1989 the number of occurrences of high water levels was about 300–500 times. After Tri An reservoir (1989) started its operation, the number of high water levels increased to about 1000–1500 times which is three times higher than that in the previous period. Therefore, it is clear that Tri An reservoir has affected the water level change downstream and implies that the flow before 1989 was almost free of impacts from the reservoir and human activities.
Second, when considering the impact of urbanization, the number of occurrences of high water levels on the inland river in 1989–1998 was about 830–1050 times. After increasing urbanization, the occurrences gradually increased to about 1200 to 1750 times (1999–2007). And after the dike system was partially completed and urbanization continued (2008–2019), the number of high water level occurrences increased by about 1900–2200 times. Thus, the impact of human factors on hydrology downstream of the SGDNrb is apparent. In the opposite direction, the effect of sea level is not noticeable. For example, in the period before 2008, the number of occurrences of high water level was about 1300–1450 times, then only increased to about 1600 times. In general, sea level impacts river water inland, but it is likely not the main driver. Many studies have similar results to our study which shows that human impacts, such as land-use change, irrigation works, construction of dike polders, and especially urbanization, are factors that are the main impacts on the increase of river water level [19,28,76]. For example, Yu Xu et al. [77] also indicates that climate change outweighs the impact of urbanization on water levels in The Taihu Basin. By using the MK trend analysis method combined with the elastic coefficient method (ECM), the results of their study show that human activity (urbanization) and climate change have an impacting ratio of more than 90% and less than 8%, respectively.
The results of the water level change years corresponding to their causes of socio-economic development in the basin revealed that the water level monitoring stations on the river tended to change the level in the river during the periods of 1998 and 2007–2009 (Table 4). Therefore, the years near these two periods were screened and selected to analyze the water level changes and fluctuations. For the water level at Vam Kenh and Vung Tau stations, the year of change around 1991 and 2008 was selected to be consistent with the monitoring stations on the river (Figure 5).
3.4. Water Level Trend Evaluation before and after the Breakpoint Year
3.4.1. Periodic Water Level Trend Hmax, Hp99% (Maximum Water Level)
The water level trend at the monitoring stations on the river is not clear, or the water level increase is meagre before urbanization (1995 or 1998). For example, the Phu An station increased 0.3 cm/year from 1980 to 1998 (according to the TFPW test calculation). However, after the year of urbanization, the water level at the monitoring stations increased and was statistically significant (Table 6).
After 2007, new urban areas were developed and urbanization increased in the SGDNrb basin. At the same time, the dike system was being built and upgraded, causing the water level to rise rapidly. For example, in Phu An (Hp99%) before 2006, the rate was only about 0.38 cm/year, but the rate increased about 1.35 cm/year in 2007–2009 (according to TFPW test calculation). In Thu Dau Mot, the difference between the rate of increase of water level before and after 2009 is 0.74 cm/year and 2.38 cm/year, respectively (calculated by TFPW). When comparing the average water level Hp99% value before and after the period, the results show that the change is 1.16 m compared to 1.49 m, respectively (Table 7).
The water level results at Nha Be, Phu An, and Thu Dau Mot stations indicate that the trend of a rapid increase in the water level after the period of urbanization and construction of the dike polder system is reasonable. These stations are located in the urban area of Ho Chi Minh City, where investment and development have ongoing since the 90s [17,18]. Especially in Nha Be district, which has low terrain (0 m–1.5 m) and belongs to one of the six planned drainage areas for the city (Decision No.752/QD-TTg dated 19 June 2001 by Prime Minister). However, the urbanization process has lost the water storage area of Ho Chi Minh city. According to a study by Viet et al. [29], the water storage area in 2018 decreased by more than 92.6% compared to 1989. Thus, the rising water level is a consequence of these impacts.
The results of water level increase after the urbanization period are quite similar to studies of Wang et al. [78] and Song et al. [79] with the case study in the Taihu Basin, China. For example, Song et al. [79] concluded that the increase in water level is influenced by urbanization, especially in new construction urban areas. They also revealed that when the impermeable area increases by one unit (i.e., 20% to 21% area), the water level would increase by 50% unit in the flood and non-flood season.
At the tidal monitoring stations Vam Kenh and Vung Tau, the results demonstrated an apparent increase in water level trend at Vam Kenh, but the rate of increase was not high, only about 0.46 cm/year (Hp99%), 0.53 cm/year (Hmax). It means that the sea level is not the main effect causing the increased water level Hmax, Hp99% for infield stations.
3.4.2. Periodic Water Level Trend Hmean (Mean Water Level)
The Hmean water level at Bien Hoa station before the period with the construction of the Tri An reservoir was about 0.1 m and tended to decrease without statistical significance (according to TFPW calculation in Table 8). After the reservoir was put into operation (1989–2019), the average water level was about 0.37 m, 0.27 m higher than 1980–1989. However, the results indicate that the increasing the Hmean water level here is relatively low, about 0.19 cm/year, and not statistically significant. Thus, the Tri An reservoir has caused the rise of water level after 1989.
The mean water level (1994–2019) at Nha Be, Thu Dau Mot, and Phu An stations tended to increase by 0.57 cm/year, 1.52 cm/year, and 0.52 cm/year, respectively (Table 8). However, this increasing trend mainly appeared from 2007 through 2019; for instance, at the Nha Be and Thu Dau Mot stations, the increasing rate was 0.43 cm/year and 1.40 cm/year, respectively. The increase in water level was not apparent at the Phu An station (2007–2019).
The mean water level in Vung Tau (1991–2007) decreased slightly by −0.45 cm/year and increased in other periods, but the result was not statistically significant. On the other hand, the water level in Vam Kenh had the most apparent increase of about 0.39 cm/year in the period 1995–2018.
3.4.3. Periodic Water Level Trend Hp1%, Hmin (Minimum Water Level)
The water level Hmin, Hp1% at Bien Hoa station or Hmin at Nha Be, Phu An, and Vung Tau stations in 1980–2019 had no clear trend within the 95% confidence level; therefore, these were not included in the subsequent analysis.
The results of the data analysis of the monitoring stations on the river showed that the low water level before the time of first urbanization (1995–1998) tended to decrease and was not statistically significant, except in Nha Be, which tended to increase by 1.25 cm/year (according to TFPW calculation in Table 9 and Table 10). After 1995 to 2008, the trend of low water levels at all the locations decreased, for example, −2.87 cm/year in Thu Dau Mot, −3.39 cm/year in Phu An, and −2.02 cm/year in Nha Be. However, by the period of urbanization after 2008–2019, the trend of low water level at stations did not decrease, especially Hp1%, Hmin in Thu Dau Mot tended to increase by more than 2.3 cm/year. The minimum water level tendancy to rise in this area will affect the drainage from small canals/rivers to the main rivers.
At Vung Tau and Vam Kenh stations, no clear minimum water level trend was found before 1991 (Table 10). The water level trend at Vung Tau station (1991–2009) tended to decrease by about −1.23 cm/year according to Hp1% calculation, and −1.02 cm/year at Vam Kenh (1992–2008) according to Hmin calculation. After 2008, the water level at the two tidal monitoring stations did not have a clear trend.
3.5. Limitations and Future Outlooks
This study shows the change in water level trends before and after the rapid urbanization period, although the change rate is not significantly different. There are two limitations that need to be considered and evaluated further. First, when considering Hp99% at Bien Hoa station before urbanization (1989–1998), the water level change rate was about 1.38 cm/year, but after urbanization (1998–2019), it is 1.31 cm/year. However, the results of the Hmean water level showed that increasing the water level was not clear and not significant after the reservoir came into operation in 1989; meanwhile, the change of Hp1%, Hmin decreased. Bien Hoa station is probably quite close to the Tri An reservoir and is located in an urban area with a high growth rate. The increase in the mean water level and the minimum water level that is not as significant at Bien Hoa as other monitoring locations may be due to the dredging of the Dong Nai riverbed from the Tri An to Hoa An bridge (Bien Hoa) over the past years and the decline in discharge from the Tri An reservoir. Future studies, therefore, should investigate the influence of the upstream flow. Second, there is still no clear quantitative evidence for the river level rise after the impact of the dike polder system in 2008. Besides, the effect of land subsidence on the benchmark elevation at monitoring stations may be one of the factors that is influencing the increase in the water level since Minh et al. [80] identified that the estimated annual land subsidence rate in HCMC is about −8 mm/year to −70 mm/year during 2006 to 2010. A hydrodynamic mathematical model could be useful to determine the relationship between the dike polder system and the increase of the water level that is induced by land subsidence, which will provide more precise evidence.
A recent study by Phuong et al. [50] shows an increase in the average annual precipitation at 10 out of 14 monitoring stations in SGDNrb. However, increased rainfall mainly falls in the dry season and decreases in the rainy season. In another study, Quan et al. [51] presents a tendency to increase the extreme precipitation amount (Max 1-day precipitation amount) about 0–2 mm/year and 0.2–1.8 mm/year for the max 5-day precipitation amount at 11 measuring stations in SGDNrb [39]. However, the current studies on the SGDNrb basin have not shown the relationship between the precipitation and increased water level. Therefore, further studies should assess the effect of precipitation on the water level changes.
The TFPW and MK tests revealed similar results by analyzing the water levels in most cases. This is especially true when the data series appears to exhibit autocorrelation in the case of Hmean, Hp1%, Hmin, and the TFPW tool analyzes the results relatively reliably. For instance, by calculating Hmin at Thu Dau Mot and Vam Kenh stations (1991–2008), TFPW identifies the water level decline rates of about −1.10 cm/year and −1.02 cm/year, or eliminates the unclear and slight increase in the water level (0.19 cm/year) of Hmean at Bien Hoa station (1989–2019). Future studies are recommended to investigate these tests to examine the meteorology and hydrology at a larger scale in the SGDNrb for more validation results and effectiveness.
4. Conclusions and Recommendations
This study calculates the water level trend according to the scenarios Hmax, Hp99%, Hmean, Hp1%, and Hmin, at six main stations from 1980 to 2019 downstream the SGDNrb through the MK and TFPW tests. After that, the years of potential water level change were examined to explore the relationship with the socio-economic development in the basin to analyze the causes and effects and to select the year of change before calculating, in detail, the evolution of the water level trend corresponding to the socio-economic development processes.
Our results conclude that the maximum and average water levels tended to increase at all the monitoring stations from 1980–2019. The cause of the increase in the water level was determined by the process of urbanization causing a loss of water storage area and the construction of the dike polder system that took place in 1998 and 2007. The results of the trends and rates of water level changes at different periods indicates that the maximum water level Hmax, Hp99% increased sharply after 2007 due to the cumulative effects from urbanization and its consequences. For the minimum water level Hp1%, Hmin, except for Thu Dau Mot and Vam Kenh stations, the minimum water level at the other monitoring stations had no clear trend or slight decrease. The lowest increase in water level reduces the drainage capacity from small canals to large rivers and large rivers to the sea. The results also present that sea-level rise is not the leading cause of the sudden rise in the water levels at the inland stations. As for the impact of reservoirs, the influence of the Tri An reservoir on the Dong Nai River at maximum water level is more evident than that of the Dau Tieng reservoir on the Saigon River.
The recent increase in water levels in the downstream area of SGDNrb will exacerbate the risk of urban flooding, saltwater intrusion, and affect economic development and make life difficult for many people that are living in the area. Further studies for the SGDNrb region need to explicitly assess the impacts of water level changes due to each type of infrastructure development before exploring adaptation solutions to help land and water planning strategy for the region in coping with future water level changes.
Author Contributions
C.N.X.Q. developed the methodology and concept, performed data analysis and structured and wrote the first draft; N.N.H.G. reviewed the literature, developed the methodology and wrote the first draft of the manuscript; D.D.T. contributed to the study concept and wrote the draft; D.T.L., P.D.K. and N.D.V. reviewed the state-of-the-art, commented on the content and structure of the manuscript. All authors have read and agreed to the published version of the manuscript.
Funding
This research was funded by the Department of Science and Technology, Ho Chi Minh City under contract No. 62/2019/HĐ-QPTKHCN dated 6 September 2019.
Institutional Review Board Statement
Not applicable.
Informed Consent Statement
Not applicable.
Data Availability Statement
Data used for this study are available from the corresponding author upon request.
Acknowledgments
This research was funded by the Department of Science and Technology, Ho Chi Minh City under contract No. 62/2019/HĐ-QPTKHCN dated September 06 2019. The authors also would like to thank the anonymous reviewers for their careful reading and constructive comments to improve our manuscript.
Conflicts of Interest
The authors declare no conflict of interest.
Abbreviations
| BIC | Bayesian information criterion |
| CRAN | Comprehensive R Archive Network |
| ENSO | El Niño-Southern Oscillation |
| HCMC | Ho Chi Minh City |
| MK | Mann-Kendall |
| Modifiedmk | Modified Mann-Kendall |
| RSS | Residual sum of squares |
| SGDNrb | The lower Sai Gon-Dong Nai river basin |
| TFPW | Trend-Free Prewhitening |
| Note | |
| Time * | Autocorrelation data series |
| Z | Statistically significant at 95% confidence level |
| +Z | Upward trend |
| −Z | Downward trend |
Appendix A
Figure A1.
Water level trends Hp99%.


Figure A2.
Water level trends Hp1%.

Appendix B
Figure A3.
Changepoint years showing the possible shifts in Hp99%.

Figure A4.
Changepoint years showing the possible shifts in Hmean.


Figure A5.
Changepoint years showing the possible shifts in Hp1%.


Figure A6.
Changepoint years showing the possible shifts in Hmin.

References
- Deng, X.; Xu, Y.; Han, L.; Song, S.; Yang, L.; Li, G.; Wang, Y. Impacts of Urbanization on River Systems in the Taihu Region, China. Water 2015, 7, 1340–1358. [Google Scholar] [CrossRef]
- Zaharia, L.; Ioana-toroimac, G.; Cocoş, O.; Ghiţă, F.A.; Mailat, E. Urbanization effects on the river systems in the Bucharest City region (Romania). Ecosyst. Health Sustain. 2016, 2, e01247. [Google Scholar] [CrossRef] [Green Version]
- UNDESA. World Urbanization Prospects; UNDESA: New York, NY, USA, 2018; Volume 12. [Google Scholar]
- Tran, D.D.; Weger, J. Barriers to Implementing Irrigation and Drainage Policies in An Giang Province, Mekong Delta, Vietnam. Irrig. Drain. 2018, 67, 81–95. [Google Scholar] [CrossRef] [Green Version]
- Tran, D.D.; van Halsema, G.; Hellegers, P.J.; Ludwig, F.; Wyatt, A. Questioning triple rice intensification on the Vietnamese Mekong Delta floodplains: An environmental and economic analysis of current land-use trends and alternatives. Environ. Water Manag. 2018, 217, 429–441. [Google Scholar] [CrossRef]
- Tran, D.D.; van Halsema, G.; Hellegers, P.J.; Ludwig, F.; Seijger, C. Stakeholders assessment of alternative flood-based farming systems from a sustainable livelihood perspective in An Giang province. Agric. Water Manag. 2018, 206, 187–199. [Google Scholar] [CrossRef]
- Tran, D.D.; van Halsema, G.; Hellegers, P.J.; Hoang, L.P.; Ludwig, F. Long-term sustainability of the Vietnamese Mekong Delta in question: An economic assessment of water management alternatives. Agric. Water Manag. 2019, 223, 105703. [Google Scholar] [CrossRef]
- Triet, N.V.K.; Dung, N.V.; Hoang, L.P.; Le Duy, N.; Tran, D.D.; Anh, T.T.; Kummu, M.; Merz, B.; Apel, H. Future projections of flood dynamics in the Vietnamese Mekong Delta. Sci. Total. Environ. 2020, 742, 140596. [Google Scholar] [CrossRef] [PubMed]
- Tran, D.D.; Huu, L.H.; Hoang, L.P.; Pham, T.D.; Nguyen, A.H. Sustainability of rice-based livelihoods in the upper floodplains of Vietnamese Mekong Delta: Prospects and challenges. Agric. Water Manag. 2021, 243, 106495. [Google Scholar] [CrossRef]
- Wang, W.; Wu, T.; Li, Y.; Xie, S.; Han, B.; Yuanzheng, L.; Ouyang, Z. Urbanization Impacts on Natural Habitat and Ecosystem Services in the Guangdong-Hong Kong-Macao “Megacity”. Sustainability 2020, 12, 6675. [Google Scholar] [CrossRef]
- Cui, N.; Feng, C.C.; Han, R.; Guo, L. Impact of Urbanization on Ecosystem Health: A Case Study in Zhuhai, China. Int. J. Environ. Res. Public Health 2019, 16, 4717. [Google Scholar] [CrossRef] [PubMed] [Green Version]
- Wang, J.; Hu, C.; Ma, B.; Mu, X. Rapid Urbanization Impact on the Hydrological Processes in Zhengzhou, China. Water 2020, 12, 1870. [Google Scholar] [CrossRef]
- Konrad, C.P. Effects of Urban Development on Floods; USGS: Reston, VA, USA, 2003; p. 4. [Google Scholar]
- Fang, G.; Yuan, Y.; Gao, Y.; Huang, X.; Guo, Y. Assessing the Effects of Urbanization on Flood Events with Urban Agglomeration Polders Type of Flood Control Pattern Using the HEC-HMS Model in the Qinhuai River Basin, China. Water 2018, 10, 1003. [Google Scholar] [CrossRef] [Green Version]
- Hammond, M.; Chen, A.; Djordjević, S.; Butler, D.; Mark, O. Urban flood impact assessment: A state-of-the-art review. Urban Water J. 2015, 12, 14–29. [Google Scholar] [CrossRef] [Green Version]
- Loc, H.H.; Lixian, M.L.; Park, E.; Dung, T.D.; Shrestha, S.; Yoon, Y.J. How the saline water intrusion has reshaped the agricultural landscape of the Vietnamese Mekong Delta, a review. Sci. Total Environ. 2021, 794, 148651. [Google Scholar] [CrossRef] [PubMed]
- Park, E.; Ho, H.L.; Tran, D.D.; Yang, X.; Alcantara, E.; Merino, E.; Son, V.H. Dramatic decrease of flood frequency in the Mekong Delta due to river-bed mining and dyke construction. Sci. Total Environ. 2020, 723, 138066. [Google Scholar] [CrossRef] [PubMed]
- Huong, H.T.L.; Pathirana, A. Urbanization and climate change impacts on future urban flooding in Can Tho city, Vietnam. Hydrol. Earth Syst. Sci. 2013, 17, 379–394. [Google Scholar] [CrossRef] [Green Version]
- Wang, Y.; Xu, Y.; Song, S.; Wang, J.; Zhang, J. Assessing the impacts of climatic and anthropogenic factors on water level variation in the Taihu Plain based on non-stationary statistical models. Environ. Sci. Pollut. Res. 2020, 27, 22829–22842. [Google Scholar] [CrossRef] [PubMed]
- Zhou, Q.; Leng, G.; Su, J.; Ren, Y. Comparison of urbanization and climate change impacts on urban flood volumes: Importance of urban planning and drainage adaptation. Sci. Total Environ. 2019, 658, 24–33. [Google Scholar] [CrossRef]
- Peng, D.; Qiu, L.; Fang, J.; Zhang, Z. Quantification of Climate Changes and Human Activities That Impact Runoff in the Taihu Lake Basin, China. Math. Probl. Eng. 2016, 2016, 2194196. [Google Scholar] [CrossRef] [Green Version]
- Tran, T.A.; Pittock, J.; Tran, D.D. Adaptive flood governance in the Vietnamese Mekong Delta: A policy innovation of the North Vam Nao scheme, An Giang Province. Environ. Sci. Policy 2020, 108, 45–55. [Google Scholar] [CrossRef]
- ADB. Hochiminh City Adaptation to Climate Change; Asian Development Bank: Mandaluyong, Philippines, 2010; Volume 76. [Google Scholar]
- Bangalore, M.; Smith, A.; Veldkamp, T. Exposure to Floods, Climate Change, and Poverty in Vietnam; World Bank: Washington, DC, USA, 2016. [Google Scholar]
- MONRE. Climate Change and Sea Level Rise Scenarios. Science 2016, 294, 1379–1388. [Google Scholar]
- Nguyen, T.B.; Samsura, D.A.A.; van der Krabben, E.; Le, A.D. Saigon-Ho Chi Minh City. Cities 2016, 50, 16–27. [Google Scholar] [CrossRef]
- Kontgis, C.; Schneider, A.; Fox, J.; Saksena, S.; Spencer, J.H.; Castrence, M. Monitoring peri-urbanization in the greater Ho Chi Minh City metropolitan area. Appl. Geogr. 2014, 53, 377–388. [Google Scholar] [CrossRef]
- Tran, D.D.; van Halsema, G.; Hellegers, P.J.G.J.; Hoang, L.P.; Tran, T.Q.; Kummu, M.; Ludwig, F. Assessing impacts of dike construction on the flood dynamics of the Mekong Delta. Hydrol. Earth Syst. Sci. 2018, 22, 1875–1896. [Google Scholar] [CrossRef] [Green Version]
- Luong, V.V.; Bui, D.H. The impact of the decline in area of the storage areas on water level at downstream of the Sai Gon-Dong Nai river system. Int. J. River Basin Manag. 2019, 19, 169–178. [Google Scholar] [CrossRef]
- Ho, L.P.; Nguyen, T.; Chau, N.X.Q.; Nguyen, K.D. Integrated urban flood risk management approach in context of uncertainties: Case study Ho Chi Minh city. La Houille Blanche 2014, 2014, 26–33. [Google Scholar] [CrossRef]
- Vu, T.T.; Kiesel, J.; Guse, B.; Fohrer, N. Towards an improved understanding of hydrological change—Linking hydrologic metrics and multiple change point tests. J. Water Clim. Chang. 2019, 10, 743–758. [Google Scholar] [CrossRef]
- Priyadarshi, N.; Bandyopadhyay, S.; Chowdary, V.M.; Chandrasekar, K.; Chockalingam, J.; Raj, U.; Jha, C.S. Segmentation-based approach for trend analysis and structural breaks in rainfall time series (1851–2006) over India. Hydrol. Sci. J. 2020, 65, 1583–1595. [Google Scholar] [CrossRef]
- Vicca, S.; Balzarolo, M.; Filella, I.; Granier, A.; Herbst, M.; Knohl, A.; Longdoz, B.; Mund, M.; Nagy, Z.; Pintér, K.; et al. Remotely-sensed detection of effects of extreme droughts on gross primary production. Sci. Rep. 2016, 6, 28269. [Google Scholar] [CrossRef] [PubMed]
- Jandhyala, V.; Fotopoulos, S.; MacNeill, I.; Liu, P. Inference for single and multiple change-points in time series. J. Time Ser. Anal. 2013, 34, 423–446. [Google Scholar] [CrossRef]
- Haan, C.T. Statistical Methods in Hydrology; The Iowa State University Press: Ames, IA, USA, 1977. [Google Scholar]
- Mann, H.B. Non-Parametric Test Against Trend. Econometrica 1945, 13, 245–259. [Google Scholar] [CrossRef]
- Kendall, M.G. Rank Correlation Methods; Griffin: London, UK, 1975. [Google Scholar]
- Hirsch, R.M.; Slack, J.R.; Smith, R.A. Techniques of trend analysis for monthly water quality data. Water Resour. Res. 1982, 18, 107–121. [Google Scholar] [CrossRef] [Green Version]
- Hirsch, R.M.; Slack, J.R. A Nonparametric Trend Test for Seasonal Data with Serial Dependence. Water Resour. Res. 1984, 20, 727–732. [Google Scholar] [CrossRef] [Green Version]
- Şen, Z. Innovative Trend Analysis Methodology. J. Hydrol. Eng. 2012, 17, 1042–1046. [Google Scholar] [CrossRef]
- Hamed, K.H.; Rao, A.R. A modified Mann-Kendall trend test for autocorrelated data. J. Hydrol. 1998, 204, 182–196. [Google Scholar] [CrossRef]
- Yue, S.; Wang, C. The Mann-Kendall Test Modified by Effective Sample Size to Detect Trend in Serially Correlated Hydrological Series. Water Resour. Manag. 2004, 18, 201–218. [Google Scholar] [CrossRef]
- Yue, S.; Pilon, P.; Phinney, B.; Cavadias, G. The influence of autocorrelation on the ability to detect trend in hydrological series. Hydrol. Process. 2002, 16, 1807–1829. [Google Scholar] [CrossRef]
- Önöz, B.; Bayazit, M. Block bootstrap for Mann–Kendall trend test of serially dependent data. Hydrol. Process. 2012, 26, 3552–3560. [Google Scholar] [CrossRef]
- Machiwal, D.; Jha, M.K. Hydrologic Time Series Analysis: Theory and Practice; Springer: Dordrecht, The Netherlands, 2012. [Google Scholar]
- Güçlü, Y.S. Improved visualization for trend analysis by comparing with classical Mann-Kendall test and ITA. J. Hydrol. 2020, 584, 124674. [Google Scholar] [CrossRef]
- Dang, V.H.; Tran, D.D.; Cham, D.D.; Hang, P.T.T.; Nguyen, H.T.; Van Truong, H.; Tran, P.H.; Duong, M.B.; Nguyen, N.T.; Van Le, K.; et al. Assessment of Rainfall Distributions and Characteristics in Coastal Provinces of the Vietnamese Mekong Delta under Climate Change and ENSO Processes. Water 2020, 12, 1555. [Google Scholar] [CrossRef]
- Dang, H.V.; Tran, D.D.; Pham, B.T.; Khoi, N.D.; Tran, H.P.; Nguyen, T.N. Exploring Freshwater Regimes and Impact Factors in the Coastal Estuaries of the Vietnamese Mekong Delta. Water 2019, 11, 782. [Google Scholar] [CrossRef] [Green Version]
- Khoi, D.N.; Trang, H.T. Analysis of Changes in Precipitation and Extremes Events in Ho Chi Minh City, Vietnam. Procedia Eng. 2016, 142, 229–235. [Google Scholar] [CrossRef] [Green Version]
- Phuong, D.N.D.; Linh, V.T.; Nhat, T.T.; Dung, H.M.; Loi, N.K. Spatiotemporal variability of annual and seasonal rainfall time series in Ho Chi Minh city, Vietnam. J. Water Clim. Chang. 2019, 10, 658–670. [Google Scholar] [CrossRef]
- Quan, N.T.; Khoi, D.N.; Hoan, N.X.; Phung, N.K.; Dang, T.D. Spatiotemporal Trend Analysis of Precipitation Extremes in Ho Chi Minh City, Vietnam during 1980–2017. Int. J. Disaster Risk Sci. 2021, 12, 131–146. [Google Scholar] [CrossRef]
- Attar, N.F.; Pham, Q.B.; Nowbandegani, S.F.; Rezaie-Balf, M.; Fai, C.M.; Ahmed, A.N.; Pipelzadeh, S.; Dung, T.D.; Nhi, P.T.T.; Khoi, D.N.; et al. Enhancing the Prediction Accuracy of Data-Driven Models for Monthly Streamflow in Urmia Lake Basin Based upon the Autoregressive Conditionally Heteroskedastic Time-Series Model. Appl. Sci. 2020, 10, 571. [Google Scholar] [CrossRef] [Green Version]
- Salas, J.D. Applied Modeling of Hydrologic Time Series; Water Resources Publication: Littleton, CO, USA, 1980. [Google Scholar]
- Gocic, M.; Trajkovic, S. Analysis of changes in meteorological variables using Mann-Kendall and Sen’s slope estimator statistical tests in Serbia. Glob. Planet. Change 2013, 100, 172–182. [Google Scholar] [CrossRef]
- Sayemuzzaman, M.; Jha, M.K. Seasonal and annual precipitation time series trend analysis in North Carolina, United States. Atmos. Res. 2014, 137, 183–194. [Google Scholar] [CrossRef]
- Chattopadhyay, S.; Edwards, D.R. Long-term trend analysis of precipitation and air temperature for Kentucky, United States. Climate 2016, 4, 10. [Google Scholar] [CrossRef]
- Hamed, K.H. Trend detection in hydrologic data: The Mann–Kendall trend test under the scaling hypothesis. J. Hydrol. 2008, 349, 350–363. [Google Scholar] [CrossRef]
- Cao, Y.; Zhang, W.; Zhu, Y.; Ji, X.; Xu, Y.; Wu, Y.; Hoitink, A. Impact of trends in river discharge and ocean tides on water level dynamics in the Pearl River Delta. Coast. Eng. 2020, 157, 103634. [Google Scholar] [CrossRef]
- von Storch, H.; Geesthacht, H.; Navarra, A. Misuses of Statistical Analysis in Climate. In Analysis of Climate Variability: Applications of Statistical Techniques; Springer: Berlin/Heidelberg, Germany, 1995; pp. 10–26. [Google Scholar]
- Sen, P.K. Estimates of the Regression Coefficient Based on Kendall’s Tau. J. Am. Stat. Assoc. 1968, 63, 1379. [Google Scholar] [CrossRef]
- Zeileis, A.; Kleiber, C.; Walter, K.; Hornik, K. Testing and dating of structural changes in practice. Comput. Stat. Data Anal. 2003, 44, 109–123. [Google Scholar] [CrossRef] [Green Version]
- Zeileis, A.; Leisch, F.; Hornik, K.; Kleiber, C. Strucchange: An R package for testing for structural change in linear regression models. J. Stat. Softw. 2002, 7, 1–38. [Google Scholar] [CrossRef] [Green Version]
- Bai, J. Estimating Multiple Breaks. Econom. Theory 1997, 13, 315–352. [Google Scholar] [CrossRef] [Green Version]
- Bai, J. Least squares estimation of a shift in linear processes. J. Time Ser. Anal. 1994, 15, 453–472. [Google Scholar] [CrossRef] [Green Version]
- Bai, J. Estimation of a Change Point in Multiple Regression Models. Rev. Econ. Stat. 1997, 79, 551–563. [Google Scholar] [CrossRef]
- Bai, J.; Perron, P. Book Review: Estimating and Testing Linear Models with Multiple Structural Changes; The Econometric Society: Cleveland, OH, USA, 2012; Available online: http://www.jstor.org/stable/2998540 (accessed on 20 November 2021).
- Bai, J.; Perron, P. Computation and analysis of multiple structural change models. J. Appl. Econ. 2003, 18, 1–22. [Google Scholar] [CrossRef] [Green Version]
- Zeileis, A.; Leisch, F.; Hornik, K.; Kleiber, C.; Hansen, B.; Merkle, E.C. StrucchangeRcpp: Testing, Monitoring, and Dating Structural Changes Description—Package, version 1.5-2. 2019. Available online: https://CRAN.R-project.org/package=strucchangeRcpp (accessed on 20 November 2021).
- Schwarz, G. Book Review: Estimating the Dimension of a Model; Institute of Mathematical Statistics Source: Beachwood, OH, USA, 2012; Volume 6, pp. 461–464. Available online: http://www.jstor.org (accessed on 20 November 2021).
- Pohlert, T. Trend: Non-Parametric Trend Tests and Changepoint Detection—R Package, version 1.1.2. 2020. Available online: https://CRAN.R-project.org/package=trend (accessed on 20 November 2021).
- Patakamuri, S.K.; O′Brien, N.M. Modified Versions of Mann Kendall and Spearman’s Rho Trend Tests; The R Project for Statistical Computing: Vienna, Austria, 2019. [Google Scholar]
- EVNHPC. Development History of Tri An Hydropower; EVNHPC: Hanoi, Vietnam, 2016. [Google Scholar]
- Van, T.T.; Bao, H.D.X. Study of the Impact of Urban Development on Surface Temperature Using Remote Sensing in Ho Chi Minh City, Southern Vietnam. Geogr. Res. 2010, 48, 86–96. [Google Scholar] [CrossRef]
- The Prime Minister. Decision No. 1547/QĐ-TTg 2008—Approving the Master Plan for Flood Prevention in HCMC; Vietnam Ministry of Natural Resources and Environment: Ho Chi Minh City, Vietnam, 2008. [Google Scholar]
- NOAAA. NOAAA. Cold & Warm Episodes by Season; NOAAA: College Park, MD, USA. In Cold & Warm Episodes by Season; NOAAA: College Park, MD, USA. Available online: https://origin.cpc.ncep.noaa.gov/products/analysis_monitoring/ensostuff/ONI_v5.php (accessed on 20 November 2021).
- Song, S.; Xu, Y.; Zhang, J.; Li, G.; Wang, Y. The long-term water level dynamics during urbanization in plain catchment in Yangtze River Delta. Agric. Water Manag. 2016, 174, 93–102. [Google Scholar] [CrossRef]
- Xu, Y.; Xu, Y.; Wang, Q. Evolution of trends in water levels and their causes in the Taihu Basin, China. Hydrol. Sci. J. 2020, 65, 2296–2308. [Google Scholar] [CrossRef]
- Wang, Y.; Xu, Y.; Xu, Y.; Song, S.; Li, G.; Wu, L. Changing patterns of extreme water levels in urbanizing plain river network region of Taihu Basin, China: Characteristics and causes. Hydrol. Earth Syst. Sci. Discuss. 2016, 25, 1–24. [Google Scholar]
- Song, S.; Xu, Y.; Wu, Z.; Deng, X.; Wang, Q. The relative impact of urbanization and precipitation on long-term water level variations in the Yangtze River Delta. Sci. Total. Environ. 2019, 648, 460–471. [Google Scholar] [CrossRef] [PubMed]
- Minh, D.H.T.; Van Trung, L.; Le Toan, T. Mapping Ground Subsidence Phenomena in Ho Chi Minh City through the Radar Interferometry Technique Using ALOS PALSAR Data. Remote. Sens. 2015, 7, 8543–8562. [Google Scholar] [CrossRef] [Green Version]
Figure 1.
The study area and the location of the six gauging stations that were investigated.

Figure 2.
Methodology flowchart.

Figure 3.
Annual maximum water level trends Hmax.


Figure 4.
Annual minimum water level trends Hmin.


Figure 5.
Annual medium water level trends Hmean.


Figure 6.
Changepoint years showing possible shifts in Hmax.


Figure 7.
Imperious surface change in Ho Chi Minh city over the period 1989–2006 adopted from Van and Bao [73].
Figure 7.
Imperious surface change in Ho Chi Minh city over the period 1989–2006 adopted from Van and Bao [73].

Figure 8.
Transition from cropland to construction land in Ho Chi Minh City with data referenced from Kontgis et al. [27].
Figure 8.
Transition from cropland to construction land in Ho Chi Minh City with data referenced from Kontgis et al. [27].

Figure 9.
The dike polder system under the planning project No. 1547.

Figure 10.
Overview of the water level changes in 1980–2019 corresponding to socio-economic development events.
Figure 10.
Overview of the water level changes in 1980–2019 corresponding to socio-economic development events.


Table 1.
Description of the six monitoring stations.
| No. | Characteristic | Water Level (m) | |||||
|---|---|---|---|---|---|---|---|
| Station | Available Data | Lat/Long | Rivers | Max | Mean | Min | |
| 1 | Bien Hoa | 1980–2019 | 10°56′/106°50′ | Dong Nai | 2.19 | 0.31 | −2.06 |
| 2 | Nha Be | 1981–2019 | 10°41′/106°45′ | Dong Nai | 1.80 | 0.04 | −2.70 |
| 3 | Thu Dau Mot | 1980–2019 | 10°52′/106°42′ | Sai Gon | 1.67 | 0.21 | −2.55 |
| 4 | Phu An | 1980–2019 | 10°49′/106°43′ | Sai Gon | 1.74 | 0.11 | −2.52 |
| 5 | Vam Kenh | 1984–2018 | 10°16′/106°43′ | Tide | 1.73 | −0.07 | −2.67 |
| 6 | Vung Tau | 1980–2019 | 10°22′/107°42′ | Tide | 1.48 | −0.23 | −3.32 |
Table 2.
The effects of autocorrelation of data series.
| Station | r1 | r(f) | r(b) | ||||
|---|---|---|---|---|---|---|---|
| HMax | Hp99% | HMean | Hp1% | HMin | |||
| Dong Nai river | |||||||
| Bien Hoa | 0.52 | 0.62 | 0.83 | 0.72 | 0.59 | −0.29 | 0.23 |
| Nha Be | 0.84 | 0.91 | 0.82 | 0.67 | 0.56 | −0.29 | 0.24 |
| Sai Gon river | |||||||
| Thu Dau Mot | 0.92 | 0.92 | 0.90 | 0.92 | 0.72 | −0.29 | 0.23 |
| Phu An | 0.93 | 0.95 | 0.87 | 0.78 | 0.65 | −0.29 | 0.23 |
| Tidal station | |||||||
| Vam Kenh | 0.46 | 0.87 | 0.91 | 0.77 | 0.71 | −0.31 | 0.25 |
| Vung Tau | 0.58 | 0.65 | 0.71 | 0.77 | 0.37 | −0.29 | 0.23 |
Table 3.
Water level trend analysis based on Mann-Kendall, TFPW tests, and Sen’s slope.
| Station | Indices | HMax | Hp99% | HMean | Hp1% | HMin | |||||
|---|---|---|---|---|---|---|---|---|---|---|---|
| Z | Sen | Z | Sen | Z | Sen | Z | Sen | Z | Sen | ||
| Dong Nai river | |||||||||||
| Bien Hoa | TFPW | 5.01 | 1.55 | 5.59 | 1.53 | 4.89 | 0.72 | 0.8 | 0.11 | −0.94 | −0.16 |
| MK | 5.14 | 1.55 | 5.72 | 1.48 | 4.44 | 0.76 | 0.55 | 0.14 | −0.47 | −0.07 | |
| Nha Be | TFPW | 6.96 | 1.32 | 7.59 | 1.27 | 6.54 | 0.45 | −2.51 | −0.28 | −1.76 | −0.36 |
| MK | 6.58 | 1.25 | 7.19 | 1.20 | 5.78 | 0.42 | −2.66 | −0.32 | −1.77 | −0.38 | |
| Sai Gon river | |||||||||||
| Thu Dau Mot | TFPW | 7.77 | 1.26 | 7.98 | 1.18 | 7.02 | 0.75 | 6.94 | 1.54 | 5.37 | 1.84 |
| MK | 7.04 | 1.11 | 7.07 | 1.08 | 5.6 | 0.70 | 4.35 | 1.45 | 4.94 | 1.80 | |
| Phu An | TFPW | 7.79 | 1.47 | 7.91 | 1.38 | 6.41 | 0.49 | 2.35 | 0.20 | 1.6 | 0.25 |
| MK | 7.15 | 1.38 | 7.21 | 1.33 | 5.58 | 0.47 | 0.73 | 0.13 | 0.9 | 0.17 | |
| Tidal station | |||||||||||
| Vam Kenh | TFPW | 4.86 | 0.71 | 6.08 | 0.80 | 6.49 | 0.64 | 4.65 | 0.68 | 3.94 | 0.75 |
| MK | 4.84 | 0.69 | 6.02 | 0.77 | 6.33 | 0.65 | 4.00 | 0.73 | 3.50 | 0.83 | |
| Vung Tau | TFPW | 4.36 | 0.54 | 4.69 | 0.44 | 4.89 | 0.33 | 3.97 | 0.39 | 1.21 | 0.20 |
| MK | 3.97 | 0.50 | 4.6 | 0.43 | 4.53 | 0.33 | 2.34 | 0.34 | 1.25 | 0.20 | |
Note: Z: statistically significant at 95% confidence level; +Z: upward trend, whereas −Z: downward trend.
Table 4.
Changepoint year based on water level analysis.
| Station | Hmax | Hp99% | Hmean | Hp1% | Hmin |
|---|---|---|---|---|---|
| Dong Nai river | |||||
| Bien Hoa | 1998 | 1989, 1998 | 1989 | - | - |
| Nha Be | 1995, 2001, 2011 | 1997, 2005, 2010 | 1998, 2007 | 1991, 1998, 2003, 2009 | - |
| Sai Gon river | |||||
| Thu Dau Mot | 1998, 2009 | 1998, 2009 | 1998, 2009 | 1993, 2001, 2008 | 1991, 2010 |
| Phu An | 1998, 2006, 2012 | 1997, 2007 | 1994, 2007 | 1994, 2000, 2008 | - |
| Tidal station | |||||
| Vam Kenh | 1995, 2007 | 1995, 2007 | 1995, 2007 | 1991, 2003, 2008 | 1992, 2003, 2008 |
| Vung Tau | 1991 | 1992 | 1991, 2007 | 1991, 2002, 2009 | - |
Table 5.
Changepoint years selected for further analysis.
| Station | HMax | Hp99% | HMean | Hp1% | HMin |
|---|---|---|---|---|---|
| Dong Nai river | |||||
| Bien Hoa | 1998 | 1989, 1998 | 1989 | - | - |
| Nha Be | 1995, 2011 | 1997, 2010 | 1998, 2007 | 1998, 2009 | - |
| Sai Gon river | |||||
| Thu Dau Mot | 1998, 2009 | 1998, 2009 | 1998, 2009 | 1993, 2008 | 1991, 2010 |
| Phu An | 1998, 2006 | 1997, 2007 | 1994, 2007 | 1994, 2008 | - |
| Tidal station | |||||
| Vam Kenh | 1995, 2007 | 1995, 2007 | 1995, 2007 | 1991, 2008 | 1992, 2008 |
| Vung Tau | 1991 | 1992 | 1991, 2007 | 1991, 2009 | - |
Table 6.
The periodic water level trend at Hmax.
| Station | Time | Mean | MK | TFPW | ||
|---|---|---|---|---|---|---|
| Z | Slope | Z | Slope | |||
| Dong Nai river | ||||||
| Bien Hoa | 1980–1998 | 1.53 | 1.72 | 1.18 | 1.36 | 1.16 |
| 1998–2019 | 1.87 | 2.03 | 1.27 | 1.54 | 0.96 | |
| Nha Be | 1981–1995 * | 1.31 | −0.05 | 0.00 | 0.66 | 0.12 |
| 1995–2011 * | 1.45 | 3.35 | 1.26 | 2.93 | 1.17 | |
| 2011–2019 * | 1.67 | 2.64 | 2.55 | 2.10 | 1.98 | |
| 1995–2019 | 1.53 | 5.50 | 1.71 | 5.28 | 1.76 | |
| Sai Gon river | ||||||
| Thu Dau Mot | 1980–1998 * | 1.12 | 0.49 | 0.06 | 0.98 | 0.14 |
| 1998–2009 * | 1.22 | 3.34 | 0.88 | 2.80 | 0.81 | |
| 2009–2019 * | 1.51 | 3.98 | 3.29 | 3.58 | 3.14 | |
| 1998–2019 | 1.36 | 5.94 | 2.50 | 5.89 | 2.64 | |
| Phu An | 1980–1998 * | 1.27 | 1.50 | 0.20 | 2.20 | 0.30 |
| 1998–2006 * | 1.41 | 1.16 | 0.79 | 0.62 | 0.29 | |
| 2006–2019 * | 1.61 | 4.12 | 2.00 | 3.72 | 1.96 | |
| 1998–2019 | 1.54 | 5.40 | 1.86 | 5.22 | 1.90 | |
| Tidal station | ||||||
| Vam Kenh | 1984–1995 | 1.48 | 0.00 | 0.00 | 1.25 | 0.57 |
| 1995–2007 * | 1.58 | 0.18 | 0.18 | −0.34 | −0.14 | |
| 2007–2018 * | 1.64 | 2.09 | 0.79 | 1.71 | 0.42 | |
| 1995–2018 * | 1.61 | 3.11 | 0.59 | 2.54 | 0.53 | |
| Vung Tau | 1980–1991 * | 1.24 | −0.07 | 0.00 | 0.16 | 0.30 |
| 1991–2019 * | 1.37 | 1.49 | 0.25 | 1.32 | 0.26 | |
Note: Time *: autocorrelation data series; Z: statistically significant at 95% confidence level; +Z: upward trend, whereas −Z: downward trend.
Table 7.
Periodic water level trend at Hp99%.
| Station | Time | Mean | MK | TFPW | ||
|---|---|---|---|---|---|---|
| Z | Slope | Z | Slope | |||
| Dong Nai river | ||||||
| Bien Hoa | 1980–1989 | 1.28 | −0.89 | −2.41 | −0.94 | −1.76 |
| 1989–1998 | 1.46 | 0.89 | 1.38 | 0.10 | 0.25 | |
| 1998–2019 * | 1.69 | 2.88 | 1.31 | 2.39 | 1.17 | |
| 1989–2019 | 1.62 | 4.66 | 1.40 | 4.28 | 1.31 | |
| Nha Be | 1981–1997 * | 1.17 | 1.19 | 0.24 | 1.76 | 0.36 |
| 1997–2010 * | 1.31 | 3.39 | 1.25 | 2.99 | 1.15 | |
| 2010–2019 * | 1.49 | 2.86 | 1.45 | 2.61 | 1.27 | |
| 1997–2019 | 1.38 | 5.60 | 1.59 | 5.36 | 1.53 | |
| Sai Gon river | ||||||
| Thu Dau Mot | 1980–1998 * | 1.06 | 0.70 | 0.14 | 1.67 | 0.22 |
| 1998–2009 * | 1.16 | 3.36 | 0.79 | 3.11 | 0.74 | |
| 2009–2019 * | 1.40 | 3.74 | 2.56 | 3.40 | 2.38 | |
| 1998–2019 | 1.28 | 5.87 | 2.04 | 5.71 | 2.12 | |
| Phu An | 1980–1997 * | 1.15 | 0.83 | 0.20 | 1.69 | 0.38 |
| 1997–2007 * | 1.29 | 3.11 | 1.32 | 2.86 | 1.28 | |
| 2007–2019 * | 1.48 | 3.72 | 1.53 | 3.36 | 1.35 | |
| 1997–2019 | 1.40 | 5.86 | 1.59 | 5.75 | 1.54 | |
| Tidal station | ||||||
| Vam Kenh | 1984–1995 * | 1.24 | 0.89 | 0.26 | 1.25 | 0.55 |
| 1995–2007 * | 1.36 | 1.04 | 0.30 | 0.48 | 0.18 | |
| 2007–2018 * | 1.44 | 0.75 | 0.21 | 0.00 | 0.00 | |
| 1995–2018 * | 1.40 | 3.89 | 0.54 | 3.49 | 0.46 | |
| Vung Tau | 1980–1992 * | 1.06 | 0.31 | 0.06 | 0.62 | 0.41 |
| 1992–2019 * | 1.17 | 1.76 | 0.22 | 1.63 | 0.19 | |
Note: Time *: autocorrelation data series; Z: statistically significant at 95% confidence level; +Z: upward trend, whereas −Z: downward trend.
Table 8.
Periodic water level trend at Hmean.
| Station | Time | Mean | MK | TFPW | ||
|---|---|---|---|---|---|---|
| Z | Slope | Z | Slope | |||
| Dong Nai river | ||||||
| Bien Hoa | 1980–1989* | 0.10 | −0.54 | −1.31 | −0.10 | −0.31 |
| 1989–2019* | 0.37 | 2.01 | 0.27 | 1.43 | 0.19 | |
| Nha Be | 1981–1998 | 0.00 | 1.36 | 0.17 | 2.27 | 0.25 |
| 1998–2007 | 0.03 | −0.89 | −0.29 | −1.36 | −0.38 | |
| 2007–2019 | 0.10 | 2.75 | 0.51 | 2.13 | 0.43 | |
| 1998–2019 * | 0.07 | 4.00 | 0.59 | 4.02 | 0.57 | |
| Sai Gon river | ||||||
| Thu Dau Mot | 1980–1998 | 0.14 | 0.00 | 0.02 | 0.00 | 0.01 |
| 1998–2009 | 0.18 | 0.75 | 0.37 | 0.31 | 0.21 | |
| 2009–2019 | 0.37 | 3.11 | 1.65 | 2.50 | 1.40 | |
| 1998–2019 * | 0.27 | 4.57 | 1.56 | 4.68 | 1.52 | |
| Phu An | 1980–1994 * | 0.06 | 0.00 | 0.00 | 0.66 | 0.15 |
| 1994–2007 | 0.10 | 0.33 | 0.15 | 0.00 | 0.00 | |
| 2007–2019 | 0.19 | 1.53 | 0.37 | 0.75 | 0.09 | |
| 1994–2019 * | 0.14 | 4.14 | 0.58 | 3.99 | 0.52 | |
| Tidal station | ||||||
| Vam Kenh | 1984–1995 * | −0.15 | 2.81 | 0.37 | 2.80 | 0.48 |
| 1995–2007 | −0.05 | 0.92 | 0.34 | 0.34 | 0.09 | |
| 2007–2018 | 0.00 | 0.48 | 0.13 | 0.00 | 0.07 | |
| 1995–2018 * | −0.02 | 3.75 | 0.44 | 3.64 | 0.39 | |
| Vung Tau | 1980–1991 * | −0.29 | −0.07 | −0.03 | 0.00 | 0.02 |
| 1991–2007 | −0.22 | −0.95 | −0.31 | −2.30 | −0.45 | |
| 2007–201 9* | −0.18 | 1.40 | 0.30 | 0.89 | 0.20 | |
| 1991–2019 * | −0.20 | 1.93 | 0.15 | 1.24 | 0.12 | |
Note: Time *: autocorrelation data series; Z: statistically significant at 95% confidence level; +Z: upward trend, whereas −Z: downward trend.
Table 9.
Periodic water level trend at Hp1%.
| Station | Time | Mean | MK | TFPW | ||
|---|---|---|---|---|---|---|
| Z | Slope | Z | Slope | |||
| Dong Nai river | ||||||
| Nha Be | 1981–1998 * | −2.07 | 2.42 | 1.03 | 3.75 | 1.25 |
| 1998–2009 * | −2.20 | −2.54 | −2.29 | −2.02 | −1.44 | |
| 2009–2019 | −2.17 | 0.16 | 0.20 | −0.54 | −0.06 | |
| 1998–2019 * | −2.18 | 0.11 | 0.04 | 1.54 | 0.32 | |
| Sai Gon river | ||||||
| Thu Dau Mot | 1980–1993 * | −1.93 | −0.88 | −0.50 | 0.43 | 0.30 |
| 1993–2008 * | −1.85 | −1.49 | −1.07 | −2.87 | −1.19 | |
| 2008–2019* | −1.51 | 2.81 | 4.04 | 2.49 | 3.19 | |
| 1993–2019 * | −1.70 | 3.59 | 1.83 | 4.94 | 1.84 | |
| Phu An | 1980–1994 * | −2.00 | −0.99 | −0.85 | −0.11 | −0.06 |
| 1994–2008 * | −1.99 | −2.97 | −2.22 | −3.39 | −2.51 | |
| 2008–2019 * | −1.92 | 0.34 | 0.49 | −0.31 | −0.21 | |
| 1994–2019 * | −1.96 | −0.18 | −0.08 | −0.07 | −0.01 | |
| Tidal station | ||||||
| Vam Kenh | 1984–1991 * | −2.24 | 1.86 | 0.75 | 1.20 | 0.78 |
| 1991–2008 | −2.06 | −0.23 | −0.15 | −1.36 | −0.33 | |
| 2008–2018 * | −2.02 | 1.25 | 0.66 | 0.54 | 0.57 | |
| 1991–2018 | −2.05 | 1.52 | 0.22 | 1.00 | 0.13 | |
| Vung Tau | 1980–1991 * | −2.65 | −1.17 | −1.07 | −1.25 | −0.43 |
| 1991–2009 * | −2.56 | −2.66 | −1.04 | −3.79 | −1.23 | |
| 2009–2019 | −2.50 | 1.56 | 0.86 | 0.89 | 0.68 | |
| 1991–2019 * | −2.53 | 0.17 | 0.04 | −0.18 | −0.02 | |
Note: Time *: autocorrelation data series; Z: statistically significant at 95% confidence level; +Z: upward trend, whereas −Z: downward trend.
Table 10.
Periodic water level trend at Hmin.
| Station | Time | Mean | MK | TFPW | ||
|---|---|---|---|---|---|---|
| Z | Slope | Z | Slope | |||
| Sai Gon river | ||||||
| Thu Dau Mot | 1980–1991 | −2.36 | −0.07 | −0.38 | −1.25 | −3.19 |
| 1991–2008 * | −2.20 | −0.95 | −0.67 | −2.18 | −1.10 | |
| 2008–2019 * | −1.83 | 2.96 | 4.18 | 2.34 | 4.04 | |
| 1991–2019 * | −2.05 | 3.77 | 2.00 | 4.84 | 1.84 | |
| Tidal station | ||||||
| Vam Kenh | 1984–1992 * | −2.51 | 1.37 | 0.86 | 1.61 | 0.68 |
| 1992–2008 * | −2.31 | −1.57 | −0.84 | −2.30 | −1.02 | |
| 2008–2018 * | −2.25 | 0.47 | 0.30 | 0.72 | 0.46 | |
| 1992–2018 * | −2.28 | 0.61 | 0.12 | −0.22 | −0.03 | |
Note: Time *: autocorrelation data series; Z: statistically significant at 95% confidence level; +Z: upward trend, whereas −Z: downward trend.
Publisher’s Note: MDPI stays neutral with regard to jurisdictional claims in published maps and institutional affiliations. |
© 2022 by the authors. Licensee MDPI, Basel, Switzerland. This article is an open access article distributed under the terms and conditions of the Creative Commons Attribution (CC BY) license (https://creativecommons.org/licenses/by/4.0/).
Share and Cite
MDPI and ACS Style
Giang, N.N.H.; Quang, C.N.X.; Long, D.T.; Ky, P.D.; Vu, N.D.; Tran, D.D. Statistical and Hydrological Evaluations of Water Dynamics in the Lower Sai Gon-Dong Nai River, Vietnam. Water 2022, 14, 130. https://doi.org/10.3390/w14010130
AMA Style
Giang NNH, Quang CNX, Long DT, Ky PD, Vu ND, Tran DD. Statistical and Hydrological Evaluations of Water Dynamics in the Lower Sai Gon-Dong Nai River, Vietnam. Water. 2022; 14(1):130. https://doi.org/10.3390/w14010130
Chicago/Turabian StyleGiang, Ngo Ngoc Hoang, Chau Nguyen Xuan Quang, Do Tan Long, Pham Dinh Ky, Nguyen Duc Vu, and Dung Duc Tran. 2022. "Statistical and Hydrological Evaluations of Water Dynamics in the Lower Sai Gon-Dong Nai River, Vietnam" Water 14, no. 1: 130. https://doi.org/10.3390/w14010130
Note that from the first issue of 2016, this journal uses article numbers instead of page numbers. See further details here.