
Estimation of Groundwater Depletion in Iran’s Catchments Using Well Data


1
Department of Civil and Environmental Engineering, Norwegian University of Science and Technology (NTNU), 7491 Trondheim, Norway
2
Faculty of Science and Technology, Norwegian University of Life Sciences (NMBU), 1430 Akershus, Norway
*
Author to whom correspondence should be addressed.
Water 2022, 14(1), 131; https://doi.org/10.3390/w14010131
Submission received: 8 November 2021
/
Revised: 28 December 2021
/
Accepted: 31 December 2021
/
Published: 5 January 2022
(This article belongs to the Topic Water Management in the Era of Climatic Change)
Abstract
:Iran is experiencing significant water challenges that have now turned water security into a national priority. By estimating secular trend groundwater storage in Iran between 2002 and 2017, we see that there is an intensive negative trend, even −4400 Mm3 in some areas. These estimations show shifting in the climate and extra extraction from aquifers for agricultural use in some areas in Iran. The secular trend of groundwater storage changes across the whole of Iran inferred from observation well data is −20.08 GT/yr. The secular trends of GWS changes based on observation well data are: −11.55 GT/yr for the Central Plateau basin, −3.60 GT/yr for the Caspian Sea basin, −3.0 GT/yr for the Persian Gulf and Oman Sea basin, −0.53 GT/yr for the Urmieh Lake basin, −0.57 GT/yr for the Eastern Boundary basin, and −0.83 GT/yr for the Gharaghom basin. The most depleted sub-basin (Kavir Markazi) has secular trends of GWS changes of −4.503 GT/yr. This study suggests that groundwater depletion is the largest single contributor to the observed negative trend of groundwater storage changes in Iran, the majority of which occurred after the drought in 2007. The groundwater loss that has been accrued during the study period is particularly alarming for Iran, which is already facing severe water scarcity.
1. Introduction
Water is an essential resource for life on Earth. In recent decades, because of growth in the population and in technologies, demands for water resources have been increasing. Due to groundwater’s physical properties, it has a special role in human life, and it is one of the most important natural resources for nations, especially in a dry and semi-dry climate like that of Iran. Water shortages in Middle Eastern countries cause a variety of problems and lead to economic and consequently political instability, and there is a high frequency of conflicts due to disputes over groundwater [1,2,3]. The annual precipitation in Iran is 273 mm, which is less than one-third of the world’s mean annual precipitation [4]. Because of the recent drought, the rate of precipitation has reached its lowest point (the minimum yearly precipitation) in more than 40 years, and the average surface run-off in this period is 42% less than the long-term average. In Iran, 72% of precipitation evaporates and transpires and only 22% of precipitation flows in as surface water source [5]. The temporal and spatial distribution of rainfall in Iran is not uniform. About 75% of the nation’s precipitation falls on the southern coast of the Caspian Sea, and only 25% of the precipitation falls during plant growth season [4,6]. In addition, because of the relatively high temperature, about half of the annual precipitation evaporates, so there are few permanent streams in Iran. Furthermore, population growth and inappropriate spatial population distribution is currently causing the 20 most populous Iranian cities to experience a medium to extremely high overall water risk.
Deep beneath the ground, groundwater is unseen and protected from evaporation and pollution, and there is easy access to pumped wells and access to groundwater any time and everywhere it is needed. All of these factors make people inclined to use more groundwater in Iran [7,8]. Iran’s sources of groundwater include wells, springs and underground aqueducts known as qanats. Groundwater amounts to 60% of the country’s total supply and is consumed almost entirely by the agricultural sector [9]. Iran is one of the world’s largest consumers of groundwater [10], and the vast majority of the population lives in areas that are highly dependent on groundwater for drinking and irrigation. Continuing the business-as-usual approach in depleting aquifers will expose Iran to food and water risks as well as social and political security issues. On average, more than half of the design capacity of Iran’s reservoirs was empty from 2003 to 2017 due to intensive water extraction in the agricultural sector [11]. Groundwater overdraft has contributed to different socioecological problems, including the drying up of wetlands, desertification, sand and dust storms, weakening water quality, frequent occurrences of floods, and climate migration [12,13,14]. It has also increased the desertification and salinization of land and has also degraded groundwater quality due to natural processes such as saltwater intrusion [15,16,17,18]. Land subsidence due to groundwater depletion is now a manmade hazard to vital infrastructure and residents on vulnerable plains. The increasing stress on rural livelihoods and increasing tensions among groundwater users worsen food and water security risks [19], and create issues related to the migration of rural populations to urban areas. In addition, rapidly growing demand for crops has put pressure on authorities to give permission to dig new wells. There are many illegal wells in aquifers in Iran, so there is no appropriate control over the withdrawals of water there. The number of wells has dramatically increased in the past decade in Iran. While the number of groundwater extraction points increased by 84.9% from 546,000 in 2002 to over a million in 2015.
All of these issues make groundwater management a high-priority matter in Iran, but groundwater monitoring has not been carried out well in some regions. Groundwater withdrawal statistics are sometimes outdated and measured using inconsistent methods [20,21]. The acquisition of accurate data represents a major challenge mainly due to the hidden nature of groundwater. The spatial and temporal variability of groundwater data ought to be good enough for proper water management studies. However, availability of the time series of parameters of Groundwater Storage (GWS) is usually limited and uncertain [22]. Collected well water-table data are being used to produce the time series of GWS. The distribution of observation wells is usually not uniform and there are regions with sparce data. Better water level monitoring and better assessment and forecasting of water resources would help government agencies allocate water more efficiently among competing needs [23].
Relatively good groundwater data records exist in Iran. The Iran Water Resources Management Company has collected data from a large number of observation wells for 40 years that are used in different hydrological studies. But these data are not well organized, and a huge part of this study was to collect all these data and put them into a database to finally allow the calculation of GWS changes from well data. Despite its importance, there have been few hydrological studies carried out on an entire water basin using GWS observational data in Iran. In this study, we used the water level of all 17,865 observation wells between 2002 and 2017 to estimate nationwide groundwater depletion in Iran.
The main objective of this study is to collect, assess, and evaluate all observation well data, producing a nationwide database, and allocating those data across water basins in Iran to constitute the time series of groundwater data for a final estimation of GWS changes using in-situ hydrological data.
This study provides a statistical analysis of the major groundwater characteristics using a rich ground-based dataset (2002 to 2017) to determine the groundwater depletion in all 32 sub-basins of Iran. The investigation of the temporal trend and spatial distribution of groundwater depletion provides valuable information for the effective management of groundwater storage across Iran and offers insights to other countries facing similar water security issues.
In the following sections, the distribution of observation wells in Iran’s main water basins is explained and the analysis method is presented. The results are manifested in the spatial dependence of groundwater storage and the time series of GWS changes. The time series of GWS changes across Iran’s main basins are analyzed and the trends of GWS changes across main basins and sub-basins are presented. The last section is devoted to concluding remarks and outlooks.
2. Data and Analysis Method
2.1. Data
There are 17,865 active observation wells in the whole of Iran. In order to study the well level time series, Iran is divided into six main basins: the Caspian Sea basin (with a 175,051 km2 area, code 1), the Persian Gulf and Oman Sea basin (with a 424,029.6 km2 area, code 2), the Lake Urmieh basin (with a 52,000 km2 area, code 3), the Central Plateau basin (with an 825,000 km2 area, code 4), the Eastern Boundary basin (with a 106,000 km2 area, code 5), and the Ghareghom basin (with a 44,295.5 km2 area, code 6). Each main water basin is divided into several sub-basins. Each sub-basin is divided into several study areas too. There are 32 sub-basins with 641 study areas in Iran (Table 1). But data for 4 of these sub-basins for the study period have not been collected. Table 1 shows the main water basins and the number of sub-basins and number of observation wells in each main basin. All well data observations were provided by the Iran Water Resources Management Company. These data are categorized based on monthly intervals, where Iran’s water year is defined as the 12-month period between 1 October and 30 September of the following year.
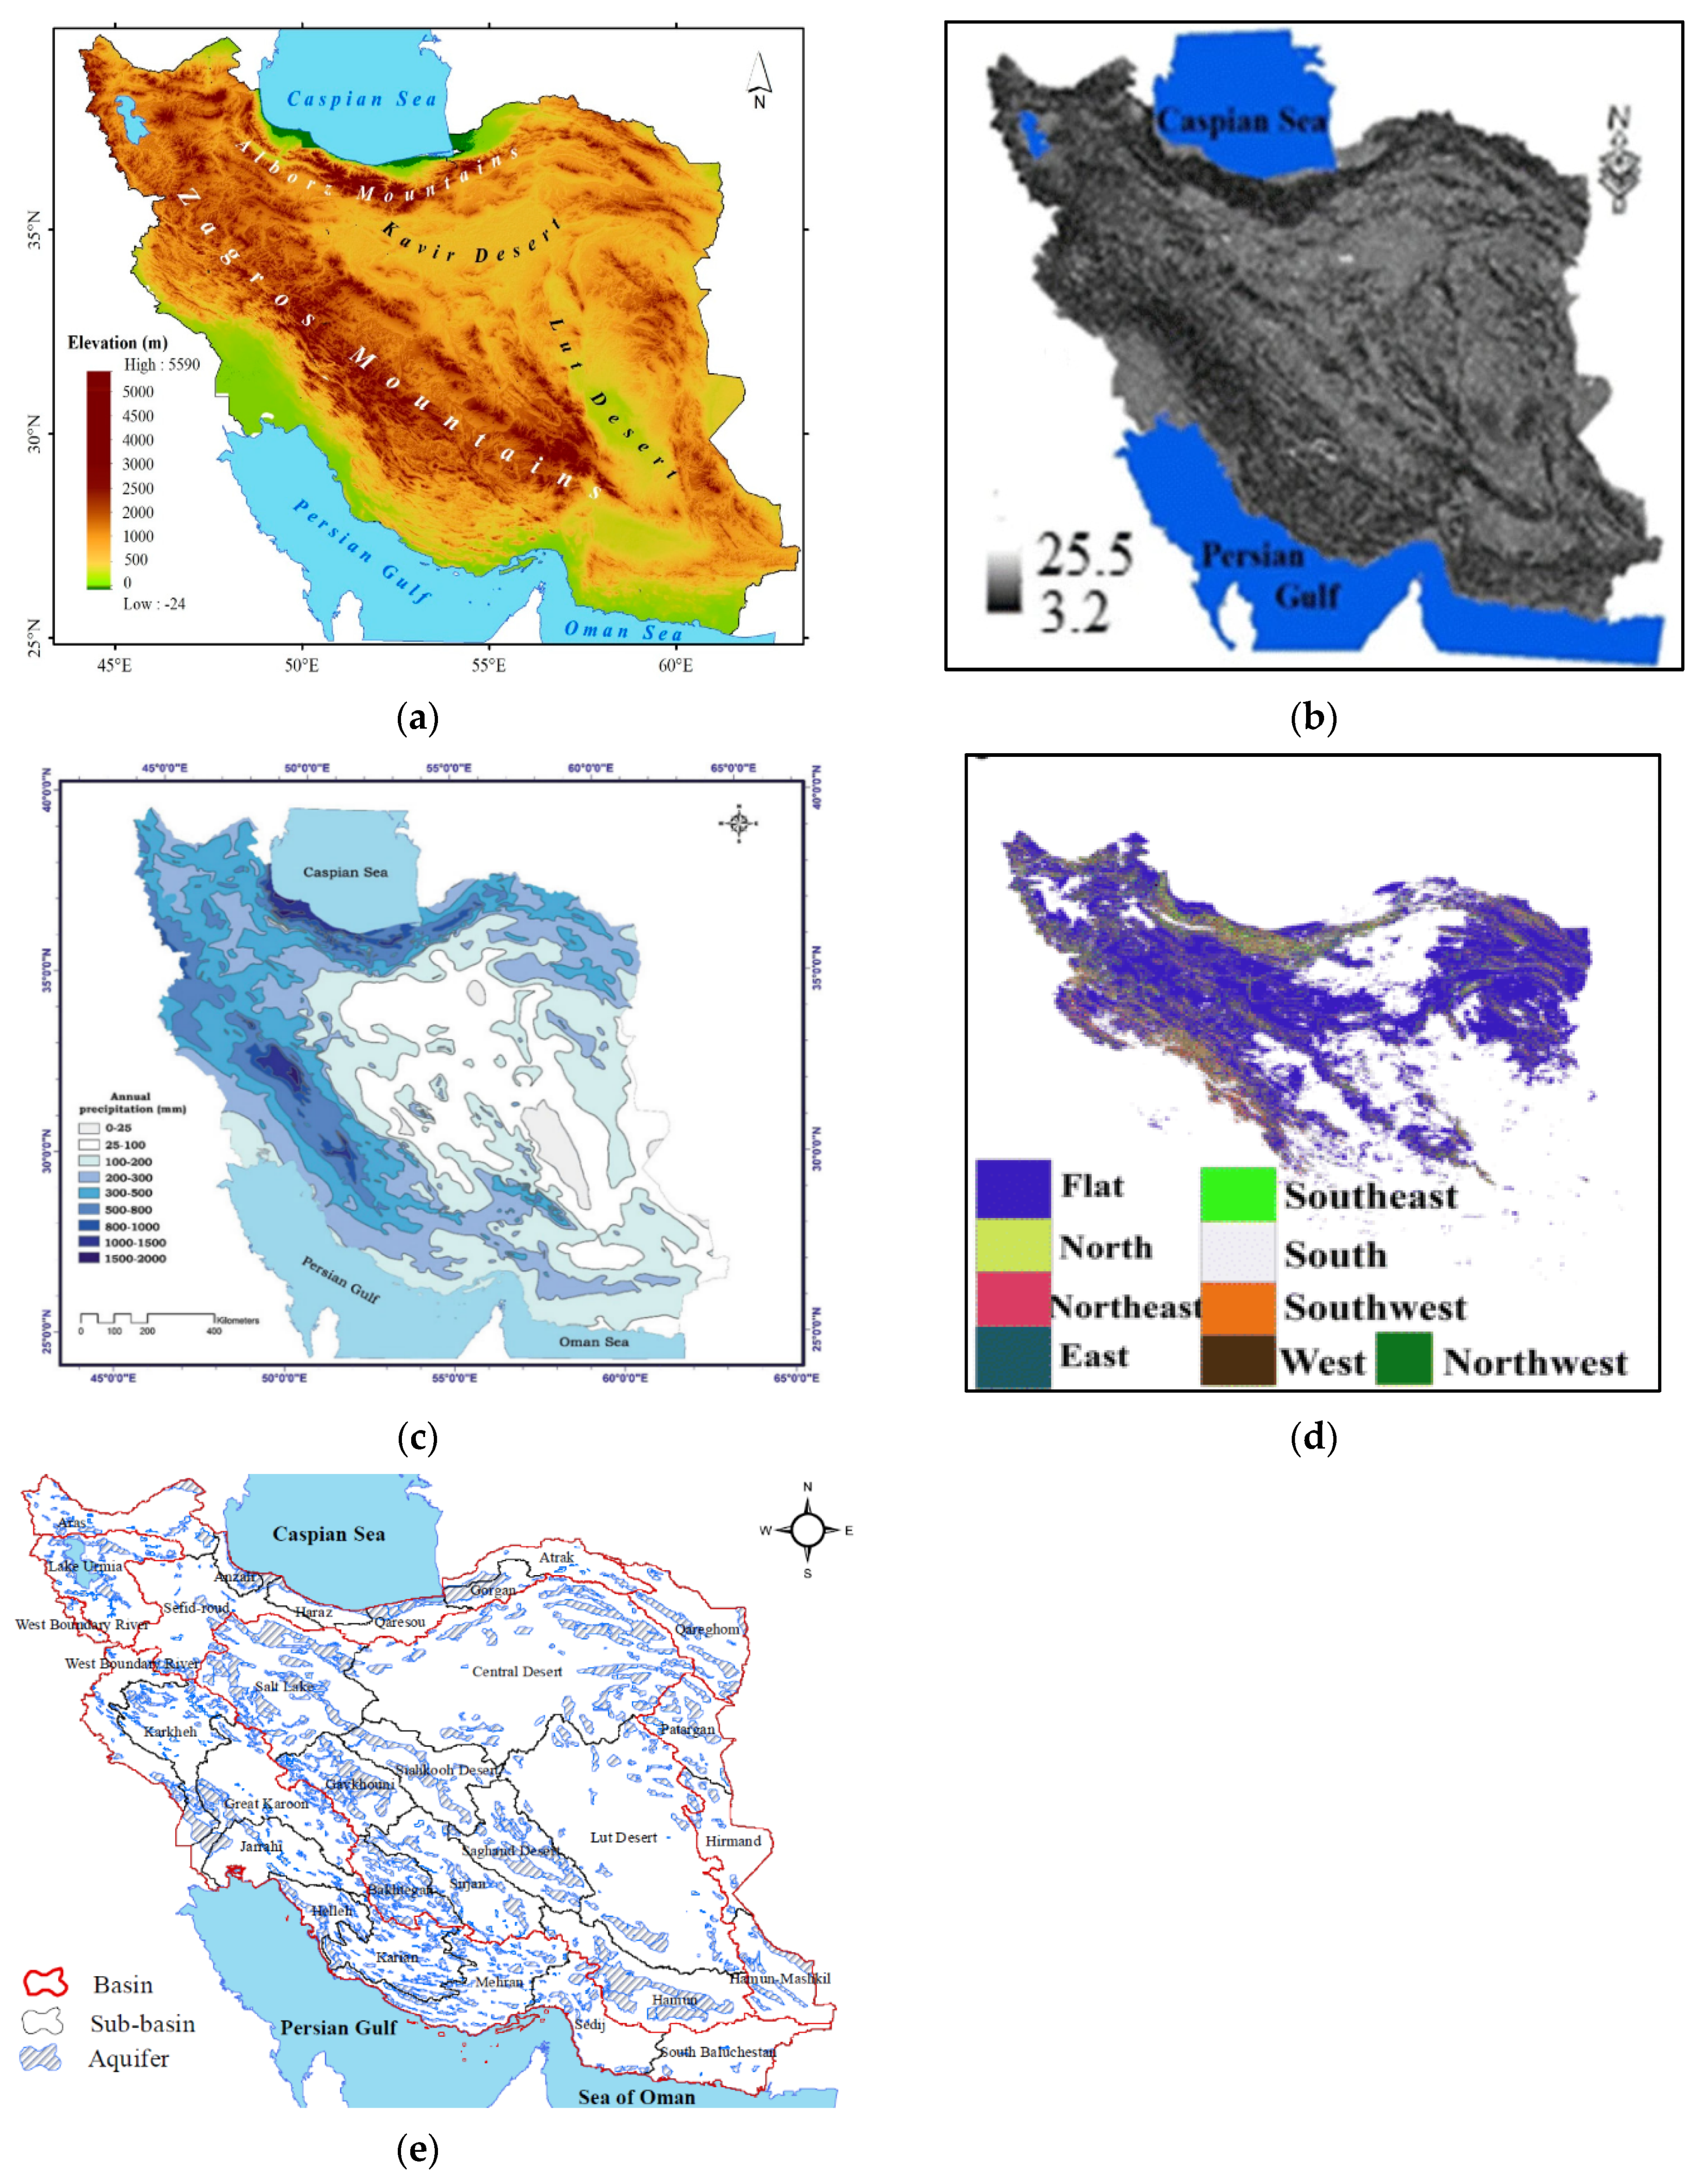
In order to have an overview and better analysis, we have provided an elevation map of Iran, a Topographic Wetness Index (TWI) map of Iran, a spatial distribution of precipitation (1961–2005), a slope aspect of Iran, and a representation of the observation wells distribution in each main basin (Figure 1 and Figure 2).
2.2. Analysis Method
The groundwater monitoring wells are established as nonhomogeneous on the alluvial plains of the study areas. Therefore, we cannot use these well data directly to make a time series of the groundwater level across the whole study area. In order to achieve an accurate estimation of the spatial distribution of the water table in every study area, it is necessary to use a suitable interpolation method, and the Thiessen method is the most appropriate one. Thiessen polygons were used in several fields, including hydrology and climatology, as an essential method for the analysis of the proximity and neighborhood of phenomena, over a century ago.
Different interpolation methods can produce different patterns and estimations of water table changes across each study area. This implies that the use of alternative methods of interpolation to estimate water table changes may have differential impacts on the result. The Thiessen polygon model is among the best, most popular, and most straightforward method for estimating water levels. Although the method has weaknesses, its strength makes it ideal for estimating water levels. The method is satisfactory when a good gauge network is available, and the area is flat. Since the observation wells in Iran are located on alluvial planes, the wells’ networks are almost at the same altitude.
A major controversial issue of the Thiessen method is the assumption that the water level between two observation wells linearly varies, and this method does not consider the changes in water level according to the altitude or orographic effect.
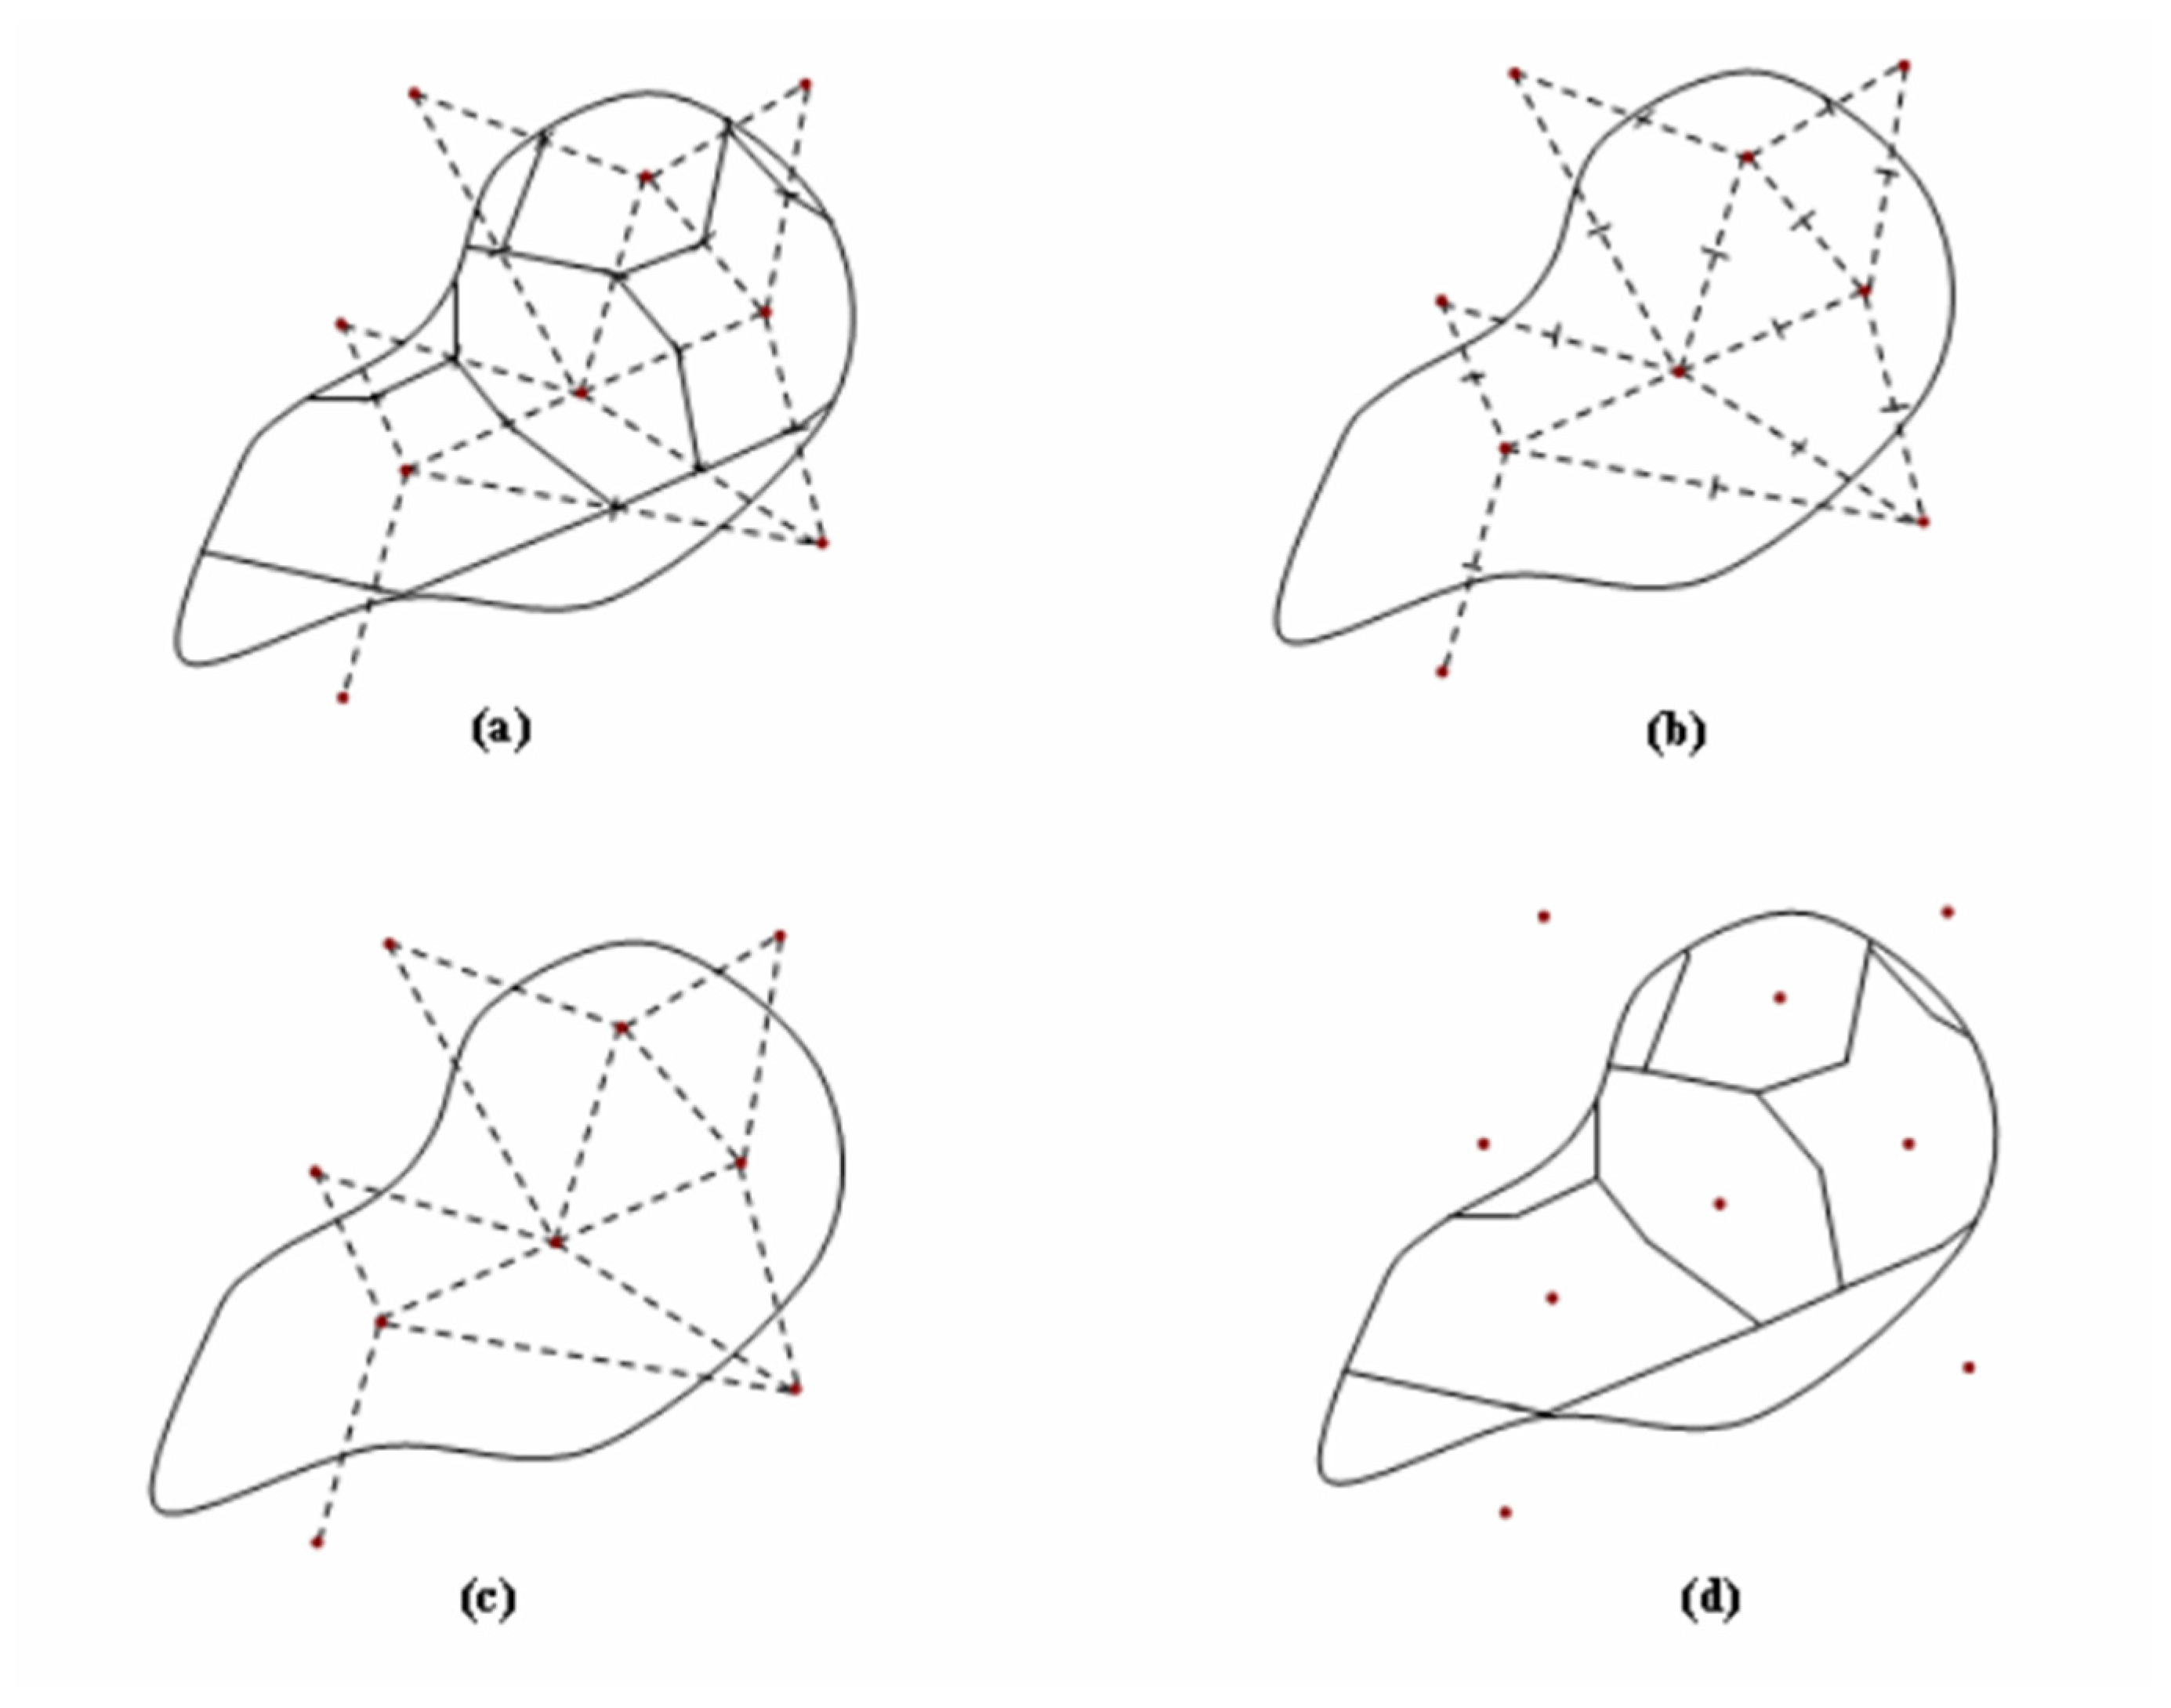
This method is a graphical technique that calculates station weights based on the relative areas of each measuring station in the Thiessen polygon network. The method assigns to each station a weighted value based on the percentage of the area it represents in relation to the total area of the region in question. This method assigns weight at each gauge station in proportion to the catchment area that is closest to that gauge. The method of constructing the polygons implies the following steps (see also Figure 3):
- The gauge network is plotted on a map of the catchment area of interest.
- Adjacent stations are connected with lines.
- Perpendicular bisectors of each line are constructed (perpendicular line at the midpoint of each line connecting two stations).
- The bisectors are extended and used to form the polygon around each gauge station.
- The water table value for each gauge station is multiplied by the area of each polygon.
- All values from previous step are summed and divided by the total basin area.
Each point location in the watershed is assigned a water table equal to that of the closest well. If Ai is area assigned to well i, then the water table can be estimated as:
where is the areal mean level, Pi is water table observed at the ith station inside or outside the basin, Ai is in-region portion of the area of the polygon surrounding the ith station, m is the number of the area, and A is the total basin area [29,30].
A time series of the changes in GWS changes across each study area can be computed, as its area multiplies its specific yield multiplies the change in groundwater level:
where
eΔV is groundwater changes, Δh is well-level changes, S is the area of the Thiessen polygon, ρ is specific yield, h is well level and has been the average well level during the period of study. Then we scale up it for each study area by multiplying it by the ratio: . The total change in GWS across each sub-basin is computed by adding together the scaled change in GWS of all its study areas. The same procedure is carried out for each main water basin.
The results for each of Iran’s main water basins and their sub-basins are represented in detail in the following section. The observations of all well data are categorized based at monthly intervals in the 12-month period between October 1st and September 30th of the following year. The 641 study areas have long periods of well-level data; some of them have more than 40 years of monthly water level data.
3. Results and Discussion
3.1. Spatial Dependence of Groundwater Storage
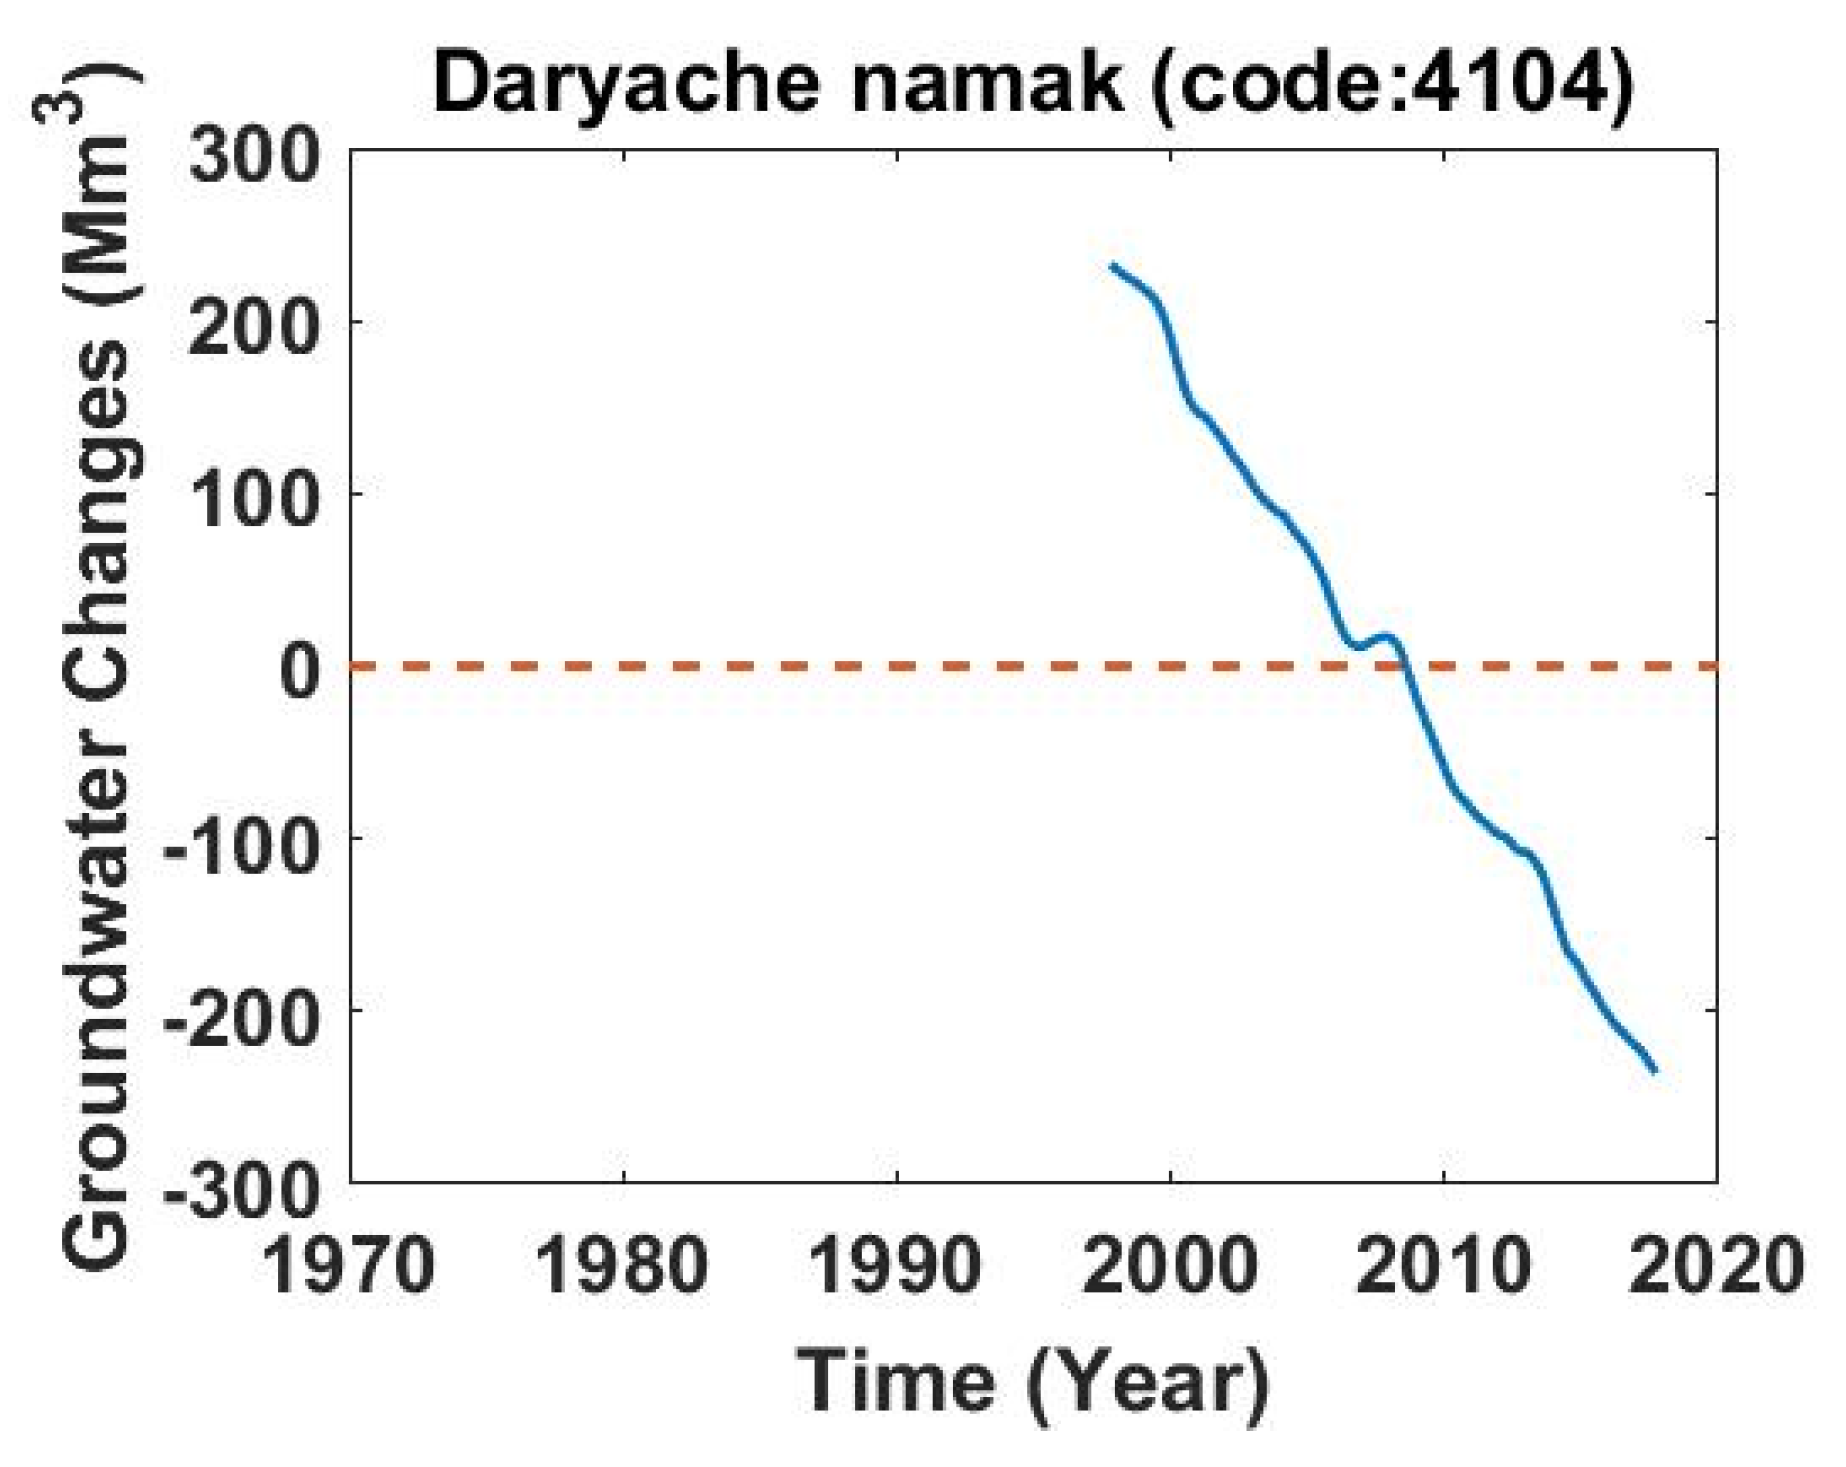
We have estimated GWS changes across each study area. As an example, the results for one of the study areas (code 4104) will be illustrated below:
The study area of 4104 (Eshtehard) is 805.5 km2. The Thiessen polygon of this study area is 245.2 km2 and the specific yield of this study area is ρ = 0.04. According to the Equation (2), GWS changes across the Thiessen polygon have been estimated. Then we can scale up it by multiplying it by the ratio: = 3.29. We can see the result in Figure 4:
In order to estimate GWS changes across each sub-basin we scaled up the value for each study area by multiplying it by the ratio: .
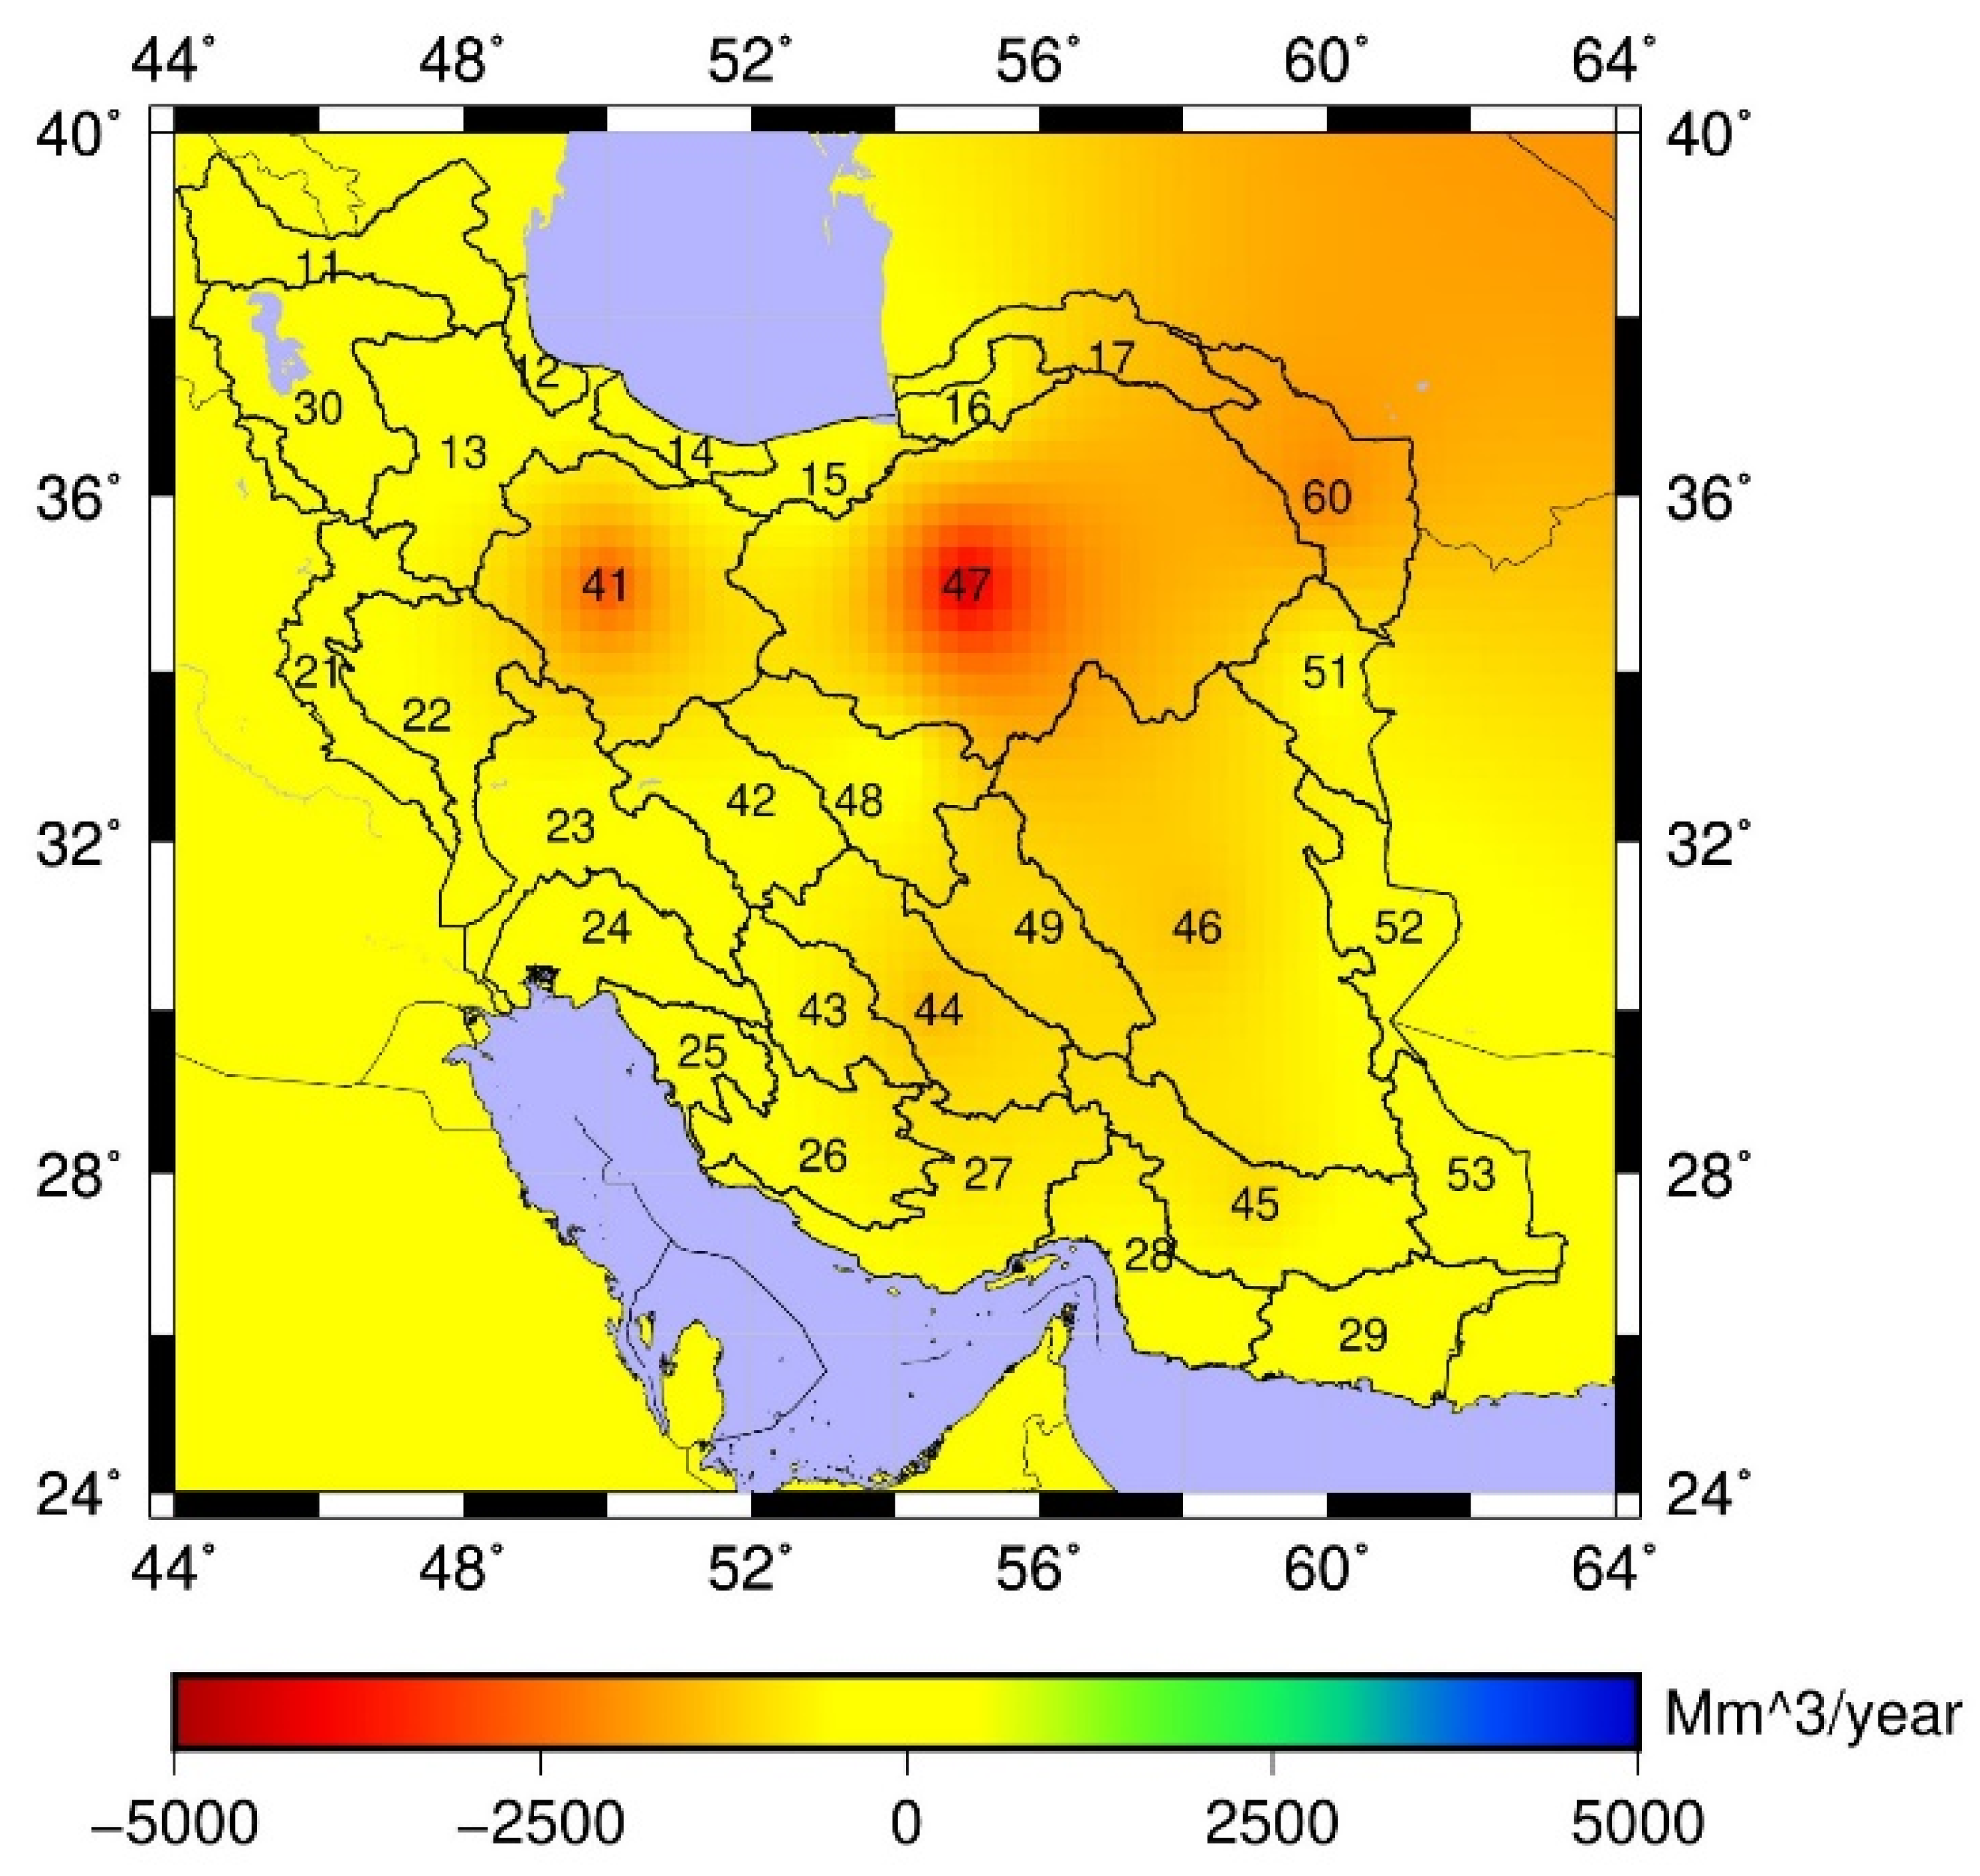
Figure 5 shows groundwater storage changes from observation well water level in sub-basins across Iran, between 2002 and 2017. This map shows contours of water-level declines, in (Mm3/year = Million cubic meter per year). The secular trend in groundwater storage varies from 600 to −4400 Mm3 across Iran. In this figure, we see a significant negative trend of water levels in most of the sub-basins in Iran. Obviously, there are two intensive trends of water decline in the Central Plateau basin (Daryache namak (code 41) and Kavir markazi (code 47)). These two areas are mostly located in arid and semi-arid areas. Some of the most populated cities in Iran are located there. The agriculture sector is the largest consumer of water in Iran. These estimations represent climate variability and changes in agriculture patterns. It also needs to be remembered that during a drought period, there is intensive pressure on groundwater storage especially in arid areas. These are all reasons for severe negative trends in the Central Plateau.
Figure 5 shows that there is not a significant negative trend in the Persian Gulf and the Oman Sea catchment or in the southeast. The Persian Gulf water basin has almost half of the country’s renewable water resources. This area even has low precipitation, but it has some rivers that originate from mountains. Rivers provide a large contribution to Iran’s water resources. Therefore, in this area, rivers fulfill some of the requirements of the agricultural sector, and there was less pressure on the groundwater during the study period. In addition to this, irrigating with surface water might be a new means of groundwater recharge as the water is absorbed by the soil used in agriculture. Another possible reason for these positive features is the construction of new dams in the region. Constructing dams probably results in more recharge aquifers in the area.
The positive features of the southeast may be explained by new irrigation methods that are starting to be used in the basin. Farther west, various Afghan governments constructed large dams (Arghandab Dam, Kajaki Dam) that diverted water from the upper reaches of the river [31].
3.2. Time Series Estimates
In order to investigate the water level time series, we needed to decompose them to long and short terms. We used a general expression of the following formula to obtain them:
where f is the water level for each study area, A is a static value, B is the secular trend, and are amplitude of angular frequencies . The variable characterizes noise.
To show the groundwater level changes better in each water basin, these changes have been divided into two components: long-term (inter-annual and secular trend) components and short-term (semi-annual) components. In the following sections, these components have been shown.
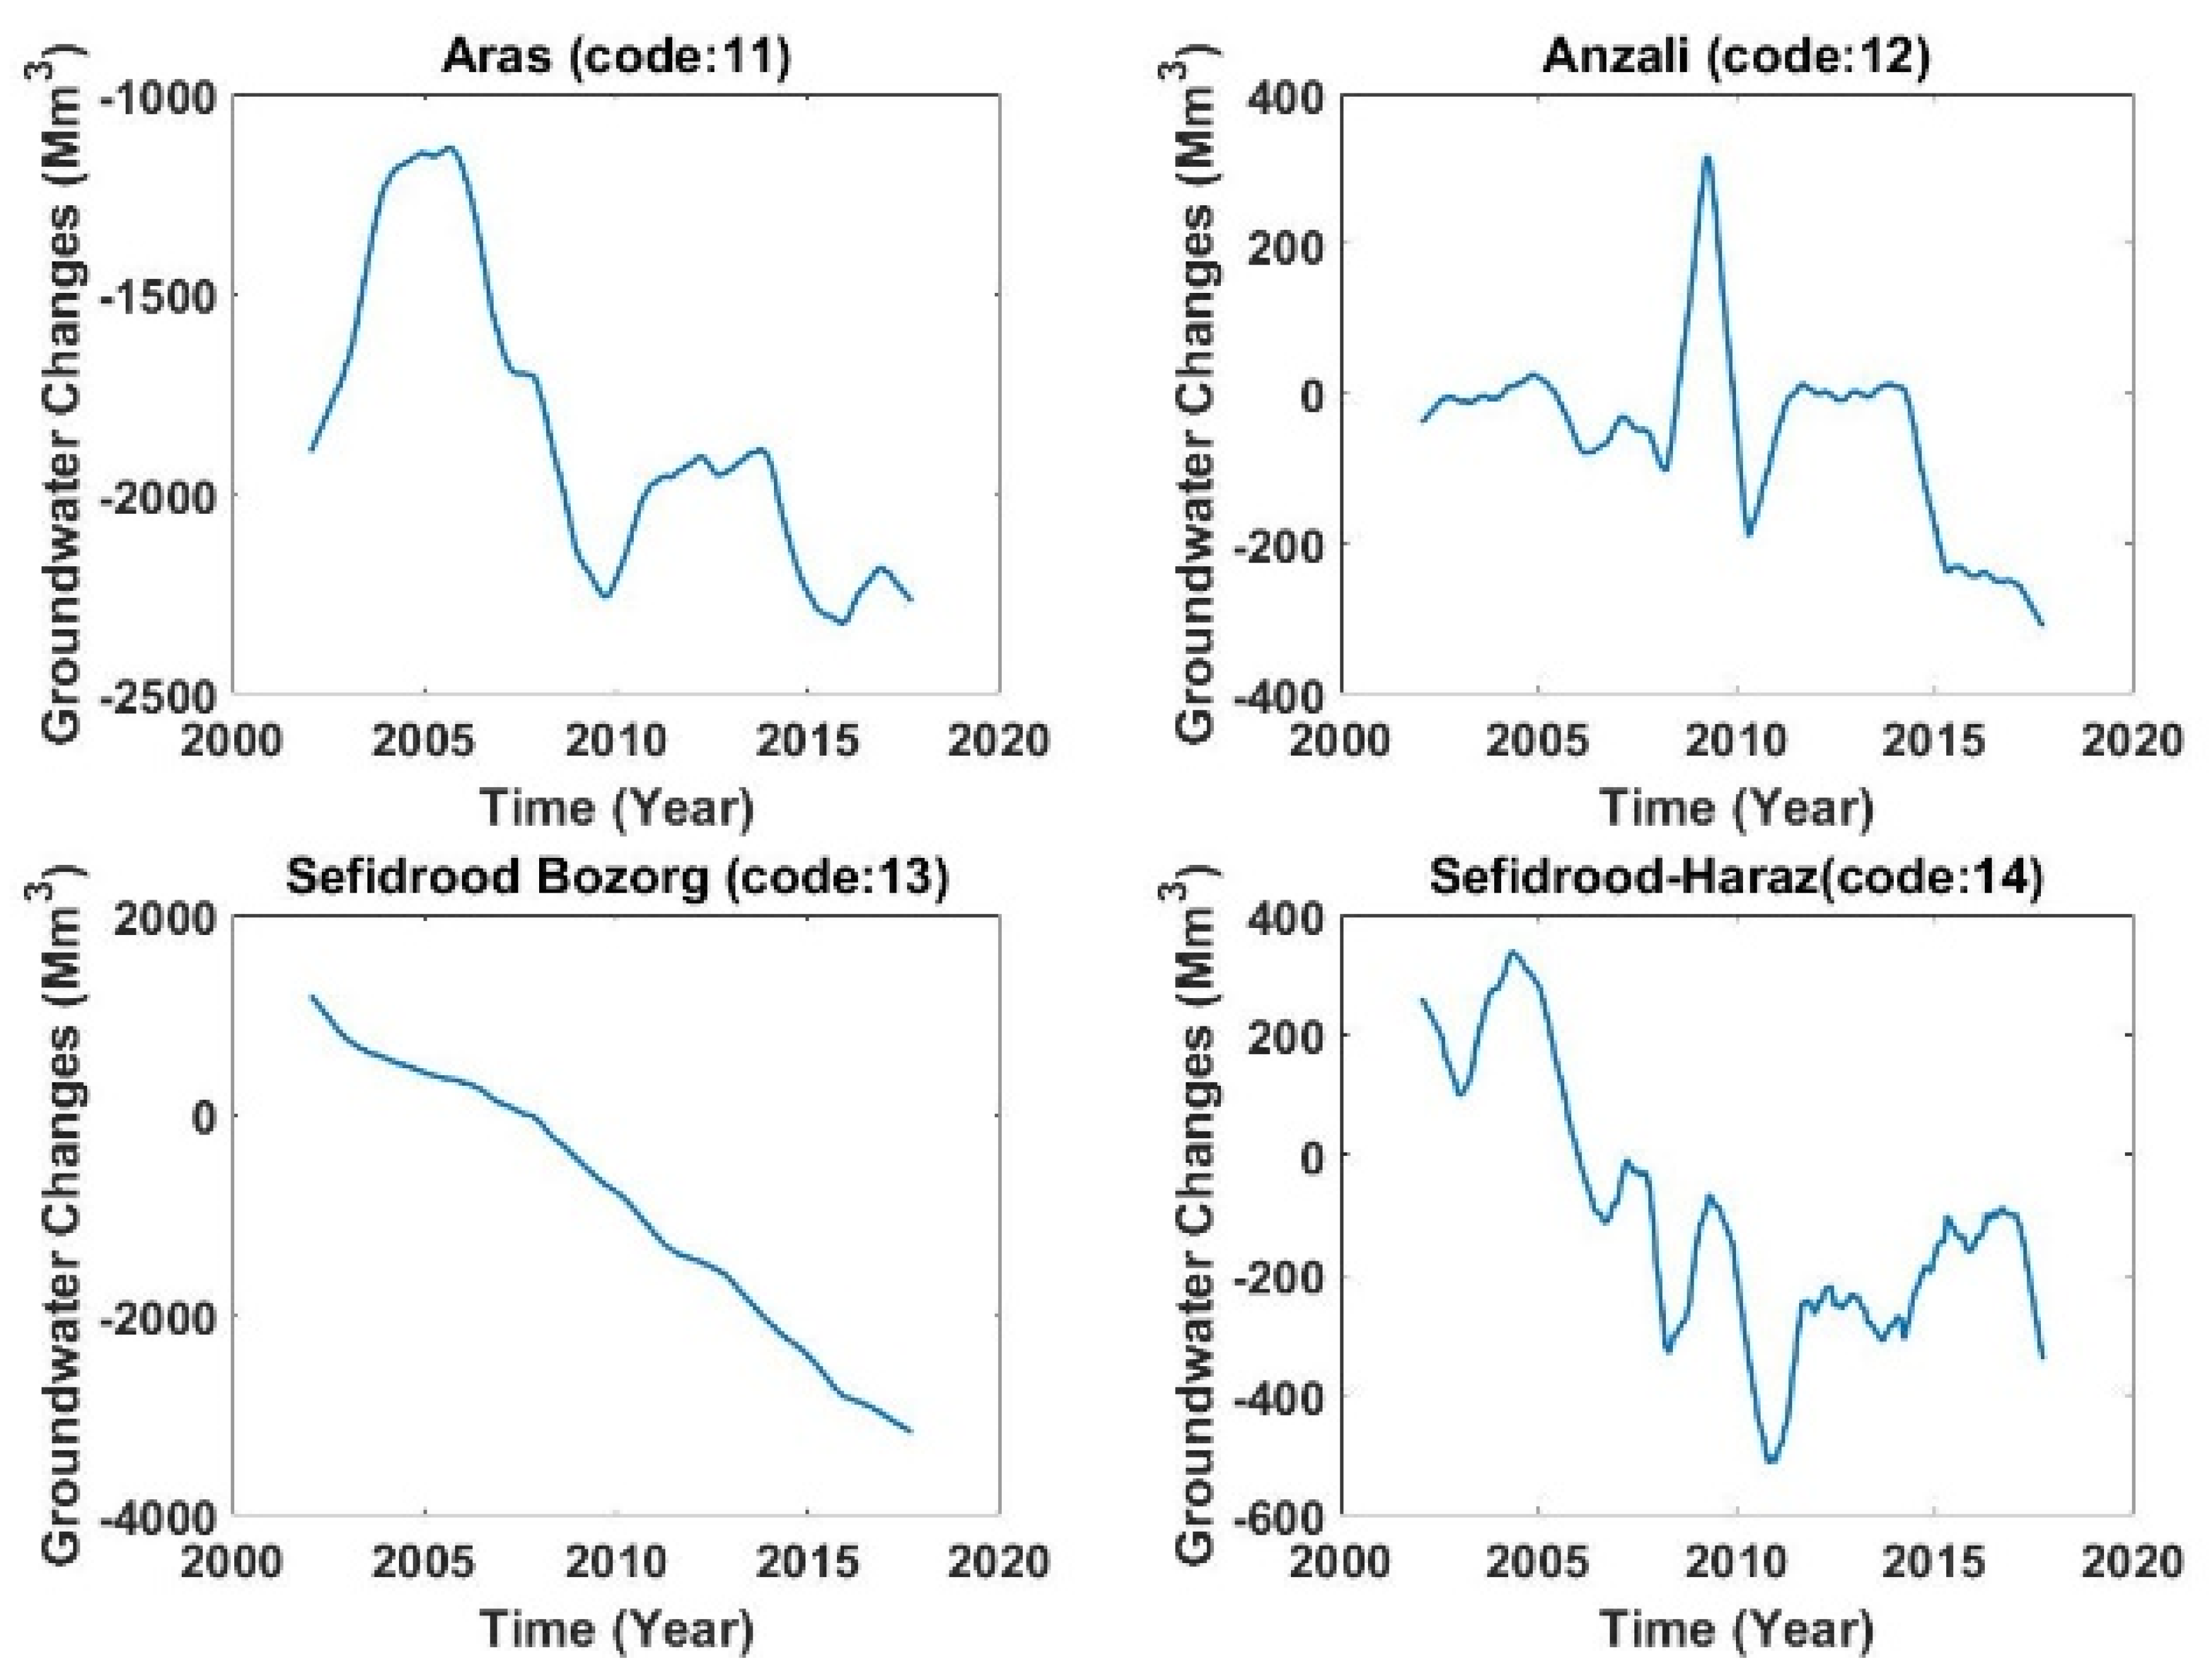
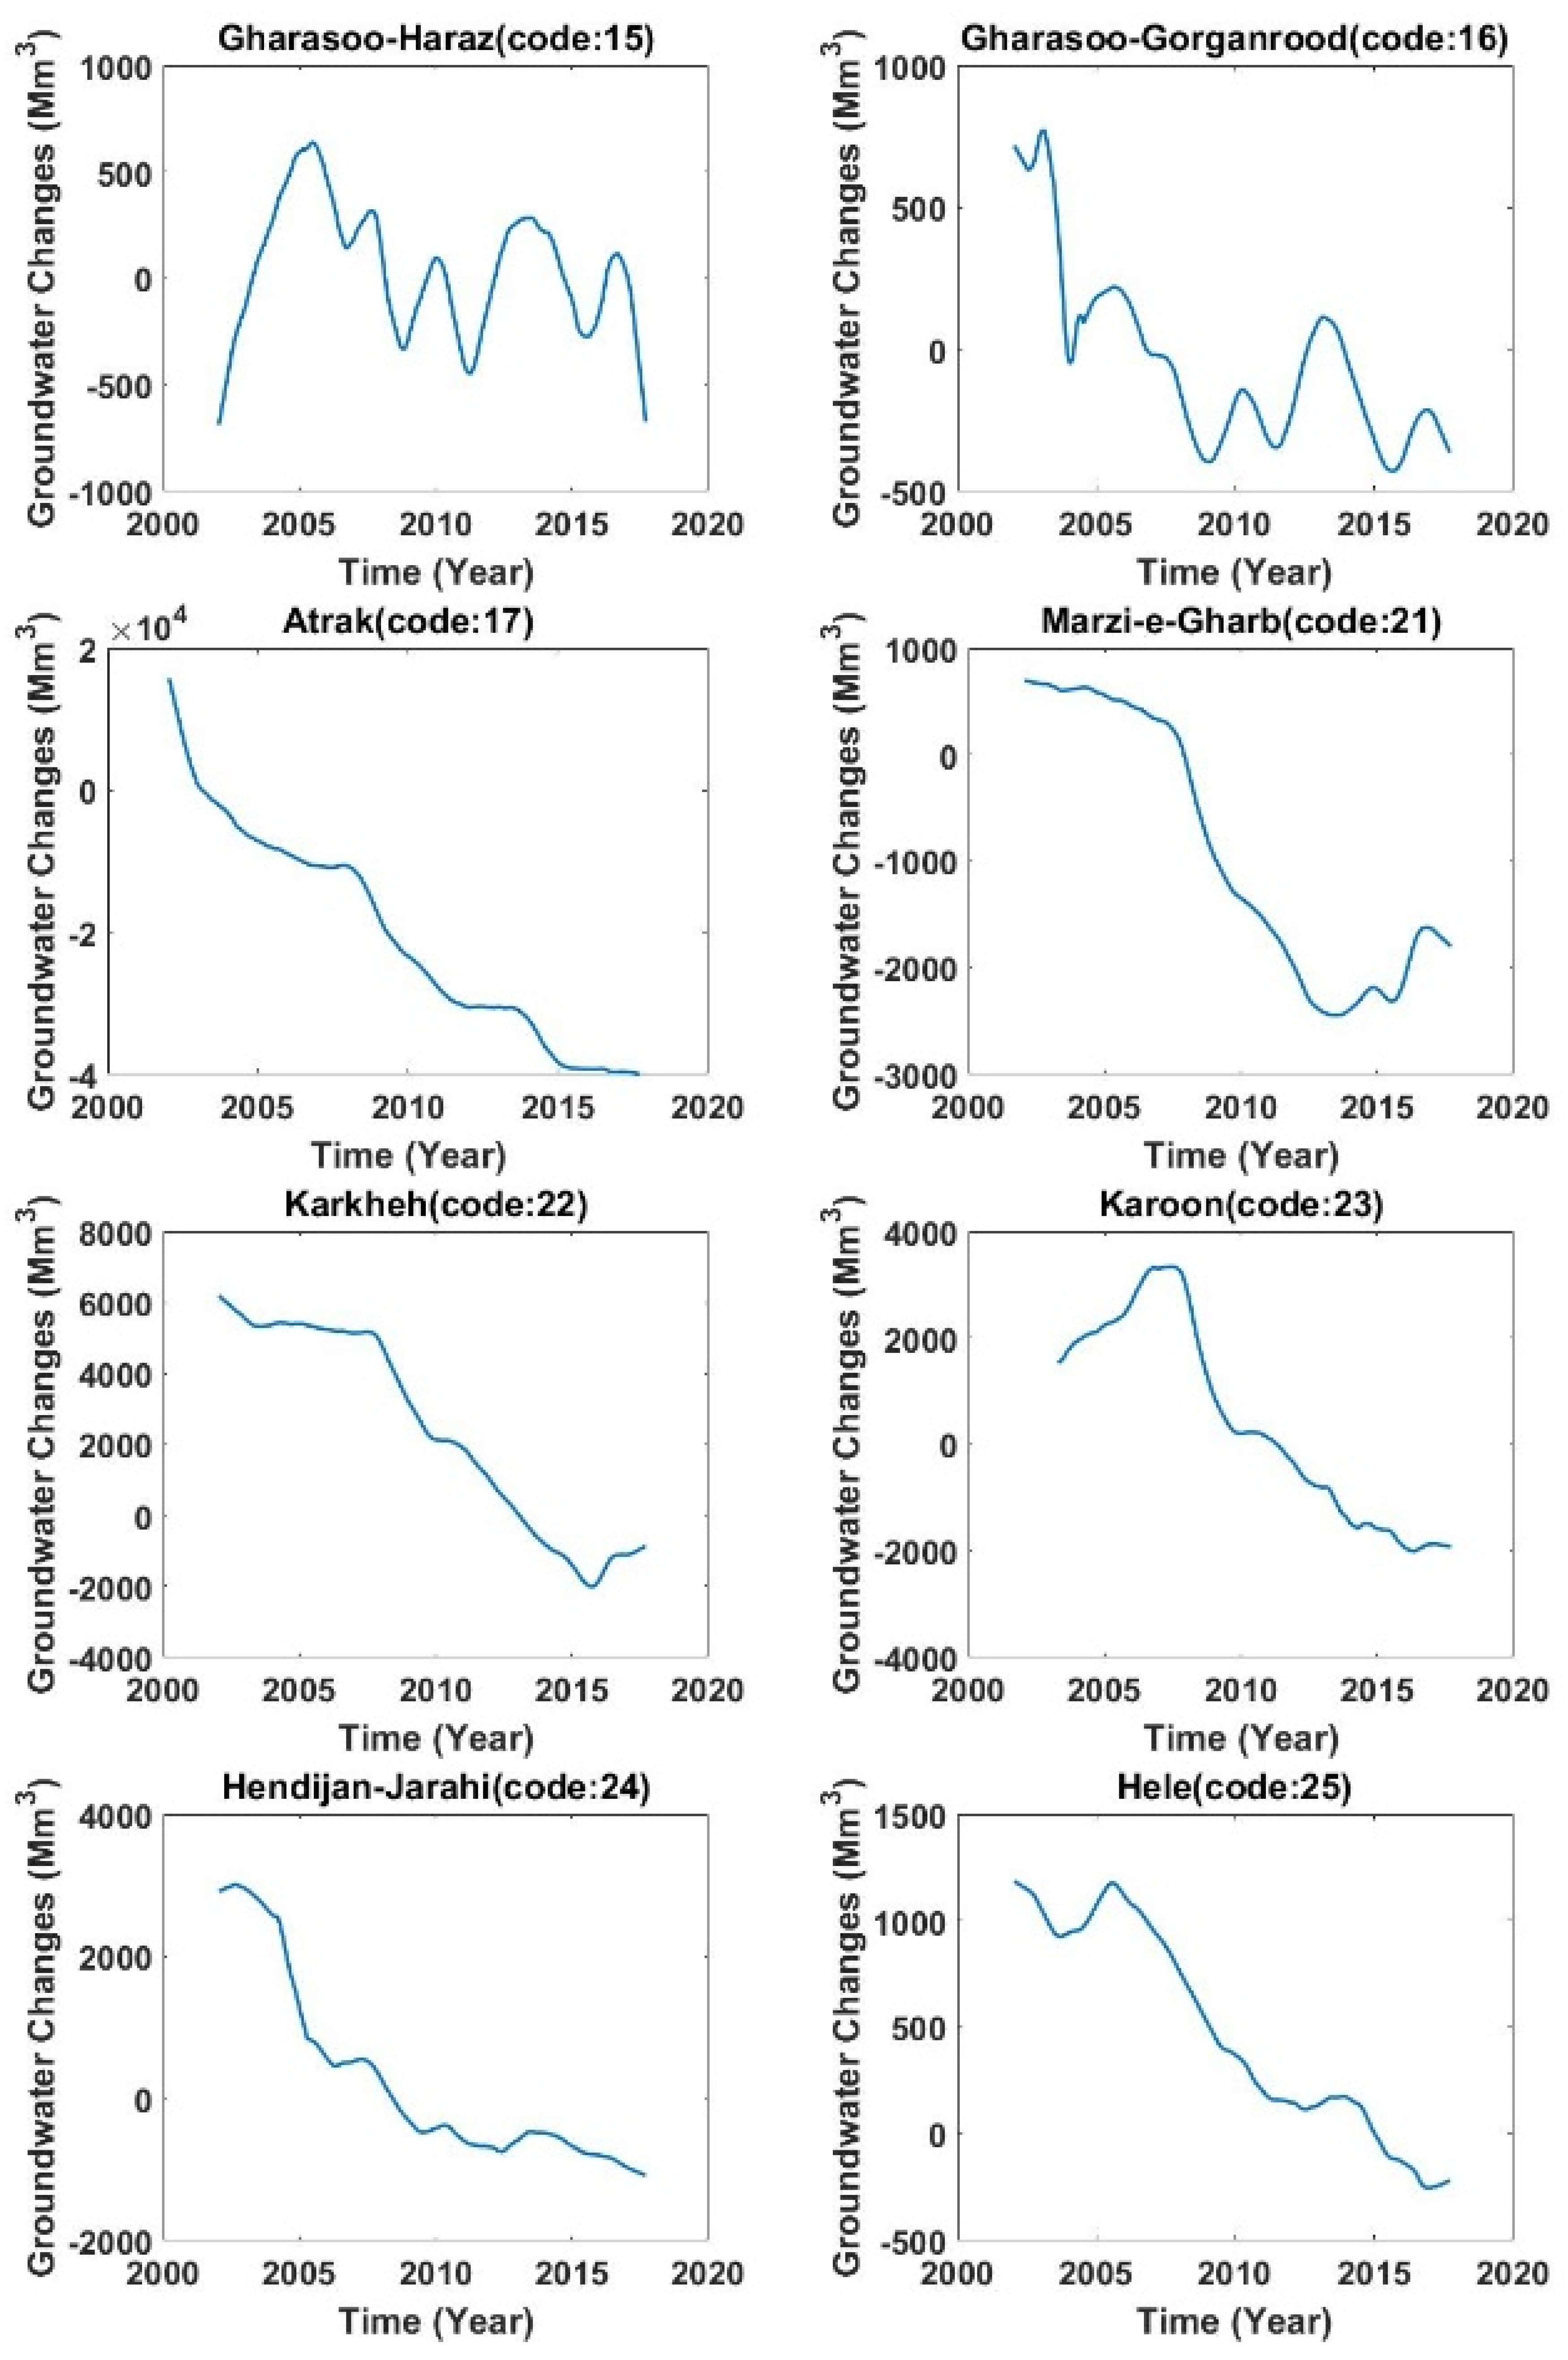
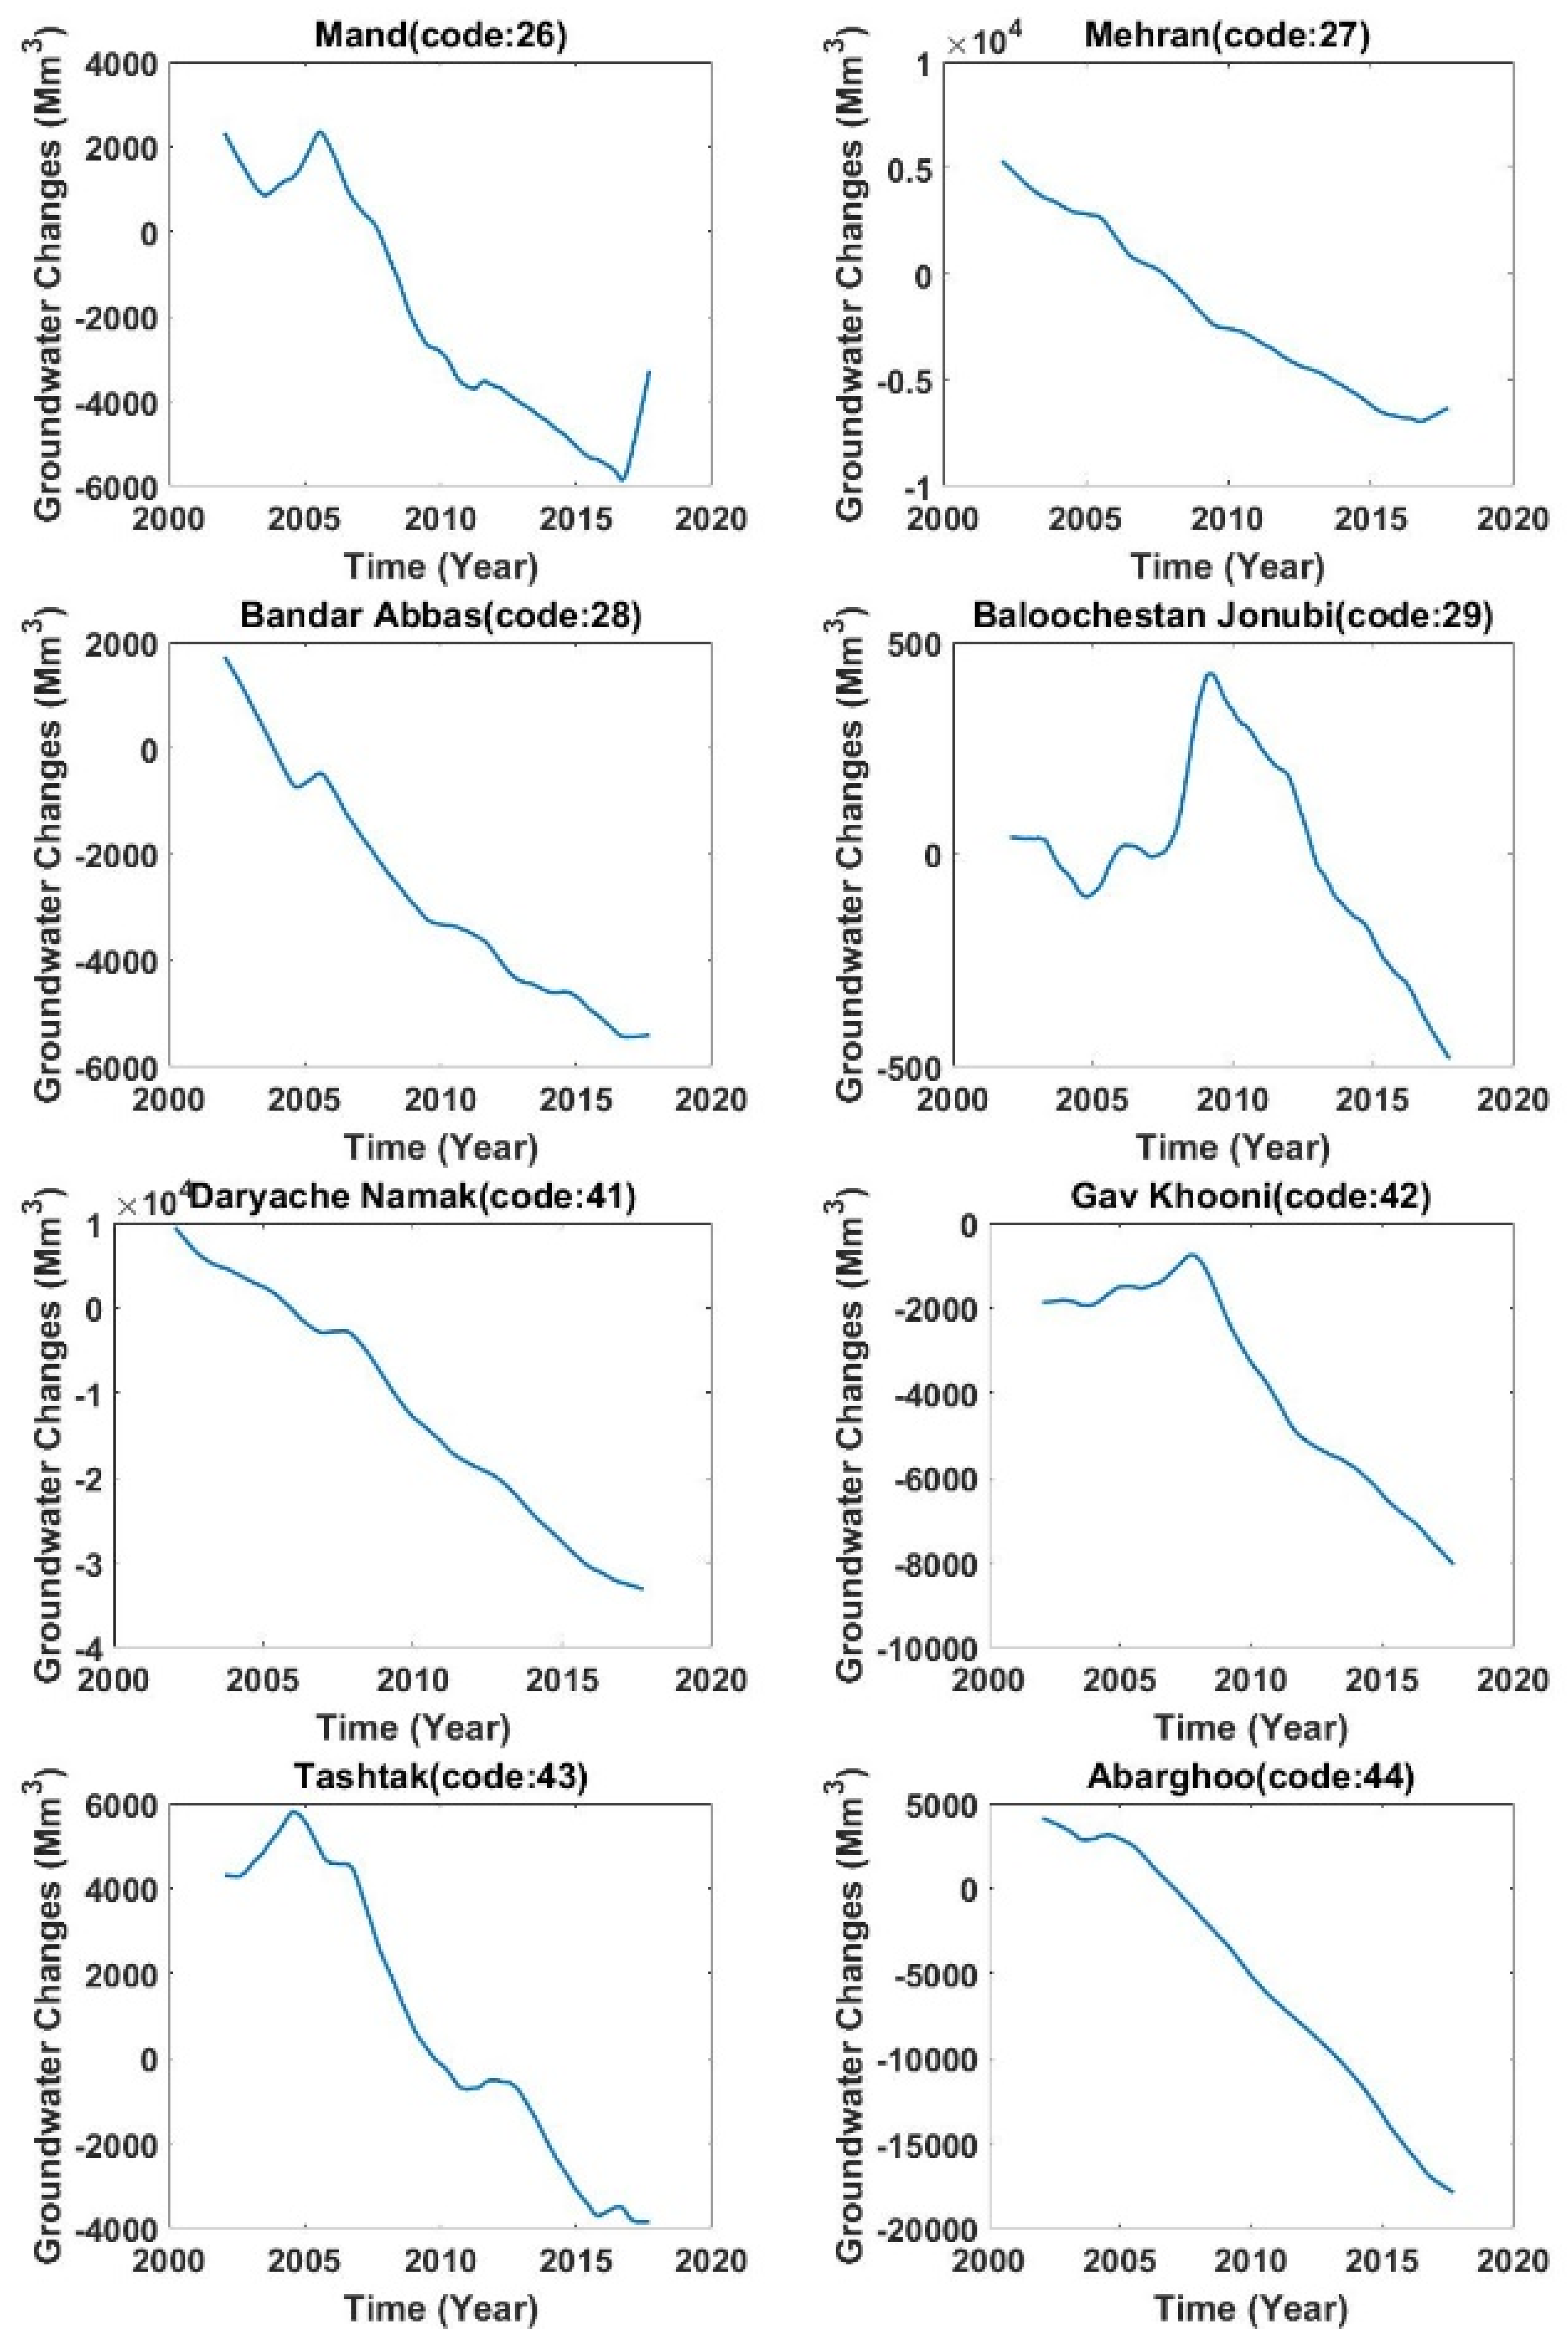
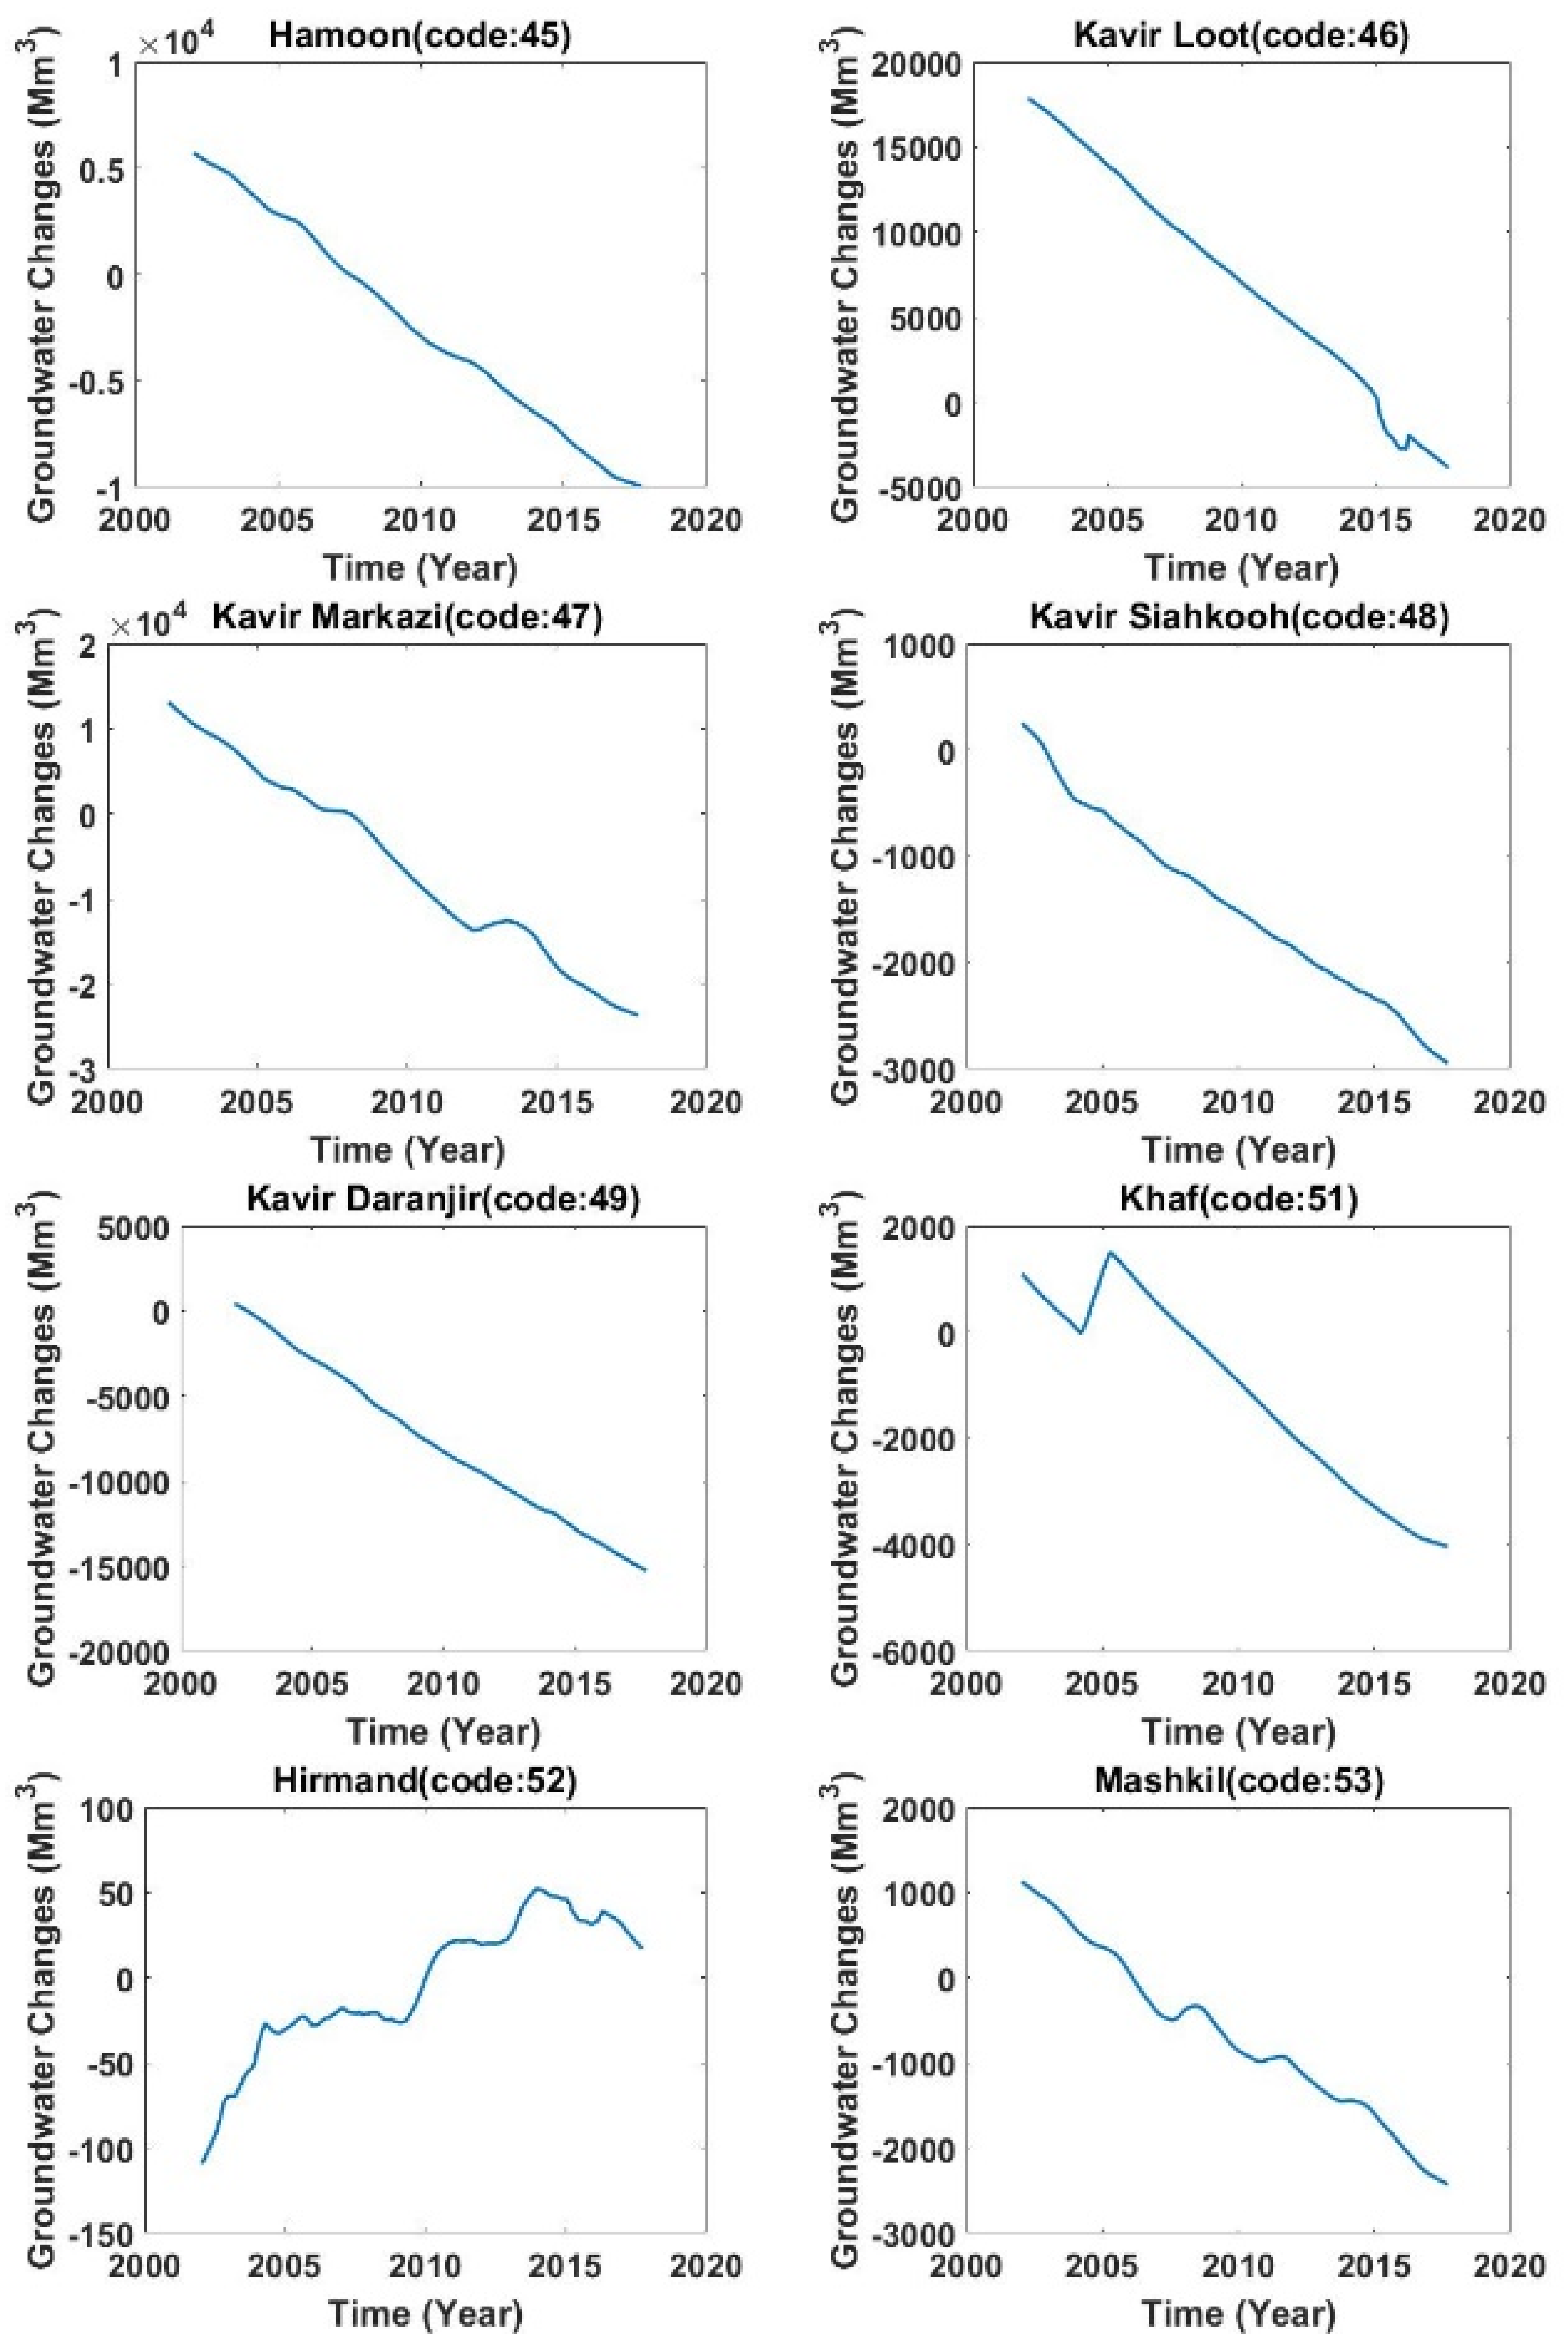
Based on the time series of the well data across each study area, using Equation (4), we have computed the long-term (i.e., inter-annual and secular trend) components of groundwater changes for 28 of sub-basins in Iran, between 2002 and 2017: The two-digit numbers’ codes show the sub-basins. The first digit of these numbers shows the number of main basins, and the second digit shows the number of sub-basins (Figure 6).
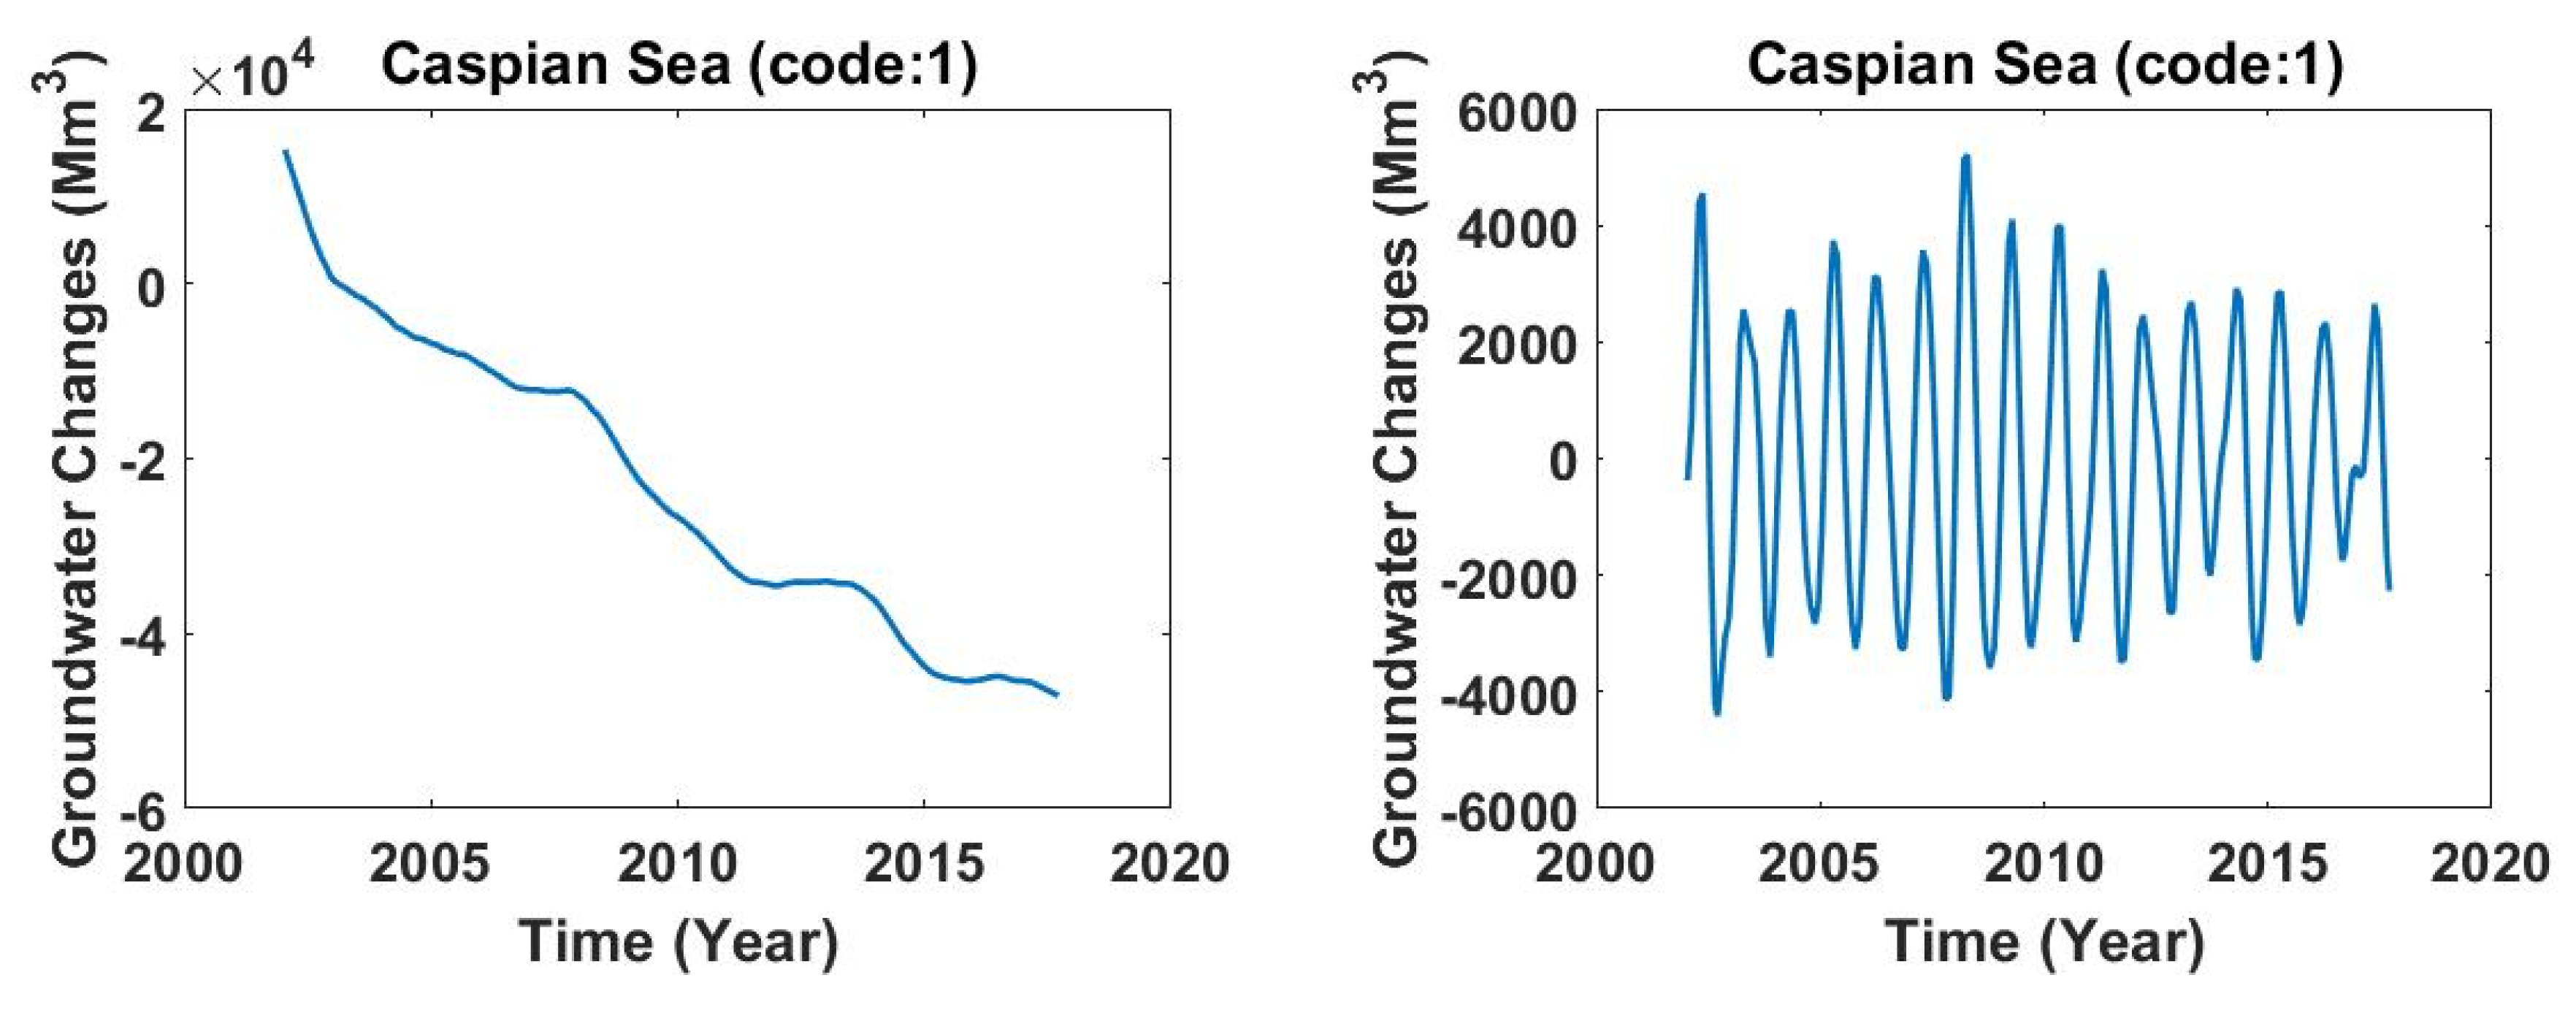
We can see some fluctuation in the long period of different sub-basins of the Caspian Sea basin (codes 11 to 17). We can justify this as there is faster recharge of low-land aquifers in this area caused by precipitation. There is quite high precipitation in this area. The average altitude of this area is very low; therefore, the average water table of this basin is very close to the Earth’s surface and is not deep. So, the water table fluctuates due to changes in precipitation.
Table 2 shows the trend of the GWS changes across all sub-basins in Iran. Comparing trends of sub-basins in the Persian Gulf basin (code 2) and the Caspian Sea (code 1) with the Central Plateau basin (code 4), we realized that most of the sub-basins in the Central plateau have intensive negative trends. This is because of less surface water and precipitation in this area. Therefore, the agricultural sector is forced to use more groundwater. Recent droughts put more pressure on the groundwater.
The only sub-basin that has a positive trend during this period is Hirmand (52). There is a shared aquifer between Iran and Afghanistan in this area. Some of the rivers in this area originate from Afghanistan, and water policy in Afghanistan can affect the water level changes in this sub-basin.
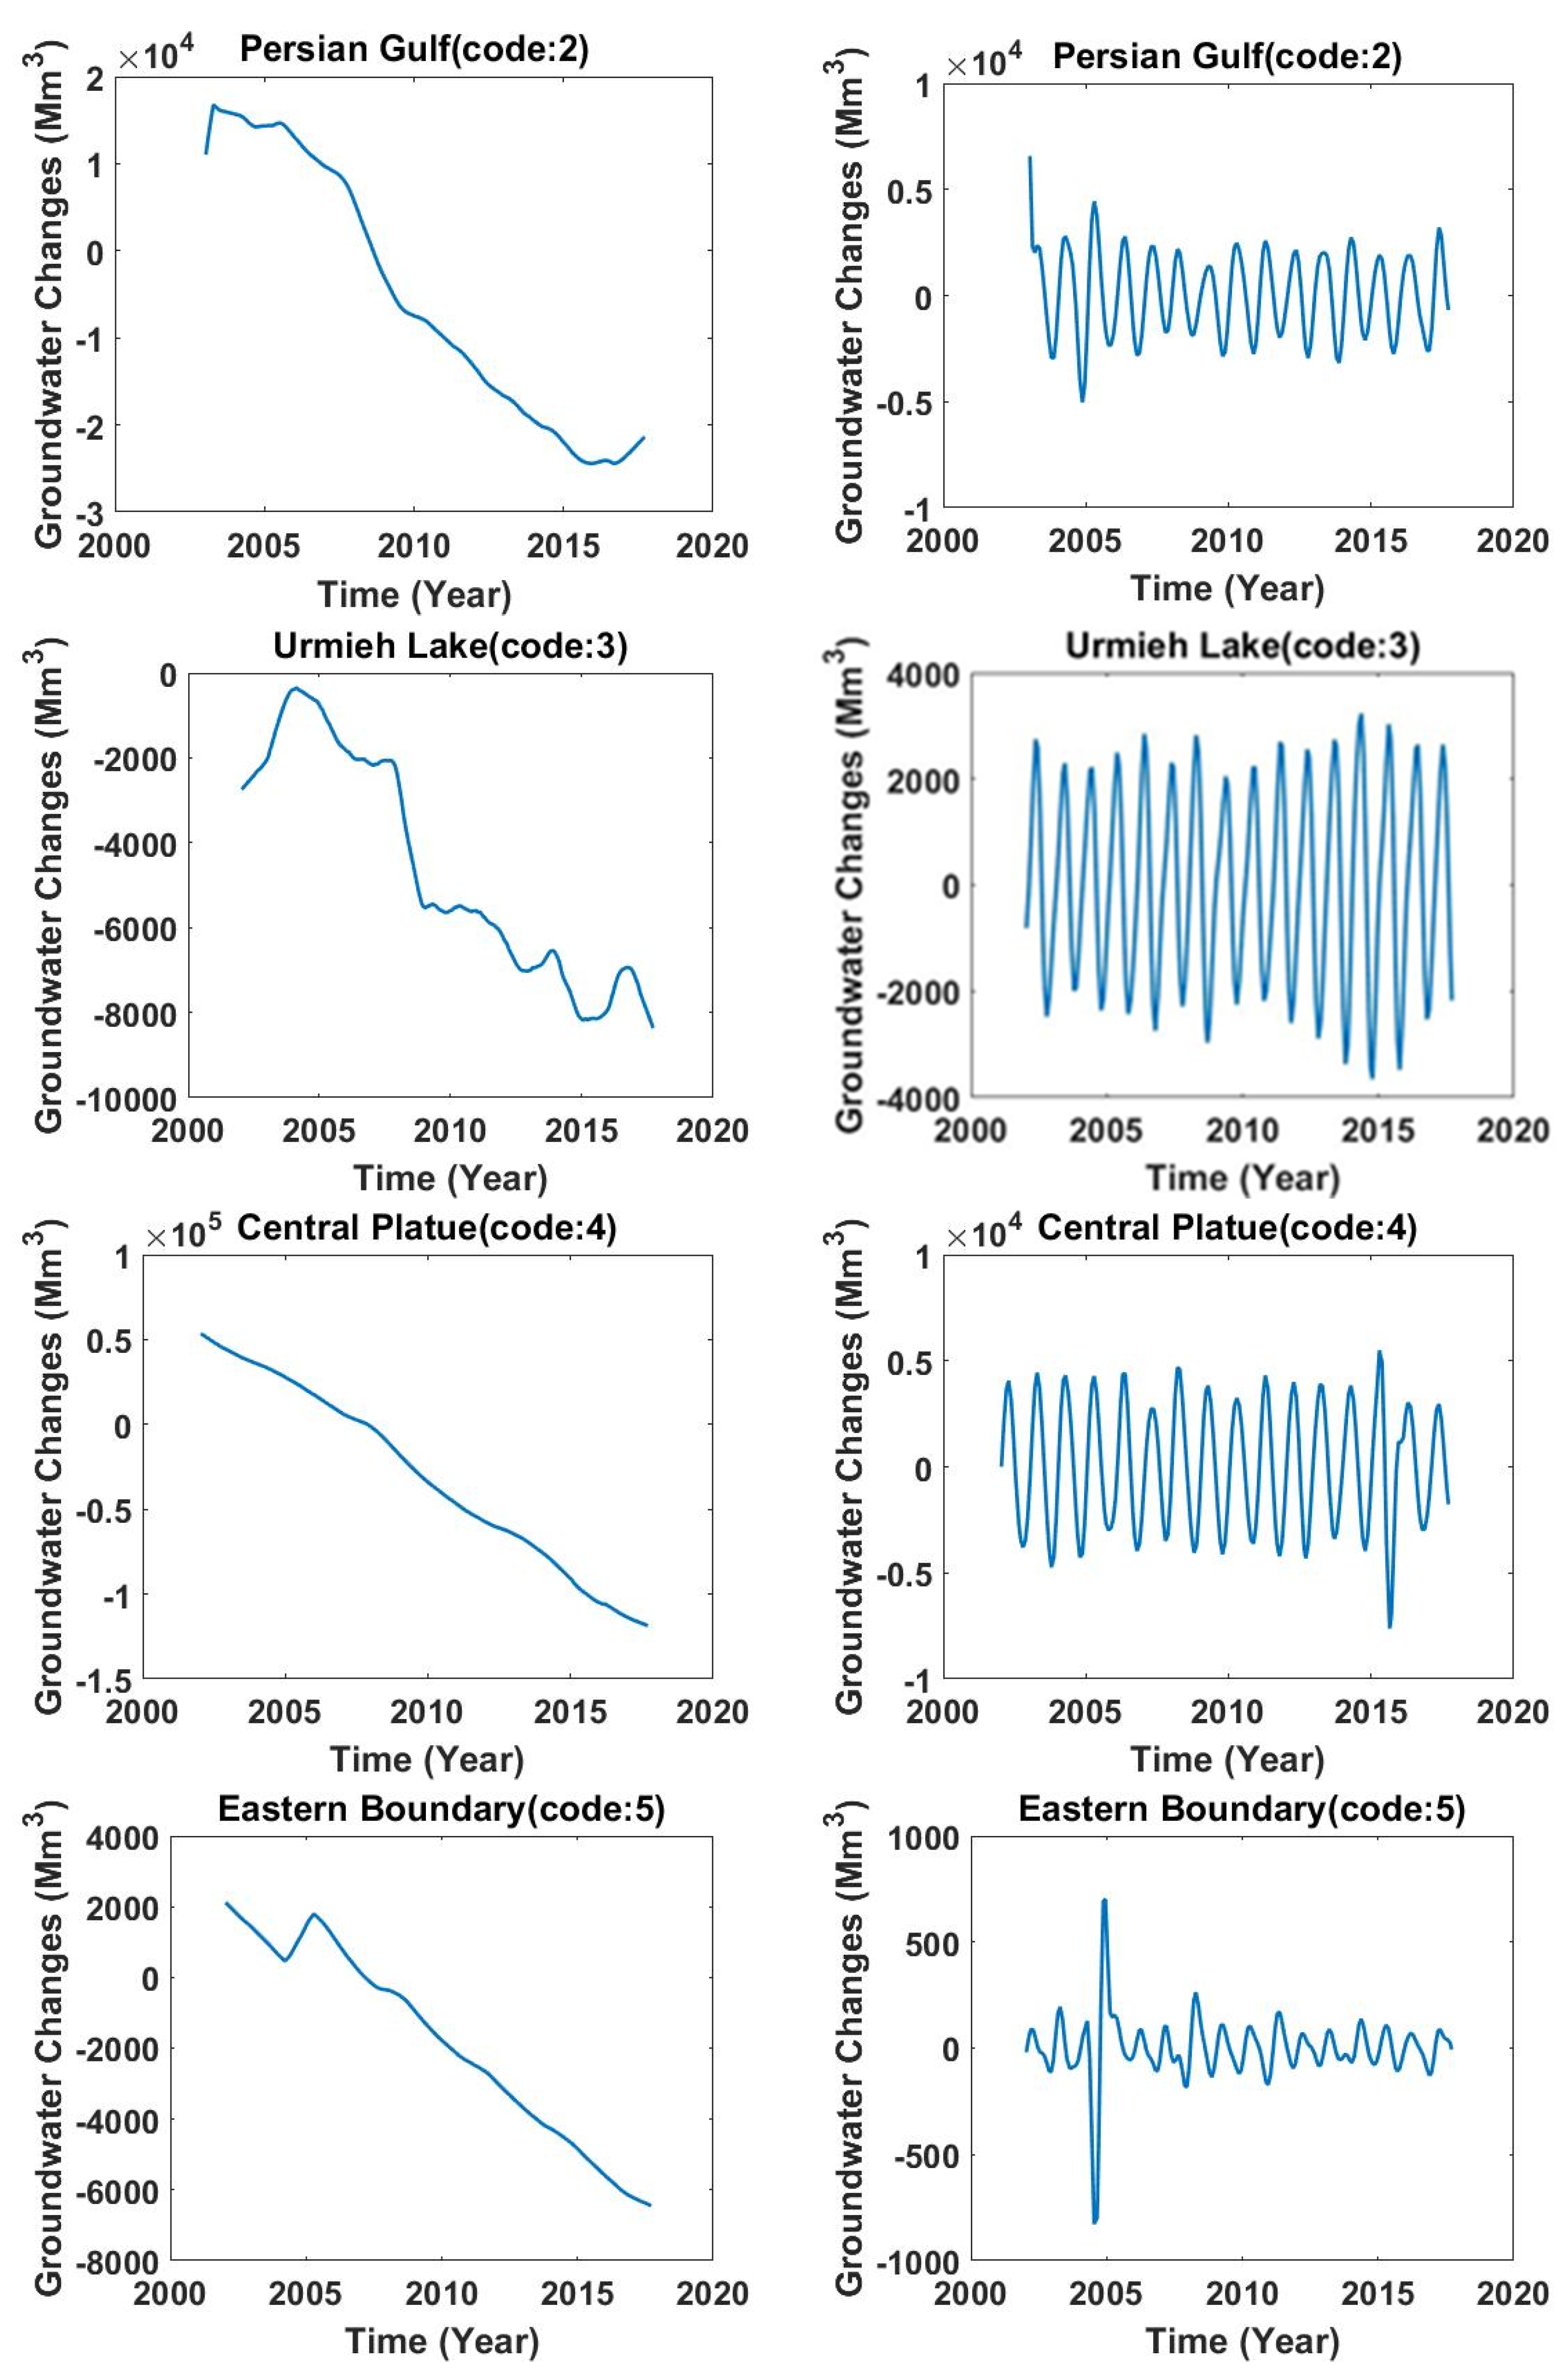
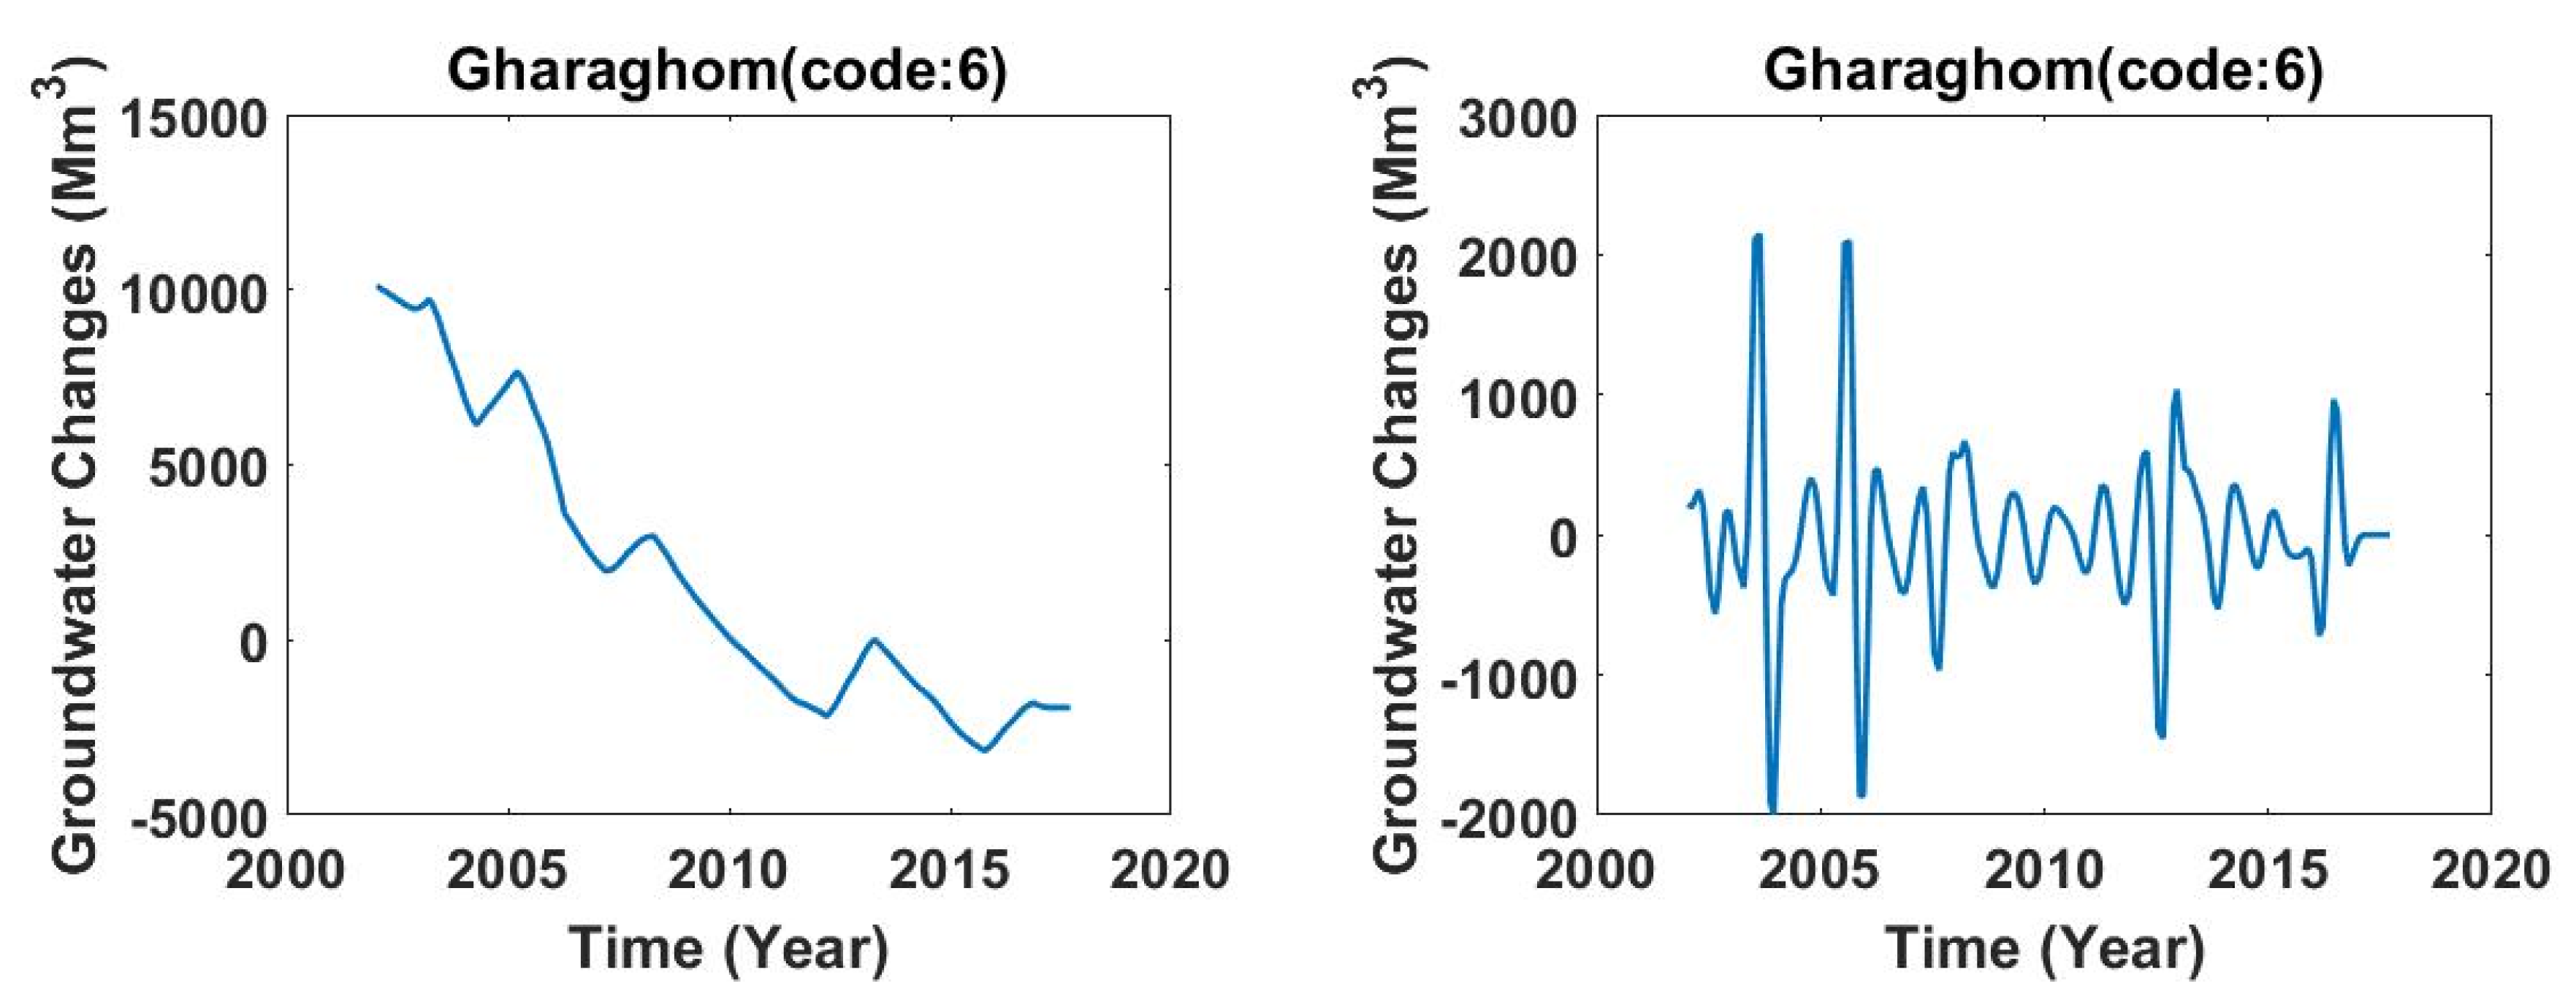
The total change in GWS across each main basin is computed by adding together the scaled changes in GWS of all its sub-basins. Figure 7 shows the long-term and short-term components of groundwater depletion in all main basins, from 2002 to 2017.
In most of the basins, there is large negative trend in groundwater storage around 2008. We know that a drought occurred in 2007 in Iran. Therefore, the large negative trend could be explained by a delay in the soil absorbing the water and reaching aquifers. This delay depended on the specific yield for each area.
The Central Plateau basin was depleted by more than 1.5 × 10⁵ Mm3 in these 15 years. This is the largest trend because this basin has the largest area in Iran.
In the Caspian Sea basin, we can find a sharp negative trend around 2003, and after it, the situation improved. This is probably because of the establishment of more control over water extraction from illegal wells in this region and changes in agricultural patterns.
In the Persian Gulf and Oman Sea basin, we can find a sharp positive trend around 2003. This is probably because of the construction of a number of dams in this region. But after that period, there is a negative trend in the water storage in the basin, which is probably due to intensive groundwater extractions for irrigation. There is also a sharp negative trend around 2008; this may be because of the occurrence of a drought in 2007. Around 2017, the trend of water storage is positive, which could be due to more precipitation during that year.
The area of this basin is half that of the Central Plateau, but the amount of depleted water in the Central Plateau is more than three times that of this basin, which may because of large permanent rivers such as the Karoon River in this sub-basin. It may also be due to the fact that the most populated cities are located in the Central Plateau basin and the intensive immigration to these cities.
The trend in the Urmieh basin is not a smooth one; it has some fluctuation. There is an intensive negative trend from 2007 to 2008, which might be due to drought in 2007. The water level in the Urmieh Lake depends on precipitation. The water table in this basin is directly influenced by the Urmieh lake level, and the drought period had severe effects on this level. Therefore, the irrigation pattern directly changes the water level in the area.
For instance, turning 90,000 hectares of Urmieh grape fields into apple orchards by using 5 times more water is one of the most important factors in Urmieh Lake drying out [32].
In the Eastern boundary basin, the changes in the trend of groundwater around 2005 are due to Afghan governments constructing large dams (Arghandab Dam, Kajaki Dam) that diverted water from the mountains in Afghanistan that charges some of rivers and water storages in this basin.
The long-term trend of groundwater in the Ghareghom basin has some fluctuations. There is an important transboundary sedimentary aquifer in this basin; it is shared between Turkmenistan, Afghanistan, and Iran. This fluctuation maybe because of changes in rules in Afghanistan and Turkmenistan.
After dividing the average volume of groundwater by the areas of every basin, the water thickness changes will be computed in mm (Table 3).
Table 3 shows that the Caspian Sea basin has the largest water thickness negative trend (−20,565 mm/yr) in Iran. [33] showed that the number of new wells in most of the sub-basins of the Caspian Sea basin increased intensively between 2002 and 2015. There may be a relation between the increasing number of wells and the negative trend of GWS depicted in the Caspian Sea basin. The water level dramatically decreases as the number of wells increases [33].
Well data in the six main basins show steady groundwater depletion in Iran over the last few decades. This is valuable information for our estimation for water management. In most of the regions, we can see sever water depletion. After the drought of 2007, without surface water to replenish supplies, there was only one choice: to increase reliance on groundwater. So since 2007, new wells have been dug to meet agricultural and domestic needs. This rapid increase in groundwater consumption, with no replenishment from precipitation or streamflow, is an important driver of the groundwater losses that are estimated in this study.
4. Conclusions and Outlook
Management of the sustainability of groundwater is necessary in a dry and semi-dry climate like that of Iran. The first stage in water management is to collect water-table data in order to have a time series of groundwater storage. The Iran Water Resources Management Company has collected a large number of observation wells data for 40 years. Iran is divided to six main water basins. There are 17,865 active observation wells in the whole of Iran. The six main water basins have 32 sub-basins. Each sub-basin is divided into several study areas. The Thiessen polygon method has been used to make a time series of the groundwater level across each study area. This study concludes that there are two intensive negative trends of groundwater storage changes in Iran, concentrated in the Central plateau basin, around Tehran (See Figure 5: Daryache Namak and Kavir Markazi). Tehran is the capital and the most populated city in Iran. At least 25% of Iran’s population are living where the subsidence has the potential to reach to at least one meter within just a few years due to dramatically shrinking groundwater reserves [34]. This has also been well documented in several plains within the Daryache Namak sub-basin [35,36], one of the most depleted sub-basins in Iran (see Figure 2 and Figure 3). Tehran is also vulnerable to seismic hazards due to high potential for tectonic activities. If significant decline in soil stability due to land subsidence, caused by extreme groundwater overdraft, is compounded with a major tectonic activity, it could potentially intensify earthquake impacts causing a human catastrophe (see also [33]). Groundwater depletion also affects the environment. The depletion results in increasing soil and groundwater salinity. Salinity negatively affects soil fertility and endangers long-term food security. As mentioned, a consequence of groundwater depletion is land subsidence. Land subsidence can change surface and sub-surface flow paths and cause major and irreversible declines in aquifer capacity (USDA 2007).
In Iran, there are many wells that likely have no control over their water withdrawals. In addition to climate change, crop patterns that are likely changing, inefficient irrigation systems, and high-water wastage with traditional irrigation are causing increased water extraction. So, there are some pressures on decision makers to grant permission for new wells in aquifers with negative water balances. When the groundwater table in an aquifer is decreased, discharges of wells are usually decreased. So even by digging deeper wells, the yield of wells has been reduced.
According to the Food and Agriculture Organization (FAO), agricultural water usage in Iran is 22% above the global average, while water productivity (crop yield per cubic meter of water consumption) is one third of the global average. This means that the agricultural sector generates about 10% of the country’s gross domestic product (GDP) but consumes 92% of the country’s fresh water. Groundwater depletion may also affect the food security of the countries that depend on the agriculture products. These issues lead us to the necessity of appropriate water management in Iran. Despite of all these issues, there is not an effective water management strategy that considers the sustainability of groundwater in Iran. Continuing this situation results in the loss of agricultural yields, unemployment, and climate migration [37].
In addition, lack of proper use of modern sciences coupled with lack of attention to warnings by officials about water shortage have aggravated the situation. If water scarcity is not resolved urgently, its impacts will soon bring heavier and irreparable damage to all sectors in the country. This situation is irreversible. Given that the most water-consuming sector in Iran is the agricultural sector, the only way forward is to carry out more relevant research in order to gain a full insight into sustainable irrigation practices and an understanding of the characteristics of farms and farming households to better frame strategies to cope with water-stressed regimes in drought-prone environments.
Water shortages in Iran can still be managed by proper planning, long-term follow-up assessment, and creating a culture of moderate consumption in the country. Cultural awareness about moderate use of water can begin with households and can spread to the industrial and agricultural sector by employing methods such as drip irrigation, greenhouse cultivation, etc.
Moreover, proper use of climatic information and scientific methods is essential in preparation of a comprehensive water management plan to identify the regions and prepare a specific plan that meets the climatic characteristics of each area.
Since drought is unpredictable and may happen frequently in Iran, establishing applicable and proper rules for water usage permission and having standards for water withdrawal from groundwater as a safe yield from wells helps to reduce the water depletion and its effects in Iran. Therefore, access to accurate water level data to have an updated time series is required for proper management. Better monitoring, assessment, and forecasting of water resources would help government agencies allocate water more efficiently among competing needs. Integrated management strategies for balancing water supply and demand at the basin and sub-basin scales are necessary.
In this study, we have focused on the monitoring of groundwater storage changes in Iran. Other countries with the same climate and intensive groundwater extraction may experience the same issues and different kinds of consequences of groundwater depletion.
Author Contributions
Conceptualization, Z.S., H.N. and G.J.; methodology, Z.S., H.N. and G.J.; software, Z.S. and G.J.; validation, Z.S., H.N. and G.J.; formal analysis, Z.S.; investigation, Z.S.; resources, Z.S., H.N. and G.J.; data curation, Z.S.; writing—original draft preparation, Z.S.; writing—review and editing, Z.S., H.N. and G.J.; visualization, Z.S. and G.J.; supervision, H.N. and G.J.; project administration, H.N. All authors have read and agreed to the published version of the manuscript.
Funding
This research received no external funding.
Institutional Review Board Statement
Not applicable.
Acknowledgments
The authors would like to acknowledge the Iran Water Resources Management Company for providing observation well data. We would like to thank the three anonymous reviewers for their insightful comments, which let to improved presentation of the results.
Conflicts of Interest
The authors declare that they have no conflict of interest.
Acronyms
| GWS | Groundwater Storage |
| TWI | Topographic Wetness Index |
| FAO | Food and Agriculture Organization |
| GDP | Gross Domestic Product |
References
- Joodaki, G.; Wahr, J.; Swenson, S. Estimating the human contribution to groundwater depletion in the Middle East, from GRACE data, land surface models, and well observations. Water Resour. Res. 2014, 50, 2679–2692. [Google Scholar] [CrossRef]
- Amery, H.A.; Wolf, A.T. Water in the Middle East: A Geography of Peace; University of Texas Press: Austin, TX, USA, 2000. [Google Scholar]
- Wolf, A.T.; Newton, J.T. Case Study Transboundary Dispute Resolution: The Tigris-Euphrates Basin, Transboundary Freshwater Dispute Database (TFDD); Oregon State University: Corvallis, OR, USA, 2007; Available online: https://www.transboundarywaters.orst.edu/ (accessed on 20 June 2021).
- Mahdavi, M. Applied Hydrology, 5th ed.; University of Tehran Press: Tehran, Iran, 2004; Volume 2, p. 420. (In Persian) [Google Scholar]
- Alemohammad, H.; Gharari, S. Qanat: An Ancient Invention for Water Management in Iran. In Proceedings of the Water History Conference, Delft, The Netherland, 24–26 June 2015. [Google Scholar]
- Jamab Consulting Engineers Company. National Master Plan of Water: Final Report; Iranian Ministry of Energy Press: Tehran, Iran, 1998. (In Persian) [Google Scholar]
- Brown, L. Water tables falling and rivers running dry: International situation. Int. J. Environ. 2007, 3, 1–5. [Google Scholar]
- Moridi, A. State of water resources in Iran. Int. J. Hydrol. 2017, 1, 111–114. [Google Scholar] [CrossRef] [Green Version]
- Iran is draining its aquifers dry. Nature 2021, 594, 476. [CrossRef]
- Safdari, Z. Groundwater Level Monitoring across Iran’s Main Water Basins Using Temporal Satellite Gravity Solutions and Well Data. Ph.D. Thesis, Norwegian University of Science and Technology’s, Trondheim, Norway, 2021. [Google Scholar]
- IPRC (Iranian Parliament Research Center). An Analysis of Iran’s Water Crisis and its Impacts; IPRC (Iranian Parliament Research Center): Eslam, Iran. Available online: https://rc.majlis.ir/fa/report/show/1040201 (accessed on 15 June 2021). (In Persian).
- Madani, K. Water management in Iran: What is causing the looming crisis? J. Environ. Stud. Sci. 2014, 4, 315–328. [Google Scholar] [CrossRef]
- Madani, K.; AghaKouchak, A.; Mirchi, A. Iran’s socio-economic drought: Challenges of a water-bankrupt nation. Iran. Stud. 2016, 49, 997–1016. [Google Scholar] [CrossRef]
- Danaei, G.; Farzadfar, F.G.; Kelishadi, P.R.; Rashidian, A.; Rouhani, O.M.; Ahmadnia, S.; Ahmadvand, A.; Arabi, M.; Ardalan, A.; Arhami, M.; et al. Iran in transition. Lancet 2019, 393, 1984–2005. [Google Scholar] [CrossRef]
- Motevalli, A.; Moradi, H.R.; Javadi, S. A comprehensive evaluation of groundwater vulnerability to saltwater up-coning and sea water intrusion in a coastal aquifer (case study: Ghaemshahr-juybar aquifer). J. Hydrol. 2018, 557, 753–773. [Google Scholar] [CrossRef]
- Ghahremanzadeh, H.; Noori, R.; Baghvand, A.; Nasrabadi, T. Evaluating the main sources of groundwater pollution in the southern Tehran aquifer using principal component factor analysis. Environ. Geochem. Health 2018, 40, 1317–1328. [Google Scholar] [CrossRef]
- Sinéad, L. The Iranian Water Crisis; Strategic Analysis Paper, Future Directions International Pty Ltd.: Perth, Australia, 2014; p. 11. [Google Scholar]
- Mahmoudpour, M.; Khamehchiyan, M.; Nikudel, M.R.; Ghassemi, M.R. Numerical simulation and prediction of regional land subsidence caused by groundwater exploitation in the southwest plain of Tehran, Iran. Eng. Geol. 2016, 201, 6–28. [Google Scholar] [CrossRef]
- Nabavi, E. Failed policies, falling aquifers: Unpacking groundwater overabstraction in Iran. Water Altern. 2018, 11, 699–724. [Google Scholar]
- Shiklomanov, I.A.; Penkova, N.V. Methods for assessing and forecasting global water use and water availability. In World Water Resources at the Beginning of the 21st Century; Shiklomanov, I.A., Rodda, J.C., Eds.; Cambridge University Press: Cambridge, UK, 2003; p. 452. [Google Scholar]
- Alley, W.M. Tracking, U.S. Groundwater: Reserves for the Future? Environ. Sci. Policy Sustain. Dev. 2006, 48, 10–25. [Google Scholar] [CrossRef]
- Shah, T.; Molden, D.; Sakthivadivel, R.; Seckler, D. The Global Groundwater Situation: Overview of Opportunities and Challenge; International Water Management Institute: Colombo, Sri Lanka, 2000. [Google Scholar]
- Jackson, R.B.; Carpenter, S.R.; Dahm, C.N.; McKnight, D.M.; Naiman, R.J.; Postel, S.L.; Running, S.W. Water in a Changing World. Ecol. Appl. 2001, 11, 1027–1045. [Google Scholar] [CrossRef]
- Hadi Pour, S.; Wahab, A.A.; Shahid, S.; Wang, X. Spatial Pattern of the Unidirectional Trends in Thermal Bioclimatic Indicators in Iran. Sustainability 2019, 11, 2287. [Google Scholar] [CrossRef] [Green Version]
- Shafizadeh-Moghadam, H.; Minaei, M.; Shahabi, H.; Hagenauer, J. Big data in Geohazard; pattern mining and large scale analysis of landslides in Iran. Earth Sci. Inform. 2018, 12, 1–17. [Google Scholar] [CrossRef]
- Khalili, A.; Rahimi, J.; Climate, B.T. The Soils of Iran; Roozitalab, M.H., Siadat, H., Farshad, A., Eds.; Springer International Publishing: Cham, Switzerland, 2018; pp. 19–33. [Google Scholar]
- Ghasemifar, E.; Mohammadi, C.; Farajzadeh, M. Spatiotemporal analysis of snow cover in Iran based on topographic characteristics. Theor. Appl. Climatol. 2019, 137, 1855–1867. [Google Scholar] [CrossRef]
- Noori, R.; Maghrebi, M.; Mirchi, A.; Tang, Q.; Bhattarai, R.; Sadegh, M.; Noury, M.; Haghighi, A.T.; Kløve, B.; Madani, K. Anthropogenic depletion of Iran’s aquifers. Proc. Natl. Acad. Sci. USA 2021, 118, e2024221118. [Google Scholar] [CrossRef]
- Diskin, M. On the computer evaluation of Thiessen weights. J. Hydrol. 1970, 11, 69–78. [Google Scholar] [CrossRef]
- Olawoyin, R.; Acheampong, P.K. Objective assessment of the Thiessen polygon method for estimating areal rainfall depths in the River Volta catchment in Ghana. Ghana J. Geogr. 2017, 9, 151–174. [Google Scholar]
- Weier, J. From Wetland to Wasteland; Destruction of the Hamon Oasis. NASA Earth Observatory. 2002. Available online: https://earthobservatory.nasa.gov/features/hamoun (accessed on 22 June 2021).
- Maghsoudi, T.; Yazdi, F.K.; Joneydi, M.S.; Sedighi, N.T.; Davodi, H. Sustainability of agricultural water management associations in Iran (Case study of Khuzestan Province). Eur. J. Exp. Biol. 2013, 3, 545–550. [Google Scholar]
- Ashraf, S.; Nazemi, A.; AghaKouchak, A. Anthropogenic drought dominates groundwater depletion in Iran. Sci. Rep. 2021, 11, 9135. [Google Scholar] [CrossRef]
- Motagh, M.; Walter, T.R.; Sharifi, M.A.; Fielding, E.; Schenk, A.; Anderssohn, J.; Zschau, J. Land subsidence in Iran caused by widespread water reservoir overexploitation. Geophys. Res. Lett. 2008, 35, L16403. [Google Scholar] [CrossRef] [Green Version]
- Edalat, A.; Khodaparast, M.; Rajabi, A.M. Detecting land subsidence due to groundwater withdrawal in Aliabad Plain, Iran, using ESA sentinel-1 satellite data. Nat. Resour. Res. 2019, 29, 1935–1950. [Google Scholar] [CrossRef]
- Haghighi, M.H.; Motagh, M. Ground surface response to continuous compaction of aquifer system in Tehran, Iran: Results from a long-term multi-sensor InSAR analysis. Remote Sens. Environ. 2019, 221, 534–550. [Google Scholar] [CrossRef]
- FAO. Water Report 34; FAO: Rome, Italy, 2008; Available online: http://www.fao.org/nr/water/aquastat/countries_regions/irn/index.stm (accessed on 16 March 2017).
Figure 1.
(a) Elevation map of Iran [24], (b) Topographic Wetness Index (TWI) map of Iran, [25], (c) Spatial distribution of precipitation in Iran in millimetre (1961–2005) [26], (d) Slope aspect of Iran [27], (e) Aquifers across Iran [28].

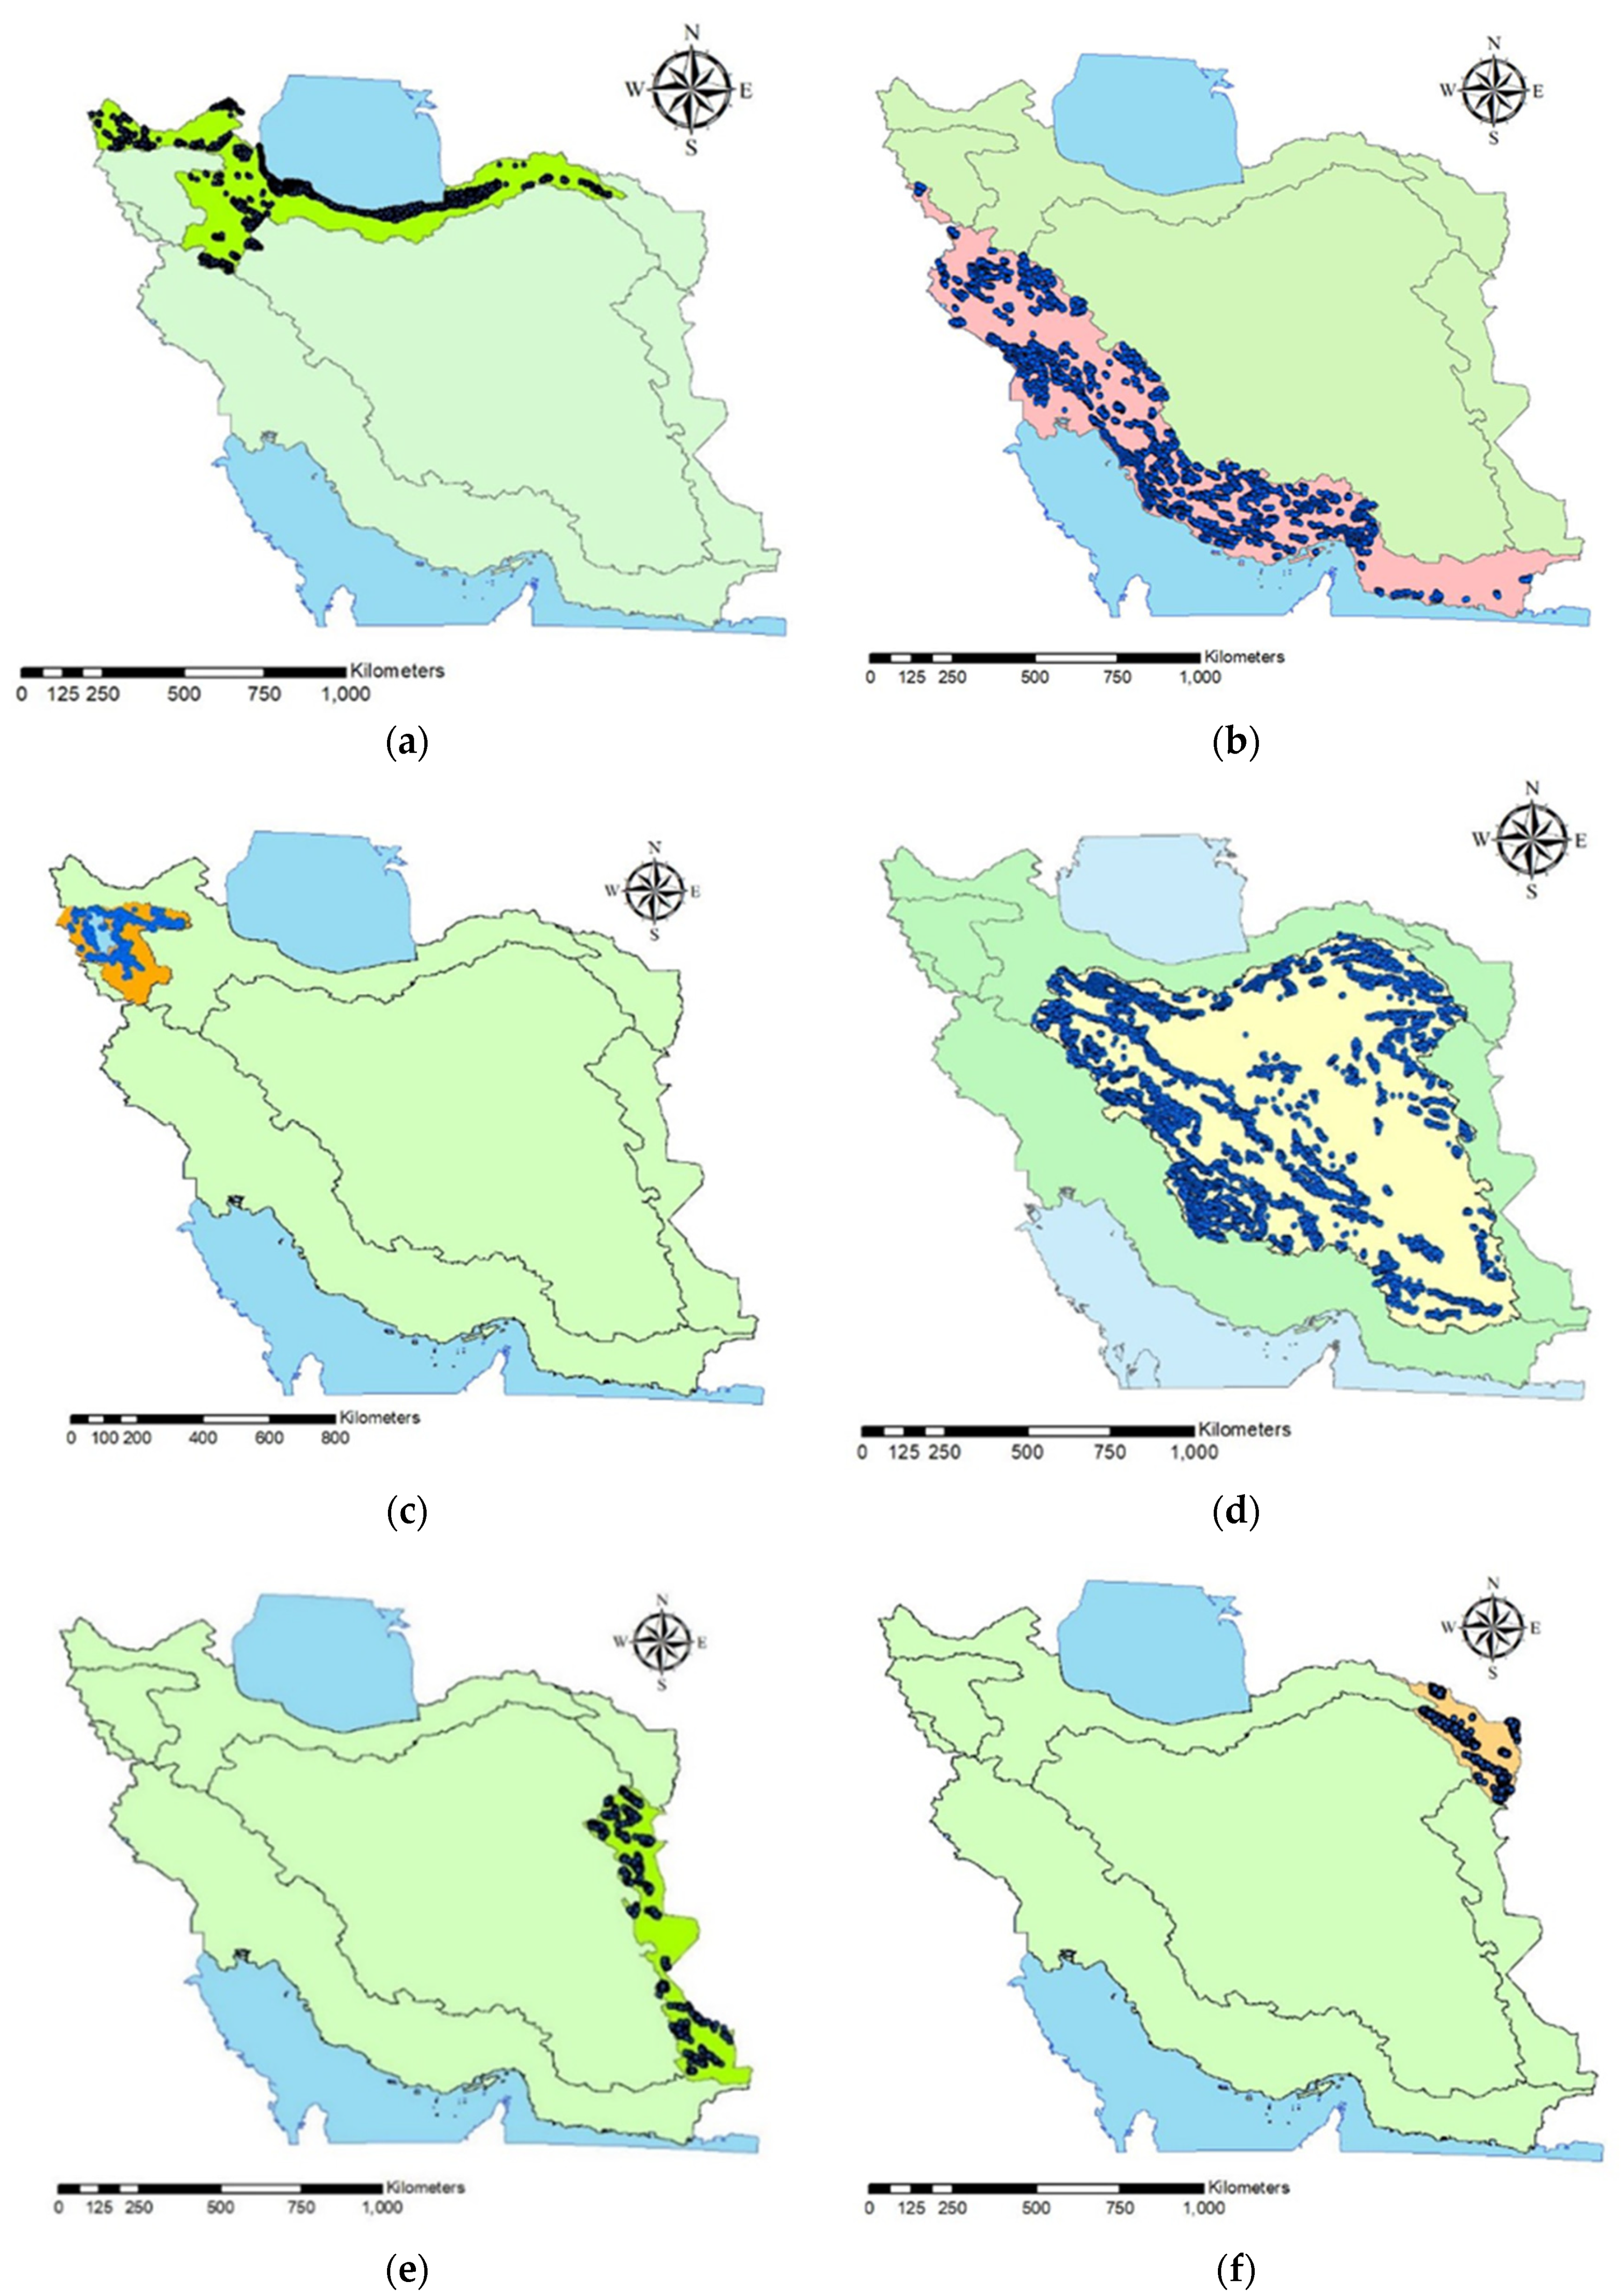
Figure 2.
Observation wells distribution in the main water basins in Iran: (a) Caspian Sea, (b) Persian Gulf and Oman Sea, (c) Urmieh, (d) Central Plateau, (e) Eastern Boundary, (f) Ghareghom.
Figure 2.
Observation wells distribution in the main water basins in Iran: (a) Caspian Sea, (b) Persian Gulf and Oman Sea, (c) Urmieh, (d) Central Plateau, (e) Eastern Boundary, (f) Ghareghom.

Figure 3.
(a–d) show steps to construct the Thiessen polygon.

Figure 4.
Long-term monthly values of groundwater storage across study area of 4104.

Figure 5.
Secular trend in Million cubic meter (Mm3/year) normal units groundwater storage across Iran, computed from water levels inferred from observation wells in sub-basins in Iran, between 2002 and 2017.
Figure 5.
Secular trend in Million cubic meter (Mm3/year) normal units groundwater storage across Iran, computed from water levels inferred from observation wells in sub-basins in Iran, between 2002 and 2017.

Figure 6.
The long-term monthly values of groundwater storage across different sub-basins.


Figure 7.
The long-term and short-term monthly values of groundwater storage across the main basins in Iran.
Figure 7.
The long-term and short-term monthly values of groundwater storage across the main basins in Iran.


Table 1.
Number of wells in study areas, sub-basins and main basins.
| Main Basin | Number of Sub-Basins | Number of Study Areas | Number of Observation Wells |
|---|---|---|---|
| Caspian Sea (code 1) | 7 | 31 | 3280 |
| Persian Gulf and Oman Sea (code 2) | 9 | 256 | 5404 |
| Urmieh (code 3) | 9 | 1308 | 25 |
| Central Plateau (code 4) | 9 | 233 | 13,000 |
| Eastern Boundary (code 5) | 9 | 23 | 498 |
| Ghareghom (code 6) | 13 | 23 | 295 |
| Iran | 32 | 641 | 17,865 |
Table 2.
Trend of GWS changes across sub-basins in Iran.
| Sub-Basins | Code | Trend (Mm3/yr) | Sub-Basins | Code | Trend (Mm3/yr) |
|---|---|---|---|---|---|
| Aras | 11 | −63.107 | Urmieh | 30 | −535.362 |
| Anzali | 12 | −13.873 | Daryache Namak | 41 | −2881.360 |
| Sefidrood Bozorg | 13 | −281.418 | Gav khooni | 42 | −465.545 |
| Sefidrood-Haraz | 14 | −31.955 | Tashtak | 43 | −695.810 |
| Gharasoo-Haraz | 15 | −16.708 | Abarghoo | 44 | −1521.080 |
| Gharasoo-Gorganrood | 16 | −50.125 | Hamoon | 45 | −1039.140 |
| Atrak | 17 | −3867 | Kavir loot | 46 | −1399.170 |
| Marzi-e-Gharb | 21 | −240.328 | Kavir Markazi | 47 | −4502.970 |
| Karkheh | 22 | −591.728 | Kavir Siahkooh | 48 | −185.784 |
| Karoon | 23 | 34.798 | Kavir Daranjir | 49 | −933.010 |
| Hendijan-Jarahi | 24 | −247.809 | Khaf | 51 | −368.318 |
| Hele | 25 | −100.770 | Hirmand | 52 | 7.842 |
| Mand | 26 | −567.042 | Mashkil | 53 | −209.970 |
| Mehran | 27 | −830.647 | Ghareghome | 60 | −2178.660 |
| Bandar Abbas | 28 | −441.877 | |||
| Baloochestan Jonubi | 29 | −20.909 |
Table 3.
Trend of GWS changes in the main basins in Iran.
| Main Basins | Area (km2) | Average Groundwater Depletion Trend (mm/yr) | Groundwater Depletion Trend (Mm3) | Groundwater Depletion Trend (Mm3/yr) | Groundwater Depletion Trend (GT/yr) |
|---|---|---|---|---|---|
| Caspian Sea (code 1) | 17,5051 | −20,565 | −5.40 × 10⁴ | −3.60 × 10³ | −3.60 |
| Persian Gulf and Oman Sea (code 2) | 424,029.6 | −7.075 | −4.50 × 10⁴ | −3.0 × 10³ | −3.0 |
| Urmieh (code 3) | 52,000 | −10.192 | −0.79 × 10⁴ | −0.53 × 10³ | −0.53 |
| Central Plateau(code 4) | 825,000 | −14,0 | −17.25 × 10⁴ | −11.55 × 10³ | −11.55 |
| Eastern Boundary(code 5) | 106,000 | −5377 | −0.85 × 10⁴ | −0.57 × 10³ | −0.57 |
| Ghareghom (code 6) | 44,295.5 | −18,738 | −1.24 × 10⁴ | −0.83 × 10³ | −0.83 |
| Iran | 1,626,376.1 | −12,346 | −3.01 × 10⁵ | −20.08 × 10³ | −20.08 |
Publisher’s Note: MDPI stays neutral with regard to jurisdictional claims in published maps and institutional affiliations. |
© 2022 by the authors. Licensee MDPI, Basel, Switzerland. This article is an open access article distributed under the terms and conditions of the Creative Commons Attribution (CC BY) license (https://creativecommons.org/licenses/by/4.0/).
Share and Cite
MDPI and ACS Style
Safdari, Z.; Nahavandchi, H.; Joodaki, G. Estimation of Groundwater Depletion in Iran’s Catchments Using Well Data. Water 2022, 14, 131. https://doi.org/10.3390/w14010131
AMA Style
Safdari Z, Nahavandchi H, Joodaki G. Estimation of Groundwater Depletion in Iran’s Catchments Using Well Data. Water. 2022; 14(1):131. https://doi.org/10.3390/w14010131
Chicago/Turabian StyleSafdari, Zohreh, Hossein Nahavandchi, and Gholamreza Joodaki. 2022. "Estimation of Groundwater Depletion in Iran’s Catchments Using Well Data" Water 14, no. 1: 131. https://doi.org/10.3390/w14010131
Note that from the first issue of 2016, this journal uses article numbers instead of page numbers. See further details here.