
Influence of Key Environmental Drivers on the Performance of Sediment Diversions


1
Department of River-Coastal Science and Engineering, Tulane University, New Orleans, LA 70118, USA
2
Mississippi Valley Division, U.S. Army Corps of Engineers, Vicksburg, MS 39183, USA
3
Coastal and Hydraulics Laboratory, US Army Engineer Research and Development Center, Vicksburg, MS 39180, USA
4
Earth System Science Interdisciplinary Center, University of Maryland, College Park, MD 20742, USA
*
Author to whom correspondence should be addressed.
Water 2022, 14(1), 24; https://doi.org/10.3390/w14010024
Submission received: 23 November 2021
/
Revised: 19 December 2021
/
Accepted: 20 December 2021
/
Published: 23 December 2021
(This article belongs to the Section Water Erosion and Sediment Transport)
Abstract
:A Delft3D morphodynamic model for Barataria Bay, Louisiana, USA is used to quantify a plausible range of land change in response to a proposed sediment diversion under a range of environmental drivers. To examine the influence of environmental drivers, such as Mississippi River water hydrographs, mineral and organic sediment loading, sea level rise rates, subsidence, and a projected implementation (or operation) date, 240 multi-decadal (2020–2100) numerical experiments were used. The diversion was assumed to begin operation in 2025, 2030, or 2035. The experiments revealed persistent benefits of the sediment diversion through 2100. Start data of 2025 result in a median net positive land change of 32 km2 by 2100; whereas the 90th, and 10th percentiles are 69 and 10 km2. A delay in the operation date of the diversion to 2030 or 2035 would reduce the net positive land change by approximately 15–20% and 20–30%, respectively.
1. Introduction
Coastal systems are facing severe challenges due to persistent sea level rise, land subsidence, climate driven changes to the freshwater and sediment riverine inflows to coastal systems [1]. Anthropogenic activities, such as urbanization, dramatically increase runoff generation and consequently increase the flooding potential of coastal regions [2]. Construction of dams along major riverine systems have reduced the sediment supply and increased the likelihood of coastal wetland systems and deltas to be drowned by rising seas and sinking land [3]. Extensive research and analyses have been carried out to evaluate the efficacy of various restoration approaches and strategies [4,5,6,7]. Restoration approaches have been extensively deployed [5] to enhance the resiliency of the coastal ecosystems against these challenges. Examples of these restoration strategies include shoreline protection, ridge restoration, reconnecting rivers to hydrologically severed coastal bays/estuaries, marsh creation, seawalls and wave-attenuation structures.
Numerical models are used to quantify a range of outcomes by implementing one or a combination of restoration strategies [4,5,6,7,8,9]. While numerical models inherently include uncertainties, they do provide valuable insights that guide the decision-making process of implementing proposed restoration projects. Extensive sensitivity and uncertainty analyses are crucial to provide a range of plausible outcomes capturing, to the extent possible, the inherent natural variabilities as well as to outline the level of confidence in the model output [10].
The Lower Mississippi River in Louisiana, USA has been disconnected from the adjacent estuaries by a levee system. As a result, the Barataria and Breton Sound basins have been deprived from the riverine freshwater, sediment and nutrients [11]. One of the restoration strategies proposed in Louisiana’s Master Plan is reconnecting the river to the adjacent estuaries through controlled diversion structures [11]. This study focuses on one of these sediment diversions, namely the Mid Barataria. Specifically, this research is designed to address two research questions. Would the delta/land created by a sediment diversion drown by 2100 due to environmental conditions—at least under severe Sea Level Rise (SLR) rates? Would a delay of implementation of the diversion beyond 2030 severely reduce the land building potential? To respond to these research questions, we constructed an extensive set of numerical experiments to examine the impact of key environmental drivers on the net land change resulting from the implementation of sediment diversions as a restoration strategy.
2. Study Site and Morphodynamic Model
2.1. Barataria Basin
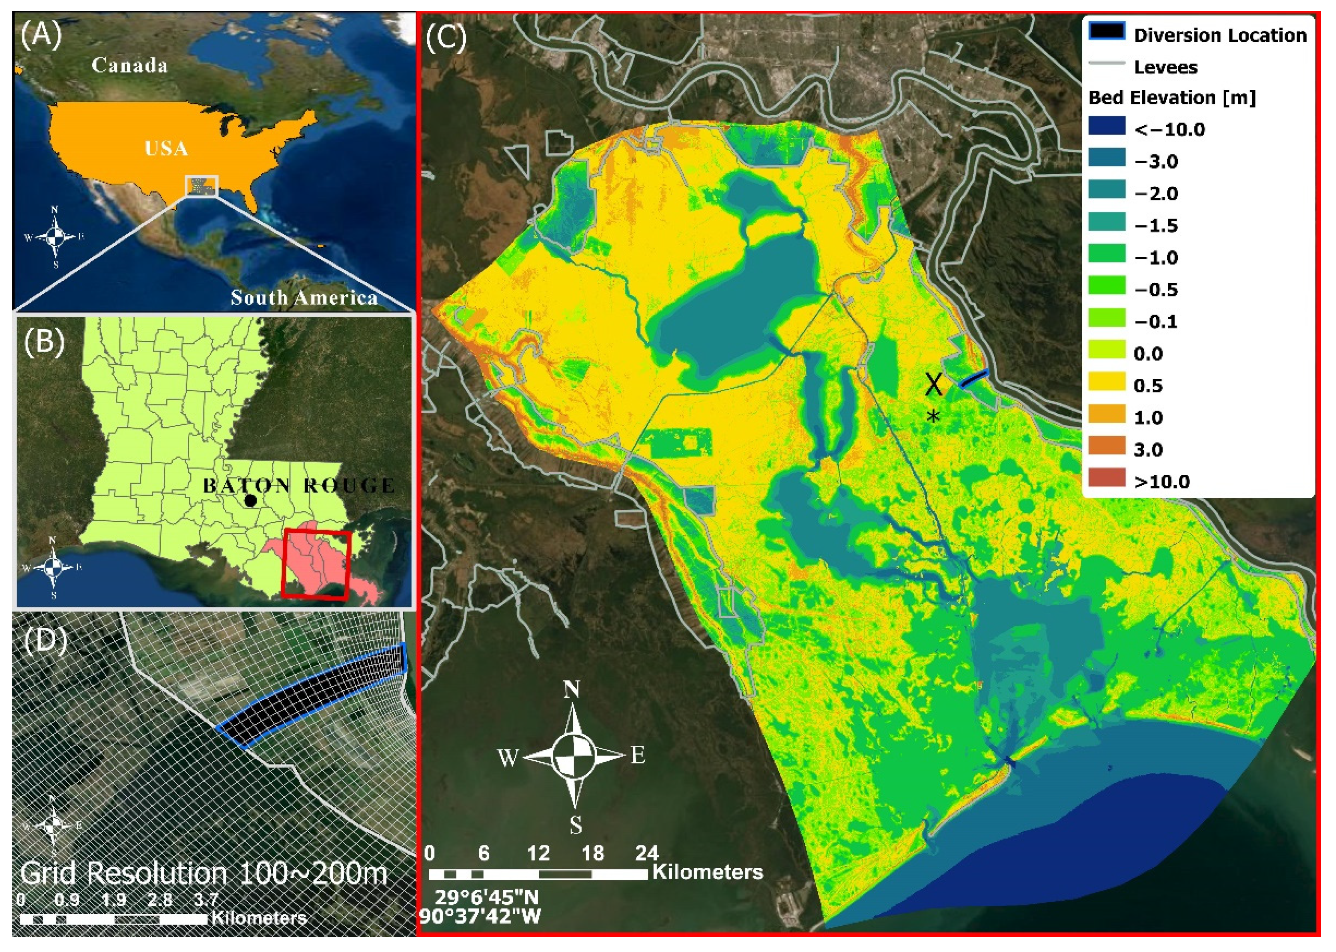
This study focuses on Barataria Bay, Louisiana USA as shown in Figure 1 to evaluate the influence of environmental drivers on restoration strategies. Barataria Basin has an area of approximately 6333 km2, including 616 km2 of swamps, 701 km2 of fresh marsh, 241 of intermediate marsh, 416 of Brackish marsh and 541 of saline marsh. The basin hydrodynamics are governed by tides, wind and precipitation. The tidal range is approximately 30 cm in the lower basin and diminishes to ~3 cm in the upper portion of the basin. It was reported that the basin lost nearly 17% of its marsh area since the 1930s [12]. The basin is bordered in the north and east by the Mississippi River (albeit disconnected from the river by a levee system except for freshwater point source connections; https://lacoast.gov/new/about/basin_data/ba/default.aspx, accessed on 19 December 2021), to the west by a Mississippi River tributary (Bayou Lafourche), and to the south by the Gulf of Mexico.
2.2. Morphodynamic Model
For this study, a Delft3D (V-6.04) [13] morphodynamic model was used. The model domain and grid design are shown in Figure 1. The grid size is 294,224 curvilinear grid points. The grid size ranges from 50 m to ~200 m. The United States Geological Survey (USGS) 5 m-resolution National Elevation Dataset (http://ned.usgs.gov/, accessed on 19 December 2021) was used as the primary source of the topo-bathymetric of the basin.
The model presented here was parameterized based on previous modeling efforts for the same and neighboring basins [14,15,16,17,18,19]. These previous modeling efforts detailed the validation efforts against field observations. A summary of the model parameters used here include horizontal eddy viscosity and diffusivity of 2 and 20 m2 s−1, respectively; five sediment fractions (sand, silt, clay, consolidated clay and marsh soil) [15], and spatially variable Chezy roughness ranging from 60 to 75. Based on a sensitivity analysis along with guidance from the previous modeling efforts, the morphological simulation was accelerated using a morphological acceleration factor (MORFAC) of 80 to reduce the simulation time [20]. The substrate was designed with total of 30 layers covering a 20 m depth where the top 1 m is surficial uncompacted fine sediment layer and the bottom 19 m are consolidated clay [21]. The top 15 layers have 0.3 m thickness while the bottom 15 layers have 1-m thickness each. It should be also noted that the model does not include explicitly a vegetation dynamic component. However, to quantify the impact of inundation on marsh productivity and organic loading, the following calculations were performed. At the end of every calendar year, mean annual water depth (MAWD) at every computational cell is calculated to classify the model domain into water or land/marsh. Initially, all cells with MAWD of zero are classified as marsh. For all subsequent years, land cells with MAWD >36 cm for two consecutive years, no organic loading was assumed. Otherwise, a 5 mm/year of organic depth was added to the elevation of that cell. For cells initially classified as water, they convert to marsh if their latest MAWD is zero [22,23]. The 5 mm/year is assumed as an average organic loading for all marsh types, although the production typically varies among marsh types. For this analysis, the average is reasonable to provide insights through the large number of permutations without the necessity of explicitly modeling the vegetation dynamics, which is computationally costly [16,23].
3. Environmental Drivers
To construct a plausible range of outcomes, key environmental drivers were considered to quantify the impact on the land change projections by year 2100. Key environmental drivers include the following:
Land Subsidence. Two spatially variable subsidence maps were used. One is based on the Louisiana 2017 Coastal Master Plan [24] and will be labeled here as the CMP17. The other is based on [25] and will be labeled Byrnes19. These subsidence rates were assumed to persist over the simulation duration.
Sea Level Rise Rates. Two Sea Level Rise Rates (SLR) curves with a projected elevation of 1-m and 2-m by 2100 were assumed for consistency with values used in the Louisiana Coastal Master Plan [17].
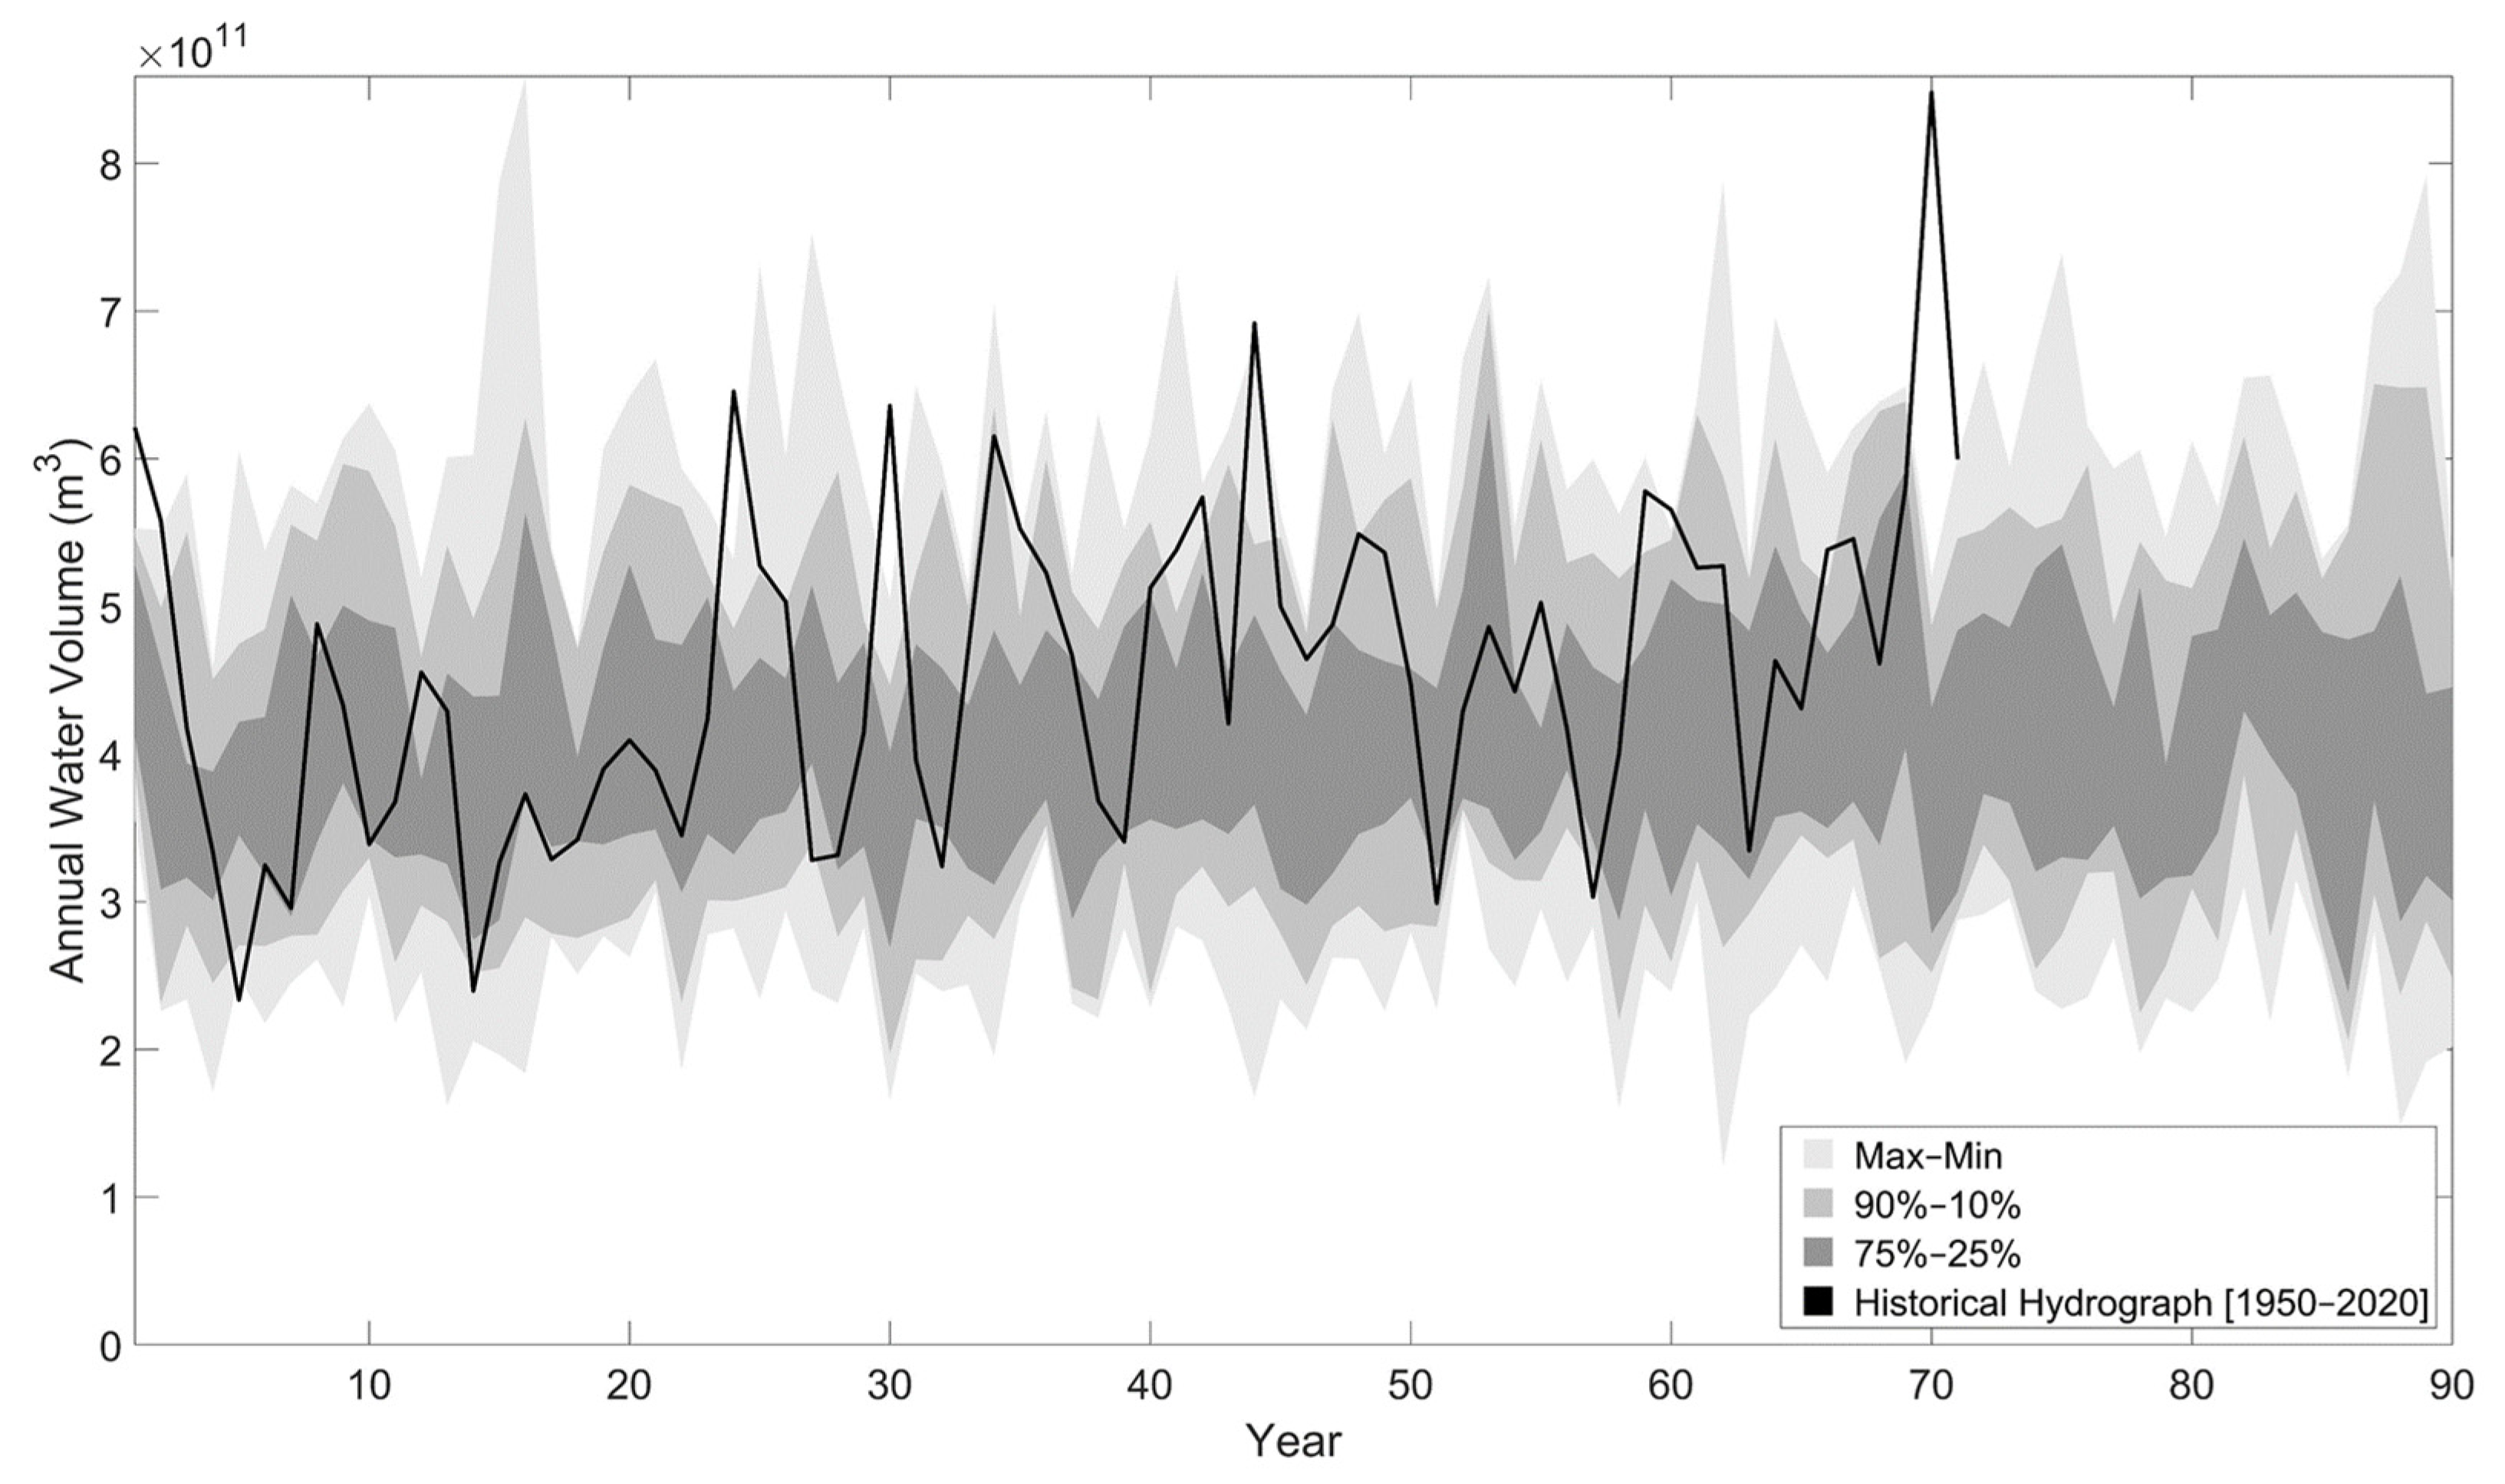
Riverine Inflow Hydrographs. Five riverine hydrographs, including four climate scenarios and one historical record were selected in this study. To select four climate scenarios, a suite of 16 streamflow simulations using the Coupled Model Intercomparison Project phase 5 (CMIP5) projections span from 1950 through 2100 were initially applied [26]. The Routing Application Parallel Discharge (RAPID, [27,28]) numerical model was used to route runoff datasets provided by executions of the Variable Infiltration Capacity (VIC, [29]) hydrologic model. The VIC model has been executed with its boundary conditions provided by the downscaled and bias corrected global climate models. Daily streamflow was generated for the entire Mississippi River Basin (MRB) at more than 1.2 million river reaches using high performance computer (HPC) systems. We then used these streamflow results for 16 scenarios at the Tarbert Landing to select representative subset based on the morphologic response of the system. Figure 2 shows summary statics of the 16 projected water hydrographs for the Lower Mississippi River. The figure shows the min, max, along with the 10th, 25th, 75th and 90th percentiles. The historically recorded hydrograph at the Tarbert Landing station is also displayed.
To reduce the number of permutations needed, we performed 80-year morphodynamic simulations (2020–2100) using all 16 scenarios as well as using the historical hydrograph (1950–2020). We also performed a similar morphodynamic simulation where the diversion was not operating to calculate the net land change induced by the diversion. Statistical analysis was performed to calculate the max, min, median and the quartiles of the resulting net land change. Four scenarios were selected based on their resulting net land change, namely, gfdlcm3_rcp45, bcccsm11m_rcp45, mpiesmmr_rcp45, and miroc5_rcp45 as they captured the full range of outcomes from morphological response point of view. The historical hydrograph was also used as an additional option for the set of permutations performed.
Sediment Rating Curves. To estimate the mineral sediment loading in the Mississippi River, two sediment rating curves were used, one is based on [4,30], labeled as USGS, while the second rating curve estimates the hysteresis effects [31], and will be referred to as HYST.
Organic Accretion. Two scenarios were examined, a 5 mm/year of organic accretion rate from all marsh areas within the model domain and zero organic accretion rate. The second scenario represents the land change from only the mineral sediment. These two scenarios provide insights about the ability of marsh areas to combat SLR through organic and mineral elevation gain, and through only mineral gain.
Considering the drivers listed above along with a hypothesized operation date of 2025, 2030 and 2035, a total of 240 permutations were produced (Table 1 below). These permutations were used to drive 80-year simulations.
4. Results and Discussions
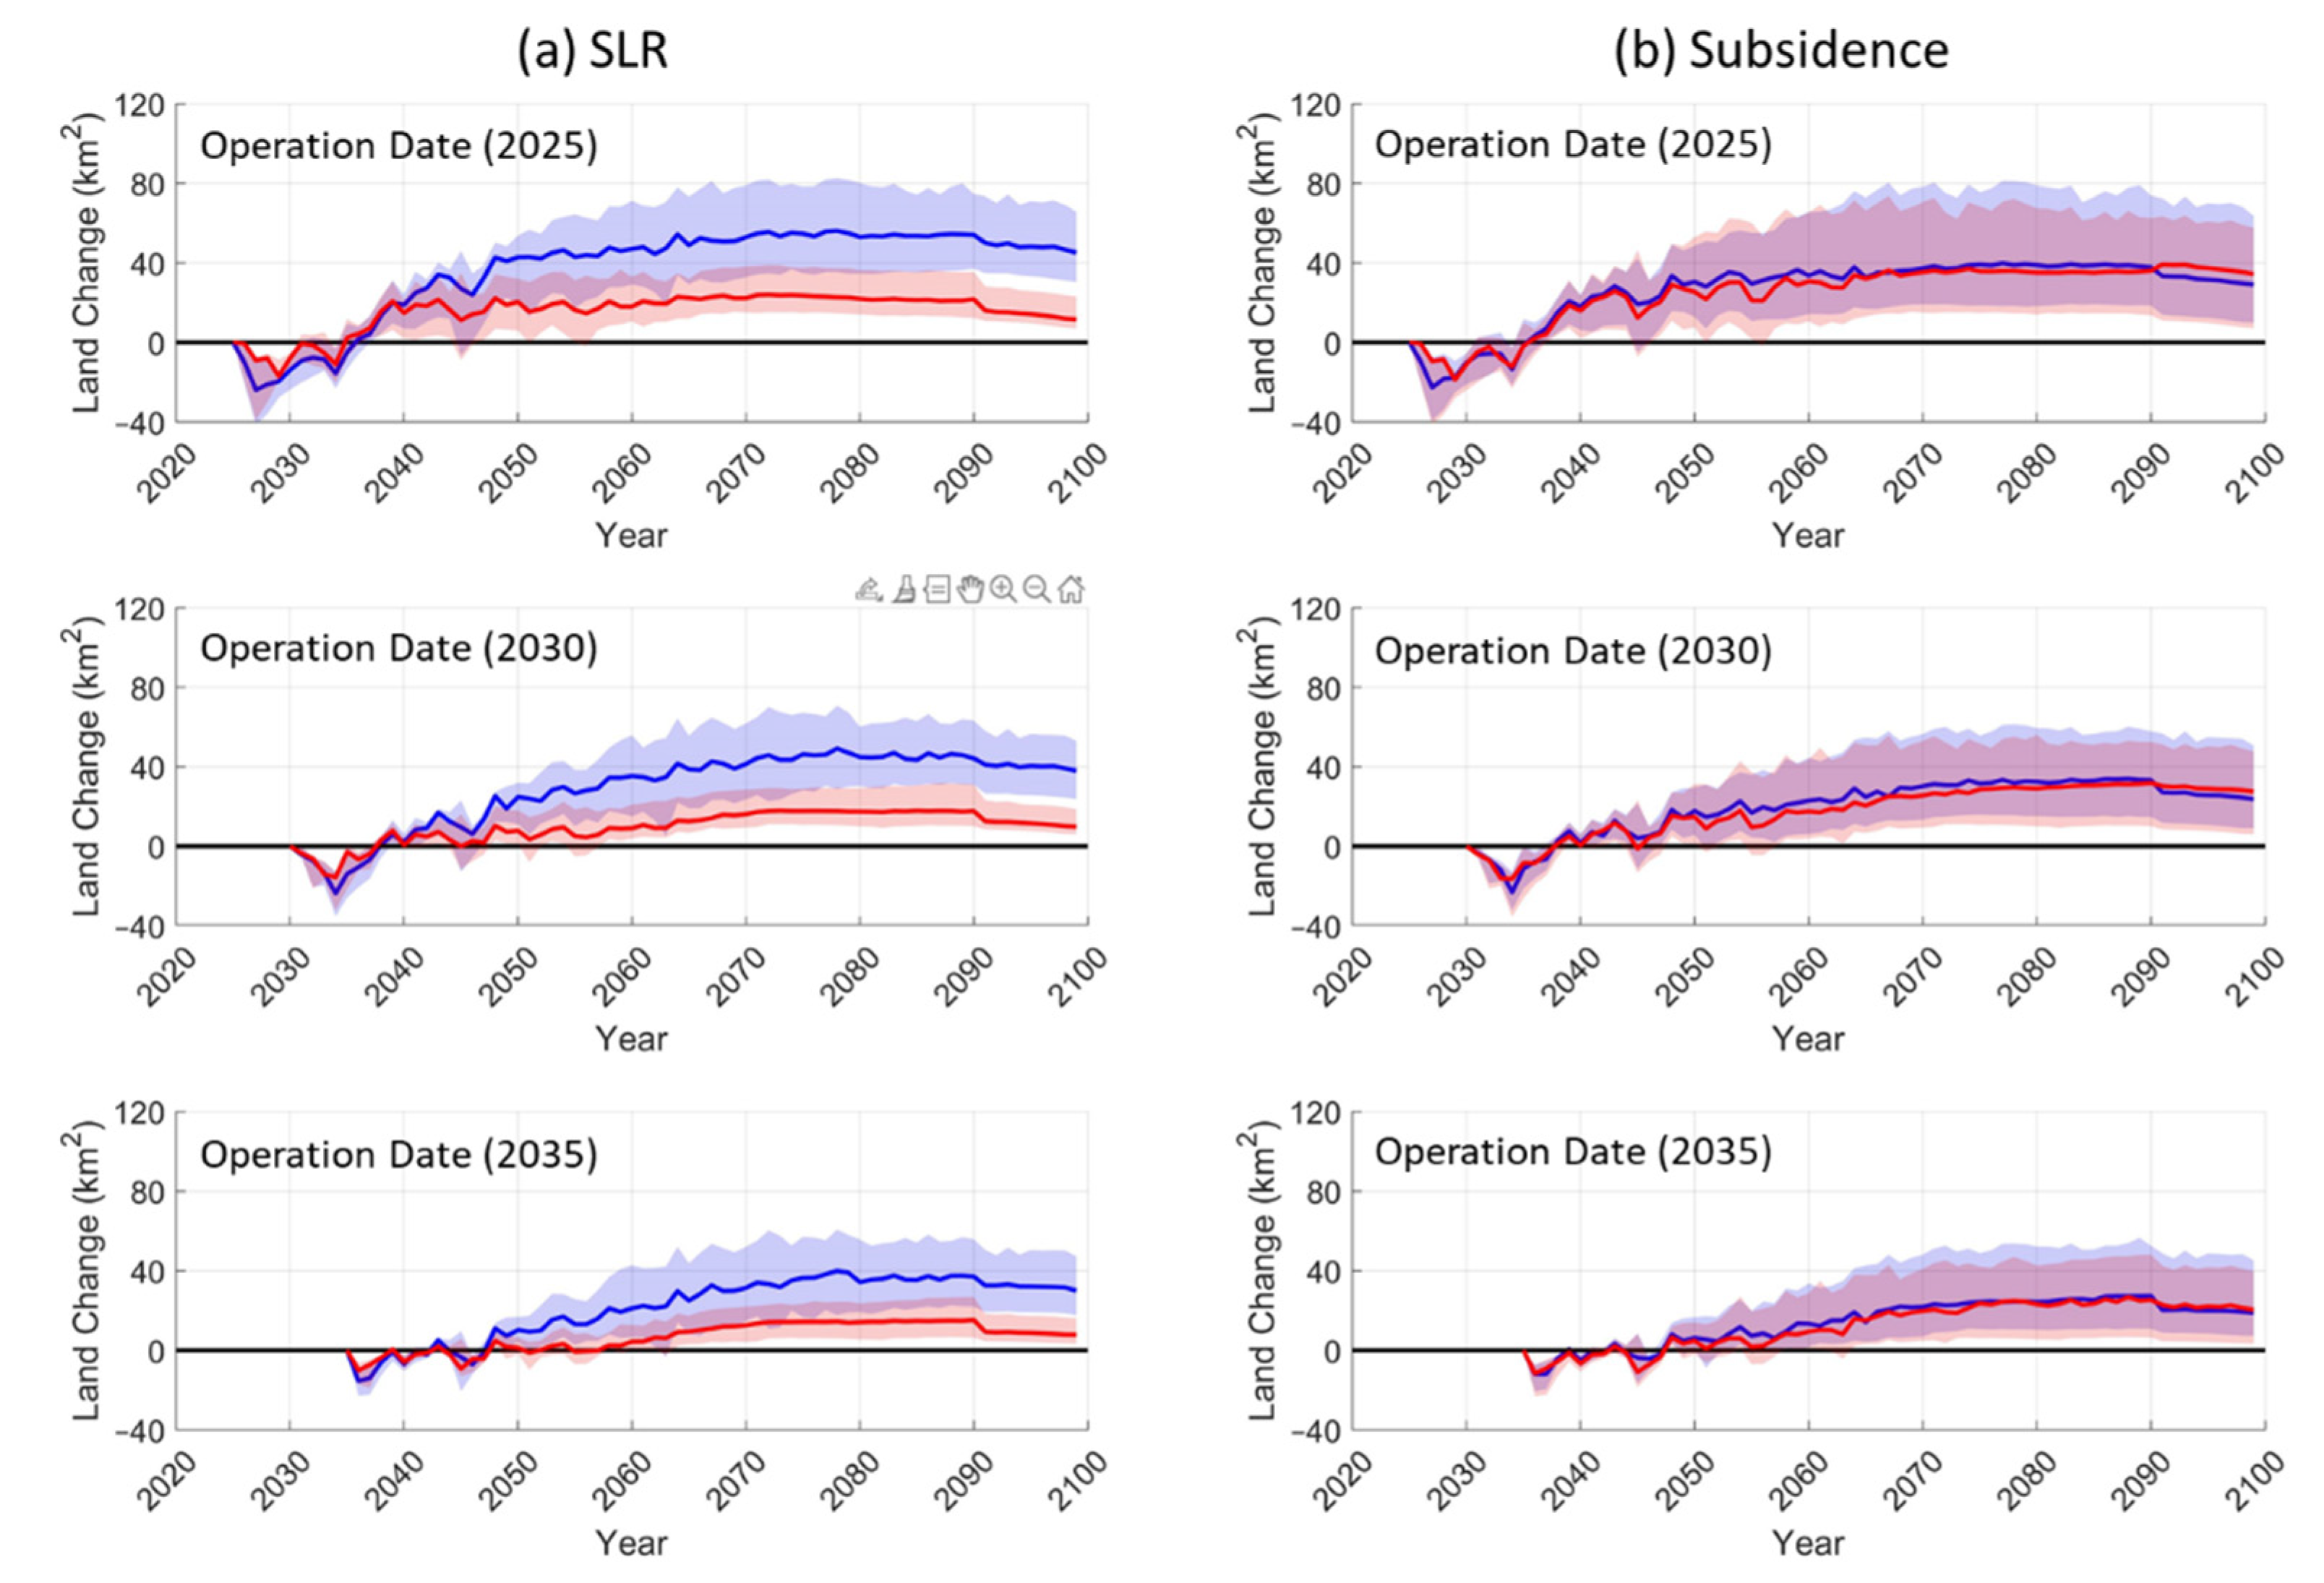
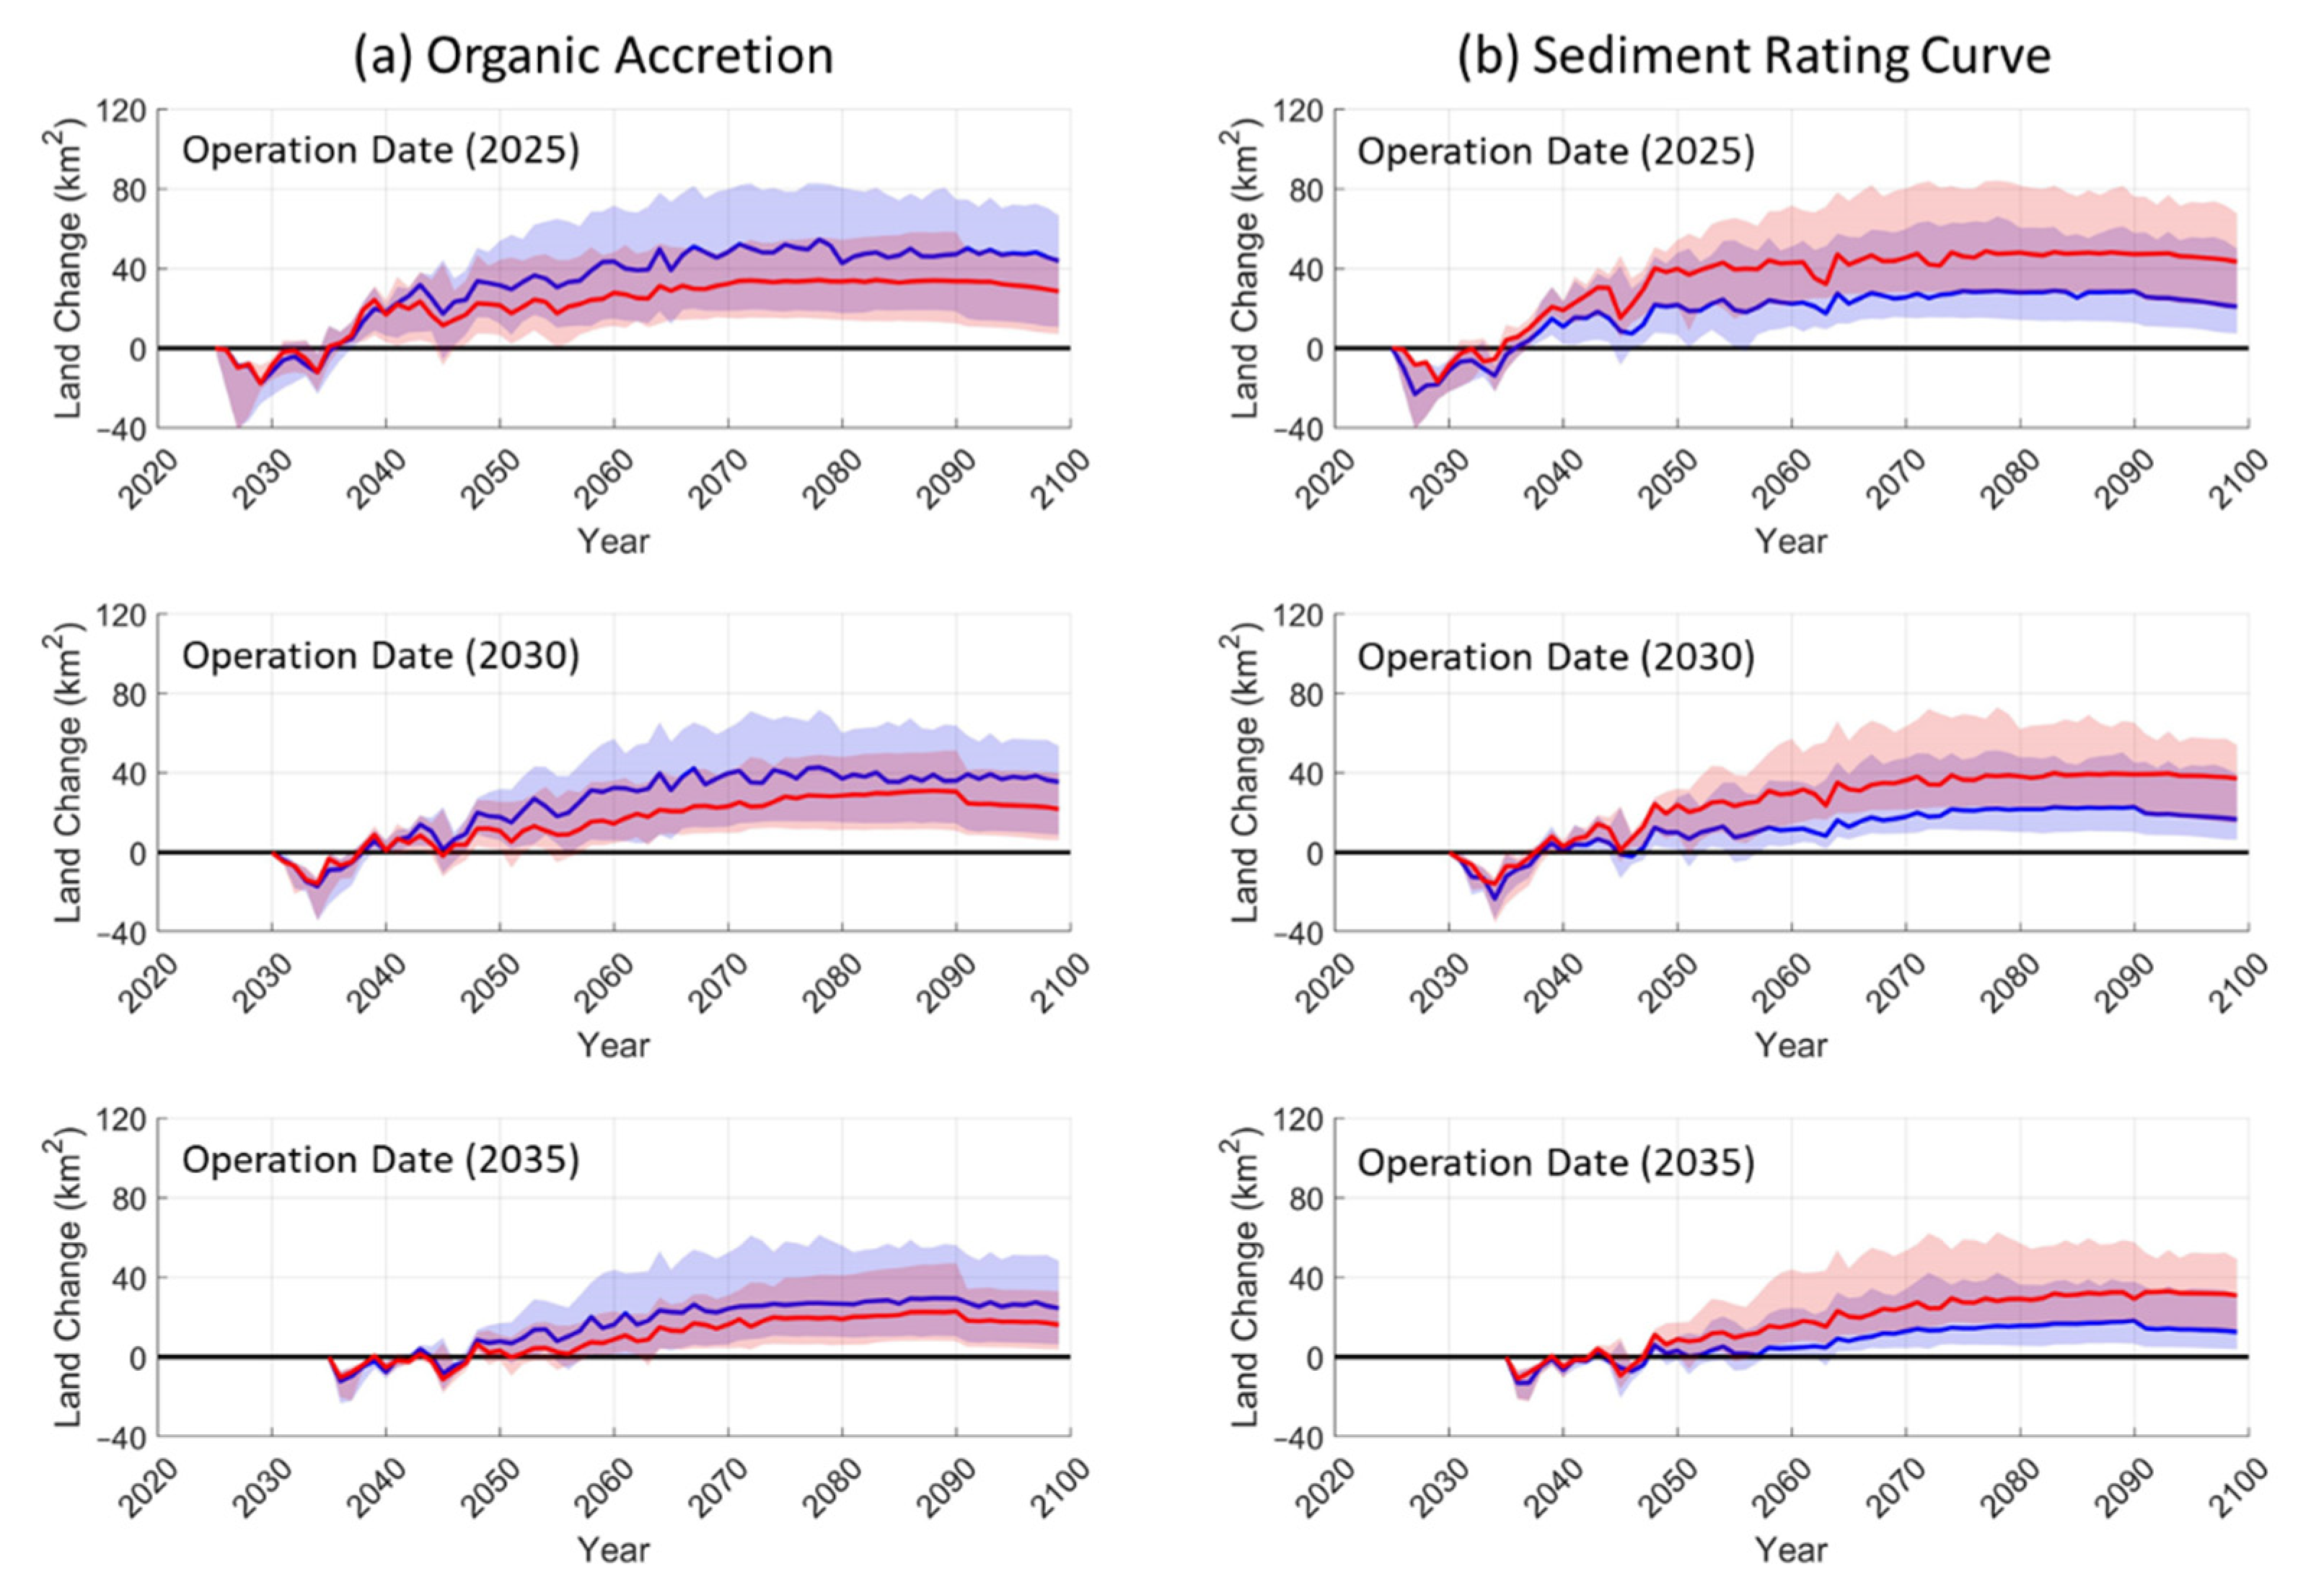
The results of the 240 permutations were analyzed by dividing the experiments into groups. Each group of experiments focused on the impact of one of the key environmental drivers listed in Table 1. For example, to isolate the impact of an SLR, all the permutations involving each of the two SLR rate considered at 120 permutations for each SLR rate. These outcomes were sorted by the three operation dates (2025, 2030 and 2035) so that 40 permutations for each operation date were used to calculate the median, 90th and 10th percentiles of the resulting net land change. Figure 3 shows a plausible range of net land change by 2100 for the two SLR rates and two subsidence alternatives. Similarly, Figure 4, shows the range of net land change by 2100 for the two organic accretion rates and two sediment rating curves examined here.
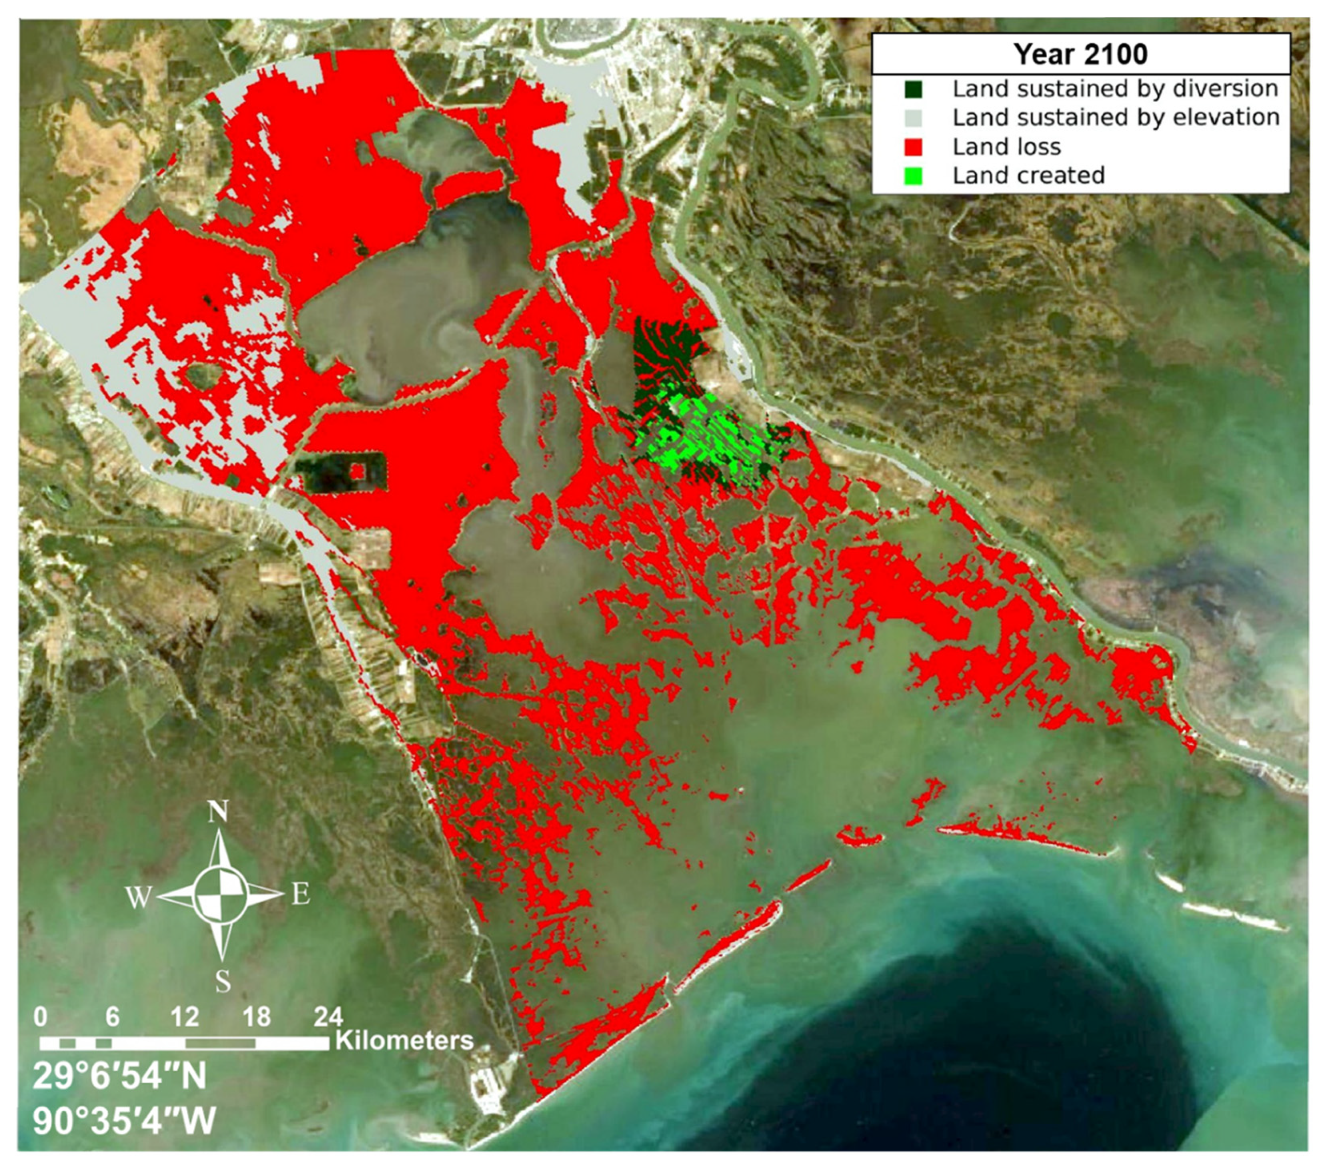
Figure 5 shows an example of land change map at year 2100 for one of the permutations. The two SLR rates used in the analysis produced distinct net land change outcomes. Not only the median results were clearly distinct, the 25th–750th range of the 2-m SLR hardly overlaps with the 1-m scenario even for the 2035 operation date. This highlights the sensitivity of the system response to SLR as an environmental driver. The organic accretion, as shown in Figure 4, shows clear increase in the net-land change, although the overlap between the two scenarios (zero accretion rate and 5 mm/year accretion rate) is significant. This signifies the importance of the organic contribution to the vertical elevation of the marsh surface. Establishing vegetated surface, as early as possible, adds significant increase in the annual elevation gain, thereby ameliorating the influence of SLR and subsidence.
The sediment rating curve that capture the hysteresis dynamics produces larger net land change compared to the standard USGS rating curve. Finally, the two subsidence scenarios used in the analysis produced very similar results (Figure 3b) for all three operation dates. Overall, for all the environmental drivers, a delay in the operation date results in noticeable decrease in the net land change highlighting the urgency of implementing this restoration strategy. Interestingly, all the permutations show a resilient formation of a subaerial marsh area. The magnitude of the net land change is strongly influenced by the environmental drivers.
To further examine the impact of the delay in implementing the restoration strategy, the permutations were organized by the operation date. Statistics were then calculated for the 80 experiments associated with each operation date. The results are summarized in Table 2. Overall, the results presented in Figure 3, Figure 4 and Figure 5 illustrate a plausible range of net land change resulting from the implementation of a sediment diversion. An obvious highlight of these result (as shown in Table 2) is the significant reduction in the benefit if the implementation date is delayed. Specifically, the potential benefit is reduced by approximately 15–20% if the operation date of the diversion is delayed from 2025 to 2030, while the loss of benefit would be approximately 20–30% if the delay is until 2035. Interestingly, all the permutations considered here showed that the diversion resulted in a net positive land change through 2100, even under the most severe combination of environmental drivers. The plausible resulting range of net land change by 2100 is fairly wide and highlights the opportunities and risks. The opportunities denoted by higher end (optimistic) of the positive land change emphasizes the need for a thorough adaptive management protocol to carefully monitor the response of the ecosystem to the implementation of these massive restoration strategies and exploring synergistic measures (e.g., marsh creation or ridge restoration) to maximize the land building processes. Further, a thorough riverside and basin-side monitoring framework of key variables such as water discharge, sediment load, nutrient load, salinity and temperature is crucial to making adjustments to the operation of the diversion to maximize the possible benefits and protect the natural resources of these valuable estuarine systems. Additionally, the outcomes driven by the key environmental drivers demonstrate the importance of considering a quantitative “range” of the potential benefit from restoration strategies rather than a singular number/quantity. It is imperative to consider these ranges in the optimization process of designing and especially in operating these restoration strategies. Considering these science-based quantitative ranges offers a viable approach to inform the decision-making process and to adequately evaluate the level of risk associated with the implementation of these restoration strategies.
5. Conclusions
An extensive set of numerical experiments was used to examine the impact of key environmental drivers on the performance of sediment diversions used as a coastal restoration strategy. The environmental drivers considered here include sea level rise rates, subsidence, freshwater inflow, mineral sediment load and organic accretion rate. These drivers were considered along with potential implementation date of the diversion by 2025, 2030 or 2035. A morphodynamic model was used to quantify the net land change that would result from the implementation of the sediment diversion over an approximately 80-year period (from 2020 through 2100). Remarkably, the diversion showed net positive land change through 2100 even under the most severe combination of environmental drivers considered here. However, the plausible range of the net land change is broad and highlights the opportunities and risk inherent in large scale environmental restoration strategies. To appropriately consider natural variabilities and adequately capture uncertainties in the projections of environmental drivers, utilizing a quantitative range of outcomes to evaluate and adaptively manage large-scale environmental strategies and initiatives is a more viable approach than a singular outcome. Adaptive management and strategic post-project monitoring programs are critical to optimize the operation plans of diversions to maximize the benefits and address potential concerns and impacts. Further, synergistic approaches, such as marsh creation and ridge restoration, should be explored to stimulate the land building processes and achieve the higher end of possible range of land change.
Author Contributions
Conceptualization, E.M., J.L., K.H. and A.A.T.; methodology, E.M., K.H., A.M.K. and A.A.T.; formal analysis, E.M., K.H., A.M.K. and A.A.T.; investigation, E.M., J.L., K.H., A.A.T. and A.M.K.; resources, E.M., K.H., A.M.K. and A.A.T.; writing—original draft preparation, E.M., A.M.K., A.A.T., J.L. and K.H.; writing—review and editing, E.M. and A.M.K.; visualization, E.M. and A.M.K.; supervision, E.M., K.H., J.L. and A.A.T.; project administration, E.M. All authors have read and agreed to the published version of the manuscript.
Funding
This research was supported, in part, by using high-performance computing (HPC) resources and services provided by both the Louisiana Optical Network Infrastructure (LONI) and Technology Services at Tulane University.
Acknowledgments
The authors would like to thank Denise Reed for her insights and informative feedback on the contents of the manuscript.
Conflicts of Interest
The authors declare no conflict of interest.
References
- Crossland, C.J.; Kremer, H.H.; Lindeboom, H.J.; Marshall Crossland, J.I.; le Tissier, M.D. Coastal Fluxes in the Anthropocene. In The Land-Ocean Interactions in the Coastal Zone Project of the International Geosphere-Biosphere Programme; Springer: Berlin/Heidelberg, Germany, 2005. [Google Scholar]
- Tao, B.; Tian, H.; Ren, W.; Yang, J.; Yang, Q.; He, R.; Cai, W.; Lohrenz, S. Increasing Mississippi river discharge throughout the 21st century influenced by changes in climate, land use, and atmospheric CO2. Geophys. Res. Lett. 2014, 41, 4978–4986. [Google Scholar] [CrossRef]
- Allison, M.A.; Meselhe, E.A. The use of large water and sediment diversions in the lower Mississippi River (Louisiana) for coastal restoration. J. Hydrol. 2010, 387, 346–360. [Google Scholar] [CrossRef]
- Meselhe, E.A.; Sadid, K.M.; Allison, M.A. Riverside morphological response to pulsed sediment diversions. Geomorphology 2016, 270, 184–202. [Google Scholar] [CrossRef] [Green Version]
- Reed, D.; Wang, Y.; Meselhe, E.; White, E. Modeling wetland transitions and loss in coastal Louisiana under scenarios of future relative sea-level rise. Geomorphology 2020, 352, 106991. [Google Scholar] [CrossRef]
- White, E.D.; Reed, D.J.; Meselhe, E.A. Modeled Sediment Availability, Deposition, and Decadal Land Change in Coastal Louisiana Marshes under Future Relative Sea Level Rise Scenarios. Wetlands 2019, 39, 1233–1248. [Google Scholar] [CrossRef]
- White, E.D.; Meselhe, E.; Reed, D.; Renfro, A.; Snider, N.P.; Wang, Y. Mitigating the Effects of Sea-Level Rise on Estuaries of the Mississippi Delta Plain Using River Diversions. Water 2019, 11, 2028. [Google Scholar] [CrossRef] [Green Version]
- Gaweesh, A.; Meselhe, E. Evaluation of Sediment Diversion Design Attributes and Their Impact on the Capture Efficiency. J. Hydraul. Eng. 2016, 142, 04016002. [Google Scholar] [CrossRef]
- Wang, H.; Steyer, G.D.; Couvillion, B.R.; Rybczyk, J.M.; Beck, H.J.; Sleavin, W.J.; Meselhe, E.A.; Allison, M.A.; Boustany, R.G.; Fischenich, C.J.; et al. Forecasting landscape effects of Mississippi River diversions on elevation and accretion in Louisiana deltaic wetlands under future environmental uncertainty scenarios. Estuarine Coast. Shelf Sci. 2014, 138, 57–68. [Google Scholar] [CrossRef]
- Meselhe, E.; Sadid, K.; Khadka, A. Sediment Distribution, Retention and Morphodynamic Analysis of a River-Dominated Deltaic System. Water 2021, 13, 1341. [Google Scholar] [CrossRef]
- Coastal Protection and Restoration Authority (CPRA) (2017). Louisiana’s Comprehensive Master Plan for a Sustainable Coast. Available online: https://coastal.la.gov/our-plan/2017-coastal-master-plan/ (accessed on 19 December 2021).
- Dunbar, B.J.; Britsch, L.D.; Kemp, E.B.I. Land Loss Rates; Report 3, Louisiana Coastal Plain (No. GL-90-2); U.S. Army Corps of Engineers: New Orleans, LA, USA, 1992.
- Lesser, G.; Roelvink, J.; van Kester, J.; Stelling, G. Development and validation of a three-dimensional morphological model. Coast. Eng. 2004, 51, 883–915. [Google Scholar] [CrossRef]
- Allison, M.A.; Yuill, B.T.; Meselhe, E.A.; Marsh, J.K.; Kolker, A.S.; Ameen, A.D. Observational and numerical particle tracking to examine sediment dynamics in a Mississippi River delta diversion. Estuarine Coast. Shelf Sci. 2017, 194, 97–108. [Google Scholar] [CrossRef]
- Baustian, M.M.; Meselhe, E.; Jung, H.; Sadid, K.; Duke-Sylvester, S.M.; Visser, J.M.; Allison, M.A.; Moss, L.C.; Ramatchandirane, C.; van Maren, D.S.; et al. Development of an Integrated Biophysical Model to represent morphological and ecological processes in a changing deltaic and coastal ecosystem. Environ. Model. Softw. 2018, 109, 402–419. [Google Scholar] [CrossRef]
- Meselhe, E.; Reed, D.; Grace, A. Coastal Protection and Restoration Authority Appendix C: Modeling Report: Version III; Coastal Protection and Restoration Authority: Baton Rouge, LA, USA, 2015.
- Meselhe, E.; White, E.; Wang, Y.; Reed, D. Uncertainty analysis for landscape models used for coastal planning. Estuarine Coast. Shelf Sci. 2021, 256, 107371. [Google Scholar] [CrossRef]
- Sendrowski, A.; Sadid, K.; Meselhe, E.; Wagner, W.; Mohrig, D.; Passalacqua, P. Transfer Entropy as a Tool for Hydrodynamic Model Validation. Entropy 2018, 20, 58. [Google Scholar] [CrossRef] [PubMed] [Green Version]
- Yuill, B.T.; Khadka, A.K.; Pereira, J.; Allison, M.A.; Meselhe, E.A. Morphodynamics of the erosional phase of crevasse-splay evolution and implications for river sediment diversion function. Geomorphology 2016, 259, 12–29. [Google Scholar] [CrossRef]
- Roelvink, J. Coastal morphodynamic evolution techniques. Coast. Eng. 2006, 53, 277–287. [Google Scholar] [CrossRef]
- Bomer, E.J.; Bentley, S.J.; Hughes, J.E.; Wilson, C.A.; Crawford, F.; Xu, K. Deltaic morphodynamics and stratigraphic evolution of Middle Barataria Bay and Middle Breton Sound regions, Louisiana, USA: Implications for river-sediment diversions. Estuarine Coast. Shelf Sci. 2019, 224, 20–33. [Google Scholar] [CrossRef]
- Snedden, G.; Cretini, K.; Patton, B. Inundation and salinity impacts to above- and belowground productivity in Spartina patens and Spartina alterniflora in the Mississippi River deltaic plain: Implications for using river diversions as restoration tools. Ecol. Eng. 2015, 81, 133–139. [Google Scholar] [CrossRef]
- White, E.; Meselhe, E.; McCorquodale, A.; Brady, C.; Zhifei, D.; Scott, D.-S.; Yushi, W. Coastal Protection and Restoration Authority Attachment C3-22: Integrated Compartment Model (ICM) Development; Coastal Protection and Restoration Authority: Baton Rouge, LA, USA, 2016.
- Reed, D.; Yuill, B. Coastal Protection and Restoration Authority Attachment C2-2: Subsidence; Coastal Protection and Restoration Authority: Baton Rouge, LA, USA, 2015.
- Byrnes, M.R.; Britsch, L.D.; Berlinghoff, J.L.; Johnson, R.; Khalil, S. Recent subsidence rates for Barataria Basin, Louisiana. Geo-Marine Lett. 2019, 39, 265–278. [Google Scholar] [CrossRef]
- Lewis, J.W.; Tavakoly, A.A.; Martin, C.A.; Moore, C.D. Mississippi River and Tributaries Future Flood Conditions; United States Army, Corps of Engineer: Washington, DC, USA, 2019.
- David, C.H.; Maidment, D.R.; Niu, G.-Y.; Yang, Z.-L.; Habets, F.; Eijkhout, V. River Network Routing on the NHDPlus Dataset. J. Hydrometeorol. 2011, 12, 913–934. [Google Scholar] [CrossRef] [Green Version]
- Tavakoly, A.A.; Snow, A.; David, C.H.; Follum, M.L.; Maidment, D.R.; Yang, Z.-L. Continental-Scale River Flow Modeling of the Mississippi River Basin Using High-Resolution NHDPlusDataset. JAWRA J. Am. Water Resour. Assoc. 2016, 53, 258–279. [Google Scholar] [CrossRef]
- Liang, X.; Lettenmaier, D.P.; Wood, E.F.; Burges, S.J. A simple hydrologically based model of land surface water and energy fluxes for general circulation models. J. Geophys. Res. Space Phys. 1994, 99, 14415–14428. [Google Scholar] [CrossRef]
- Allison, M.A.; Demas, C.R.; Ebersole, B.A.; Kleiss, B.A.; Little, C.D.; Meselhe, E.A.; Powell, N.J.; Pratt, T.C.; Vosburg, B.M. A water and sediment budget for the lower Mississippi–Atchafalaya River in flood years 2008–2010: Implications for sediment discharge to the oceans and coastal restoration in Louisiana. J. Hydrol. 2012, 432–433, 84–97. [Google Scholar] [CrossRef]
- Peyronnin, N.S.; Caffey, R.H.; Cowan, J.H.; Justic, D.; Kolker, A.S.; Laska, S.B.; McCorquodale, A.; Melancon, E.; Nyman, J.A.; Twilley, R.R.; et al. Optimizing Sediment Diversion Operations: Working Group Recommendations for Integrating Complex Ecological and Social Landscape Interactions. Water 2017, 9, 368. [Google Scholar] [CrossRef] [Green Version]
Figure 1.
Study site and model domain. (A) Location of Louisiana state within the Unites States of America; (B) location of Barataria basin within the state of Louisiana; (C) digital Elevation Map (DEM) data in (m-vertically referenced to North American Vertical Datum NAVD-88); and (D) grid distribution at location (X) in the outfall area of the diversion where grid resolution is 100:200 m.

Figure 2.
Statistical summary of 16 projected hydrographs for the Lower Mississippi River at the Tarbert Landing, Louisiana station. The historically recorded hydrograph at the same station from 1950–2020 is shown for comparison.
Figure 2.
Statistical summary of 16 projected hydrographs for the Lower Mississippi River at the Tarbert Landing, Louisiana station. The historically recorded hydrograph at the same station from 1950–2020 is shown for comparison.

Figure 3.
(a) Effect of 1-m (blue line) and 2-m (red line) sea level rise (SLR) and (b) subsidence (CMP2017—blue line; and BYRNES T19 is red line) on the net land change by 2100. The top row is assuming operation date of 2025, while the middle row is for 2030, and the bottom row is for 2035.
Figure 3.
(a) Effect of 1-m (blue line) and 2-m (red line) sea level rise (SLR) and (b) subsidence (CMP2017—blue line; and BYRNES T19 is red line) on the net land change by 2100. The top row is assuming operation date of 2025, while the middle row is for 2030, and the bottom row is for 2035.

Figure 4.
Effect of organic accretion and mineral sediment rating curves on net land change. Panel (a) is for organic accretion rates where the blue line represents the 5-mm rate and the red line represent the mineral only permutations. Panel (b) is for the mineral sediment rating curves where the blue line represents the USGS rating curve, while the red line represents the HYST rating curve. The top row is assuming operation date of 2025, while the middle row is for 2030, and the bottom row is for 2035.

Figure 5.
Net land change map by 2100. Red represents pixels that started as marsh in 2020 and converted to water by 2100 with or without the diversion, whereas grey are pixels that started as marsh in 2020 and remained as marsh by 2100 with or without the diversion. The dark green represents a pixel that started as marsh in 2020 and converted to water by 2100 without the diversion but was sustained as marsh only due to the presence of the diversion. The light green represents a pixel that started as open water in 2020 and remained water without the diversion but converted to marsh due the presence of the diversion. This particular permutation had the following attributes: subsidence: CMP17, SLR 1-m; sediment rating curve: HYST; and accretion rate of 5-mm and operation date of 2025.


Table 1.
Permutations of the morphodynamic numerical experiments. Note: In addition to the 240 permutations, 16 future-without-action simulations are performed to allow for calculating net land change due to the implementation of the sediment diversion.
Table 1.
Permutations of the morphodynamic numerical experiments. Note: In addition to the 240 permutations, 16 future-without-action simulations are performed to allow for calculating net land change due to the implementation of the sediment diversion.
| Parameters | Number of Permutations | List of Scenarios |
|---|---|---|
| Subsidence map | 2 | Subsidence map from 2017 master plan and 2019 published map |
| SLR | 2 | IPCC-Low (1 m between 1992–2100) and IPCC-Medium (2 m between 1992–2100) |
| River water hydrograph | 5 | USGS observation and four calculated scenarios |
| Sediment rating curve | 2 | USGS and Hysteresis rating curves |
| Annual organic marsh accretion | 2 | Two organic accretion rates 0 mm and 5 mm per year |
| Operation date | 3 | Three operation dates 2025, 2030, and 2035 |
| Total number of permutations | 240 |
Table 2.
Statistical summary of the net land change in km2 by 2100 for the three operation dates.
| Percentile | Land Change (km2) | ||
|---|---|---|---|
| Operation Date 2025 | Operation Date 2030 | Operation Date 2035 | |
| 90th | 69 | 58 | 55 |
| 50th (median) | 32 | 26 | 23 |
| 10th | 10 | 8 | 7 |
Publisher’s Note: MDPI stays neutral with regard to jurisdictional claims in published maps and institutional affiliations. |
© 2021 by the authors. Licensee MDPI, Basel, Switzerland. This article is an open access article distributed under the terms and conditions of the Creative Commons Attribution (CC BY) license (https://creativecommons.org/licenses/by/4.0/).
Share and Cite
MDPI and ACS Style
Meselhe, E.; Khalifa, A.M.; Hu, K.; Lewis, J.; Tavakoly, A.A. Influence of Key Environmental Drivers on the Performance of Sediment Diversions. Water 2022, 14, 24. https://doi.org/10.3390/w14010024
AMA Style
Meselhe E, Khalifa AM, Hu K, Lewis J, Tavakoly AA. Influence of Key Environmental Drivers on the Performance of Sediment Diversions. Water. 2022; 14(1):24. https://doi.org/10.3390/w14010024
Chicago/Turabian StyleMeselhe, Ehab, Ahmed M. Khalifa, Kelin Hu, James Lewis, and Ahmad A. Tavakoly. 2022. "Influence of Key Environmental Drivers on the Performance of Sediment Diversions" Water 14, no. 1: 24. https://doi.org/10.3390/w14010024
Note that from the first issue of 2016, this journal uses article numbers instead of page numbers. See further details here.