Article

Spatial–Temporal Distribution of Phosphorus Fractions and Their Relationship in Water–Sediment Phases in the Tuojiang River, China

1
State Key Laboratory of Environmental Criteria and Risk Assessment, Chinese Research Academy of Environmental Sciences, Beijing 100012, China
2
SEPA Key Laboratory of Eco-Industry, Chinese Research Academy of Environmental Sciences, Beijing 100012, China
3
State Key Laboratory of Pollution Control and Resource Reuse, College of Environmental Science and Engineering, Tongji University, Shanghai 200092, China
*
Authors to whom correspondence should be addressed.
Water 2022, 14(1), 27; https://doi.org/10.3390/w14010027
Submission received: 20 November 2021 / Revised: 16 December 2021 / Accepted: 22 December 2021 / Published: 23 December 2021

Abstract

:
Understanding the distribution and transportation of phosphorus is vital for the sustainable development of aquatic environmental protection and ecological security. The spatial–temporal distribution of phosphorus fractions in water–sediment phases in river systems and their relationships remain unclear in Southwest China. In this study, the spatial and temporal distribution of phosphorus fractions in water–sediment phases in the Tuojiang River, a primary tributary of the Yangtze River which plays important roles in the economy and ecology of the region, and the relationships among the different phosphorus fractions were analyzed. These fractions were soluble reactive phosphorus (SRP), dissolved organic phosphorus (DOP), and total particulate phosphorus (PP) fractions in water, and exchangeable phosphorus (Ex-P), organic phosphorus (Or-P), phosphorus bound by Fe oxides (Fe-P), authigenic phosphorus (Ca-P), detrital phosphorus (De-P), and refractory phosphorus (Res-P) fractions in sediment. The SPR and Fe-P were the dominant phosphorus fractions in the water and sediment, respectively. The TP content was greater in the lower reaches than in the middle and upper reaches. The average abundances of most phosphorus fractions in water–sediment phases showed significant seasonal variations. The Fe-P, Org-P, and TP in sediments were released to the water interface, resulting in the increase of phosphorus in the overlying water. Redundancy analysis (RDA) indicated that the physicochemical properties of water and sediment have a certain influence on the spatial–temporal distribution of the phosphorus fractions. Principal component analysis (PCA) revealed that the main phosphorus source was anthropogenic activities. These results provide primary data regarding phosphorus fractions and contribute to understanding phosphorus cycling and controlling phosphorus pollution in the Tuojiang River.

1. Introduction

Phosphorus is an essential nutrient element for biological growth, and excessive phosphorus is a crucial factor causing eutrophication in aquatic systems [1,2]. Phosphorus bioavailability is not only related to the concentration of total phosphorus (TP), but also to the phosphorus fraction [3] as soluble reactive phosphorus (SRP), dissolved organic phosphorus (DOP), and total particulate phosphorus (PP) in aqueous environments, and exists as six phosphorus fractions (exchangeable phosphorus (Ex-P), organic phosphorus (Or-P), phosphorus bound by Fe oxides (Fe-P), authigenic phosphorus (Ca-P), detrital phosphorus (De-P), and refractory phosphorus (Res-P)) in sediment. Each fraction has unique bioavailability, chemical reactivity, and environmental fate, which can play different roles in regulating water quality and the biogeochemical cycling of other bioactive elements in aquatic environments [4,5]. Therefore, understanding the distribution of phosphorus fractions is important in evaluating water quality and managing phosphorus pollution in aquatic environments [1].
Sediment, a source and sink of water-soluble phosphates, is a significant medium of environmental phosphorus, that acts [6]. Phosphorus could migrate and transform in water–sediment phases under certain environmental conditions [7,8]. Additionally, not all of the phosphorus fractions can be released from sediment into the surficial waters [9]. Hence, knowledge of the relationships of different phosphorus fractions in water–sediment phases is vital to better understand their environmental fate and ecological role in aquatic environments.
The Tuojiang River is located in Southwest China and is a primary tributary of the Yangtze River. Water needed to sustain industrial agricultural, domestic, and natural ecosystems within its basin is mainly provided by the river [10]. With rapid population growth, and agricultural and economic development, increased environmental pressure has resulted in severe phosphorus pollution in the Tuojiang River [11,12]. The resulting pollution threatens both environmental quality and human health. Thus, quantifying the phosphorus fractions, and revealing their relationships in the water–sediment phases, provides useful reference for managing phosphorus pollution for sustainable development in the Tuojiang. Several studies have focused on the source of TP emissions [13], phosphorus fractions, potential release characteristics of phosphogypsum [14], phosphorus-fixing capacity of the sediment [15], and vertical distribution characteristics and the relationship of phosphorus fractions in the sediment–water system [16] in the Tuojiang River. These studies have contributed to a better understanding of the phosphorus pollution in terms of sources and management strategies. However, less attention has been paid to the phosphorus fractions in the water–sediment phases. Previous study on phosphorus fractions was limited to few and sparse stations along the river course. There is a knowledge gap in comprehensively identifying the spatial–temporal distribution of phosphorus fractions and their relationship in water–sediment phases in the Tuojiang River. Furthermore, prior research has not covered the influence of seasonality and environmental factors as key factors in affecting phosphorus fraction in the water–sediment phases. Understanding the trends of seasonal variations and influence of environmental factors is critical to deriving adaptive strategies for effective basin management. Investigating the temporal variations of pollution in Dongting Lake in China found different phosphorus fractions varied between wet and dry seasons [17]. The phosphorus fractions were influenced by pH, dissolved oxygen (DO), organic matter (OM), and particle size in the Minjiang River and the Three Gorges Reservoir [7,18].
This study aims to (a) characterize the spatial–temporal distribution of phosphorus fractions and their relationship in water–sediment phases; (b) reveal the influence of environmental variables on the phosphorus fractions; and (c) identify possible sources of different phosphorus fractions. The results obtained can provide a basis for summarizing the dynamics of phosphorus fractions migration and transformation and help to understand the ecological role of different phosphorus fractions to effectively prevent and manage phosphorus pollution in the Tuojiang River.

2. Materials and Methods

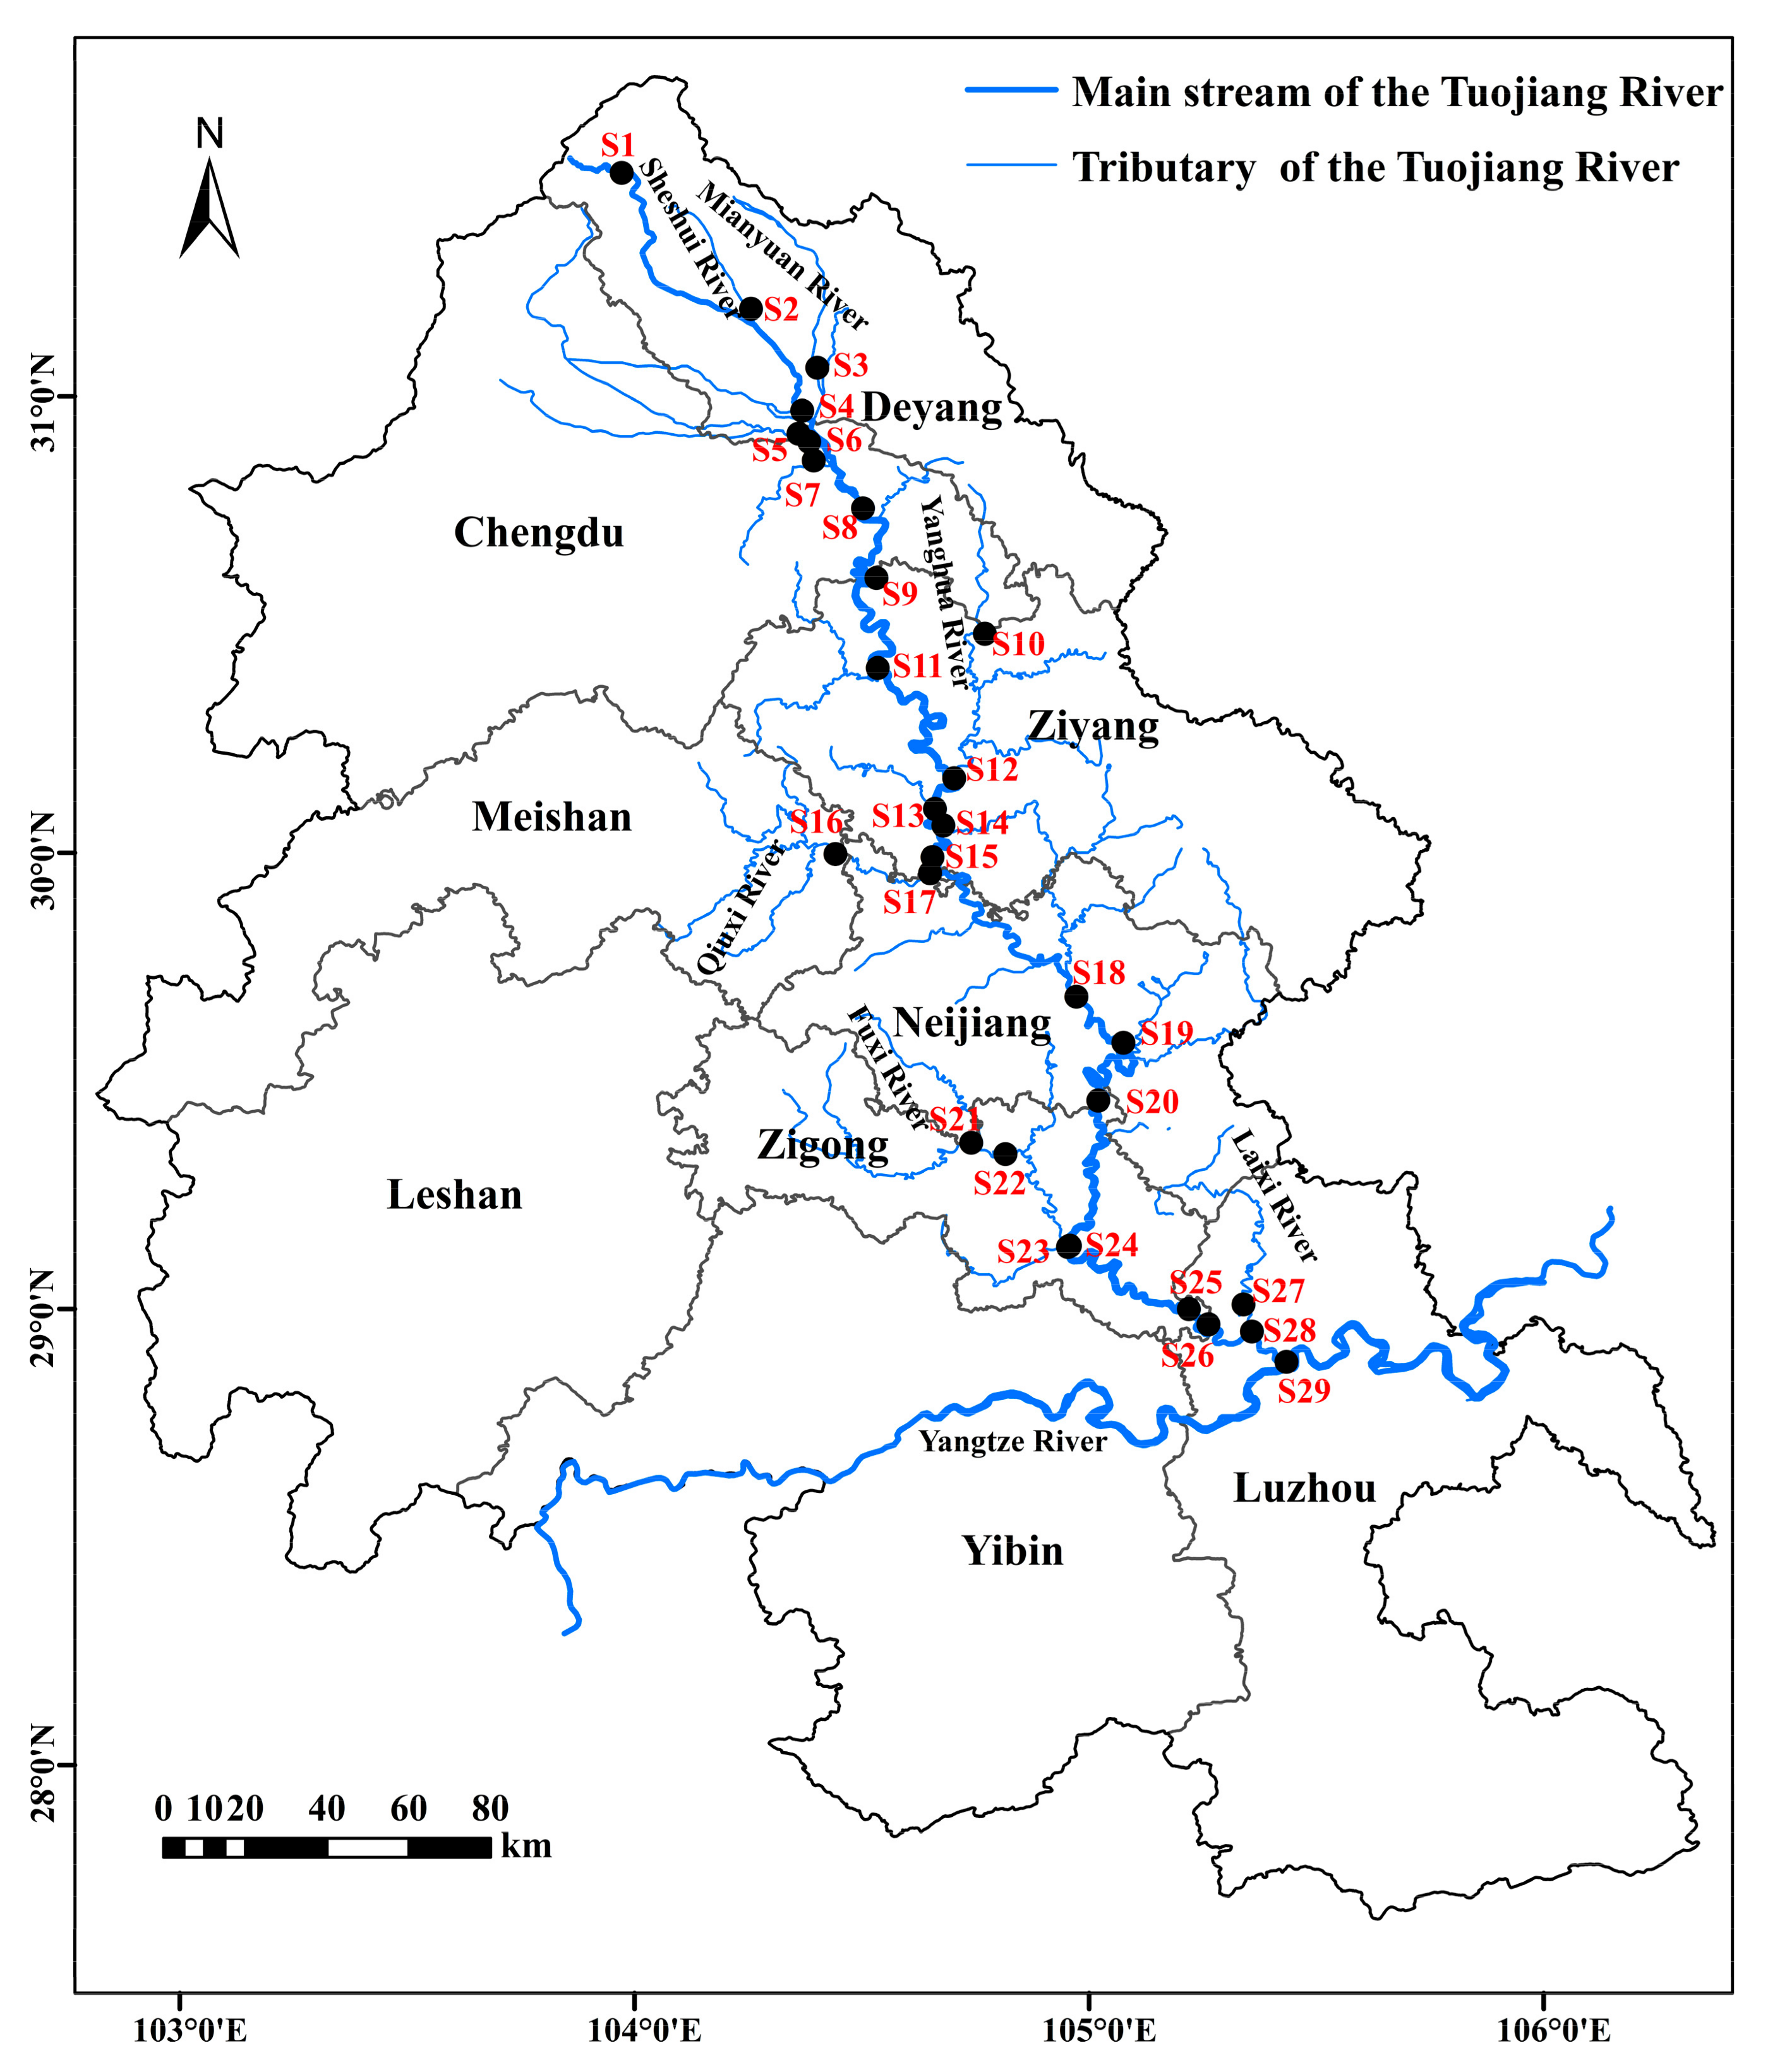
2.1. Study Region and Sampling Sites

The Tuojiang River is a tributary of the upper Yangtze River, located in Southwest China (Sichuan Province). The Tuojiang River is 712 km long and covers an area of 32,900 km2 with an annual average precipitation of 1200 mm and runoff of 35.1 billion m3. The Tuojiang River flows through Deyang, Chengdu, Meishan, Leshan, Ziyang, Neijiang, Zigong, Yibin, and Luzhou (Figure 1), converging with the Yangtze River in the city of Luzhou. The water and sediment samples were collected at twenty-nine sampling sites (S1–S29, Figure 1) from the upper reaches to the lower reaches along the Tuojiang River in September 2020 (dry season), and March 2021 (wet season). These samples can be divided into the upper reaches (S1–S8), middle reaches (S9–S17), and lower reaches (S18–S29). These sampling sites were mainly based on the layout of national control and provincial control monitoring sections of the Tuojiang River. Coordinates of the sampling sites are provided in Table S1.

2.2. Sample Collection

The water samples were collected at a depth of 0.5 m into precleaned polyethylene bottles. Several drops of chloroform were added to inhibit bacterial activity. The water samples were then stored at 4 °C within a portable refrigerator. All water samples were immediately transported to the laboratory for total dissolved phosphorus (DTP), SRP, and TP analysis. During the sampling period, water temperature (T), pH (PH-W), DO, electrical conductivity (EC), and reduction–oxidation potential (OPR) were measured using a portable multiparameter meter (Orion Star A Portable, Thermo Scientific, Waltham, MA, USA).
In this study, the sediments were collected from the riverbed. Approximately 1.0 kg of surface sediment samples (0–5 cm) at each site were collected using a grab sampler and placed into acid-rinsed polyethylene plastic bags. The sediment in contact with or within 1 cm of the metallic sides of the grab sampler was not collected [19]. Each sample consists of a mixture of three samples from one sampling site and were transported to the laboratory within a portable refrigerator at 4 °C. The sediment sample was then freeze-dried and sieved using a 100 mm diameter mesh before the experiment to ensure homogeneity prior to analyze sediment pH (PH-S), organic matter (OM), particle size, and phosphorus fractions.

2.3. Sample Analysis

After digestion with potassium persulfate in an autoclave (120 °C, 0.5 h), TP, TDP, and SRP (without digestion) were analyzed using the ammonium molybdate spectrophotometric method [20], summarized briefly as the following: 1.0 mL ascorbic acid (C6H8O6) solution was added to the 50.0 mL mixture of samples and deionized water (1:1, v/v), after 30 s, 2.0 mL molybdate solution was added and mixed thoroughly. Absorbance of the solution was measured at 700 nm by a UV–Visible spectrophotometer (UV-8000S, Shanghai Yuantong Instrument Co., Ltd., Shanghai, China). The PP was assumed to be equivalent to the difference between the TP and TDP. The DOP was calculated by subtracting SRP from TDP. Six phosphorus fractions including Ex-P, Or-P, Fe-P, Ca-P, De-P, and Re-P in sediment were determined using a modified sequential extraction method [1]. The contents of OM and PH-S were determined according to standard methods for soil analysis [21]. In brief, the sediments were thoroughly mixed with deionized water at a ratio (sediment/water) of 1:2.5, then the PH-S was measured. The OM concentrations were determined using oil bath potassium dichromate–sulfuric acid (K2CrO7–H2SO4) and ferrous sulfate (FeSO4) solution titration. The water content (WC) was analyzed by drying the sediment at 105 °C to a constant weight [22]. The grain-size distribution was analyzed using a Mastersizer 2000 laser particle size analyzer to determine the median sediment size (D50): clay (<4 μm), silt (4–63 μm), and sand (>63 μm). The sodium hydroxide (NaOH), hydrochloric acid (HCl), sodium bicarbonate (NaHCO3), potassium persulfate (K2S2O8), ammonium molybdate ((NH4)6Mo7O24·4H2O), potassium antimony tartrate (C8H4K2O12Sb2), sulfuric acid (H2SO4), C6H8O6, acetic acid (CH3COOH), sodium acetate (CH₃COONa), sodium dodecyl sulfate (CHSO4Na), sodium bicarbonate (NaHCO3), and magnesium chloride (MgCl2·6H2O) were purchased from Sinopharm Chemical Reagent Co. Ltd. (Shanghai, China). Deionized water prepared by a Milli-Q ULPHW water purification device (Millipore) was used throughout the experiments. All reagents and solvents used in the samples analysis were of analytical grade.

2.4. Statistical Analysis

A one-way analysis of variance (ANOVA) was used to determine whether there were significant seasonal differences in phosphorus fractions. SPSS 24.0 software (SPSS; Chicago, IL, USA) was applied to analyze the data, with p < 0.05 considered significant. Pearson correlation analysis was conducted to reveal the relationships between phosphorus fractions in the wet and dry seasons by SPSS 24.0. Redundancy analysis (RDA) was conducted to reveal the relationships between phosphorus fractions and influencing factors by Canoco 5.0 (Biometris, The Netherlands). Principal component analysis (PCA) was applied to identify possible sources of phosphorus using Canoco 5.0.

3. Results

3.1. The Physicochemical Parameters of Water and Sediments

The T values in the wet and dry seasons ranged from 16.1 to 24.6 °C (mean = 23.0 °C) and 11.3 to 24.0 °C (mean = 23.0 °C), respectively (Figure 2). The water was alkaline in general, and the PH-W values in the wet and dry seasons ranged from 7.8 to 8.4 (mean = 8.1) and 7.7 to 8.5 (mean = 8.2), respectively. The OPR values ranged from 71.8 to 263.3 mV (mean = 222.9 mV) and 283.7 to 576.3 mV (mean = 425.8 mV) in the wet and dry seasons, respectively. The DO values ranged from 5.2 to 8.3 mg L−1 (mean = 7.0 mg L−1) and 6.0 to 9.5 mg L−1 (mean = 8.1 mg L−1) in the wet and dry seasons, respectively. The DO concentrations were generally higher than 7.0 mg L−1, indicating that the water was aerobic. The EC values in the wet and dry seasons ranged from 352.7 to 653.8 μs cm−1 (mean = 499.4 μs cm−1) and 456.2 to 929.0 μs cm−1 (mean = 675.2 μs cm−1), respectively. There was little difference in PH-S, OM, WC, D50, clay, silt, and sand between the wet and dry seasons. The PH-S values ranged from 8.3 to 9.7 (mean = 8.7) and 7.5 to 9.1 (mean = 8.4) in the wet and dry seasons, respectively. The OM values ranged from 1.8 to 50.3 g kg−1 (mean = 14.2 g kg−1) and 2.3 to 29.4 g kg−1 (mean = 13.6 g kg−1) in the wet and dry seasons, respectively. The D50 in the wet and dry seasons ranged from 9.3 to 755.5 μm (mean = 149.5 μm) and 12.3 to 695.5 μm (mean = 129.8 μm), respectively. The clay ranged from 0.1% to 25.2% (mean = 7.1%) and 0 to 23.1% (mean = 8.2%) in the wet and dry seasons, respectively. The silt in the wet and dry seasons ranged from 3.8% to 80.1% (mean = 34.3%) and 4.0% to 80.1% (mean = 39.3%), respectively. The sand ranged from 3.2% to 96.1% (mean = 58.7%) and 1.0% to 96.0% (mean = 52.6%) in the wet and dry seasons, respectively. The PH-S, OM, D50, clay, silt, and sand were higher in the wet season than in the dry season. The WC was higher in the dry season (mean = 30.0%) than in the wet season (mean = 29.1%). The physicochemical parameters have obvious spatial differences in the whole river. The T values exhibited a moderate increasing trend from the upper reaches to the lower reaches, and EC and OM were higher in the lower reaches than in the middle and upper reaches. The PH-W, OPR, DO, WC, PH-S, clay, and silt were higher in the middle reaches than in the upper and lower reaches. The D50 and sand were higher in the upper reaches than in the middle and lower reaches. In general, the sediment particles are gradually refined from upper reaches to the lower reaches in the Tuojiang River.

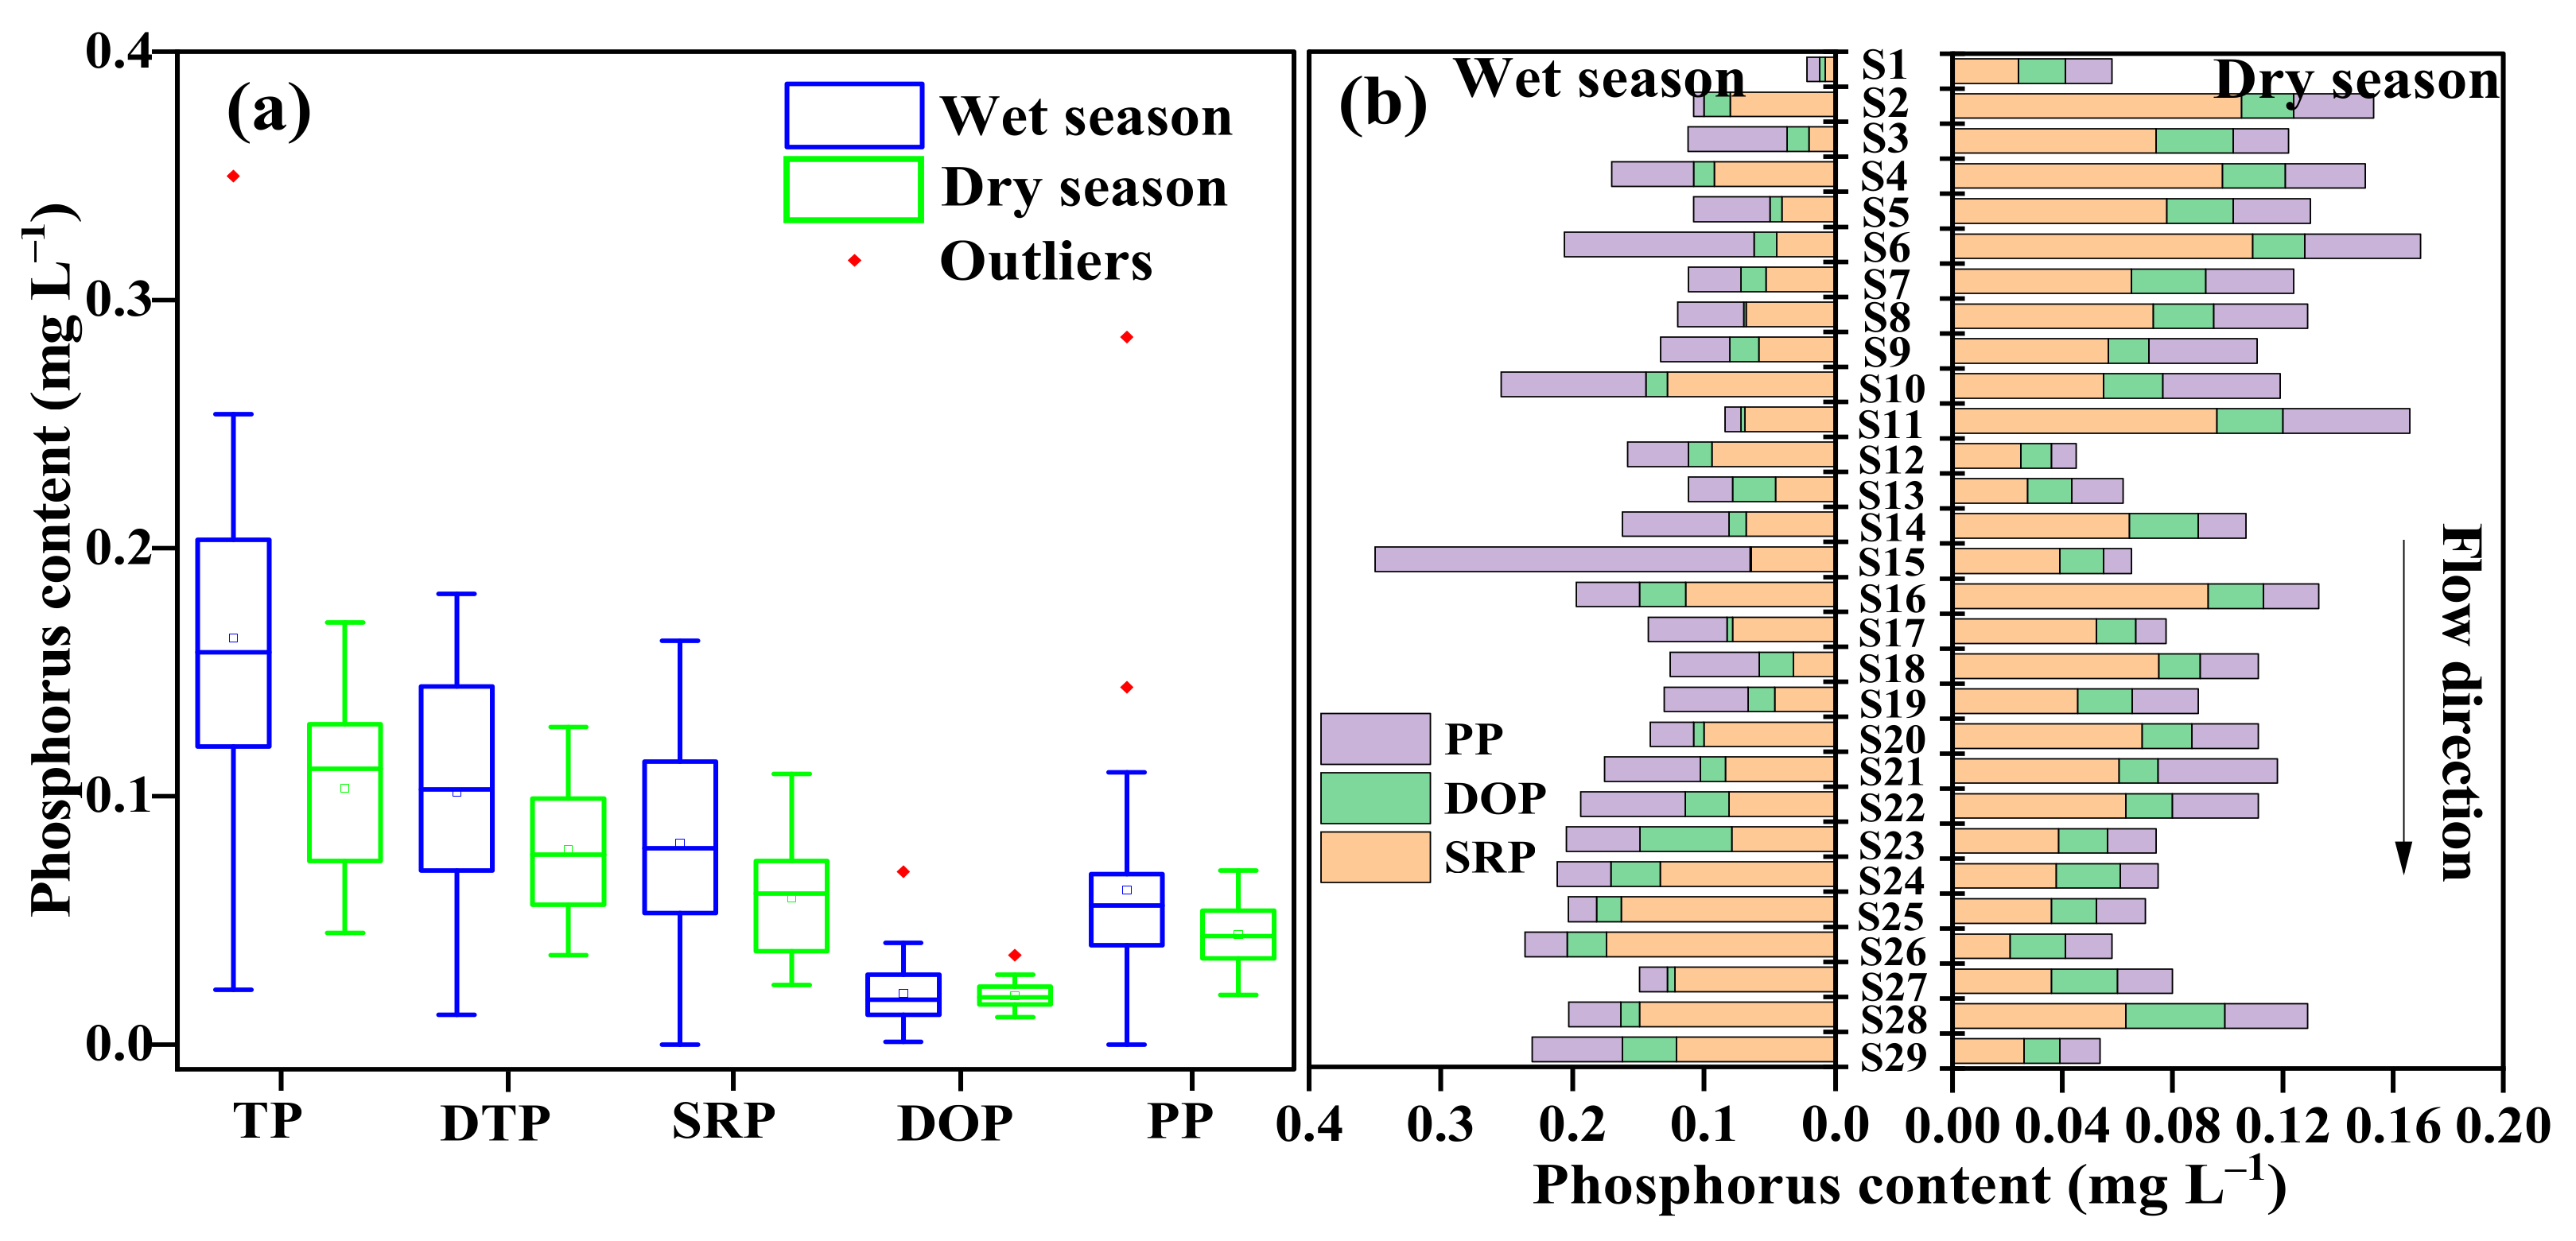
3.2. Spatial–Temporal Distribution of Phosphorus Fractions in the Water

The TP-W concentrations were 0.022–0.350 mg L−1 (mean = 0.164 mg L−1) and 0.045–0.170 mg L−1 (mean = 0.103 mg L−1) in the wet and dry seasons, respectively (Figure 3a). This result was consistent with a previous study conducted in the Tuojiang River [11]. The DTP concentrations were 0.012–0.204 mg L−1 (mean = 0.103 mg L−1) and 0.036–0.128 mg L−1 (mean = 0.079 mg L−1) in the wet and dry seasons, respectively. SPR was the dominant phosphorus fraction in all the samples, with concentrations ranging from 0.008 to 0.174 mg L−1 (mean = 0.083 mg L−1) and 0.021 to 0.109 mg L−1 (mean = 0.059 mg L−1) in the wet and dry seasons, respectively. The DOP concentrations were 0.001–0.070 mg L−1 (mean = 0.020 mg L−1) and 0.011–0.036 mg L−1 (mean = 0.020 mg L−1) in the wet and dry seasons, respectively. The PP concentrations were 0.008–0.285 mg L−1 (mean = 0.061 mg L−1) and 0.009–0.046 mg L−1 (mean = 0.025 mg L−1) in the wet and dry seasons, respectively. The TP-W, DTP, SRP, and PP concentrations had significant seasonal variations (p < 0.05). DOP had no significant seasonal variations (p > 0.05). The DTP and SRP concentrations shared the same spatial distribution pattern as the TP concentration in the dry season (Figure 3b). The TP-W concentrations were relatively high at S15, S10, and S26, and S6, S11, and S2 in the wet and dry seasons, respectively.

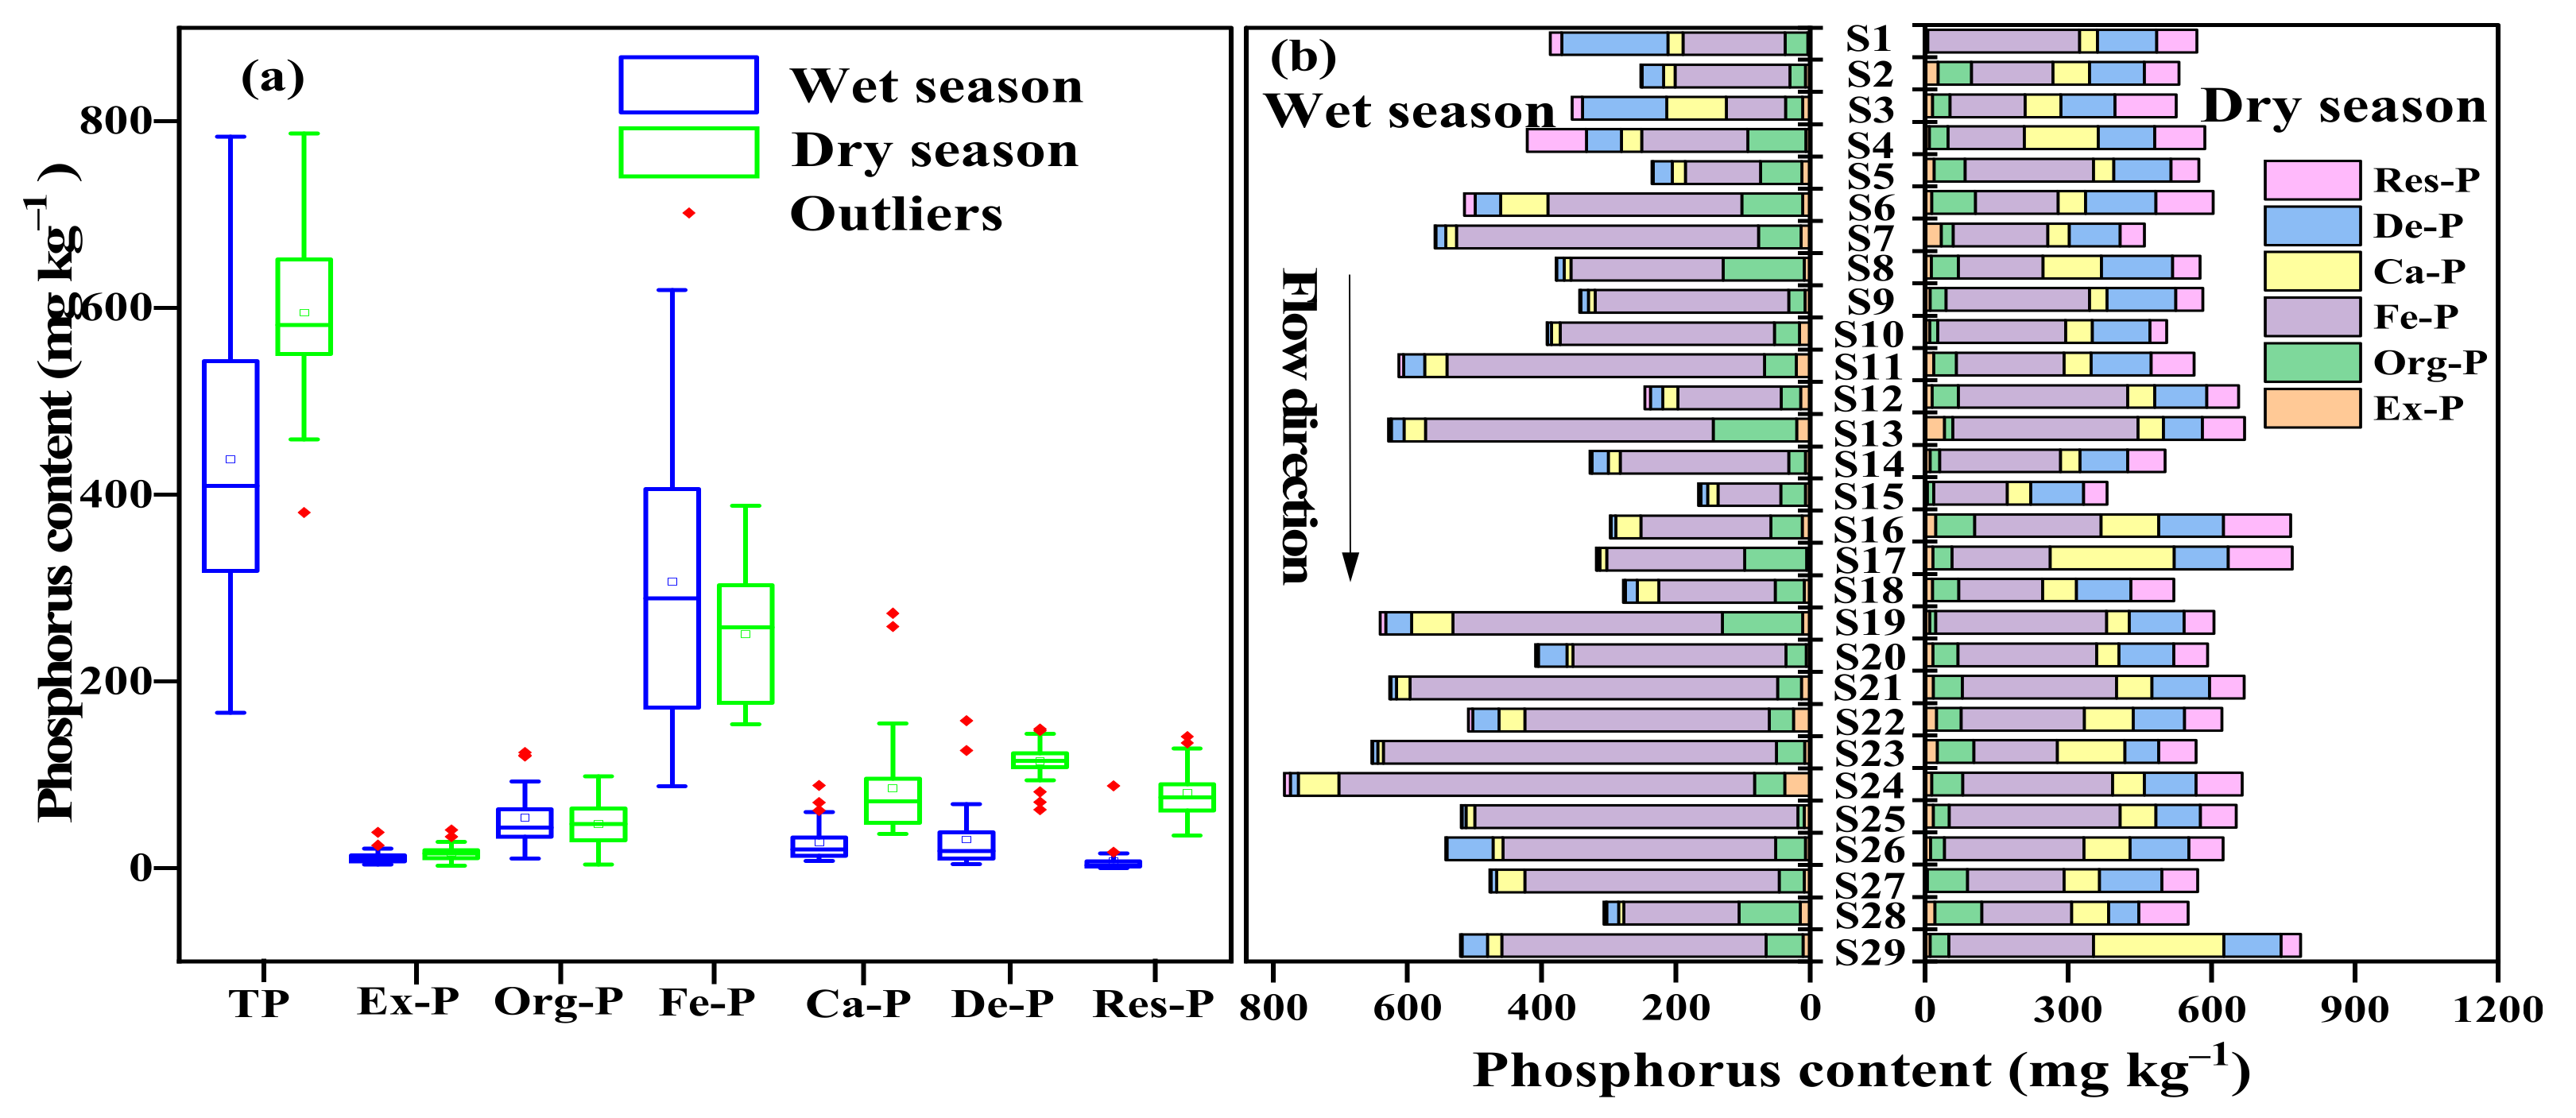
3.3. Spatial–Temporal Distribution of Phosphorus Fractions in the Sediment

The TP-S concentrations were 166.5–783.2 mg kg−1 (mean = 438.2 mg kg−1) and 380.8–786.6 mg kg−1 (mean = 594.7 mg kg−1) in the wet and dry seasons, respectively (Figure 4a). The TP-S concentration was higher in the dry season than in the wet season. Compared with the background value of 453 mg kg−1 for soil phosphorus in Sichuan Province [18], the sediment of the Tuojiang River exhibited a certain degree of phosphorus pollution. The Ex-P concentrations were 3.9–38.2 mg kg−1 (mean = 12.0 mg kg−1) and 2.7–41.0 mg kg−1 (mean = 16.6 mg kg−1) in the wet and dry seasons, respectively. Org-P concentrations ranged from 10.0 to 124.0 mg kg−1 (mean = 53.8 mg kg−1) and 3.9 to 98.2 mg kg−1 (mean = 47.3 mg kg−1) in the wet and dry seasons, respectively. The Fe-P was the dominant phosphorus fraction in all the samples, with concentrations ranging from 87.9 to 619.0 mg kg−1 (mean = 306.6 mg kg−1) and 154.0 to 388.0 mg L−1 (mean = 250.7 mg kg−1) in the wet and dry seasons, respectively. Ca-P concentrations ranged from 7.9 to 88.6 mg kg−1 (mean = 27.5 mg kg−1) and 36.6 to 273.0 mg kg−1 (mean = 85.6 mg kg−1) in the wet and dry seasons, respectively. The De-P ranged from 4.2 to 158.0 mg kg−1 (mean = 30.8 mg kg−1) and 36.6 to 273.0 mg kg−1 (mean = 114.2 mg kg−1) in the wet and dry seasons, respectively. The Res-P concentrations ranged from 0.4 to 88.2 mg L−1 (mean = 7.5 mg kg−1) and 35.2 to 141.0 mg kg−1 (mean = 80.3 mg kg−1) in the wet season and dry seasons, respectively. The mean concentrations of Org-P and Fe-P were higher in the wet season than in the dry season. The TP-S, Ex-P, Ca-P, De-P, and Res-P concentrations had significant seasonal variations (p < 0.05). The Fe-P and Org-P had no significant seasonal variations (p > 0.05). The Fe-P concentrations shared the same spatial distribution pattern as the TP-S concentrations (Figure 4b). The TP-S contents were relatively high at S24, S23, and S19 in the wet season, and at S20, S29, and S17 in the dry season. The Fe-P contents were relatively high at S21, S23, and S24 in the wet season and at S13, S19, and S25 in the dry season, which indicated significant phosphorus pollution and high potential for sediment release at these sampling sites.

4. Discussions

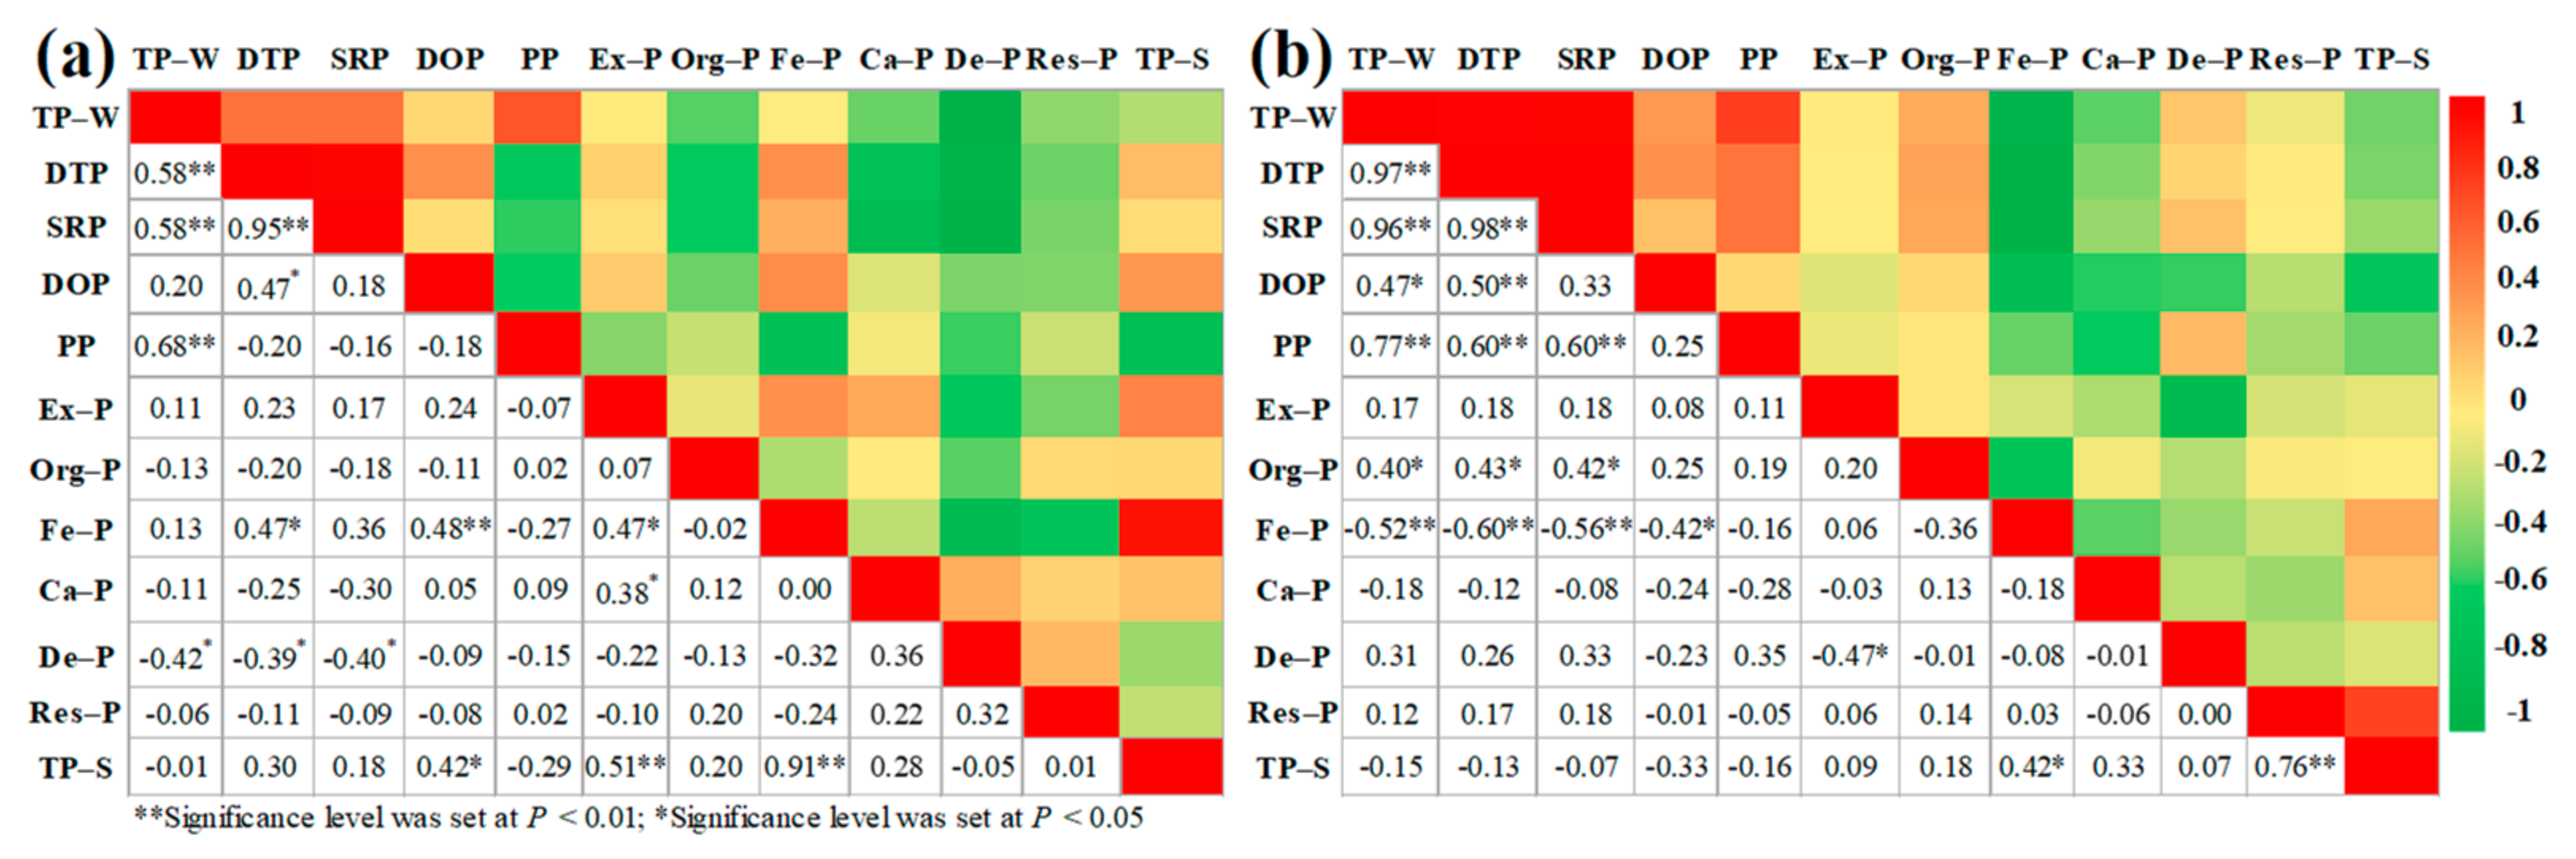
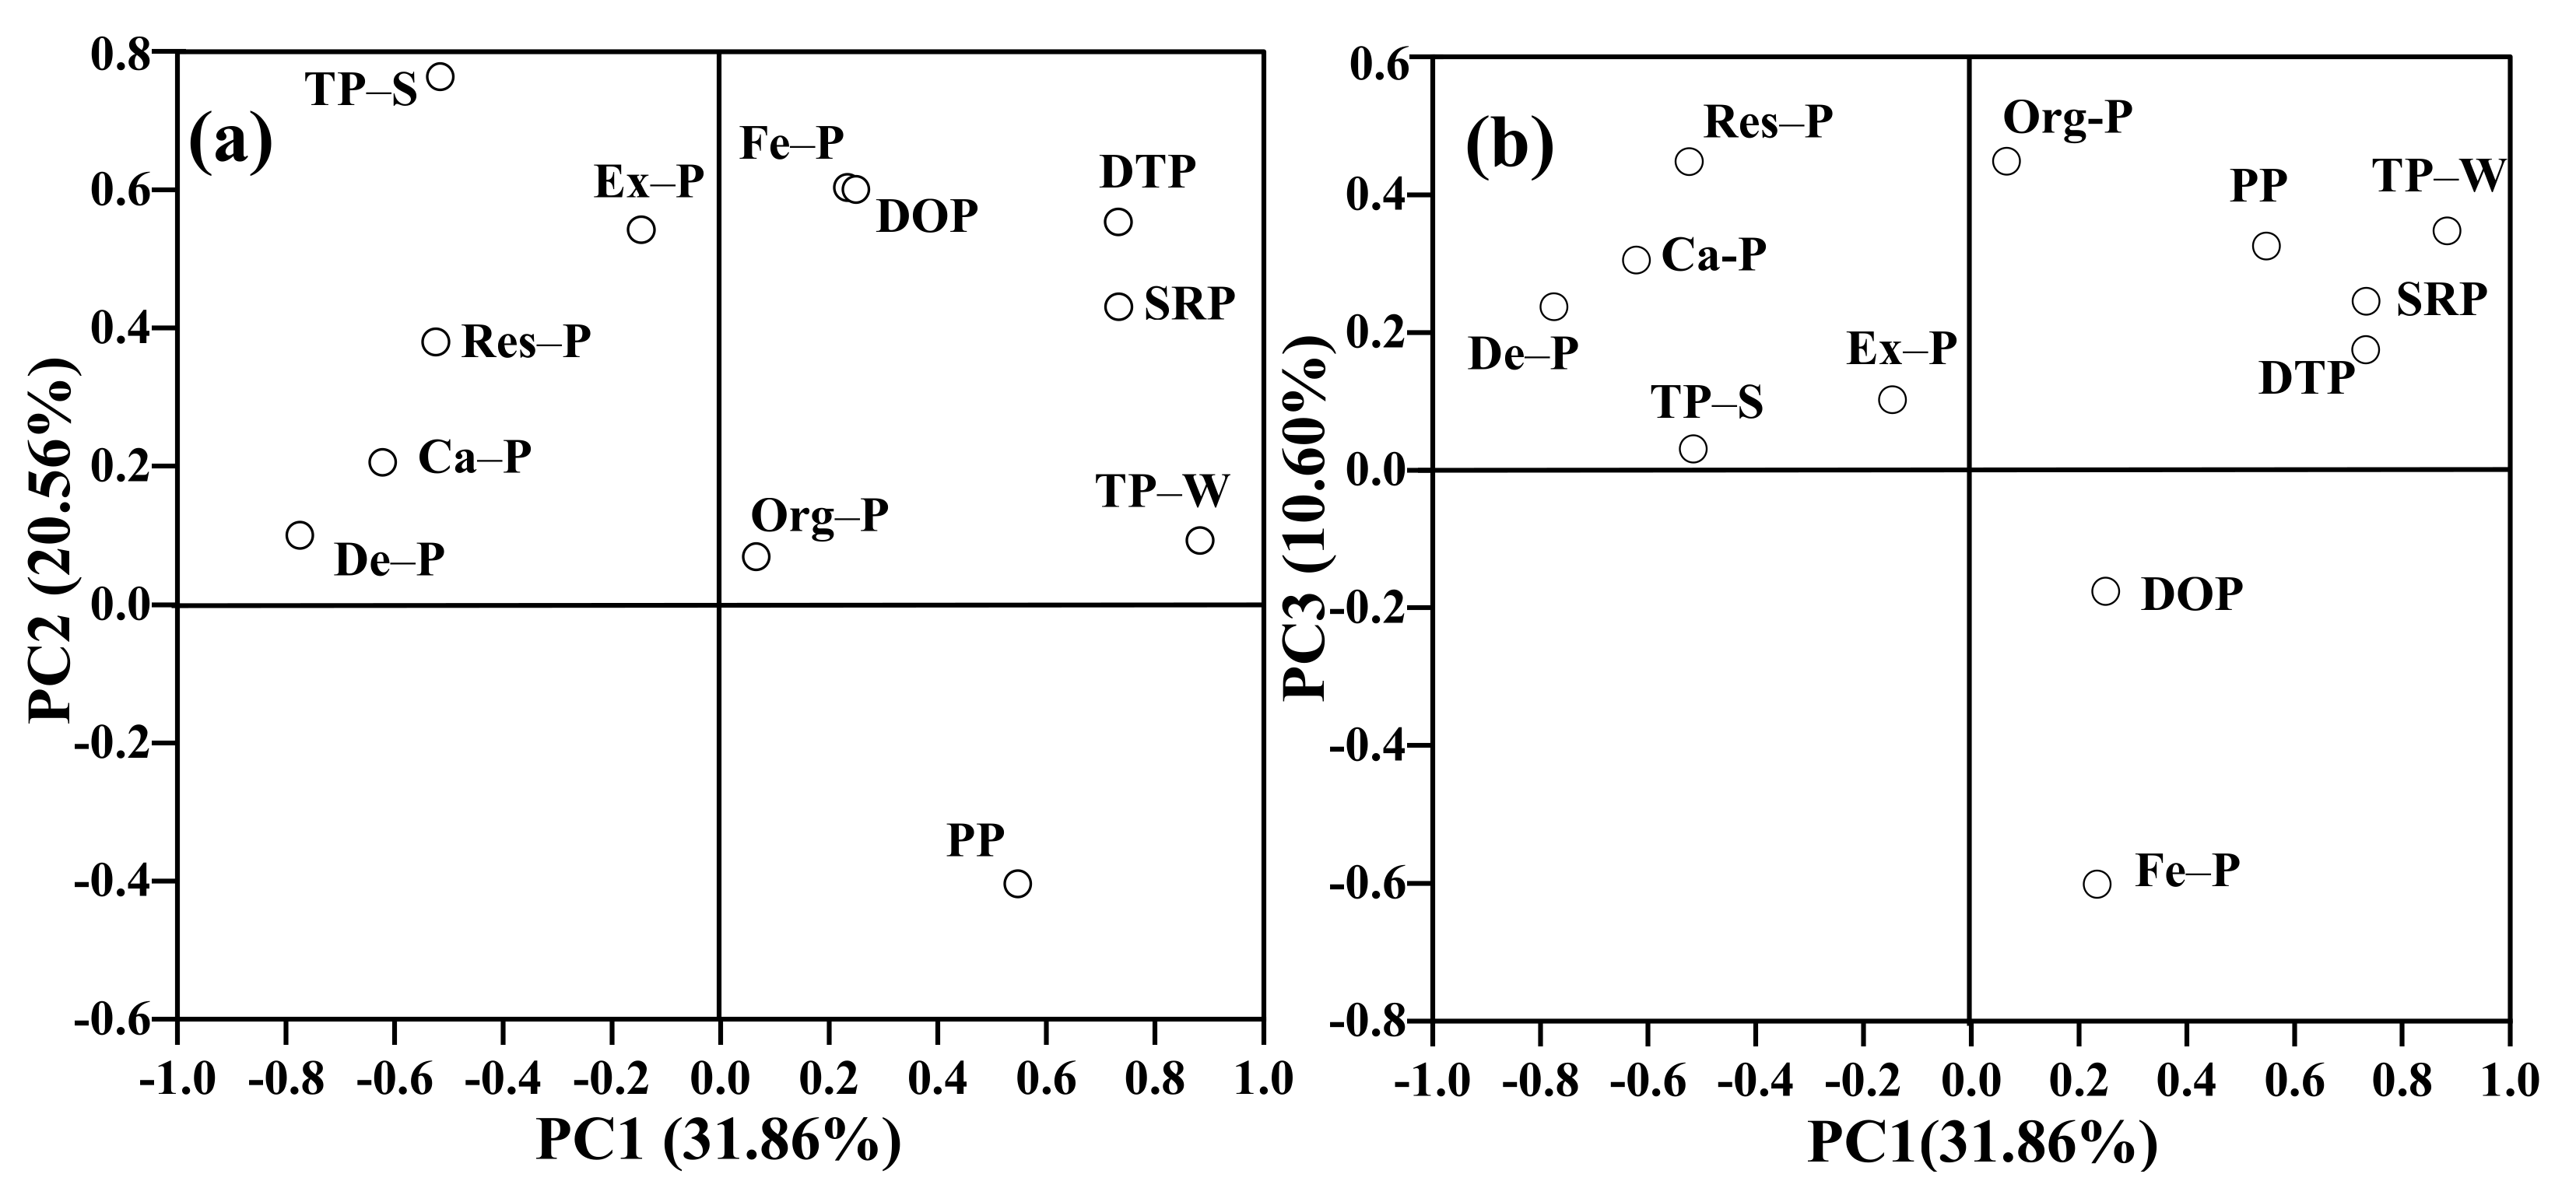
4.1. Relationship between Phosphorus Fractions in the Water–Sediment Phases

The TP-W was positively and strongly correlated with DTP, SRP, and PP. The DTP was positively correlated with SRP and DOP in the Tuojiang River (Figure 5a,b). The TP-W was positively correlated with DOP in the dry season (Figure 5b). These findings indicated that the TP-W was affected by all phosphorus fractions of water in the dry season; however, the influence of DOP on TP-W was not obvious in the wet season. In addition, the PP was positively and strongly correlated with DTP and SRP in the dry season, which indicated the conversion between PP and DTP and SRP. The TP-S was positively and strongly correlated with Fe-P in both the wet and dry seasons, which indicated that Fe-P was the dominating phosphorus fraction in the Tuojiang River. The Fe-P was considered to be the major component entering the adsorption–desorption reaction when environmental conditions change [3]. In the wet season, the TP-S was positively and strongly correlated with Ex-P, and the Ex-P was positively correlated with Fe-P and Ca-P (Figure 5a). The Ca-P is considered to be nonbioavailable and relatively stable in sediments, especially in alkaline environments [7]. A previous study showed that Ex-P contains phosphorus released from CaCO3-associated phosphorus [8]. However, in the dry season, the TP-S was positively and strongly correlated with Res-P (Figure 5b), which was consistent with a previous study [16]. The Ex-P was negatively correlated with De-P, which suggests the conversion of Ex-P to De-P. This may result in higher De-P in the dry season than in the wet season (Figure 4a). In the wet season, the TP-S was positively correlated with DOP, the Fe-P was positively and strongly correlated with DTP and DOP, and the De-P was negatively correlated with TP-W, DTP, and SRP, which suggests that the TP-S and Fe-P might be exchanged with phosphorus in the water [9]. In the dry season, Org-P was positively correlated with TP-W, DTP, and SRP. The Fe-P was negatively correlated with TP-W, DTP, SRP, and DOP. It was reported that the Fe-P could be easily released from sediments, hence being the major fraction influencing the phosphorus distribution in the water [9]. The results indicated that phosphorus contents in the water were influenced by the adsorption–desorption balance between water and sediments. As a potential phosphorus source to water, the Fe-P, Org-P, and TP-S were available for the evaluation of phosphorus interactions in water–sediment phases in the Tuojiang River.

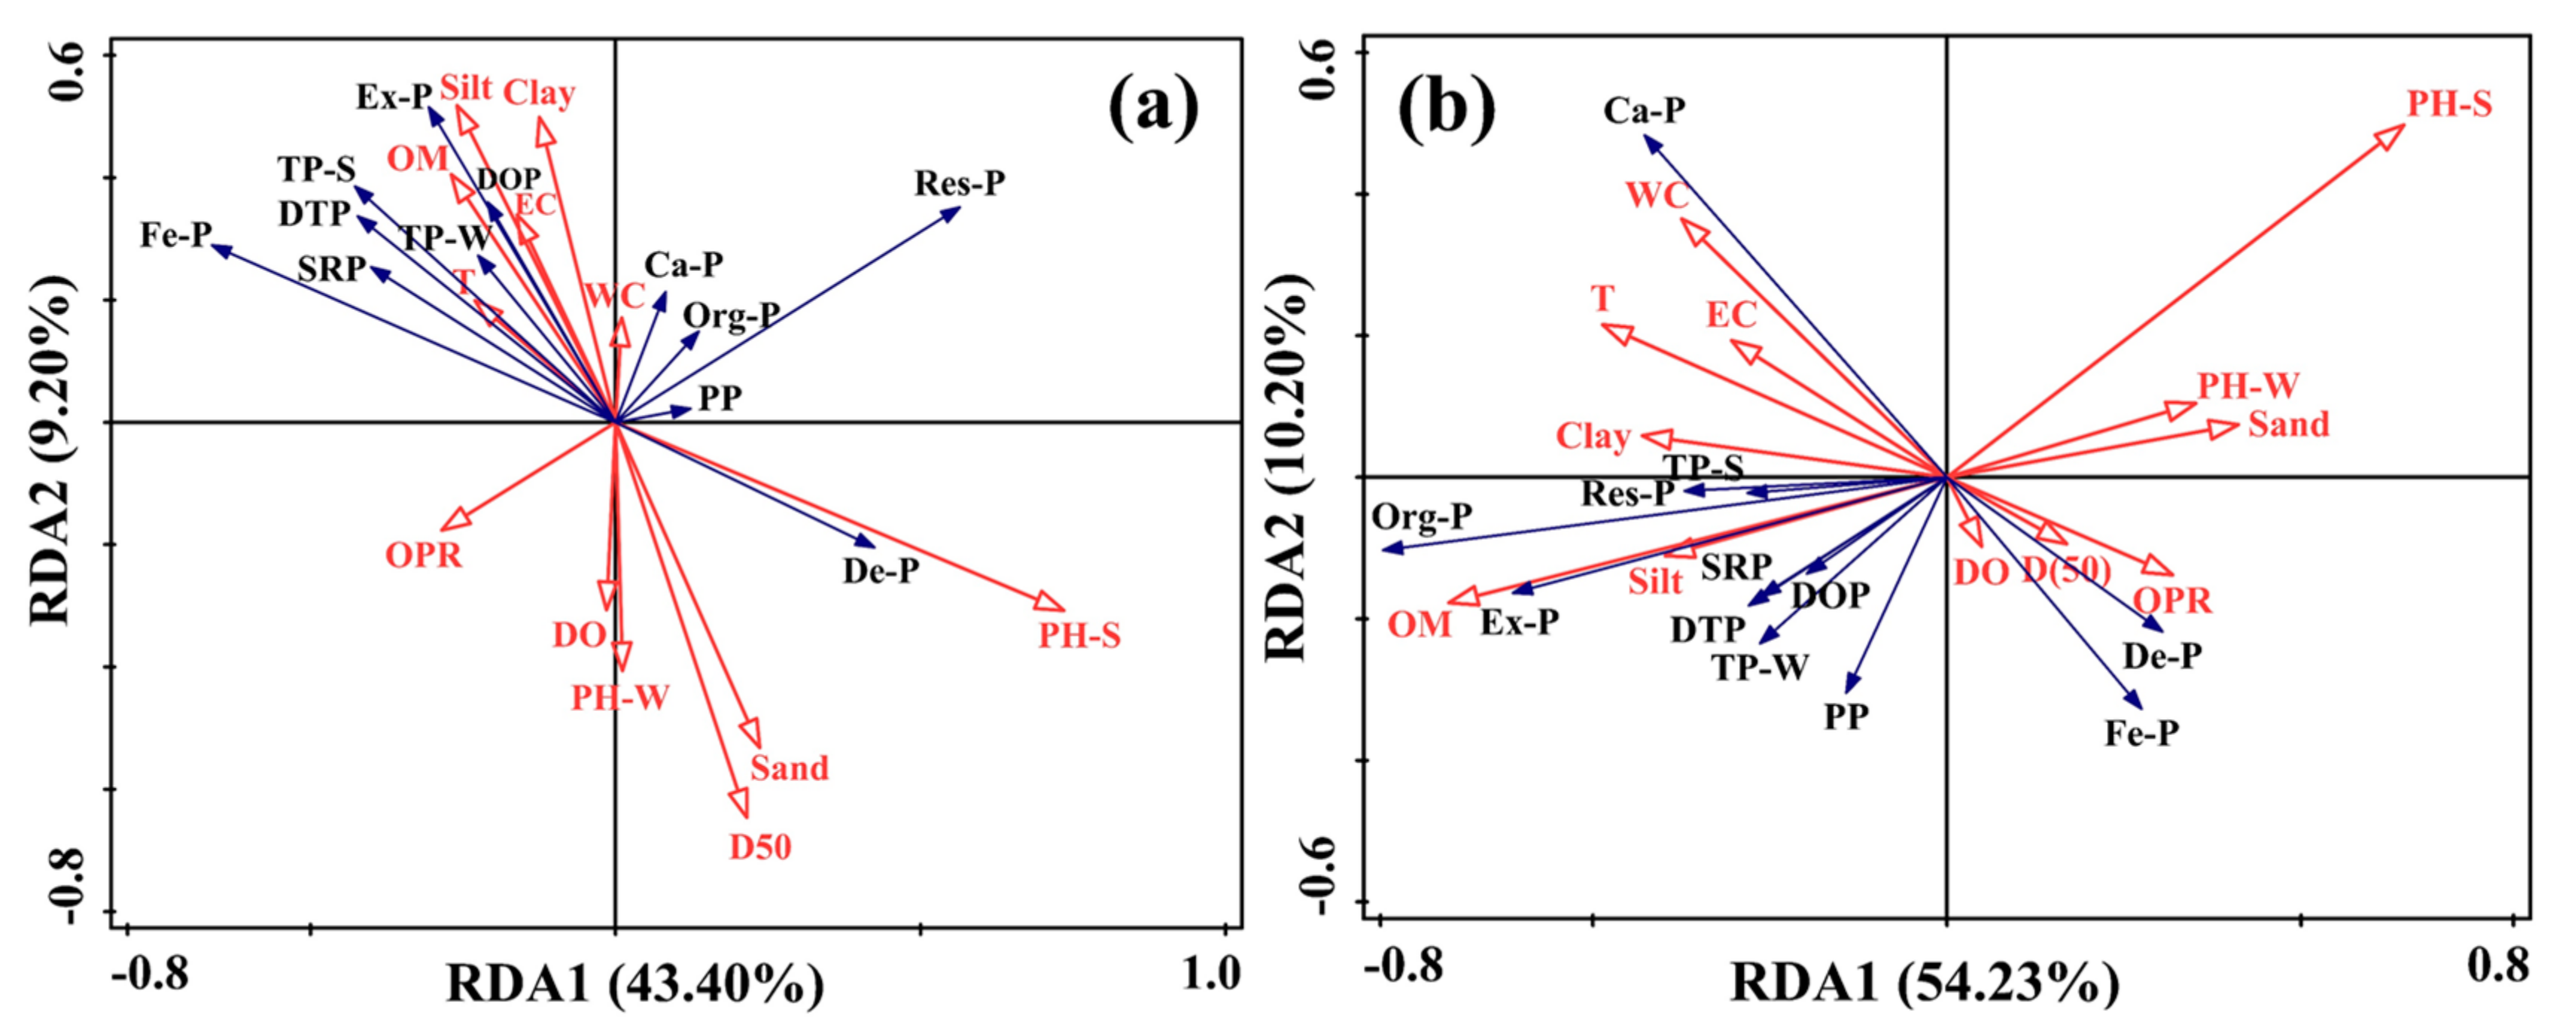
4.2. Effect of Physicochemical Properties of Water and Sediments on Phosphorus Fractions

The temporal and spatial differences in physicochemical properties of water and sediment may have led to the differences of phosphorus fractions observed in this study, which was consistent with previous studies [7,18]. These properties include T, PH-W, DO, EC, and OPR of the water samples and PH-S, OM, WC, D50, and particle size of the sediment samples. The first two axes of RDA were 43.40% and 9.20% in the wet season (Figure 6a), and 54.23% and 10.20% in the dry season (Figure 6b), which explained a high proportion of the variance. The spatial and temporal distribution of phosphorus fractions has a close relationship with environmental factors. In the wet season, the PH-S was positively correlated with PP, Ca-P, De-P, and Res-P. The Tuojiang River presents high alkalinity values and is usually above pH of 8. High PH-S can promote the release of Fe-P and decrease the phosphorus-binding capacity of iron compounds [23]. The OM was positively correlated with all the phosphorus fractions (except Fe-P and De-P). The increase in OM enhanced the phosphorus adsorption of sediment [24]. PH-W had a negative correlation with all the phosphorus fractions (except Fe-P and De-P). This was consistent with previous studies [18]. The PH-W can affect the mineralization rate of sediment, and acidic or alkaline water can promote phosphorus exchange in water–sediment phases [7]. The T, DO, EC, OPR, and WC values had few effects on the occurrence of phosphorus fractions. In the dry season, PH-S had a negative correlation with all the phosphorus fractions (except Fe-P and De-P). The T and OM were positively correlated with all the phosphorus fractions (except Fe-P and De-P). The increased T values can strengthen microbial activity in water, thus promoting phosphorus release from sediment [25]. The WC and EC had a positive correlation with all the phosphorus fractions (except Fe-P, De-P, and Re-P), which indicated that WC and EC increased, the Fe-P, De-P, and Re-P decreased, and the phosphorus fractions increased in water. The PH-W, DO, and OPR had few effects on the distribution of phosphorus fractions. In the wet and dry seasons, the D50 was negatively correlated with all the phosphorus fractions (except De-P). The clay and silt were positively correlated with all the phosphorus fractions (except De-P). The sand had a negative correlation with all the phosphorus fractions (except De-P). Fine particles could adsorb more dissolved phosphorus due to their larger surface area per unit mass of particles [1]. However, the De-P was mainly concentrated in medium and coarse sediments, which indicated that the coarser the sediments were, the higher the concentrations of De-P [26]. This explained that the De-P was higher in the upper reaches than in the middle and lower reaches (Figure 4b). The PH-S and OM were the major environment factor that affected the abundance and distribution of phosphorus fractions, which explained 12.70% (p = 0.008) and 16.80% (p = 0.002) in the wet and dry seasons, respectively. The abundance and distribution of phosphorus fractions were attributed to the combined effect of physicochemical properties of water and sediments. The concentrations of TP-W and PP were highest at S15. The highest concentrations of DTP and SRP were found at stations S26. The concentrations of TP-S and Ca-P were highest at S29 in the dry season. The highest concentrations of Ex-P and Res-P were found at S13 and S16 in the wet season, respectively. The highest concentrations of Fe-P were found at S24 in the wet season. The distribution of these phosphorus fractions was possibly due to the discharge of local pollution sources. Other factors, such as the PH-S and the OM content of sediment, can also affect the concentration of phosphorus fractions.

4.3. Identification of the Sources of Phosphorus in the Tuojiang River

The first three PCs explained 63.02% of the phosphorus fraction variation, and PC1 explained 31.86% of the variation. PC1 was negatively correlated with Ca-P, De-P, and Res-P, which suggested that the sources of these three phosphorus fractions may have mainly originated from soil erosion and agricultural production [25,27]. PC1 was positively correlated with TP-W, DTP, SRP, and PP, which suggested that these phosphorus fractions may have originated from anthropogenic activities other than soil erosion and agricultural production. The PC2 accounts for 20.56% of the variation and was correlated with TP-S, Fe-P, Ex-P, and DOP. Fe-P was an effective indicator of industrial and domestic emissions [25]. Therefore, these phosphorus fractions may have been derived from great quantities of domestic and industrial wastewater emissions into the Tuojiang River. The PC3 accounts for 10.60% of the variation and showed a high positive loading on Org-P only (Figure 7b). Aquatic plant residues, algae, and agricultural nonpoint-source pollution all contribute to Org-P in sediments [28]. These results were consistent with previous studies [13].
The mean concentrations of all phosphorus fractions of water in the Tuojiang River were higher in the wet season than in the dry season, likely due to increased surface runoff and stream inputs, which are major pathways for phosphorus and organic matter transport from terrestrial to aquatic environments [29,30]. The TP-S was higher in the dry season, which may be due to aquatic plants being in a period of rapid growth and sediments providing nutrients for plant growth in the wet season [22]. The TP-S was larger in the lower reaches than in the upper and middle reaches, which may be attributed to the anthropogenic phosphorus emissions being greater in the lower reaches [2]. Therefore, strengthening anthropogenic pollution management will be necessary for controlling phosphorus emissions into the Tuojiang River.

4.4. Comparison with Previous Studies

Compared to other rivers in China, the TP-W concentration was lower in the Tuojiang River than in the Minjiang River and Qiuxi River (Table 1). The TP-S concentration was lower in the Tuojiang River than in the Yellow River and Minjiang River. These results indicated that phosphorus pollution in the Tuojiang River in 2020 was lighter than that in the Minjiang River in 2016, Qiuxi River in 2018, and Yellow River in 2006–2007 and 2019. The Tuojiang River, Minjiang River, and Qiuxi River are located in Sichuan Province, the upper reaches of the Yangtze River. Anthropogenic phosphorus pollution is serious in Sichuan Province [31]. The TP input in the Yellow River was reported to be higher compared to other major world rivers [32]. The TP-S concentration was higher in the Tuojiang River than in the Yarlung Zangbo River in 2016–2017. This may be due to the fact that the Yarlung Zangbo River is a typical plateau river. The river flows through the Qinghai–Tibet Plateau, where the vegetation in the basin is mostly grassland and sparsely populated, and the degree of industrialization and urbanization is very low [5]. The SRP was the dominant fraction of phosphorus fractions in the water in the Tuojiang River, which was similar to that in the Minjiang River and Qiuxi River. The Ca-P was the dominant phosphorus fraction in the Yellow River and Yarlung Zangbo River. However, the Fe-P was the dominant fraction in the Tuojiang River. Fe-P is usually used to indicate the extent of phosphorus pollution and reflect the scales of the impact of anthropogenic activities on an environment [5]. This result was similar to that reported in the Minjiang River and was consistent with their environmental settings with both intensive industrial and domestic phosphorus emissions in these areas [25].
Compared to some lakes and reservoirs in the Yangtze River basin, the TP-W concentration was higher in the Tuojiang River than that in the Three Gorges Reservoir (upper reaches of the Yangtze River) in 2010, Qingcaosha Reservoir (lower reaches of the Yangtze River) in 2011, and Dongting Lake (middle reaches of the Yangtze River) (Table 1). The TP-S concentration in the Tuojiang River was lower than that in the Three Gorges Reservoir, Qingcaosha Reservoir, and Dongting Lake, while the TP-S concentration was slightly higher than that in Haizi Lake (middle reach of the Yangtze River) in 2011. This variation may be due to the decrease in water velocity and the extension of hydraulic retention time, which can lead to the retention of nutrients in the sediment of reservoirs and lakes. The SRP was the dominant phosphorus observed in these aquatic environments.
Compared to the seas that were lightly affected by anthropogenic activities, the TP-S and Fe-P concentrations were higher in the Tuojiang River than in the Southern Caspian Sea in 2009, South Eastern Arabian Sea in 2013, South China Sea in 2014, and the East China Sea shelf in 2014. These concentrations confirmed that high anthropogenic phosphorus led to high phosphorus pollution in the Tuojiang River. In addition, the variation of the phosphorus concentration in different aquatic environments may also be related to different sampling time.

4.5. Study Uncertainties and Limitations

The phosphorus fractions in the water–sediment phases are complex due to their spatial and temporal migration processes from various sources to water and sediments, which are both controlled by natural and anthropogenic activities. The correlation of different phosphorus fractions, effects of physicochemical parameters of water and sediments on phosphorus fractions, and possible sources of phosphorus fractions were explored. These results could help to understand the spatial–temporal distribution of phosphorus fractions. However, the limited observations seem be inadequate for revealing the migration and transformation of phosphorus; long-term monitoring is needed to obtain insight into temporal variation of phosphorus fractions, which would improve efficiency of environmental policy and phosphorus pollution management. In addition, sediment may be a source of phosphorus in the water, which needs further confirmation in the future. Moreover, as the environment is dynamic, the samples were collected at different times; therefore, the results’ representativeness of “comparison with previous studies” in Section 4.4 was limited.

5. Conclusions

The spatial–temporal distribution of phosphorus fractions in water and sediments along the Tuojiang River were analyzed in the present study. The main findings of this study can be summarized as follows:
(1)
The average of most phosphorus fractions showed significant seasonal variations, with relatively high contents of phosphorus fractions in water in the wet season and high contents in sediment in the dry season. The SPR and Fe-P were the dominant phosphorus fractions in the water and sediment, respectively. The TP-W, DTP, SRP, and DOP in water and the TP-S, Ex-P, Fe-P, and Ca-P in sediment were larger in the upper reaches than in the middle and lower reaches in the wet season. All the phosphorus fractions (except De-P and Re-P in the sediment) in the water–sediment phases were larger in the lower reaches than in the middle and upper reaches in the dry season.
(2)
The Fe-P, Org-P, and TP in the sediments of the Tuojiang River would be released to the water interface, resulting in an increase in phosphorus in the water. The spatial–temporal distribution of phosphorus fractions was attributed to a superposition of various factors in the Tuojiang River. The PH-S and OM may majorly affect phosphorus fractions with spatial–temporal variations in the Tuojiang River.
(3)
Most phosphorus fractions mainly originated from anthropogenic activities (industrial or domestic wastewater and agricultural production). More attention should be given to strengthening the management of anthropogenic sources in the Tuojiang River.

Supplementary Materials

The following supporting information can be downloaded at: https://www.mdpi.com/article/10.3390/w14010027/s1, Table S1: Sampling sites in the Tuojiang River.

Author Contributions

Investigation and writing—original draft, D.L.; Formal analysis, X.L.; Methodology, Y.Z. and Z.L.; Supervision and writing—review and editing, L.B. and Q.Q.; Project administration, J.L. All authors have read and agreed to the published version of the manuscript.

Funding

This research was supported by the Joint Research Project for the Yangtze River Conservation (Phase I) (No. 2019-LHYJ-01).

Institutional Review Board Statement

Not applicable.

Informed Consent Statement

Not applicable.

Data Availability Statement

Data are contained within the article.

Acknowledgments

All authors sincerely thank the anonymous reviewers and the editors for their helpful and constructive comments.

Conflicts of Interest

The authors declare no conflict of interest.

References

  1. Han, C.N.; Zheng, B.H.; Qin, Y.W.; Ma, Y.Q.; Yang, C.C.; Liu, Z.C.; Cao, W.; Chi, M.H. Impact of upstream river inputs and reservoir operation on phosphorus fractions in water-particulate phases in the Three Gorges Reservoir. Sci. Total Environ. 2018, 610–611, 1546–1556. [Google Scholar] [CrossRef]
  2. Liu, D.D.; Bai, L.; Li, X.Y.; Zhang, Y.; Qiao, Q.; Lu, Z.B.; Liu, J.Y. Spatial characteristics and driving forces of anthropogenic phosphorus emissions in the Yangtze River Economic Belt, China. Resour. Conserv. Recycl. 2022, 176, 105937. [Google Scholar] [CrossRef]
  3. Pu, J.; Wang, S.R.; Ni, Z.K.; Wu, Y.; Liu, X.F.; Wu, T.; Wu, H.X. Implications of phosphorus partitioning at the suspended particle-water interface for lake eutrophication in China’s largest freshwater lake, Poyang Lake. Chemosphere 2021, 263, 128334. [Google Scholar] [CrossRef]
  4. Yang, B.; Lin, H.; Bartlett, S.L.; Houghton, E.M.; Robertson, D.M.; Guo, L.D. Partitioning and transformation of organic and inorganic phosphorus among dissolved, colloidal and particulate phases in a hypereutrophic freshwater estuary. Water Res. 2021, 196, 117025. [Google Scholar] [CrossRef]
  5. Cheng, X.L.; Huang, Y.N.; Pu, X.C.; An, R.D.; Huang, W.; Li, J.; Wang, W.; Li, R. Spatial and seasonal distribution and transportation of different forms of phosphorus in the middle reaches of the Yarlung Zangbo River. Water 2018, 10, 1858. [Google Scholar] [CrossRef] [Green Version]
  6. Zhang, Z.J.; Wang, Z.D.; Wang, Y.W.; Chen, X.Y.; Wang, H.; Xu, X.; Lin, X.Y.; Czapar, G.F. Properties of phosphorus retention in sediments under different hydrological regimes: A laboratory-scale simulation study. J. Hydrol. 2011, 404, 109–116. [Google Scholar] [CrossRef]
  7. Tang, X.Q.; Wu, M.; Li, R. Phosphorus distribution and bioavailability dynamics in the mainstream water and surface sediment of the Three Gorges Reservoir between 2003 and 2010. Water Res. 2018, 145, 321–331. [Google Scholar] [CrossRef] [PubMed]
  8. Liu, Q.; Liu, S.L.; Zhao, H.D.; Deng, L.; Wang, C.; Zhao, Q.H.; Dong, S.K. The phosphorus speciations in the sediments up- and down-stream of cascade dams along the middle Lancang River. Chemosphere 2015, 120, 653–659. [Google Scholar] [CrossRef] [PubMed]
  9. Jin, X.D.; He, Y.L.; Kirumba, G.; Hassan, Y.; Li, J.B. Phosphorus fractions and phosphate sorption-release characteristics of the sediment in the Yangtze River estuary reservoir. Ecol. Eng. 2013, 55, 62–66. [Google Scholar] [CrossRef]
  10. Chen, S.B.; Gan, Z.W.; Li, Z.; Li, Y.W.; Ma, X.; Chen, M.Q.; Qu, B.; Ding, S.L.; Su, S.J. Occurrence and risk assessment of anthelmintics in Tuojiang River in Sichuan, China. Ecotoxicol. Environ. Saf. 2021, 220, 112360. [Google Scholar] [CrossRef]
  11. Fu, D.; Wu, X.F.; Chen, Y.C.; Yi, Z.Y. Spatial variation and source apportionment of surface water pollution in the Tuo River, China, using multivariate statistical techniques. Environ. Monit. Assess. 2020, 192, 745. [Google Scholar] [CrossRef] [PubMed]
  12. Zhang, W.Q.; Jin, X.; Cao, H.M.; Zhao, Y.; Shan, B.Q. Water quality in representative Tuojiang River network in Southwest China. Water 2018, 864, 10. [Google Scholar] [CrossRef] [Green Version]
  13. Liu, D.D.; Bai, L.; Qiao, Q.; Zhang, Y.; Li, X.Y.; Zhao, R.N.; Liu, J.Y. Anthropogenic total phosphorus emissions to the Tuojiang River Basin, China. J. Clean. Prod. 2021, 294, 126325. [Google Scholar] [CrossRef]
  14. Yang, G.; Qin, Y.W.; Ma, Y.Q.; Han, C.N.; Liu, Z.C.; Yang, C.C. Phosphorus forms and potential release characteristics of phosphogypsum in Tuojiang River basin. J. Environ. Eng. Technol. 2018, 8, 610–616. (In Chinese) [Google Scholar] [CrossRef]
  15. Cao, Z.J.; Zhang, X.B.; Ai, N.S. Effect of sediment on concentration of dissolved phosphorus in the Three Gorges Reservoir. Int. J. Sediment Res. 2011, 26, 87–95. [Google Scholar] [CrossRef]
  16. Xu, Q.; Liu, X.; Yu, X.P.; Guo, Y.F.; Deng, T.L. Vertical distribution of phosphorus species at the sediment-water interface of the Tuojiang River and its spatial and temporal characteristics. Rock Miner. Anal. 2019, 38, 668–680. (In Chinese) [Google Scholar] [CrossRef]
  17. Wang, L.Q.; Liang, T. Distribution patterns and dynamics of phosphorus forms in the overlying water and sediment of Dongting Lake. J. Great Lakes Res. 2016, 42, 565–570. [Google Scholar] [CrossRef]
  18. Yang, G.; Qin, Y.W.; Han, C.N.; Ma, Y.Q.; Liu, Z.C.; Yang, C.C. Environmental Science. Distribution of phosphorus fractions in surface sediments of Minjiang mainstreams. Environ. Sci. 2018, 39, 2165–2173. (In Chinese) [Google Scholar] [CrossRef]
  19. Otim, O. To freeze, or not to freeze: The impact of subzero temperature on quantifying organic contaminants in ocean sediments. Environ. Sci. Processes Impacts 2019, 21, 1580–1595. [Google Scholar] [CrossRef]
  20. China’s Ministry of Environmental Protection. Water Quality-Determination of Total Phosphorus-Ammonium Molybdate Spectrophotometric Method (GB 11893-89). 1989. Available online: http://c.gb688.cn/bzgk/gb/showGb?type=online&hcno=E3834D3D19D975F69C69CB359BCB762E (accessed on 22 August 2021). (In Chinese)
  21. Bao, S.D. Soil and Agricultural Chemistry Analysis; China Agricultural Press: Beijing, China, 2000. [Google Scholar]
  22. Liu, C.; Du, Y.H.; Yin, H.B.; Fan, C.X.; Chen, K.N.; Zhong, J.; Gu, X.Z. Exchanges of nitrogen and phosphorus across the sediment-water interface influenced by the external suspended particulate matter and the residual matter after dredging. Environ. Pollut. 2019, 246, 207–216. [Google Scholar] [CrossRef]
  23. Cavalcante, H.; Araujo, F.; Noyma, N.P.; Becker, V. Phosphorus fractionation in sediments of tropical semiarid reservoirs. Sci. Total Environ. 2018, 619–620, 1022–1029. [Google Scholar] [CrossRef] [PubMed]
  24. Zhang, B.; Fang, F.; Guo, J.S.; Chen, Y.P.; Li, Z.; Guo, S.S. Phosphorus fractions and phosphate sorption-release characteristics relevant to the soil composition of water-level-fluctuating zone of Three Gorges Reservoir. Ecol. Eng. 2012, 40, 153–159. [Google Scholar] [CrossRef]
  25. Ni, Z.K.; Wang, S.R.; Wu, Y.; Pu, J. Response of phosphorus fractionation in lake sediments to anthropogenic activities in China. Sci. Total Environ. 2020, 699, 134242. [Google Scholar] [CrossRef] [PubMed]
  26. Zhou, F.X.; Gao, X.L.; Yuan, H.M.; Song, J.M.; Chen, C.T.A.; Lui, H.K.; Zhang, Y. Geochemical forms and seasonal variations of phosphorus in surface sediments of the East China Sea shelf. J. Mar. Syst. 2016, 159, 41–54. [Google Scholar] [CrossRef]
  27. Wang, Y.D.; Ouyang, W.; He, M.C.; Han, F.X.; Lin, C.Y. Sorption dynamics, geochemical fraction and driving factors in phosphorus transport at large basin scale. J. Clean. Prod. 2021, 294, 126111. [Google Scholar] [CrossRef]
  28. Jiang, X.; Wen, S.L.; Yao, S.C.; Zheng, X.L.; Kang, D.Y.; Zhong, J.C. Environmental significance of phosphorus existing forms in the sediments of Yuqiao Reservoir in Tianjin. J. Lake Sci. 2018, 30, 628–639. (In Chinese) [Google Scholar] [CrossRef] [Green Version]
  29. Varol, M. Spatio-temporal changes in surface water quality and sediment phosphorus content of a large reservoir in Turkey. Environ. Pollut. 2020, 259, 113860. [Google Scholar] [CrossRef]
  30. Verheyen, D.; Van Gaelen, N.; Ronchi, B.; Batelaan, O.; Struyf, E.; Govers, G.; Merckx, R.; Diels, J. Dissolved phosphorus transport from soil to surface water in catchments with different land use. Ambio 2015, 44, 228–240. [Google Scholar] [CrossRef] [Green Version]
  31. Xu, Y.X.; Wu, X.; Lu, R.; Yang, W.J.; Zhao, Y. Total phosphorus pollution, countermeasures and suggestions of the Yangtze River economic belt. Chin. J. Environ. Manag. 2018, 10, 70–74. (In Chinese) [Google Scholar] [CrossRef]
  32. Pan, G.; Krom, M.D.; Zhang, M.Y.; Zhang, X.W.; Wang, L.J.; Dai, L.C.; Sheng, Y.Q.; Mortimer, R.J. Impact of suspended inorganic particles on phosphorus cycling in the Yellow River (China). Environ. Sci. Technol. 2013, 47, 9685–9692. [Google Scholar] [CrossRef] [PubMed] [Green Version]
  33. Samadi-Maybodi, A.; Saffar, H.T.; Khodadoust, S.; Saravi, H.N.; Najafpour, S. Study on different forms and phosphorus distribution in the coastal surface sediments of Southern Caspian Sea by using UV-Vis spectrophotometery. Spectrochim. Acta Part A 2013, 113, 67–71. [Google Scholar] [CrossRef] [PubMed]
  34. Sudheesh, V.; Movitha, M.; Hatha, A.A.M.; Renjith, K.R.; Resmi, P.; Rahiman, M.; Nair, S.M. Effects of seasonal anoxia on the distribution of phosphorus fractions in the surface sediments of southeastern Arabian Sea shelf. Cont. Shelf Res. 2017, 150, 57–64. [Google Scholar] [CrossRef]
  35. Yang, B.; Liu, S.M.; Zhang, G.L. Geochemical characteristics of phosphorus in surface sediments from the continental shelf region of the northern South China Sea. Mar. Chem. 2018, 198, 44–55. [Google Scholar] [CrossRef]
  36. Bi, D.S.; Guo, X.P.; Cai, Z.H.; Gao, X.F.; Li, Y.; Guo, J.L.; Long, X.J.; Zhong, Z.Q.; Liang, Y.R. Characteristics of various forms of phosphorus and their relationships in the sediments of Haizi Lake, China. Water Sci. Technol. 2012, 66, 2688–2694. [Google Scholar] [CrossRef] [PubMed]
  37. Tong, H.J.; Wei, Y.; Yuan, X.Y.; Yang, M.F.; Chen, J. Study on the characteristics of total phosphorus in the Qiuxi River basin, Renshou, Sichuan. Sichuan Environ. 2019, 38, 23–29. (In Chinese) [Google Scholar] [CrossRef]
Figure 1. Locations of the 29 water and sediment sampling stations (S1–S29) in the Tuojiang River.
Water 14 00027 g001
Figure 2. Spatial–temporal of physicochemical parameters: (a) temperature, (b) pH, (c) dissolved oxygen, (d) electrical conductivity and (e) reduction–oxidation potential of water, and (f) pH, (g) organic matter, (h) water content, (i) median sediment size, and (j) particle size distribution of sediments in the Tuojiang River (S1–S29 are defined in Figure 1).
Water 14 00027 g002
Figure 3. Phosphorus fractions distribution in different seasons (a) and sampling sites (b) in the water of the Tuojiang River (S1–S29 are defined in Figure 1).
Water 14 00027 g003
Figure 4. Phosphorus fractions distribution in different seasons (a) and sampling sites (b) in the sediment of the Tuojiang River (S1–S29 are defined in Figure 1).
Water 14 00027 g004
Figure 5. Correlation analysis of different phosphorus fractions in water–sediment phases in the wet season (a) and dry season (b) in the Tuojiang River.
Water 14 00027 g005
Figure 6. Redundancy analysis diagram between phosphorus fractions and environmental factors of water and sediments in the wet season (a) and dry season (b) in the Tuojiang River.
Water 14 00027 g006
Figure 7. PC1 versus PC2 (a) and PC1 versus PC3 (b) of phosphorus fractions in water and sediment in the Tuojiang River.
Water 14 00027 g007
Table 1. Comparisons of phosphorus concentrations in water–sediment phases in different aquatic environments.
Study AreaSampling TimeTP-WSRPCa-PFe-PTP-SReference
mg L−1mg L−1mg kg−1mg kg−1mg kg−1
Southern Caspian SeaSummer 2009--146.045.7287.0[33]
South Eastern Arabian SeaAugust 2013--294.010.0508.0[34]
South China SeaMarch–April 2014--100.727.3412.9[35]
East China Sea shelfMay–June, October–November 2014--164.021.0466.8[26]
Three Gorges ReservoirOctober and November 20100.100.08431.2–592.80.1–2.2744.9[7]
Qingcaosha ReservoirApril–November 20110.110.05481.741.1649.0[9]
Dongting Lake-0.06-281.5168705.6[17]
Haizi LakeApril 2011-0.4836.455.9503.0[36]
Yarlung Zangbo RiverAugust and November 2016, April 2017--355.612.4408.2[6]
Yellow RiverSeptember and October 2019--517.014.7619.9[27]
Yellow RiverNovember 2006, April 2007-0.01586.515.3650.1[32]
Minjiang RiverDecember 20160.240.0967.082.9745.0[18]
Qiuxi RiverJune 20180.590.37---[37]
Tuojiang RiverSeptember 20200.160.0827.5306.6438.2This study
March 20210.100.0685.6250.7594.7This study
“-“: Not found in the reference.
Publisher’s Note: MDPI stays neutral with regard to jurisdictional claims in published maps and institutional affiliations.

