Article

Optimized Main Ditch Water Control for Agriculture in Northern Huaihe River Plain, Anhui Province, China, Using MODFLOW Groundwater Table Simulations

1
State Key Laboratory of Water Resources and Hydropower Engineering Science, Wuhan University, Wuhan 430072, China
2
Key Laboratory of Water Conservancy and Water Resources of Anhui Province, Anhui & Huaihe River Institute of Hydraulic Research, Bengbu 233000, China
*
Authors to whom correspondence should be addressed.
Water 2022, 14(1), 29; https://doi.org/10.3390/w14010029
Submission received: 29 September 2021 / Revised: 21 December 2021 / Accepted: 21 December 2021 / Published: 23 December 2021

Abstract

:
Controlled drainage by regulating the groundwater level in open ditches is necessary to ensure the normal growth of crops in Northern Huaihe River Plain, China. The groundwater model MODFLOW was calibrated and validated in a representative area, and was then conducted to simulate the groundwater under different main drainage ditch water depth control schemes during the growth period of corn and wheat. Then the scenario with highest water depth (Scenario 20) from 1989 to 2019 was simulated, and the annual cumulative drought and waterlogging intensity (ACDWI) were analyzed in each decade and in different hydrological years. The results showed that the study area was dominated by drought stress. The lowest level of drought stress was achieved under Scenario 20. The frequency of drought gradually decreased from north to south in the study area. Moreover, the ACDWI decreased with increase of precipitation during 1989 to 2019. The results indicated that it was important to store water during the dry season, while it is also necessary to control the drainage in the rainy season to drain excess water on time. The results suggested that the water depth of the main drainage ditch should be regulated by zoning and by season to alleviate crop drought and waterlogging.

1. Introduction

At present, the world’s population is growing at a rate of approximately 1.1% per year. According to the medium-variable scenario of the future population growth model predicted by the United Nations Population Division, the world’s population is expected to reach 9.7 billion by 2050; thus, global food production will need to increase by 70%, and demand for irrigation water will increase by as much as 50% [1]. However, the land area available for agriculture is limited, and the current rate of global groundwater depletion is threatening sustainable groundwater use. Moreover, agricultural drought and waterlogging have become increasingly frequent in recent years and may endanger future agricultural production [2,3]. Consequently, effective water resource management is essential for global food production. Designing a proper drainage system is often an essential component of an overall water management system, and developing a proper drainage control scheme can improve crop production and reduce adverse environmental impacts [4].
Controlled drainage regulates the field groundwater level by adding physical restrictions (controlled hydraulic structures) at the farmland drainage outlet [5,6,7]. After various attempts by researchers, controlled drainage becomes one of the most effective measures taken to date [8]. Open ditches, subdrain tiles, shafts and pumping station drainage are typical farmland waterlogging drainage engineering technical measures. Among these, open-ditch drainage was the earliest to be developed and is the most widely used drainage measure in China [9,10]. Controlled drainage was first proposed in the late 1970s to ensure agricultural production without damaging the environment in which we live and to seek a balance point in harmony with nature [11]. In the rainy season, the water level is kept low to protect crops from waterlogging, while in the dry season, a high water level is maintained for crop utilization to achieve drought resistance and yield increases [12,13]. Controlled drainage is now classified as the best management practice for agricultural production in many regions of Europe and the United States [14,15]. Especially in rain-fed agricultural areas, controlled drainage can be regulated under groundwater according to the drought and waterlogging tolerance characteristics of crops. Thus, such regulation plays an important role in the rational use of rainfall and in reducing of crop drought and waterlogging losses [16].
Agricultural water-management measures change the temporal and spatial water distribution, thereby affecting the balance of surface water and groundwater and changing the groundwater levels’ response [17,18]. However, the depth of the groundwater level also affects crop growth and can lead to varying degrees of drought and waterlogging stresses [19]. Understanding the effect of the groundwater level on crop growth can improve agricultural water management to a certain extent. Groundwater regulation contributes to crop water consumption and can promote crop growth by either reducing drainage and surface irrigation water or increasing the amount of water available for crops to absorb [20]. Moreover, controlled drainage can also maintain an optimal groundwater depth, providing the necessary water, respiration and aeration for the crop roots to increase crop yields [21]. Field experiments can be used to understand the contribution of groundwater to crop water use, but the location specificity and the time required limit their practicality [22]. Instead, numerical models can be used to study the characteristics of temporal and spatial changes in groundwater more deeply and to simulate regional groundwater conditions [23]. The groundwater-flow model MODFLOW is a popular three-dimensional groundwater dynamic simulation model in groundwater research. It uses the finite difference method to solve the groundwater-flow formulas [24,25] and can simulate water movement in an aquifer to obtain the phreatic water level responding to groundwater recharge and large changes in the ditch water levels. Thus, it provides a basis for judging drought and waterlogging conditions for crops [26,27,28,29,30].
Although controlled drainage is considered to be the best method for water management, most of the recent studies focus on controlled drainage using subsurface pipes and are mainly concerned with nutrient loss and environmental pollution [31,32]. In contrast, few studies have focused on the controlled drainage using open ditches. The main purposes of this study are to evaluate the effect of different open ditch control drainage schemes on groundwater as an example area that rely on rain-fed agriculture vulnerable to drought and waterlogging to optimize open-ditch water-depth control schemes in rainy and dry seasons based on the upper and lower limits of the suitable groundwater depth for crops (SGDC), and to analyze the spatial and temporal variation characteristics of these regions to provide a basis for water management in alternating drought and waterlogging zones.

2. Materials and Methods
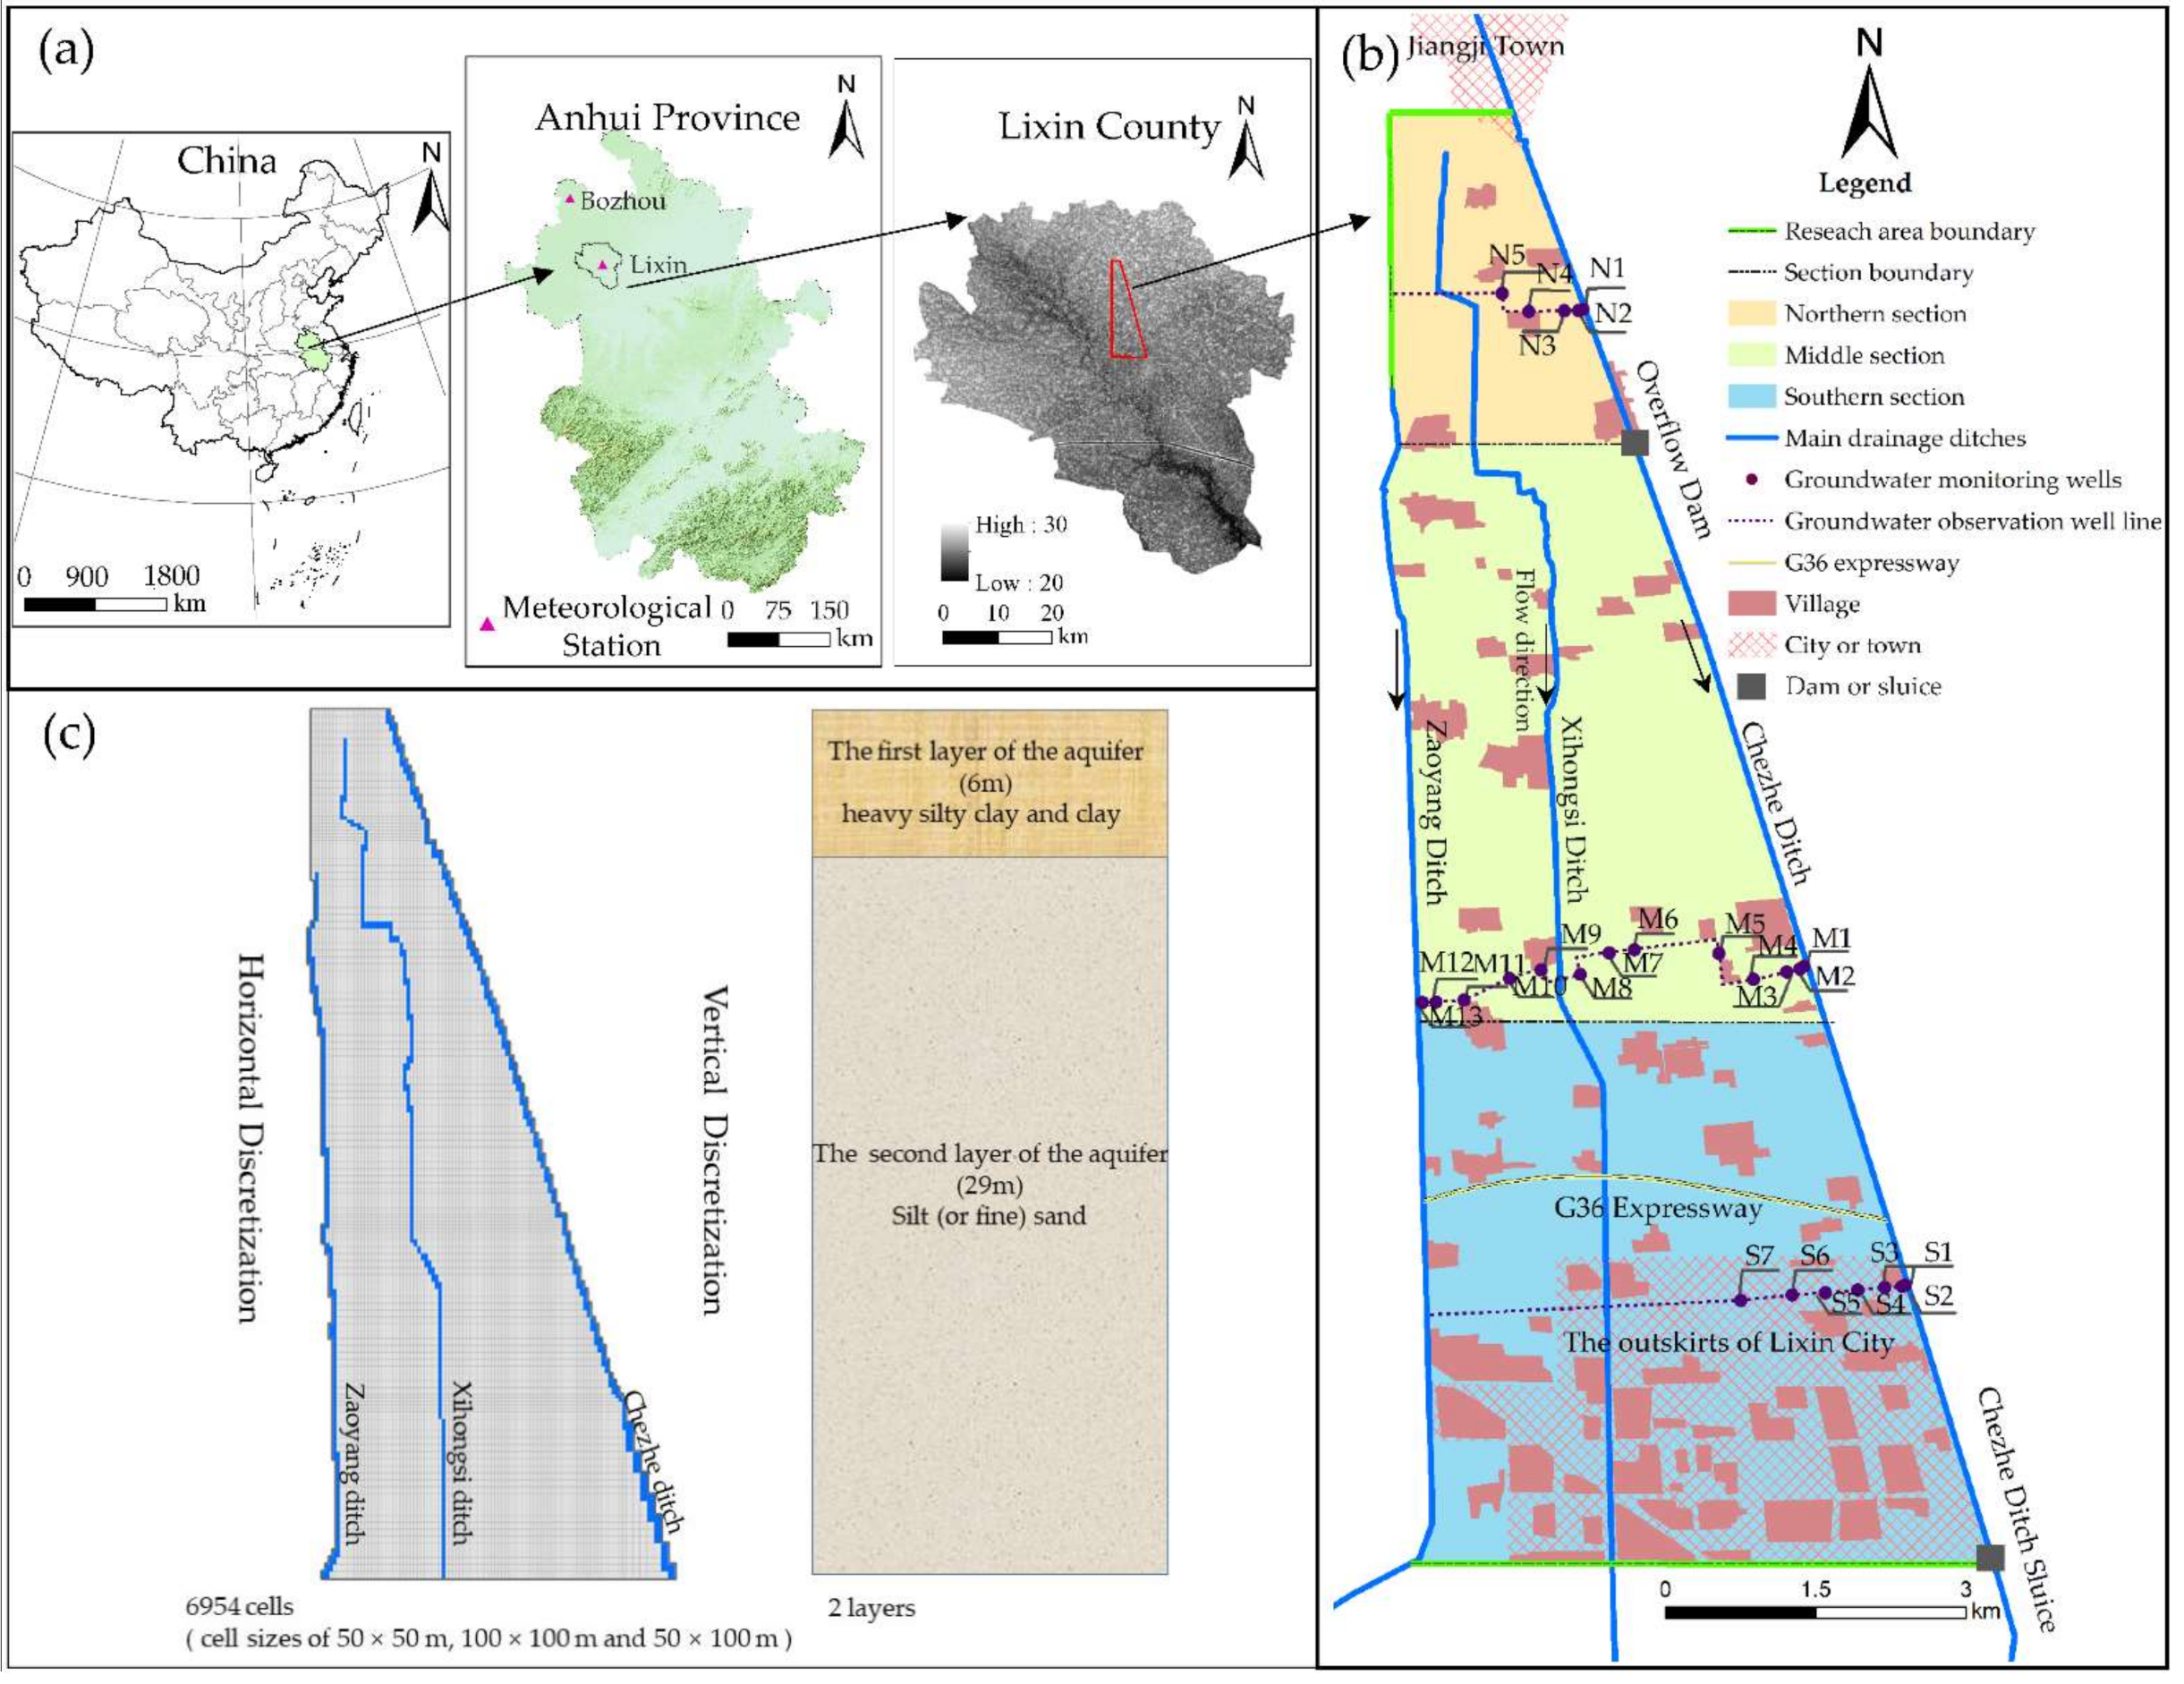
2.1. Study Area

The study area, which is located in the Northern Huaihe River Plain, Anhui Province (33°09′–33°17′ N, 116°08′–116°12′ E), China, is 14.4 km long from north to south, 5.2 km wide from east to west, with an area of 42.6 km2 (Figure 1a,b). The terrain is high in the north and low in the south. According to ASTER GDEM elevation data, the elevation gradually changes from 31.93 to 27.56 m AMSL, with an average gradient of approximately 1:3300. The ASTER GDEM v3 data with 30 m spectral resolutions were obtained from the National Aeronautics and Space Administration (NASA) website (http://reverb.echo.nasa.gov/reverb/, accessed on 20 September 2021).
There are three main drainage ditches in the study area. Their names are, from west to east, the Zaoyang ditch, the Xihongsi ditch and the Chezhe ditch. These three main drainage ditches transport field rainwater and underground drainage southward towards the Fumengxin River and eventually discharge into the Huaihe River. A sluice was installed south of the Chezhe ditch, and it is the main measure used to control drainage in the local area. Another sluice was installed south of the Xihongsi ditch, but it became useless due to disrepair. An overflow dam about 3.7 m in height above the bottom of the drainage ditches was built 11.6 km far from the sluice in the north of Chezhe ditch as another measure to control the ditch water depth. The study area is divided into three sections: the northern section, which is in the upstream of the overflow dam with catchment area 5.0 km2; the middle section, which is between the overflow dam and the location in 5.6 km below the overflow dam with catchment area 15.8 km2; and the southern section, which is between the location in 5.6 km below the overflow dam and the sluice with catchment area 21.8 km2. There are 25 groundwater-level observation wells in the research area: five of them, Nos. N1–N5, are in the northern line, which is about 1.3 km from the overflow dam in north; 13 of the wells, Nos. M1–M13, are in the middle line, which is about 5.5 km from the overflow dam in the south; and seven wells, Nos. S1–S7, in the southern line, which is about 2.8 km from the sluice in the north (Figure 1b). The main soil textures are Shajiang black soil and silt sand. The region is dominated by rain-fed cultivation, mainly for winter wheat and summer corn.
The area has a typical warm temperate subhumid monsoon climate, which is classified according to annual accumulated temperature [33]. Affected by the monsoon climate and geomorphology, there are visible spatial differences and high interannual variations within this study area [33,34]. The study used meteorological data from the Lixin County meteorological station and the Bozhou City meteorological station in Anhui Province and precipitation data from the Lixin County meteorological station, which is located in the south of the study area, at 116°16′ E, 33°08′ N, approximately 1.76 km away from the Chezhe ditch sluice. Because evaporation-related data from the Lixin County meteorological station were not available, data provided by the Chinese Meteorological Administration (Website: http://data.cma.cn/, accessed on 20 September 2021) from the Bozhou city meteorological station—which is located in the north-west of the study area, 115°46′ E, 33°52′ N, 85.5 km away from the Chezhe ditch sluice (for locations see the small triangles in Figure 1a)—were adopted instead. According to the meteorological data, the annual average precipitation for 1989–2019 was 924 mm, of which approximately 64% and 36% were concentrated in June–September (rainy season) and October–May (dry season), respectively. Seasonal drought and waterlogging disasters occur every year and may occur individually or simultaneously, successively or alternately [35]. Drought based on the number of consecutive 15 days of non-precipitation in spring, summer, autumn and winter was reported to account for 38.8%, 47.3%, 41.8% and 58.7% of the season’s total days, respectively, while more than 80% waterlogging disasters occurred in summer [36]. Summer is not only a season of critical water requirements for crops, but also frequently involves crop water shortages and includes a period of heavy concentrated rainfall [37]. Waterlogging disasters often occur at the end of spring and the beginning of summer, as well as during the transition between summer and autumn. Among these problems, winter wheat yields are mainly affected by spring waterlogging disasters; yield losses can exceed 40% [38]. By analyzing the statistical data of the area affected by drought and waterlogging disasters in various regions of Anhui Province from 2005 to 2015, the average damage rate of drought reached 13.2%, and the average damage rate of waterlogging reached 11.3% [39]. Due to the influences of specific climatic conditions, geographical environment, watershed characteristics and human activities, droughts and waterlogging disasters occur frequently, seriously threatening food security and social stability [40,41].
Local crops depend primarily on precipitation or groundwater, and wells are built in the area for water replenishment and irrigation in the dry season. However, according to our field investigations, due to the depth of the groundwater level and the high costs of irrigation in dry years or dry seasons, irrigation is rarely applied to cereal crops, other than those crops with high economic value, such as vegetables, fruits and herbs. There are sound drainage ditches in the area, of which the main drainage ditch is mainly used to accumulate rainwater and regulate the groundwater level by opening and closing the ditch sluices to supplement water for crops and prevent waterlogging. According to the research results by Wang et al. [42,43], the suitable groundwater depth for crops (SGDC) is 0.4–1.0 m for corn and 0.6–1.5 m for wheat under subclay soil cultivation conditions in the Northern Huaihe River Plain area. When the groundwater level is higher than the SGDC, crops are affected by waterlogging, and when it is lower than the SGDC, crops are affected by drought.

2.2. Brief Introduction to MODFLOW

2.2.1. Governing Equation

The equation for controlling the groundwater saturation zone is an incompressible three-dimensional finite difference equation [44]:
x i K i j H x j + W = S S H t ,
where i, j = 1–3, represent the x, y and z directions, respectively; Kij denotes the saturation hydraulic conductivity tensor, L/T; H is the pressure head, L; W is the flux of source/sink per unit volume, L3/T; SS is the specific yield of the porous medium; and t denotes time, T.

2.2.2. Mesh Generation

According to the hydrogeological, surface elevation and model boundary conditions, considering the size of the study area and the requirements of calculation accuracy, the model was meshed to generate two vertical layers, with 155 rows in the east–west direction and 213 columns in the north–south direction. The total number of cells was 66,030, of which 16,954 were active cells, with individual cell sizes of 50 m × 50 m, 100 m × 100 m and 50 m × 100 m (see Figure 1c). To accurately simulate the change of groundwater level near the ditches, the observation well area was locally refined. The two vertical layers were defined as follows: The upper layer of the aquifer was a 6 m unconsolidated sedimentary formation layer containing heavy silty clay and clay (mainly Shajiang black soil). The second layer of the aquifer was an unconsolidated sedimentary formation layer of silt (or fine) sand with a thickness of 6–35 m [45,46] (see Figure 1c). Moreover, there was a thicker layer of Shajiang black soil (clay) at the bottom; thus, a depth of 35 m was used as the lower boundary of the model for the top of the aquifuge [47]. The range of hydraulic conductivity and specific yield of the first and second layers are shown in Table 1 [48,49]. The initial values are specified the average of the range in Table 1.

2.2.3. Boundary Generalization

The study area is flat, and groundwater recharge and discharge are weak along the north–south direction, so it was assumed that there were no flow conditions in the north–south direction, the upper boundary was the free surface of groundwater and the lower boundary was the impermeable bedrock generalized into the impermeable boundary of 35 m depth. The hydraulic heads of the ditches were known and generalized as the time-variant specified head (CHD) package to specify this boundary condition.

2.2.4. Rainfall Infiltration

Precipitation is the main source of groundwater recharge in the phreatic zone. The amount of infiltration was calculated by using Equation (2):
P r = α P ,
where Pr is the amount of groundwater replenishment by precipitation (mm), α is coefficient of replenishment from infiltration of precipitation and P is precipitation (mm). In this study, α was 0.22–0.24 based on the groundwater simulation results of Yuezan Tao et al. [50] in the North Huaihe River area of Anhui Province (Figure 2). Since the southern section was close to the urban area and contained large areas with roads and buildings, the rainfall infiltration coefficient was 0.22, while the northern and middle sections had a value of 0.24. The rainfall data were measured by the Lixin County Meteorological Station in Anhui Province (Figure 1a).

2.2.5. Phreatic Evaporation

Due to the lack of evaporation data from the meteorological station in Lixin County, the meteorological data of Bozhou city, Anhui Province, were used for calculation (Figure 1a). The Penman–Monteith Equation [51] was used to calculate the reference evapotranspiration. The potential evapotranspiration (ETp) was obtained by using the crop coefficient [52] multiplied the reference evapotranspiration. The annual precipitation and the annual potential evapotranspiration are plotted in Figure 2. According to the experimental study by the Anhui and Huaihe River Institute of Hydraulic Research [45], the extinction depth of groundwater evaporation of soil with different qualities in the local area was 2.18–5.0 m, and the model was calibrated towards this range.

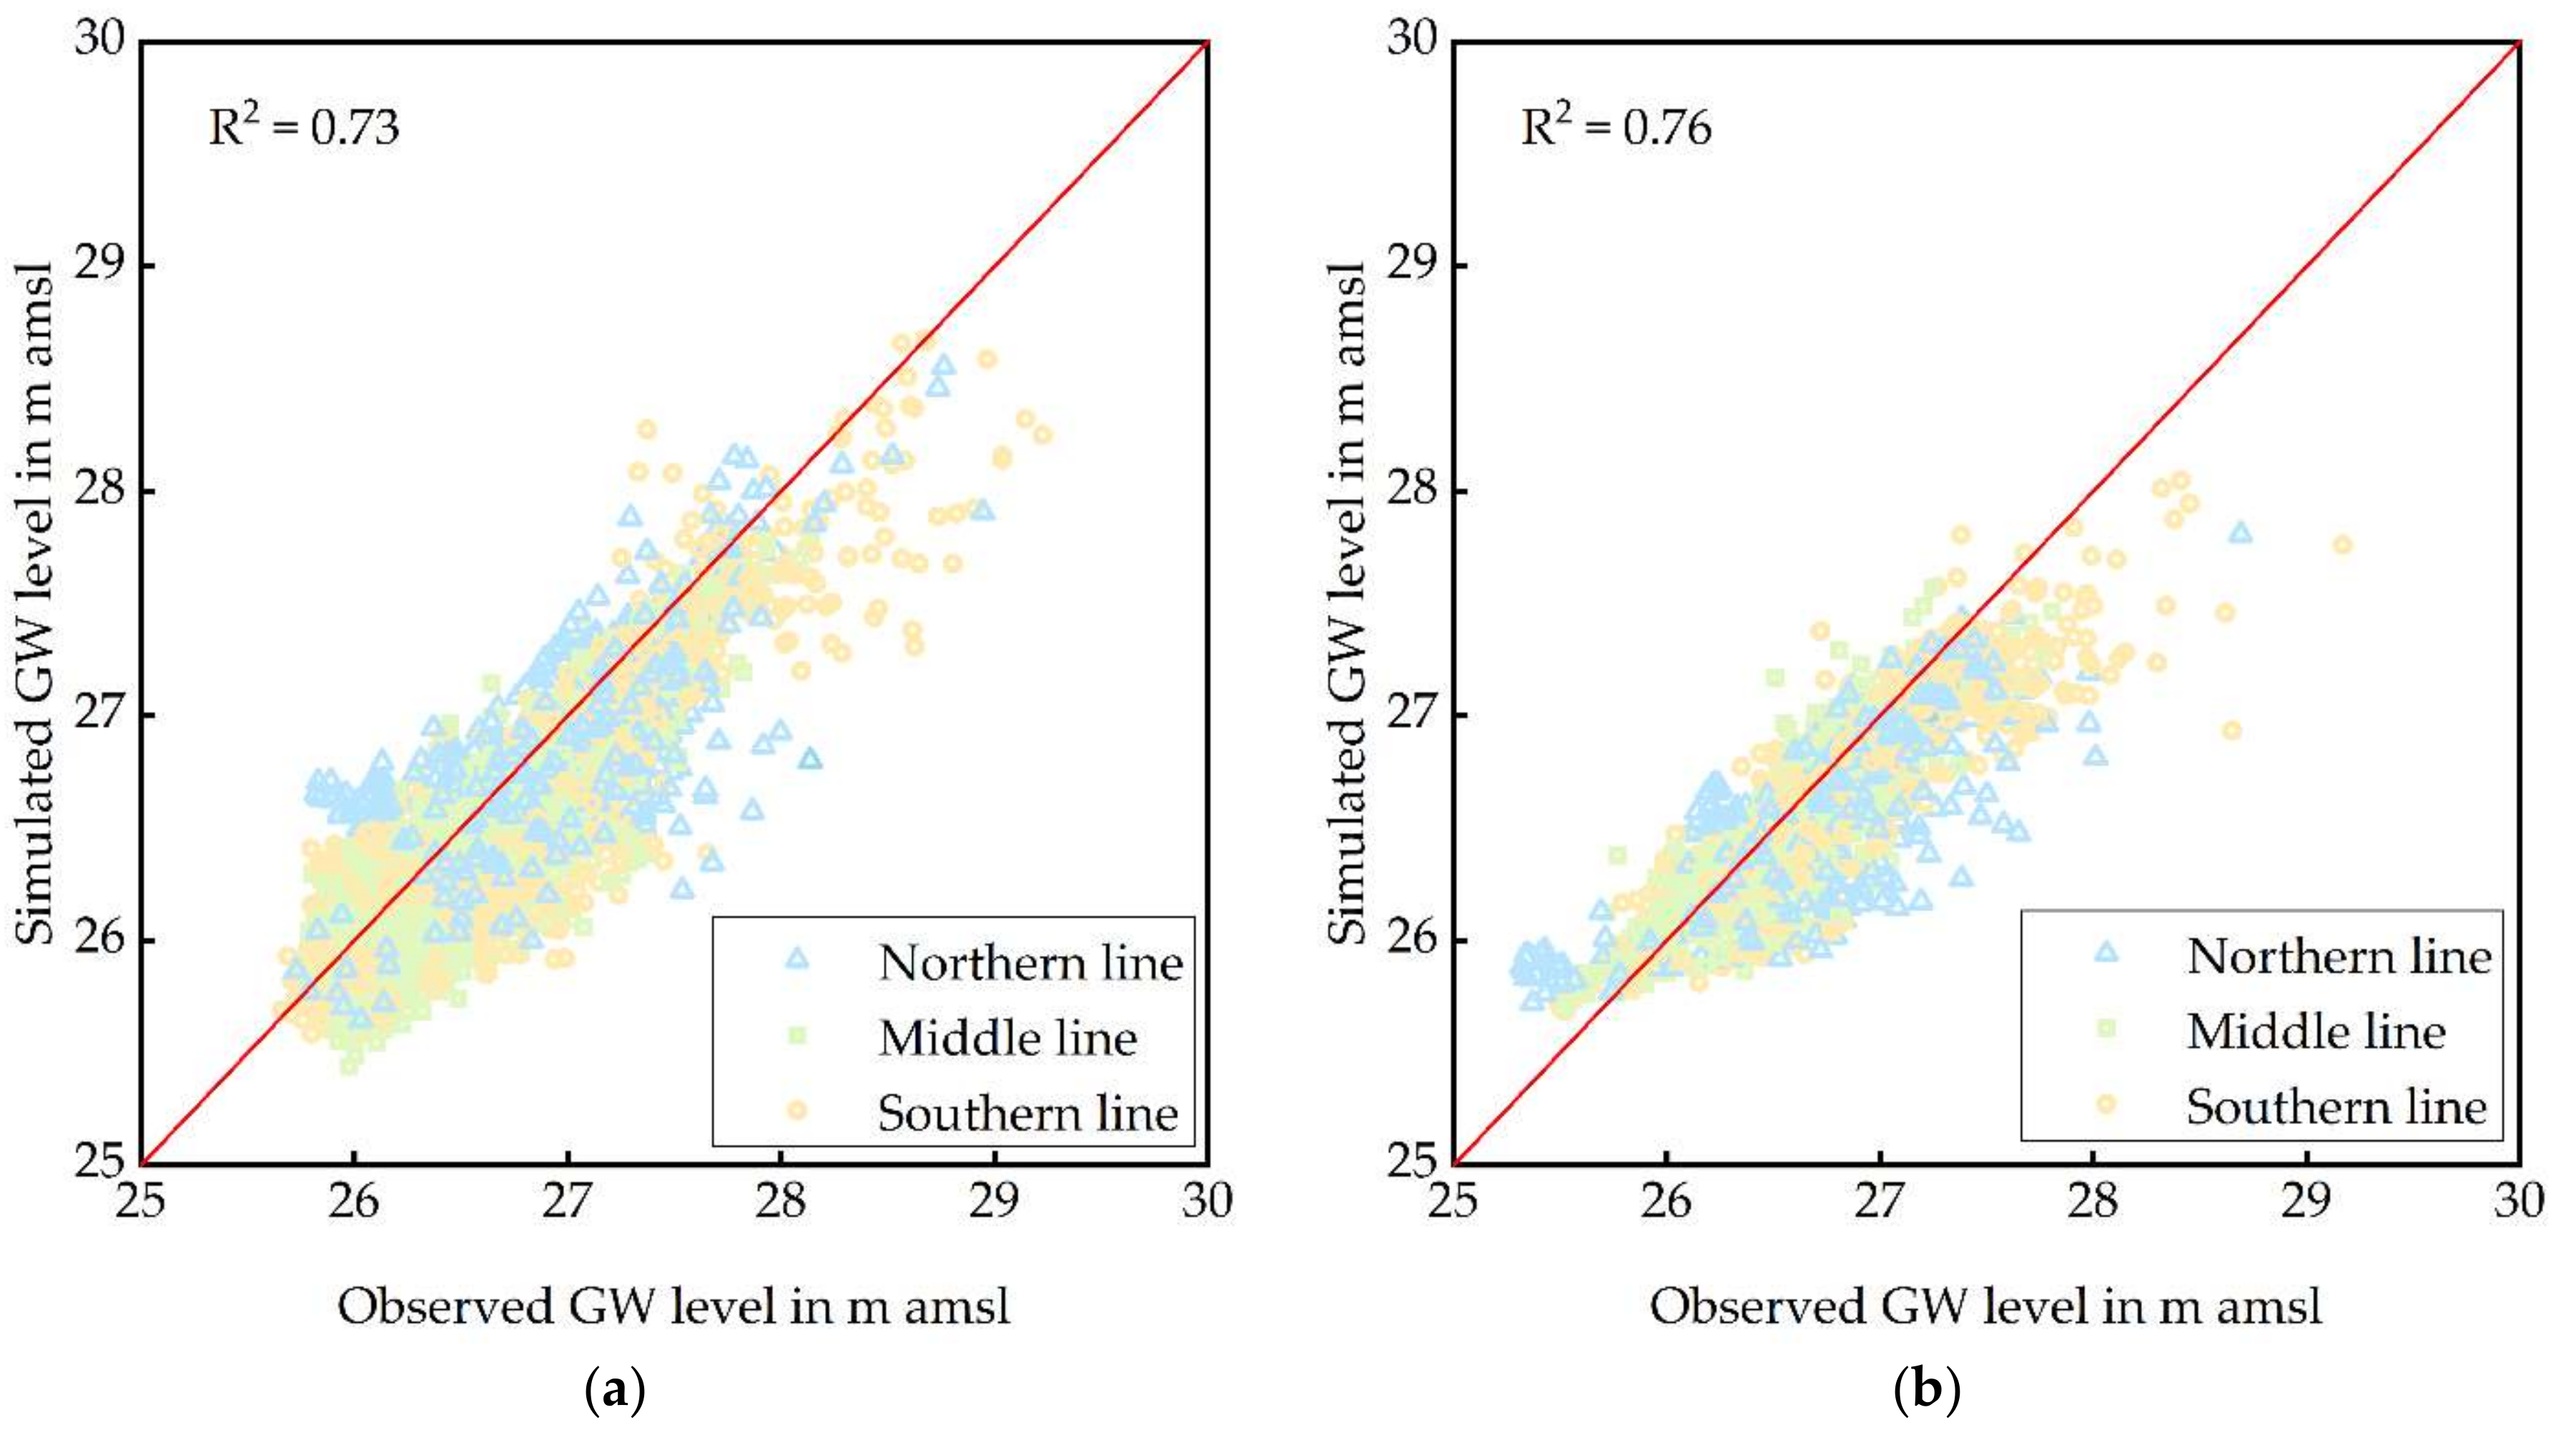
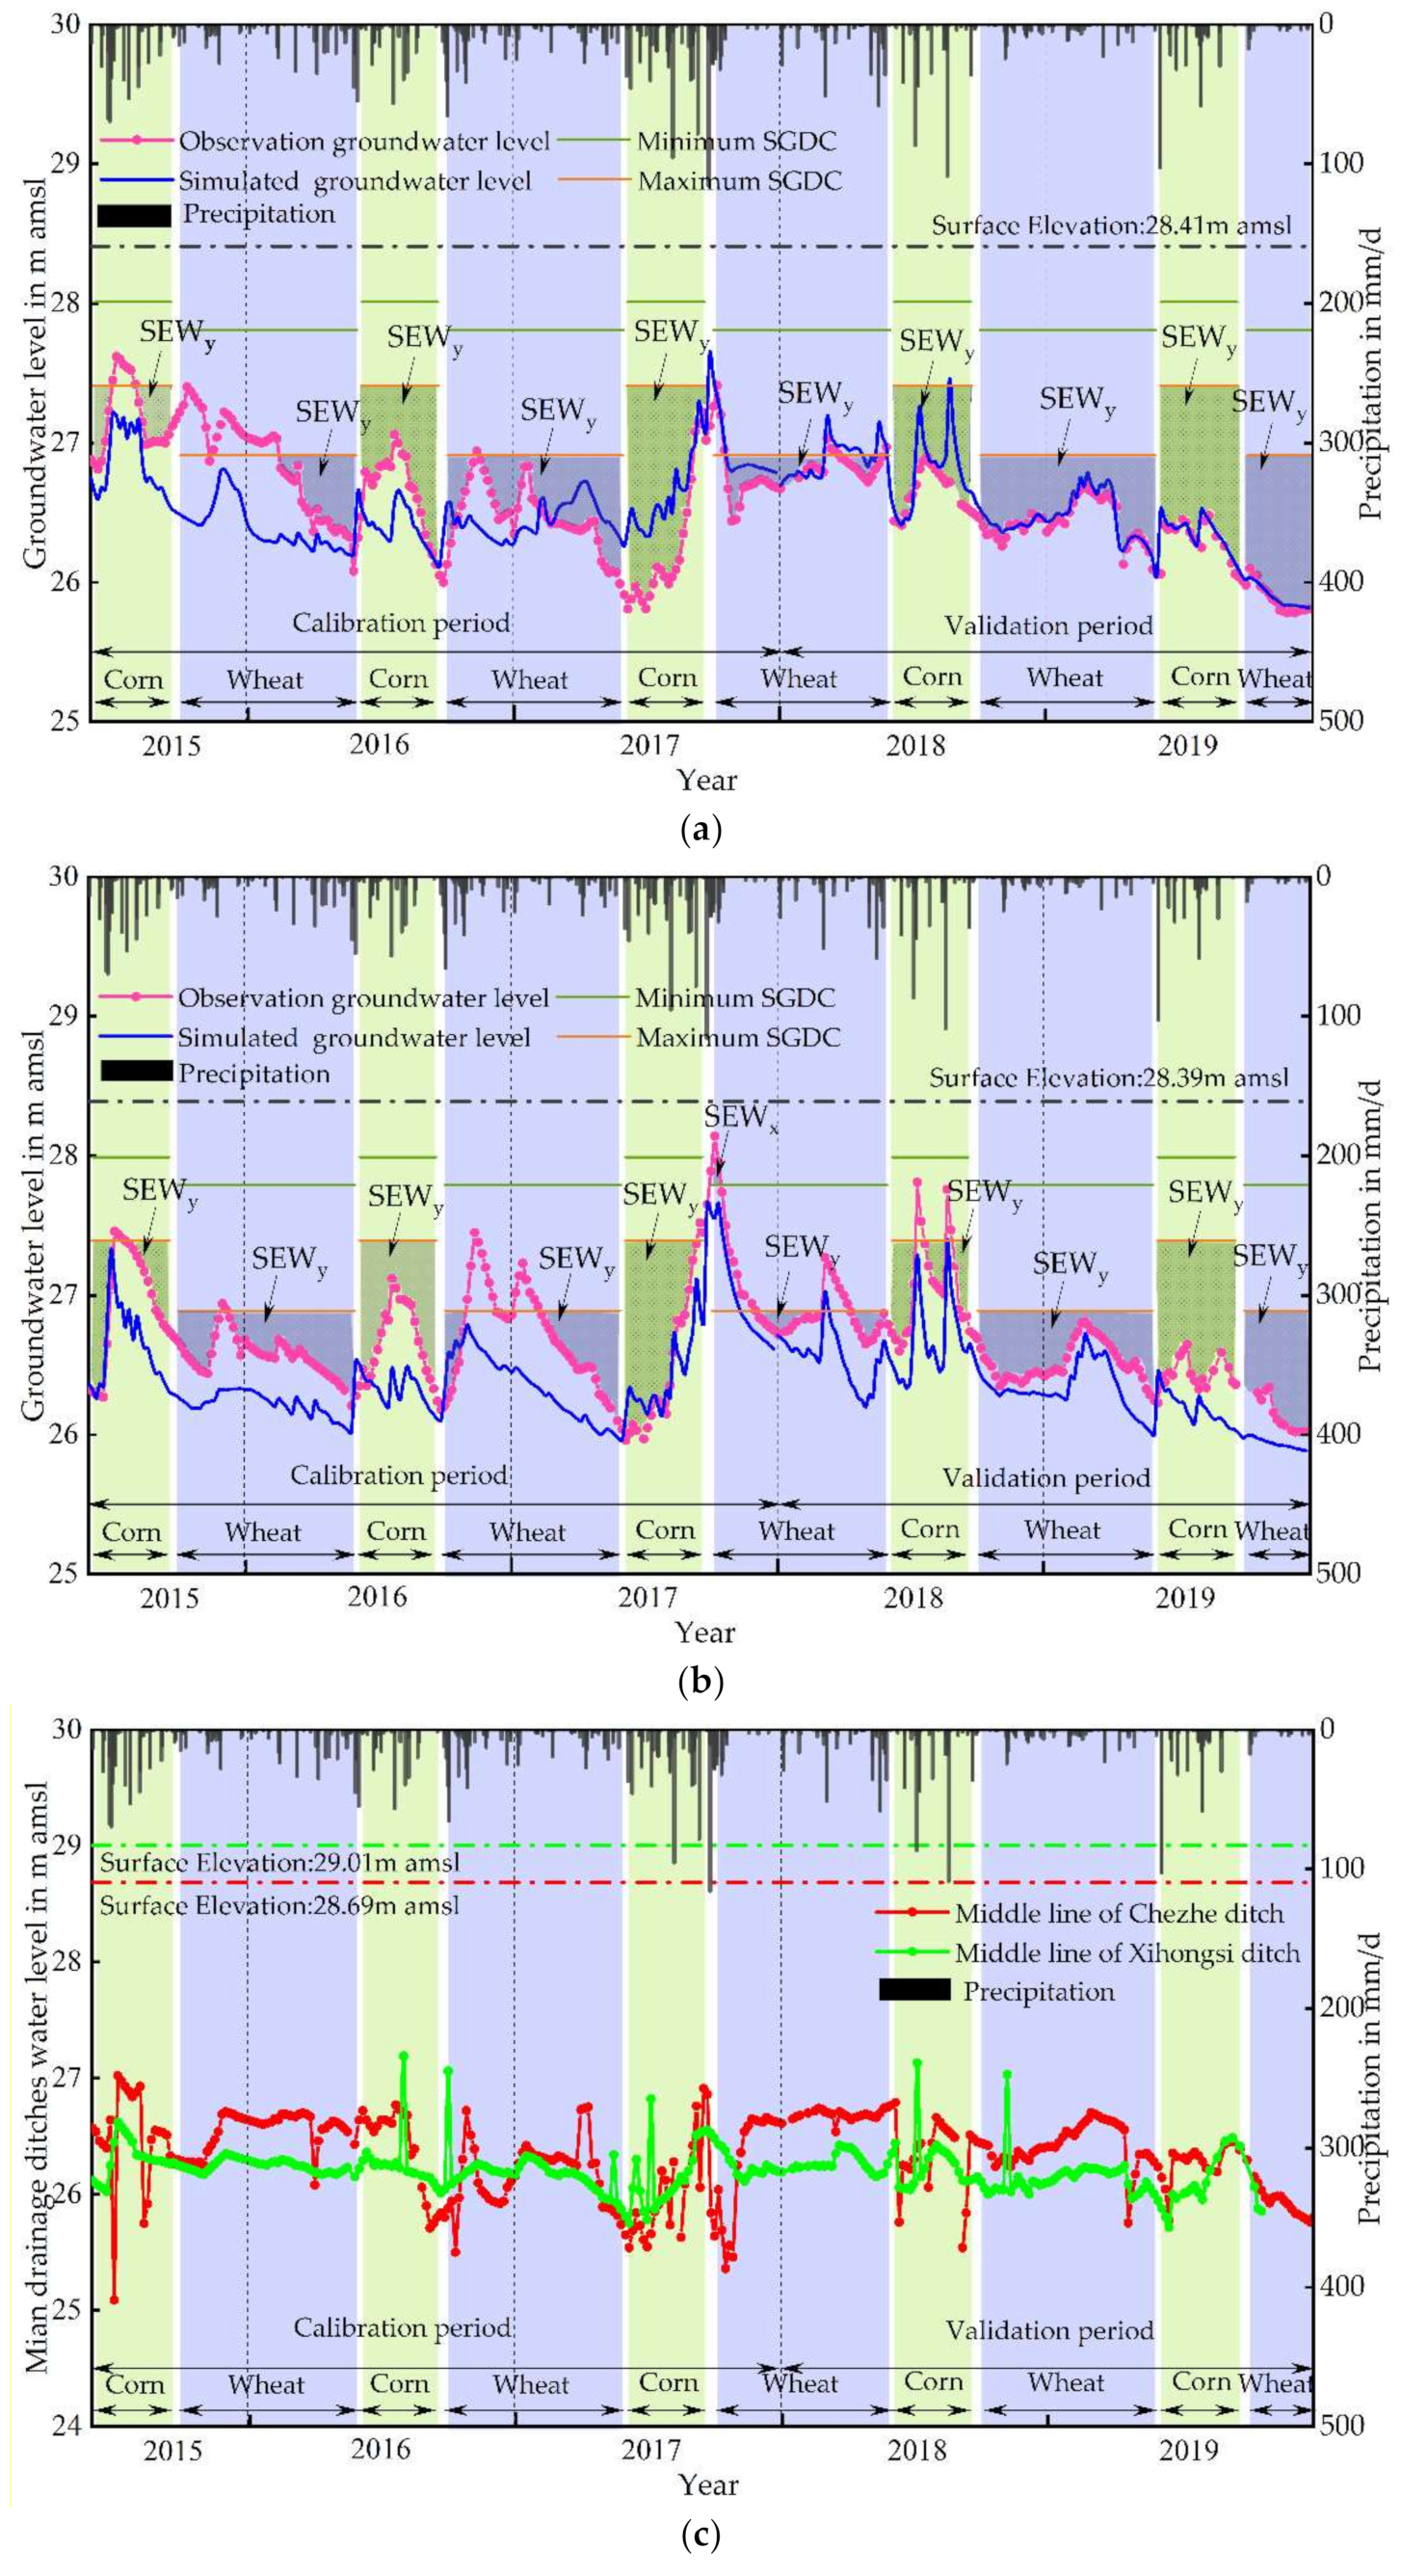
2.3. Model Calibration and Validation

There are 25 groundwater-level observation wells in the study area located in the northern, middle and southern sections and named accordingly, as shown in Figure 1b. Groundwater levels are manually observed every 5 days. In this groundwater simulation analysis, the measured groundwater-level data from 2015 to 2017 were used to calibrate the hydrogeological parameters of the model, and the groundwater-level data from 2018 to 2019 were used to validate the model.
The standardized root mean square error (NRMSE), the relative error (RE), coefficient of determination (R2) and root mean square error (RMSE) [53] were selected as indicators to evaluate the simulation results. The evaluation criteria of these indicators for model simulation are shown in Equations (3)–(6).
N R M S E = 1 n i = 1 n m i s i 2 s 2 ,
R E = u n m u u n s u 1 ,
R M S E = u = 1 n m u s u 2 n ,
R 2 = u = 1 n m u m s u s 2 u = 1 n m u m 2 u = 1 n s u s 2 ,
where su and mu denote the simulated and measured values of the u-th sample, respectively; m and s denote the mean value; and n denotes the number of measured values.

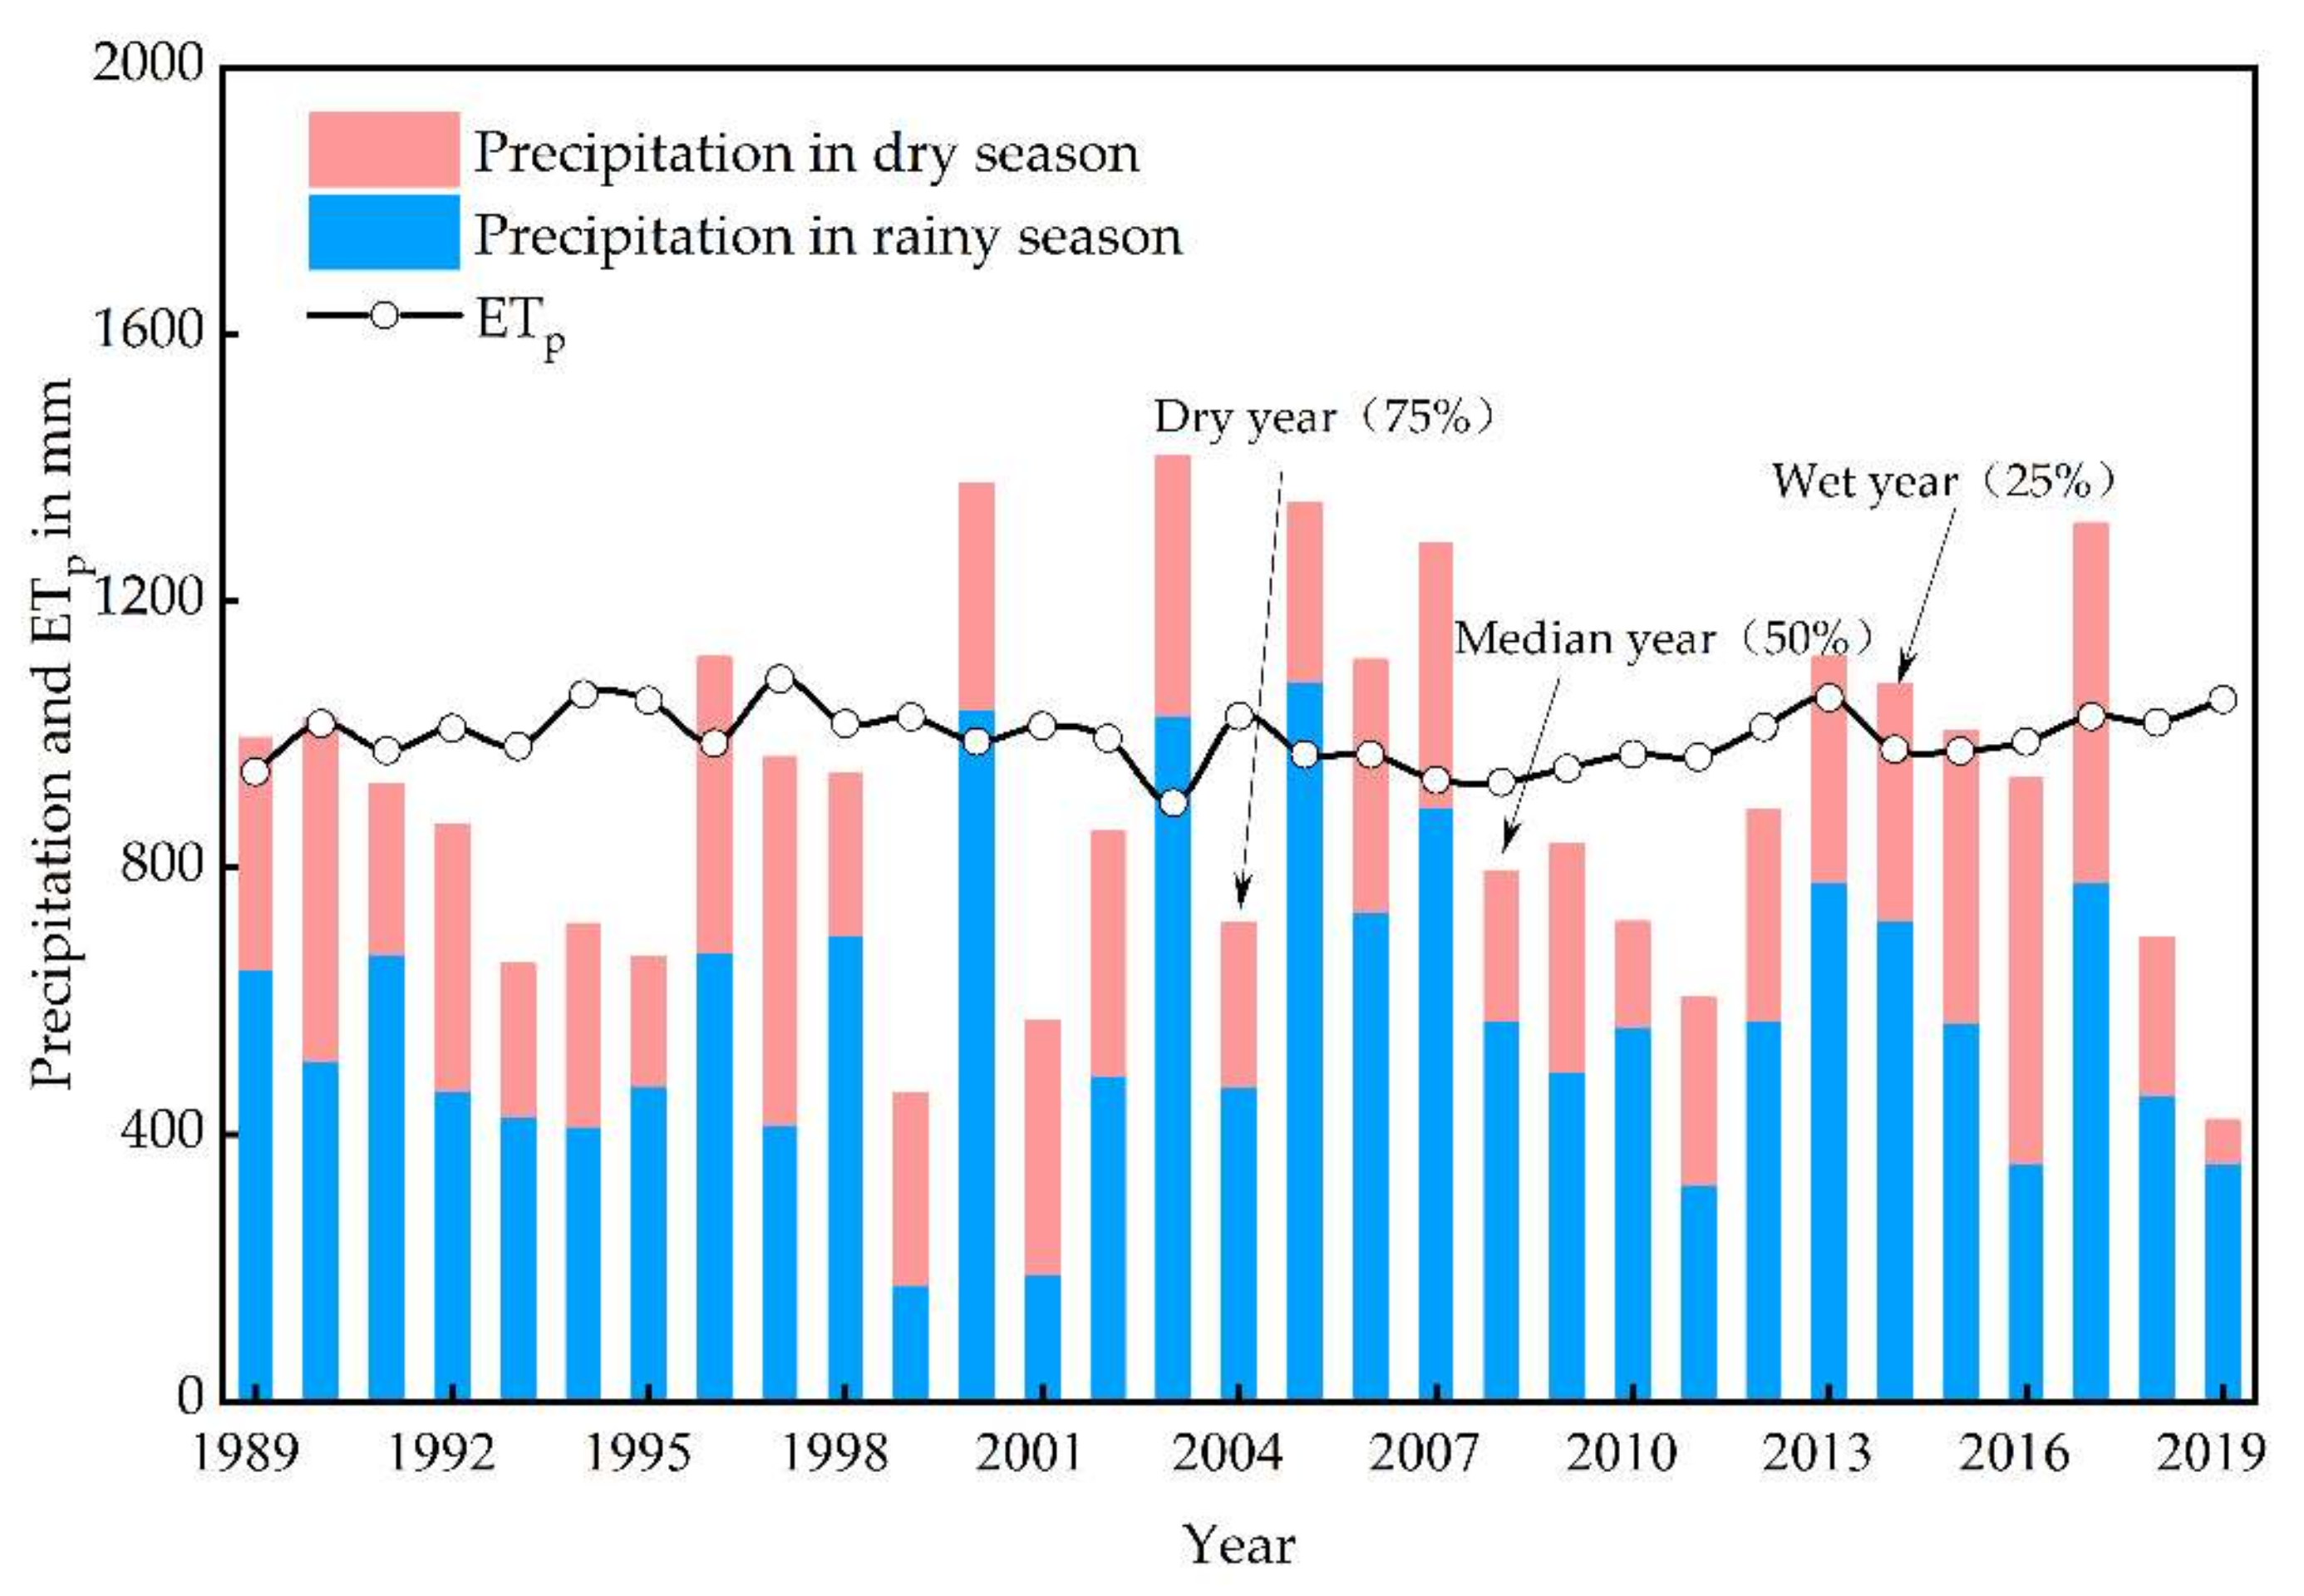
2.4. Scenario Description

The main drainage ditch is the primary local water-storage and -drainage mechanism. During the rainy season, heavy rainfall and high groundwater levels can cause crop waterlogging. Therefore, the sluice gate at the exit of the main drainage ditch is opened, and the rainwater from farmland drains through the main drainage ditch into the river in the southern part of the area, reducing the farmland groundwater level. During the dry season, the sluice gate at the outlet of the ditch is closed, the water level in the ditch rises and the groundwater level in the field increases through soil infiltration into the field, making it available for crops to use. The purpose of this paper was to study the effect of controlling the water depth in different main drainage ditches on the groundwater level of the farmland, and according to the local rainfall characteristics and the actual operation of the ditches, different main drainage-ditch-water levels are set for the dry and wet seasons, respectively. Based on the on-site survey results, the average depth of the main drainage ditch was 5 m below ground surface; therefore, the depth of the main drainage ditch was divided into 5 sections in 1 m increments, and 5 water level control schemes were set for the dry and rainy seasons. According to the on-site survey, the actual main drainage ditches’ water depth (the distance from the bottom of the drainage ditches to the surface of the water) in the rainy season was 1, 2, 3, 4 and 5 m above the bottom of the ditch, while the actual main drainage ditches’ water depth in the dry season never exceeded 4 m above the bottom of the ditch; thus, twenty main drainage-ditch water-depth combinations were implemented, namely the depth of the main drainage ditches was controlled to between 1 and 4 m above the bottom of the ditch during the dry season and to between 1 and 5 m above the bottom of the ditch during the rainy season, as shown in Table 2. In order to fully understand the effect of groundwater in the control area of the main drainage ditch water depth combination as much as possible, and according to the availability of data, each scenario simulates the changes of groundwater during the growth periods of corn and wheat from 1989 to 2019.

2.5. Crop Drought and Waterlogging Indicators

When the groundwater depth is higher than the suitable groundwater depth for crops (SGDC), there is high soil moisture in the active layer of the root system; the ratio of water, air and heat in the soil is out of balance; and crops are affected by waterlogging stress, which inhibits the growth of crops and leads to a reduction in crop yield [21]. Since the study area is basically rain-fed, when the depth of the groundwater is lower than the SGDC, groundwater is difficult to be used by crops to meet their requirements, and yields will decrease [54,55]. To determine the best water-depth-control plan for the main drainage ditches, the drought and waterlogging conditions of two crops (summer corn and winter wheat) in the study area were analyzed based on the SGDC. With reference to the concepts of drought frequency [56] and drought intensity [57], 20 water-depth-control schemes were evaluated. The main evaluation indicators included the frequency of different stress levels (drought frequency, suitable frequency and waterlogging frequency) and cumulative drought and waterlogging intensity.

2.5.1. Frequency of Drought and Waterlogging Based on SGDC

According to the research results by Hesheng Wang et al. [42,43], the SGDC is 0.4–1.0 m for corn and 0.6–1.5 m for wheat under subclay soil cultivation conditions in the Northern Huaihe River Plain area. The actual growth periods of corn and wheat are shown in Table 3. In the growing period of crops, the daily groundwater depth is analyzed, and the days with less than the minimum SGDC are called waterlogging days; the days within SGDC are called suitable days; and the days with more than the maximum suitable groundwater depth are called drought days. Based on SGDC and drought frequency [53], suitable frequency and waterlogging frequency, FSGD(a,b), are obtained as follows:
F S G D ( a , b ) = g a G b × 100 % ,
where a = 1–3 indicates drought, suitable and waterlogged, respectively; b = 1–2 (where 1 is summer maize, and 2 is winter wheat); g represents the number of drought days, suitable days and waterlogging days obtained based on SGDC; and G is the total number of days in the growth period of the corresponding crop.

2.5.2. ACDWI Based on the SGDC

Drought and waterlogging disasters are caused by deficits or surpluses in the water balance in a region. When drought and waterlogging coexist, they pose a great threat to the growth of crops. In this paper, based on SGDC and with reference to the drought intensity [57], the annual index of cumulative drought and waterlogging intensity (ACDWI) is defined as the annual summed groundwater depth value when the groundwater depth exceeds the upper limit of SGDC and the lower limit of SGDC by days (Equation (8)).
A C D W I = 1 N i = 1 m 1 S E W x i + j = 1 m 2 S E W y j ,
S E W x = t = 1 m 1 X d t ,
S E W y = t = 1 m 2 d t Y ,
where SEWx (cm d) is the sum of the excess soil water, which is used as an index to evaluate crop waterlogging [58]; dt is the groundwater depth on day t, cm; and X is the upper limit of SGDC (X is 40 and 60 cm for corn and wheat, respectively [42,43]). When dt < X, the crop is affected by excessive water. In Equation (9), it holds that dt = X when dt > X, and dt = 0 when dt < 0. X = 30 cm [58] is used most often in the literature, but X = 50 and 60 cm [59,60] are also used. Y is the lower limit of SGDC (Y is 100 cm and 150 cm for corn and wheat, respectively [42,43]). When dt > Y, crops suffer from drought. The lower the ACDWI value, the smaller the cumulative drought and waterlogging intensity are during the growth period of the crop, and the units are m d.

3. Results and Discussion

3.1. MODFLOW Evaluation

The groundwater-level measurements in the study area were used to calibrate and validate the MODFLOW. The calibration of the groundwater error evaluation index [53] was the best, and combined with the rational determination of the hydraulic conductivity and specific yield [48,49] of layered soil for parameter calibration, the resulting values are shown in Table 4. It can be found that the resulting values are all in the range of Table 1. Maybe due to less cultivation in the southern section, where there are large settlements and the main economic crops are fruits and flowers, partly in greenhouses, the value of the specific yield in the upper layer is relatively larger than in the middle and the north.
In the calibration period and validation period, the NRMSEs were 0.12 and 0.08, respectively; the RMSEs were 0.31 and 0.26 m, respectively; the REs were all 0 m (retaining two decimal places); and the R2 were all above 0.73 (Figure 3). In general, the model simulation can be judged as excellent with a NRMSE of less than 0.25, within the acceptable range, if the NRMSE is greater than 0.25 and less than 0.3 [61]. Chen [62] proposed that an RE less than 0.2 is generally satisfactory. The RMSE is as small as possible, and any R2 greater than 0.65 is acceptable [63]. Thus, the evaluation results of the simulated groundwater level during the model calibration period and validation period met the accuracy requirements of the model simulation.
In order to compare the changes of simulated and measured water levels, the measured and simulated groundwater levels at observation wells near the ditch (M2) and far from the ditch (M5) on the middle line, from 2015 to 2019, are shown in Figure 4a,b. The water level in both of the main drainage ditches at the middle line is shown in Figure 4c. It can be seen from Figure 4a,b that the simulated and observed groundwater levels have the same variation trend. The peak and trough values of some simulated water levels appear earlier than the observed values. The groundwater level, main drainage ditches’ water level and precipitation show positive correlation.
It can also be seen from Figure 4a,b that, from 2015 to 2019, most of the groundwater level appeared below the lower limit of SGDC, showing that the crops were mainly subjected to drought stress. According to Equations (8)–(10), the total cumulative drought and waterlogging intensity of the two crops at the representative field around M2 near the ditch from 2015 to 2019 was 845.5 m d (see the shaded part of Figure 4a), and the ACDWI was 84.6 m d. The total cumulative drought and waterlogging intensity of the two crops at the representative field around M5 far from the ditch from 2015 to 2019 was 694.1 m d (see the shaded part of Figure 4b), and the ACDWI was 69.1 m d. It indicates that the representative field near the ditch suffered more drought stress than the one far from the ditch, and this might be caused by the fact that the water level of the main drainage ditch was lower than 2 m below the ground surface most of the time in the past few years (see Figure 4c), and that the main drainage ditch served mainly to drain during the wet season, while failing to recharge groundwater during the dry season.

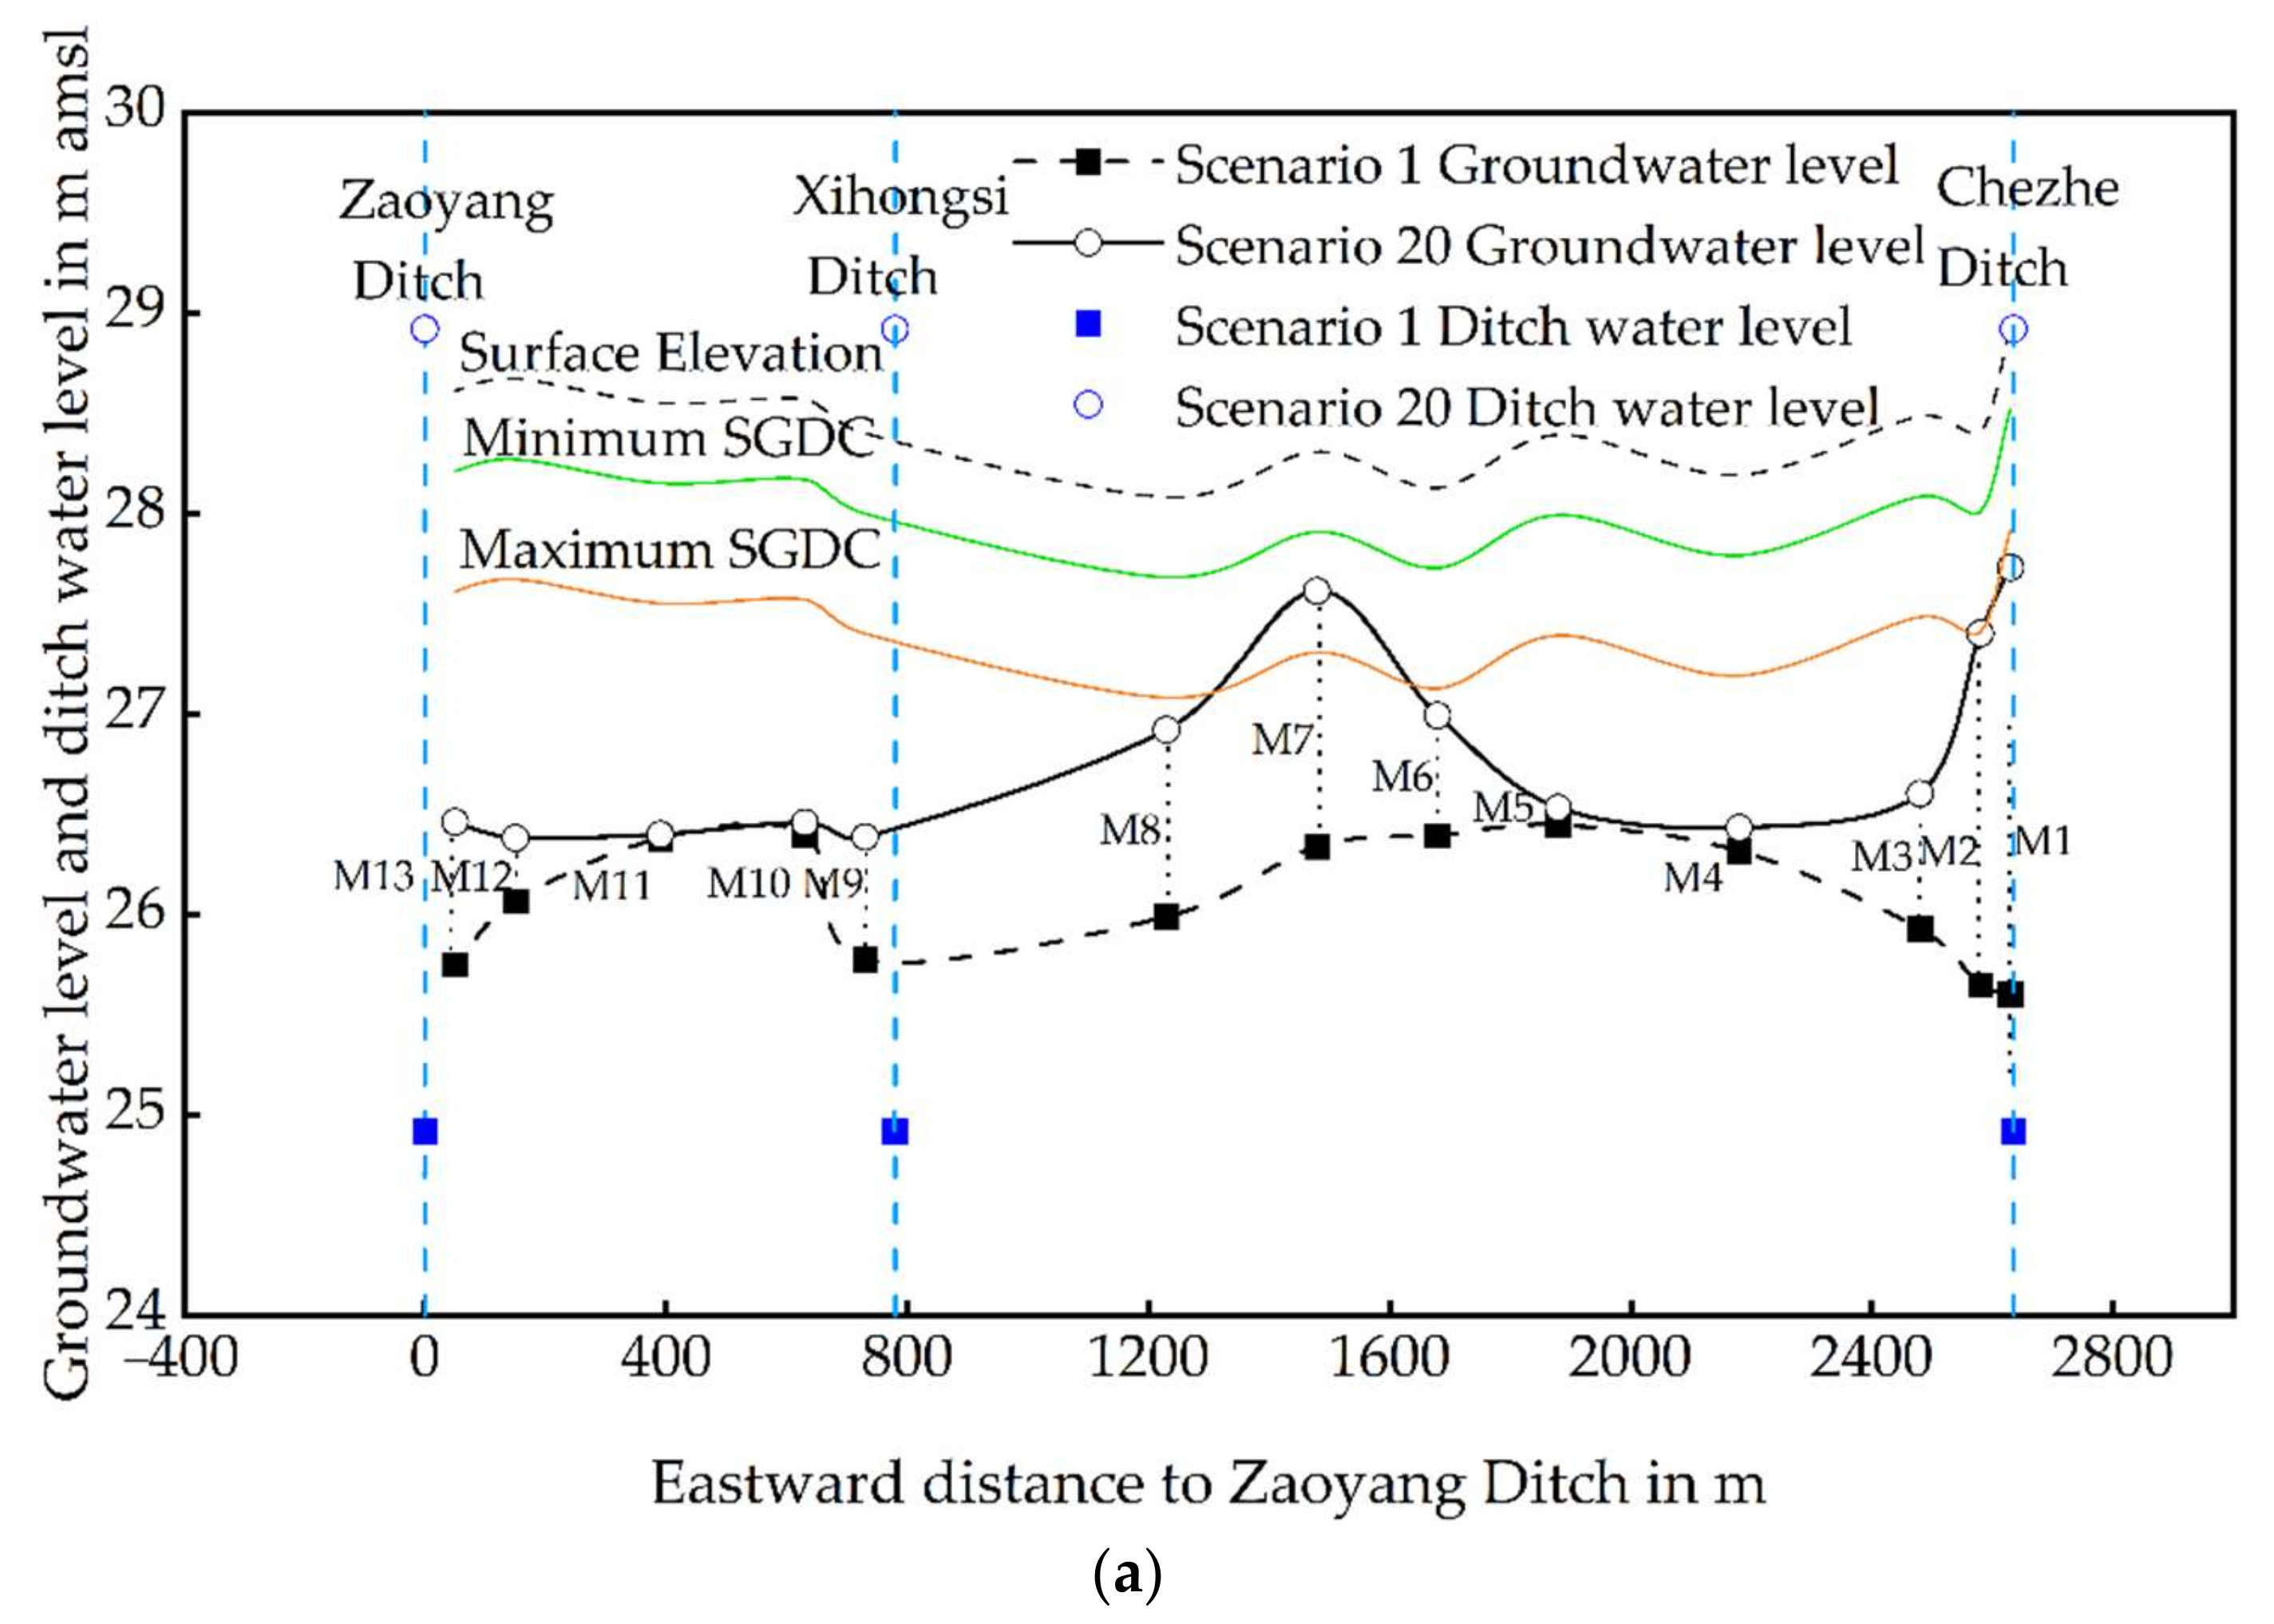
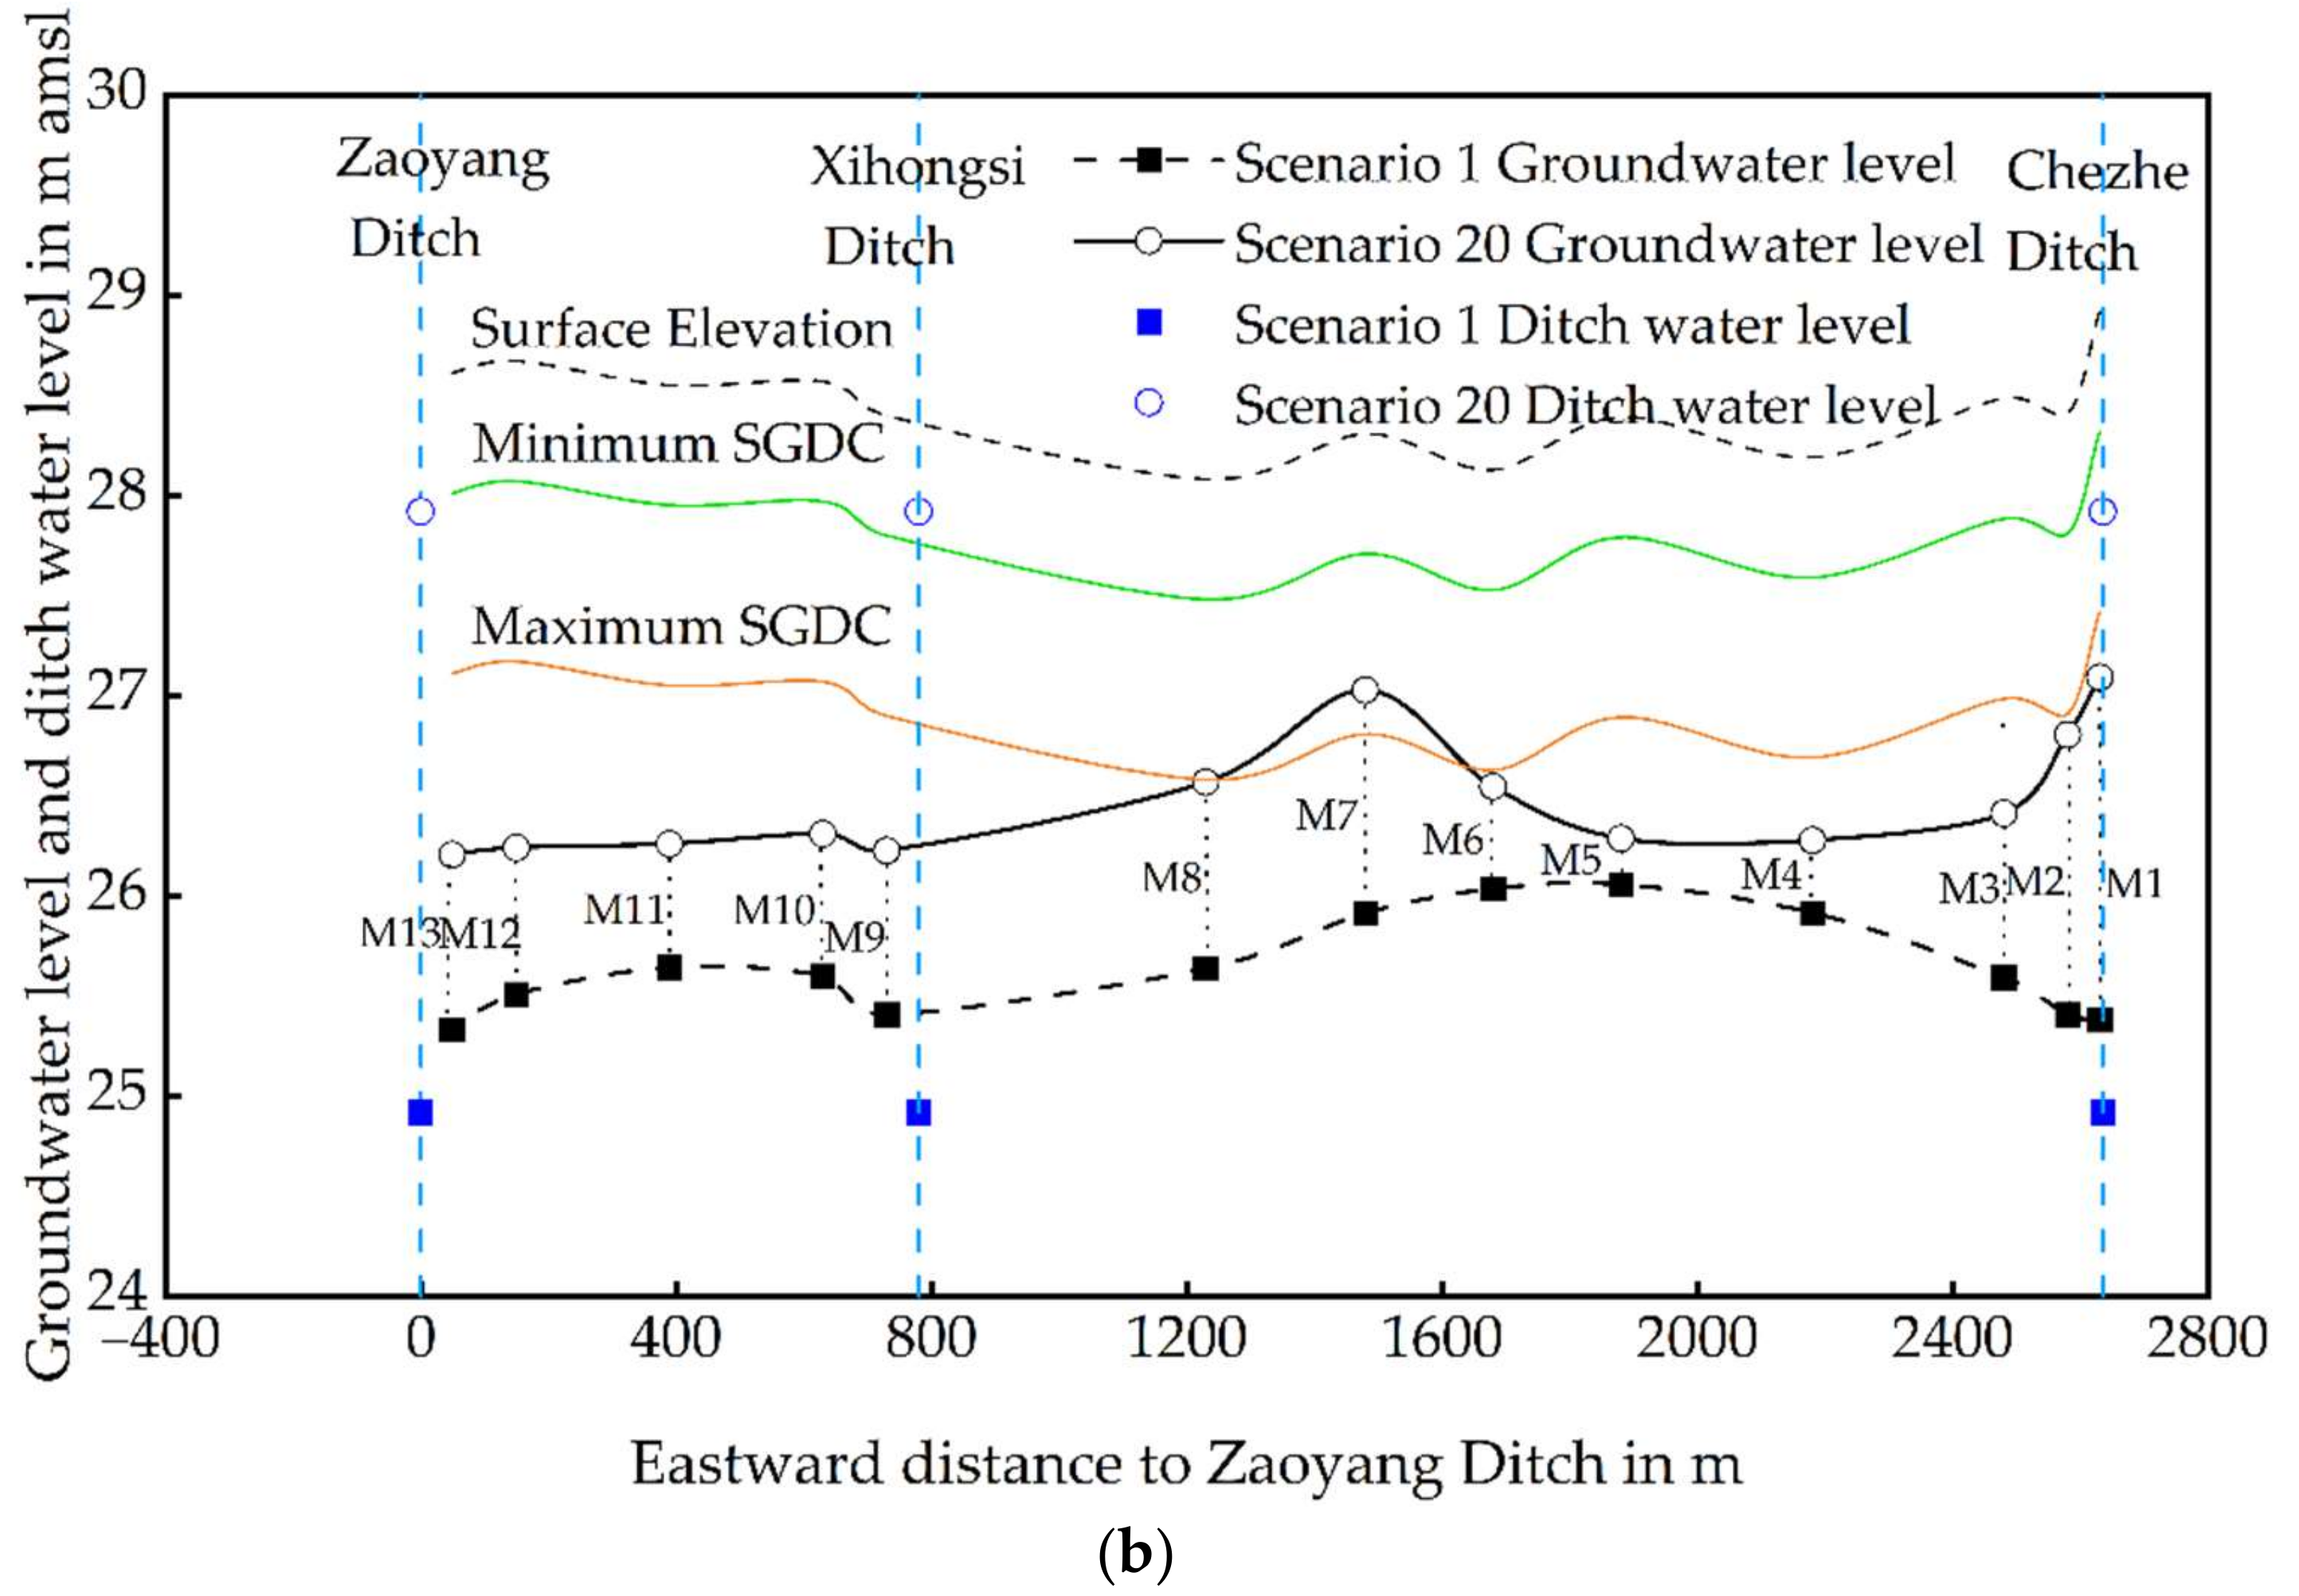
3.2. Analysis of Ditches’ Water-Depth Scenarios

In order to reflect the changes of groundwater levels of different ditch-water-depth scenarios, the groundwater-level changes in the middle line of the study area for Scenario 1, with the lowest ditch water depth, and Scenario 20, with the highest ditch water depth during the reproductive stage of corn and wheat (17 August and 20 April, respectively) in normal year 2008, are shown in Figure 5a,b. It can be seen that the groundwater levels of the two crops have the same changing trend from east to west under the same scenario. For Scenario 20, the groundwater level of the fields near M7 and the Chezhe ditch was higher than other fields. For Scenario 1, the groundwater level in the fields far from the ditch was higher than for the fields near the ditch. For Scenario 20, during the growth period of corn, except for the fields near M7, the groundwater level in most fields was lower than the maximum value of SGDC, while the groundwater level of all fields of wheat was below the SGDC. Both crops were in a drought state, but groundwater levels were higher in Scenario 20 than in Scenario 1, meaning that there was less drought stress for both crops in Scenario 20.
In order to study the changes of groundwater drought and waterlogging during the growth period of corn and wheat, based on different combinations of water depths of the main drainage ditches from 1989 to 2019, the area scale and the fields scale were analyzed respectively. The area scale refers to the whole study area. The fields scale was measured based on the representative fields around the observation wells, which should be selected according to the hydraulic connection. Hydraulic connection is related to the distance between observation wells and the main ditch. Fields close to the ditch have strong hydraulic connection with the ditch water, while the fields far from the ditch have weak hydraulic connection with the ditch water. We chose the closest and furthest fields from the ditches as representative fields around the observation wells. The representative wells chosen and their distances from the ditches are shown in Table 5.

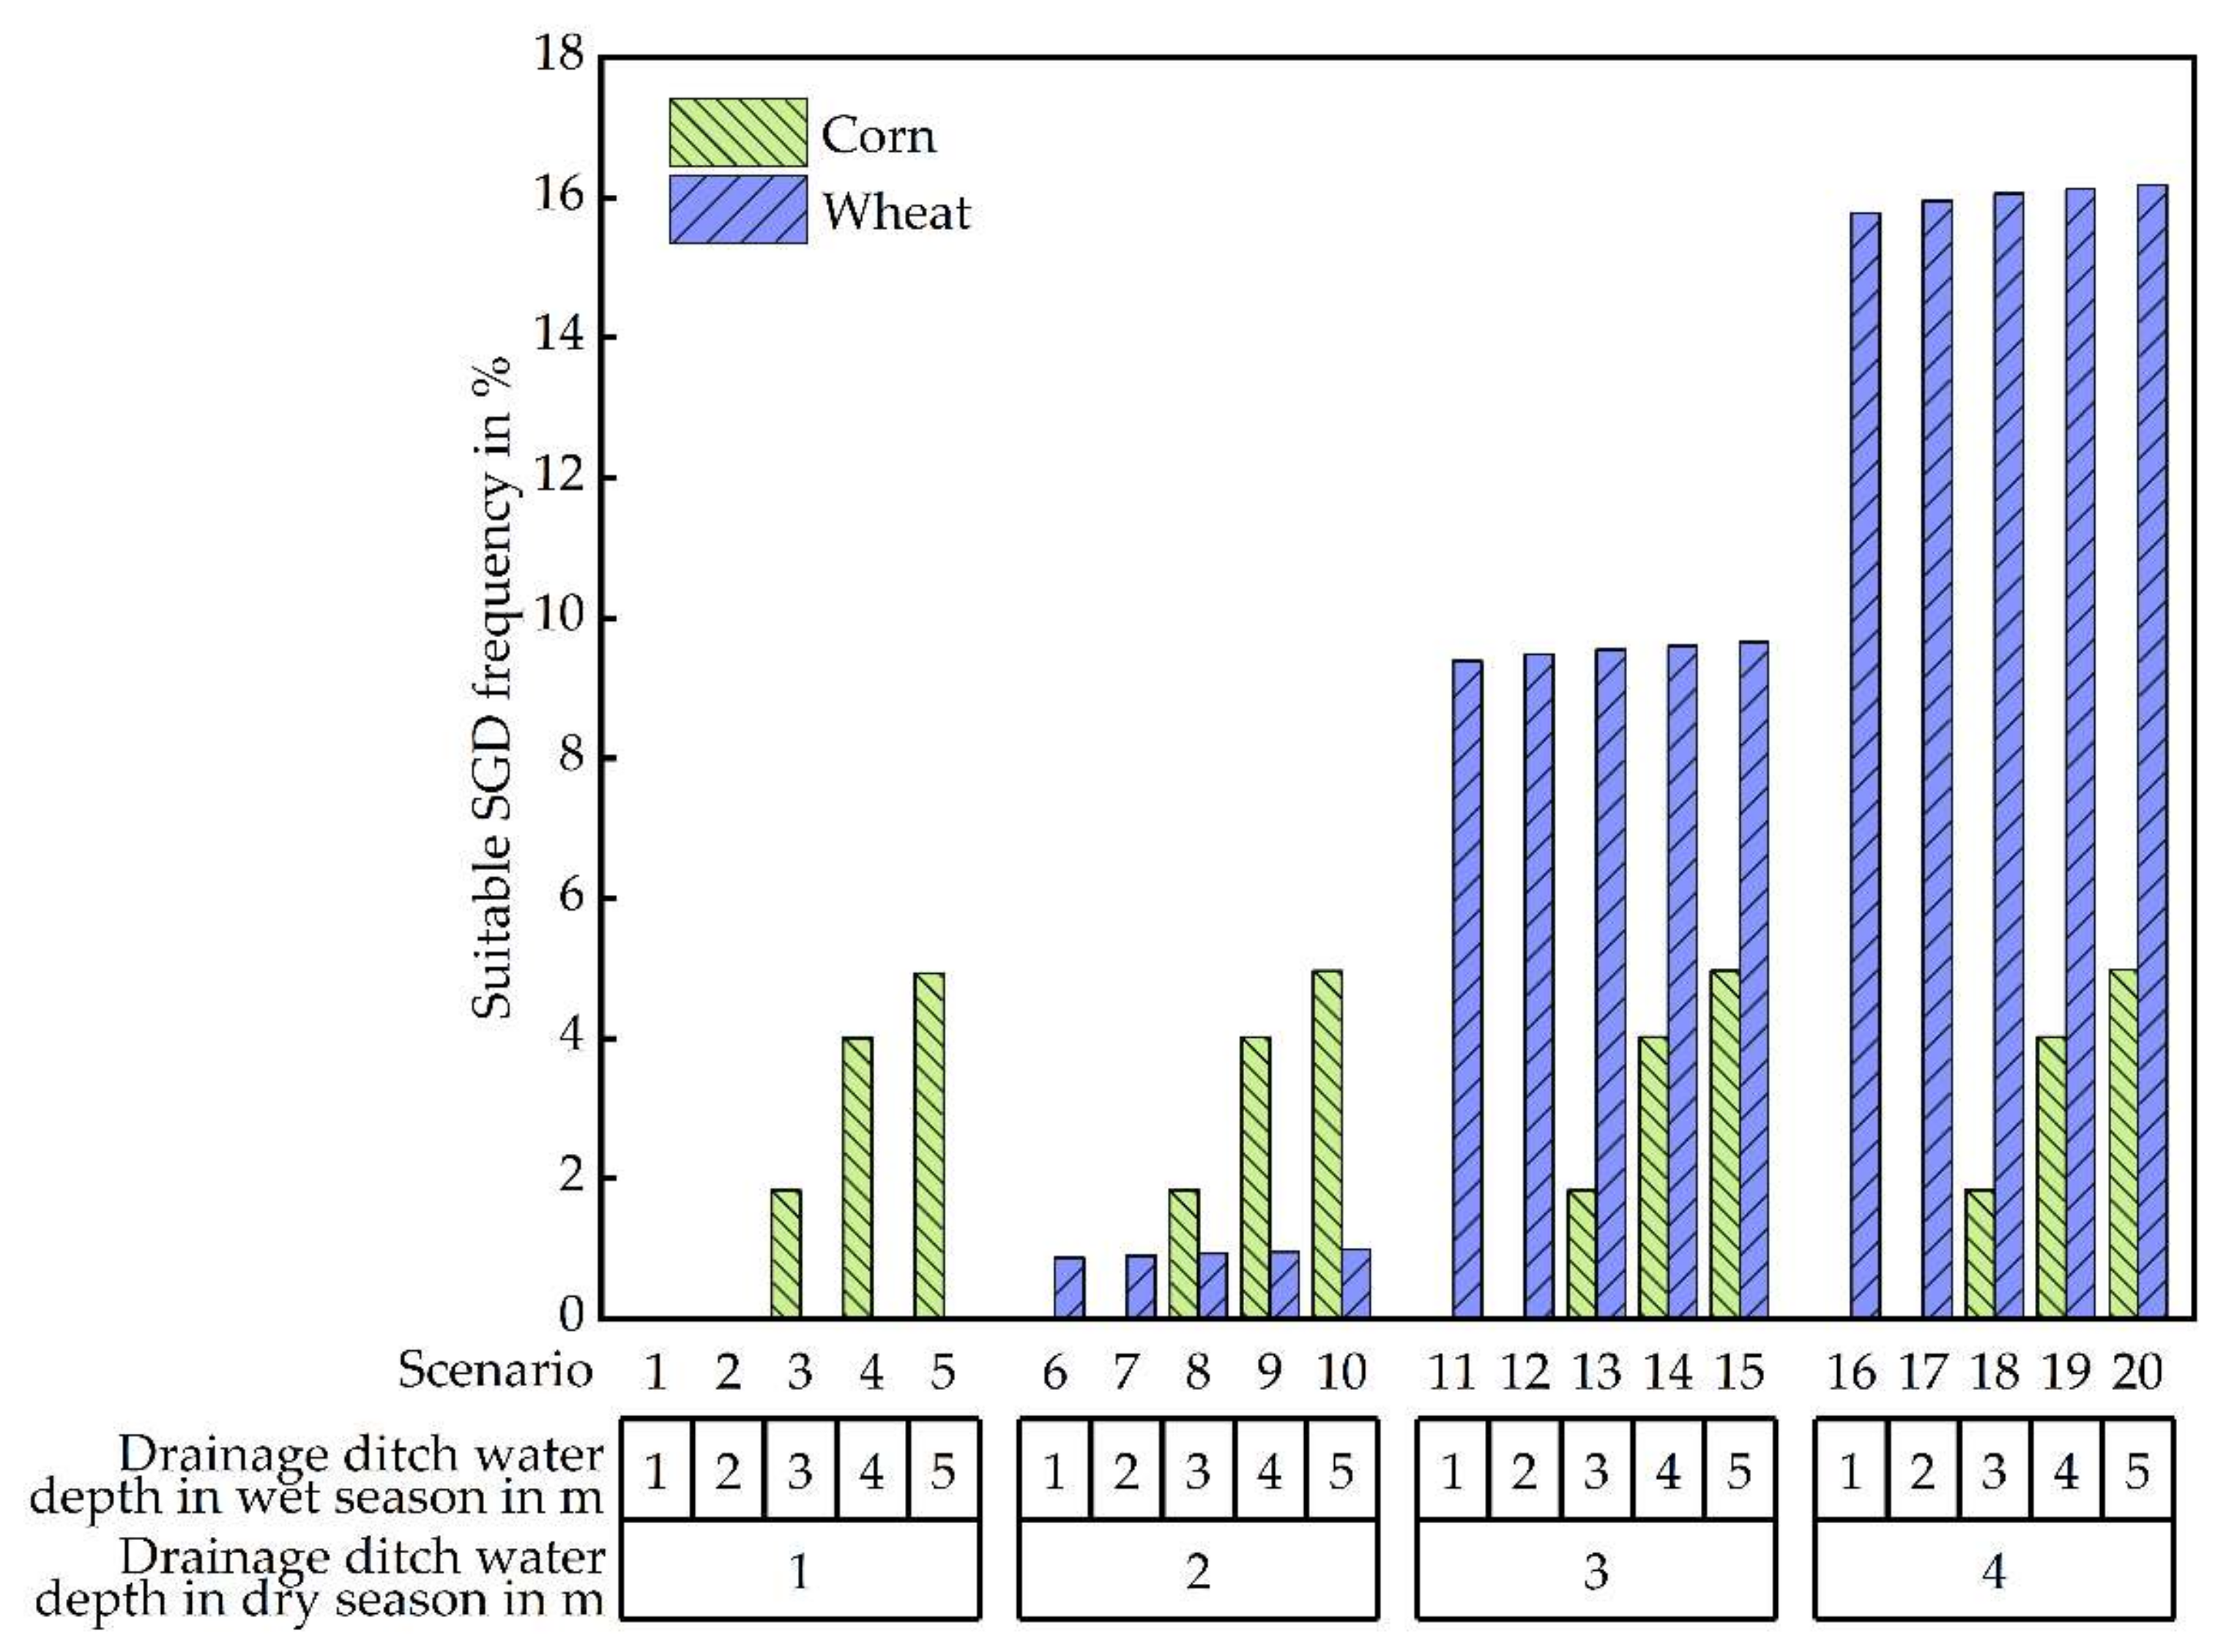
3.2.1. Analysis of the Suitable Frequency of the Groundwater Table under Different Scenarios

The suitable frequency corresponding to the SGDC of different crops was analyzed first. To understand the change in the suitable frequency in the entire study area, the average value of suitable frequency corresponding to the SGDC of both crops at all cells in the whole study area was calculated at the area scale. Figure 6 shows the mean suitable frequency of the 20 scenarios in the study area calculated with Equation (7) during the growth periods of both crops from 1989 to 2019. Since the growing season of corn was the rainy season, the drought and waterlogging of corn were not related to the change in the ditch water depth during the dry season. When the water depth of the ditches was 1 m in the rainy season, no SGDC occurred in the whole area. When the water depth of the ditches in the rainy season was 2–5 m, the suitable frequency during the growth period of corn increased as the ditch water depth increased. When the rainy season ditch water depth was 4 m (corresponding to Scenarios 4, 9, 14 and 19), the suitable frequency suddenly increased by 2.2%, and when the ditch water depth was 5 m, the maximum suitable frequency of 5.0% was reached, corresponding to Scenarios 5, 10, 15 and 20. These results show that, to reduce the frequency of drought during the growth period of corn and to meet corn growth needs, the water depth of ditches in the rainy season should be controlled at 4–5 m.
The wheat growth period occurs during the dry season. During the dry season, the groundwater level is mainly affected by the ditch water depths. When the ditch water depth in the dry season was 1 m, no SGDC occurred throughout in the whole region. When the ditch water depth was 2–4 m in the dry season, the suitable frequency of groundwater during the wheat growth period increased with increasing ditch water depth, and the suitable frequency increased suddenly when the ditch water depth reached 3 m in the dry season suddenly by 8.7%. When the ditch water depth reached 4 m in the dry season, the suitable frequency reached its maximum value of 16.0%, corresponding to Scenarios 11 to 20.
Figure 6 also shows that the SGDC frequency during the corn growth period was primarily affected by the ditches’ water depth in the rainy season, similar to the ditch water depth in the dry season during the wheat growth period. The suitable frequencies for both crops increased as the water depth in the ditches increased. Based on the above analysis, Scenarios 14, 15, 19 and 20 resulted in higher frequencies of SGDC for both crops (see Figure 6).

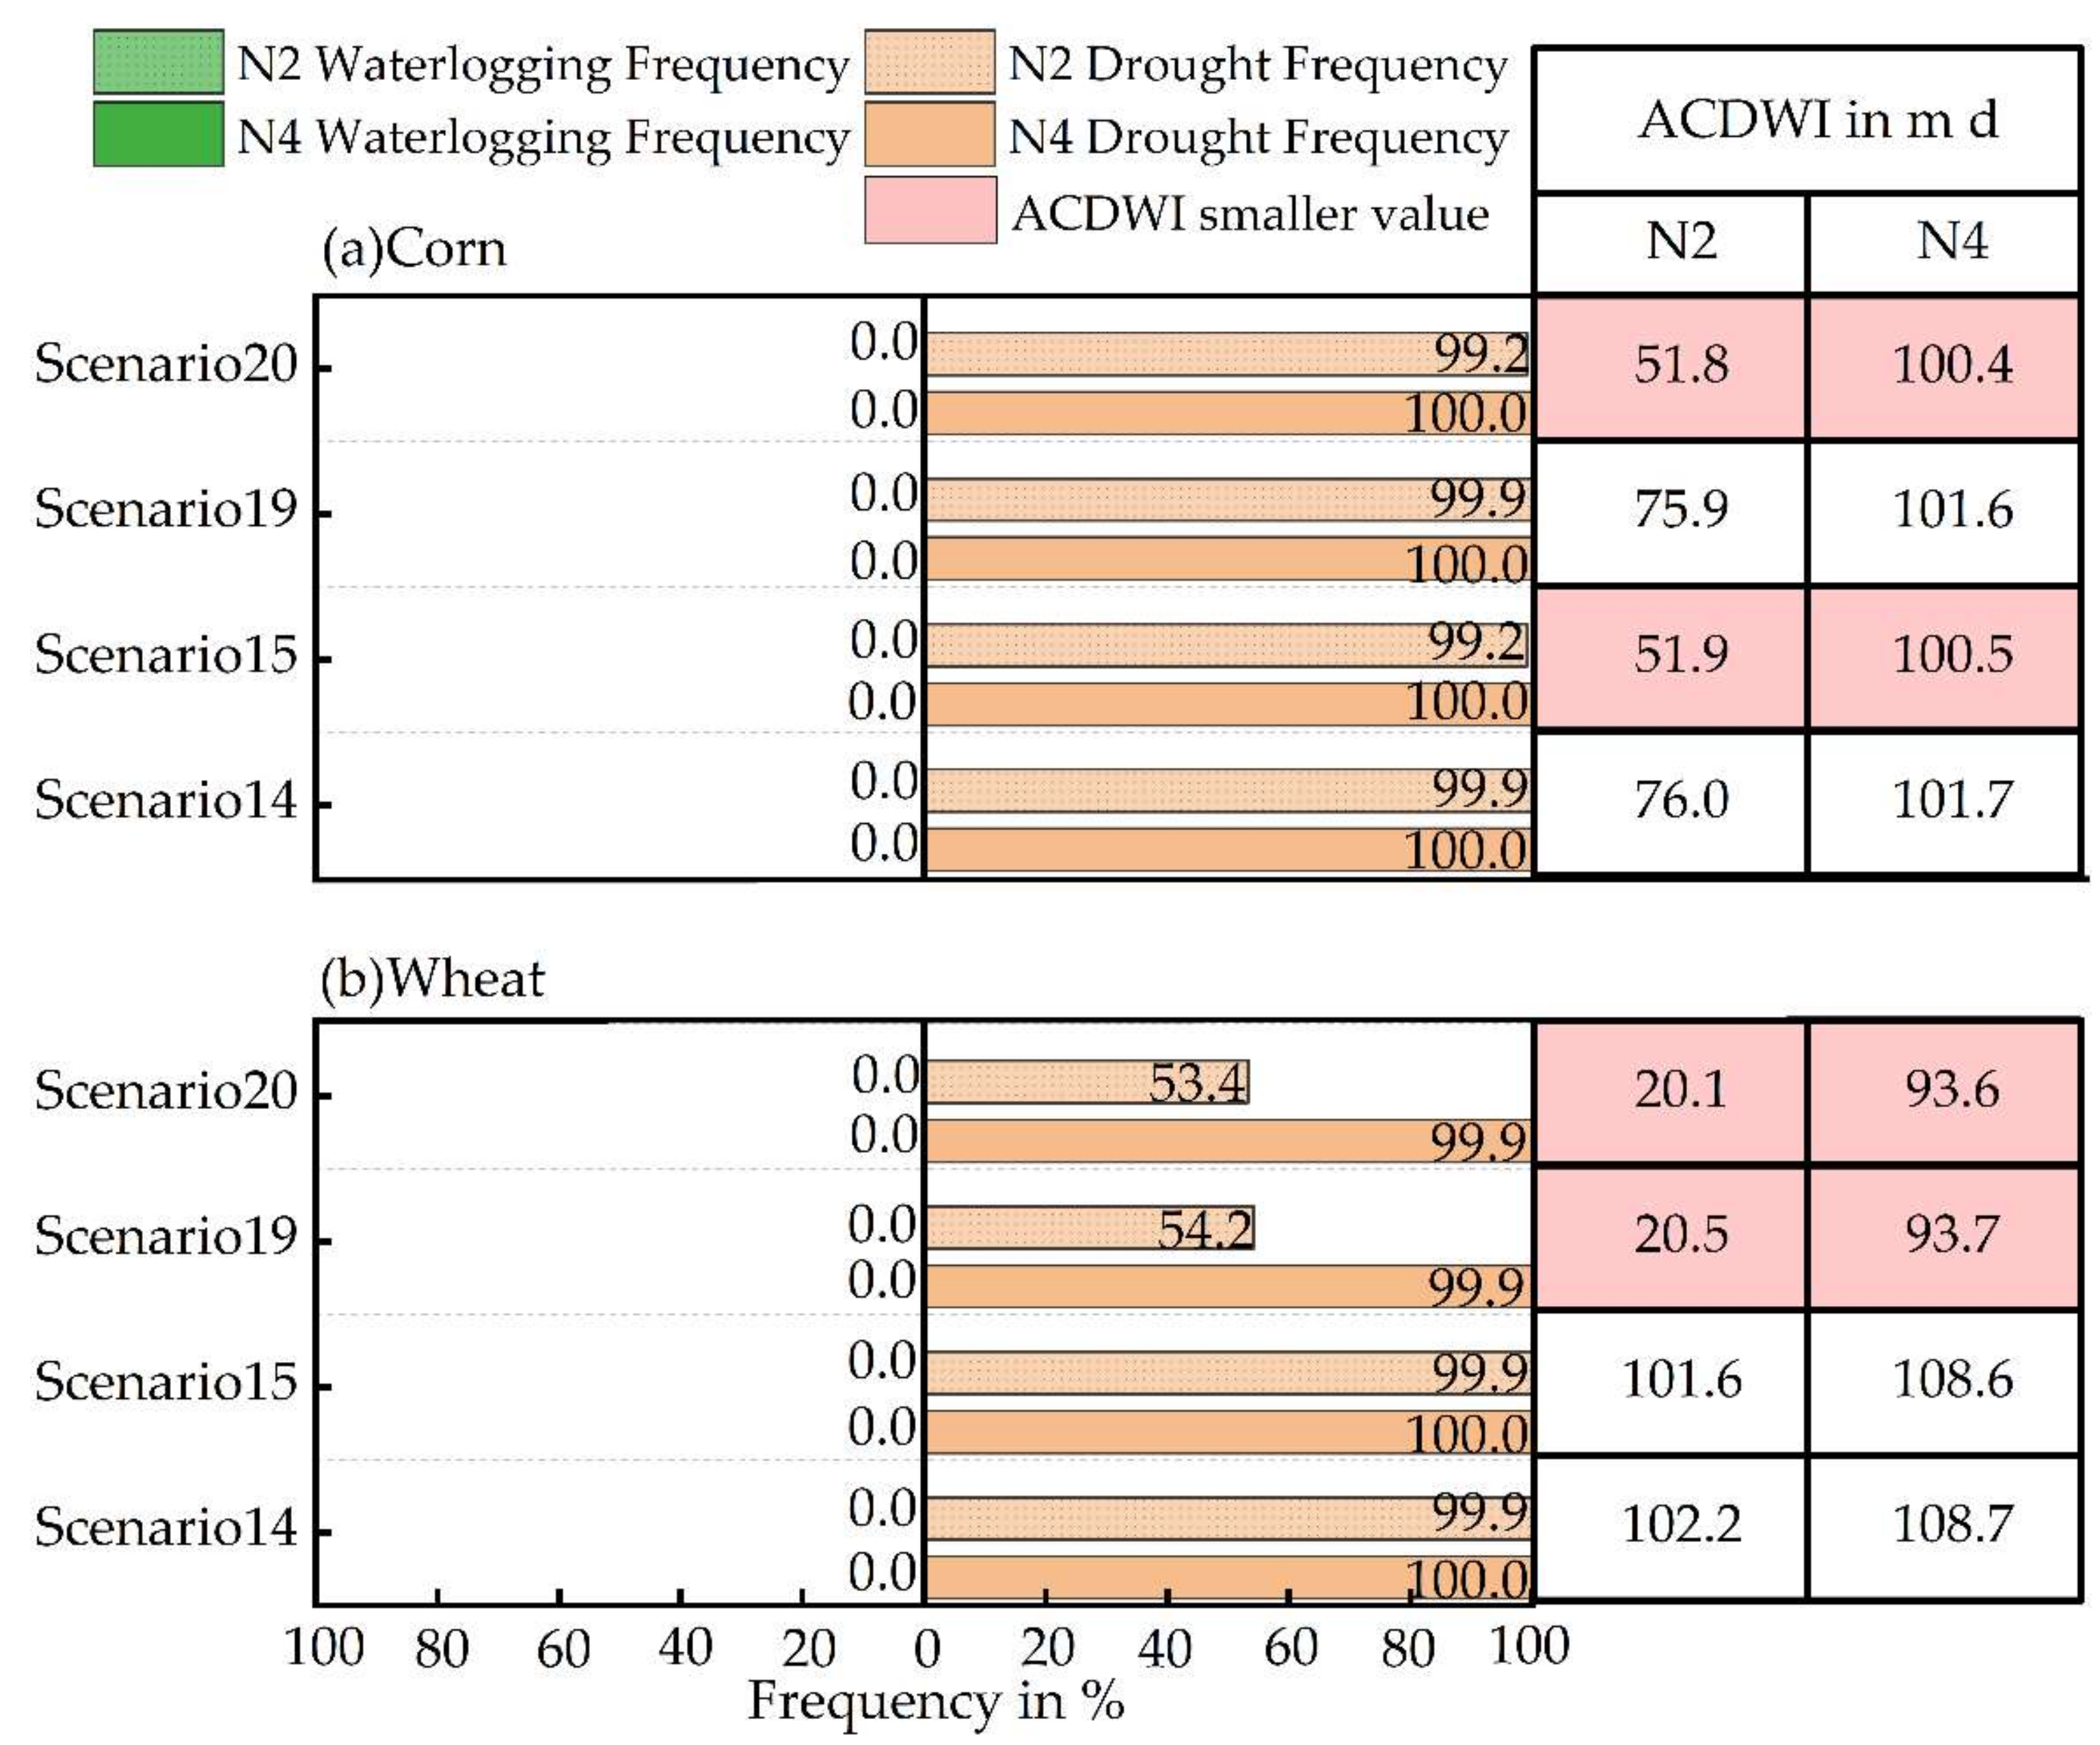
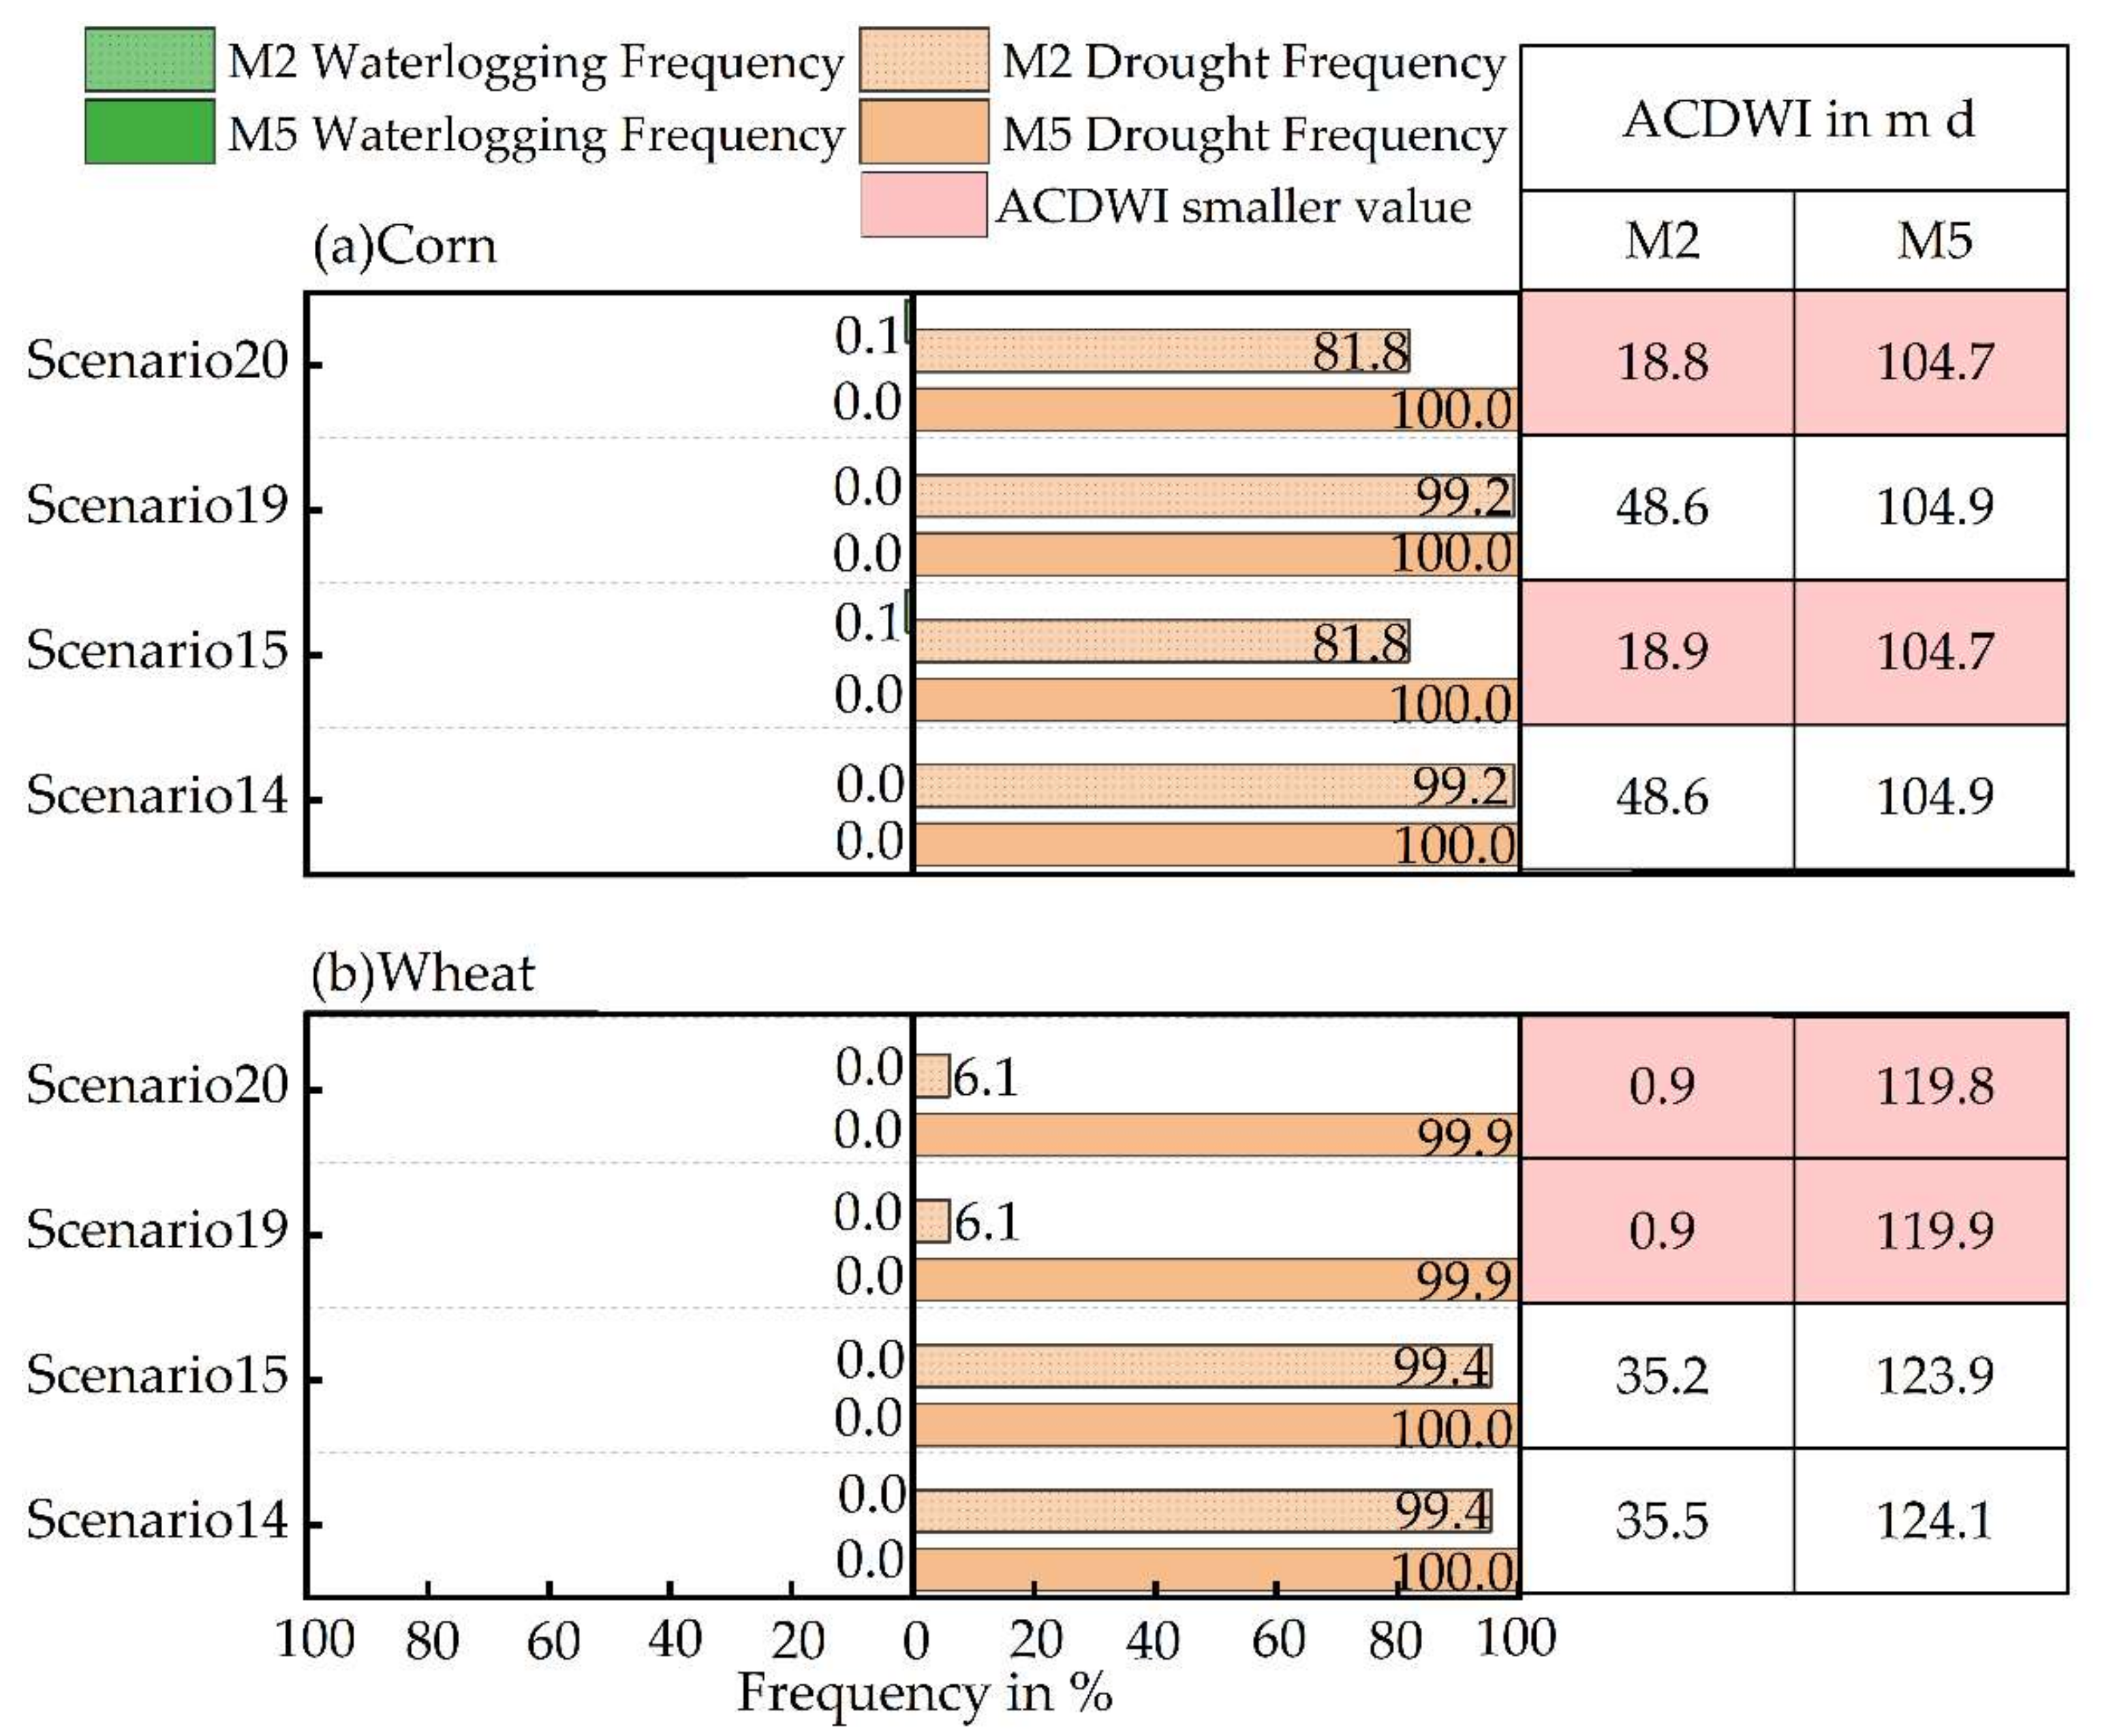
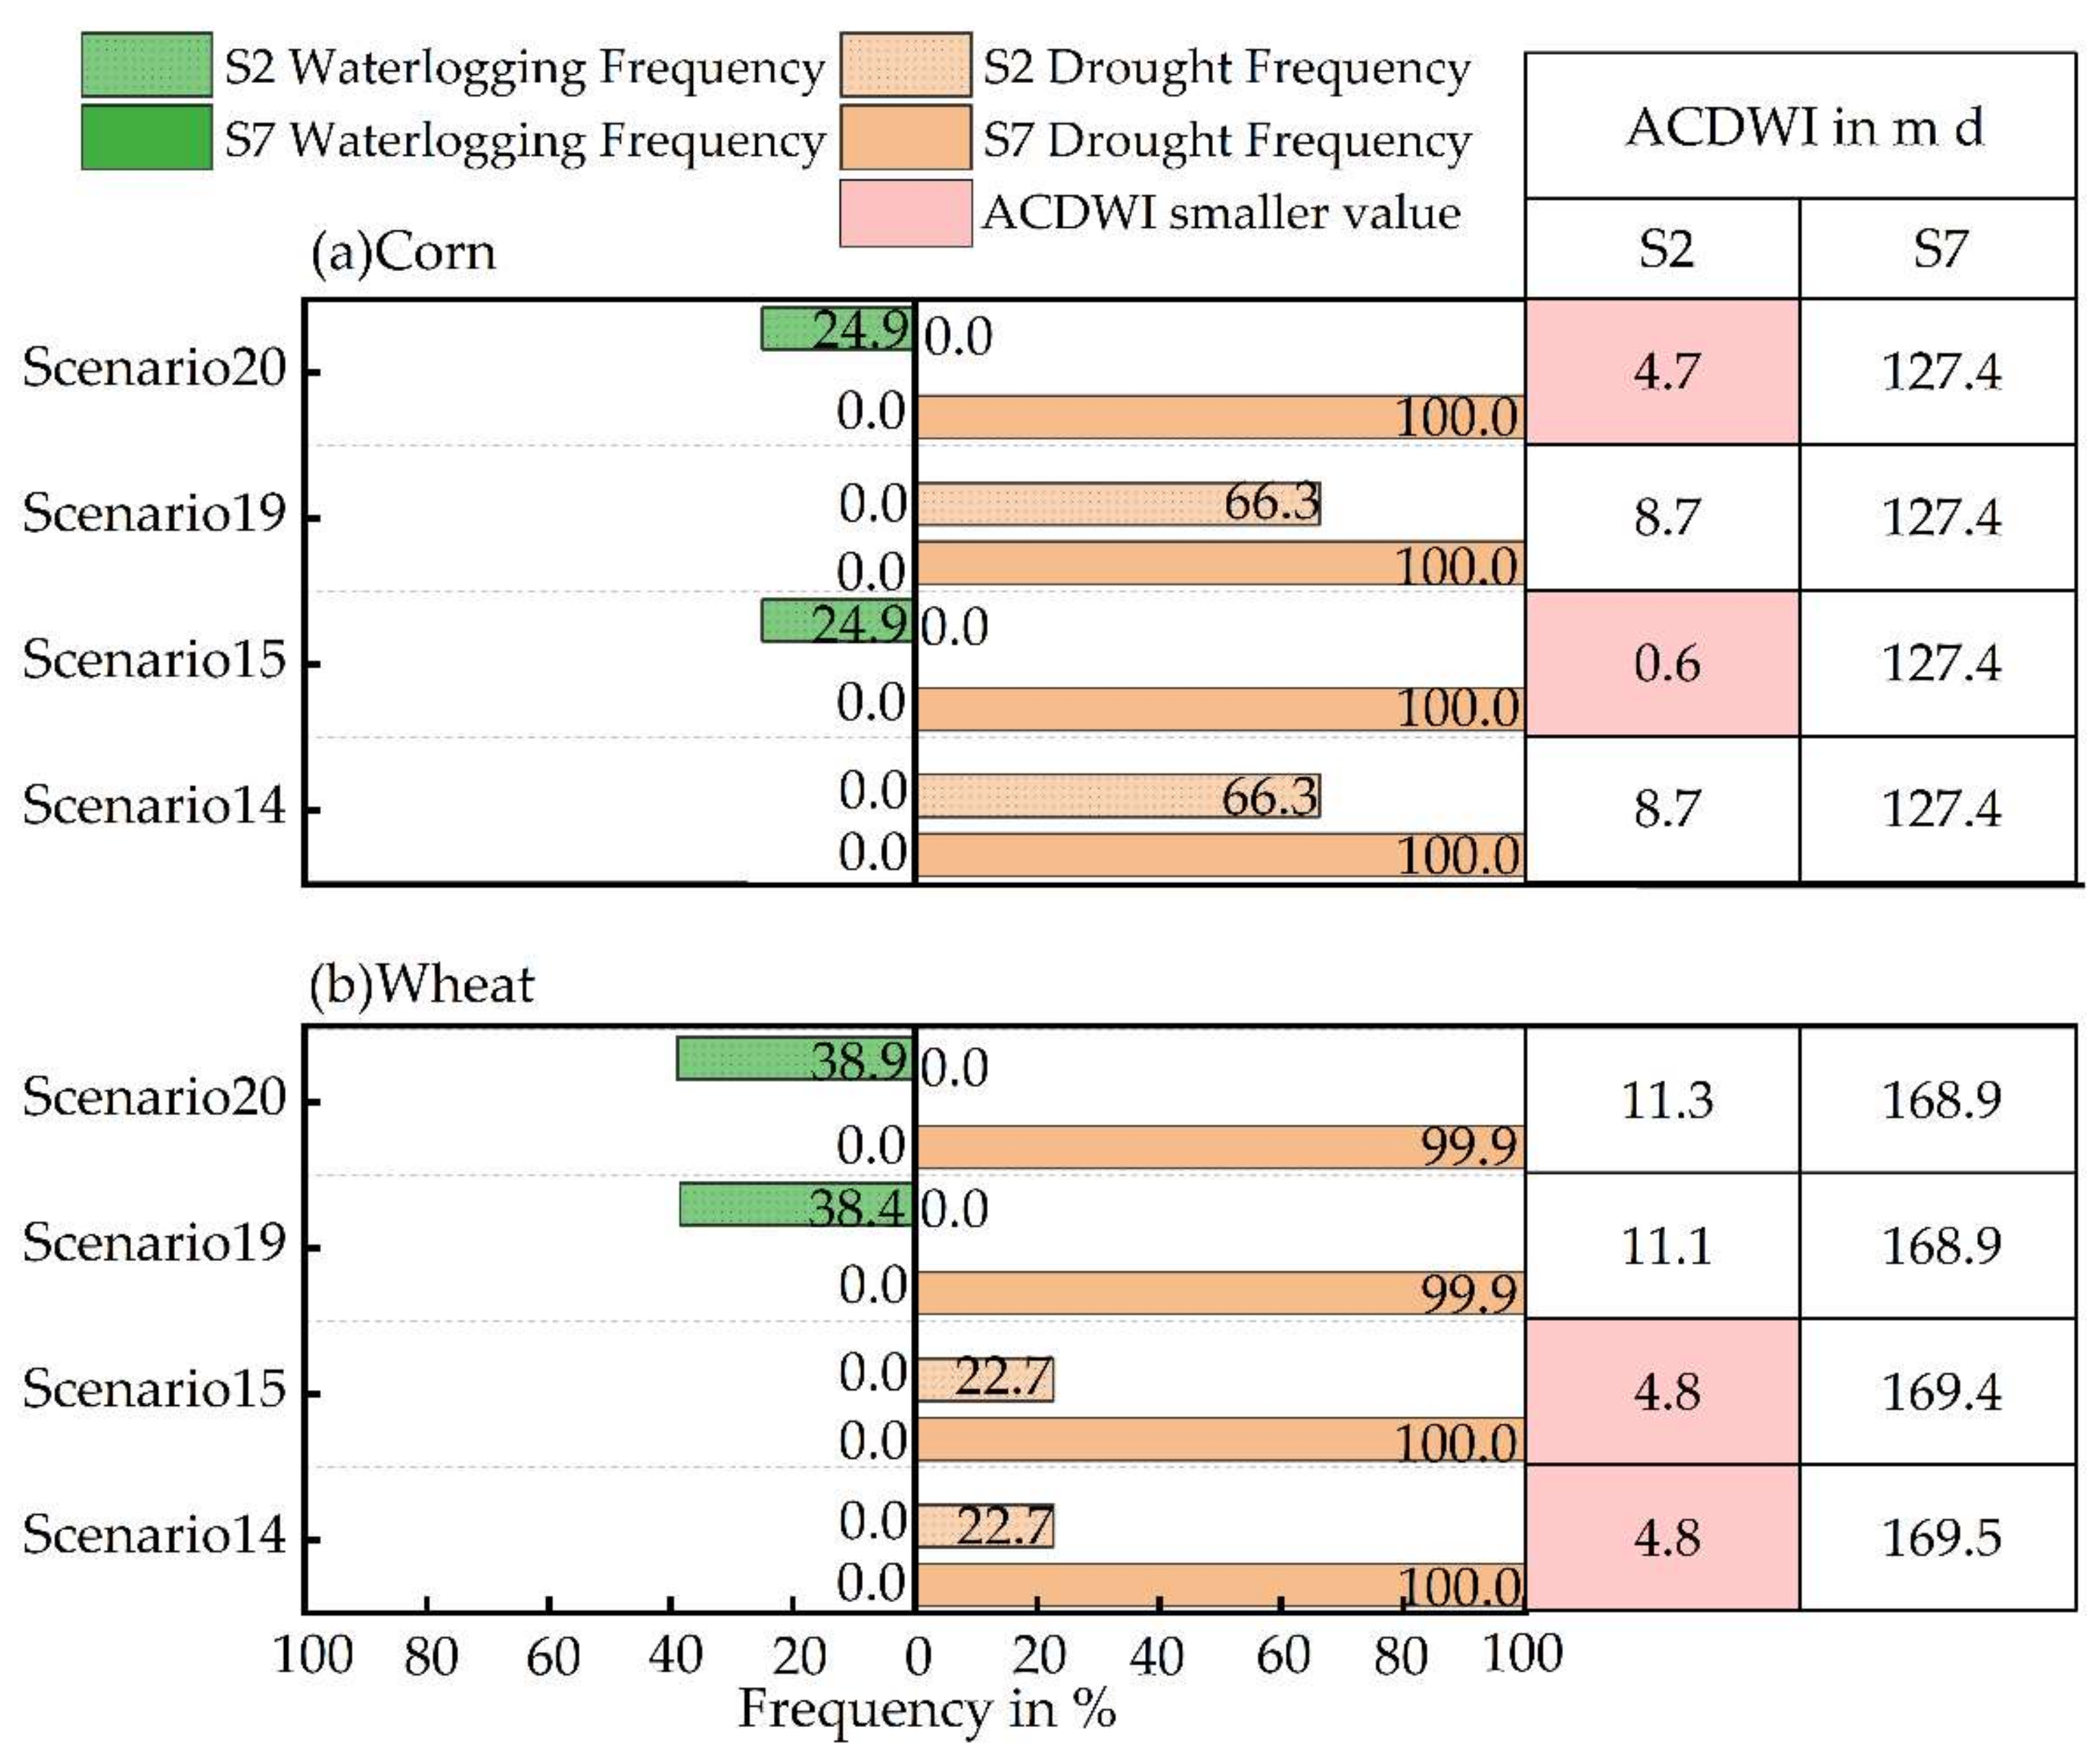
3.2.2. Analysis of the Degree of Drought and Waterlogging Stresses for Scenarios with a High Suitable Groundwater Frequency

Through the above frequency analysis of SGDC reflected by the groundwater level in the study area, it was determined that the combined scenarios of different ditches’ water depths with higher suitable frequencies during the growth periods of both crops were Scenarios 14, 15, 19 and 20. Due to the alternating occurrences of drought and waterlogging in this area, an in-depth analysis was needed to obtain the optimal groundwater-level control scheme among the above four scenarios, using the minimum drought and waterlogging stresses as the criteria. The growth and yield of both crops are closely related to the depth of groundwater. Moreover, due to the different effects of the main drainage ditches on groundwater levels at different locations, the groundwater supplied to crops in different areas varies. To obtain more reasonable scenarios of ditch-water-depth combinations, Scenarios 14, 15, 19 and 20, as identified above, were studied separately to further analyze the drought and waterlogging stresses at representative fields where observation wells existed near and far from the ditch in the northern, middle and southern sections of the study area from 1989 to 2019 (Figure 7, Figure 8 and Figure 9).
During the growth period of corn, when the water depth of the ditches in the rainy season was 4–5 m, the representative fields with observation wells far from the ditch all exposed a groundwater table below the lower limit of the SGDC of 1.0 m; that is, the drought frequency was 100%, showing a dry state (Figure 7a, Figure 8a and Figure 9a). As shown in Figure 7a, no situation higher than the upper limit of the SGDC and no waterlogging occurred in the northern section. In Scenarios 14, 15, 19 and 20, the drought frequency at representative field N2 near the ditch in Scenarios 15 and 20 (both 99.19%) was relatively smaller than that in Scenarios 14 and 19. The degree of crop damage was related to the degree of drought and waterlogging, which was analyzed by ACDWI. The ACDWI of the representative field with observation wells near the ditch (N2) in Scenarios 15 and 20 was less than the values for the corresponding representative fields in other scenarios, and was approximately 52.0 m d. The ACDWI of the representative field with an observation well far from the ditch (N4) was essentially the same for the four selected scenarios; it was approximately 101.0 m d (Figure 7a). Based on a combination of the results of drought and waterlogging frequency, as well as ACDWI, the optimal ditch-depth scenarios for the corn reproductive period in the northern section were Scenarios 15 and 20. According to the same analysis (Figure 8a and 9a), for the middle and southern sections, Scenario 20 and Scenario 15 were optimal.
During the growth period of wheat, Scenarios 14, 15, 19 and 20 correspond to drainage ditch water depths of 3–4 m in the dry season. The representative fields with observation wells far from the ditch were all exposed groundwater levels lower than the lower SGDC limit, showing a dry state (Figure 7b, Figure 8b and Figure 9b). According to Figure 8b, in Scenarios 14, 15, 19 and 20, the drought frequency of approximately 54% at the representative field around N2 near the ditch in Scenarios 19 and 20 was relatively less than that in Scenarios 14 and 15. The ACDWI of Scenarios 19 and 20 was approximately 20.0 m d, less than the value of the corresponding representative fields in other scenarios. Based on a combination of the results of drought and waterlogging frequencies, as well as ACDWI, the optimal ditch-depth scenarios for the wheat reproductive period in the northern section were Scenarios 19 and 20. According to the same analysis for wheat in the middle section, the lowest drought frequency and the lowest ACDWI were found at representative field M2 (near the ditch) and representative field M5 (far from the ditch) for Scenarios 19 and 20 (see Figure 8b). Similarly, for the southern section, Scenarios 14 and 15 are optimal (see Figure 9b).
In summary, Scenarios 15 and 20 were more suitable than other scenarios for corn in all sections. For wheat, Scenarios 19 and 20 were suitable for the middle section and the northern section, but not for the southern section. Therefore, it was difficult to identify a single scenario that was optimal in all sections for both crops (see Table 6). Overall, Scenario 20 was relatively suitable in most cases; it was inferior to Scenarios 14 and 15 for wheat only in the southern section. Therefore, the final recommendation of this study is Scenario 20.
A comparison of Figure 7 and Figure 9 shows that drought stress gradually decreases from the north to the south of the study area. The drought stress of the representative fields near the ditches was lower than for those far from the ditches. The whole region was dominated by drought, and the drought frequency was higher than that of waterlogging. However, in Scenarios 15 and 20, with high ditch-water-depth controls in the middle and south of the study area, waterlogging occurred in the representative fields where observation wells were near the ditch during the growth periods of corn and wheat. This result also indicates that the scenarios with higher ditch-water-depth controls, such as Scenarios 15 and 20, are more suitable for the crop growth and yield in the area.

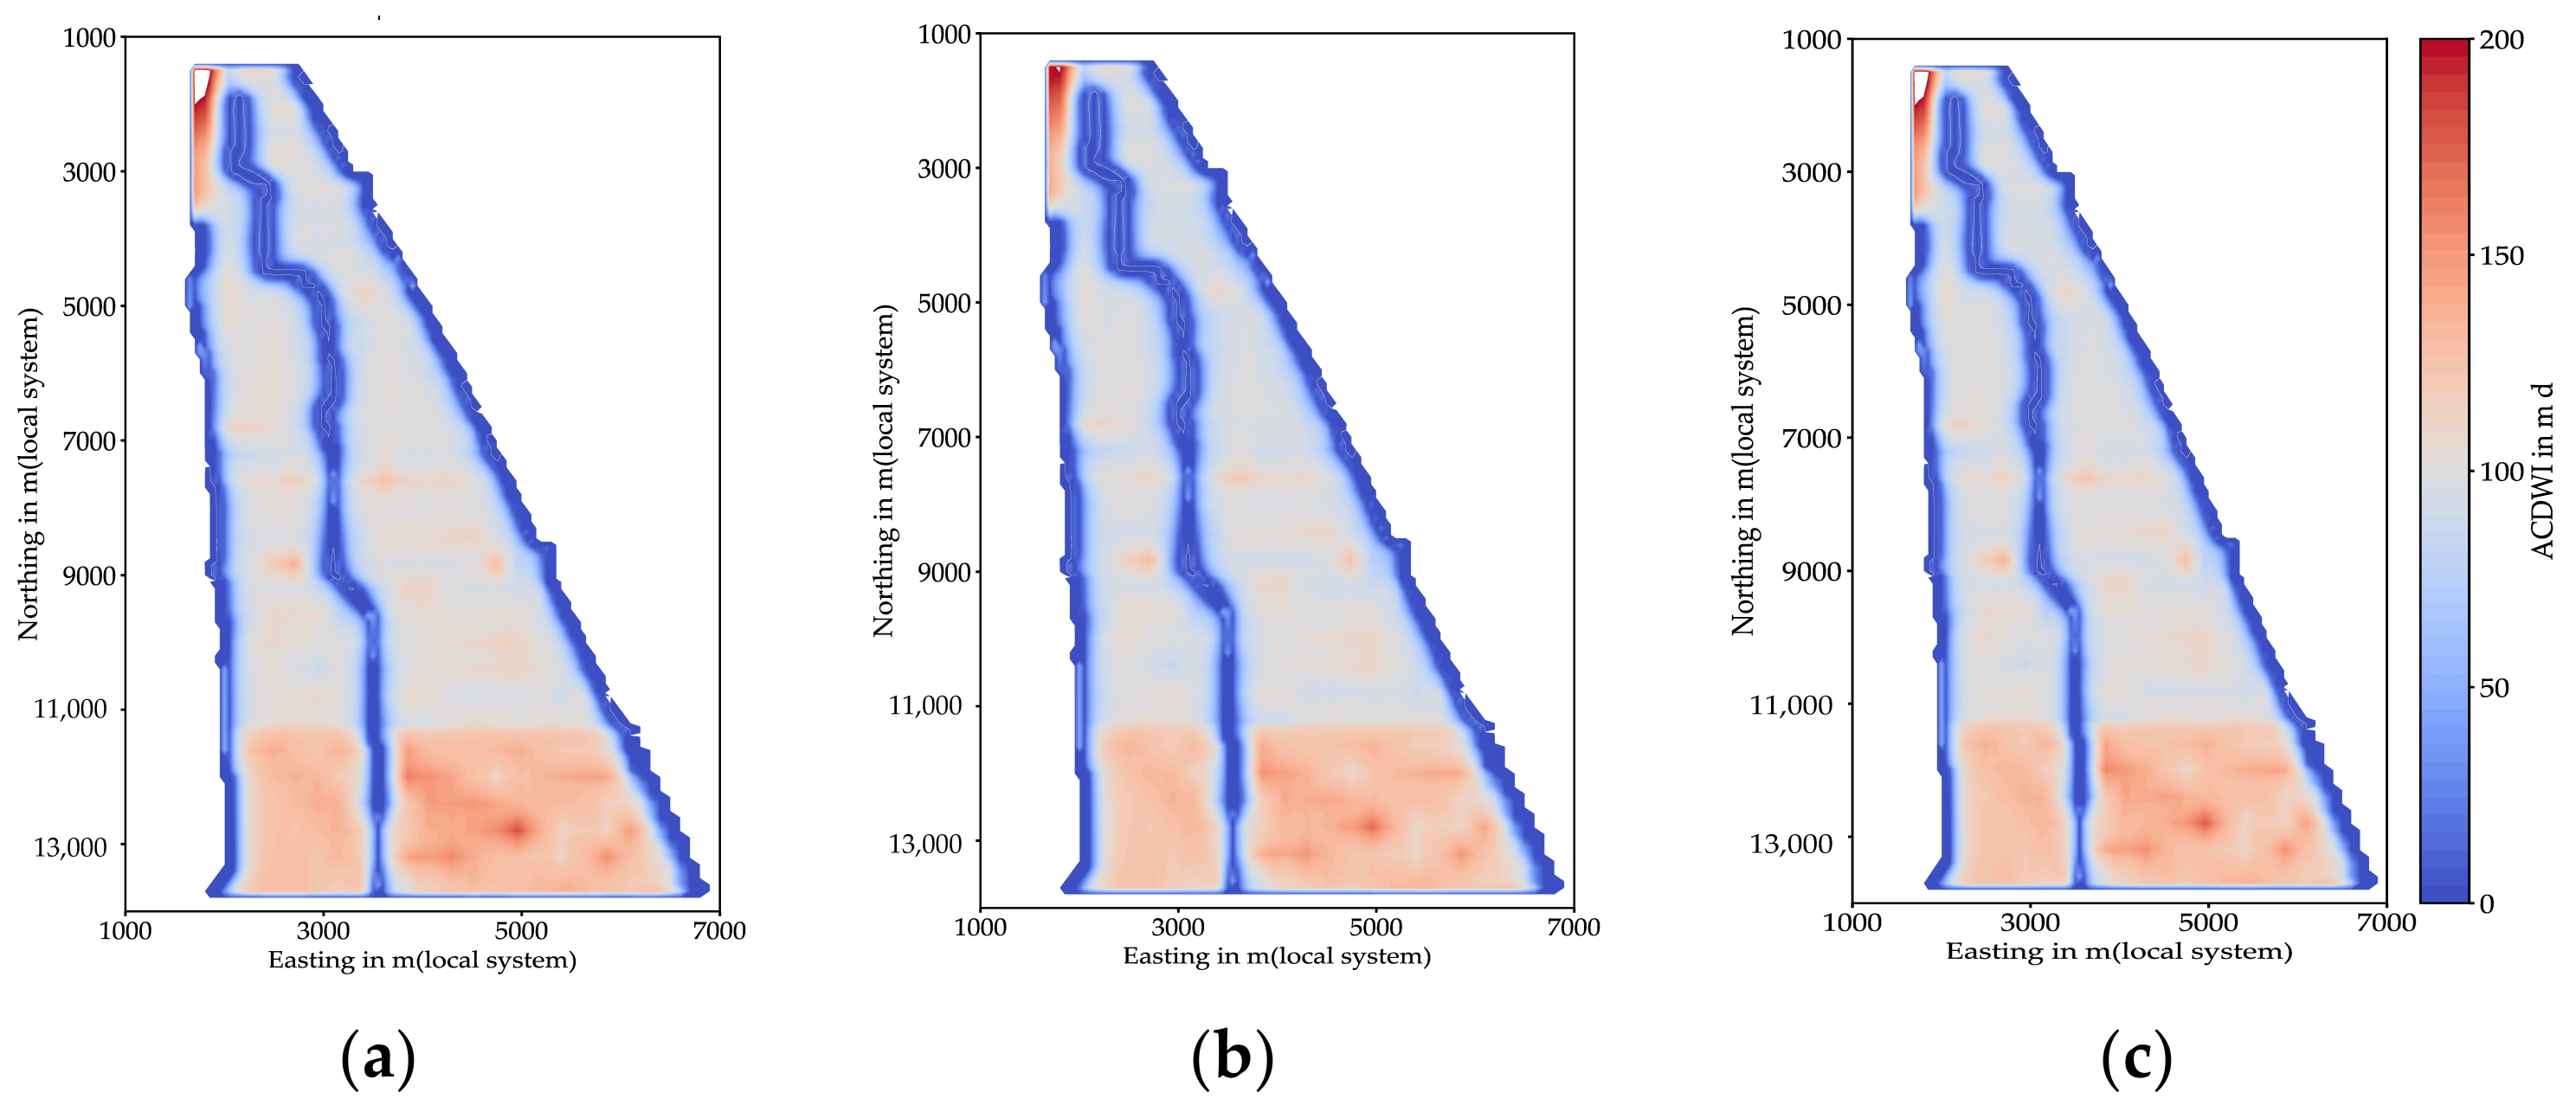
3.3. Analysis of the Temporal and Spatial Distributions of Drought and Waterlogging Stresses under a Comprehensive Optimal Scenario

Based on the recommended Scenario 20, a spatiotemporal analysis of the distribution of drought and waterlogging in the study area from 1989 to 2019 was conducted to provide further suggestions for water management strategies.

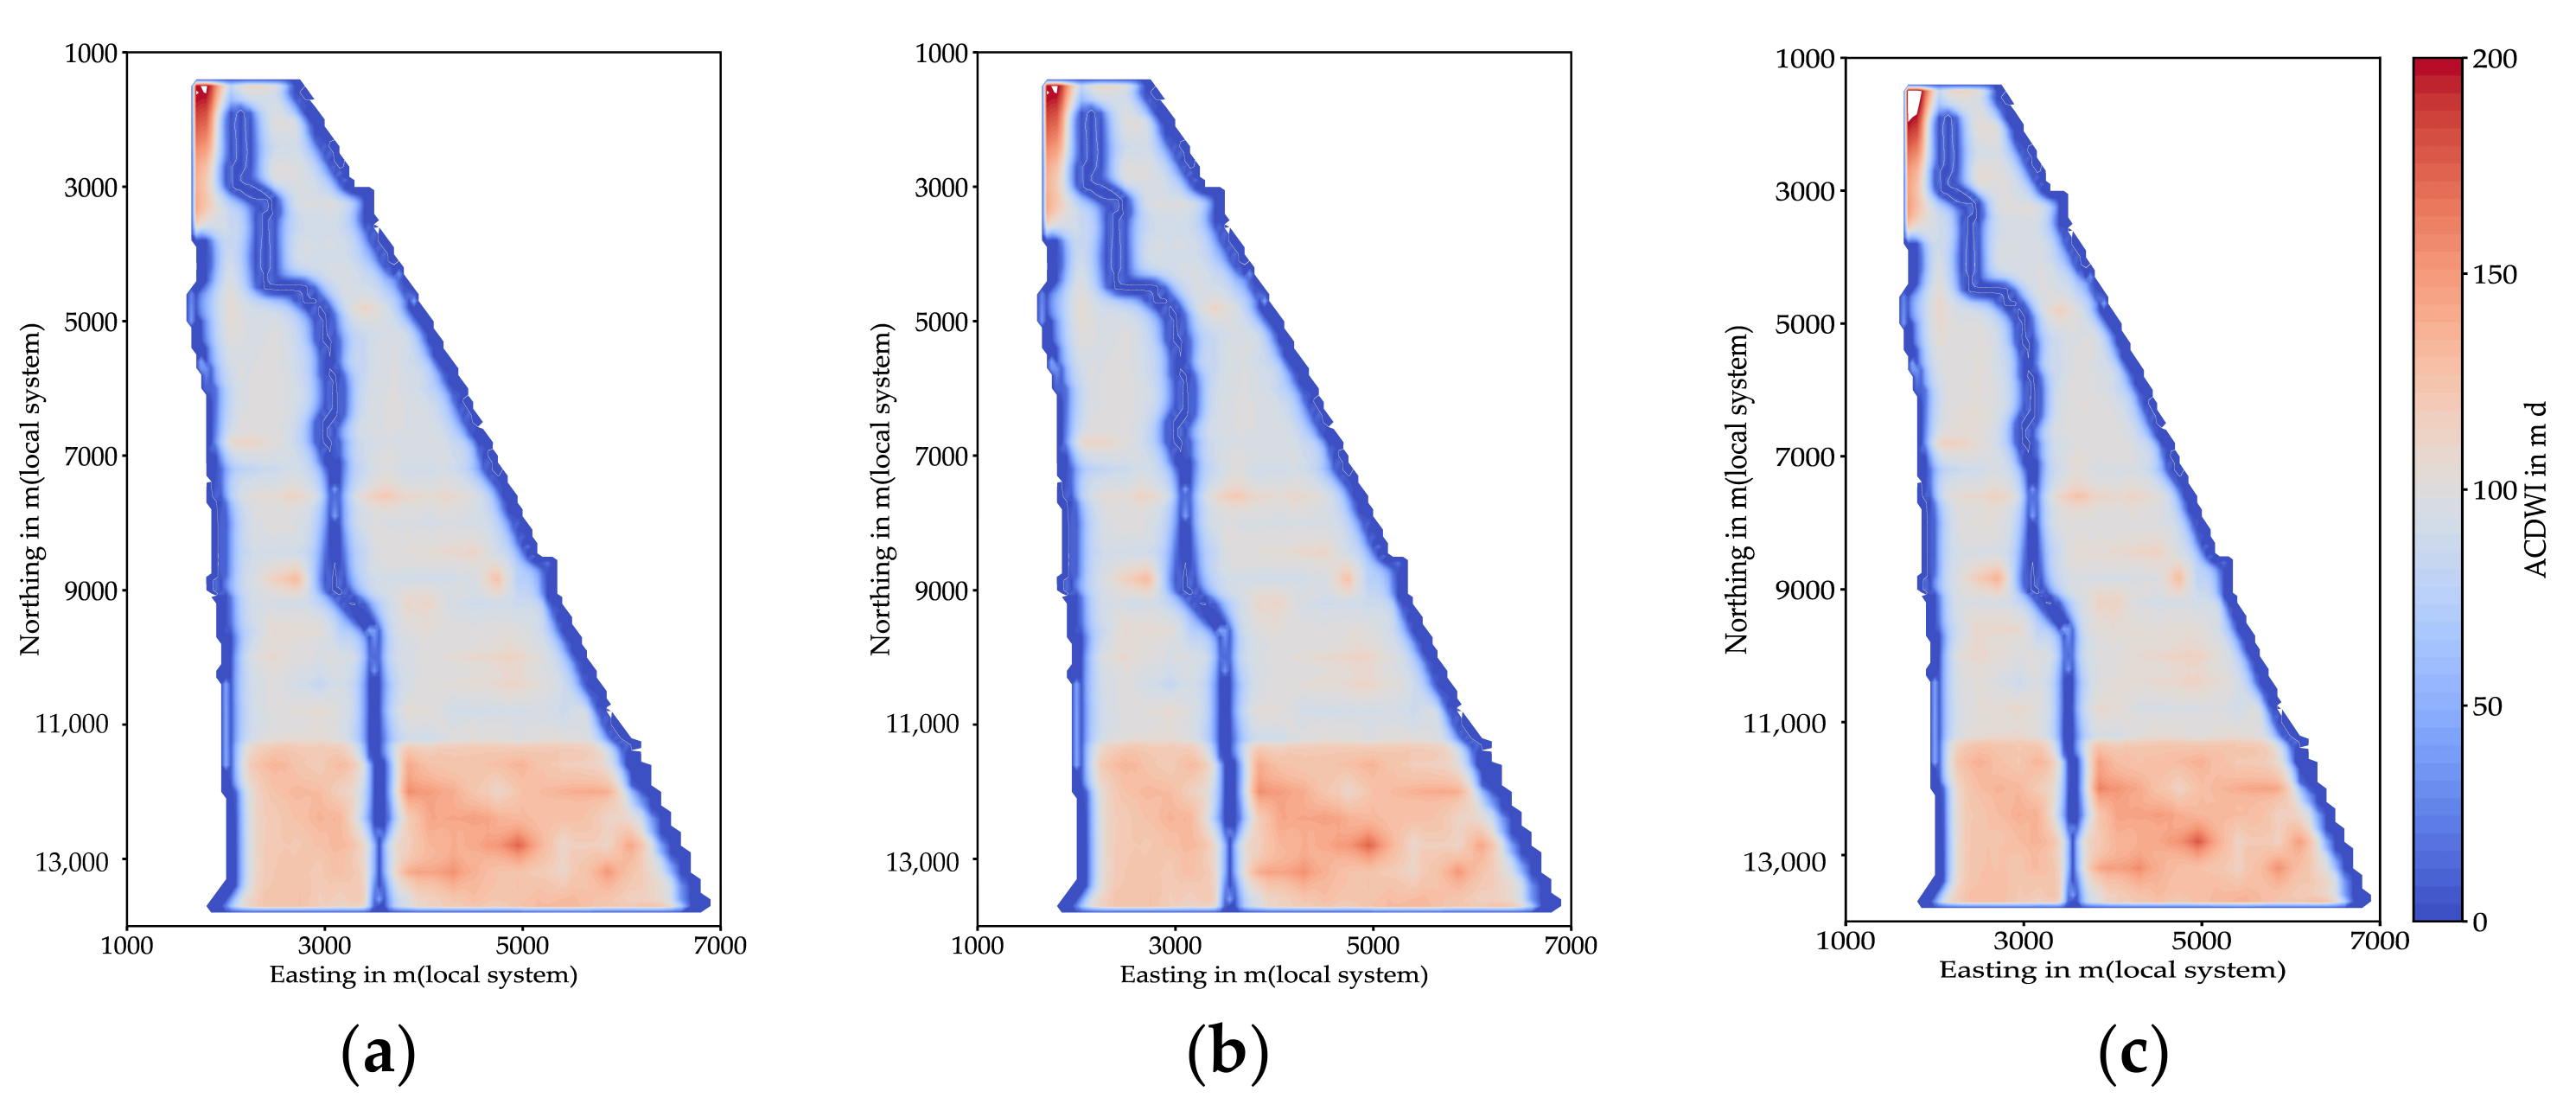
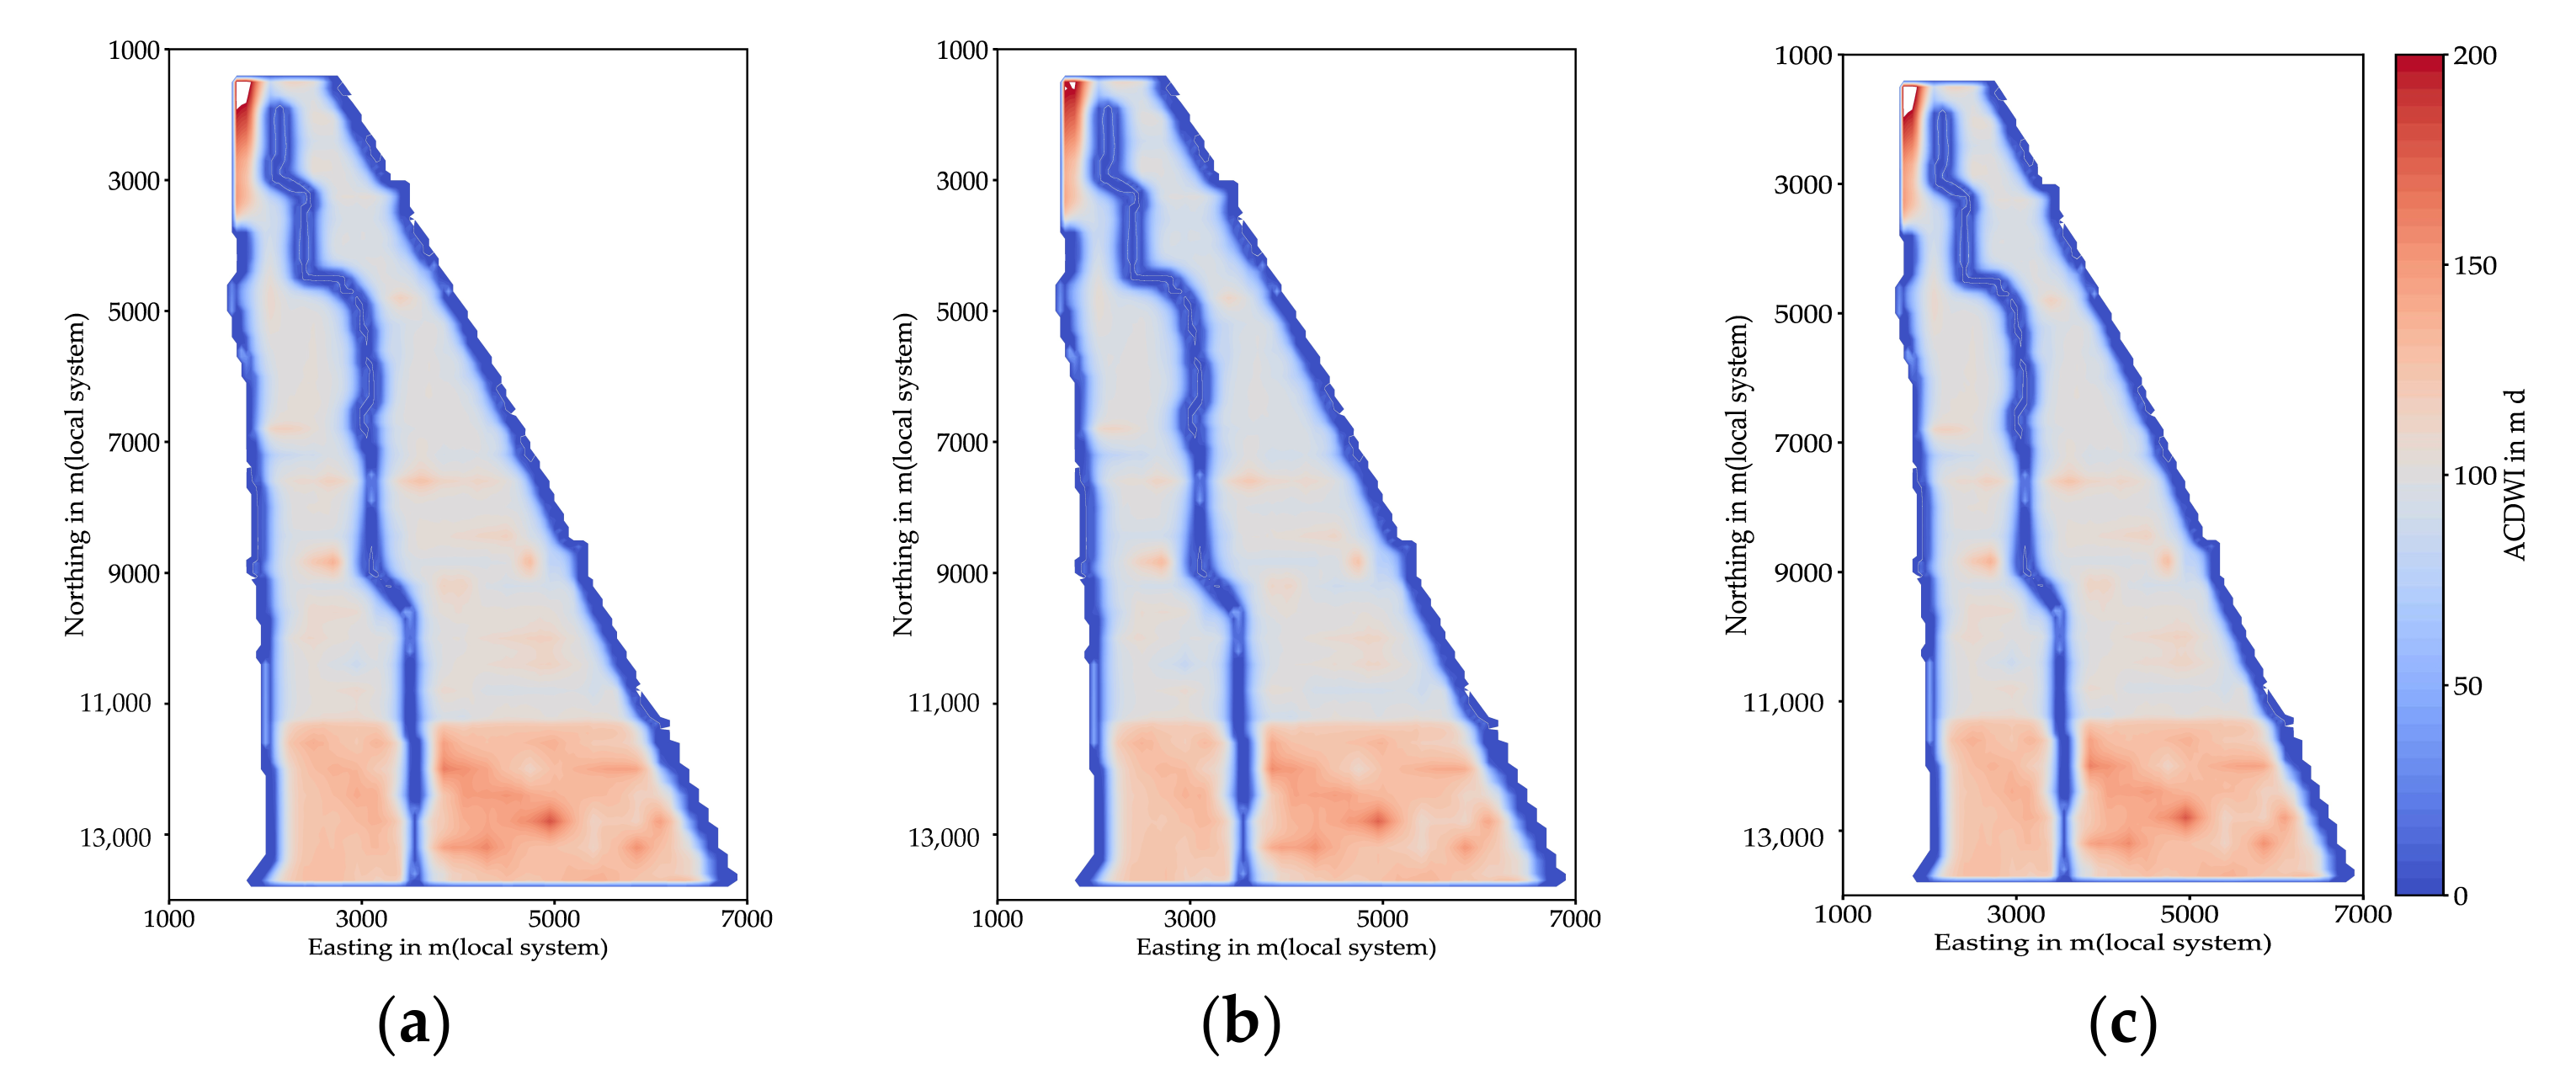
3.3.1. Spatial Distribution Characteristics of Drought and Waterlogging

According to an analysis of the annual cumulative drought and waterlogging intensity (ACDWI) of the two crops in each cell of every 10 years from 1989 to 2019 in the study area (see Figure 10 and Figure 11), most of the high values of ACDWI occurred far from the ditches. Since the study area practices rain-fed farming, if there is no ditch water-level regulation and reliance only on natural precipitation for replenishment, agricultural drought and waterlogging disasters will increase in the region. As shown in Table 7, during the growth period of corn, the ACDWI from 1989 to 1999 was higher than that in the other two 10-year periods, followed by 2010–2019 and lowest in 2000–2009, which was negatively correlated with precipitation, indicating that ACDWI was related to precipitation in the region. From the northern to the southern part of the study area, the ACDWI in each section during the corn growth period showed a clear increasing trend, which indicated that the area needs to be controlled by zoning. During the growth period of wheat, the average ACDWI in the whole area was largest during 1989–1999, followed by 2000–2009, and it was minimal during 2010–2019. The latter two periods had a weak relationship with precipitation. The possible reason is that rainfall mainly occurs during the growth period of corn, while rainfall during the growth period of wheat is low. From the northern to the southern part of the study area, the spatial trend of ACDWI in the growth period of wheat is the same as in the growth period of corn, and it also needs to be regulated by zoning.

3.3.2. Spatial and Temporal Distribution of Droughts and Waterlogging in Different Hydrological Years

According to the precipitation data of Lixin County from 1989 to 2019, three hydrological year types (dry year, normal year and wet year) were determined by annual precipitation depths. Typical years with the frequencies of 75%, 50% and 25% were selected as representative years for analysis [64]. The selected results showed that 2004 was a dry year of 75%, 2008 was a normal year of 50% and 2014 was a wet year of 25% (Figure 2). Figure 12 and Figure 13 show the spatial distribution of ACDWI during the growth period of both crops in different hydrological years. Table 8 shows the ACDWI and the precipitation depths in different hydrological years. During the corn growth period and wheat growth period, the ACDWI of the whole study area was the largest in the dry year of 2004, followed by the wet year in 2014, and minimal in the normal year of 2008. The ACDWI in different hydrological years was negatively correlated with precipitation, indicating that the drought and waterlogging stress during the corn growth period is related to precipitation. From the northern to the southern part of the study area, the ACDWI within each section showed a clear increasing trend during the growth periods of both crops and the need for zonal regulation within the area.

4. Conclusions

In this study, the groundwater-flow model MODFLOW was applied in a study area of 46.9 km2 in the North Huaihe River Plain, China, to simulate the effects of different main drainage-ditch water-depth control schemes on the groundwater level during the growth period of corn and wheat from 1989 to 2019. Based on the upper and lower limits of the suitable groundwater depth of crops (SGDC), the suitable frequency, drought frequency and waterlogging frequency, as well as the annual cumulative drought and waterlogging intensity (ACDWI), were determined to assess the drought and waterlogging stress status of the crops. The main conclusions are as follows:
(1)
MODFLOW is an effective tool for evaluating the effects of open-ditch controlled-drainage programs on regional groundwater conditions that can well reflect the temporal and spatial changes in drought and waterlogging in a given area. Combined with the suitable frequency, drought frequency, waterlogging frequency and cumulative drought and waterlogging intensity of both crops, the drought and waterlogging status in the study area was easily evaluated.
(2)
As the elevation in the north of the study area is higher than in the south, the drought was more serious in the north. The frequency of drought near the ditch showed a decreasing trend from north to south. Therefore, more sluices should be built in different locations of the ditch for zoning control in the future.
(3)
Drought was the dominating stress factor for cropping in the study area, the lowest level of drought stress was achieved under the scenario with highest water depth for the main drainage ditch. This was observed for the entire study area independent from the nearest ditch, albeit the local drought stress was lower in the representative field where observation wells were near to the main ditch than the representative field where observation wells were far from the ditches.
(4)
According to the spatiotemporal variation trend of ACDWI in the scenario with highest water depth, the degree of drought and waterlogging stress decreased with increasing precipitation. It also indicated that drought was the dominating stress factor for cropping in the study area, and it was important to store water during the dry season by closing sluice gates, while it was still necessary to drain excess water on time by opening sluices at storm events during the rainy season.
The results of this study suggest the water depth of the main drainage ditch should be regulated by zoning and by season to alleviate crop drought and waterlogging. Further research is needed to determine how to control the sluice gates in different zones and in different hydrological years. Especially, extreme weather events are becoming more frequent with global warming, and this poses new challenges for the optimization of main drainage ditch control schemes.

Author Contributions

Conceptualization, X.W. and J.H.; data curation, R.T.; formal analysis, R.T. and X.W.; funding acquisition, X.W.; investigation, R.T., X.H., X.W., S.H., T.S., Y.W. and J.L.; methodology, X.W. and J.H.; project administration, X.W.; resources, X.W.; software, R.T., X.H. and S.H.; supervision, X.W.; validation, R.T. and S.H.; visualization, R.T. and Y.Y.; writing—original draft, R.T.; writing—review and editing, X.W. All authors have read and agreed to the published version of the manuscript.

Funding

This research was funded by the National Natural Science Foundation of China, grant number 51790532, the National Key Research and Development Program of China, grant number 2018YFC1508301, and the National Natural Science Foundation of China, grant number 51909286.

Institutional Review Board Statement

Not applicable.

Informed Consent Statement

Not applicable.

Data Availability Statement

The data presented in this study are available on request from the corresponding author.

Acknowledgments

We acknowledge the Chinese Meteorological Administration for providing us with the meteorological data; the NASA (National Aeronautics and Space Administration) for providing us with the DEM data; the National Bureau of Surveying, Mapping and Geographic Information of the People’s Republic of China for providing us with global 1:1 million vector topographic data in Tianditu; and the surveyors of Huaihe River Administration bureau for providing us with the elevation data. Finally, thanks to peer reviewers for improving our manuscript.

Conflicts of Interest

The authors declare no conflict of interest.

References

  1. United Nations; Department of Economic and Social Affairs; Population Division. World Population Prospects 2019: Highlights (ST/ESA/SER.A/423); The United Nations: New York, NY, USA, 2019; pp. 1–37. [Google Scholar]
  2. Stenze, F.; Greve, P.; Lucht, W.; Tramberend, S.; Wada, Y.; Gerten, D. Irrigation of biomass plantations may globally increase water stress more than climate change. Nat. Commun. 2021, 12, 1512. [Google Scholar] [CrossRef]
  3. Long, D.; Chen, X.; Scanlon, B.R.; Wada, Y.; Hong, Y.; Singh, V.P.; Chen, Y.; Wang, C.G.; Han, Z.Y.; Yang, W.T. Have GRACE satellites overestimated groundwater depletion in the Northwest India Aquifer? Sci. Rep. 2016, 6, 24398. [Google Scholar] [CrossRef]
  4. Abd-Elaty, I.; Negm, A.M.; Sallam, G. Environmental Impact Assessment of Subsurface Drainage Projects; Springer: Cham, Switzerland, 2017; pp. 59–85. [Google Scholar] [CrossRef]
  5. Tan, C.S.; Drury, C.F.; Soultani, M.; van Wesenbeeck, I.J.; Ng, H.Y.F.; Gaynor, J.D.; Welacky, T.W. Controlled drainage and subirrigation effects on crop yields and water quality. In Proceedings of the 7th Annual Drainage Symposium, Drainage in the 21st Century: Food Production and the Environment, Orlando, Florida, USA, 8–10 March 1998; Hutzinger, O., Barcelo, D., Kostainoy, A.G., Eds.; Springer: Cham, Switzerland, 2018; Volume 59, pp. 59–85. [Google Scholar]
  6. Skaggs, R.W.; Fausey, N.R.; Evans, R.O. Drainage water management. J. Soil Water Conserv. 2012, 67, 167A–172A. [Google Scholar] [CrossRef] [Green Version]
  7. Herman, B. Integrated Water Management for the 21st Century: Problems and Solutions. J. Irrig. Drain. Eng. 2002, 128, 193–202. [Google Scholar]
  8. Gunn, K.M.; Fausey, N.R.; Shang, Y.H.; Shedekar, V.S.; Ghane Ehsan, W.M.D.; Brown, L.C. Subsurface drainage volume reduction with drainage water management: Case studies in Ohio, USA. Agric. Water Manag. 2015, 149, 131–142. [Google Scholar] [CrossRef]
  9. Ayars, J.E.; Christen, E.W.; Hornbuckle, J.W. Controlled drainage for improved water management in arid regions irrigated agriculture. Agric. Water Manag. 2006, 86, 128–139. [Google Scholar] [CrossRef]
  10. Parsons, J.E.; Skaggs, R.W.; Doty, C.W. Simulation of controlled drainage in open-ditch drainage systems. Agric. Water Manag. 1990, 18, 301–316. [Google Scholar] [CrossRef]
  11. Gilliam, J.W.; Skaggs, R.W.; Weed, S.B. Drainage Control to Diminish Nitrate Loss from Agricultural Fields. J. Environ. Qual. 1979, 8, 1–9. [Google Scholar] [CrossRef]
  12. Jing, W.H.; Luo, W.; Wen, J.; Jia, Z.H. Analysis on the effect of controlled drainage and supplemental irrigation on crop yield and drainage. J. Hydraul. Eng. 2009, 40, 1140–1146. [Google Scholar] [CrossRef]
  13. Manik, S.; Pengilley, G.; Dean, G.; Field, B.; Shabala, S.; Zhou, M. Soil and Crop Management Practices to Minimize the Impact of Waterlogging on Crop Productivity. Front. Plant Sci. 2019, 10, 1–23. [Google Scholar] [CrossRef] [Green Version]
  14. Rittenburg, R.A.; Squires, A.L.; Boll, J. Agricultural BMP Effectiveness and Dominant Hydrological Flow Paths: Concepts and a Review. J. Am. Water Resour. Assoc. 2015, 51, 305–329. [Google Scholar] [CrossRef]
  15. Lafond, J.A.; Gumiere, S.J.; Vanlandeghem, V.; Gallichand, J.; Rousseau, A.N.; Dutilleul, P. Temporal and Local Heterogeneities of Water Table Depth under Different Agricultural Water Management Conditions. Water 2021, 13, 2148. [Google Scholar] [CrossRef]
  16. Tanner, C.C.; Nguyen, M.L.; Sukias, J.P.S. Constructed wetland attenuation of nitrogen exported in subsurface drainage from irrigated and rain-fed dairy pastures. Water Sci. Technol. 2005, 51, 55–61. [Google Scholar] [CrossRef] [PubMed]
  17. Chao, Z.; Fang, X.; Na, J.; Che, M. A Collaborative Sensing System for Farmland Water Conservancy Project Maintenance through Integrating Satellite, Aerial, and Ground Observations. Water 2021, 13, 2163. [Google Scholar] [CrossRef]
  18. Abdullah, O.D.; Prem, B.P.; Ying, O.; Darrel, W.S. Evaluating the impacts of crop rotations on groundwater storage and recharge in an agricultural watershed. Agric. Water Manag. 2016, 163, 332–343. [Google Scholar] [CrossRef] [Green Version]
  19. Ni, X.J.; Parajuli, P.B.; Ouyang, Y. Assessing Agriculture Conservation Practice Impacts on Groundwater Levels at Watershed Scale. Water Resour. Manag. 2020, 34, 1553–1566. [Google Scholar] [CrossRef]
  20. Hutmacher, R.B.; Ayars, J.E.; Vail, S.S.; Bravo, A.; Dettinger, D.; Schoneman, R. Uptake of shallow groundwater by cotton: Growth stage, groundwater salinity effects in column lysimeters. Agric. Water Manag. 1996, 31, 205–223. [Google Scholar] [CrossRef]
  21. Yang, X.L.; Chen, Y.Q.; Pacenka, S.; Gao, W.S.; Ma, L.; Wang, G.Y.; Yan, P.; Sui, P.; Steenhuis, T.S. Effect of diversified crop rotations on groundwater levels and crop water productivity in the North China Plain. J. Hydrol. 2015, 522, 428–438. [Google Scholar] [CrossRef]
  22. Xiao, L.; Fulai, L.; Dong, J. Priming: A promising strategy for crop production in response to future climate. J. Integr. Agric. 2017, 16, 2709–2716. [Google Scholar] [CrossRef]
  23. Lyu, J.; Mo, S.; Luo, P.; Zhou, M.; Shen, B.; Nover, D. A quantitative assessment of hydrological responses to climate change and human activities at spatiotemporal within a typical catchment on the Loess Plateau, China. Quat. Int. 2019, 527, 1–11. [Google Scholar] [CrossRef]
  24. Harbaugh, A.W. MODFLOW-2005, the U.S. Geological Survey Modular Ground-Water Model the Ground-Water Flow Process: U.S. Geological Survey Techniques and Methods 6-A16; Library of Congress: Reston, VA, USA, 2005; pp. 1–3.
  25. Liu, S.; Zhou, Y.; Xie, M.; McCalin, M.E.; Wang, X.S. Comparative Assessment of Methods for Coupling Regional and Local Groundwater Flow Models: A Case Study in the Beijing Plain, China. Water 2021, 13, 2229. [Google Scholar] [CrossRef]
  26. Tizro, A.T.; Voudouris, K.; Mattas, C.; Kamali, M.; Rabanifar, M. Sustainable Agriculture and Food Security; Springer: Cham, Switzerland, 2018; pp. 121–141. [Google Scholar] [CrossRef]
  27. Goswami, D.; Kalita, P.K.; Mehnert, E. Modeling and Simulation of Baseflow to Drainage Ditches during Low-Flow Periods. Water Resour. Manag. 2010, 24, 173–191. [Google Scholar] [CrossRef]
  28. Gerla, P.J. Monitoring and Modeling the Effect of Agricultural Drainage and Recent Channel Incision on Adjacent Groundwater-Dependent Ecosystems. Water 2019, 11, 863. [Google Scholar] [CrossRef] [Green Version]
  29. Fowler, K.R.; Jenkins, E.W.; Ostrove, C.; Chrispell, J.C.; Farthing, M.W.; Parno, M. A decision making framework with MODFLOW-FMP2 via optimization: Determining trade-offs in crop selection. Environ. Modell. Softw. 2015, 69, 280–291. [Google Scholar] [CrossRef] [Green Version]
  30. Sabzzadeh, M.; Shourian, M. Maximizing crops yield net benefit in a groundwater-irrigated plain constrained to aquifer stable depletion using a coupled PSO-SWAT-MODFLOW hydro-agronomic model. J. Clean. Prod. 2020, 262, 121349. [Google Scholar] [CrossRef]
  31. Yuan, N.; Xiong, Y.; Li, Y.; Xu, B.; Liu, F. Experimental Study of the Effect of Controlled Drainage on Soil Water and Nitrogen Balance. Water 2021, 13, 2241. [Google Scholar] [CrossRef]
  32. Ballantine, D.; Tanner, C. Controlled drainage systems to reduce contaminant losses and optimize productivity from New Zealand pastoral systems. N. Z. J. Agric. Res. 2013, 56, 171–185. [Google Scholar] [CrossRef]
  33. Zhang, Q.; Zhang, J.; Yan, D.; Wang, Y.F. Extreme precipitation events identified using detrended fluctuation analysis (DFA) in Anhui, China. Theor. Appl. Climatol. 2014, 117, 169–174. [Google Scholar] [CrossRef]
  34. Zhu, H.W.; Zhang, W.H.; Zhang, L.P.; Xu, G.E. Different Types of Disasters in Recent 10 Years in Anhui and Their Trend. J. Catastrophol. 2003, 18, 64–70. [Google Scholar] [CrossRef]
  35. Zhao, J.; Xu, J.C.; Li, X.C.; Zhong, Y.; Han, D.H. Characteristics analysis of spatial and temporal variation on extreme weather events in Anhui Province for recent 50years. Nat. Hazards 2017, 89, 817–842. [Google Scholar] [CrossRef]
  36. Wang, F.H.; Zhou, H.F.; Dong, F.A.; Wang, S.Y.; Zhang, Y.Q.; Sun, J.H. Analysis of drought and flood regularity of farmland in Northern Anhui Province in the past 60 years based on daily rainfall index. Environ. Ecol. 2021, 3, 46–53. [Google Scholar]
  37. Zhang, P.; Wang, F.H.; Wu, Z.L.; Zhu, Z. Analysis of the climatic patterns of drought and flood transition in Huaibei City. Express Water Resour. Hydropower Inf. 2008, 29, 139–151. [Google Scholar] [CrossRef]
  38. Zhang, A.M.; Ma, X.Q.; Yang, T.M.; Meng, S.X.; Huang, Y. The Influence of Dought and Waterlogging Disasters on Corp Yields in Anhui Provinc. J. Appl. Meteorol. Sci. 2007, 18, 619–629. [Google Scholar] [CrossRef]
  39. Du, Z.Y.; Chen, S.L. Drought-flood hazards in Anhui province and variations of their stress on agriculture. J. Subtrop. Resour. Environ. 2018, 13, 78–84. [Google Scholar] [CrossRef]
  40. Sun, Z.Y.; Zhang, J.Q.; Zhang, Q.; Hu, Y.; Yan, D.H. Integrated risk zoning of drought and waterlogging disasters based on fuzzy comprehensive evaluation in Anhui Province, China. Nat. Hazards 2014, 71, 1369–1657. [Google Scholar] [CrossRef]
  41. Yuan, H.W.; Cui, Y.; Ning, S.W.; Jiang, S.M.; Yuan, X.J.; Tang, G.M. Estimation of maize evapotraspiration under drought stress—A case study of Huaibei Plain, China. PLoS ONE 2019, 14, 1–18. [Google Scholar] [CrossRef] [Green Version]
  42. Wang, H.S.; Li, Y.; Zhang, Q.; Kaie, Z. A Study on Irrigation Division Based on Crop and Groundwater Experiment. Water Sav. Irri. 2018, 1, 86–89. [Google Scholar] [CrossRef]
  43. Kahlown, M.A.; Ashraf, M.; Zia-ul-Haq. Effect of shallow groundwater table on crop water requirements and crop yields. Agric. Water Manag. 2005, 76, 24–35. [Google Scholar] [CrossRef]
  44. Harbaugh, A.W.; Banta, E.R.; Hill, M.C.; Mcdonald, M.G. MODFLOW-2000, the U.S. Geological Survey Modular Ground-Water Model—User Guide to Modularization Concepts and the Ground-Water Flow Proces; U.S. Geological Survey: Reston, VA, USA, 2005; pp. 10–40.
  45. Department of Science and Technology Education; Ministry of Water Resources. Study on Irrigation and Drainage Technology of Shajiang Black Soil; Department of Science and Technology Education, Ministry of Water Resources: Anhui, China, 1990; pp. 9–32.
  46. Survey and Design Institute of Water Resources Bureau of Anhui Province; Nanjing Institute of Soil Science; Chinese Academy of Sciences. Soils in Huaibei Plain; Shanghai People’s Publishing House: Shanghai, China, 1976; pp. 60–89. [Google Scholar]
  47. Lu, H.T. Research of the Reason of Pore Water Quality Variations in Loose-Rocks Induced by Groundwater Source Heat Pump in Lixin Count. Master’s Thesis, Hefei University of Technology, Anhui, China, 2016. [Google Scholar] [CrossRef]
  48. Shi, Q. Soil Mechanics, 2nd ed.; Wuhan University Press: Wuhan, China, 2010; pp. 110–112. [Google Scholar]
  49. Zhang, W.Z. Groundwater and Soil Hydrodynamics; China Water Resources and Hydropower Press: Beijing, China, 1994; pp. 17–19. [Google Scholar]
  50. Tao, Y.Z.; Yao, M.; Zhang, B.F. Solution and its application of transient stream/groundwater model subjected to time-dependent vertical seepage. Appl. Math. Mech. 2007, 28, 1173–1180. [Google Scholar] [CrossRef]
  51. Allen, R.G.; Pereira, L.S.; Raes, D.; Smith, M. Crop Evapotranspiration. Guidelines for Computing Crop Water Requirements; FAO: Rome, Italy, 1998; pp. 29–79. [Google Scholar]
  52. LI, Y.H. Water Saving Irrigation Theories and Techniques; Wuhan University Press: Wuhan, China, 1999; pp. 53–56. [Google Scholar]
  53. Inam, A.; Adamowski, J.; Prasher, S.; Albano, R. Parameter estimation and uncertainty analysis of the Spatial Agro Hydro Salinity Model (SAHYSMOD) in the semi-arid climate of Rechna Doab, Pakistan. Environ. Modell. Softw. 2017, 94, 186–211. [Google Scholar] [CrossRef]
  54. Huang, J.; Hartemink, A.E.; Kucharik, C.J. Soil-dependent responses of US crop yields to climate variability and depth to groundwater. Agric. Syst. 2021, 190, 103085. [Google Scholar] [CrossRef]
  55. Gonzalo, R.; Rattalino, E.; Archontoulis, S.V.; Yang, H.S.; Grassini, P. Do shallow water tables contribute to high and stable maize yields in the US Corn Belt? Glob. Food Secur. 2018, 18, 27–34. [Google Scholar] [CrossRef]
  56. Li, J.; Wang, Z.L.; Wu, X.J.; Zscheischler, J.; Guo, S.L.; Chen, X.H. A standardized index for assessing sub-monthly compound dry and hot conditions with application in China. Hydrol. Earth Syst. Sci. 2021, 25, 1587–1601. [Google Scholar] [CrossRef]
  57. Chiang, F.; Mazdiyasni, O.; Aghakouchak, A. Evidence of anthropogenic impacts on global drought frequency, duration, and intensity. Nat. Commun. 2021, 12, 1–10. [Google Scholar] [CrossRef] [PubMed]
  58. Mostaghimi, S.; Mcmahon, P.C.; Lembke, W.D. Surface and subsurface drainage simulations for a claypan soil. Agr. Water Manag. 1989, 15, 211–222. [Google Scholar] [CrossRef]
  59. Kuang, W.; Yuan, X.J.; Cao, X.Q.; Xue, Y.F. Experimental Study on Water Production Function for Waterlogging Stress on Corn. Proc. Eng. 2012, 28, 598–603. [Google Scholar] [CrossRef] [Green Version]
  60. Styczen, M.E.; Jensen, K.; Hansen, S.; Zarris, D. Yield and development of winter wheat (Triticum aestivum L.) and spring barley (Hordeum vulgare) in field experiments with variable weather and drainage conditions. Eur. J. Agron. 2020, 122, 1–11. [Google Scholar] [CrossRef]
  61. Xue, J.; Ren, L. Conjunctive use of saline and non-saline water in an irrigation district of the Yellow River Basin. Irrig. Drain. 2017, 66, 147–162. [Google Scholar] [CrossRef]
  62. Chen, Z.W.; Liu, X.N.; Zhu, B. Runoff estimation in hillslope cropland of purple soil based on SCS-CN model. Trans. Chin. Soc. Agric. Eng. 2014, 30, 72–81. [Google Scholar] [CrossRef]
  63. Moriasi, D. Model evaluation guidelines for systematic quantification of accuracy in watershed simulations. Trans. ASABE 2007, 50, 885–900. [Google Scholar] [CrossRef]
  64. Hu, Y.L.; Huang, Z.D.; Qi, X.B.; Zhang, Y.; Liang, Z.J.; Zhao, Z.J. Study on Optimal Allocation of Water Resources in Irrigation District Based on Linear Programming and MODFLOW Coupling Technology. J. Irrig. Drain. 2019, 38, 85–92. [Google Scholar] [CrossRef]
Figure 1. Overview of the study area. (a) Location of the study area. (b) Study area in detail, with the ditches, monitoring wells and sections in the location of the study area. The topographic map of Anhui Province was obtained from the National Administration of Surveying, Mapping and Geographic Information of the People’s Republic of China (http://www.nasg.gov.cn/, accessed on 20 September 2021). The DEM source of the Lixin city was obtained from the NASA (National Aeronautics and Space Administration) website (http://reverb.echo.nasa.gov/reverb/, accessed on 20 September 2021). (c) Conceptual model layout.
Water 14 00029 g001
Figure 2. Annual precipitation measurements from Lixin County Meteorological Station and annual ETp from Bozhou city Meteorological Station from 1989 to 2019 (refer to Section 3.2.2 for the selection of different hydrological years).
Water 14 00029 g002
Figure 3. Comparison of the groundwater levels in the study area during the calibration period (2015–2017) (a) and the validation period (2018–2019) (b).
Water 14 00029 g003
Figure 4. (a) Simulated and measured groundwater-level-change process of the representative field around M2 near the ditch (b) and the representative field around M5 far from the ditch, from 2015 to 2019; (c) water-level-change process of the Chezhe ditch and Xihongsi ditch in the middle line, where ditches cross the groundwater observation well line in the middle section (see Figure 1b).
Water 14 00029 g004
Figure 5. Cross-section of groundwater level in middle line for corn and wheat of Scenarios 1 and 20: (a) 17 August 2008, during corn reproductive stage; (b) 12 April 2008, during wheat reproductive stage.
Water 14 00029 g005aWater 14 00029 g005b
Figure 6. Frequencies of SGDC for corn and wheat under different ditch-water-depth scenarios from 1989 to 2019.
Water 14 00029 g006
Figure 7. Drought and waterlogging stresses under different ditches’ water-depth scenarios in the northern section from 1989 to 2019, (a) corn growth period, (b) wheat growth period.
Water 14 00029 g007
Figure 8. Drought and waterlogging stresses under different ditches’ water-depth scenarios in the middle section from 1989 to 2019, (a) corn growth period, (b) wheat growth period.
Water 14 00029 g008
Figure 9. Drought and waterlogging stresses under different ditches’ water-depth scenarios in the southern section from 1989 to 2019, (a) corn growth period, (b) wheat growth period.
Water 14 00029 g009
Figure 10. ACDWI for every 10 years of corn growth period during the 1989–2019: (a) 1989–1999, (b) 2000–2009 and (c) 2010–2019.
Water 14 00029 g010
Figure 11. ACDWI for every 10 years of wheat growth period during the 1989–2019: (a) 1989–1999, (b) 2000–2009 and (c) 2010–2019.
Water 14 00029 g011
Figure 12. Spatial distribution of ACDWI in the corn growth period in different hydrological years: (a) 2004, (b) 2008 and (c) 2014.
Water 14 00029 g012
Figure 13. Spatial distribution of ACDWI in the wheat growth period in different hydrological years: (a) 2004, (b) 2008 and (c) 2014.
Water 14 00029 g013
Table 1. The initial values of the hydraulic conductivity and specific yield in the model.
LayersHydraulic Conductivity (m/d)Specific Yield
The Range of ValuesThe Initial ValueThe Range of ValuesThe Initial Value
Layer1 (0–6 m)0.05–1.50.780.03–0.0650.048
Layer2 (6–35 m)0.5–94.750.07–0.160.115
Table 2. Water-depth setting of the main drainage ditches.
Drainage Ditches’ Water Depth (Above the Bottom of the Ditch) in Dry Season in m (from October to May of the Following Year)Drainage Ditches’ Water Depth (Above the Bottom of the Ditch) in Wet Season in m (from June to September)
12345
Scenario No.
112345
2678910
31112131415
41617181920
Table 3. Characteristics of two crops.
Crop NameBotanical NameSGDC in mSowing TimeHarvesting TimeRemarks
CornZea mays0.4–1.05 June20 SeptemberSensitive to excess water
WheatTriticum aestivum0.6–1.51 October31 MaySensitive to temperature
Table 4. The validation values of the hydraulic conductivity and specific yield in the model.
LayersLayer 1 (0–6 m)Layer 2 (6–35 m)
ParametersHydraulic Conductivity(m/d)Specific YieldHydraulic Conductivity (m/d)Specific Yield
Northern and Middle Section0.50.0550.1
Southern Section0.50.0650.1
Table 5. Distance between representative observation wells near the ditch and far from the ditch and the main drainage ditches in the northern, middle and southern line.
LineObservation WellsDistance from Chezhe Ditch/mDistance from Xihongsi Ditch/mPosition
NorthernN240850near the Chezhe ditch
N4465455far from both ditches
MiddleM2702050near the Chezhe ditch
M57001340far from both ditches
SouthernS2502470near the Chezhe ditch
S714101125far from both ditches
Table 6. Suitable scenarios based on a low waterlogging frequency and ACDWI at representative fields with observation wells near and far from the ditch.
SectionCrop
CornWheat
NorthernScenarios 15 and 20Scenarios 19 and 20
MiddleScenarios 15 and 20Scenarios 19 and 20
SouthernScenarios 15 and 20Scenarios 14 and 15
Table 7. Spatiotemporal ACDWI averages for all decades and sections, together with the respective precipitation depths.
CropSection1989–19992000–20092010–2019
CornNorthern67.363.267.2
Middle77.674.377.4
Southern108.2104.6107.7
Full area scale87.183.586.8
WheatNorthern56.254.250.7
Middle70.369.564.7
Southern137.7136.0126.7
Full area scale92.290.984.8
Average annual precipitation in mm859.61018.5900.2
Table 8. Spatiotemporal ACDWI averages for different hydrological years and sections, together with the respective precipitation depths.
CropSection2004 (75%)2008 (50%)2014 (25%)
CornNorthern67.562.065.7
Middle77.773.875.8
Southern108.4104.0106.1
Full area scale87.282.985.2
WheatNorthern55.154.354.6
Middle70.169.369.6
Southern135.7135.9136.5
Full area scale91.390.891.2
Annual precipitation in mm733.8859.6919.9
Publisher’s Note: MDPI stays neutral with regard to jurisdictional claims in published maps and institutional affiliations.

