
The Effect of Sol-Gel Coatings on the Phosphorus (P) Adsorption Capacity of Calcareous Materials for Use in Water Treatment

 ,
,  and
and
Abstract
:1. Introduction
2. Materials and Methods
2.1. Non-Coated Materials
2.2. Coated Materials and Coating Procedure
2.3. Physical and Chemical Characterization
2.4. Sorption Isotherm Experiments
2.5. Adsorption Models
2.6. Statistical Analysis
3. Results
3.1. Physical and Chemical Characteristics
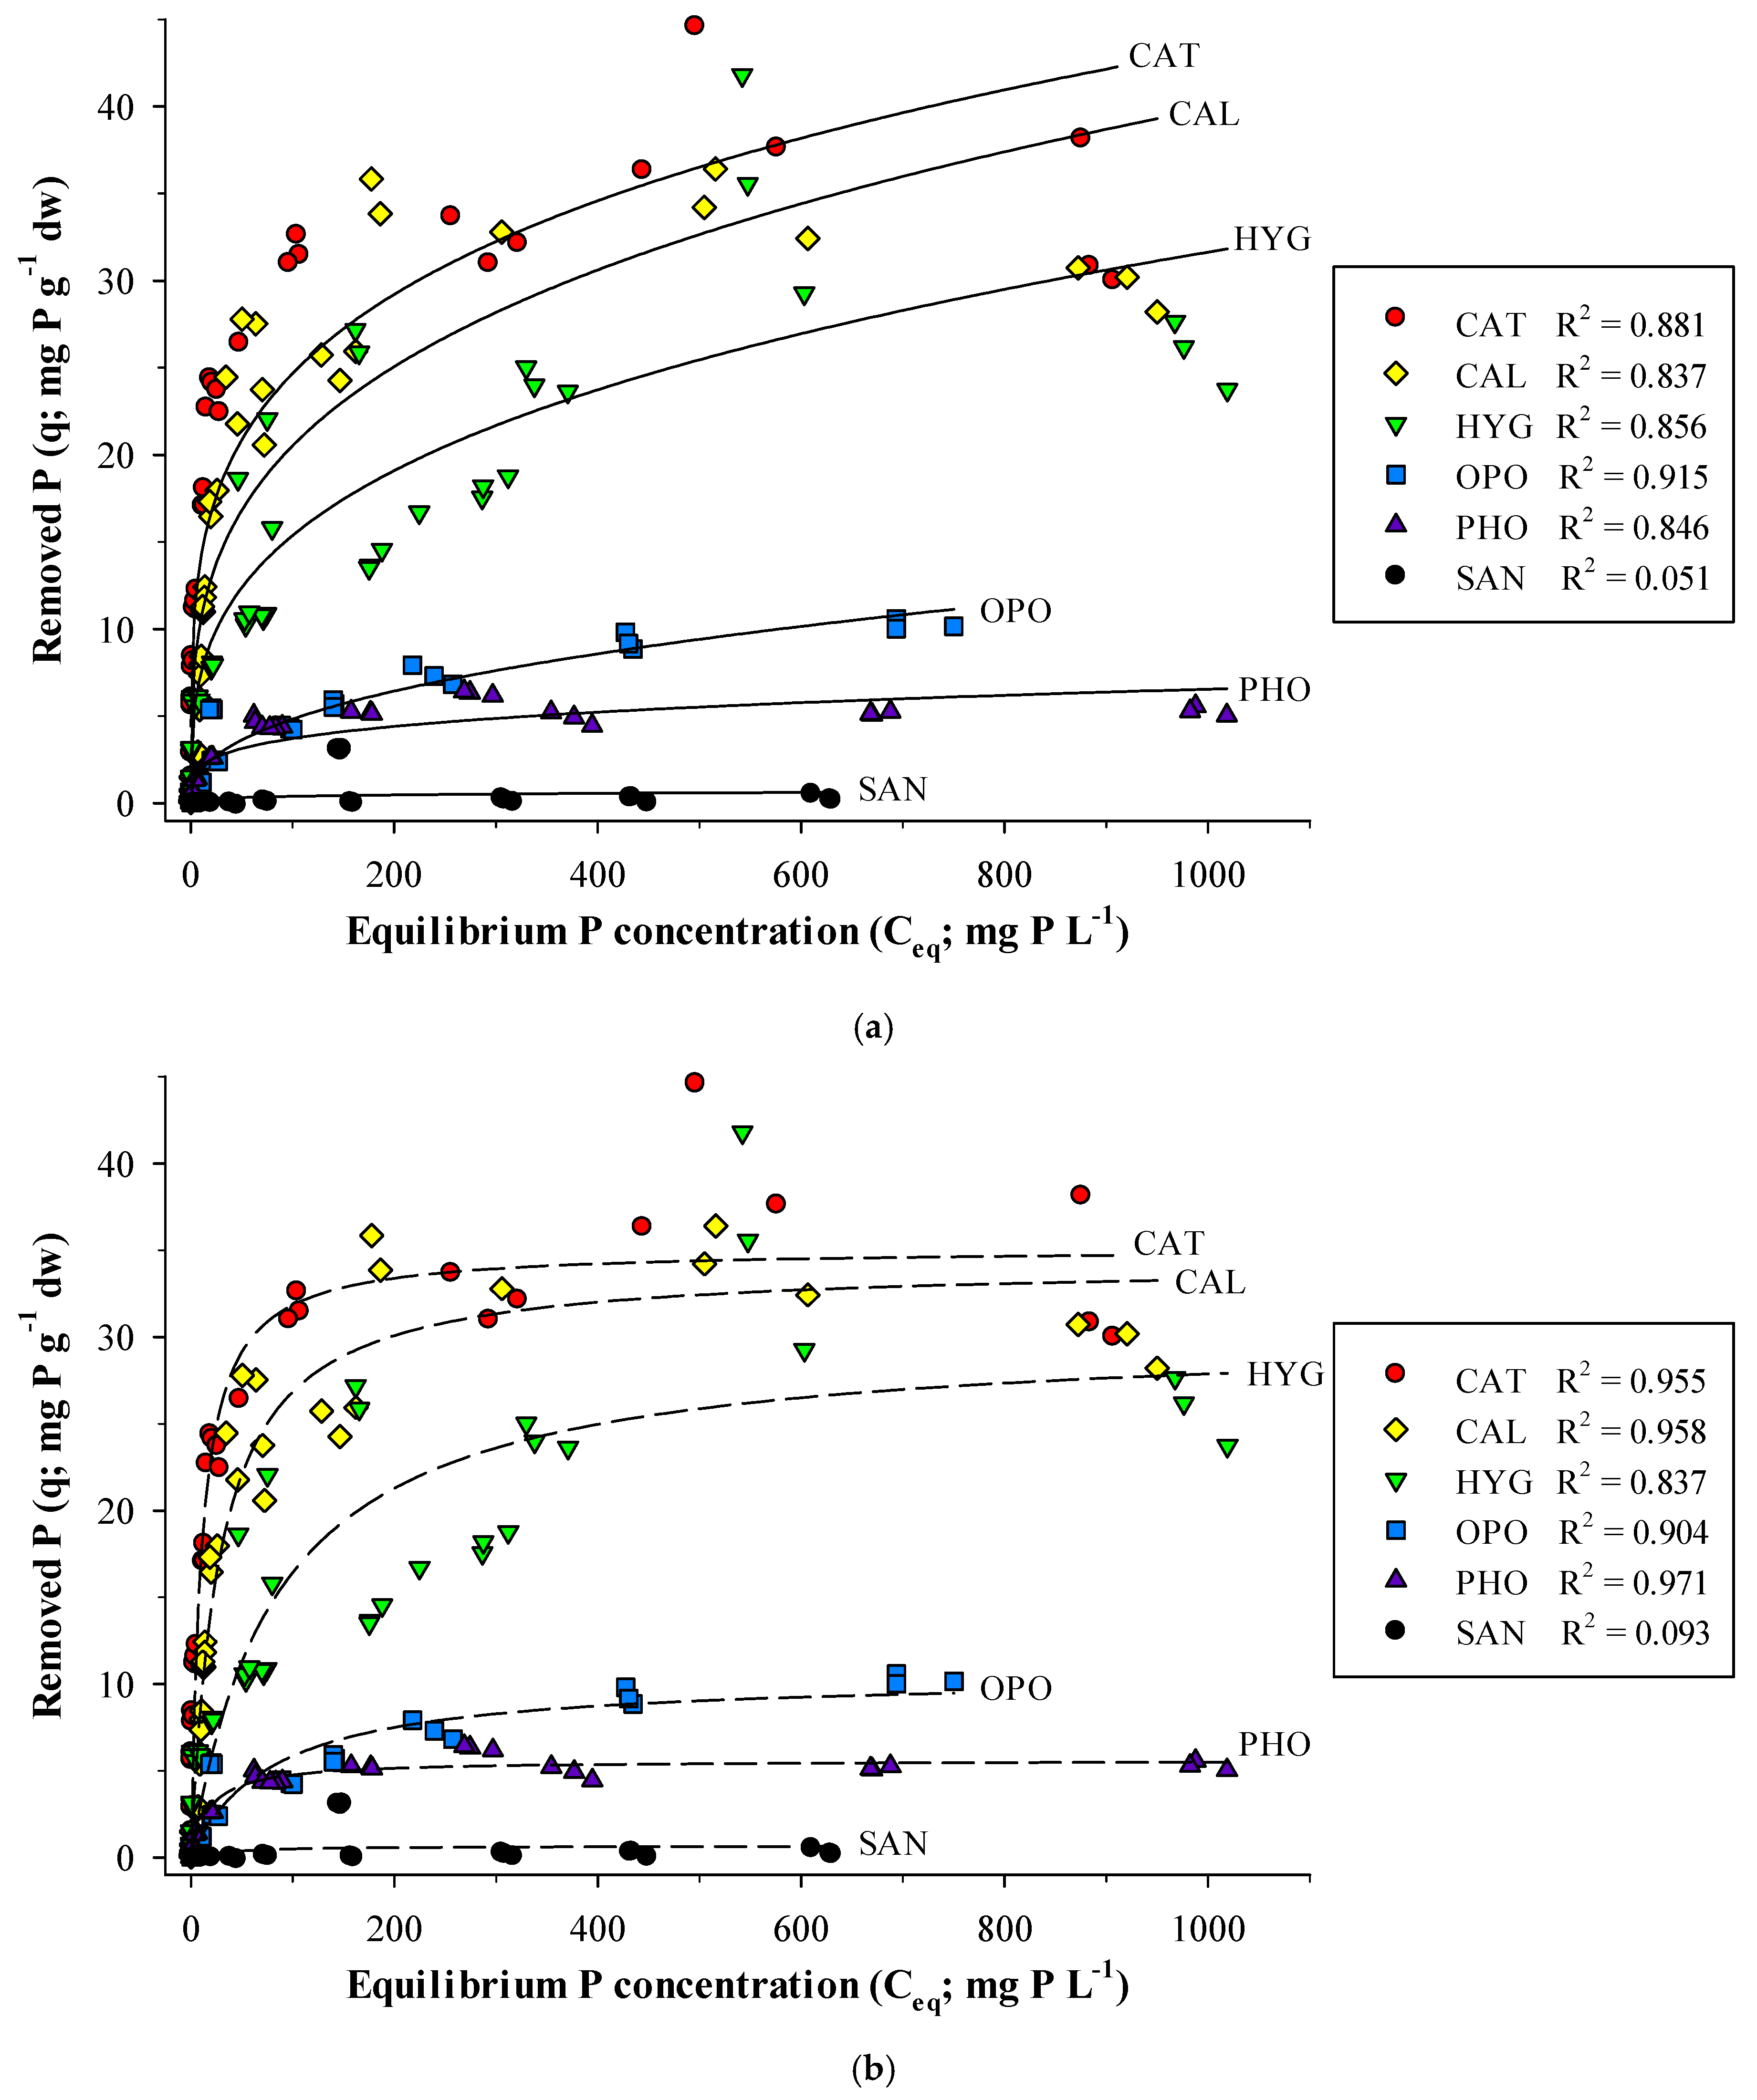
3.2. Phosphorus Removal Isotherms
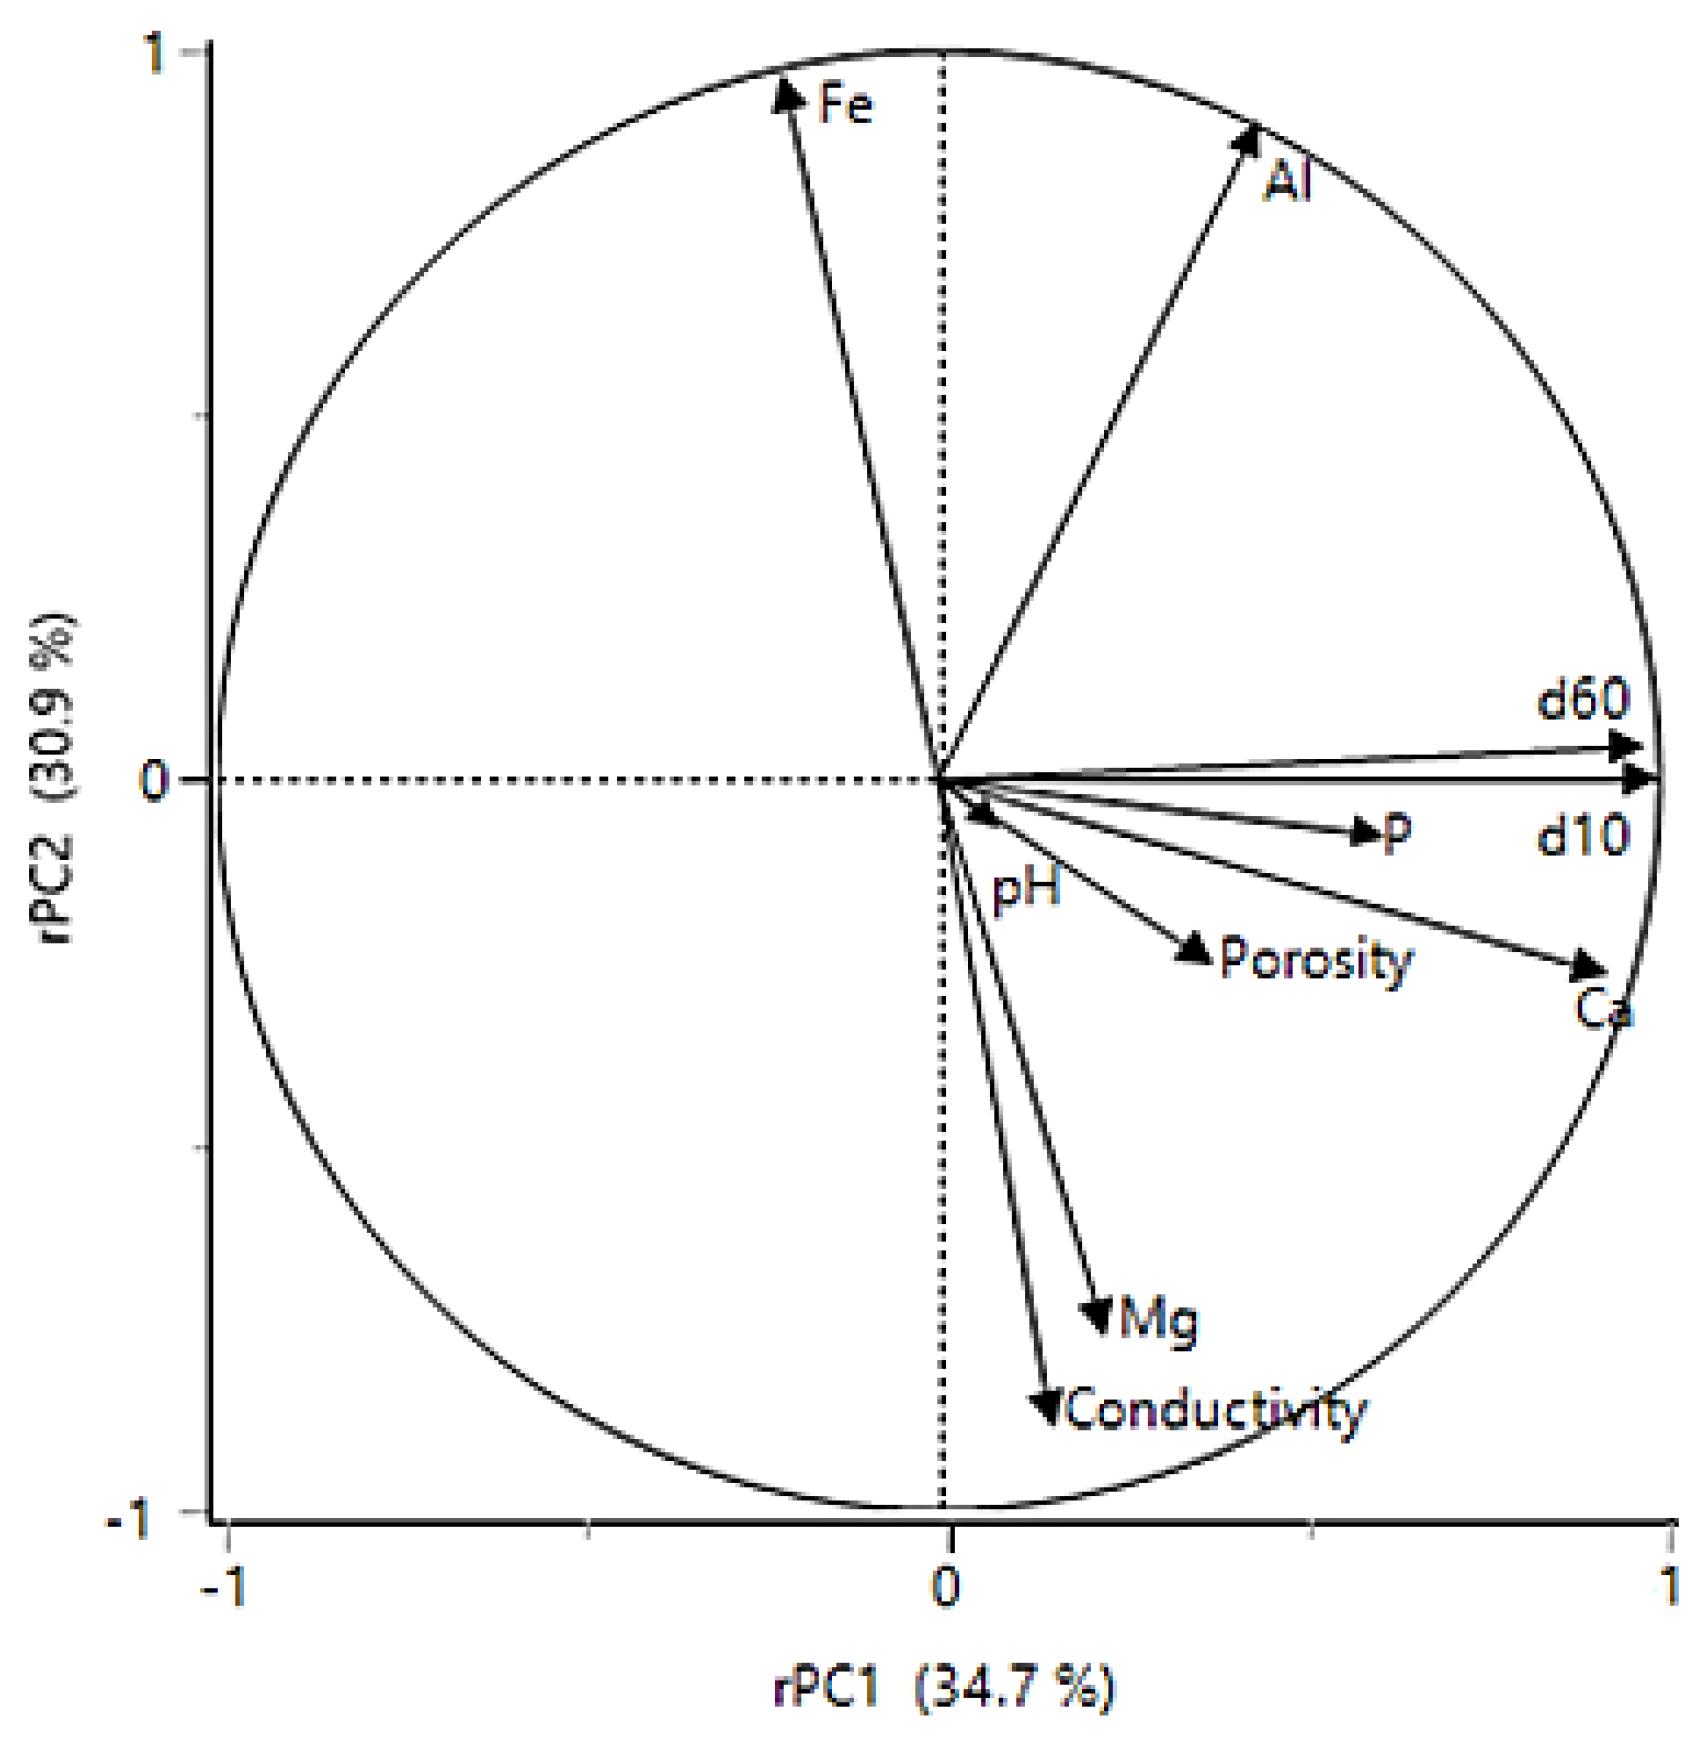
3.3. Important Chemical and Physical Characteristics for the Materials P Adsorption
4. Discussion
Author Contributions
Funding
Institutional Review Board Statement
Informed Consent Statement
Data Availability Statement
Acknowledgments
Conflicts of Interest
References
- Usuda, H. Phosphate Deficiency in Maize. V. Mobilization of Nitrogen and Phosphorus within Shoots of Young Plants and Its Relationship to Senescence. Plant Cell Physiol. 1995, 36, 1041–1049. [Google Scholar] [CrossRef]
- Jacob, J.; Lawlor, D.W. Stomatal and Mesophyll Limitations of Photosynthesis in Phosphate Deficient Sunflower, Maize and Wheat Plants. J. Exp. Bot. 1991, 42, 1003–1011. [Google Scholar] [CrossRef]
- Rittmann, B.E.; Mayer, B.; Westerhoff, P.; Edwards, M. Capturing the Lost Phosphorus. Chemosphere 2011, 84, 846–853. [Google Scholar] [CrossRef] [PubMed]
- Kok, D.J.D.; Pande, S.; Van Lier, J.B.; Ortigara, A.R.C.; Savenije, H.; Uhlenbrook, S. Global Phosphorus Recovery from Wastewater for Agricultural Reuse. Hydrol. Earth Syst. Sci. 2018, 22, 5781–5799. [Google Scholar] [CrossRef] [Green Version]
- Koppelaar, R.H.E.M.; Weikard, H.P. Assessing Phosphate Rock Depletion and Phosphorus Recycling Options. Glob. Environ. Chang. 2013, 23, 1454–1466. [Google Scholar] [CrossRef]
- Edixhoven, J.D.; Gupta, J.; Savenije, H.H.G. Recent Revisions of Phosphate Rock Reserves and Resources: A Critique. Earth Syst. Dyn. 2014, 5, 491–507. [Google Scholar] [CrossRef] [Green Version]
- Vaccari, D.A.; Mew, M.; Scholz, R.W.; Wellmer, F.-W. Chapter 2 Exploration: What Reserves and Resources? In Sustainable Phosphorus Management: A Global Transdisciplinary Roadmap; Scholz, R.W., Roy, A.H., Brand, F.S., Hellums, D.T., Ulrich, E.A., Eds.; Springer: Dordrecht, The Netherlands, 2014; pp. 129–151. [Google Scholar] [CrossRef]
- Kadlec, R.H.; Knight, R.L. Treatment Wetlands; Lewis Publishers: New York, NY, USA, 1996. [Google Scholar]
- Vymazal, J. Removal of Nutrients in Various Types of Constructed Wetlands. Sci. Total Environ. 2007, 380, 48–65. [Google Scholar] [CrossRef]
- Arias, C.A.; Brix, H. Phosphorus Removal in Constructed Wetlands: Can Suitable Alternative Media Be Identified? Water Sci. Technol. 2005, 51, 267–273. [Google Scholar] [CrossRef]
- Cui, L.; Zhu, X.; Ma, M.; Ouyang, Y.; Dong, M.; Zhu, W.; Luo, S. Phosphorus Sorption Capacities and Physicochemical Properties of Nine Substrate Materials for Constructed Wetland. Arch. Environ. Contam. Toxicol. 2008, 55, 210–217. [Google Scholar] [CrossRef]
- Ballantine, D.J.; Tanner, C.C. Substrate and Filter Materials to Enhance Phosphorus Removal in Constructed Wetlands Treating Diffuse Farm Runoff: A Review. N. Z. J. Agric. Res. 2010, 53, 71–95. [Google Scholar] [CrossRef]
- Vohla, C.; Kõiv, M.; Bavor, H.J.; Chazarenc, F.; Mander, Ü. Filter Materials for Phosphorus Removal from Wastewater in Treatment Wetlands–A Review. Ecol. Eng. 2011, 37, 70–89. [Google Scholar] [CrossRef]
- Jensen, S.M.; Esposito, C.; Konnerup, D.; Brix, H.; Arias, C.A. Phosphorus Recovery from Wastewater: Bioavailability of P Bound to Calcareous Material for Maize (Zea mays L.) Growth. Recycling 2021, 6, 25. [Google Scholar] [CrossRef]
- Molle, P.; Liénard, A.; Grasmick, A.; Iwema, A.; Kabbabi, A. Apatite as an Interesting Seed to Remove Phosphorus from Wastewater in Constructed Wetlands. Water Sci. Technol. 2005, 51, 193–203. [Google Scholar] [CrossRef]
- Del Bubba, M.; Arias, C.A.; Brix, H. Phosphorus Adsorption Maximum of Sands for Use as Media in Subsurface Flow Constructed Reed Beds as Measured by the Langmuir Isotherm. Water Res. 2003, 37, 3390–3400. [Google Scholar] [CrossRef]
- Brix, H.; Arias, C.A. Experiments with Wastewater Treatment in Areas with Scattered Settlement with Planted Filter Systems “Forsøg Med Rensning Af Spildevand i Det Åbne Land i Beplantede Filteranlæg”, The Danish Environmental Protection Agency (Miljøstyrelsen); Økologisk Byfornyelse Og Spildevandsrensning, Nr. 53. 2004. Available online: https://www2.mst.dk/Udgiv/publikationer/2004/87-7614-468-2/html/default.htm (accessed on 16 December 2021).
- Arias, C.A.; Brix, H.; Garza, M.F. Alternatives for Phosphorus Removal in Subsurface Flow Constructed Wetlands. In Proceedings of the International Meeting on Phytodepuration, Murcia, Spain, 19–22 July 2005; pp. 73–79. [Google Scholar]
- Siwek, H.; Bartkowiak, A.; Włodarczyk, M. Adsorption of Phosphates from Aqueous Solutions on Alginate/Goethite Hydrogel Composite. Water 2019, 11, 633. [Google Scholar] [CrossRef] [Green Version]
- Ciriminna, R.; Fidalgo, A.; Pandarus, V.; Béland, F.; Ilharco, L.M.; Pagliaro, M. The Sol–Gel Route to Advanced Silica-Based Materials and Recent Applications. Chem. Rev. 2013, 113, 6592–6620. [Google Scholar] [CrossRef]
- Krzak, J.; Szczurek, A.; Babiarczuk, B.; Gąsiorek, J.; Borak, B. Chapter 5: Sol–gel surface functionalization regardless of form and type of substrate. In Handbook of Nanomaterials for Manufacturing Applications. A Volume in Micro and Nano Technologies, 1st ed.; Hussain, C.M., Ed.; Elsevier: Amsterdam, The Netherlands, 2020; pp. 111–147. ISBN 9780128213810. [Google Scholar]
- Day, P.R. Particle Fractionation and Particle-Size Analysis. In Methods of Soil Analysis; American Society of Agronomy, Inc.: Madison, WI, USA, 1965; pp. 545–567. [Google Scholar] [CrossRef]
- Danish Standard. Water Quality–Determination of Phosphorus–Ammonium Molybdate Spectrometric Method; DS/EN 1189; Danish Standards Association: Charlottenlund, Denmark, 1997. [Google Scholar]
- Mann, R.A.; Bavor, H.J. Phosphorus Removal in Constructed Wetlands Using Gravel and Industrial Waste Substrata. Water Sci. Technol. 1993, 27, 107–113. [Google Scholar] [CrossRef]
- Mahmood-ul-Hassan, M.; Rashid, A.; Akhtar, M.S. Phosphorus Requirement of Corn and Sunflower Grown on Calcareous Soils of Pakistan. Commun. Soil Sci. Plant Anal. 1993, 24, 1529–1541. [Google Scholar] [CrossRef]
- Sakadevan, K.; Bavor, H.J. Phosphate Adsorption Characteristics of Soils, Slags and Zeolite to Be Used as Substrates in Constructed Wetland Systems. Water Res. 1998, 32, 393–399. [Google Scholar] [CrossRef]
- Leader, J.W.; Dunne, E.J.; Reddy, K.R. Phosphorus Sorbing Materials: Sorption Dynamics and Physicochemical Characteristics. J. Environ. Qual. 2008, 37, 174–181. [Google Scholar] [CrossRef] [Green Version]
- Arias, C.A.; Del Bubba, M.; Brix, H. Phosphorus Removal by Sands for Use as Media in Subsurface Flow Constructed Reed Beds. Water Res. 2001, 35, 1159–1168. [Google Scholar] [CrossRef]
- Pant, H.K.; Reddy, K.R.; Lemon, E. Phosphorus Retention Capacity of Root Bed Media of Subsurface Flow Constructed Wetlands. Ecol. Eng. 2001, 17, 345–355. [Google Scholar] [CrossRef]
- Prochaska, C.A.; Zouboulis, A.I. Removal of Phosphates by Pilot Vertical-Flow Constructed Wetlands Using a Mixture of Sand and Dolomite as Substrate. Ecol. Eng. 2006, 26, 293–303. [Google Scholar] [CrossRef]
- Søvik, A.K.; Kløve, B. Phosphorus Retention Processes in Shell Sand Filter Systems Treating Municipal Wastewater. Ecol. Eng. 2005, 25, 168–182. [Google Scholar] [CrossRef]
- Ádám, K.; Krogstad, T.; Vråle, L.; Søvik, A.K.; Jenssen, P.D. Phosphorus Retention in the Filter Materials Shellsand and Filtralite P®-Batch and Column Experiment with Synthetic P Solution and Secondary Wastewater. Ecol. Eng. 2007, 29, 200–208. [Google Scholar] [CrossRef]
- Molle, P.; Liénard, A.; Grasmick, A.; Iwema, A. Phosphorus Retention in Subsurface Constructed Wetlands: Investigations Focused on Calcareous Materials and Their Chemical Reactions. Water Sci. Technol. 2003, 48, 75–83. [Google Scholar] [CrossRef]
- Bellier, N.; Chazarenc, F.; Comeau, Y. Phosphorus Removal from Wastewater by Mineral Apatite. Water Res. 2006, 40, 2965–2971. [Google Scholar] [CrossRef]
- Eljamal, O.; Okawauchi, J.; Hiramatsu, K. Removal of Phosphorus from Water Using Marble Dust as Sorbent Material. J. Environ. Prot. 2012, 3, 709–714. [Google Scholar] [CrossRef] [Green Version]
- Drizo, A.; Frost, C.A.; Grace, J.; Smith, K.A. Physico-Chemical Screening of Phosphate-Removing Substrates for Use in Constructed Wetland Systems. Water Res. 1999, 33, 3595–3602. [Google Scholar] [CrossRef]
- Seo, C.D.; Hwang, H.S.; Kim, H.J.; Cho, J.S.; Lee, H.J.; Delaune, R.D.; Jugsujinda, A.; Lee, S.T.; Seo, J.Y.; Heo, J.S. Evaluation of 2- and 3-Stage Combinations of Vertical and Horizontal Flow Constructed Wetlands for Treating Greenhouse Wastewater. Ecol. Eng. 2008, 32, 121–132. [Google Scholar] [CrossRef]
- Brix, H.; Arias, C.A.; Del Bubba, M. Media Selection for Sustainable Phosphorus Removal in Subsurface Flow Constructed Wetlands. Water Sci. Technol. 2001, 44, 47–54. [Google Scholar] [CrossRef] [PubMed]
- Deng, Y.; Wheatley, A. Mechanisms of Phosphorus Removal by Recycled Crushed Concrete. Int. J. Environ. Res. Public Health 2018, 15, 357. [Google Scholar] [CrossRef] [PubMed] [Green Version]
- Brogowski, Z.; Renman, G. Characterization of Opoka as a Basis for Its Use in Wastewater Treatment. Pol. J. Environ. Stud. 2004, 13, 15–20. [Google Scholar]
- Acelas, N.Y.; Martin, B.D.; López, D.; Jefferson, B. Selective Removal of Phosphate from Wastewater Using Hydrated Metal Oxides Dispersed within Anionic Exchange Media. Chemosphere 2015, 119, 1353–1360. [Google Scholar] [CrossRef]


| Abbreviation | Material | General Description | Company or Location, Country |
|---|---|---|---|
| CAT | Catsan | Commercial cat litter product. Calcium silicate gravel composed of natural chalk and fine quality quartz sand. | CATSAN®, UK |
| CAL | Calcite | Developed for P removal. Calcium carbonate granulates. | IMERYS Industrial Minerals, DK (former Damolin) |
| HYG | Hygiene | Commercial cat litter product. Calcium silicate gravel composed of natural chalk and fine quality quartz sand. | MULTIFIT®, DE |
| OPO | Opoka | Natural product. Carbonate silicate gravel produced from natural reserves. | Bełchatów, PL |
| PHO | Phosclean | Developed for P removal. Apatite granulates produced from a Moroccan natural product. | NUWEN®, FR |
| SAN | Quartz sand | Natural sand extracted from a gravel pit in Denmark. | Franzefoss a/s, DK |
| Abbreviation | Coating Solution (Dilution Ratio) | Exposure Period (Minutes) | ||
|---|---|---|---|---|
| A-I | A | 1:10 | I | 5 |
| A-II | II | 10 | ||
| A-III | III | 15 | ||
| B-I | B | 1:5 | I | 5 |
| B-II | II | 10 | ||
| C-I | C | 1:1 | I | 5 |
| C-II | II | 10 | ||
| Material | Bulk Porosity | Specific Weight | d10 | d60 | UC |
|---|---|---|---|---|---|
| (%) | (g mL−1) | (mm) | (mm) | (d60/d10; Unitless) | |
| CAT | 56 | 0.47 | 0.55 | 1.20 | 2.18 |
| CAL | 40 | 0.82 | 0.59 | 1.25 | 2.12 |
| HYG | 67 | 0.35 | 0.53 | 1.25 | 2.38 |
| OPO | 32 | 0.95 | 0.61 | 1.30 | 2.15 |
| PHO | 32 | 1.10 | 0.68 | 1.35 | 1.99 |
| SAN | 19 | 1.59 | 0.21 | 0.60 | 2.86 |
| Material | EQ pH a | EQ Conductivity | Ca | P | Mg | Al | Fe | |
|---|---|---|---|---|---|---|---|---|
| (mS cm−1) a | (mg g−1 DW) | (mg g−1 DW) | (mg g−1 DW) | (mg g−1 DW) | (mg g−1 DW) | |||
| Non-coated | CAT | 9.2 | 4.24 | 179 | 0.13 | 16.8 | 0.9 | 0.6 |
| CAL | 8.8 | 2.93 | 294 | 0.30 | 5.5 | 4.2 | 1.6 | |
| HYG | 9.9 | 1.28 | 225 | 0.26 | 4.5 | 10.8 | 5.6 | |
| OPO | 8.6 | 0.39 | 133 | 0.27 | 3.2 | 16.9 | 10.5 | |
| PHO | 7.8 | 1.04 | 333 | 115.82 | 4.7 | 8.6 | 2.0 | |
| SAN | 8.1 | 0.51 | 9 | 0.16 | 0.7 | 2.3 | 5.5 | |
| Coated | A-I | 9.7 | 3.18 | 174 | 0.10 | 12.4 | 1.3 | 0.7 |
| A-II | 9.3 | 3.14 | 160 | 0.07 | 13.4 | 1.2 | 0.6 | |
| A-III | 10.1 | 2.88 | 182 | 0.11 | 12.3 | 1.4 | 0.9 | |
| B-I | 10.6 | 3.57 | 157 | 0.07 | 12.8 | 1.2 | 0.6 | |
| B-II | 9.8 | 3.30 | 153 | 0.06 | 10.7 | 1.2 | 0.6 | |
| C-I | 10.9 | 3.87 | 146 | 0.08 | 9.9 | 1.2 | 0.6 | |
| C-II | 10.8 | 4.23 | 146 | 0.05 | 8.8 | 1.2 | 0.6 |
| Freundlich Adsorption Parameters | Langmuir Adsorption Parameters | ||||||
|---|---|---|---|---|---|---|---|
| Material | Adsorption Constant (K; mg P g−1 DW) | Intensity (1/n; Unitless) | R2 | Maximum Adsorption Capacity (Qmax; mg P g−1 DW) | Affinity (a; l mg−1) | R2 | |
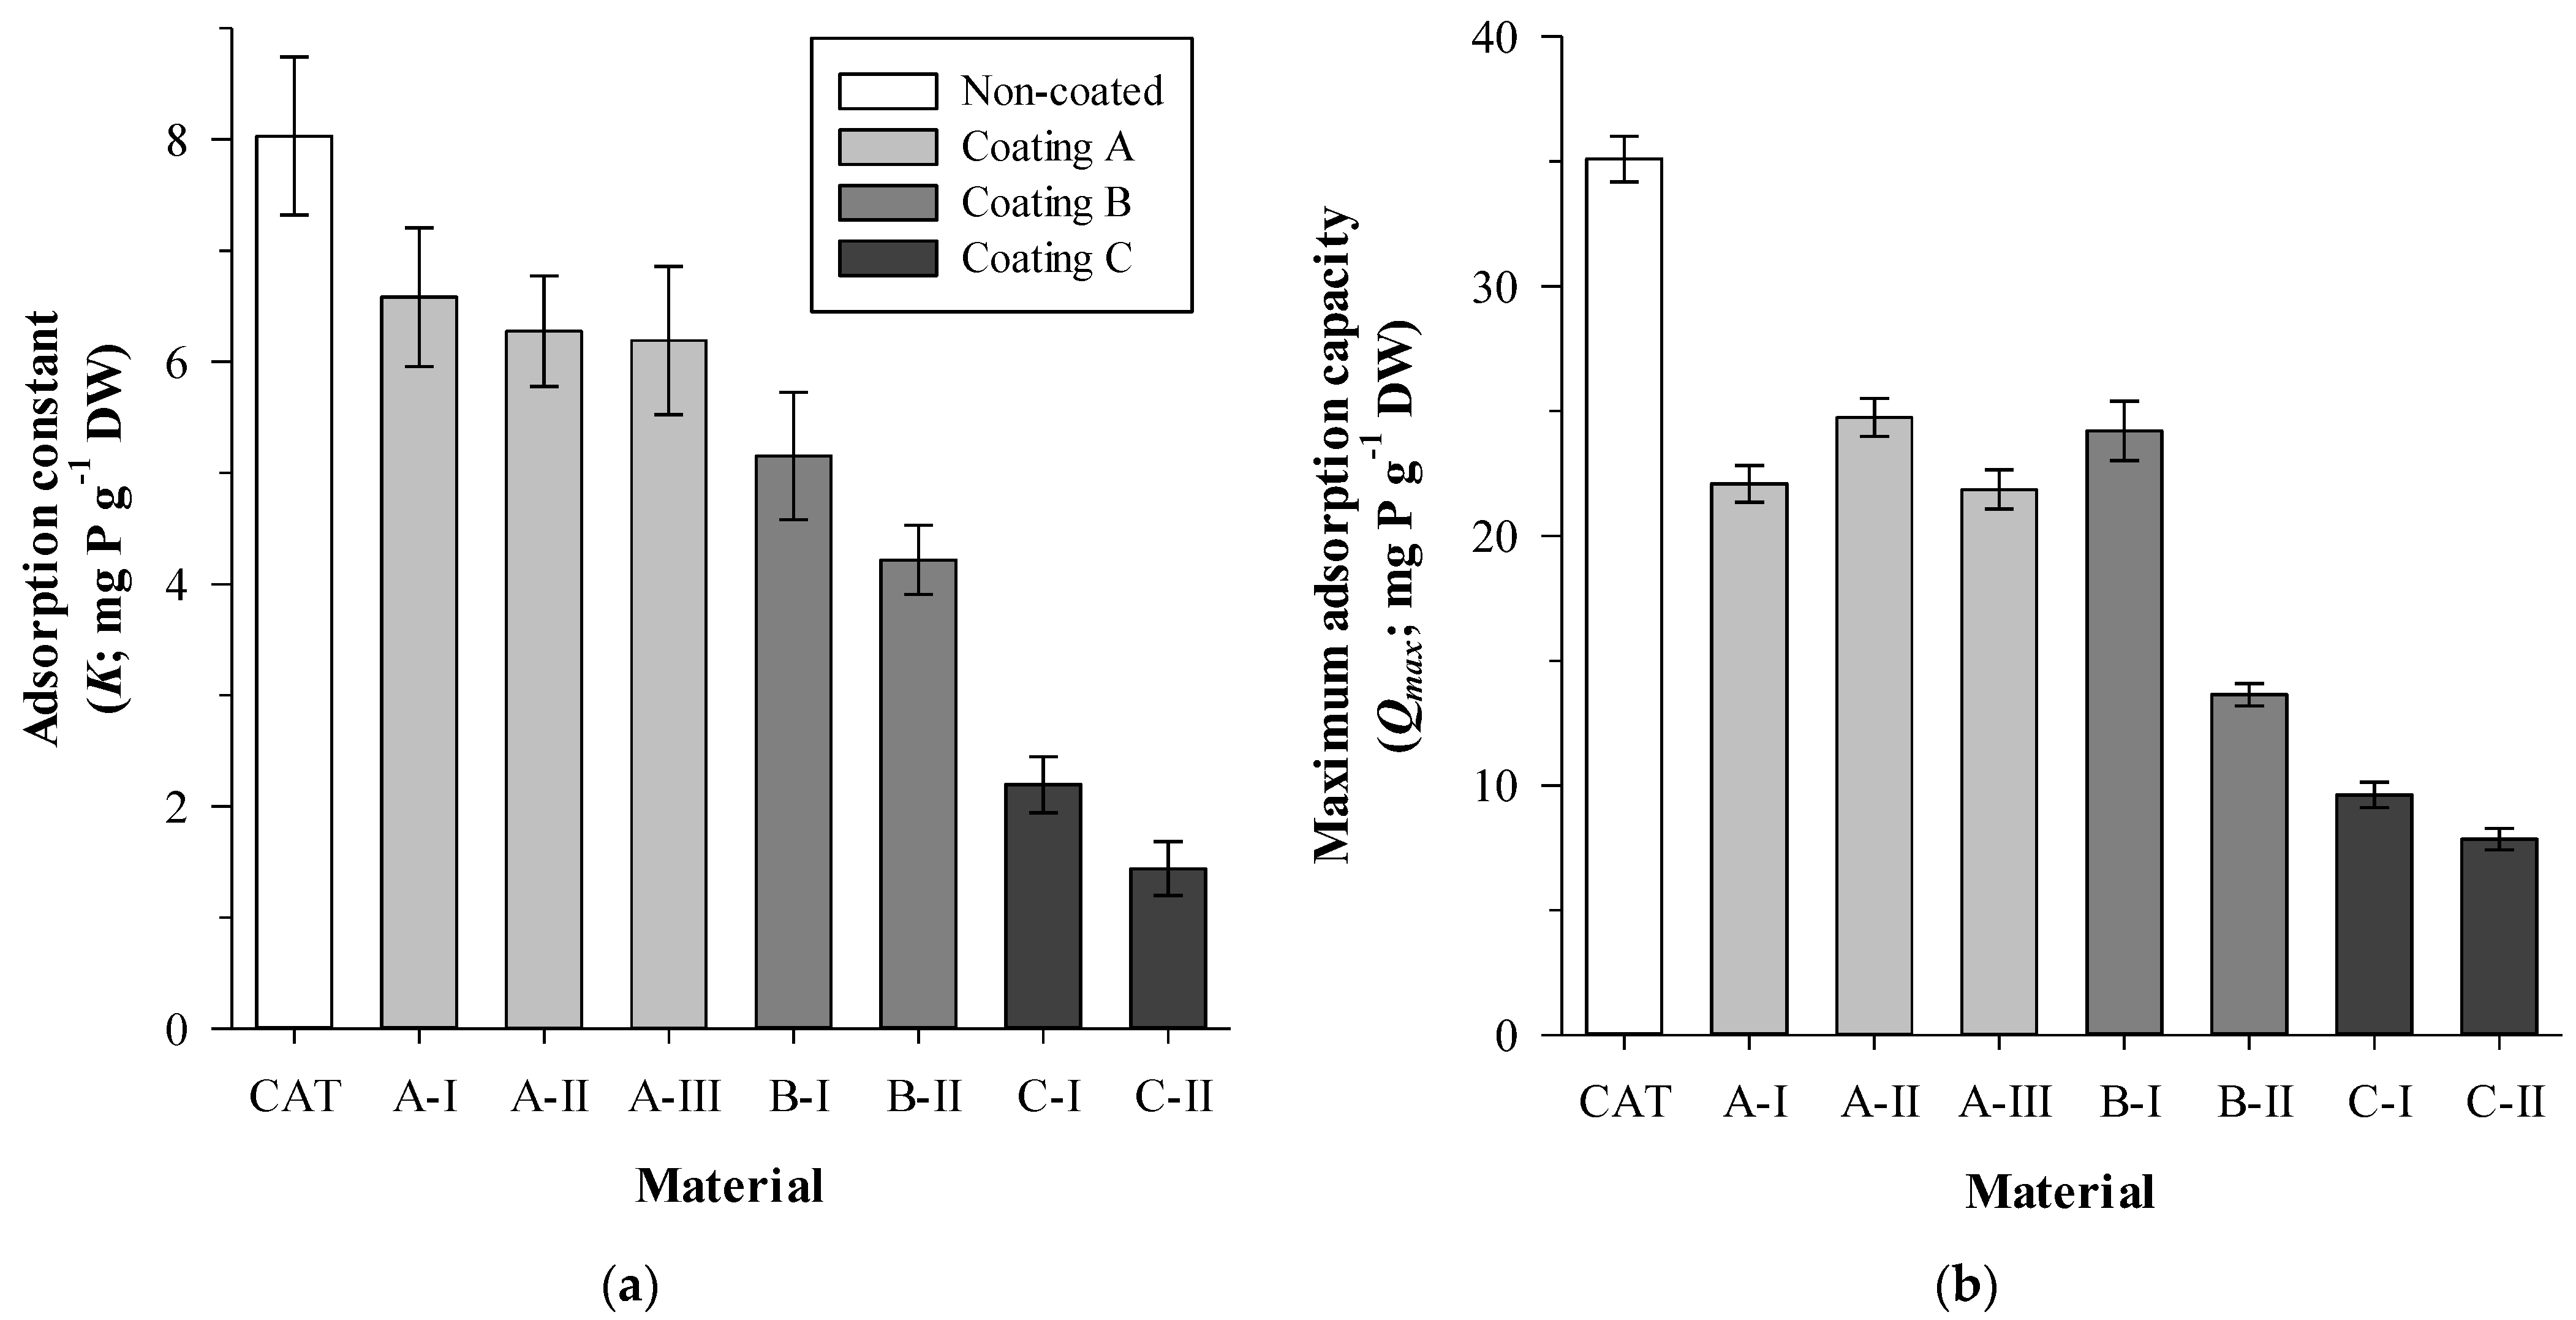
| Non-coated | CAT | 8.0 | 4.1 | 0.881 | 35.1 | 0.098 | 0.955 |
| CAL | 5.4 | 3.5 | 0.837 | 34.2 | 0.036 | 0.958 | |
| HYG | 3.6 | 3.2 | 0.856 | 30.2 | 0.012 | 0.837 | |
| OPO | 0.7 | 2.4 | 0.915 | 10.5 | 0.013 | 0.904 | |
| PHO | 1.2 | 4.1 | 0.846 | 5.6 | 0.057 | 0.971 | |
| SAN | 0.1 | 3.9 | 0.051 | 0.7 | 0.026 | 0.093 | |
| Coated | A-I | 6.6 | 4.7 | 0.869 | 22.1 | 0.843 | 0.889 |
| A-II | 6.3 | 4.1 | 0.932 | 24.7 | 0.514 | 0.907 | |
| A-III | 6.2 | 4.5 | 0.826 | 21.9 | 0.461 | 0.869 | |
| B-I | 5.2 | 4.0 | 0.890 | 24.2 | 0.050 | 0.854 | |
| B-II | 4.2 | 4.2 | 0.908 | 13.6 | 0.487 | 0.934 | |
| C-I | 2.2 | 3.6 | 0.902 | 9.6 | 0.173 | 0.947 | |
| C-II | 1.4 | 3.1 | 0.959 | 7.8 | 0.137 | 0.839 | |
| Principal Component Analysis | |||
| Principal Component | Eigenvalue | Proportion of Variance (%) | Cumulative POV (%) |
| PC1 | 4.09 | 40.9 | 40.9 |
| PC2 | 2.91 | 29.1 | 70.0 |
| PC3 | 2.17 | 21.7 | 91.7 |
| PC4 | 0.54 | 5.4 | 97.2 |
| PC5 | 0.29 | 2.9 | 100.0 |
| Varimax rotated Principal Component Analysis | |||
| Parameter | rPC1 | rPC2 | rPC3 |
| Bulk porosity (%) | 0.363 | −0.241 | 0.830 |
| d10 (mm) | 0.972 | 0.001 | 0.096 |
| d60 (mm) | 0.954 | 0.045 | 0.257 |
| pH | 0.065 | −0.051 | 0.965 |
| Conductivity (mS cm−1) | 0.153 | −0.861 | 0.415 |
| P (mg g−1 DW) | 0.593 | −0.074 | −0.715 |
| Ca (mg g−1 DW) | 0.907 | −0.261 | −0.063 |
| Mg (mg g−1 DW) | 0.225 | −0.735 | 0.441 |
| Al (mg g−1 DW) | 0.435 | 0.884 | 0.117 |
| Fe (mg g−1 DW) | −0.211 | 0.945 | 0.129 |
| Material | P Adsorption Capacity (g P kg−1) | Reference |
|---|---|---|
| Gravel | 0.03–0.49 | [11,24] |
| Soil | 0.001–1.396 | [11,25,26,27] |
| Sand | 0.02–9.60 | [11,27,28,29,30,31,32] |
| Apatite | 0.3–7.9 | [15,33,34] |
| Marble | 0.98 | [35] |
| Calcite | 0.7–7.5 | [33,36,37] |
| LECA | 0.42–1.00 | [36,38] |
| Recycled concrete | 0.3–6.9 | [33,39] |
| Heated Opoka | 120 | [40] |
| Hydrated metal oxides | 74–111 | [41] |
Publisher’s Note: MDPI stays neutral with regard to jurisdictional claims in published maps and institutional affiliations. |
© 2021 by the authors. Licensee MDPI, Basel, Switzerland. This article is an open access article distributed under the terms and conditions of the Creative Commons Attribution (CC BY) license (https://creativecommons.org/licenses/by/4.0/).
Share and Cite
Jensen, S.M.; Søhoel, H.; Blaikie, F.H.; Brix, H.; Arias, C.A. The Effect of Sol-Gel Coatings on the Phosphorus (P) Adsorption Capacity of Calcareous Materials for Use in Water Treatment. Water 2022, 14, 3. https://doi.org/10.3390/w14010003
Jensen SM, Søhoel H, Blaikie FH, Brix H, Arias CA. The Effect of Sol-Gel Coatings on the Phosphorus (P) Adsorption Capacity of Calcareous Materials for Use in Water Treatment. Water. 2022; 14(1):3. https://doi.org/10.3390/w14010003
Chicago/Turabian StyleJensen, Solvei Mundbjerg, Helmer Søhoel, Frances Helen Blaikie, Hans Brix, and Carlos A. Arias. 2022. "The Effect of Sol-Gel Coatings on the Phosphorus (P) Adsorption Capacity of Calcareous Materials for Use in Water Treatment" Water 14, no. 1: 3. https://doi.org/10.3390/w14010003