Review

A Review on the Application of Isotopic Techniques to Trace Groundwater Pollution Sources within Developing Countries

by
Abdul Aziz Sankoh
1,2,3,*,
Nana Sarfo Agyemang Derkyi
2,4,
Ronnie A. D. Frazer-williams
3,
Cynthia Laar
5 and
Ishmail Kamara
6
1
Department of Civil and Environmental Engineering, University of Energy and Natural Resources, Sunyani P.O. Box 214, Ghana
2
Regional Center for Energy and Environmental Sustainability, University of Energy and Natural Resources, Sunyani P.O. Box 214, Ghana
3
Department of Chemistry, Fourah Bay College, University of Sierra Leone, Mount Aureol, Freetown P.O. Box 87, Sierra Leone
4
Department of Energy and Petroleum Engineering, University of Energy and Natural Resources, Sunyani P.O. Box 214, Ghana
5
National Nuclear Research Institute, Ghana Atomic Energy Commission, Legon Accra P.O. Box LG 80, Ghana
6
National Water Resource Management Agency, King Harman Road, Freetown P.O. Box 778, Sierra Leone
*
Author to whom correspondence should be addressed.
Water 2022, 14(1), 35; https://doi.org/10.3390/w14010035
Submission received: 12 October 2021 / Revised: 25 November 2021 / Accepted: 1 December 2021 / Published: 24 December 2021
(This article belongs to the Section Water Quality and Contamination)

Abstract

:
Owing to a lack of efficient solid waste management (SWM) systems, groundwater in most developing countries is found to be contaminated and tends to pose significant environmental health risks. This review paper proffers guidelines on the application of isotopic techniques to trace groundwater pollution sources from data spanning from 2010 to 2020 within developing countries. Earlier groundwater studies in those countries were mainly focused on using hydrochemical and geophysical techniques. The limitation of these techniques is that they can only monitor the concentration of pollutants in the water bodies and possible leachate infiltration but cannot determine the specific sources of the pollution. Stable isotopes of δ18O, δ2H and δ13C can confirm leachate migration to water bodies due to methanogenesis. The high tritium in landfill leachates is useful to identify leachate percolation in groundwater. The δ15N technique has been used to distinguish between synthetic and organic nitrogen sources but its application is limited to differentiating between atmospheric vs. inorganic nitrogen sources. The use of a dual isotope of δ15N– NO 3 and δ18O– NO 3 is beneficial in terms of identifying various sources of nitrogen such as atmospheric and inorganic fertilizers but is yet to be used to differentiate between nitrogen pollution sources from dumpsites, sewage and animal manure. The coupling of the 11B isotope with δ15N– NO 3 and δ18O– NO 3 and other hydrochemical parameters has proven to be effective in distinguishing between nitrate fertilizer, animal manure, seawater contamination and sewage. Therefore, in areas affected by agricultural activities, landfill leachates, domestic or sewage effluent and seawater intrusion, it is incumbent to couple hydrochemical ( Cl , NO 3 , B, DO) and isotope techniques (δ18O, 2H, δ13C, δ18O– NO 3 , δ15N– NO 3 , δ11B and 3H) to effectively determine pollution sources of groundwater in developing countries. The foregoing review will provide guidelines for studies that may aim to critically distinguish between seawater intrusion, dumpsites, sewage and septic leachates.

1. Introduction

Globally, proper waste disposal is a problem due to increasing population, economic growth and industrialization [1]. The effective management of waste is crucial for sustainable development, but it remains a challenge for most developing countries where over 90% of the waste is disposed in uncontrolled open dumpsites [2]. As a result, around nine million people die each year of diseases linked to pollutants embedded in wastes [2].
The main issues related to open dumpsites involves the increasing pollution of nitrates ( NO 3 ) in groundwater [3]. High nitrate concentrations affect human health and its consumption can induce methemoglobinemia (blue baby syndrome), cancer and can also augment hypoxia [4]. As a result, the World Health Organization (WHO) and European Union (EU) have set a maximum contaminant limit of 50   mgL 1   for   NO 3 [5]. This concentration is approximately equal to 10   mgL 1 N.
Moreover, groundwater can be contaminated by a wide variety of compounds, which can be natural or anthropogenic. The contamination sources can be grouped into point and nonpoint sources. Point sources occur from a single identifiable point whilst nonpoint sources occur due to various unidentifiable points or linear and areal sources such as: leaching of excessive fertilizers, toxic wastes from dumpsites and seawater intrusion, etc. These make it more difficult to monitor and enforce mitigating controls [6]. It is noteworthy that non-point sources of pollution tend to be the major contaminant sources of groundwater in developing countries. In light of the above, the need for monitoring waterbodies from dumpsites and other sources of contamination is important for any water resource management plan. According to [7], the proper management of groundwater quality requires the identification of the specific pollution sources involved.
Previous groundwater studies by [8,9,10,11] in developing countries were mainly focused on using hydrochemical and geophysical data which only determine the concentration of pollutants in water samples and leachates. The principle of geophysical analysis links low resistivity to leachate percolation from dumpsites. This principle is quite vague owing to the fact that there are several pollution sources, such as seawater intrusion and sewage runoffs [9] that may cause low resistivity, and this has led to its limitation in precisely identifying leachate sources. However, with the emergence and use of isotope techniques, researchers have been able to deduce the pollution sources and also provide more definitive indications of the origin of surface and groundwater recharge [12]. Therefore, this review paper summarizes the current state of the use of stable and radioactive isotopes to investigate leachate migration from dumpsites and other sources of microbial contamination. It also emphasizes how the integration of hydrochemical, dual isotopes of NO 3 , as well as stable and radioactive isotopes, can be used to identify the various factors impacting groundwater pollution. This review paper also details a summary guide to using isotope methods for the identification of pollution sources.

2. Overview of Isotope Application in Groundwater Studies

Stable isotopes and radioactive isotopes have wide applications in hydrological investigations and provide vital information, for example, aquifer–aquifer interconnection, groundwater age and sources of groundwater pollution [13,14]. These applications are fundamentally focused on the general principle of tracing. The principle involves the tracking of the movement and transformation of specific substances such as nitrate, chlorinated compounds, carbonate and other anthropogenic compounds from water bodies. Isotope composition is expressed as the ratios in isotope abundances relative to a standard in delta (δ) notation [5]:
δ   = ( R Sample R Standard   1 ) × 10 3 ,
where:
Rsample are the heavy (rare) to light (abundant) isotope ratios of the sample;
Rstandard are the heavy (rare) to light (abundant) ratios of the standard.
The most widely used isotopes are oxygen (O), hydrogen (H), carbon (C), sulfur and nitrogen (N) [7]. Environmental isotopes (Table 1) in water bodies and other materials have been widely employed for more than eight (8) decades to advance our knowledge on hydrogeological and environmental processes.

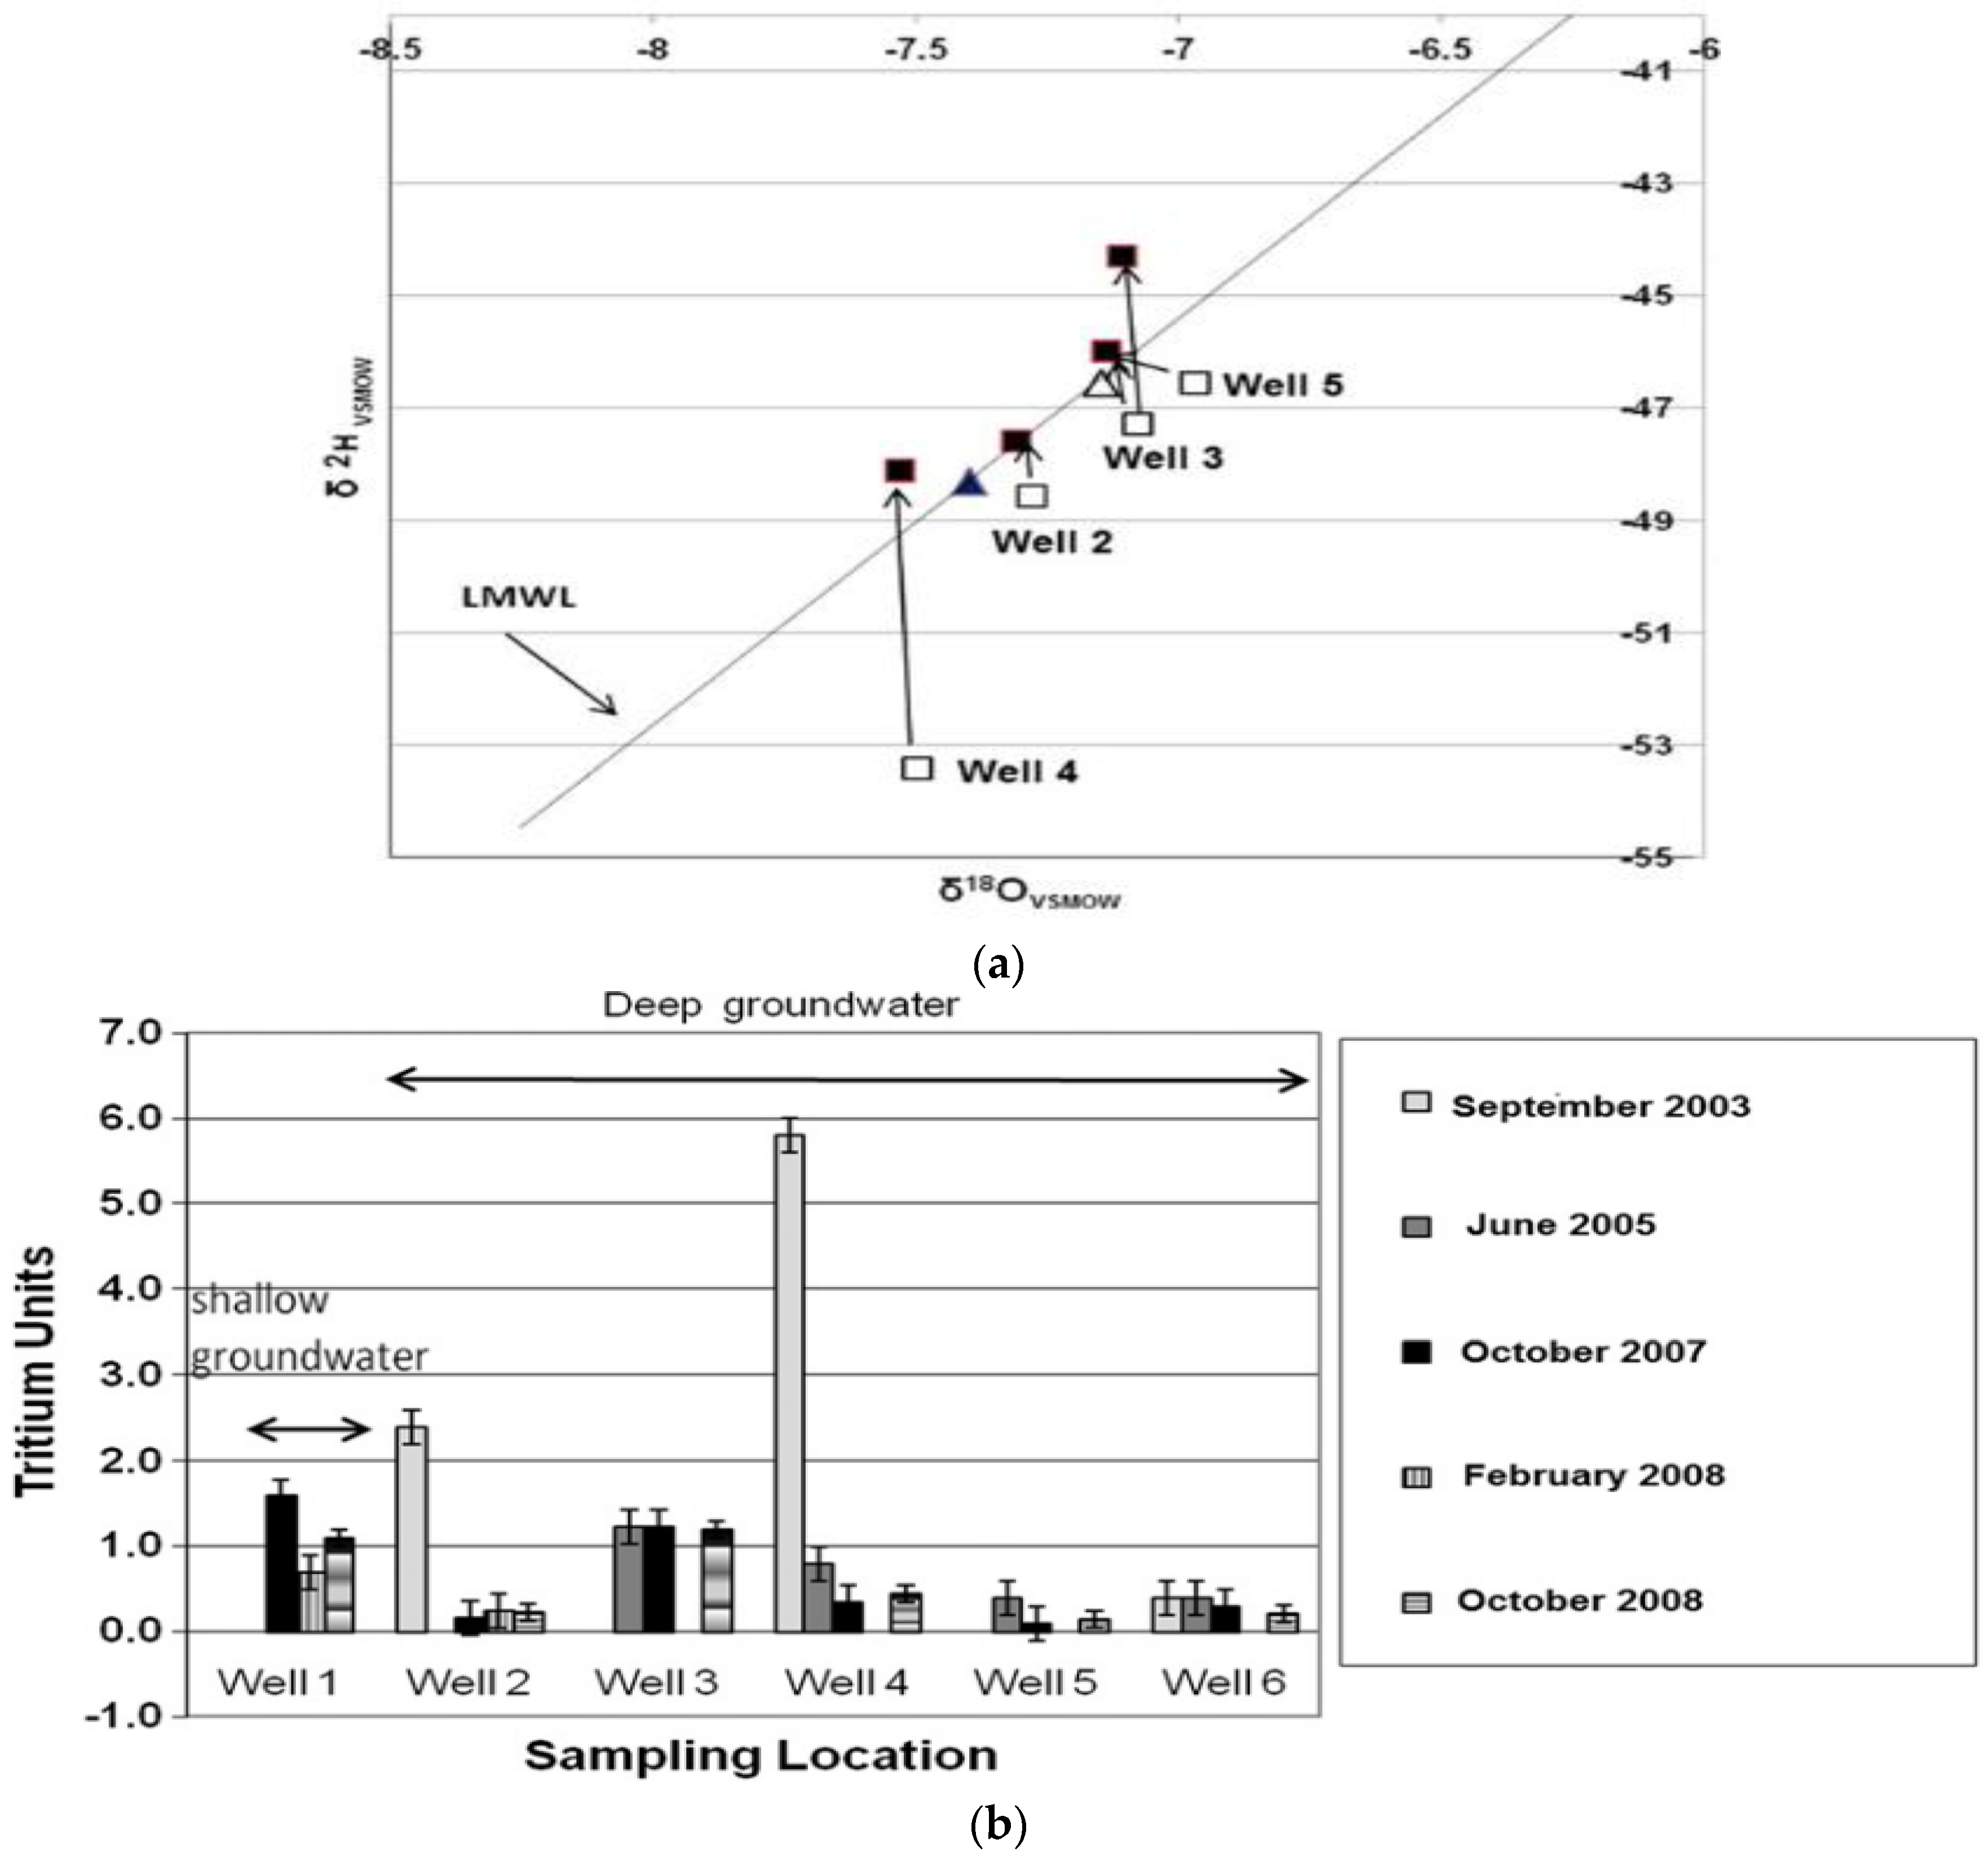
2.1. Using Isotopes of O, H and C to Determine Leachate Migration

The use of water in hydrogeology and environmental studies started in 1935, when the ratios of oxygen isotope (18O/16O) were evaluated on the water of Lake Michigan, United States of America [20]. Since then, the application of environmental isotopes in groundwater and surface water studies has demonstrated their importance in terms of better understanding contaminant flow as well as in pollution source identification. Although several studies have used the isotope ratios of H and O for hydrologic and geochemical investigations, only a few applications [16,21,22], have been reported for dumpsites in developing countries.
Landfills generate leachate, which contains methane ( CH 4 ) and carbon dioxide ( CO 2 ) gas, through a process called methanogenesis [23,24,25]. Methanogenesis is a process by which microorganisms (methanogens) utilize organic and inorganic compounds to produce CH 4 and CO 2 under anaerobic conditions [23,26,27]. According to [28,29], the microorganisms tend to react more rapidly with lighter isotopes (1H) of CH 4 gas leaving the “heavier” isotope (2H) in the leachate. Since most of the lighter isotope has already been consumed by microorganisms, the abundant amount of heavier isotopes (2H) left on the residual CH 4 of the leachate will percolate into nearby water bodies within the landfills, causing δ2H enrichment of the affected water. On the other hand, though acid fermentation and hydrolysis may cause significant reductions in the oxygen concentration in landfills, they may not cause any variation on the δ18O isotope content. This is because δ18O isotope fractionation is only influenced by phase changes, such as evaporation and condensation, but is unaffected by biogeochemical reactions [25,26]. Since δ2H is enriched whilst δ18O is unaffected by methanogenesis, this confirms their usefulness in determining leachate infiltration in groundwater bodies. However, using stable isotopes of δ18O and δ2H in groundwater pollution studies can only confirm that the waterbodies are being contaminated by leachate migration associated with methanogenesis. The shortcoming of this method is that it cannot depict the exact sources (dumpsites, sewage or animal manures) of the leachates since those sources can significantly induce methane gas. Thus, the combination of tritium and stable isotopes (δ18O and δ2H) can be used to determine the sources of leachates.
The authors of [16,21,22] employed stable and radioactive isotopes of water to verify the migration of leachate contaminant in the water bodies of Bantar Gebang Landfill, Indonesia, Metro Manila, Philippines and Andralanitra landfill site, Madagascar, respectively. To confirm the interaction of leachate with groundwater bodies, the stable isotope compositions of the leachates and those of the monitoring wells were measured and the results are presented in Table 2 and Figure 1, respectively.
The 2H values of the leachates were relatively highly enriched (+6 to +16‰), whilst δ18O is depleted and ranged from −4.5 to −3.7‰ [21]. Similarly, studies by [23,24] reported highly enriched δ2H values ranging from +30 to +60‰ in landfill leachates with respect to local average precipitation values, and these were associated with methanogenesis. The deuterium enrichment (−3.6 to +10.3‰) and depletion (−21.87 to +7.86‰) of leachates during the dry and rainy season, respectively, were also observed (Table 2). In Figure 1a, the isotopic values (δ2H and δ18O) of water in the drier months were below the Local Meteoric Water Line (LMWL) but fell above the LWML during the rainy season, especially for well 3 and 4, owing to increased deuterium concentrations. The forgoing deuterium enrichment seasonal pattern observed in groundwater was attributed to leachate infiltration from the landfill through fractures in the underlying rocks [25,26].
Tritium concentrations were measured in groundwater, landfill leachates, precipitation and surface water at the above-mentioned sites. The conservative nature and low detection levels of tritium enable its wide application as a pollution tracer in groundwater studies [30,31]. Tritium isotope is naturally produced in the atmosphere at a very low rate through the reaction of oxygen atoms and high-energy cosmic radiation. The produced tritium is subsequently oxidized to titrated water (THO), and thus, enters the hydrological cycle in precipitation [32,33]. The treatment of landfill leachates via evaporation (burning) converts the tritium in the titrated methane (present in the landfill gas) to tritiated water vapor.
The trend in tritium concentrations of groundwater immediately downstream of the landfill in Metro Manila, Philippines, is presented in Figure 1b. The mean value for tritium precipitation within the study area was assumed to be 1.9 TU [21]. Thus, any groundwater values above the mean precipitation value were likely inferred to have been impacted by other anthropogenic sources of tritium within the landfill. Even though high tritium values (>2000 TU) resulted from the atmospheric thermonuclear testing between 1952 and 1963 [34], these values decayed from 2000 to 20 TU (Canada) and from 4000 to 10 TU (UK), the same levels at the year 1985 [30]. This is clear evidence that the high tritium concentration in modern precipitation and groundwater may not be primarily an effect of the nuclear bomb testing, but mainly a result of atmospheric deposition of high energy cosmic rays and landfill leachate. Landfill leachate was detected to contain elevated tritium concentration as far back as 1982 [35]. In the current review study, the tritium value in the leachate ranged from 50.9 to 493.9 TU (Table 2) in plant A of Bantar Gebang Landfill, Indonesia. Several studies [30,33,36] have established that landfills leachates contain elevated tritium in the range of 6440 TU (760 Bq/L) (Australia), 10,000 TU (UK) and 159,316 TU (513,000 pCi/L) (USA). The elevated tritium concentration in landfill leachates according to [33,34] is associated with luminescent dial-plates of watches, gaseous tritium light sources (GTLS), trimphone, clocks, luminous paint, key chains and hospital products deposited in landfills. These sources, especially GTLS, can induce up to 6.6 × 10 9 TU (7.5GBq) [33]; exit signs have up to 30 curies of tritium [36]. GTLS are mostly used in developed countries but are apparently deposited into municipal solid waste in developing countries. The tritium concentrations in the shallow groundwater (Well 1) during the end of the rainy season (October, 2007) match with those of the precipitation tritium values (Figure 1b), thus indicating the immediate infiltration of rainfall. Even though groundwater is expected to contain little or no tritium, wells 2 and 4 in the peak of the rainy season (September, 2003) contain elevated tritium concentrations of 2.3 ± 0.5 and 5.8 ± 0.4 TU, respectively (Figure 1b), above the mean precipitation value (1.9 TU). This may be due to direct infiltration of leachate from the landfill of the underlying aquifer through the fractured rocks. Furthermore, elevated tritium contents ranging from 14.9 to 76.6 TU (Table 2) and 10.4 to 22.8 TU (Table 3) were also observed in groundwater that was down-gradient to landfills.
Conversely, the monitoring of wells that are upstream and also those that are 700 m away downstream from landfills showed depleted tritium contents of 0.84 to 1.46 TU, as evidenced in Table 2 [22]. This is congruent with the study of [21] where the deep groundwater wells 5 and 6, which are farther away from the landfill had very low tritium concentrations (0 to 0.4 TU) throughout the period. The preceding trend may be due to the limited impact of the leachate to those wells, as evidenced by an increased distance. The authors of [30] reported decreased tritium values on wells that are located away from dumpsites and trenches.
The use of tritium content as a leachate tracer is predominantly effective; it is not present in seawater nor fertilizers and, thus, provides a basis for distinguishing groundwater and leachates. These peculiarities make it preferable to any chemical and other isotopic parameters to delineate dumpsite leachates from septic waste and fertilizers. However, no technique can be 100% effective in all cases; e.g., there have been scenarios in which water bodies can contain enriched deuterium and negligible tritium values in waterbodies closer to landfills, as observed in Table 3 [37]. This may be due to the following reasons: (1) there could have been leachate percolation, but materials containing tritium had not been deposited in the landfills; (2) the landfills might be very old, causing substantial decay, or very new, with low tritium-enrichment; (3) a lack of leachate percolation but rapid evaporation may have triggered the deuterium enrichment. The latter (3) is mainly observed in rivers or lakes as they are more exposed to sunlight leading to rapid evaporation. There have also been situations where tritium production is linked to other anthropogenic activities such as nuclear plants and, thus, no enrichment of deuterium was observed. Therefore, to effectively confirm the infiltration of landfill leachates into waterbodies, there is a need to integrate 13C isotope owing to its being unaffected by condensation and evaporation, but only by the occurrence of microorganisms and organic matter.
The contribution of carbon to different pollutant sources makes it possible to assess the impact of carbon (C) in the environment [38]. The unique isotopic composition of carbon in groundwater and leachate proffers invaluable understandings of the C transfer between natural environment and landfills. All water has some amount of inorganic C dissolved in solution, which is referred to as dissolved inorganic carbon (DIC). DIC comprises the carbonate ion ( CO 3 2 ), the bicarbonate ion ( HCO 3 ), and aqueous carbon dioxide [39]. The isotopic composition of DIC (δ13CDIC) derived from organic matter decomposition is −28‰ [38]. However, the δ13CDIC from calcite dissolution and other carbonate minerals fall within the range of −14.6 to +1.1‰ whilst the isotopic signature of the diffusing CO 2 is approximately −8‰ [38].
In landfills, methanogenesis may trigger the production of methane and CO 2 (g). Owing to the presence of sufficient microorganisms within the leachate of landfills, substantial amounts of the lighter isotope, 12C, of the dissolved inorganic carbon ( CO 2 ) will be used up, thus leaving exorbitant amounts of the heavier isotope, 13C, in the residual CO 2   of   the leachate pool. Therefore, the δ13C-DIC of leachate-contaminated groundwater will be highly enriched, ranging from +10‰ [23] to +38‰ [38,40]; the variation depends on the landfill activity [38]. Within developing countries, researchers including [25,37] employed δ²H, δ¹⁸O and δ13C to identify leachate-contaminated groundwater in the vicinity of landfills and the results are shown in Table 4.
The δ13C–DIC and δ²H values of the leachates ranged from +16.5 to +21.2‰ and −38 to −24‰, respectively (Table 4). These values compare well with the δ13C–DIC and δ²H results of leachate reported by [29] due to the biodegradation of organic matter. Comparatively, the δ13C–DIC of the downstream water was more enriched than the upstream water, suggesting that the leachate may have interacted with the downstream water [29]. Moreover, δ13C–DIC in the GR1 sample (−14 to −12.2‰) depicts values that are characteristic of superficial stream water, which may have resulted from carbonate minerals dissolution in the aquifers [38]. Furthermore, well GW6 has depleted deuterium values (−42‰) and slightly enriched δ13C values (+8.9‰). The depleted δ²H isotopic values for GW6 might be due to one of two reasons: (i) a decrease in methanogenic activity due to the depletion of organic matter sources [38]; and/or (ii) the interaction of the groundwater and SW1 stream water [29]. Comparatively, both GW6 (Well) and GR10 (stream) have similar 13C values but the latter have enriched δ²H and δ18O. This might be due to the evaporation effect often observed in stream waters. In addition, the δ13C values for GW8 are enriched (+11‰) whilst GW9 is +5‰; this is because GW8 occurs immediately downgradient of the landfill whilst GW9 occurs slightly downgradient of GW8. This is one of the main reasons why both have comparable δ²H values (−35‰ & −34‰) as both are from the same recharge source. From the foregoing trend, it could be ascertained that δ13C values decrease relative to the increase in distance from landfills.

2.2. Application of Dual Isotopes of δ15N and δ18O and δ11B to Identify Nitrate Pollution Sources

Groundwater can be polluted both naturally and anthropogenically by various distinct sources, notably the leaching of excessive fertilizers, the uncontrolled release of toxic wastes from dumpsites, the leaching of sewage waste from neighboring cesspits, and seawater intrusion. All of the foregoing sources except the latter (seawater intrusion) can induce nitrates with different isotopic compositions. Therefore, using an isotopic approach to identify these nitrate sources is vital and should be the first step in deducing the sources of groundwater contamination.
Nitrogen, which has been extensively used to monitor the fate and source of nitrate contaminants, has two isotopes, δ14N and δ15N, with relative abundances of 99.63% and 0.37%, respectively. The principle is that NO 3 originating from distinct sources will show different isotope fingerprints.
The nitrogen isotope ratio values were first utilized to deduce the sources of nitrate contamination in the 1970s. The authors of [41] used the foregoing technique to evaluate the contribution of fertilizer to NO 3 in the Sangamon River, United States of America. Their research laid the foundation for a stable isotope approach to delineate the various sources of NO 3 pollution in water bodies. Understanding the factors that affect the isotopic composition of N and O is vital when utilizing the δ15N and δ18O technique to determine the sources of nitrates in freshwater bodies. There are several sources of nitrate to waterbodies, some of which are derived from agricultural and industrial activities. The primary microbially mediated reactions that control the dynamics of nitrogen in soil and groundwater are ammonia volatilization, denitrification and nitrification (Figure 2). Both ammonia volatilization and denitrification can significantly increase the δ15N of the residual nitrate in groundwater.

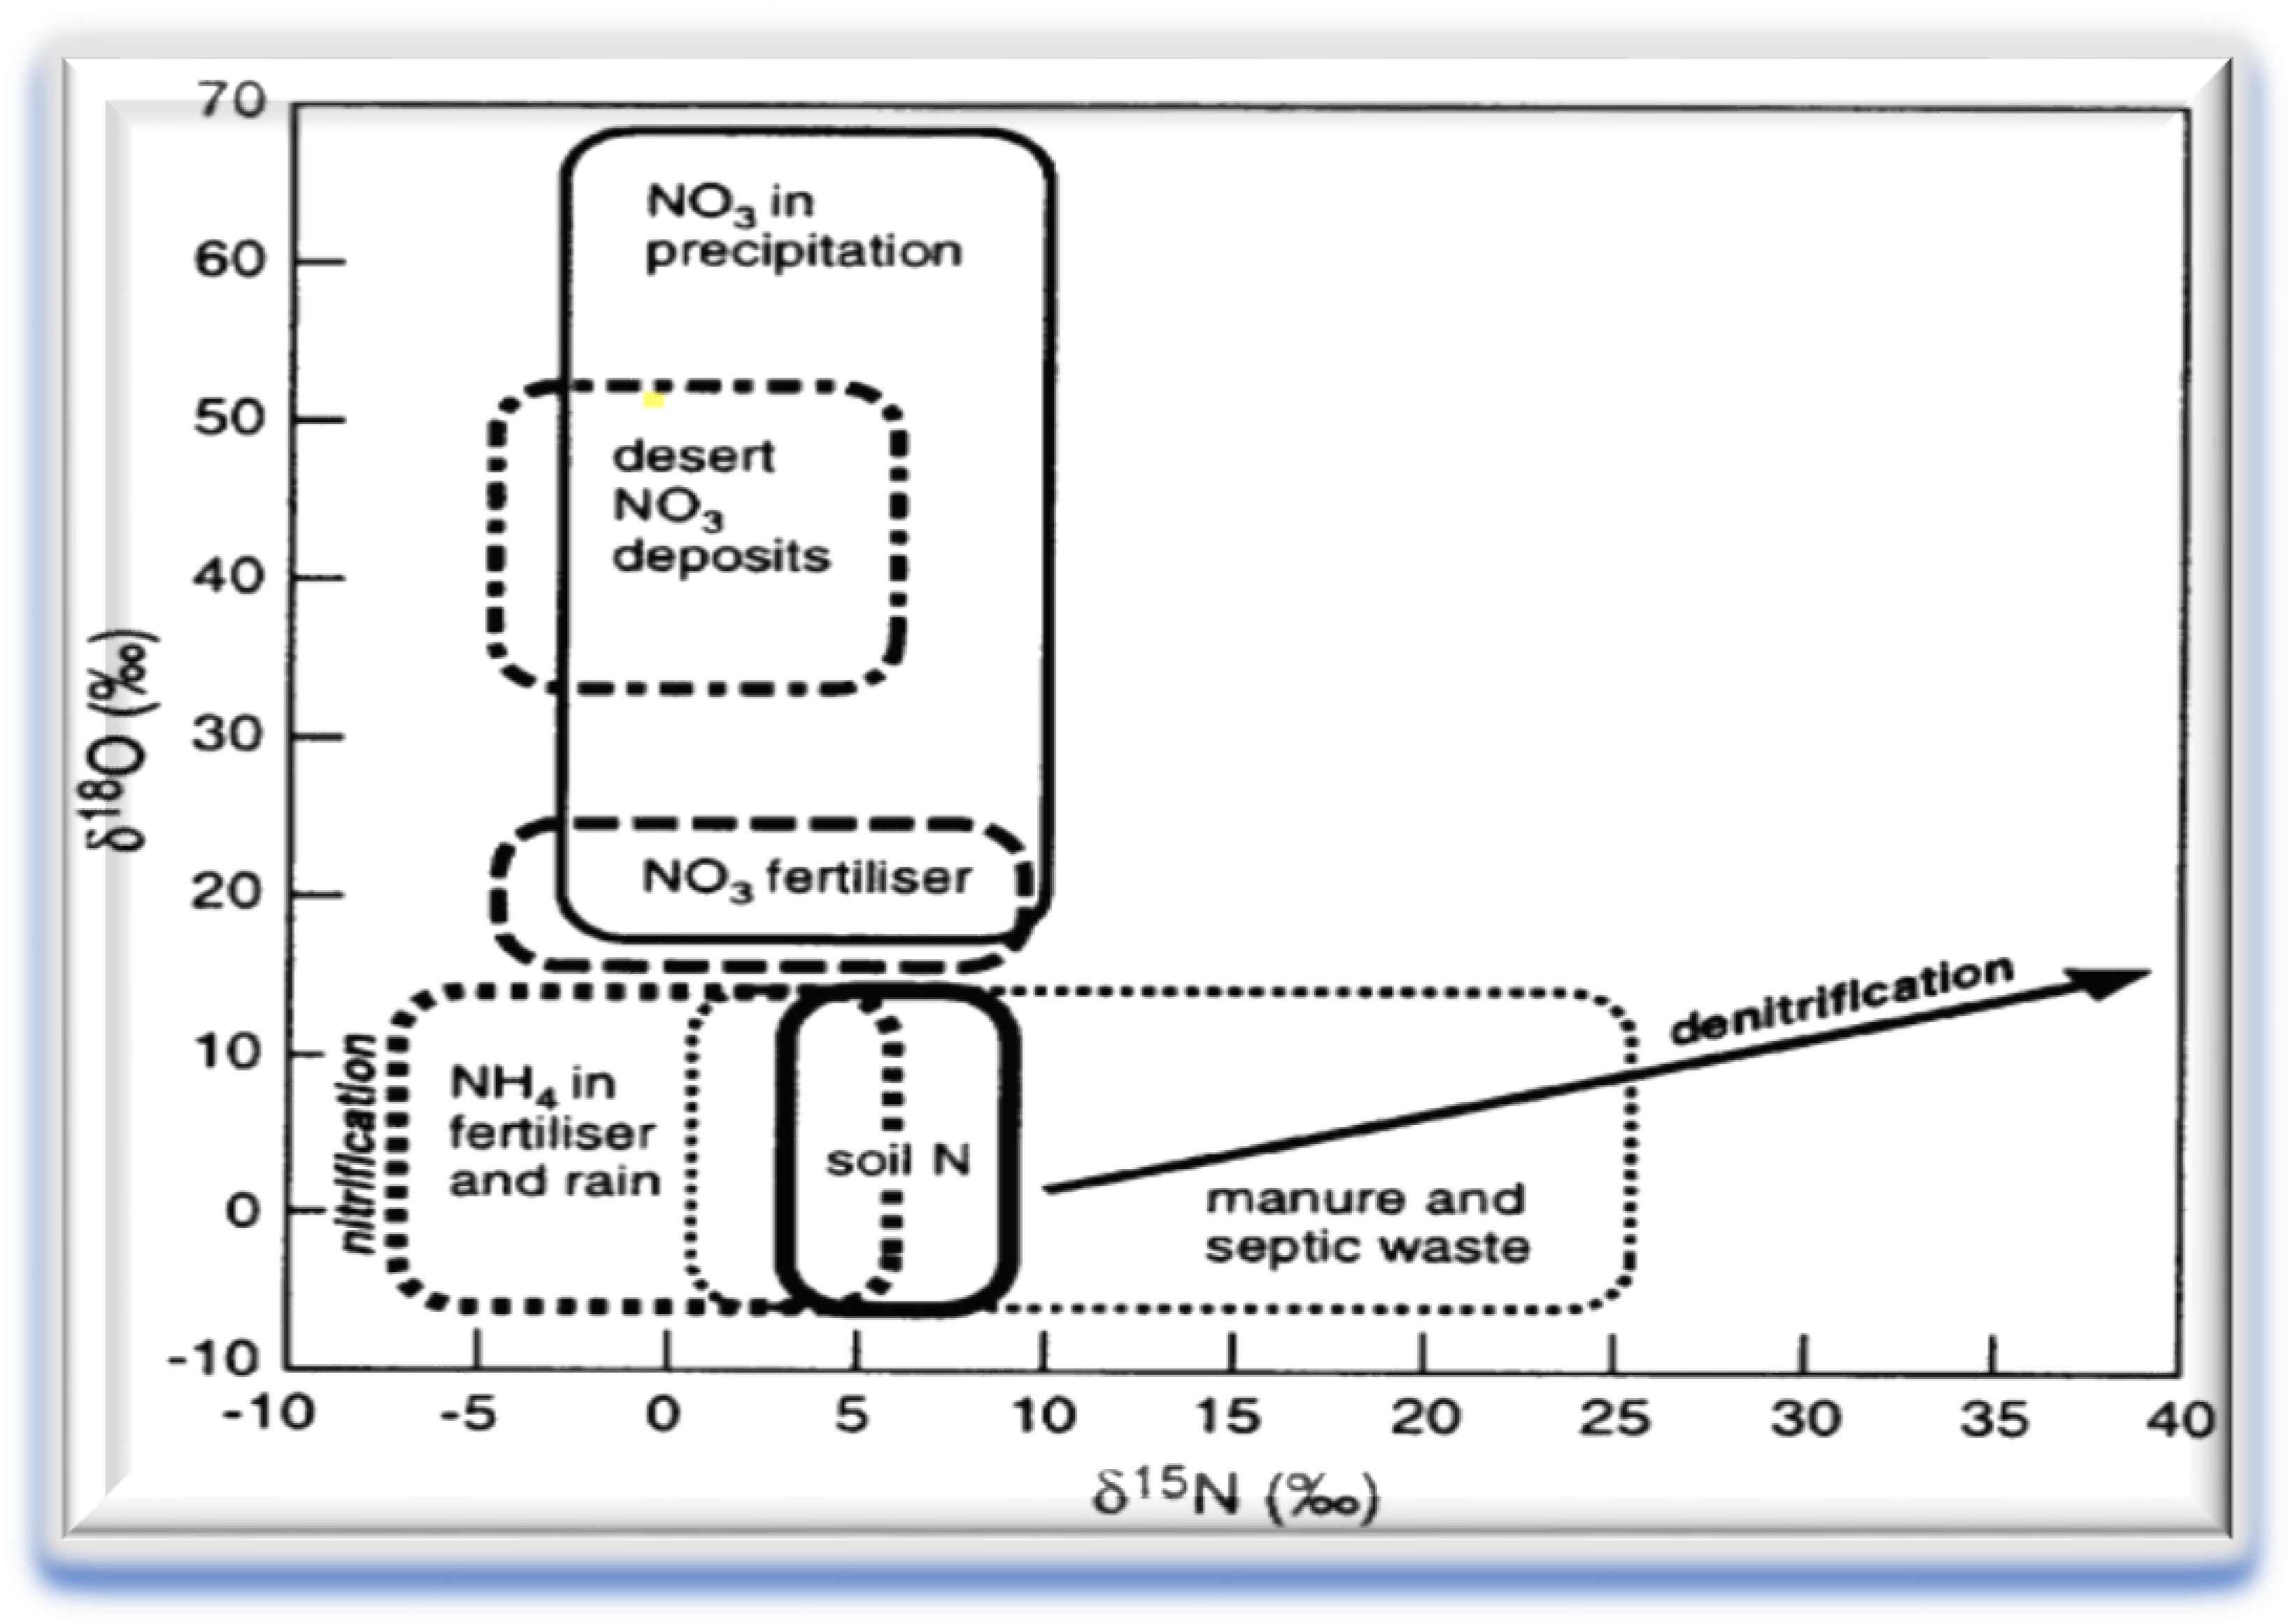
2.3. Application of δ15N and δ18O to Identify Nitrate Pollution Sources

Recent studies by [43,44,45] that utilized nitrogen isotopes to investigate the sources of NO 3 have been documented. In spite of its successful application to discriminate NO 3 pollution sources, the δ15N technique still faces some challenges such as other sources (atmospheric versus soil nitrate, inorganic fertilizer versus soil nitrate and manure versus landfill waste) not being able to be distinguished due to the intricacies of the various nitrogen transformations that cause overlaps of the δ¹⁵N. The oxygen isotopes in nitrate ( δ 18 O NO 3 ) were employed to lessen the uncertainty of δ 15 N NO 3 . However, δ 18 O NO 3 data have its own complications due to the overlap of their values for nitrate sources from ammonium fertilizer, soil nitrogen, manure and septic wastes, etc. This leads to the conclusion that δ 18 O NO 3 is of little importance in identifying nitrate sources [46].
Owing to the difficulties in distinguishing between the various nitrogen sources mentioned above, the authors of [47] coupled δ18O with δ15N to form a dual isotope of δ 18 O NO 3 and δ 15 N NO 3 to effectively identify the source (s) of nitrate. This dual stable isotope method has been widely utilized to trace nitrate sources in waterbodies by delineating their specific δ 18 O NO 3 and δ 15 N NO 3 fingerprints.

2.3.1. δ15N and δ18O Fingerprint of Manure and Septic Waste Nitrate sources

Waste from septic tanks, landfills, animal manure, sludge and sewage contains organic nitrogen, notably urea, as well as organic nitrate, etc. However, these organic nitrogen species have the tendency to transform to other forms of nitrogen via microbial processes known as denitrification and also by ammonification. During these transformational processes, there is significant enrichment of δ 15 N NO 3 and δ 18 O NO 3 . Recent studies (2010 to 2020) in developing countries from selected continents (Asia, Africa, Europe and America) that utilized δ 18 O NO 3 and δ 15 N NO 3 to investigate the sources of NO 3 have been recorded. The authors of [48] utilized δ 18 O NO 3 and δ 15 N NO 3 to determine the nitrate sources of groundwater in Kano Plains and Kisumu City, Kenya. The δ 15 N NO 3 concentrations of the boreholes of Kano Plains and Kisumu City ranged from +4.1 to +25.8‰ for the wet season whilst those of the dry season ranged from +12.4 to +51.8‰. On the other hand, the δ 18 O NO 3 values ranged from −2.4 to +20.8‰ for the wet season and from −1.7 to +24.1‰ for the dry season. Most of these δ 15 N NO 3 values (+10 to +51.8‰) partly fell within the range of sewage and animal manure. Considering the effect of seasonality, the δ 15 N NO 3   and δ 18 O NO 3 values were more enriched in the dry season than the rainy season and this is consistent with the observations of [49]. The enriched isotope values in the drier months could be associated with the enhanced denitrification or volatilization of animal manure triggered by evaporation.
Denitrification is a multiple-step process involving the bacterially mediated reduction of NO 3 to nitrous oxide ( N 2 O ) and dinitrogen ( N 2 )   under anoxic condition. It is a redox process where NO 3 is used by certain bacteria that act as electron acceptors during the degradation of organic matter (electron donors), producing N 2 O and N 2   [50]. Its isotopic fractionation depends on the enrichment of the electron donors, electron acceptor and oxygen concentration. Denitrification can be heterotrophic if linked to the oxidation of organic matter (Equation (2)) or autotrophic if related to the oxidation of inorganic compounds (Equation (3))
4 NO 3   +   5 C H 2 O     2 N 2   +   4 HCO 3   +   CO 2   +   3 H 2 O
14 NO 3 + 5 FeS 2 + 4 H +     7 N 2   + 10 SO 4 2 + 5 Fe 2 + + 2 H 2 O
During denitrification, bacteria (cyanobacteria) preferentially use lighter isotopes, leading to enriched heavier isotopes in the residual NO 3 [51]. However, the presence of algae (benthic algae, which are readily degradable, serving as both NO 3 and organic source) may facilitate the denitrification process [52]. Denitrification may drive the values of δ15N from +6 to +25‰ [50]. Because denitrification also causes the fractionation of oxygen-stable isotopes in NO 3 , both the δ15N and δ18O values of the residual NO 3 will increase at a ratio of 1.3:1 to 2:1 (Figure 3) [48,53] and, thus, produce a slope of about 0.5.
On the other hand, since denitrification involves the reduction of NO 3 (terminal electron acceptor) to N 2 , the concentration of the residual NO 3 will be negligible compared to that of the substrate pool. Therefore, increase in denitrification will lead to an increase in δ15N and δ18O values with an exponential decrease in nitrate concentration. This observation is, in principle, congruent with the study of [55] where samples taken from farming and animal-rearing areas as well as bad sanitary zones in Ghana had enriched δ 15 N NO 3 and δ 18 O NO 3 (in the ratio of 2:1) values with a corresponding decrease in NO 3 concentration due to the denitrification effect.
Apparently, since denitrification mostly takes place in anoxic conditions, the dissolved oxygen values decrease, ranging between 0 and 0.5 mg/L [54]. The authors of [53] employed a dual isotope of δ 15 N NO 3 and δ 18 O NO 3 to probe the sources of NO 3 in groundwater in the Turpan-Hami Area, Northern China. The δ 15 N NO 3 and δ 18 O NO 3 values, respectively, ranged from −0.6 to 31‰ and from +16.3 to +37.4‰ and, thus, it was inferred that the NO 3   mainly originated from precipitation and denitrification. However, most of the samples displaying denitrification effects had dissolved oxygen values >2 mg/L, which may not be relevant for denitrification. A similar finding was reported in Mexico [49]. On the contrary, the foregoing assertion may not always be true as other studies, conducted elsewhere, suggested that certain bacteria can trigger denitrification in oxygenated environments where there is oxygen fluctuation, such as sandy permeable terrain [56,57]. For example, the Paracoccus denitrificans bacteria can induce denitrification under both oxic and anoxic conditions. Therefore, relying on the dissolved oxygen content to ascertain denitrification is quite vague and may be misleading. The other alternative route in which organic nitrogen can be transformed to inorganic nitrogen is through the process known as ammonia volatilization (Equation (4)). Ammonia volatilization is defined as a chemical process that occurs at the surface of the soil when urea fertilizer is converted to NH 3 ( g ) at high pH. The nitrogen in human excreta predominantly occurs in the form of urea. The urea is hydrolyzed to NH 3 and converted to ammonium ion ( NH 4 + ) and NO 3 as illustrated below:
CO ( NH 2 ) 2     NH 3   NH 4 +     NO 3
The hydrolysis of urea triggers an increase in pH and the produced NH 3 is easily lost by volatilization and thus depleted in δ15N, while the residual NH 4 + is highly enriched in δ15N. Since a significant proportion of the NH 4 + is converted into nitrate, the residual NO 3 will be highly enriched with δ15N. Hence, NO 3 originating from animal manure displays δ15N values that are specifically in the range +10 to +20‰ [44] and +5 to +25‰ [58].

2.3.2. δ15N and δ18O Fingerprint of Ammonia in Fertilizer and Precipitation

The indiscriminate and non-strategic use of fertilizers in agriculture results in the increased NO 3 concentration of groundwater bodies. Synthetic nitrogen fertilizers, which include commonly applied man-made urea, potassium nitrate ( KNO 3 ) and ammonium nitrate ( NH 4 NO 3 ) , are produced via the fixation of atmospheric nitrogen (N2). These anthropogenic fertilizers have 15N fingerprints ranging from −4 to +4‰, typical of atmospheric nitrogen sources (Figure 3). However, some nitrate fertilizers showed enriched δ15N fingerprints ranging from −8 to +7‰ due to the effect of nitrification.
Nitrification is a process by which NH 4 + (mediated by distinct autotrophic bacteria) is oxidized into NO 3 . Nitrification occurs when biota’s N-demand is less than the NH 4 + pool and, thus, causes NO 3 to leach into the soil horizons and subsequently into water bodies [59]. The mechanism of nitrification occurs in several steps. The steps involve the oxidation of NH 4 + to NO 2 , and subsequent oxidation to NO 3 in aerobic conditions (Equation (5)). The nitrogen sources that can undergo nitrification are inorganic fertilizer and soil organic N.
Nitrification Reaction:
Organic-N     N H 4 + N H 4 +   +   H 2 O     N H 2 O H   +   2 [ H ]   +   H + N H 2 O H   +   O 2     N O 2   +   [ H ]   +   H + N O 2   +   H 2 O       N O 3   +   2 [ H ]
The whole nitrification processes involve distinct nitrogen (N) isotopic fractionations, which induce depletion of δ 15 N NO 3 values in the residual pool. The most significant fractionation step is linked with the transformation of NH 4 + to NO 2 . Generally, the degree of isotope nitrogen fractionation depends on the amount of NH 4 + ion in the substrate pool. However, the rate of nitrification decreases as the NH 4 + pool is consumed, causing an insignificant N fractionation and a small δ15N enrichment in NO 3 . Furthermore, nitrogen fractionations are negligible in N-limited systems [60]. With regard to δ 18 O NO 3 , several isotope studies demonstrated that NO 3 produced by nitrification obtains two oxygen atoms (O) from water molecules and one O atom from the atmosphere [61,62]. Therefore, the δ18O of microbial nitrate can be calculated using Equation (6) if the δ18O of water and that of atmospheric O 2 are known.
δ 18 O ( NO 3 ) = 2 3 δ 18 O ( H 2 O ) + 1 3 δ 18 O ( O 2 )
The authors of [63] estimated the δ18O of atmospheric O 2 to be 23.9‰ whilst the δ18O of the water molecule could be obtained from the laboratory. For waters with δ18O values of −25 to +4‰, the 18 O NO 3 , formed from ammonium nitrification will range from −10 to +10‰ (Figure 3). It is noteworthy that the measured δ18O values of microbially produced NO 3 can be 5‰ higher than the calculated values [64,65].
Conversely, Synthetic NO 3 fertilizer is not produced by this same nitrification reaction. It derives all of its oxygen from atmospheric O 2   ; this results in significantly enriched values of δ 18 O NO 3 ranging from +17 to +25‰ [62,65]. Thus, δ 18 O NO 3 values may be effectively used to distinguish between ammonia in fertilizer and precipitation from that of nitrate fertilizer. For example, the study conducted by [55] revealed that the δ 18 O NO 3 values of the borehole, hand-dug well and surface water ranged between +5.1 and 8.83‰ and were thus below the δ 18 O NO 3 values of atmospheric deposition (60 to 70‰) and nitrate fertilizer (+15 to 25%). This clearly indicates that atmospheric deposition and nitrate fertilizer may not have influenced the nitrate pollution. This observation is consistent with the result obtained by [49] where the δ 18 O NO 3 ranged between +3.84 and +10.96‰. However, microbial nitrification and denitrification could have influenced the nitrate concentration in the study area and, thus, confirmed by the land use activities within the study area. The whole principle is that, during nitrification, the bulk of the atmospheric molecular oxygen will be utilized for the oxidation of ammonium and, therefore, the limited concentration of O 2 will lead to the subsequent depletion of the δ18O values of the residual O 2 . However, several researchers reported that δ 18 O NO 3 values were significantly depleted in the wet season but enriched in the dry season from the same source. This might have been due to evaporation induced by increased temperature, which was accompanied by the enriched δ18O values of H 2 O [61], or the nitrification processes during the dry season.

2.3.3. δ15N and δ18O Fingerprint of Atmospheric Deposition

Nitrogen oxides, which are the source (s) of atmospheric nitrate, are produced during the combustion of fossil fuel from power plants and vehicle exhausts, etc. These nitrogen species undergo nitrification, denitrification and ammonia volatilization depending on the compound ( NH 4 + or NO 3 ) or type of anthropogenic input in precipitation. Therefore, the δ15N values of atmospheric nitrate may range from −0.6 to +31‰ [53]. The fate and the associated isotopic enrichment of atmospheric nitrate can also depend on the season, meteorological conditions, distance from the ocean, and proximity to pollution sources, etc. [54]. Thus, using δ15N isotope value alone could make it difficult to distinguish between atmospheric and other anthropogenic sources of nitrate. However, the δ 18 O NO 3 values can be a useful tool to distinguish between atmospheric nitrate depositions, which have higher values of 60 to 70‰ [54], from biologically generated nitrate in water and soil (0.8 to 5.8‰ [17] or –15 to 15‰ [66]). The δ 18 O NO 3 values in [53], for the majority of the samples, are above +30‰. Additionally, the authors of [67] established an δ 18 O NO 3 value of up to 34.6‰ in the aquifer of the Sava River. The foregoing enriched δ 18 O NO 3 values might be associated with the atmospheric deposition of nitrate [64]. This observation is consistent with the land use activities in the study areas as there are no human activities that may have induced anthropogenic nitrate within the waterbodies. The authors of [66] also observed a high range in the δ18O values of rainfall NO 3 (65 to 70‰), which subsequently decreased to 2–5‰ in soil. The highly enriched δ18O values of atmospheric NO 3 may be due to the incomplete combustion of fossil fuels and/or atmospheric photochemical reactions [54]. According to [67], nitrate from atmospheric precipitation induced by photochemical reactions may involve compounds enriched with δ18O, leading to high δ 18 O NO 3 values. This is because, during photochemical reactions (initiated by sunlight), the concentration of the atmospheric molecular oxygen will increase, which will lead to the consequent enrichment of the δ18O values of the atmosphere ( O 2 ) .

2.3.4. δ15N and δ18O Fingerprint of Soil Nitrogen/Organic Matter

Generally, soil N is often more enriched in δ15N than atmospheric N. This is because the combination of denitrification, nitrification and volatilization controls the δ15N values of the total nitrogen in soil. The δ15N values of soil N from different studies range between +3 and 8‰ (Figure 3). Although mineralization and nitrification are the respective major causes of δ15N enrichments in soil organic N, other processes can also produce increases in the δ15N of nitrate with depth. In summary, the use of the dual isotope of δ15N– NO 3 and δ18O– NO 3 is beneficial in identifying various sources of nitrogen such as atmospheric vs. inorganic fertilizers. Unfortunately, this technique is yet to be used to differentiate between nitrogen pollution from sewage, animal manure and septic effluents, etc. Therefore, to distinguish between pollution coming from the mentioned sources, the integration of other isotopes such as δ11B will be ideal.

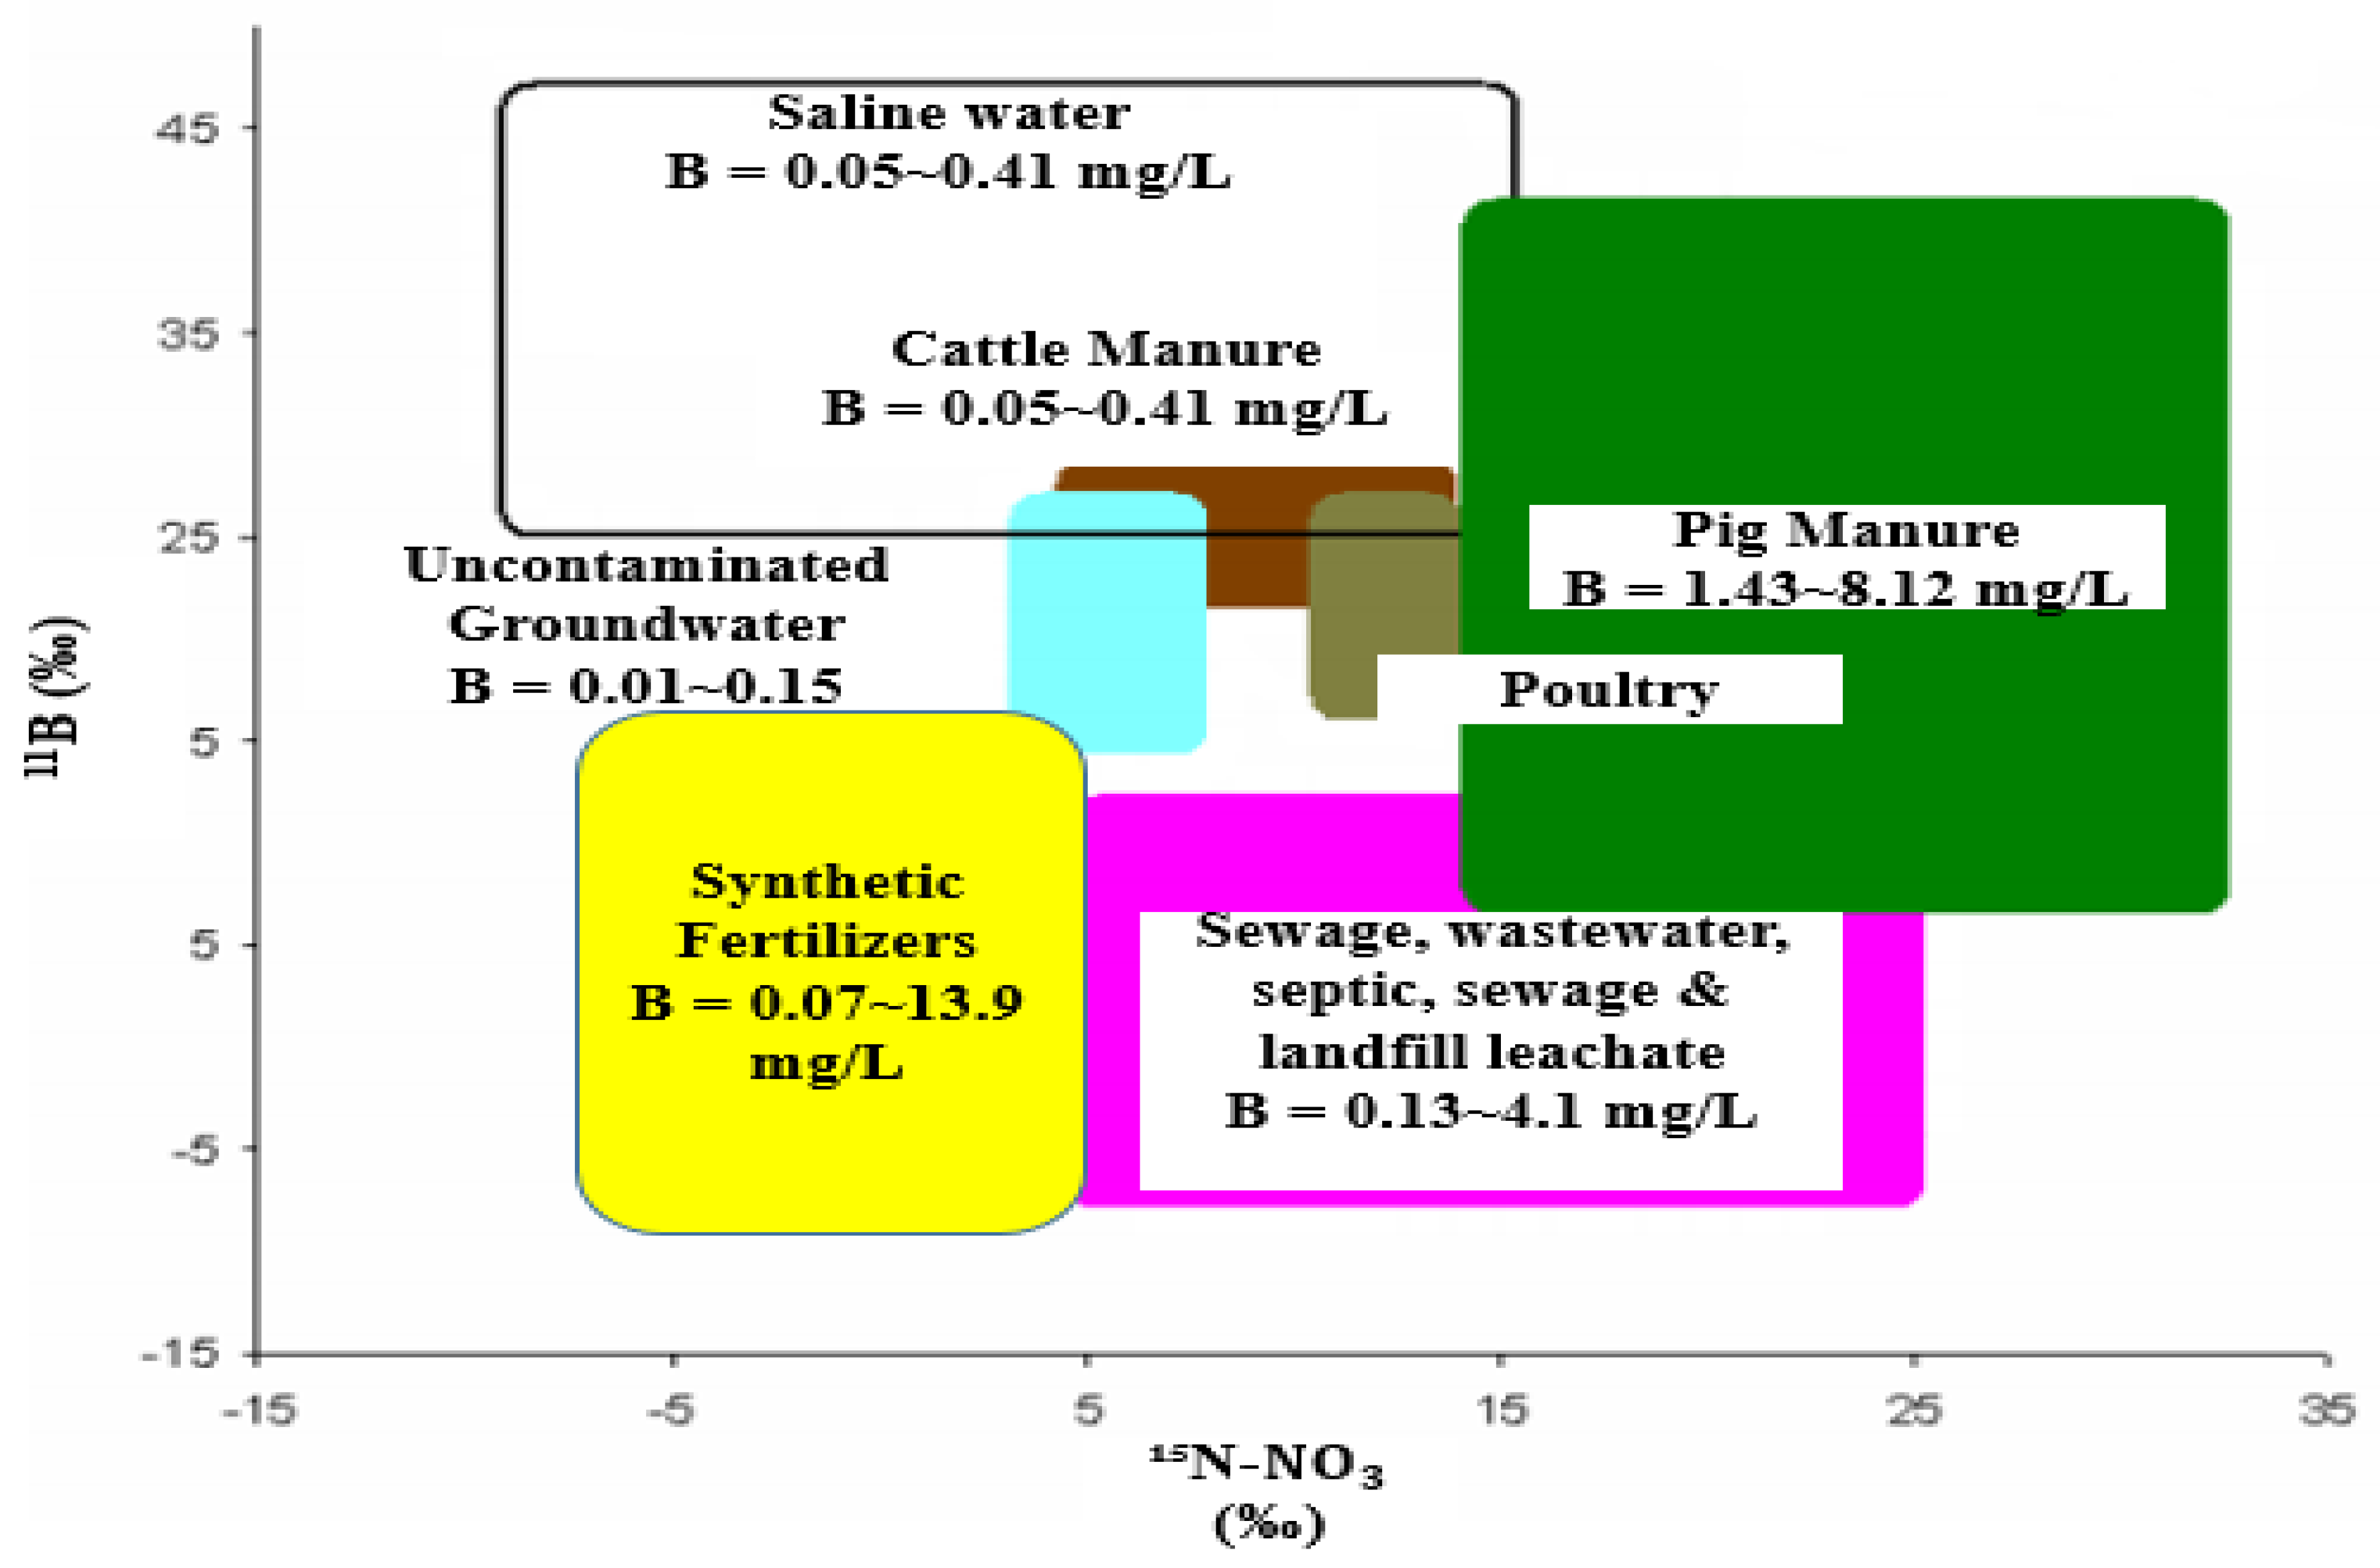
2.4. Integration of δ¹¹B and δ15N to Identify the Factors Impacting Groundwater Pollution

According to [68], the non-conservative nature of nitrogen causes the interference of isotope fractionation and thus impedes the precise identification of NO 3 sources. The preceding limitation can be tackled via the integration of δ15N and boron isotope (δ11B) [69,70]. On the other hand, the increase in groundwater salinity, mainly in coastal areas, is linked to seawater intrusion or anthropogenic contamination from sewage and septic effluents. Therefore, it is vital to distinguish the sources influencing high salinity, which could also be effectively achieved using boron isotopes [71].
The two naturally occurring boron isotopes are 10B and 11B. Relatively, these isotopes have large mass differences and this causes the wide natural range of δ11B isotope values. The wide range of δ11B isotope values enables significant contrasts between B sources in groundwater. Industrially, boric acid and borate minerals, which are derivatives of boron, are extensively applied to produce glass and porcelain, carpets, leather, photographic chemicals, cosmetics, fertilizers and metals [71]. Sodium perborate is also applied in domestic cleaning products as a bleaching agent. When the sodium perborate is discharged into the environment following the end use of detergents, this triggers the accumulation of boron in effluents and their consequent infiltration into waterbodies [71]. The purification of water in sewage treatment plants may remove little or no elemental B. Hence, δ11B is a conservative tracer of a wastewater source [70]. Owing to the conservative nature and the wide application of B-compounds in agricultural and industrial scenarios [70], alongside its natural existence in saline water, δ¹¹B can be a useful means to determine the precise source(s) of pollutants from fertilizers, septic effluents, sewage, animal manure and sea water intrusion.

2.5. Variations in Boron Isotope Abundance (δ¹¹B) in Natural and Anthropogenic Sources

The use of δ¹¹B as a tracer of natural and anthropogenic impacts on water resources has mainly focused on the determination of sea water intrusion, sewage water infiltration, animal manure (hog and cattle), septic waste and inorganic fertilizers [72]. Several researchers including [71,73] have evaluated the composition of ¹¹B from both natural and anthropogenic sources but the author of [74] was the first to utilize B isotopes as co-migrating tracers of NO 3 .
δ¹¹B values for uncontaminated groundwater were found to be highly enriched (30‰) with a corresponding depleted boron concentration of 0.06 to 0.13 mg/L [71]. The author of [74] reported δ¹¹B values and B-concentrations of 23.8 to 25.6‰ and 0.02 mg/L, respectively, for uncontaminated groundwater up-gradient of cultivated fields in Minnesota. The unpolluted groundwater in Bonne Fontaine spring had a δ¹¹B value of 38.5‰ with a corresponding B-concentration of 0.01 mg/L [68].
According to [71], seawater measurement has an average δ¹¹B value ranging from +33 to +60‰ and an average B-concentration of 1.9 mg/L; the highest boron concentration was estimated at 5.04 mg/L [71]. The foregoing δ¹¹B values for saline water is consistent with that obtained by [75] even though other researchers have reported δ¹¹B values of up to 70‰.
δ¹¹B values of untreated and treated hog manure ranged from 7.2 to 16.2‰ with a boron concentration of 1.43 to 8.12 mg/L [74]. However, the δ¹¹B value of the cattle (cow) manure ranged from 22.3 to 24‰ with a depleted boron concentration of 0.05 mg/L relative to hog manure [74]. Interestingly, groundwater down-gradient to hog manure had δ¹¹B values consistent with the hog manure whilst the δ¹¹B values of groundwater downgradient of cattle manure had enriched δ¹¹B values ranging from 32.5 to 38.6‰ [74]. The authors of [68] established that the δ¹¹B values in hog manure vary from 19.5 to 42.4‰ which is relatively higher than those reported by [74]. This is associated with the disparity of animal diet and physiology in US and France. In addition, the authors of [75] reported δ¹¹B values and B-concentrations of 6.2 to 8.2‰ and 0.15 to 0.41 mg/L, respectively, for cattle (cow) manure, and these varied widely from the results of [74].
The use of boron (B) compounds in detergents causes an enrichment of B in sewage effluents [68]. The boron isotopic composition of anthropogenic compounds is quite different from natural boron. This distinction can thus be used to identify different source (s) of boron contamination [71]. Studies conducted in the Dan region showed that the δ¹¹B values of treated and raw sewage effluents (δ¹¹B = +5.3 to +12.9‰) overlap with those of natural sodium borate ( NaBO 3 ) minerals (−0.9 to +10.2‰). This suggests that the use of NaBO 3 in detergents is the main source of anthropogenic boron in sewage [71]. However, the elemental concentrations of boron in both treated and untreated sewage are merely the same and, thus, range between 0.46 and 1.06 mg/L. Another study conducted elsewhere in England reported an enriched boron values in both sewage effluents (up to 4.1 mg/L) and sewage-contaminated river water (1.2 mg/L) [71]. This suggests that the treatment of boron via clay mineral adsorption can reduce elemental boron concentration but may lead to the enrichment of δ¹¹B in sewage effluents. The δ¹¹B values in the study conducted by [68] range between 0 and +10‰, which is in good agreement with data obtained for non-marine evaporites such as sodium borate. The authors of [75] used both TIMS and SF-ICP-MS instrumentation to measure δ¹¹B, and the values for waste water treatment plant effluent range between −2.8 and −0.3‰ with a corresponding B-concentration of 0.13 mg/L. This is within the range of different borate minerals, notably sodium perborate monohydrate (−3.9 to 0.9‰) and tetrahydrate products (−4.8 to 0.5‰) [76]. Some of the wastewater samples analyzed by [75] also have δ¹¹B values of 6‰, which is within the range reported by the authors of [71]. Relatively, some of the reported values of boron isotopes (δ11B) (approximately +3 to +10‰) in leachate at MSW landfills overlap with those of sewage and wastewater [19].
The variable increase in δ¹¹B isotope composition with a corresponding decrease in boron concentration in the groundwater of sewage and animal manure is linked with the adsorption of B onto clay minerals and organic matter. The dominant boron species in aquatic systems are boric acid B ( OH ) 3 and borates B ( OH ) 4 which are in isotopic equilibrium, as shown in Equation (7) [71,74,75].
  11 B ( OH ) 3 +   10 B ( OH ) 4     10 B ( OH ) 3 +   11 B ( OH ) 4
During the interaction of water with sediments in the aquifer, boron is absorbed by clay minerals or organic matter. Owing to its larger isotopic reduced partition function ratios, the heavy boron isotope preferentially partitions into boric acid, forming ¹¹ B ( OH ) 3 , whereas the lighter isotope partitions into the tetrahedrally coordinated B species, forming 10 B ( OH ) 4 [71,74]. The B adsorption in clays and other ion-exchange media preferentially removes 10 B ( OH ) 4 from the solution, leaving the residual B enriched in ¹¹B. Similar adsorption phenomena occur for organic materials, where 10 B ( OH ) 4 is preferentially removed from the solution, causing an enrichment in ¹¹B [74]. The adsorption magnitude of these boron species onto clay minerals depends on the concentration of boron in the solution, as well as the pH, salinity, clay content and mineralogy, organic carbon and cation exchange capacity.
The author of [74] evaluated the δ¹¹B isotope and B concentration values of different inorganic fertilizers and the results are as follows: NH 4 NO 3 (δ¹¹B~0.7‰, B~2.4 mg/L), Urea (δ¹¹B~0.4‰ B~0.46 mg/L) and PO 4 (δ¹¹B ~14.8‰, B~13.3mg/L). The δ¹¹B values (20.6‰) and B-composition (0.07 mg/L) of urea in the research of [75] are significantly different from those obtained in [74]. The results given in [75] also depict variable δ¹¹B compositions and B concentrations (0.2 to 7.2‰ and 2.7 to 13.9 mg/L, respectively) for NPK fertilizers based on differences in the proportions of N, P and K. Hence, the foregoing ranges of boron concentration and δ11B isotopes from different studies are compiled and plotted against δ15N- NO 3 values obtained by other researchers to easily aid a precise distinction of animal manures from sewage and dumpsite leachates (Figure 4). It can be observed that the 11B isotope values of pig manure overlap with cattle manure, but the elemental boron concentrations of pig manure are significantly higher than those of the cattle manure (Figure 4). Hence, elemental boron concentration could be reliably used to differentiate between cattle and pig manures. Elemental B and δ11B isotopes cannot be used to differentiate between landfill leachate and domestic sewage; thus, the use of tritium isotope will be key when considering landfills as a source of pollution.

2.6. Applications of δ¹¹B as a Pollution Tracer

Recent studies (2010 to 2020) in Spain, Portugal and Italy showed that the combined use of δ15N– NO 3 , δ18O– NO 3 and δ¹¹B is ideal to identify the source(s) of contamination from organic and inorganic fertilizers, animal manures, septic and domestic waste, and seawater intrusion. The authors of [77] carried out studies at the Baix Ter Aquifer in Spain to identify the sources of contamination and the processes affecting the nitrate concentration of a watershed. The δ15N– NO 3 and δ18O– NO 3 values ranged from +5.0 to +32‰ and +8.9 to +18.1‰, respectively. The results indicated that sewage, animal manure and dumpsite leachates could be the induced sources of nitrate. A similar observation was put forward by the authors of [78] in Portugal, where some of the samples had higher δ15N– NO 3 and δ18O– NO 3 values, suggesting possible animal manure and sewage infiltration. The δ¹¹B isotope was employed in both studies to ascertain the precise source(s) of pollution [68,74] In the study of [77], two samples had δ11B concentrations that ranged from +1.4 to +9.0‰ which indicated sewage contamination (Figure 4) [68,71,74]. This was attributed to the downstream location of the foregoing wells at the La Bishal treatment plant, which may have induced Borate ions. Ten samples had δ11B values of 23.5 to 34.5‰, which fell within the range of pig manure. This is in agreement with the studies of [78] whose δ11B values ranged between +28.5 and +44‰ and fell within the range of pig manure (Figure 4). The author of [47] used δ15N– NO 3 and δ18O– NO 3 to identify synthetic and organic sources of pollution in the Turin-Cuneo plain, Italy. Moreover, δ11B isotopes were used to further delineate the main anthropogenic sources of pollution. The δ11B result ranged from 8.37 to 18.05‰, which predicted sewage (+8.37‰) and an overlap between cattle and hog manure (18 to 42‰) as the principal sources of pollution. Considering the concentration of boron (0.06 to 0.09 mg/L), the possible source could be the cattle manure as opposed to the hog manure postulated in the literature. This is because most studies [68,71,74] reported boron concentrations of 1.43 to 8.12 mg/L for pig manure and 0.05 to 0.41 mg/L for cow manure; thus, cow manure may be the precise source. This is consistent with the land use activities within the study area, such as sewage treatment and agricultural activities (cattle rearing).

3. Quick Guide to Pollution Source Identification Using Isotope Analysis

Isotopic applications to investigate groundwater pollution sources represent one of the most integral aspects of water quality management. However, the understanding and interpretation of this technique is a challenge for many stakeholders involved in water quality management. Therefore, Table 5 proffers a quick guideline for scientists and policy makers to implement a multi-isotope approach for pollution source identification.

4. Conclusions

Earlier groundwater studies in relation to dumpsites were mainly focused on using hydrochemical data, which can provide information about the concentration of pollutants in water bodies. Geophysical methods can be used to determine the extent of pollution and possible leachate migration but cannot be applied to determine the specific sources of the leachates or pollution.
Because δ2H and δ13C values are enriched whilst δ18O remains unaffected during methanogenesis, these isotopes could be used to confirm leachate migration to water bodies. The shortcoming of this method is that it cannot depict the specific sources, dumpsites leachate versus sewage or animal manures since all of these sources can significantly induce methane gas.
The high tritium (2000 TU) in the atmosphere between 1952 and 1963, which was caused by nuclear bomb testing, has decayed to less than 10 TU. Therefore, the tritium in modern precipitation and groundwater mainly originates from atmospheric deposition (cosmic radiation) and landfill leachate, respectively. The combination of tritium and stable isotopes (δ18O and δ2H) seems to be potentially invaluable in terms of determining the sources of leachates. The δ15N technique has been successfully used to distinguish between synthetic and organic nitrogen sources but its application is limited to differentiating between atmospheric versus inorganic nitrogen sources. The use of a dual isotope of δ15N– NO 3 and δ18O– NO 3 is beneficial in identifying various sources of nitrogen such as atmospheric and inorganic fertilizers, but it is yet to be used to differentiate between nitrogen pollution caused by denitrification, i.e., sewage versus animal manure. Thus, the coupling of the 11B isotope with δ15N– NO 3 and δ18O– NO 3 and other hydrochemical parameters has proven to be effective in distinguishing between nitrate fertilizer, animal manure, seawater contamination and sewage because the 11B isotope is not influenced by physical, chemical and microbiological processes.
To date, there is no existing study that combines all of the discussed isotope approaches to identify groundwater pollution sources. Therefore, in areas affected by agricultural activities, landfill leachates, domestic or sewage effluent, and seawater intrusion, it is incumbent to couple hydrochemical ( Cl , NO 3 , B, DO) and isotope techniques (δ¹⁸O, δ²H, δ13C, δ15N– NO 3 , δ18O– NO 3 , δ11B and 3H) to effectively identify the pollution sources of groundwater in developing countries. The research outlined here will provide guidelines for further studies that may aim to critically distinguish between pollution sources from dumpsites, sewage runoff, septic leachates and seawater intrusion.

Author Contributions

Conceptualization, A.A.S.; formal analysis, A.A.S., R.A.D.F.-w. and C.L.; writing—original draft preparation, A.A.S.; writing—review and editing, A.A.S., R.A.D.F.-w., N.S.A.D., C.L. and I.K.; supervision, N.S.A.D., R.A.D.F.-w. and C.L. All authors have read and agreed to the published version of the manuscript.

Funding

This review was funded by the Regional Centre for Energy and Environmental Sustainability (RCEES), UENR.

Institutional Review Board Statement

Not applicable.

Informed Consent Statement

Not applicable.

Data Availability Statement

All data used were already referenced.

Acknowledgments

The support of the Regional Centre for Energy and Environmental Sustainability (RCEES), UENR, is acknowledged.

Conflicts of Interest

The authors declare no conflict of interest.

References

  1. Aboyeji, O.S.; Eigbokhan, S.F. Evaluations of groundwater contamination by leachates around Olusosun open dumpsite in Lagos metropolis, southwest Nigeria. Environ. Manag. 2016, 183, 333–341. [Google Scholar] [CrossRef]
  2. Ahring, B.K.; Biswas, R.; Ahamed, A.; Teller, P.J.; Uellendahl, H. Making lignin accessible for anaerobic digestion by wet-explosion pretreatment. Bioresour. Tech. 2015, 175, 182–188. [Google Scholar] [CrossRef]
  3. Kumar, S.; Dhar, H.; Nair, V.V.; Rena; Govani, J.; Arya, S.; Bhattacharya, J.K.; Vaidya, A.N.; Akolkar, A.B. Environmental quality monitoring and impact assessment of solid waste dumpsites in high altitude sub-tropical regions. Environ. Manag. 2019, 252, 109681. [Google Scholar] [CrossRef]
  4. Liu, S.; Wu, F.; Feng, W.; Guo, W.; Song, F.; Wang, H.; Wang, Y.; He, Z.; Giesy, J.P.; Zhu, P.; et al. Using dual isotopes and a Bayesian isotope mixing model to evaluate sources of nitrate of Tai Lake, China. Environ. Sci. Poll. Res. 2018, 25, 32631–32639. [Google Scholar] [CrossRef] [PubMed]
  5. Xu, S.; Kang, P.; Sun, Y.A. Stable isotope approach and its application for identifying nitrate source and transformation process in water. Environ. Sci. Poll. 2016, 23, 1133–1148. [Google Scholar] [CrossRef]
  6. Loague, K.; Corwin, D.L. Point and NonPoint Source Pollution. Encyclo. of Hydro. Sci. 2006, 4, 1–13. [Google Scholar] [CrossRef]
  7. Nisi, B.; Raco, B.; Dotsika, E. Groundwater Contamination Studies by Environmental Isotopes: A review. Hdb. Environ. Chem. Pollut. Wastes 2014. [Google Scholar] [CrossRef]
  8. Gugulothu, S.; Dhakate, R.; Sreedhar, K. Geophysical and hydrochemical studies for sustainable development of groundwater resources in northwestern part of Telangana State, India. J. Earth Syst. Sci. 2020, 129, 202. [Google Scholar] [CrossRef]
  9. Ameloko, A.A.; Ayolabi, E.A. Geophysical assessment for vertical leachate migration profile and physicochemical study of groundwater around the Olusosun dumpsite Lagos, south-west Nigeria. Appl. Water Sci. 2018, 8, 142. [Google Scholar] [CrossRef] [Green Version]
  10. Alfaifi, H.; Kahal, A.; Albassam, A. Integrated geophysical and hydrochemical investigations for seawater intrusion: A case study in southwestern Saudi Arabia. Arab. J. Geosci. 2019, 12, 372. [Google Scholar] [CrossRef]
  11. Karlık, G.; Kaya, M.A. Investigation of groundwater contamination using electric and electromagnetic methods at an open waste-disposal site: A case study from Isparta, Turkey. Environ. Geol. 2001, 40, 725–731. [Google Scholar] [CrossRef]
  12. Jia, H.; Howard, K.; Qian, H. Use of multiple isotopic and chemical tracers to identify sources of nitrate in shallow groundwaters along the northern slope of the Qinling. Appl. Geochem. 2020, 113, 104512. [Google Scholar] [CrossRef]
  13. Oteng, F.; Alo, C.; Yidana, S.M. Evaluation of groundwater recharge estimates in a partially metamorphosed sedimentary basin in a tropical environment: Application of natural tracers. Sci. World J. 2014, 2014, 8. [Google Scholar] [CrossRef]
  14. Yidana, S.M.; Alo, C.; Addai, M.O.; Fynn, O.F.; Essel, S.K. Numerical analysis of groundwater flow and potential in parts of a crystalline aquifer system in Northern Ghana. Environ. Sci. Tech. 2015, 12, 3805–3818. [Google Scholar] [CrossRef] [Green Version]
  15. Adomako, D.; Maloszewski, P.; Stumpp, C.; Osae, S.; Akiti, T. Estimating groundwater recharge from water isotope (δ2H, δ18O) depth profiles in the Densu River basin, Ghana. Hydrol. Sci. J. 2010, 55, 1405–1416. [Google Scholar] [CrossRef] [Green Version]
  16. Pujiindiyati, E.R.; Sidauruk, P. Study of leachate contamination in bantar gebang landfill to its shallow groundwater using natural isotope tracers of 18O, 2H and 3H. At. Indones. 2015, 41, 31–39. [Google Scholar] [CrossRef] [Green Version]
  17. Chen, F.; Zhou, X.; Lao, Q.; Wang, S.; Jin, G.; Chen, C.; Zhu, Q. Dual isotopic evidence for nitrate sources and active biological transformation in the Northern South China Sea in summer. PLoS ONE 2019, 14, 1–16. [Google Scholar] [CrossRef]
  18. Zimmermann, J.L.; Halloran, J.S.; Hunkeler, D. Tracking chlorinated contaminants in the subsurface using compound-specific chlorine isotope analysis: A review of principles, current challenges and applications. Chemosphere 2020, 244, 125476. [Google Scholar] [CrossRef]
  19. Nigro, A.; Sappa, G.; Barbieri, M. Application of boron and tritium isotopes for tracing landfill contamination in groundwater. Geochem. Explor. 2017, 172, 101–108. [Google Scholar] [CrossRef] [Green Version]
  20. Edmunds, W.M. Contribution of isotopic and nuclear tracers to study of groundwaters. Oxf. Cent. Wat. Res. 2005, 171–172. [Google Scholar] [CrossRef]
  21. Castañeda, S.S.; Sucgang, R.J.; Almoneda, R.V.; Mendoza, N.D.S.; David, C.P.C. Environmental isotopes and major ions for tracing leachate contamination from a municipal landfill in Metro Manila, Philippines. Environ. Radioact. 2012, 110, 30–37. [Google Scholar] [CrossRef] [PubMed]
  22. Ramaroson, V.; Rakotomalala, C.U.; Rajaobelison, J.; Fareze, L.P.; Razafitsalama, F.A.; Rasolofonirina, M. Tritium as tracer of groundwater pollution extension: Case study of Andralanitra landfill site, Antananarivo–Madagascar. Appl. Wat. Sci. 2018, 8, 1–11. [Google Scholar] [CrossRef] [Green Version]
  23. Wimmer, B.; Hrad, M.; Huber-Humer, M.; Watzinger, A.; Wyhlidal, S.; Reichenauer, T.G. Stable isotope signatures for characterising the biological stability of landfilled municipal solid waste. Waste Manag. 2013, 33, 2083–2090. [Google Scholar] [CrossRef] [PubMed]
  24. Mukherjee, S.; Mukhopadhyay, S.; Hashim, M.A.; Sen Gupta, B. Contemporary environmental issues of landfill leachate: Assessment and remedies. Crit. Rev. Environ. Sci. Tech. 2015, 45, 472–590. [Google Scholar] [CrossRef] [Green Version]
  25. Lee, K.S.; Ko, K.S.; Kim, E.Y. Application of stable isotopes and dissolved ions for monitoring landfill leachate contamination. Environ. Geochem. Health 2020, 42, 1387–1399. [Google Scholar] [CrossRef] [PubMed]
  26. Andrei, F.; Barbieri, M.; Sappa, G. Application of 2H and18O isotopes for tracing municipal solid waste landfill contamination of groundwater: Two Italian case histories. Water 2021, 13, 1065. [Google Scholar] [CrossRef]
  27. Fenchel, T.; King, G.M.; Blackburn, T.H. Bacterial Metabolism. Bact. Biogeochem. 2012, 1–34. [Google Scholar] [CrossRef]
  28. Meckenstock, R.U.; Morasch, B.; Griebler, C.; Richnow, H.H. Stable isotope fractionation analysis as a tool to monitor biodegradation in contaminated acquifers. J. Contam. Hydrol. 2004, 75, 215–255. [Google Scholar] [CrossRef]
  29. North, J.C.; Frew, R.D.; Van Hale, R. Can stable isotopes be used to monitor landfill leachate impact on surface waters? J. Geochem. Explor. 2006, 88, 49–53. [Google Scholar] [CrossRef]
  30. Hughes, C.E.; Cendón, D.I.; Harrison, J.J.; Hankin, S.I.; Johansen, M.P.; Payne, T.E.; Vine, M.; Collins, R.N.; Hoffmann, E.L.; Loosz, T. Movement of a tritium plume in shallow groundwater at a legacy low-level radioactive waste disposal site in eastern Australia. J. Environ. Radioact. 2011, 102, 943–952. [Google Scholar] [CrossRef] [PubMed]
  31. Kerfoot, H.B.; Baker, J.A.; Burt, D.M. The use of isotopes to identify landfill gas effects on groundwater. J. Environ. Monit. 2003, 5, 896–901. [Google Scholar] [CrossRef]
  32. Tazioli, A. Landfill investigation using tritium and isotopes as pollution tracers. AQUA Mundi 2011, 18, 83–92. [Google Scholar] [CrossRef]
  33. Robinson, H.D.; Gronow, J.R. Tritium levels in leachates and condensates from domestic wastes in landfill sites. Water Environ. J. 1996, 100, 391–398. [Google Scholar] [CrossRef]
  34. Bandeira, J.V.; Mingote, R.M.; Baptista, M.B.; Oliveira, D.M.; Lima, F.P. The use of tritium content as an indicator of the groundwater contamination by sanitary landfills leachates in the region of Belo Horizonte City, Brazil. Water Sci. Tech. 2008, 57, 1915–1920. [Google Scholar] [CrossRef] [PubMed]
  35. MacFarlane, D.S.; Cherry, J.A.; Gillham, R.W.; Sudicky, E.A. Migration of contaminants in groundwater at a landfill: A case study. 1. Groundwater flow and plume delineation. Hydro 1983, 63, 1–29. [Google Scholar] [CrossRef]
  36. Mutch, R.D.; Mahony, J.D. A study of tritium in municipal solid waste leachate and gas. Fusion Sci. Tech. 2008, 54, 305–310. [Google Scholar] [CrossRef]
  37. Raco, B.; Dotsika, E.; Battaglini, R.; Bulleri, E.; Doveri, M.; Papakostantinou, K. A quick and reliable method to detect and quantify contamination from MSW landfills: A case study. Water Air Soil Poll. 2013, 224, 1–18. [Google Scholar] [CrossRef]
  38. Porowska, D. Determination of the origin of dissolved inorganic carbon in groundwater around a reclaimed landfill in Otwock using stable carbon isotopes. Waste Manag. 2015, 39, 216–225. [Google Scholar] [CrossRef]
  39. Cole, J.J.; Prairie, Y.T. Dissolved CO2 in Freshwater Systems. In Reference Module in Earth Systems and Environmental Sciences; Elsevier Inc.: Amsterdam, The Netherlands, 2014. [Google Scholar] [CrossRef]
  40. Preziosi, E.; Frollini, E.; Zoppini, A.; Ghergo, S.; Melita, M.; Parrone, D.; Rossi, D.; Amalfitano, S. Disentangling natural and anthropogenic impacts on groundwater by hydrogeochemical, isotopic and microbiological data: Hints from a municipal solid waste landfill. Waste Manag. 2019, 84, 245–255. [Google Scholar] [CrossRef]
  41. Kohl, D.H.; Shearer, G.B.; Commoner, B. Fertilizer nitrogen: Contribution to nitrate in surface water in a corn belt watershed. Science 1971, 24, 1331–1334. [Google Scholar] [CrossRef]
  42. Charles, B.; Iii, A.C.; Groat, C.G. Use of Stable Isotopes of Carbon, Nitrogen, and Sulfur to Identify Sources of Nitrogen in Surface Waters in the Lower Susquehanna River Basin, Pennsylvania; US Government Printing Office: Washington, DC, USA, 2005. [Google Scholar]
  43. Curt, M.D.; Aguado, P.; Sánchez, G.; Bigeriego, M.; Fernández, J. Nitrogen isotope ratios of synthetic and organic sources of nitrate water contamination in Spain. Water Air Soil Pollut. 2004, 151, 135–142. [Google Scholar] [CrossRef]
  44. Li, X.; Masuda, H.; Koba, K.; Zeng, H. Nitrogen isotope study on nitrate-contaminated groundwater in the Sichuan Basin, China. Water Air Soil Pollut. 2007, 178, 145–156. [Google Scholar] [CrossRef]
  45. Ren, Y.; Xu, Z.; Zhang, X.; Wang, X.; Sun, X.; Ballantine, D.J.; Wang, S. Nitrogen pollution and source identi fi cation of urban ecosystem surface water in Beijing. Front. Environ. Sci. Eng. 2014, 8, 106–116. [Google Scholar] [CrossRef]
  46. Minet, E.; Coxon, C.E.; Goodhue, R.; Richards, K.G.; Kalin, R.M.; Meier-Augenstein, W. Evaluating the utility of 15N and 18O isotope abundance analyses to identify nitrate sources: A soil zone study. Water Res. 2012, 46, 3723–3736. [Google Scholar] [CrossRef] [PubMed]
  47. Luca, D.A. Evaluation of sources and fate of nitrates in the western Po plain groundwater (Italy) using nitrogen and boron isotopes. Environ. Sci. Pollut. Res. 2017, 26, 2089–2104. [Google Scholar]
  48. Benjamin, S.M.; Nyilitya, P.B. Kisumu City and Kano Plains, Kenya. Water 2020, 12, 1–18. [Google Scholar]
  49. Pastén-Zapata, E.; Ledesma-Ruiz, R.; Harter, T.; Ramírez, A.I.; Mahlknecht, J. Assessment of sources and fate of nitrate in shallow groundwater of an agricultural area by using a multi-tracer approach. Sci. Total Environ. 2014, 470–471, 855–864. [Google Scholar] [CrossRef] [Green Version]
  50. Marchitto, T.M. Nutrient Proxies, 2nd ed.; Elsevier B.V.: Amsterdam, The Netherlands, 2013. [Google Scholar] [CrossRef]
  51. Granger, J.; Sigman, D.M.; Needoba, J.A.; Harrison, P.J. Coupled nitrogen and oxygen isotope fractionation of nitrate during assimilation by cultures of marine phytoplankton. Limnol. Oceanogr. 2004, 49, 1763–1773. [Google Scholar] [CrossRef] [Green Version]
  52. Xiaofeng, C.; Liuyan, Y.; Lin, X.; Aijun, M.; Beidou, X. Nitrogen removal by denitrification during cyanobacterial bloom in Lake Taihu. J. Freshw. Eco. 2012, 27, 243–258. [Google Scholar] [CrossRef]
  53. Jiang, W.; Wang, G.; Sheng, Y.; Zhao, D. Enrichment and Sources of Nitrogen in Groundwater in the Turpan-Hami Area, Northwestern China. Expo. Health 2016, 8, 389–400. [Google Scholar] [CrossRef]
  54. Kendall, C.; Elliot, E.M.; Wankel, S.D. Tracing Anthropogenic Inputs of Nitrogen to Ecosystems, 2nd ed.; Blackwell: Hoboken, NJ, USA, 2007; pp. 375–449. [Google Scholar]
  55. Anornu, G.; Gibrilla, A.; Adomako, D. Tracking nitrate sources in groundwater and associated health risk for rural communities in the White Volta River basin of Ghana using isotopic approach (δ15N, δ18O]NO3 and 3H). Sci. Total Environ. 2017, 603–604, 687–698. [Google Scholar] [CrossRef]
  56. Koba, K.; Tokuchi, N.; Wada, E.; Nakajima, T.; Iwatsubo, G. Intermittent denitrification: The application of a 15N natural abundance method to a forested ecosystem. Geochim. Cosmochim. Acta 1997, 61, 5043–5050. [Google Scholar] [CrossRef]
  57. Marchant, H.K.; Ahmerkamp, S.; Lavik, G.; Tegetmeyer, H.E.; Graf, J.; Klatt, J.M.; Holtappels, M.; Walpersdorf, E.; Kuypers, M.M.M. Denitrifying community in coastal sediments performs aerobic and anaerobic respiration simultaneously. ISME J. 2017, 11, 1799–1812. [Google Scholar] [CrossRef] [PubMed] [Green Version]
  58. Sharma, S.K.; Sanghi, R. Wastewater Reuse and Management; Springer: Dordrecht, The Netherlands, 2013. [Google Scholar] [CrossRef]
  59. Piatek, K.B.; Mitchell, M.J.; Silva, S.R.; Kendall, C. Sources of nitrate in snowmelt discharge: Evidence from water chemistry and stable isotopes of nitrate. Water Air Soil Pollut. 2005, 165, 13–35. [Google Scholar] [CrossRef]
  60. Casciotti, K.L.; Sigman, D.M.; Ward, B.B. Linking diversity and stable isotope fractionation in ammonia-oxidizing bacteria. Geomicrobiol. J. 2003, 20, 335–353. [Google Scholar] [CrossRef]
  61. Kendall, C.; Aravena, R. Nitrate Isotopes in Groundwater Systems. Environ. Tracers Subsurf. Hydro. 2000, 261–297. [Google Scholar] [CrossRef]
  62. Veale, N.; Visser, A.; Esser, B.; Singleton, M.J.; Moran, J.E. Nitrogen cycle dynamics revealed through δ 18 O-NO3−Analysis in California Groundwater. Geosciences 2019, 9, 95. [Google Scholar] [CrossRef] [Green Version]
  63. Mader, M.; Roberts, A.M.; Porst, D.; Schmidt, C.; Trauth, N.; van-Geldern, R.; Barth, J.A.C. River recharge versus O2 supply from the unsaturated zone in shallow riparian groundwater: A case study from the Selke River (Germany). Sci. Total Environ. 2018, 634, 374–381. [Google Scholar] [CrossRef]
  64. Kendall, C. Tracing Nitrogen Sources and Cycling in Catchments. Elsevier B.V.: Amsterdam, The Netherlands, 1998. [Google Scholar] [CrossRef]
  65. Mayer, B.; Bollwerk, S.M.; Mansfeldt, T.; Hütter, B.; Veizer, J. The oxygen isotope composition of nitrate generated by nitrification in acid forest floors. Geochim. Cosmochim. Acta 2001, 65, 2743–2756. [Google Scholar] [CrossRef]
  66. Shi, J.; Ohte, N.; Tokuchi, N.; Imamura, N.; Nagayama, M.; Oda, T.; Suzuki, M. Nitrate isotopic composition reveals nitrogen deposition and transformation dynamics along the canopy-soil continuum of a suburban forest in Japan. Rapid Commun. Mass Spectro 2014, 28, 2539–2549. [Google Scholar] [CrossRef]
  67. Ogrinc, N.; Tamše, S.; Zavadlav, S.; Vrzel, J.; Jin, L. Evaluation of geochemical processes and nitrate pollution sources at the Ljubljansko polje aquifer (Slovenia): A stable isotope perspective. Sci. Total Environ. 2019, 646, 1588–1600. [Google Scholar] [CrossRef]
  68. Widory, D.; Petelet-Giraud, E.; Négrel, P.; Ladouche, B. Tracking the sources of nitrate in groundwater using coupled nitrogen and boron isotopes: A synthesis. Environ. Sci. Tech. 2005, 39, 539–548. [Google Scholar] [CrossRef] [PubMed]
  69. Bronders, J.; Tirez, K.; Desmet, N.; Widory, D.; Petelet-Giraud, E.; Bregnot, A.; Boeckx, P. Use of Compound-Specific Nitrogen (d 15N), Oxygen (d 18O), and Bulk Boron (d 11B) Isotope Ratios to Identify Sources of Nitrate-Contaminated Waters: A Guideline to Identify Polluters. Environ. Forensics 2012, 13, 32–38. [Google Scholar] [CrossRef]
  70. Saccon, P.; Leis, A.; Marca, A.; Kaiser, J.; Campisi, L.; Böttcher, M.E.; Savarino, J.; Escher, P.; Eisenhauer, A.; Erbland, J. Multi-isotope approach for the identification and characterisation of nitrate pollution sources in the Marano lagoon (Italy) and parts of its catchment area. Appl. Geochem. 2013, 34, 75–89. [Google Scholar] [CrossRef] [Green Version]
  71. Vengosh, A.; Kolodny, Y.; Spivack, A.J. Groundwater Pollution Determined by Boron Isotope Systematics; International Atomic Energy Agency: Vienna, Austria, 1998; pp. 17–37. [Google Scholar]
  72. Reed, E.M.; Duranceau, S.J. Chemical and isotopic composition of nitrogen and boron in septic tank wastewater samples. Environ. Earth Sci. 2016, 75, 1–7. [Google Scholar] [CrossRef]
  73. Bassett, R.L. A critical evaluation of the available measurements for the stable isotopes of boron. Appl. Geochem. 1990, 5, 541–554. [Google Scholar] [CrossRef]
  74. Komor, S.C. Boron Contents and Isotopic Compositions of Hog Manure, Selected Fertilizers, and Water in Minnesota. J. Environ. Qual. 1997, 26, 1212–1222. [Google Scholar] [CrossRef]
  75. Tirez, K.; Brusten, W.; Widory, D.; Petelet, E.; Bregnot, A.; Xue, D.; Boeckx, P.; Bronders, J. Boron isotope ratio (δ11B) measurements in Water Framework Directive monitoring programs: Comparison between double focusing sector field ICP and thermal ionization mass spectrometry. J. Anal. At. Spectrom. 2010, 25, 964–974. [Google Scholar] [CrossRef] [Green Version]
  76. Barth, S. Application of boron isotopes for tracing sources of anthropogenic contamination in groundwater. Water Res. 1998, 32, 685–690. [Google Scholar] [CrossRef]
  77. Puig, R.; Soler, A.; Widory, D.; Mas-Pla, J.; Domènech, C.; Otero, N. Characterizing sources and natural attenuation of nitrate contamination in the Baix Ter aquifer system (NE Spain) using a multi-isotope approach. Sci. Total Environ. 2017, 580, 518–532. [Google Scholar] [CrossRef]
  78. Fernandes, P.; Carvalho, M.R.; Silva, M.C.; Rebelo, A.; Zeferino, J. Application of nitrogen and boron isotopes for tracing sources of anthropogenic contamination in Monforte-Alter do Chão aquifer system, Portugal. Sustain. Water Resour. Manag. 2019, 5, 249–266. [Google Scholar] [CrossRef]
  79. Wahl, E.H.; Fidric, B.; Rella, C.W.; Koulikov, S.; Kharlamov, B.; Tan, S.; Kachanov, A.A.; Richman, B.A.; Crosson, E.R.; Paldus, B.A.; et al. Applications of cavity ring-down spectroscopy to high precision isotope ratio measurement of 13C/12C in carbon dioxide. Isot. Environ. Health Stud. 2006, 42, 21–35. [Google Scholar] [CrossRef] [PubMed]
  80. Pierchala, A.; Rozanski, K.; Dulinski, M.; Gorczyca, Z.; Marzec, M.; Czub, R. High-precision measurements of δ 2H, δ 18O and δ 17O in water with the aid of cavity ring-down laser spectroscopy. Isot. Environ. Health Stud. 2019, 55, 290–307. [Google Scholar] [CrossRef]
  81. Balslev-Clausen, D.; Dahl, T.W.; Saadd, N.; Rosinga, M.T. Precise and accurate d13C analysis of rock samples using Flash Combustion–Cavity Ring Down Laser Spectroscopy. J. Anal. At. Spectrom. 2013, 28, 413–614. [Google Scholar] [CrossRef]
  82. Wang, C. Plasma-cavity ringdown spectroscopy (P-CRDS) for elemental and isotopic measurements. J. Anal. At. Spectrom. 2007, 22, 1337–1436. [Google Scholar] [CrossRef]
  83. Chen, T.; Ober, D.C.; Miri, R.; Bui, T.Q.; Shen, L.; Okumura, M. Optically switched dual-wavelength cavity ring-down spectrometer for high-precision isotope ratio measurements of methane δd in the near infrared. Anal. Chem. 2021, 93, 6375–6384. [Google Scholar] [CrossRef] [PubMed]
  84. Jung, H.; Koh, D.; Kim, Y.S.; Jeen, S.; Lee, J. Stable isotopes of water and nitrate for the identification of groundwater flowpaths: A Review. Water 2020, 12, 138. [Google Scholar] [CrossRef] [Green Version]
  85. Sigman, D.M.; Casciotti, K.L.; Andreani, M.; Barford, C.; Galanter, M.; Bo, J.K.; Supe, Ä.N. A Bacterial Method for the Nitrogen Isotopic Analysis of Nitrate in Seawater and Freshwater. Anal. Chem. 2001, 73, 4145–4153. [Google Scholar] [CrossRef]
  86. Dotsika, E.; Poutoukis, D.; Kloppmann, W.; Guerrot, C.; Voutsa, D.; Kouimtzis, T.H. The use of O, H, B, Sr and S isotopes for tracing the origin of dissolved boron in groundwater in Central Macedonia, Greece. Appl. Geochem. 2010, 25, 1783–1796. [Google Scholar] [CrossRef]
Figure 1. (a). Deuterium and oxygen 18 deviation from rainy to dry season [21]. (b). Tritium trends from 2003 to 2008 of groundwater within the Rodriguez municipality, immediately downstream of the landfills [21].
Water 14 00035 g001
Figure 2. Biochemical cycles of nitrogen [42].
Water 14 00035 g002
Figure 3. Typical values of δ15N and δ18O of nitrate derived from various N sources [54].
Water 14 00035 g003
Figure 4. Typical δ11B versus δ15N- NO 3 values derived from various nitrates from pollution sources.
Water 14 00035 g004
Table 1. Environment isotopes used for various groundwater studies.
Element
Symbol
IsotopeRatio%Natural AbundanceApplication References
Hδ ²H²H/¹H0.015Origin of water[15]
H³H 10 18 Dumpsite leachate [16]
Nδ ¹⁵N¹⁵N/¹⁴N0.366Source of pollution[17]
Clδ ³⁷Cl³⁷Cl/³⁵Cl24.23Origin and transformation of chlorinated compounds[18]
Bδ ¹¹B¹¹B/¹ºB80.1Anthropogenic and geogenic pollution source[19]
Oδ ¹⁸O¹⁸O/¹⁶O0.204Origin of water[15]
Cδ ¹³C¹³C/¹²C1.11Carbonate source
Sδ ³⁴S³⁴S/³²S4.21Potential sources of sulphate from landfill and acid mine drainage[7]
Table 2. Isotope data of leachate and monitoring well.
Sample
Code
Sample Typeδ²H (‰)
Dry
Rainy
δ¹⁸O (‰)
Dry
Rainy
³H (TU)Reference
BG-LAOutlet and inlet leachate −3.6 to +10.3
−21.87 to +7.86
−0.42 to 0.67
−5.93 to −5.43
50.9 to 493.9[16]
BG-MAMonitoring well down-gradient of Plant A−37.9 to −30.6
−37.42 to −29.80
−6.26 to −5.81
−6.02 to −5.96
14.9 to 76.7
Table 3. Isotope data of hand-dug wells.
Sample CodeSample Typeδ²H
(‰)
δ¹⁸O
(‰)
³H
(TU)
Reference
Group 1Hand-dug well down-gradient of the landfill −42.80 to −40.77−6.81 to −6.6310.4 to 22.8[22]
Group 2Hand-dug well upstream and 700 m downstream from landfills−46.63 to −39.12−7.51 to −5.910.84–1.46
Table 4. Isotope data of hand-dug wells, stream, and leachate samples.
Sample
Code
Sample
Type
Comment
δ²H
(‰)
δ¹⁸O
(‰)
δ¹³C
(‰)
Reference
L1-6LeachateLeachate of landfill sites−38 to −24−7.5 to −7.3+16.5 to +21.2[25]
GR1WellUp-gradient to landfill−38.3 to −35.5−5.93 to −5.46−14.2 to −12.2[37]
GW 6WellJust down-gradient to GW9 and adjacent to SW1−42−7.0+8.9[25]
GR10StreamFar down-gradient to AKL−6.3+0.71+8.97[37]
GW8WellJust down-gradient of Leachate−35−6.9+11.6[25]
GR9WellJust down-gradient to CKL−37.0−6.17−3.3[37]
Table 5. Quick guide to pollution source identification.
StagesParametersMethodologyCharacteristics RangesReferences
Step 1: The first step to identify the source (s) of water pollution near a landfill site is to determine the percolation of leachate using a stable isotope approach. However, isotopic samples should be collected alongside ongoing chemical analysis to reduce costs.δ¹⁸O,
δ²H
δ13C
CO 2 H 2 O   Equilibration. The method involves equilibrating 5 mL of the samples with CO 2 gas for 24 h. at 25 ± 0.1 °C. Cr at 850 °C is utilized for the reduction of H 2 O ( l ) to produce H 2 ( g ) . Both the δ 18 O   and   δ ² H contents are determined using a Liquid Water Isotope Analyzer. Evacuated glass septum vials, pre-filled with phosphoric acid (85%) and a magnetic stirrer are used to collect water samples for δ 13 C   analyses. The sealed vacuum sample is acidified, and cryogenic traps are used to purify the produced CO 2 . Isotope-ratio mass spectrometry (IRMS) is used to measure the isotopic ratio of δ13CDIC
Disadvantages of IRMS technique
Sampling of soil using IRMS is time-consuming as IRMS is not operated in the field [79]. The IRMS technique requires pretreatment (liquid conversion to gaseous samples), and is not applicable for field measurement; this limits the number of samples that can be analyzed in a given period [80].
Alternative method to measure δ¹⁸O, δ²H & δ13C
Cavity Ring-down Spectroscopy (CRDS) (laser absorption technique) is the current alternative measurement to Isotope-ratio mass spectrometry. The principle of CRDS involves the measurement of the rate of decay (ring-down time) of a laser beam’s intensity [80]. Comparable to IRMS, its potability, simple operation, relatively cheap labor and equipment cost (<$50 K) and applicability at remote sites make CRDS technology useful for developing countries [79]. CRDS has a comparable precision to IRMS [81]. CRDS can be used for elemental and isotopic measurements such as C, O, N, and H in organic or inorganic samples [82,83]. The presence of dissolved organic molecules has the disadvantage of degrading the analytical performance of CRDS due to spectral interferences [84].
Leachate waterUncontaminated water[25]
δ¹⁸O −4.5 to 3.7‰δ¹⁸O −4.1 to −4.4‰
δ²H −22 to +60‰δ²H −23 to −25.5‰
(δ²H is enriched due to methanogenesis)
Note: Unlike δ²H, δ¹⁸O is unaffected by methanogenesis
Calcite dissolutionLeachate
δ13C −14 to +1.1‰δ13C +16 to +21.2‰
Leachate polluted Groundwater
δ13C +5 to +38‰
Step   2 :   The   NO 3 data are vital to define the status of groundwater and surface water. If the NO 3 concentration is higher than the WHO limit (50 mg/L), it is necessary to identify its source(s) for further prevention measures.δ¹⁵N and δ¹⁸OBacteria denitrification
NO 3       N 2 O
extraction: online (auto sampler); measurement: IRMS
PrecipitationSoil Nitrogen[53,54,61,62,65,85]
δ¹⁵N −0.6 to 31‰δ¹⁵N +3 to +8‰
δ¹⁸ +30 to 70‰δ¹⁸O −8 to +12‰
NH 4 + in Fertilizer Synthetic   NO 3   Fertilizer
δ¹⁵N −8 to +7‰δ¹⁵N −5 to +8‰
δ¹⁸O −8 to +12‰δ¹⁸O +17 to +25‰
Manure, sewage & septic waste
δ¹⁵N +5 to +25‰δ¹⁸O −8 to +12‰
Step 3: Following potential scenarios where multiple nitrate sources could be involved, δ¹¹B should be used to further identify the specific nitrate source (s).δ¹¹BThe boron isotope composition can be determined by using Thermal Ionization Mass-Spectrometry (TIMS). The amberlite IRA-743 boron selective resin method can be employed to isolate the boron.Uncontaminated Groundwater[86]
δ¹¹B +23.8 to +38.5‰
B 0.015 to 0.15 mg/L
SeawaterSynthetic fertilizer
δ¹¹B +33 to +70‰δ¹¹B −6 to +5‰
B 0.07 to 13.9mg/LB 0.05 to 0.41 mg/L
Hog ManureCattle Manure
δ¹¹B +7.2 to +42.5‰δ¹¹B +22.3 to +24‰
B 1.43 to 8.12 mg/LB 0.05 to 0.41mg/L
Sewage, landfill and septic leachates
δ¹¹B +5 to +25‰ B 0.13 to 4.1mg/L
Step 4: Since all the above techniques cannot be used to differentiate between septic and landfill leachates, 3H isotope could be used to isolate dumpsite leachate. TritiumElectrolytic enrichment method. The tritium concentration is then measured via b-particle counting emission using a liquid scintillation counter. Leachate
(50.9 to 159,316 TU)
[16,21,22,30]
Groundwater polluted by leachate
(2.3 to 76.6 TU)
Unpolluted water Precipitation
(0.04 to 10 TU) (<10 TU)
Publisher’s Note: MDPI stays neutral with regard to jurisdictional claims in published maps and institutional affiliations.

