
Contamination Levels of Potentially Toxic Elements and Foraminiferal Distribution Patterns in Lagos Lagoon: A Correlation Analysis

 , , and
Abstract
:1. Introduction
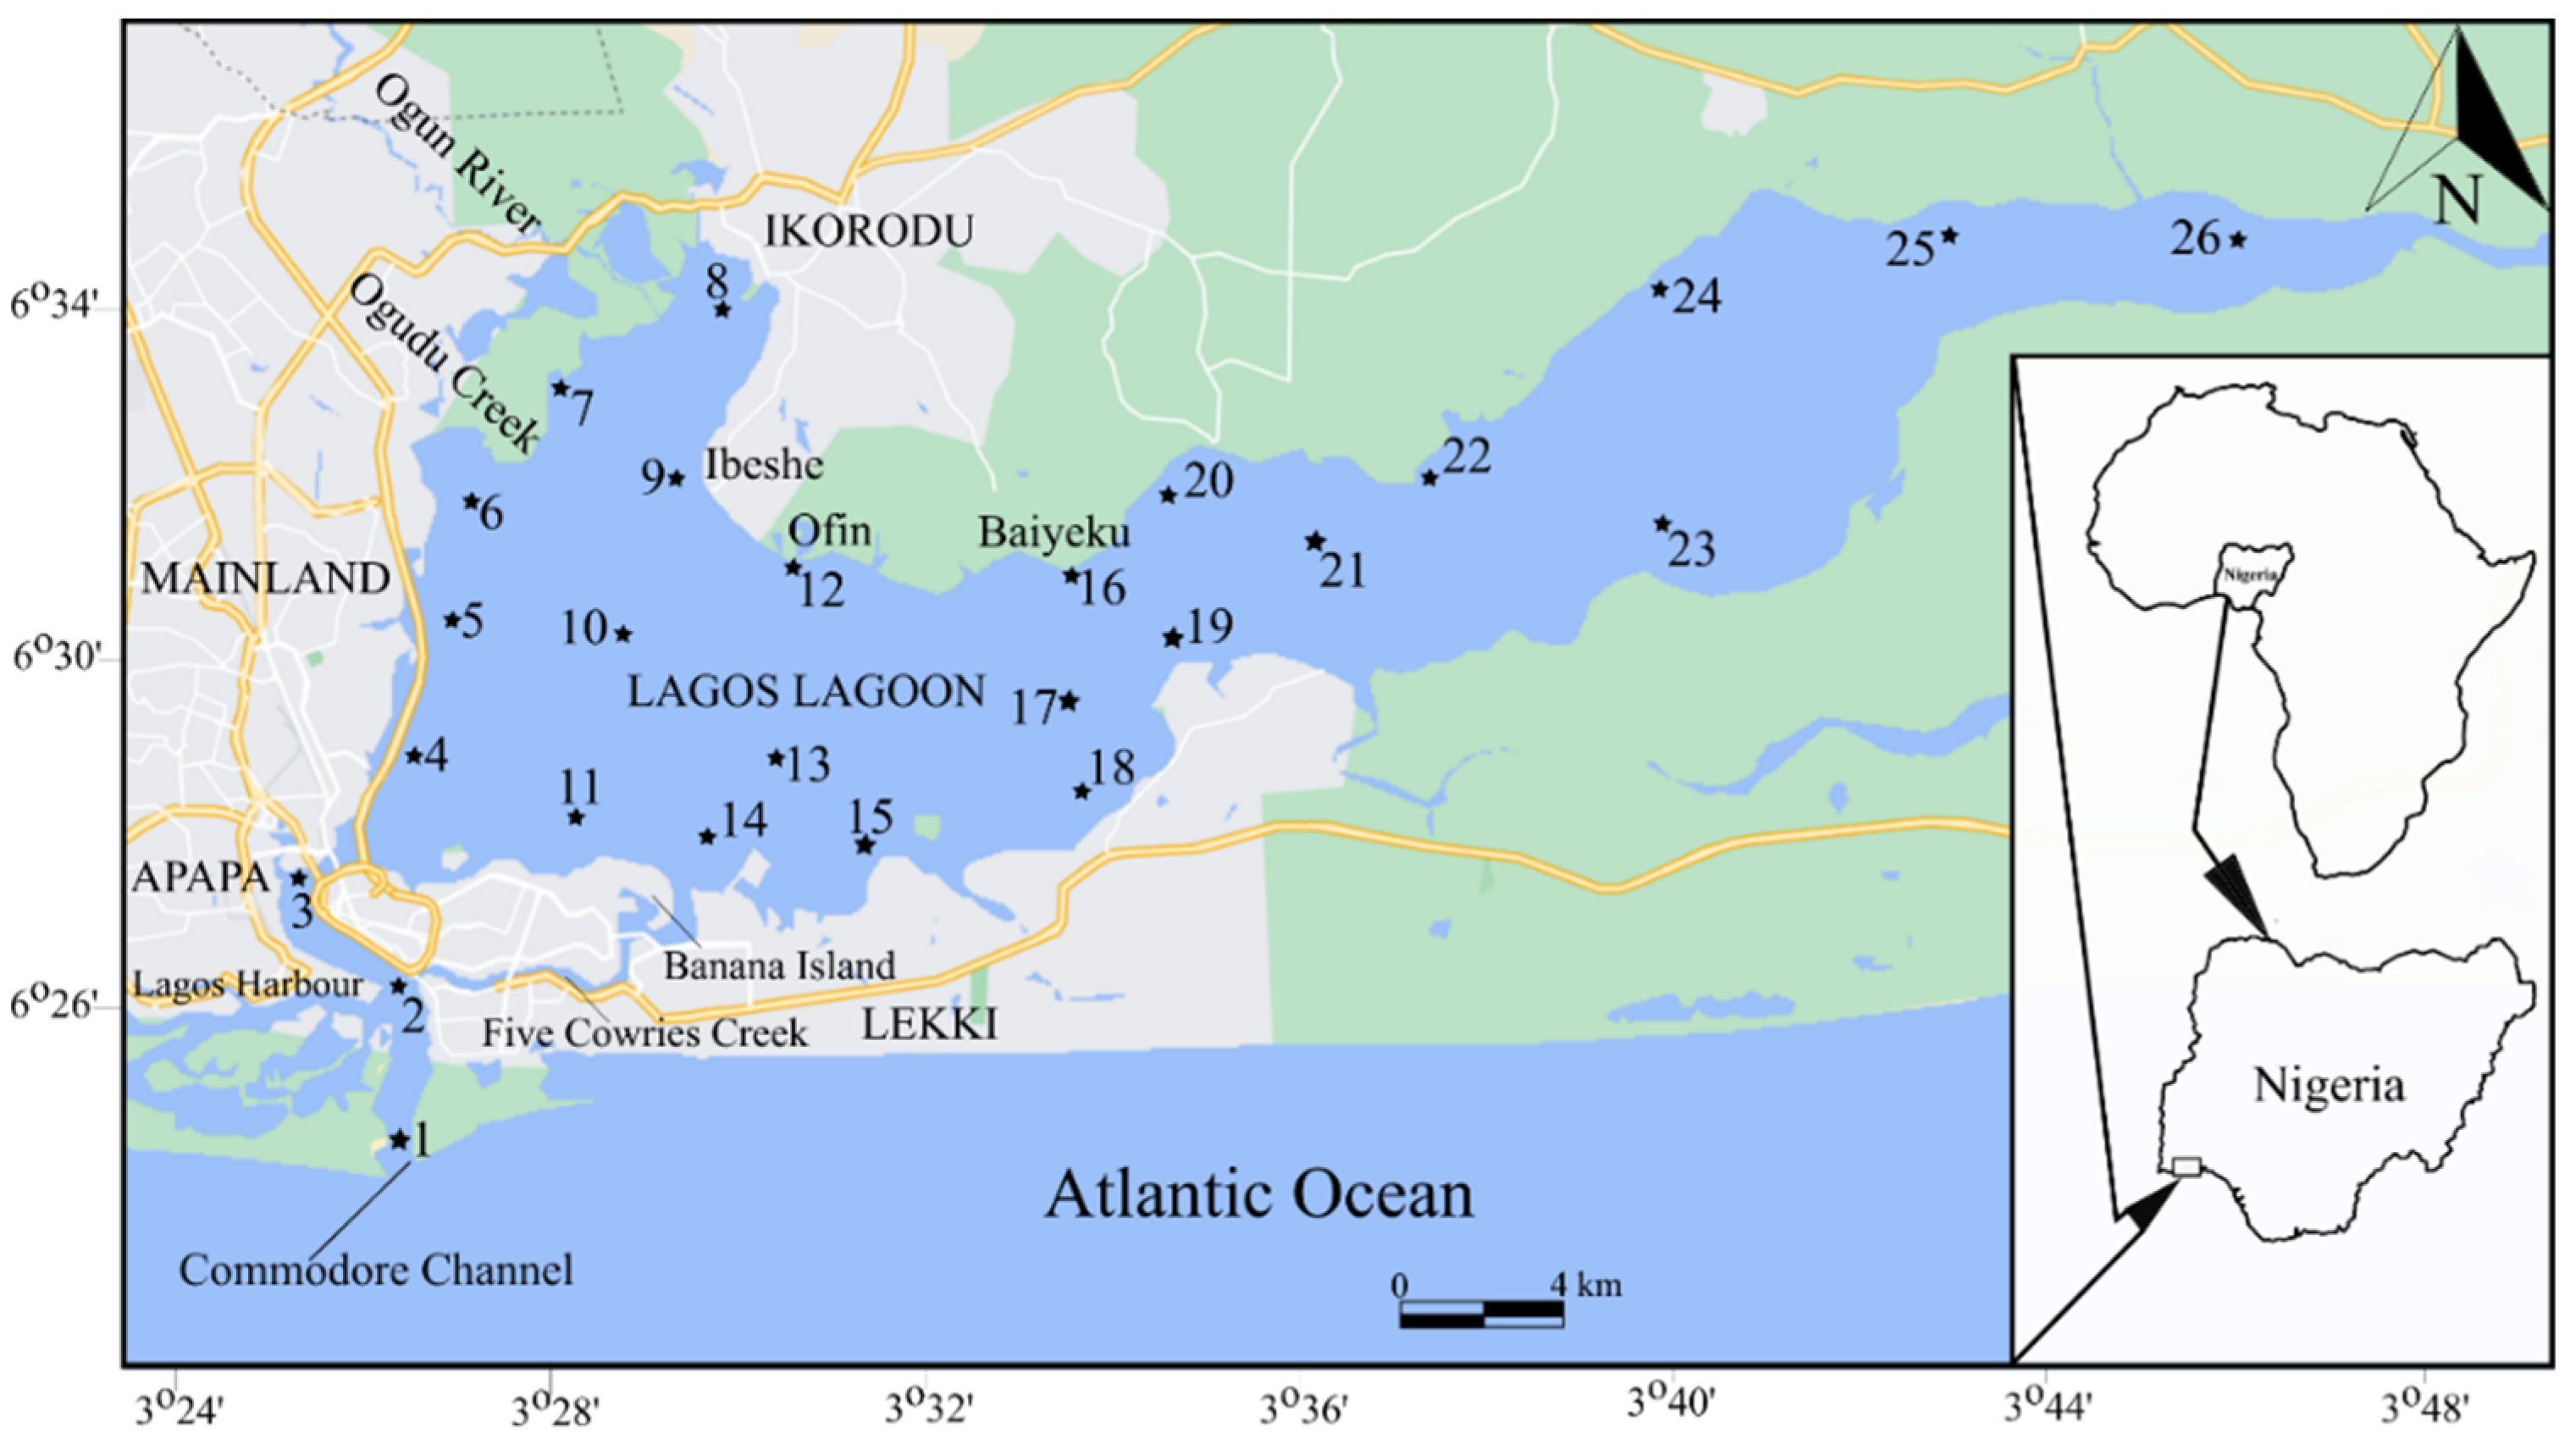
2. Study Area
3. Methods
3.1. Processing of Sediment Samples
3.2. Evaluation of Sediment Contamination
3.3. Multivariate Analyses
4. Results
4.1. Lagos Lagoon Water Characteristics
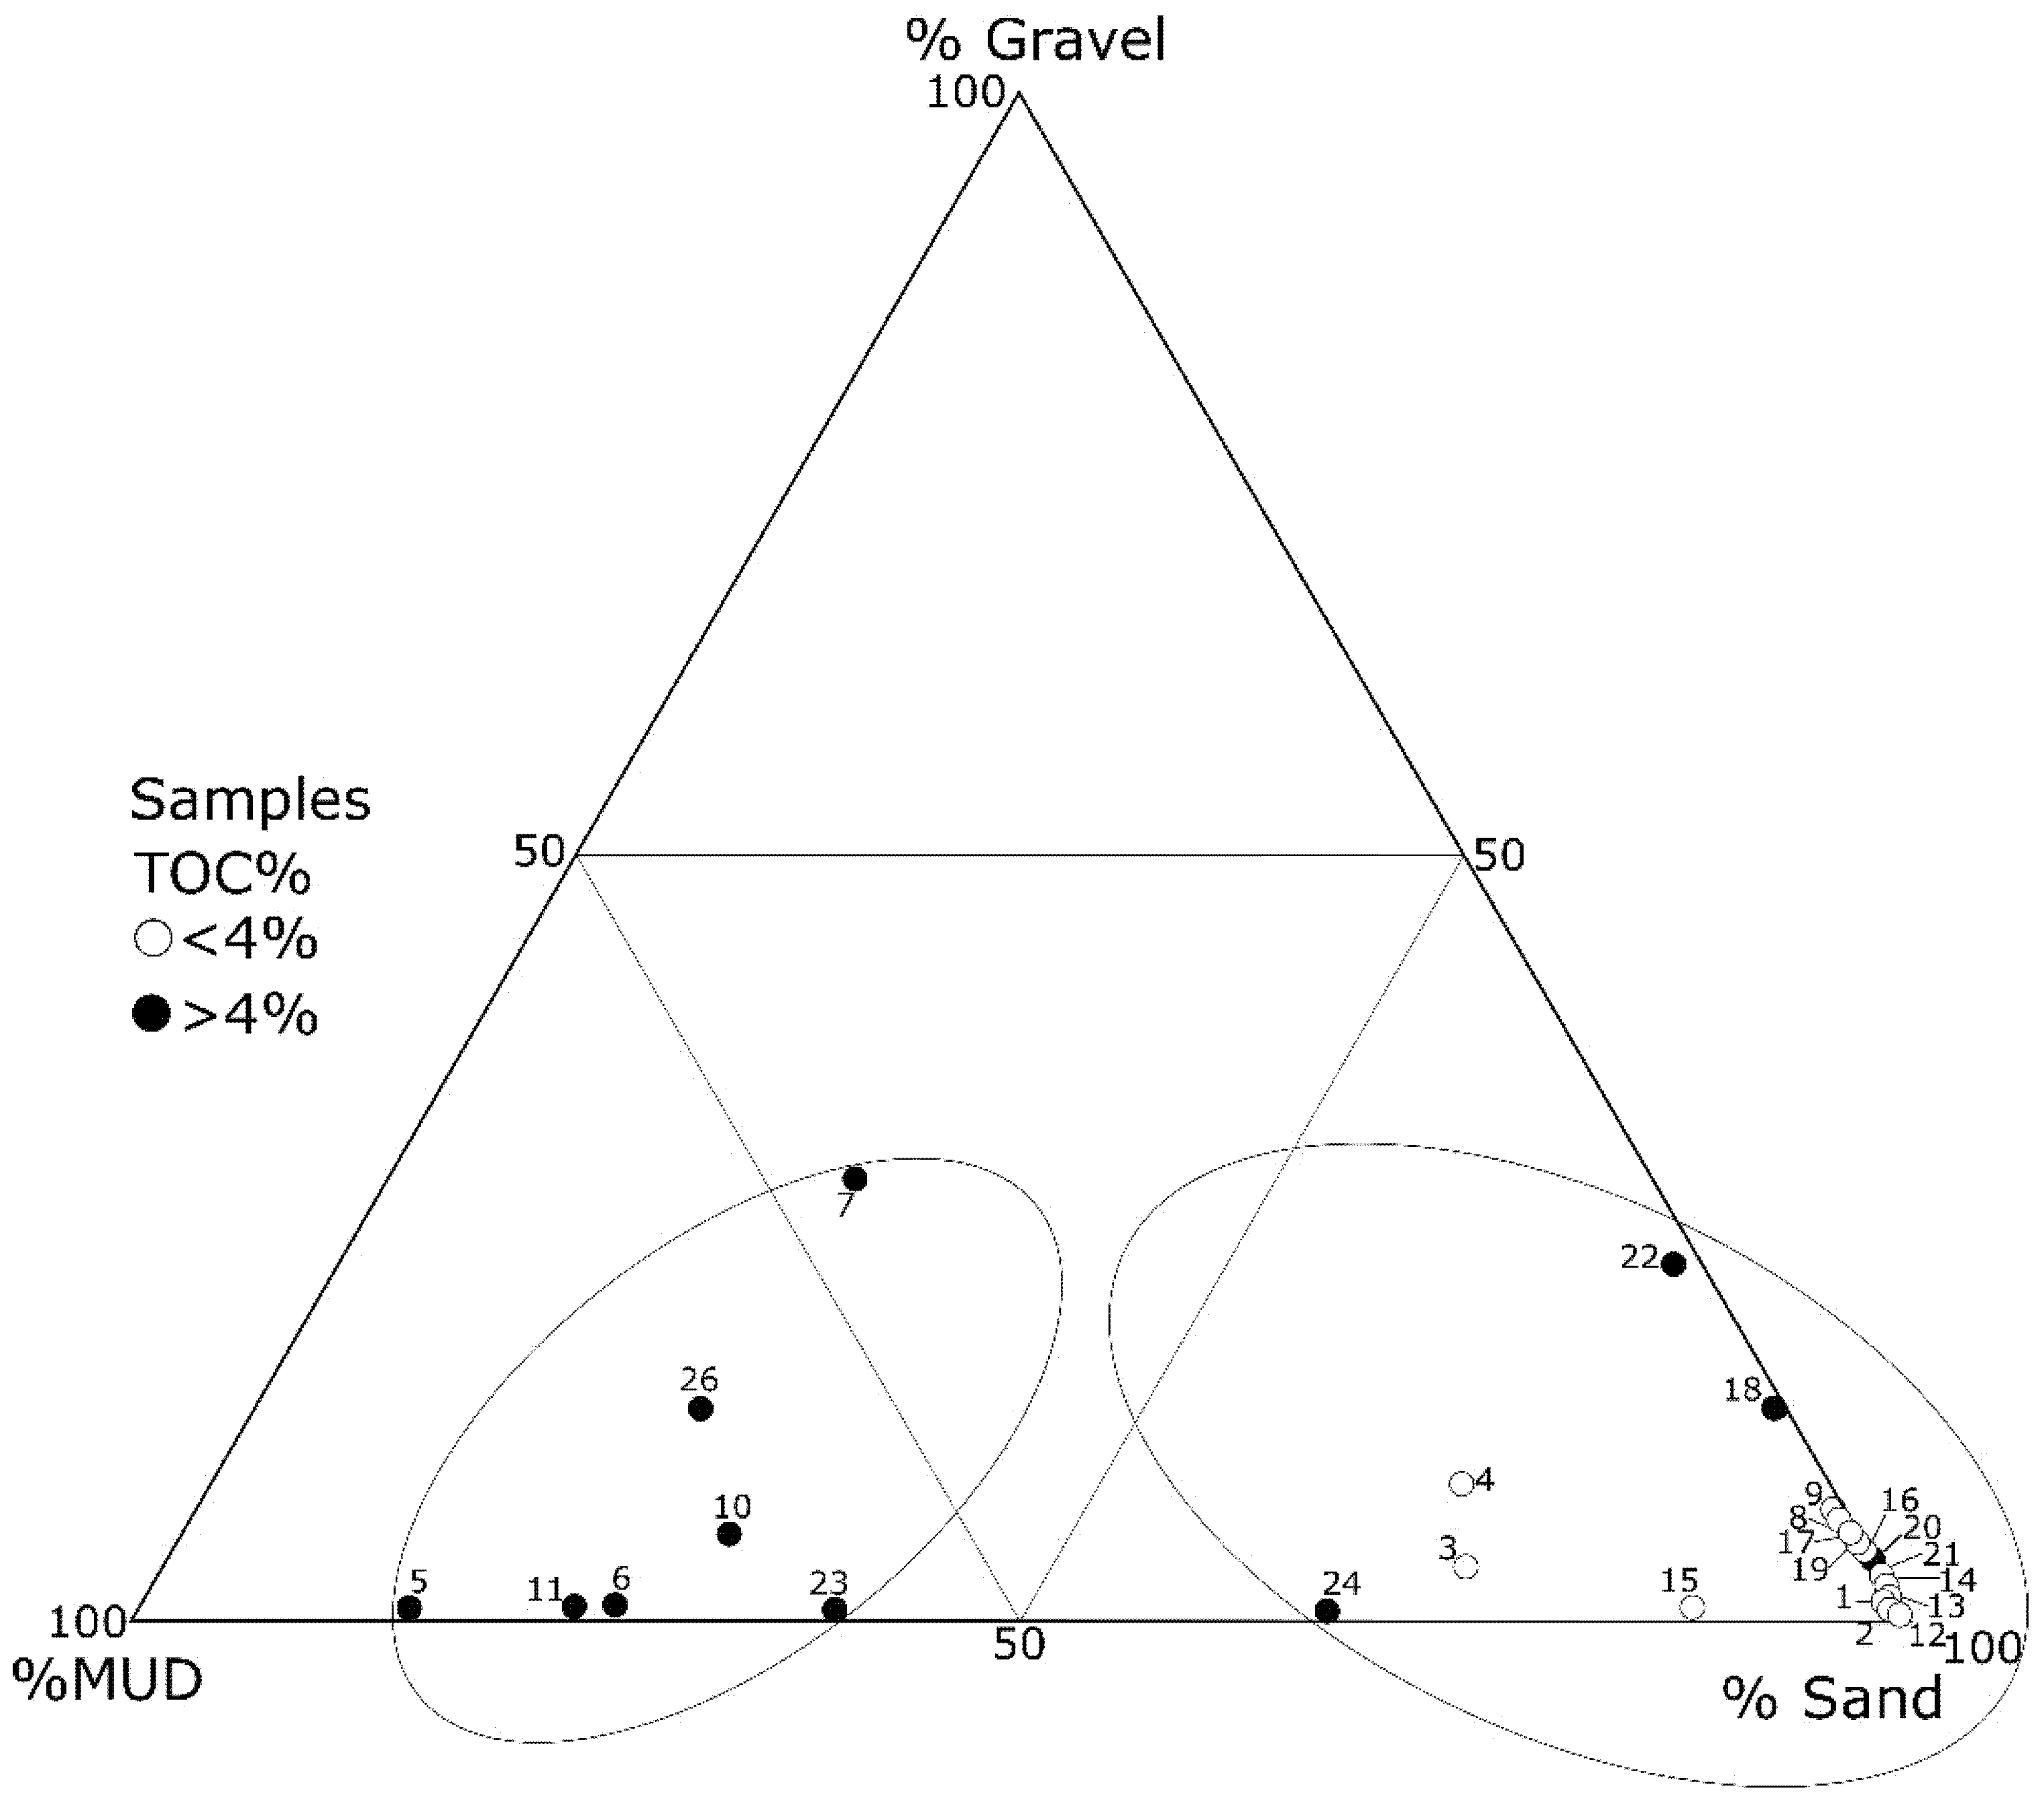
4.2. Sediment Texture and Characteristics
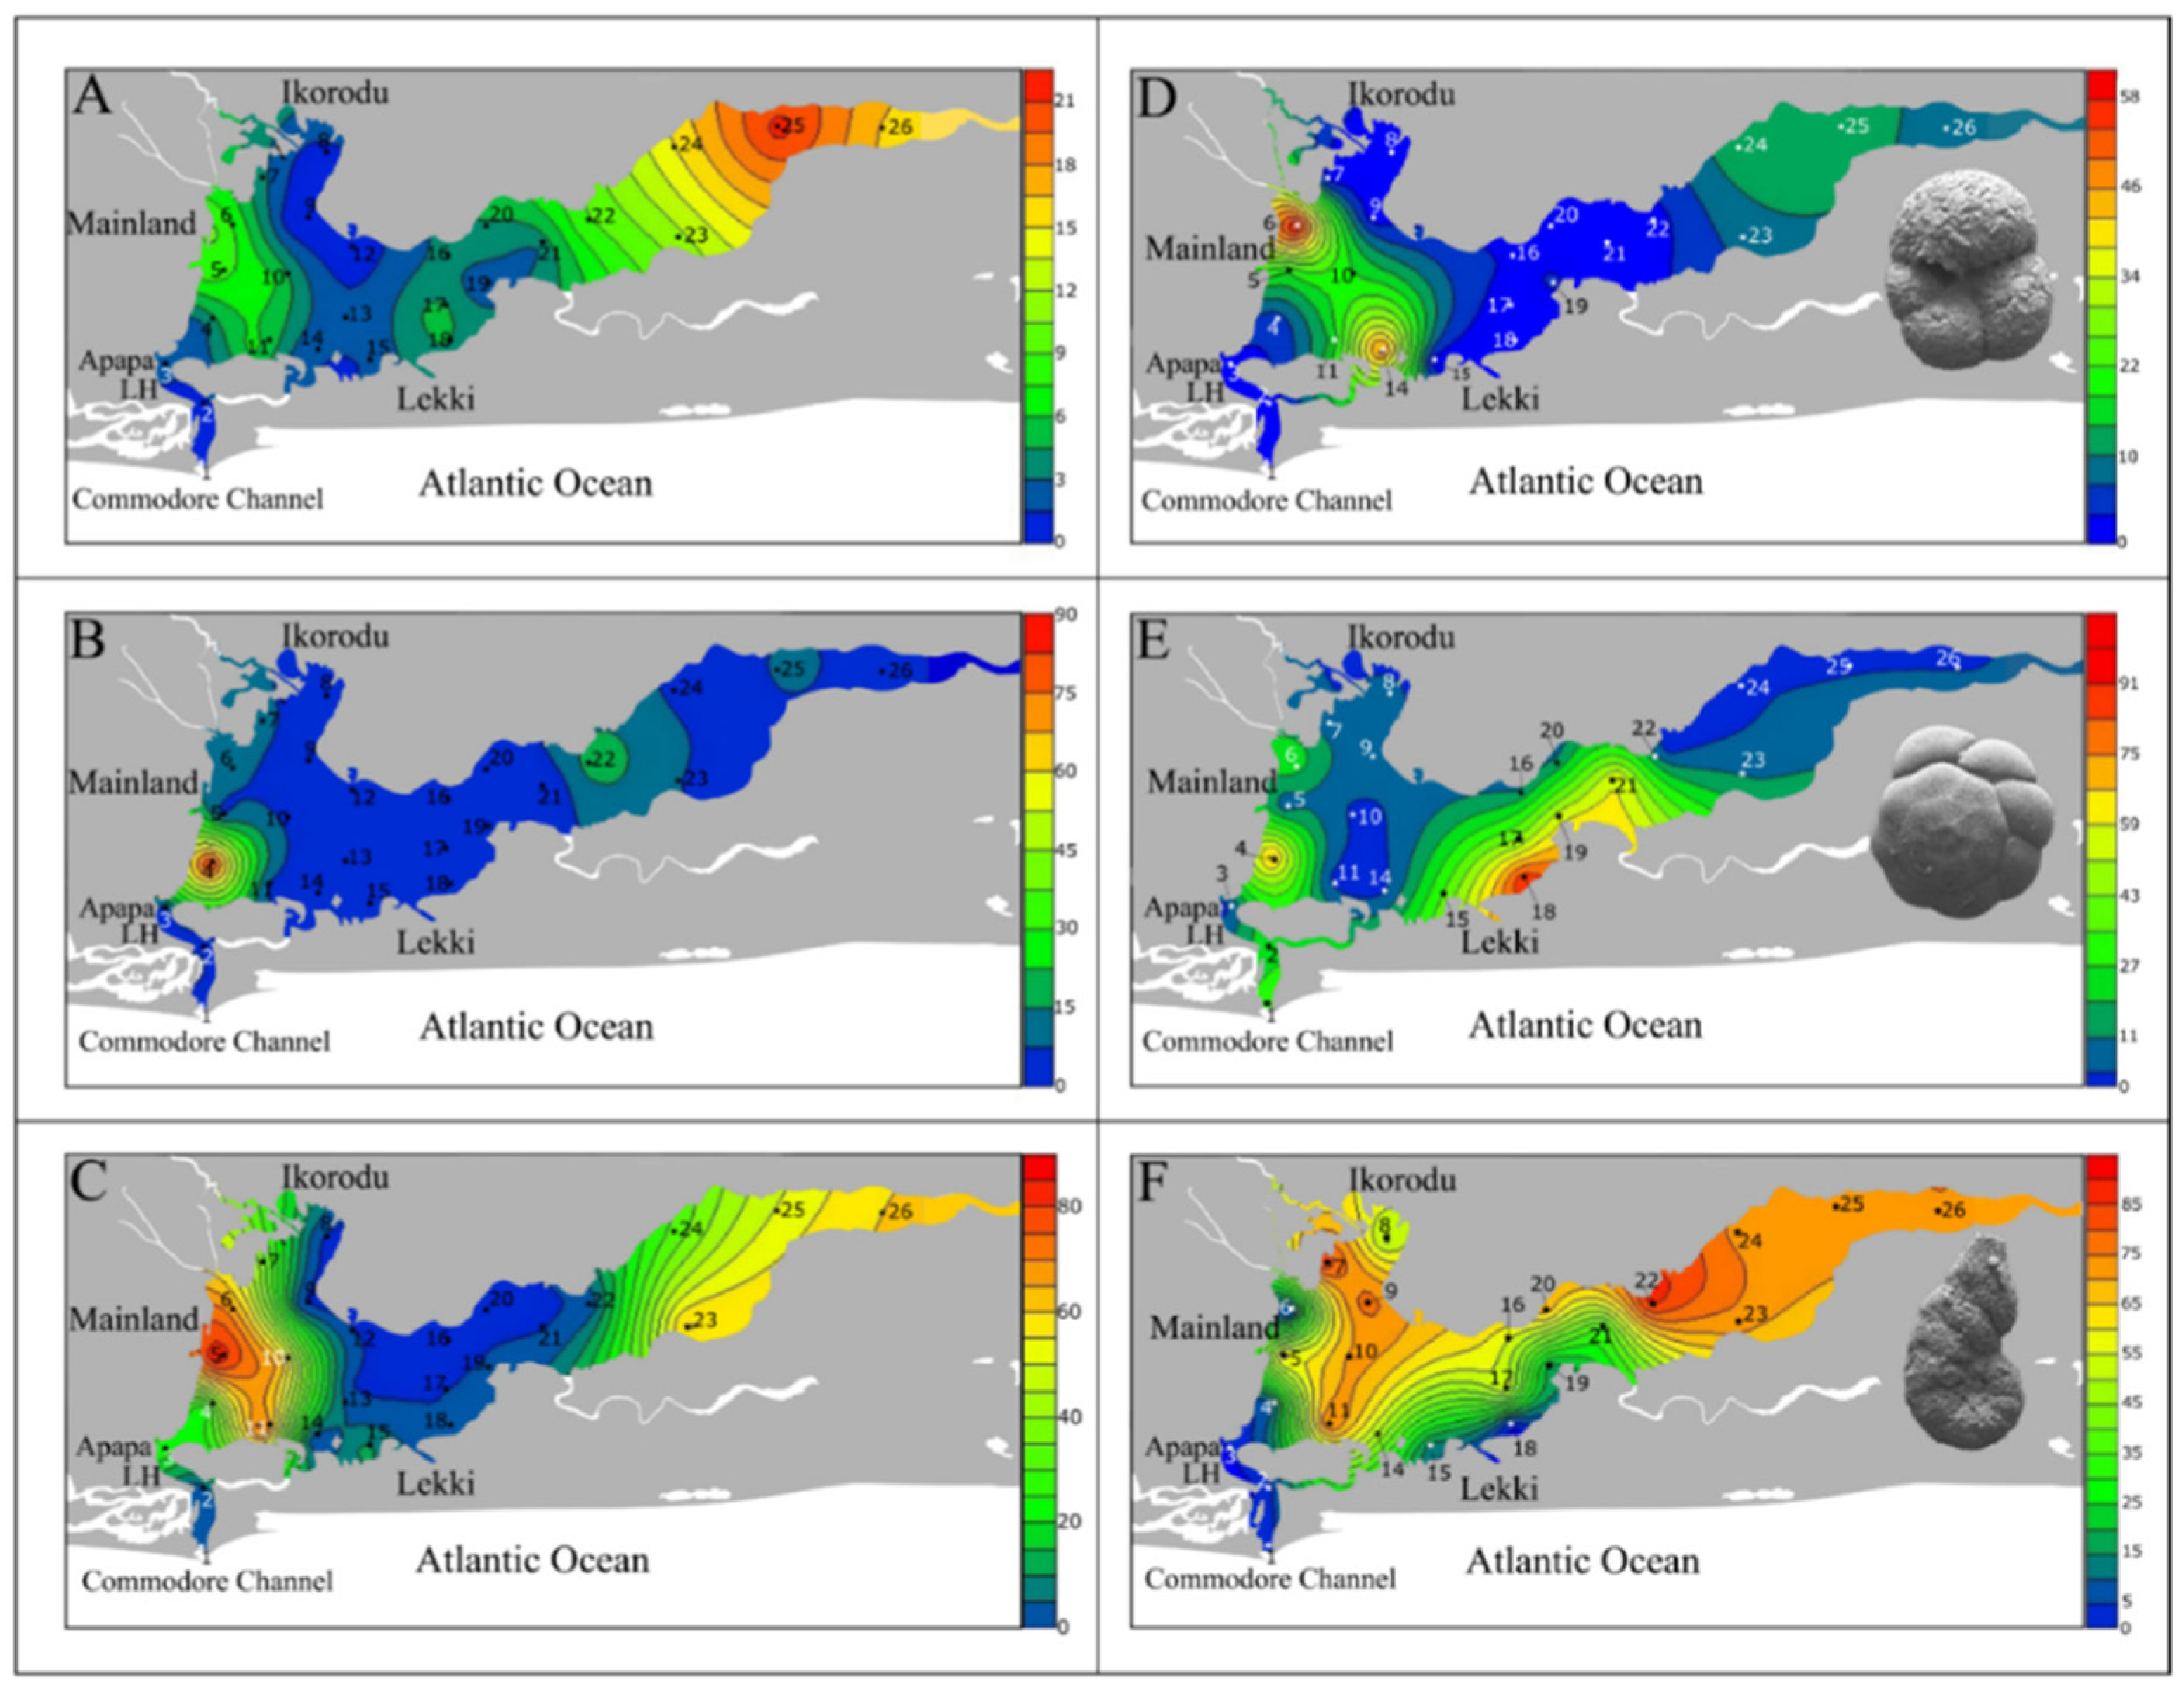
4.3. Spatial Distribution of Foraminiferal Assemblages
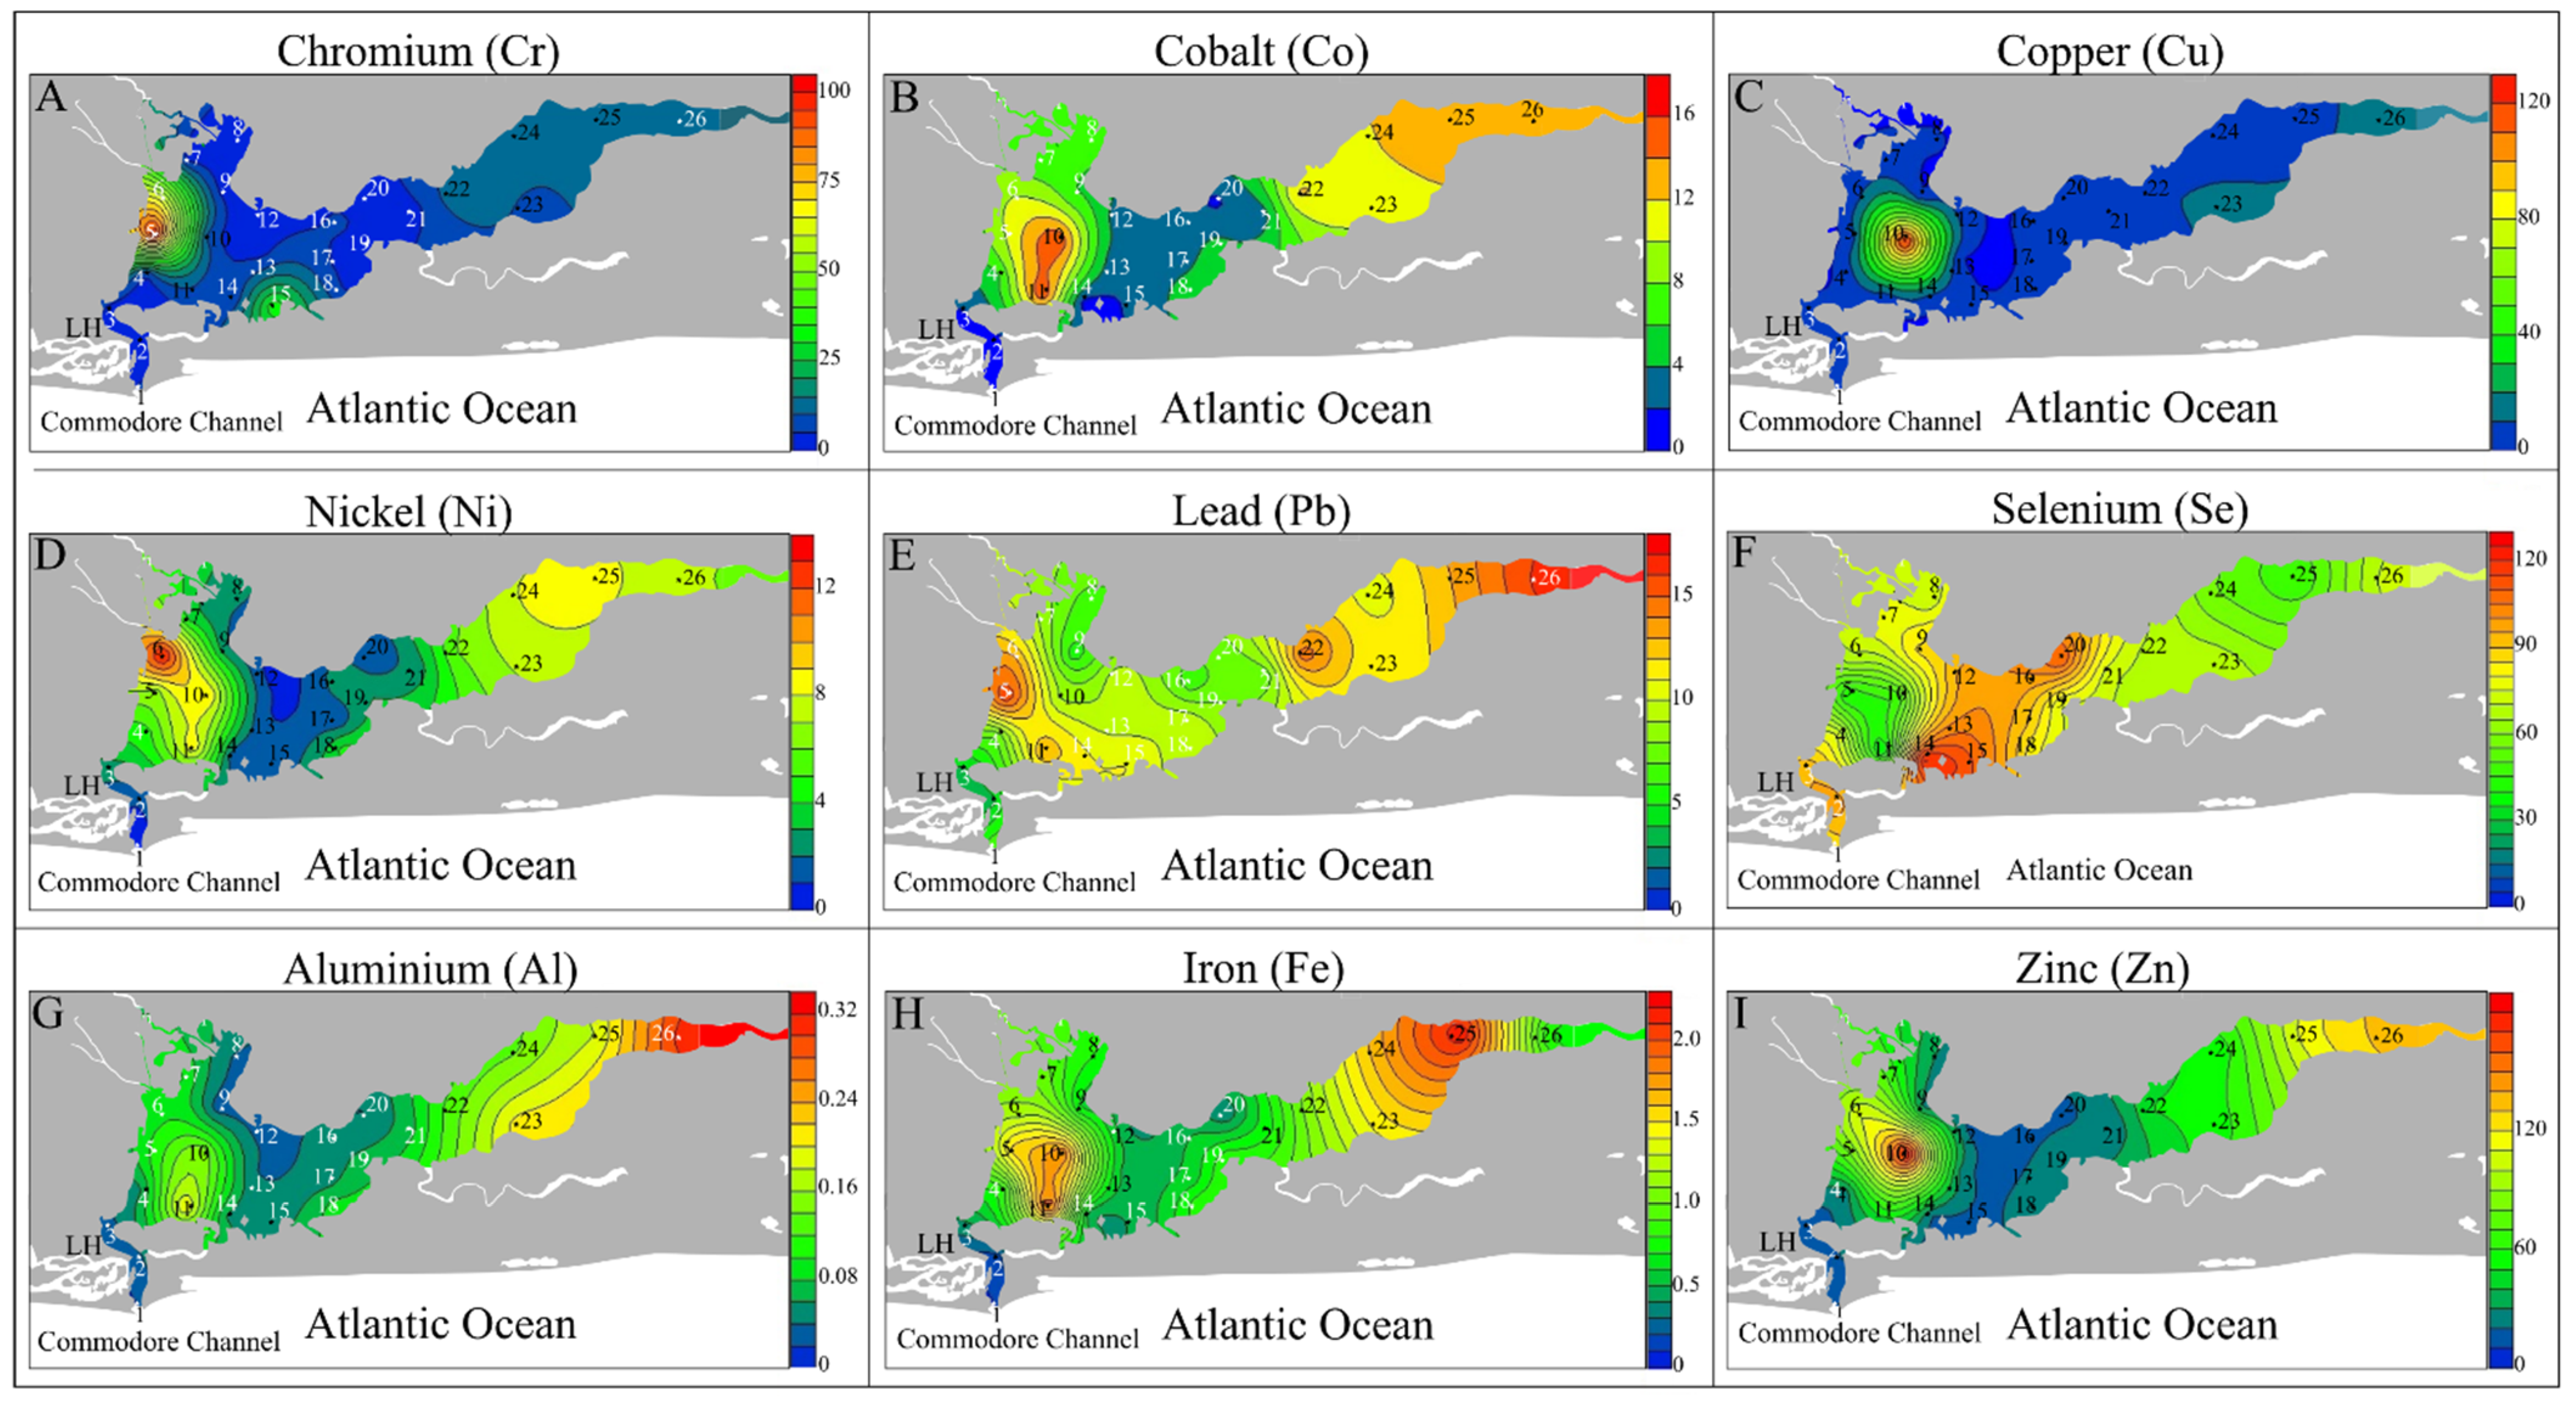
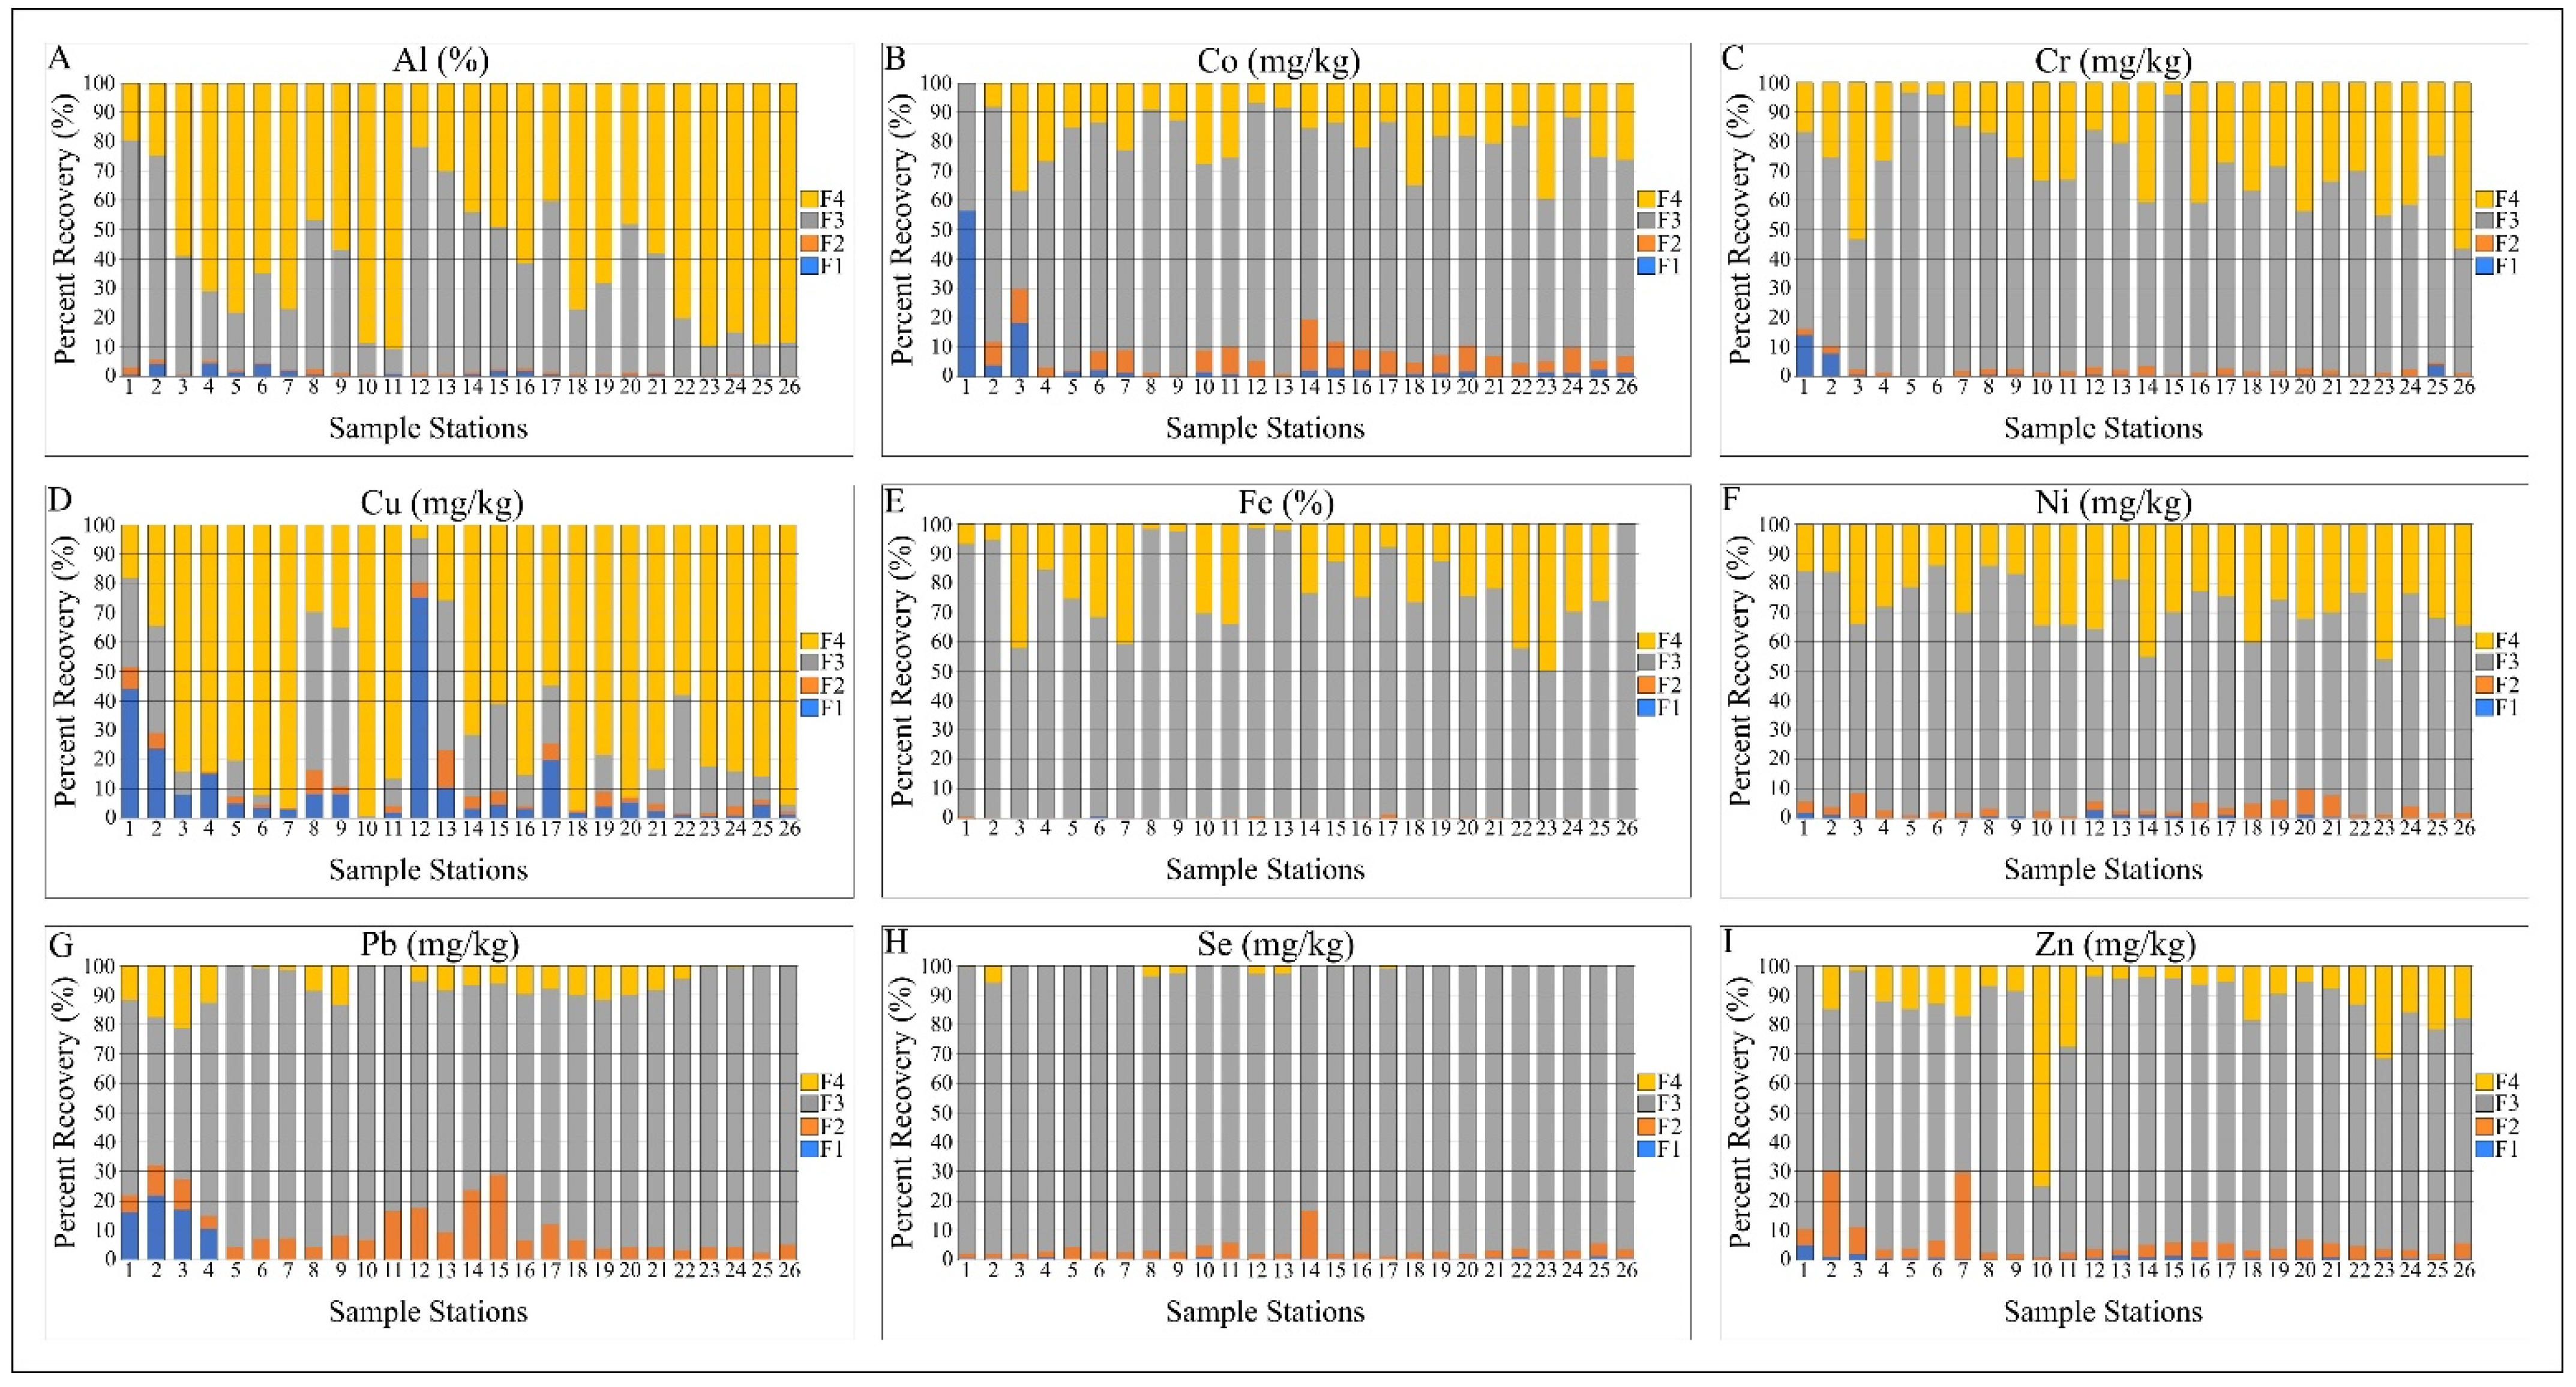
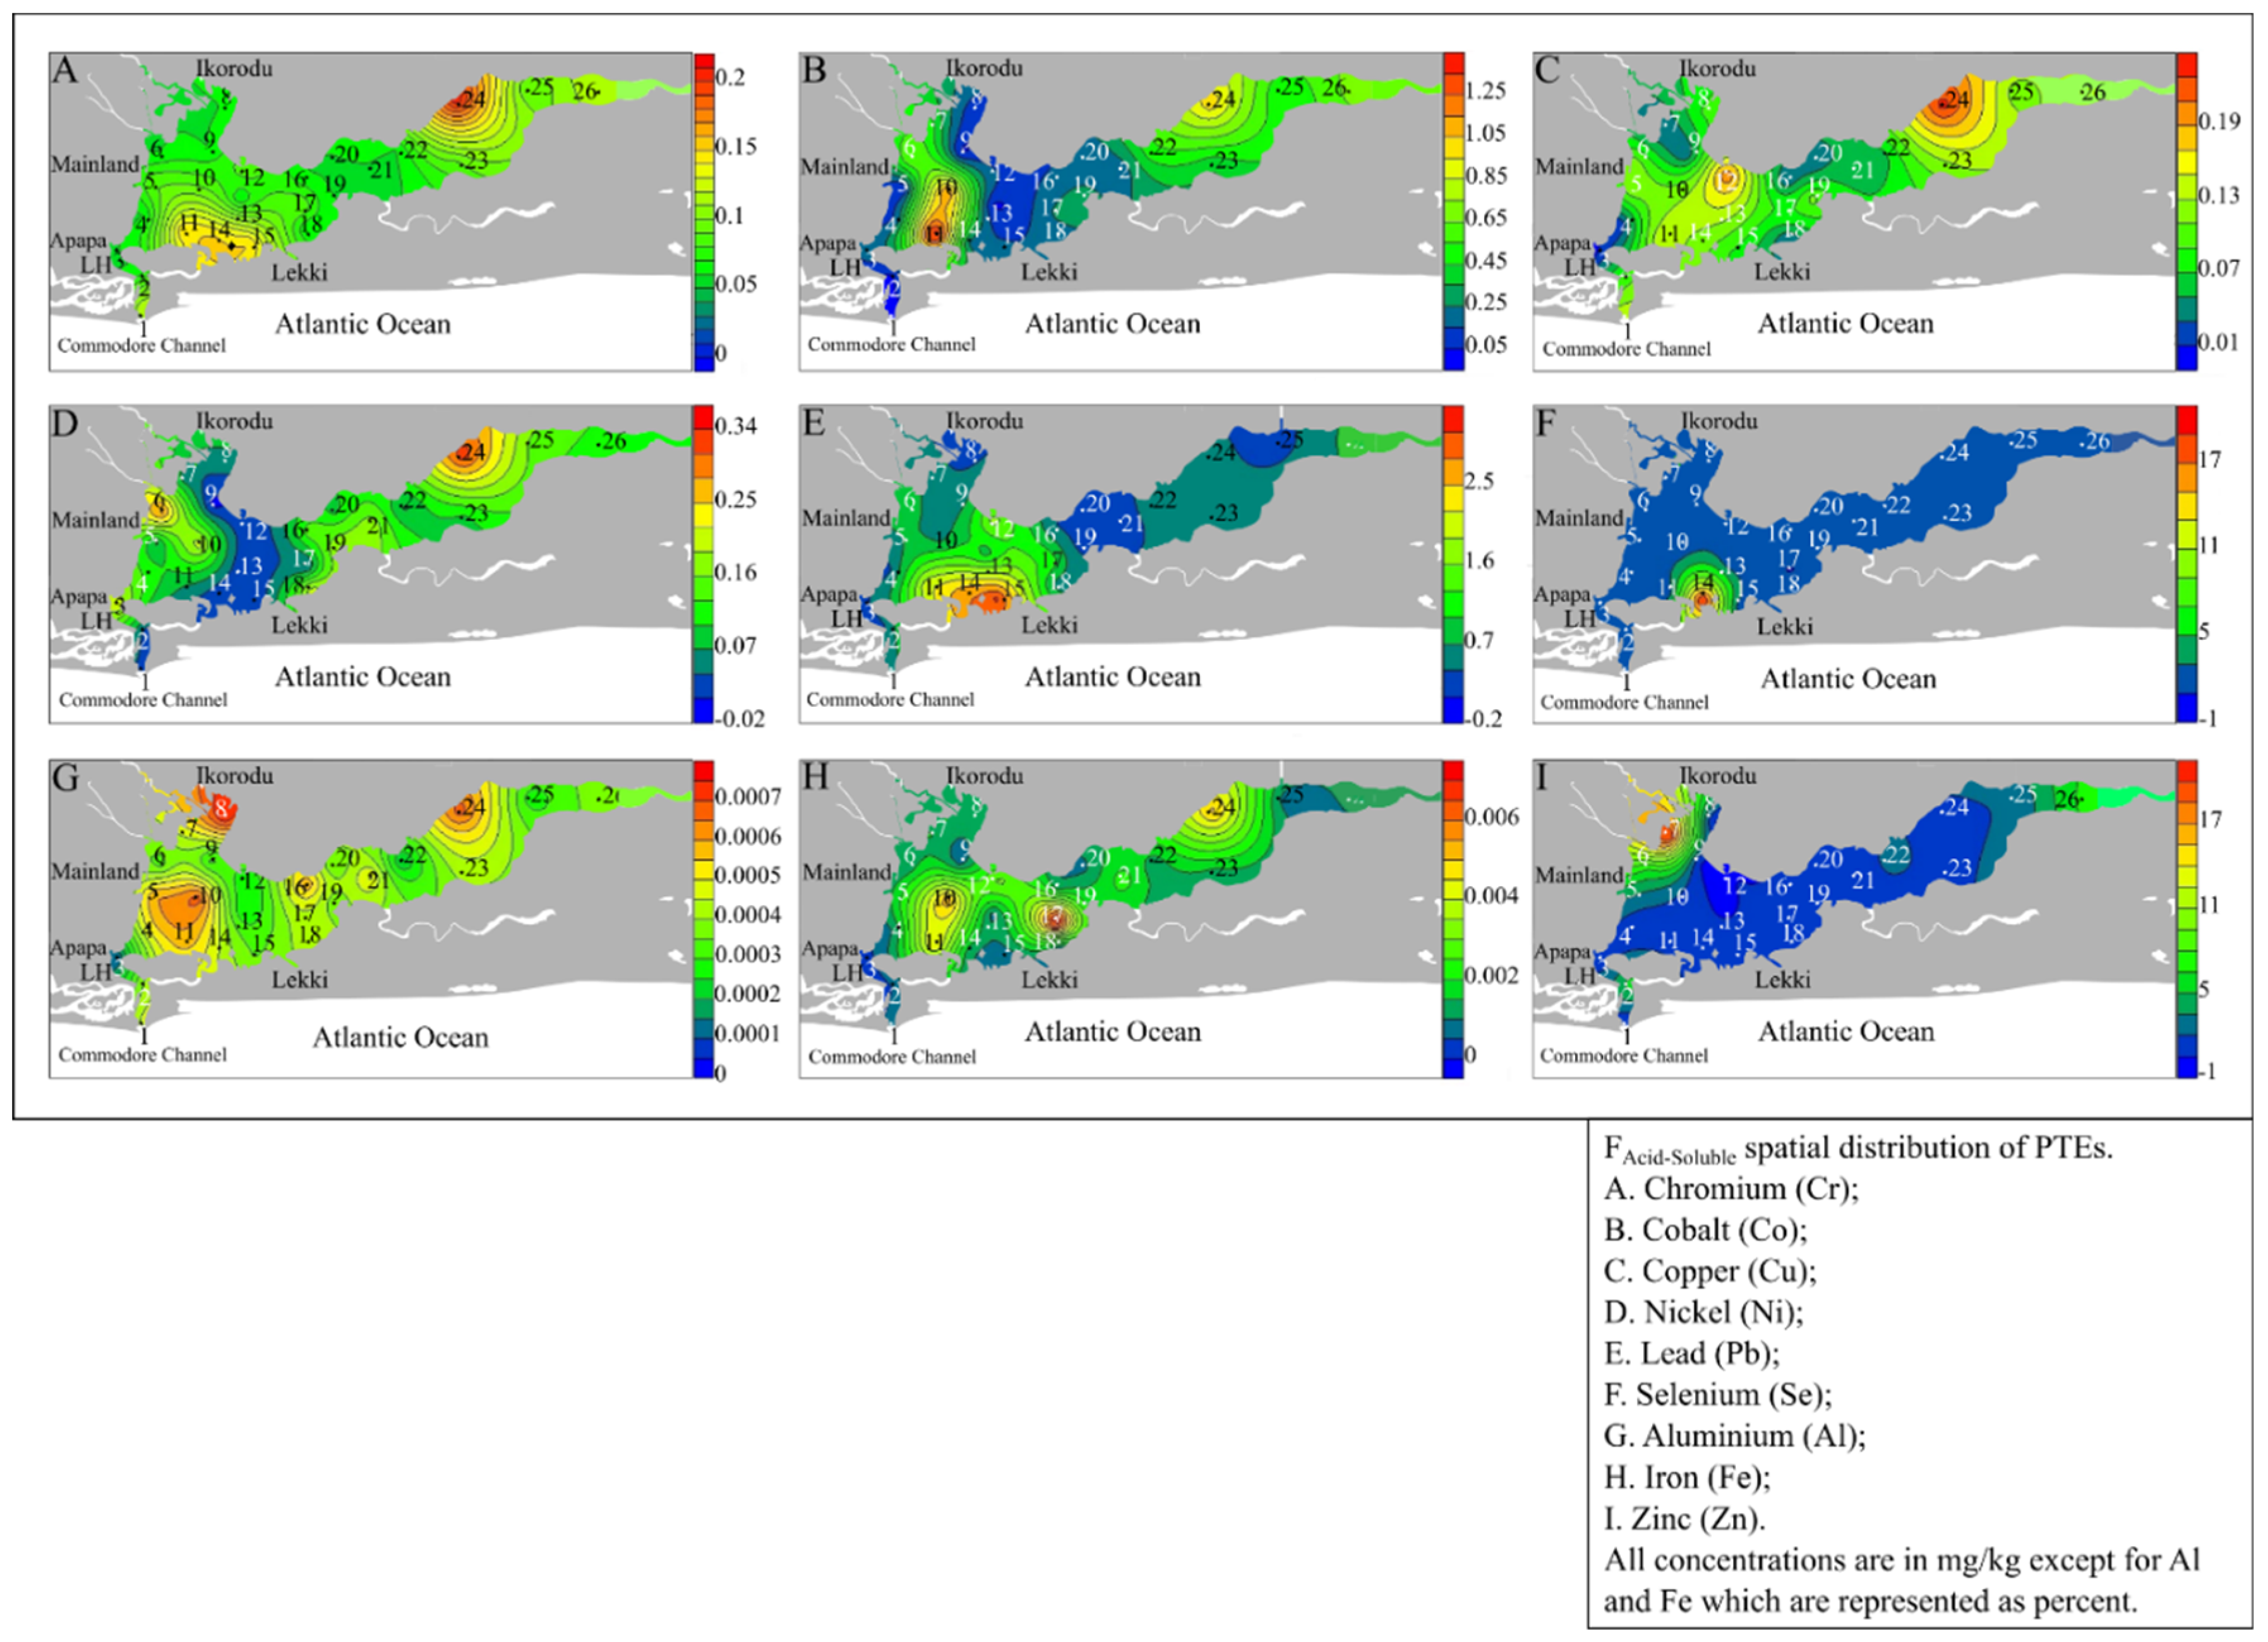
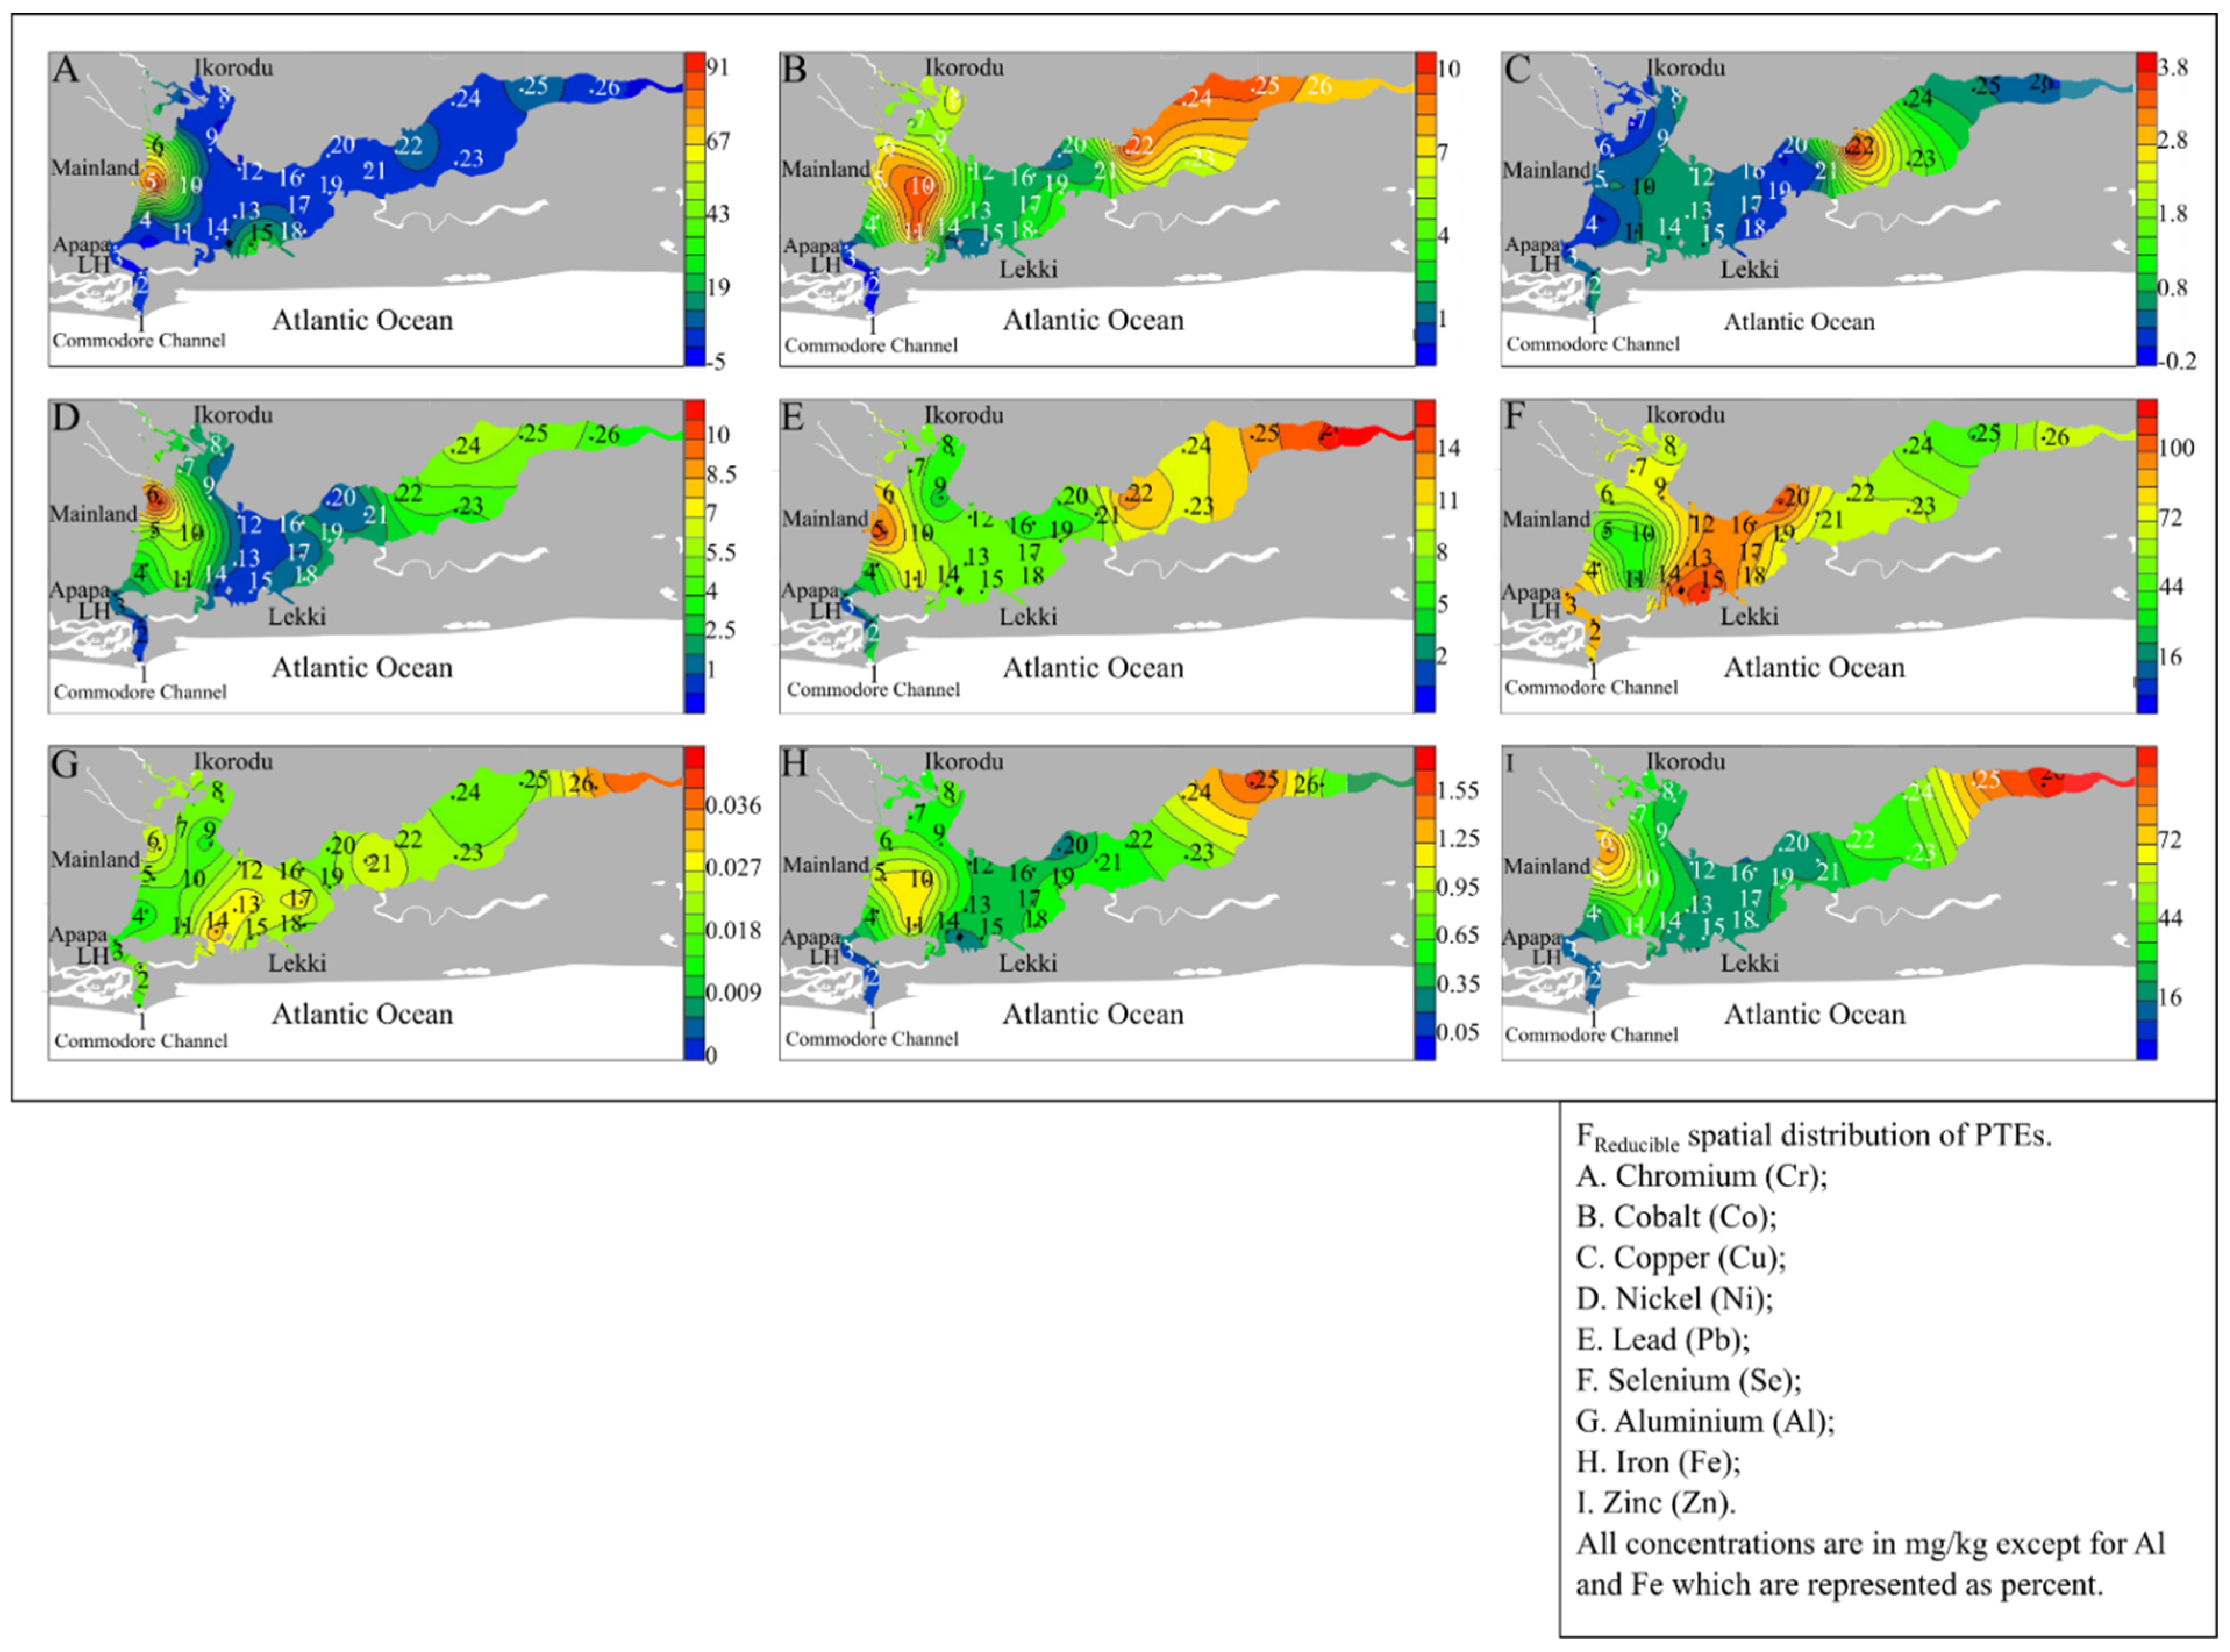
4.4. Potentially Toxic Elements (PTEs)
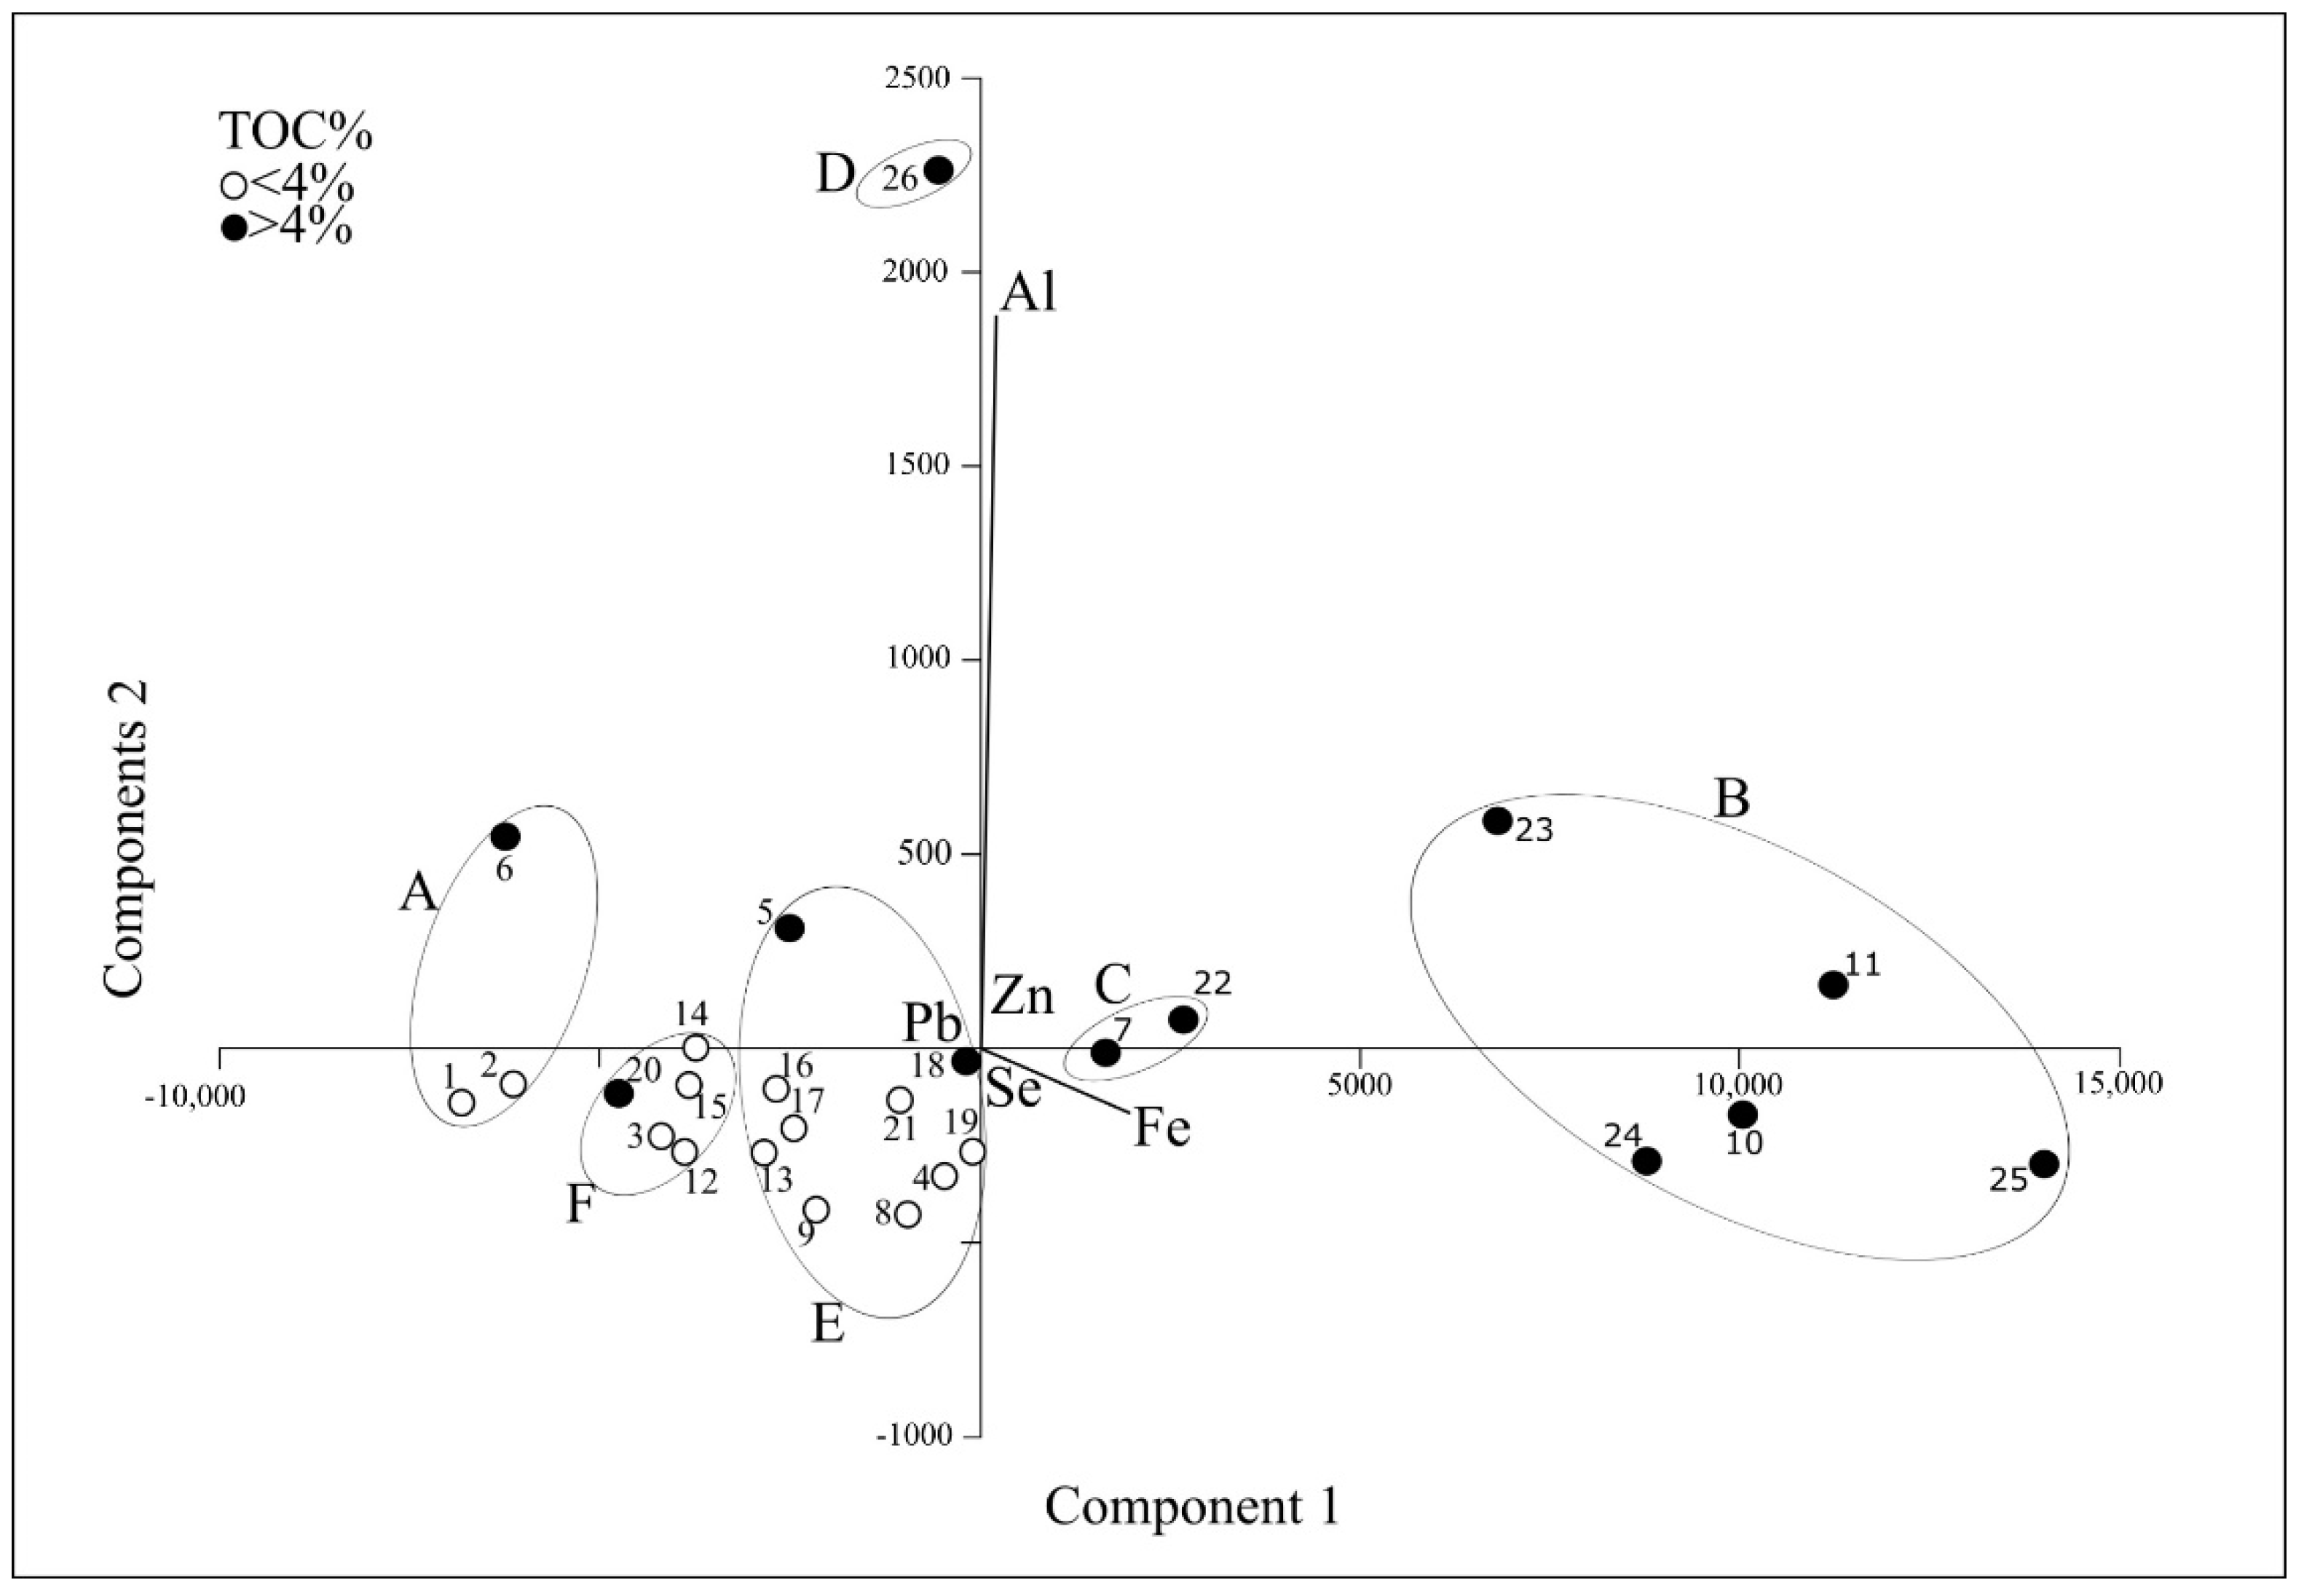
Correlation Matrix Analysis
4.5. Sediment Contamination Indices
5. Discussion
5.1. Potentially Toxic Elements in Sediments
5.2. Correlation between PTEs and Benthic Foraminiferal Assemblages
6. Conclusions
- The results of our study do not show a significant negative correlation between benthic foraminiferal species and PTEs except for PbF4 and SeF4.
- The spatial distribution of foraminiferal species richness and diversity negatively correlates with CoF4-NiF4-FeF4, a feature that tracks the salinity gradients. On the contrary, the positive correlation of CoF4-CuF4-NiF4-AlF4-FeF4-ZnF4 with the foraminiferal number distribution suggests that these PTEs behave as micronutrients since it also correlates favorably with TOC.
- This study provides new information on the bioavailability of PTEs, especially of Se in Lagos Lagoon. The relatively high concentrations of Se suggest that it has been accumulated unnoticed in the lagoon over the years. Lagos Lagoon will continue to act as a sink for Se and other PTEs, therefore, their potential impact on the lagoon’s ecosystem must be monitored and assessed for proper management and control to minimize further impacts of all these pollutants on coastal activities.
- Shannon diversity values H(S) show significant negative correlations with various bioavailable PTEs in the F4 fraction (Co-Ni-Fe).
- An interesting finding is Se being the only PTE with the highest total concentration (32–120 mg/kg) within the central portion of the lagoon. The Ecological Risk Index and Enrichment Factor also suggest that this part of the lagoon is experiencing moderate to severely polluted environmental conditions. It is uncertain what the extent of its effects on the foraminiferal assemblages is, since the abundance of A. salsum and Trochammina sp. 1, and the FN are the only parameters showing significant negative correlations with the non-bioavailable fractions of Se.
- Our study serves as a baseline for future studies investigating the environmental impact of pollution on benthic foraminifera, species richness, and within the Lagos Lagoon environment. Because the PTEs analyzed in this study represent only a portion of the pollution cocktail accumulating within Lagos Lagoon, future analysis of PAHs, PCBs, and OCs would provide a more comprehensive view on the status of pollution and their effects on foraminiferal bioindicators. Consistent with previous work, our results identify the problems associated with using total concentrations of selected PTEs alone as tools for biomonitoring, but support the usefulness of foraminiferal abundance and species richness as tools for environmental analysis.
Author Contributions
Funding
Data Availability Statement
Acknowledgments
Conflicts of Interest
Appendix A

| Sample ID | Fraction #1 (F1: Exchangeable) | ||||||||||||
| Cr | Co | Cu | Ni | Cd | Pb | K * | Se | As | Al * | Fe * | Zn | ||
| 1 | 0.75 | 0.39 | 0.87 | BDL | 2.25 | 1.11 | 0.01 | 0.42 | 0.15 | 1.11 × 10⁻⁴ | 2.76 × 10⁻⁴ | 0.57 | |
| 2 | 0.18 | BDL | 0.39 | BDL | 0.18 | 0.78 | 0.02 | 0.39 | 0.18 | 1.35 × 10⁻³ | 2.34 × 10⁻⁴ | 0.24 | |
| 3 | BDL | 0.33 | 0.30 | BDL | 0.06 | 0.60 | 0.04 | 0.24 | BDL | 9.3 × 10⁻⁵ | 2.01 × 10⁻⁴ | 0.27 | |
| 4 | BDL | 0.00 | 0.33 | BDL | 0.00 | 0.75 | 0.09 | 0.48 | BDL | 2.4 × 10⁻³ | 5.49 × 10⁻⁴ | 0.15 | |
| 5 | 0.03 | 0.18 | 0.24 | BDL | 0.12 | BDL | 0.14 | 0.00 | 0.09 | 1.65 × 10⁻³ | 3.16 × 10⁻³ | 0.60 | |
| 6 | 0.06 | 0.24 | 0.33 | BDL | 0.42 | BDL | 0.13 | BDL | BDL | 3.88 × 10⁻³ | 7.55 × 10⁻³ | 0.87 | |
| 7 | 0.00 | 0.09 | 0.18 | BDL | 0.00 | BDL | 0.06 | 0.15 | BDL | 2.13 × 10⁻³ | 4.24 × 10⁻³ | 0.21 | |
| 8 | BDL | BDL | 0.09 | BDL | BDL | BDL | 0.01 | 0.18 | BDL | 2.55 × 10⁻⁴ | 7.92 × 10⁻⁴ | 0.06 | |
| 9 | BDL | BDL | 0.09 | BDL | BDL | BDL | 0.01 | 0.03 | 0.09 | 9.3 × 10⁻⁵ | 3.42 × 10⁻⁴ | 0.06 | |
| 10 | BDL | 0.27 | 0.09 | BDL | 0.03 | BDL | 0.15 | 0.42 | BDL | 2.94 × 10⁻⁴ | 1.15 × 10⁻³ | 0.24 | |
| 11 | 0.00 | 0.15 | 0.12 | BDL | 0.03 | BDL | 0.15 | 0.09 | BDL | 1.6 × 10⁻³ | 3.3 × 10⁻³ | 0.21 | |
| 12 | BDL | 0.00 | 3.00 | BDL | BDL | BDL | 0.01 | 0.12 | BDL | 6.3 × 10⁻⁵ | 1.44 × 10⁻⁴ | 0.12 | |
| 13 | BDL | 0.00 | 0.12 | BDL | BDL | BDL | 0.01 | 0.15 | BDL | 9.3 × 10⁻⁵ | 4.47 × 10⁻⁴ | 0.45 | |
| 14 | BDL | 0.03 | 0.09 | BDL | BDL | BDL | 0.06 | 0.30 | BDL | 5.1 × 10⁻⁴ | 8.22 × 10⁻⁴ | 0.18 | |
| 15 | BDL | 0.06 | 0.09 | BDL | BDL | BDL | 0.04 | 0.24 | BDL | 9.9 × 10⁻⁴ | 1.4 × 10⁻³ | 0.27 | |
| 16 | BDL | 0.06 | 0.09 | BDL | BDL | BDL | 0.05 | 0.12 | 0.09 | 1.03 × 10⁻³ | 1.69 × 10⁻³ | 0.18 | |
| 17 | BDL | 0.03 | 0.30 | BDL | BDL | BDL | 0.02 | 0.09 | BDL | 3.54 × 10⁻⁴ | 8.76 × 10⁻⁴ | 0.12 | |
| 18 | BDL | 0.06 | 0.06 | BDL | 0.00 | BDL | 0.09 | 0.15 | BDL | 2.88 × 10⁻⁴ | 6.15 × 10⁻⁴ | 0.18 | |
| 19 | BDL | 0.06 | 0.09 | BDL | BDL | BDL | 0.05 | 0.21 | BDL | 2.46 × 10⁻⁴ | 6.3 × 10⁻⁴ | 0.12 | |
| 20 | BDL | 0.03 | 0.09 | BDL | BDL | BDL | 0.03 | 0.24 | BDL | 2.13 × 10⁻⁴ | 4.41 × 10⁻⁴ | 0.12 | |
| 21 | BDL | 0.00 | 0.06 | BDL | BDL | BDL | 0.05 | 0.33 | BDL | 4.65 × 10⁻⁴ | 9.42 × 10⁻⁴ | 0.21 | |
| 22 | BDL | 0.06 | 0.09 | BDL | 0.00 | BDL | 0.07 | 0.57 | BDL | 1.53 × 10⁻⁴ | 4.17 × 10⁻⁴ | 0.12 | |
| 23 | BDL | 0.18 | 0.06 | BDL | 0.06 | BDL | 0.18 | 0.24 | BDL | 3.54 × 10⁻⁴ | 7.14 × 10⁻⁴ | 0.42 | |
| 24 | BDL | 0.15 | 0.06 | BDL | 0.03 | BDL | 0.14 | 0.12 | BDL | 4.77 × 10⁻⁴ | 1.46 × 10⁻³ | 0.27 | |
| 25 | 0.45 | 0.33 | 0.33 | BDL | 0.27 | BDL | 0.14 | 0.48 | BDL | 6.9 × 10⁻⁴ | 4.17 × 10⁻⁴ | 0.30 | |
| 26 | BDL | 0.18 | 0.18 | BDL | 0.39 | BDL | 0.11 | 0.36 | BDL | 1.5 × 10⁻⁴ | 3.6 × 10⁻⁴ | 0.57 | |
| Sample ID | Fraction #2 (F2: Acid-soluble) | ||||||||||||
| Cr | Co | Cu | Ni | Cd | Pb | K * | Se | As | Al * | Fe * | Zn | ||
| 1 | 0.12 | 0.00 | 0.15 | 0.03 | 0.03 | 0.39 | 0.01 | 1.350 | BDL | 4.77 × 10⁻⁴ | 6.3 × 10⁻⁴ | 0.60 | |
| 2 | 0.06 | 0.03 | 0.09 | 0.03 | 0.03 | 0.36 | 0.02 | 1.56 | BDL | 4.02 × 10⁻⁴ | 4.71 × 10⁻⁴ | 6.00 | |
| 3 | 0.06 | 0.21 | 0.00 | 0.21 | 0.00 | 0.36 | 0.03 | 1.74 | BDL | 9.9 × 10⁻⁵ | 2.85 × 10⁻⁴ | 1.20 | |
| 4 | 0.06 | 0.18 | BDL | 0.12 | 0.03 | 0.30 | 0.05 | 1.59 | BDL | 5.13 × 10⁻⁴ | 1.08 × 10⁻³ | 0.81 | |
| 5 | 0.09 | 0.05 | 0.12 | 0.06 | 0.03 | 0.66 | 0.10 | 1.71 | BDL | 5.97 × 10⁻⁴ | 2.1 × 10⁻³ | 2.85 | |
| 6 | 0.06 | 0.66 | 0.12 | 0.30 | 0.18 | 0.96 | 0.09 | 1.68 | BDL | 3.27 × 10⁻⁴ | 1.15 × 10⁻³ | 6.57 | |
| 7 | 0.06 | 0.51 | 0.03 | 0.06 | 0.06 | 0.66 | 0.04 | 1.74 | BDL | 4.62 × 10⁻⁴ | 1.58 × 10⁻³ | 21.00 | |
| 8 | 0.06 | 0.09 | 0.09 | 0.06 | 0.00 | 0.27 | 0.02 | 1.89 | BDL | 7.53 × 10⁻⁴ | 1.13 × 10⁻³ | 0.66 | |
| 9 | 0.06 | 0.03 | 0.03 | 0.00 | 0.03 | 0.42 | 0.02 | 2.07 | BDL | 2.76 × 10⁻⁴ | 6 × 10⁻⁴ | 0.51 | |
| 10 | 0.09 | 1.17 | 0.12 | 0.21 | 0.03 | 0.60 | 0.10 | 1.77 | BDL | 6.78 × 10⁻⁴ | 5.45 × 10⁻³ | 1.38 | |
| 11 | 0.15 | 1.47 | 0.15 | 0.06 | BDL | 2.13 | 0.09 | 1.71 | BDL | 5.76 × 10⁻⁴ | 4.69 × 10⁻³ | 1.41 | |
| 12 | 0.09 | 0.15 | 0.21 | BDL | BDL | 1.77 | 0.01 | 1.80 | BDL | 2.43 × 10⁻⁴ | 3.2 × 10⁻³ | 0.57 | |
| 13 | 0.06 | 0.03 | 0.15 | BDL | BDL | 0.84 | 0.02 | 1.89 | BDL | 2.46 × 10⁻⁴ | 7.32 × 10⁻⁴ | 0.48 | |
| 14 | 0.15 | 0.24 | 0.12 | BDL | BDL | 2.64 | 0.03 | 19.80 | BDL | 4.53 × 10⁻⁴ | 1.27 × 10⁻³ | 0.87 | |
| 15 | 0.15 | 0.18 | 0.09 | BDL | BDL | 3.18 | 0.02 | 1.98 | BDL | 3.48 × 10⁻⁴ | 5.76 × 10⁻⁴ | 0.84 | |
| 16 | 0.06 | 0.18 | 0.03 | 0.15 | 0.03 | 0.42 | 0.03 | 2.07 | BDL | 6 × 10⁻⁴ | 1.08 × 10⁻³ | 0.99 | |
| 17 | 0.09 | 0.27 | 0.09 | 0.03 | BDL | 1.20 | 0.02 | 0.90 | BDL | 4.35 × 10⁻⁴ | 7.42 × 10⁻³ | 1.23 | |
| 18 | 0.06 | 0.21 | 0.03 | 0.21 | 0.00 | 0.60 | 0.04 | 1.77 | BDL | 4.35 × 10⁻⁴ | 8.28 × 10⁻⁴ | 0.78 | |
| 19 | 0.06 | 0.30 | 0.12 | 0.18 | 0.03 | 0.30 | 0.03 | 1.86 | BDL | 3.66 × 10⁻⁴ | 2.07 × 10⁻³ | 1.05 | |
| 20 | 0.06 | 0.15 | 0.03 | 0.09 | 0.00 | 0.30 | 0.02 | 1.86 | BDL | 3.45 × 10⁻⁴ | 8.7 × 10⁻⁴ | 1.17 | |
| 21 | 0.06 | 0.18 | 0.06 | 0.18 | 0.03 | 0.30 | 0.03 | 1.83 | BDL | 5.19 × 10⁻⁴ | 2.29 × 10⁻³ | 1.11 | |
| 22 | 0.06 | 0.51 | 0.06 | 0.06 | 0.03 | 0.48 | 0.05 | 2.04 | BDL | 1.83 × 10⁻⁴ | 1.22 × 10⁻³ | 2.28 | |
| 23 | 0.09 | 0.36 | 0.12 | 0.09 | 0.03 | 0.45 | 0.08 | 1.89 | BDL | 4.2 × 10⁻⁴ | 1.19 × 10⁻³ | 1.71 | |
| 24 | 0.21 | 1.02 | 0.24 | 0.33 | 0.18 | 0.45 | 0.12 | 1.56 | BDL | 6.81 × 10⁻⁴ | 5.21 × 10⁻³ | 1.68 | |
| 25 | 0.09 | 0.45 | 0.12 | 0.15 | 0.12 | 0.30 | 0.11 | 2.04 | BDL | 2.7 × 10⁻⁴ | 7.17 × 10⁻⁴ | 2.25 | |
| 26 | 0.12 | 0.69 | 0.15 | 0.12 | 0.21 | 0.84 | 0.12 | 2.100 | BDL | 3.87 × 10⁻⁴ | 1.15 × 10⁻³ | 7.35 | |
| Sample ID | Fraction #3 (F3: Reducible) | ||||||||||||
| Cr | Co | Cu | Ni | Cd | Pb | K * | Se | As | Al * | Fe * | Zn | ||
| 1 | 3.6 | 0.3 | 0.6 | 0.6 | 0.3 | 4.5 | 2.01 × 10⁻³ | 83.4 | BDL | 0.02 | 0.10 | 9.9 | |
| 2 | 1.5 | 0.3 | 0.6 | 0.9 | 0.3 | 1.8 | 2.52 × 10⁻³ | 92.1 | BDL | 0.02 | 0.17 | 11.4 | |
| 3 | 1.5 | 0.6 | 0.3 | 1.5 | 0.3 | 1.8 | 2.43 × 10⁻³ | 93.3 | BDL | 0.01 | 0.22 | 11.4 | |
| 4 | 3.9 | 3.9 | 0.0 | 3.3 | BDL | 5.1 | 0.01 | 73.5 | BDL | 0.01 | 0.63 | 22.2 | |
| 5 | 93.0 | 8.4 | 0.6 | 5.1 | BDL | 15.3 | 0.03 | 38.1 | BDL | 0.02 | 1.15 | 70.5 | |
| 6 | 60.0 | 8.1 | 0.3 | 11.4 | 0.3 | 12.6 | 0.02 | 66.9 | BDL | 0.03 | 0.79 | 89.1 | |
| 7 | 2.7 | 4.5 | 0.0 | 2.4 | BDL | 8.4 | 0.01 | 75.9 | BDL | 0.02 | 0.56 | 38.1 | |
| 8 | 2.4 | 6.6 | 0.6 | 1.8 | BDL | 5.7 | 1.53 × 10⁻³ | 66.9 | BDL | 0.02 | 0.68 | 25.8 | |
| 9 | 2.1 | 5.4 | 0.6 | 1.8 | BDL | 4.2 | 1.47 × 10⁻³ | 81.3 | BDL | 0.01 | 0.56 | 24.6 | |
| 10 | 5.7 | 10.2 | 0.6 | 5.7 | BDL | 8.4 | 0.02 | 44.1 | BDL | 0.02 | 1.24 | 44.7 | |
| 11 | 6.3 | 10.2 | 0.6 | 5.7 | BDL | 10.8 | 0.02 | 30.0 | BDL | 0.02 | 1.25 | 45.3 | |
| 12 | 2.7 | 2.4 | 0.6 | 0.3 | BDL | 7.8 | 7.80 × 10⁻⁴ | 92.1 | BDL | 0.02 | 0.40 | 17.1 | |
| 13 | 2.7 | 3.0 | 0.6 | 0.9 | BDL | 7.5 | 9.00 × 10⁻⁴ | 92.7 | BDL | 0.03 | 0.50 | 24.3 | |
| 14 | 2.7 | 0.9 | 0.6 | 0.6 | 0.0 | 7.8 | 3.15 × 10⁻³ | 100.8 | BDL | 0.03 | 0.32 | 18.3 | |
| 15 | 33.0 | 1.5 | 0.6 | 0.9 | 0.0 | 7.2 | 2.25 × 10⁻³ | 111.3 | BDL | 0.02 | 0.35 | 16.5 | |
| 16 | 3.3 | 1.8 | 0.3 | 2.1 | 0.0 | 5.4 | 2.73 × 10⁻³ | 94.8 | BDL | 0.02 | 0.39 | 16.5 | |
| 17 | 2.7 | 2.7 | 0.3 | 0.9 | BDL | 8.1 | 1.56 × 10⁻³ | 88.5 | BDL | 0.03 | 0.50 | 20.7 | |
| 18 | 3.0 | 3.3 | 0.0 | 2.4 | BDL | 7.5 | 4.95 × 10⁻³ | 79.5 | BDL | 0.02 | 0.57 | 22.2 | |
| 19 | 3.0 | 3.6 | 0.3 | 2.1 | BDL | 6.9 | 3.15 × 10⁻³ | 72.9 | BDL | 0.02 | 0.68 | 26.1 | |
| 20 | 1.5 | 1.2 | 0.0 | 0.6 | 0.0 | 6.3 | 1.8 × 10⁻³ | 109.5 | BDL | 0.02 | 0.24 | 16.2 | |
| 21 | 2.4 | 1.8 | 0.3 | 1.5 | BDL | 6.3 | 3.48 × 10⁻³ | 70.2 | BDL | 0.03 | 0.53 | 19.8 | |
| 22 | 9.3 | 9.9 | 3.9 | 4.6 | 2.7 | 13.5 | 0.01 | 66.3 | BDL | 0.02 | 0.61 | 41.4 | |
| 23 | 5.1 | 5.7 | 1.8 | 3.9 | 0.6 | 10.5 | 0.01 | 67.8 | BDL | 0.02 | 0.73 | 37.2 | |
| 24 | 5.7 | 9.3 | 0.9 | 6.0 | BDL | 9.9 | 0.03 | 53.7 | BDL | 0.02 | 1.17 | 44.7 | |
| 25 | 8.1 | 9.6 | 0.6 | 5.4 | BDL | 12.9 | 0.02 | 42.3 | BDL | 0.02 | 1.62 | 88.5 | |
| 26 | 5.4 | 8.1 | 0.3 | 4.5 | 0.3 | 15.6 | 0.02 | 69.9 | BDL | 0.04 | 0.71 | 103.8 | |
| Sample ID | Fraction #4 (F4: Oxidizable) | ||||||||||||
| Cr | Co | Cu | Ni | Cd | Pb | K * | Se | As | Al * | Fe * | Zn | ||
| 1 | 0.90 | 0.00 | 0.36 | 0.12 | 0.03 | 0.81 | 0.03% | 0.19 | BDL | 3.84 × 10⁻³ | 0.01 | 0.00 | |
| 2 | 0.60 | 0.03 | 0.57 | 0.18 | 0.03 | 0.63 | 0.04% | 5.64 | BDL | 0.01 | 0.01 | 3.00 | |
| 3 | 1.80 | 0.66 | 3.18 | 0.87 | BDL | 0.75 | 0.08% | BDL | BDL | 0.02 | 0.16 | 0.18 | |
| 4 | 1.44 | 1.47 | 1.86 | 1.32 | BDL | 0.90 | 0.12% | BDL | BDL | 0.04 | 0.11 | 3.12 | |
| 5 | 3.30 | 1.53 | 3.96 | 1.38 | BDL | 0.03 | 0.04% | BDL | BDL | 0.08 | 0.39 | 12.63 | |
| 6 | 2.58 | 1.38 | 8.97 | 1.86 | BDL | 0.12 | 0.02% | BDL | BDL | 0.06 | 0.37 | 14.04 | |
| 7 | 0.48 | 1.50 | 5.94 | 1.05 | BDL | 0.15 | 0.08% | BDL | BDL | 0.08 | 0.39 | 12.03 | |
| 8 | 0.51 | 0.66 | 0.33 | 0.30 | 0.00 | 0.57 | 0.04% | 2.46 | BDL | 0.02 | 0.01 | 1.89 | |
| 9 | 0.75 | 0.78 | 0.39 | 0.36 | 0.00 | 0.72 | 0.05% | 2.13 | BDL | 0.02 | 0.01 | 2.28 | |
| 10 | 2.91 | 4.38 | 129.51 | 3.06 | BDL | BDL | 0.19% | BDL | BDL | 0.14 | 0.54 | 137.31 | |
| 11 | 3.18 | 4.02 | 5.64 | 2.97 | BDL | BDL | 0.10% | BDL | BDL | 0.19 | 0.65 | 17.70 | |
| 12 | 0.54 | 0.18 | 0.18 | 0.18 | 0.00 | 0.54 | 0.03% | 2.52 | BDL | 0.01 | 0.01 | 0.60 | |
| 13 | 0.72 | 0.27 | 0.30 | 0.21 | 0.00 | 0.78 | 0.06% | 2.49 | BDL | 0.01 | 0.01 | 1.08 | |
| 14 | 1.98 | 0.21 | 2.04 | 0.51 | BDL | 0.75 | 0.08% | BDL | BDL | 0.03 | 0.10 | 0.72 | |
| 15 | 1.38 | 0.27 | 1.23 | 0.39 | BDL | 0.69 | 0.07% | 0.06 | BDL | 0.02 | 0.05 | 0.75 | |
| 16 | 2.34 | 0.57 | 2.46 | 0.66 | BDL | 0.63 | 0.11% | BDL | BDL | 0.04 | 0.13 | 1.14 | |
| 17 | 1.05 | 0.45 | 0.84 | 0.30 | BDL | 0.81 | 0.07% | 0.60 | BDL | 0.02 | 0.04 | 1.23 | |
| 18 | 1.80 | 1.89 | 3.45 | 1.74 | BDL | 0.93 | 0.18% | BDL | BDL | 0.07 | 0.20 | 5.19 | |
| 19 | 1.23 | 0.87 | 1.86 | 0.78 | BDL | 0.96 | 0.10% | BDL | BDL | 0.04 | 0.10 | 2.79 | |
| 20 | 1.23 | 0.30 | 1.59 | 0.33 | BDL | 0.75 | 0.06% | BDL | BDL | 0.02 | 0.08 | 0.96 | |
| 21 | 1.26 | 0.51 | 2.10 | 0.72 | BDL | 0.60 | 0.10% | BDL | BDL | 0.04 | 0.15 | 1.71 | |
| 22 | 4.05 | 1.77 | 5.58 | 1.38 | BDL | 0.69 | 0.21% | BDL | BDL | 0.10 | 0.45 | 6.51 | |
| 23 | 4.29 | 4.05 | 9.30 | 3.36 | BDL | 0.03 | 0.05% | BDL | BDL | 0.19 | 0.73 | 17.94 | |
| 24 | 4.23 | 1.35 | 6.33 | 1.92 | BDL | 0.06 | 0.23% | BDL | BDL | 0.12 | 0.50 | 8.64 | |
| 25 | 2.85 | 3.45 | 6.33 | 2.58 | BDL | BDL | 0.19% | BDL | BDL | 0.16 | 0.57 | 24.66 | |
| 26 | 7.23 | 3.15 | 13.95 | 2.40 | BDL | BDL | 0.25% | BDL | BDL | 0.28 | ND | 23.85 | |
Appendix B


References
- Martínez-Colón, M.; Hallock, P.; Green-Ruíz, C.; Smoak, J.M. Benthic foraminifera as bioindicators of potentially toxic element (PTE) pollution: Torrecillas Lagoon (San Juan Bay Estuary), Puerto Rico. Ecol. Indic. 2018, 89, 516–527. [Google Scholar] [CrossRef]
- Li, T.; Li, X.; Zhong, H.; Yang, C.; Sun, G.; Luo, W. Distribution of trace metals and the benthic foraminiferal assemblage as a characterization of the environment in the north Minjiang River Estuary (Fujian, China). Mar. Pollut. Bull. 2015, 90, 227–241. [Google Scholar] [CrossRef] [PubMed]
- Debenay, J.-P.; Pages, J.; Diouf, P.S. Ecological zonation of the hyperhaline estuary of the Casamance River (Senegal): Foraminifera, zooplankton and abiotic variables. Hydrobiologia 1989, 174, 161–176. [Google Scholar] [CrossRef]
- Ekett, S.I.; Fred-Ahmadu, O.H.; Adedapo, A.E.; Benson, N.U. Trace and major elements distribution in coastal sediment cores from Lagos Lagoon, Nigeria. Data Brief 2018, 16, 93–100. [Google Scholar] [CrossRef]
- Sogbanmu, T.O.; Nagy, E.; Phillips, D.H.; Arlt, V.M.; Otitoloju, A.A.; Bury, N.R. Lagos Lagoon sediment organic extracts and polycyclic aromatic hydrocarbons induce embryotoxic, tetratogenic and genotoxic effects in Danio rerio (zebrafish) embryos. Environ. Sci. Pollut. Res. 2016, 23, 14489–14501. [Google Scholar] [CrossRef] [Green Version]
- Ajao, E.A. Review of the state of pollution of the Lagos Lagoon. NIOMR Tech. Pap. 1996, 106, 19. [Google Scholar]
- Ajao, E.A.; Fagade, S.O. A study of the sediments and communities in Lagos Lagoon, Nigeria. Oil Chem. Pollut. 1990, 7, 85–117. [Google Scholar] [CrossRef]
- Obi, C.C.; Adebusoye, S.A.; Ugoji, E.O.; Ilori, M.O.; Amund, O.O.; Hickey, W.J. Microbial Communities in sediments of Lagos Lagoon, Nigeria: Elucidation of Community Structure and potential Impacts of contamination by municipal and industrial wastes. Front. Microbiol. 2016, 7, 1213. [Google Scholar] [CrossRef] [Green Version]
- Ellison, R.L.; Broome, R.; Oglivie, R. Foraminiferal response to trace metal contamination in the Patapsco River and Baltimore harbour, Maryland. Mar. Pollut. Bull. 1986, 17, 419–423. [Google Scholar] [CrossRef]
- Frontalini, F.; Coccioni, R.; Bucci, C. Benthic foraminiferal assemblages and trace element contents from the lagoons of Orbetello and Lesina. Environ. Monit. Assess. 2010, 170, 245–260. [Google Scholar] [CrossRef] [PubMed]
- Martins, M.V.A.; Helali, M.A.; Zaaboub, N.; Boukef-BenOmrane, I.; Frontalini, F.; Reis, D.; Portela, H.; Clemente, I.M.M.M.; Nogueira, L.; Pereira, E.; et al. Organic matter quantity and quality, metals availability and foraminiferal assemblages as environmental proxy applied to the Bizerte Lagoon (Tunisia). Mar. Pollut. Bull. 2016, 105, 161–179. [Google Scholar] [CrossRef]
- Suokhrie, T.; Saraswat, R.; Nigam, R. Foraminifera as Bio-Indicators of Pollution: A Review of Research over the Last Decade. Micropaleontology and its Applications; Pradeep, K.K., Rajiv, N., Abu, T., Eds.; Sci. Publ.: Delhi, India, 2017; pp. 265–284. [Google Scholar]
- Fajemila, O.T.; Sariaslan, N.; Langer, M.R. Spatial Distribution of Benthic Foraminifera in the Lagos Lagoon (Nigeria): Tracing the Impact of Environmental Perturbations. PLoS ONE 2020, 15, e0243481. [Google Scholar] [CrossRef]
- Hill, M.B.; Webb, J.E. The ecology of Lagos Lagoon—Part II. The topography and physical features of Lagos Harbour and Lagos Lagoon. Philos. Trans. R. Soc. 1957, 241, 319–333. [Google Scholar]
- Emmanuel, B.E.; Chukwu, L.O. Spatial distribution of saline water and possible sources of intrusion into a tropical freshwater lagoon and the transitional effects on the lacustrine ichthyofaunal diversity. Afr. J. Eniron. Sci. Technol. 2010, 4, 480–491. [Google Scholar]
- Nkwoji, J.A.; Ugbana, S.I.; Ina-Salwany, M.Y. Impacts of land-based pollutants on water chemistry and benthic macroinvertebrates community in a coastal lagoon, Lagos, Nigeria. Sci. Afr. 2020, 7, e00220. [Google Scholar] [CrossRef]
- Nkwoji, J.A.; Awodeyi, S.I. Impacts of sediment mining on the hydrochemistry and macrozoobenthos community in a coastal lagoon, Lagos, Nigeria. Arch. Agric. Environ. Sci. 2018, 3, 209–215. [Google Scholar] [CrossRef]
- Lawson, E.O. Physico-chemical parameters and heavy metal contents of water from the mangrove swamps of the Lagos Lagoon, Nigeria. Adv. Biol. Res. 2011, 5, 8–21. [Google Scholar]
- Okoye, B.C.O.; Afolabi, O.A.; Ajao, E.O. Heavy metals in the Lagos Lagoon sediments. Int. J. Environ. Stud. 1991, 37, 35–41. [Google Scholar] [CrossRef]
- Heiri, O.; Lotter, A.F.; Lemcke, G. Loss on ignition as a method for estimating organic and carbonate content in sediments: Reproducibility and comparability of results. J. Paleolimnol. 2001, 25, 101–110. [Google Scholar] [CrossRef]
- Jacq, K.; Perrette, Y.; Fenger, B.; Sabatier, P.; Coquin, D.; Martinez-Lamas, R.; Debret, M.; Arnaud, F. High-resolution prediction of organic matter concentration with hyperspectral imaging on a sediment core. Sci. Total Environ. 2019, 663, 236–244. [Google Scholar] [CrossRef] [Green Version]
- Tessier, A.; Campbell, P.G.C.; Bisson, M. Sequential Extraction Procedure for the Speciation of Particulate Trace Metals. Anal. Chem. 1979, 51, 844–851. [Google Scholar] [CrossRef]
- Parker, W.C.; Arnold, A.J. Quantitative methods of data analysis in foraminiferal ecology. In Modern Foraminifera; Sen, G.B.K., Ed.; Kluwer: Dordrecht, The Netherlands, 1999; pp. 71–89. [Google Scholar]
- Turekian, K.K.; Wedepohl, K.H. Distribution of elements in some major units of the earth’s crust. Geol. Soc. Am. Bull. 1961, 72, 175–192. [Google Scholar] [CrossRef]
- Liaghati, T.; Preda, M.; Cox, M. Heavy metal distribution and controlling factors within coastal plain sediments, bells creek catchments, Southeast Queensland, Australia. Environ. Int. 2003, 29, 935–948. [Google Scholar] [CrossRef]
- Abdel Ghani, S.A. Trace metals in seawater, sediments and some fish species from Marsa Matrouh Beaches in north-western Mediterranean coast, Egypt. Egypt. J. Aquat. Res. 2015, 41, 145–154. [Google Scholar] [CrossRef] [Green Version]
- Hakanson, L. An ecological risk index for aquatic pollution control. A sedimentological approach. Water Res. 1980, 14, 975–1001. [Google Scholar] [CrossRef]
- Hammer, Ø.; Harper, D.A.T.; Ryan, P.D. PAST: Paleontological statistics software package for education and data analysis. Palaeontol. Electron. 2001, 4, 1–9. [Google Scholar]
- Dehghan-Madiseh, S.; Savari, A.; Parham, H.; Marmmazy, J.; Papahn, F.; Sabzalizadeh, S. Heavy metals contaminant evaluation of Khour-e-Musa creeks., northwest of Persian Gulf. Iran. J. Fish. Sci. 2008, 7, 137–156. [Google Scholar]
- Sulaiman, M.B.; Salawu, K.; Barambu, A.U. Assessment of Concentrations and Ecological Risk of Heavy Metals at Resident and Remediated Soils of Uncontrolled Mining Site at Dareta Village, Zamfara, Nigeria. J. Appl. Sci. Environ. Manag. 2019, 23, 187–193. [Google Scholar] [CrossRef]
- Van Bentum, K.M. Lagos Coast: Investigation of the Long-Term Morphological Impact of the Eko Atlantic City Project. Master’s Thesis, Delft University of Technology, Delft, The Netherlands, 2012; 223p. [Google Scholar]
- Onyena, A.P.; Okoro, C.A. Spatio-temporal variations in water and sediment parameters of Abule Agege, Abule Eledu, Ogbe, creeks adjoining Lagos Lagoon, Nigeria. J. Ecol. Nat. Environ. 2019, 11, 46–54. [Google Scholar] [CrossRef]
- Brady, J.P.; Ayoko, G.A.; Martens, W.N.; Goonetilleke, A. Development of a hybrid pollution index for heavy metals in marine and estuarine sediments. Environ. Monit. Assess. 2015, 187, 306. [Google Scholar] [CrossRef] [Green Version]
- Mennilo, E.; Adeogun, A.; Arukwe, A. Quality screening of the Lagos lagoon sediment by assessing the cytotoxicity and toxicological responses of rat hepatoma H4IIE and fish PLHC-1 cell-lines using different extraction approaches. Environ. Res. 2020, 182, 108986. [Google Scholar] [CrossRef]
- Don-Pedro, K.N.; Oyewo, E.O.; Otitoloju, A.A. Trend of heavy metal concentrations in Lagos Lagoon ecosystem, Nigeria. West Afr. J. Appl. Ecol. 2004, 5, 103–114. [Google Scholar] [CrossRef]
- Bawa-Allah, K.A.; Saliu, J.K.; Otitoloju, A.A. Heavy Metal Pollution Monitoring in Vulnerable Ecosystems: A Case Study of the Lagos Lagoon, Nigeria. Bull. Environ. Contam. Toxicol. 2018, 100, 609–613. [Google Scholar] [CrossRef]
- Martínez-Colón, M.; Hallock, P.; Green-Ruíz, C. Strategies for using shallow-water benthic foraminifers as bioindicators of potentially toxic elements: A review. J. Foraminifer. Res. 2009, 39, 278–299. [Google Scholar] [CrossRef]
- Martins, M.V.A.; Hohenegger, J.; Martínez-Colón, M.; Frontalini, F.; Bergamashi, S.; Laut, L.; Belart, P.; Mahiques, M.; Pereira, E.; Rodrigues, R.; et al. Ecological quality status of the NE sector of the Guanabara Bay (Brazil): A case of living benthic foraminiferal resilience. Mar. Pollut. Bull. 2020, 158, 111449. [Google Scholar] [CrossRef]
- Hassani, S.; Karbassi, A.R.; Ardestani, M. Role of estuarine natural flocculation process in removal of Cu, Mn, Ni, Pb and Zn. Glob. J. Environ. Sci. Manag. 2017, 3, 187–196. [Google Scholar]
- Frontalini, F.; Buosi, C.; Da Pelo, S.; Coccioni, R.; Cherchi, A.; Bucci, C. Benthic foraminifera as bio-indicators of trace element pollution in the heavily contaminated Santa Gilla lagoon (Cagliari, Italy). Mar. Pollut. Bull. 2009, 58, 858–877. [Google Scholar] [CrossRef]
- Shaheen, S.M.; Abdelrazek, M.A.S.; Elthoth, M.; Moghanm, F.S.; Mohamed, R.; Hamza, A.; El-Habashi, N.; Wang, J.; Rinklebe, J. Potentially toxic elements in saltmarsh sediments and common reed (Phragmites australis) of Burullus coastal lagoon at North Nile Delta, Egypt: A survey and risk assessment. Sci. Total Environ. 2019, 649, 1237–1249. [Google Scholar] [CrossRef]
- Peters, G.M.; Maher, W.A.; Barford, J.P.; Gomes, V.G. Selenium associations in estuarine sediments: Redox effects. Water Air Soil Pollut. 1997, 99, 275–282. [Google Scholar] [CrossRef]
- Owoade, O.K.; Olise, F.S.; Obioh, I.B.; Olaniyi, H.B.; Ferrero, L.; Bolzacchini, E. EDXRF elemental assay of airborne particulates: A case study of an iron and steel smelting industry, Lagos, Nigeria. Sci. Res. Essay 2009, 4, 1342–1347. [Google Scholar]
- Olatunji, A.S.; Kolawole, T.O.; Oloruntola, M.; Günter, G. Evaluation of pollution of soils and particulate matter around metal recycling factories in southwestern Nigeria. J. Health Pollut. 2018, 8, 20–30. [Google Scholar] [CrossRef] [Green Version]
- Anderson, C.S. Mineral Yearbook. Selenium and Tellurium. Advanced Release; 2016; pp. 1–9. Available online: https://www.usgs.gov/centers/national-minerals-information-center/selenium-and-tellurium-statistics-and-information (accessed on 23 November 2021).
- May, T.W.; Fairchild, J.F.; Petty, J.D.; Walther, M.J.; Lucero, J.; Delvaux, M.; Manring, J.; Armbruster, M. An evaluation of selenium concentrations in water, sediment, invertebrates, and fish from the Solomon River Basin. Environ. Monit. Assess. 2008, 137, 213–232. [Google Scholar] [CrossRef] [Green Version]
- Lemly, A.D. Interpreting selenium concentrations. In Selenium Assessment in Aquatic Ecosystems: A Guide for Hazard Evaluation and Water Quality Criteria; Alexander, D.E., Ed.; Springer: Berlin/Heidelberg, Germany, 2002; pp. 18–38. [Google Scholar]
- Lemly, A.D. Toxicology of selenium in a freshwater reservoir: Implications for environmental hazard evaluation and safety. Ecotoxicol. Environ. Saf. 1985, 10, 314–338. [Google Scholar] [CrossRef]
- Overah, C.L.; Iwegbue, C.M.A.; Ossai, E.K.; Nwajei, G.E. Trace elements in sediments of selected gutters and Bar-Beach, Lagos, Nigeria. J. Appl. Sci. Environ. Manag. 2012, 16, 253–255. [Google Scholar]
- El Baz, S.M.; Khalil, M.M. Benthic foraminifera and trace metal distribution: A case study from the Burullus Lagoon, Egypt. Rev. Micropaléontol. 2018, 61, 97–109. [Google Scholar] [CrossRef]
- Elshanawany, R.; Ibrahim, M.I.; Milker, Y.; Schmiedl, G.; Badr, N.; Kholeif, S.E.A.; Zonneveld, K.A.F. Anthropogenic impact on benthic foraminifera, Abu-Qir Bay, Alexandria, Egypt. J. Foraminifer. Res. 2011, 41, 326–348. [Google Scholar] [CrossRef]
- Ferraro, L.; Sprovieri, M.; Alberico, I.; Lirer, F.; Prevedello, L.; Marsella, E. Benthic foraminifera and heavy metals distribution: A case study from the Naples Harbour (Tyrrhenian Sea, Southern Italy). Environ. Pollut. 2006, 142, 274–287. [Google Scholar] [CrossRef]
- Martínez-Colón, M.; Hallock, P.; Green-Ruíz, C.; Smoak, J.M. Temporal variability in potentially toxic elements (PTE’s) and benthic Foraminifera in an estuarine environment in Puerto Rico. Micropaleontology 2017, 63, 357–381. [Google Scholar]
- Murray, J.W. Ecology and Applications of Benthic Foraminifera; Cambridge University Press: Cambridge, UK; New York, NY, USA; Melbourne, Australia, 2006. [Google Scholar]
- Langer, M.R.; Lipps, J.H. Foraminiferal distribution and diversity, Madang reef and lagoon, Papua New Guinea. Coral Reefs 2003, 22, 143–154. [Google Scholar] [CrossRef]
- Sariaslan, N.; Langer, M.R. Atypical, high-diversity assemblages of foraminifera in a mangrove estuary in northern Brazil. Biogeosciences 2021, 18, 4073–4090. [Google Scholar] [CrossRef]
- Fajemila, O.T.; Langer, M.R.; Lipps, J.H. Atlas of Shallow-Water Tropical Benthic Foraminifera from Moorea (Society Islands, French Polynesia). Cushman Found. Spec. Publ. 2020, 48, 107. [Google Scholar]
- Fajemila, O.T.; Langer, M.R. Ecosystem indicators: Foraminifera, Thecamoebians and Diatoms from the Ologe Lagoon, Nigeria. Rev. Micropaléontol. 2016, 59, 397–407. [Google Scholar] [CrossRef]
- Langer, M.R.; Mouanga, G.H.; Fajemila, O.T. Shallow-water nearshore benthic foraminifera assemblages from Gabon. Micropaleontology 2016, 62, 69–80. [Google Scholar]
- Langer, M.R.; Fajemila, O.T.; Mannl, S. Assemblages of recent intertidal mangrove foraminifera from the Akanda National Park, Gabon: Sea level proxies preserved in faunal assemblages. Neues Jahrb. Geol. Paläontol. Abh. 2016, 281, 327–338. [Google Scholar] [CrossRef]
- Debenay, J.P. Recent foraminiferal assemblages and their distribution relative to environmental stress in the paralic environments of west African (Cape Timiris to Ebrie Lagoon). J. Foraminifer. Res. 1990, 20, 267–282. [Google Scholar] [CrossRef]
- Hayward, B.W.; Holzmann, M.; Pawlowski, J.; Parker, J.H.; Kaushik, T.; Toyofuku, M.S.; Tsuchiya, M. Molecular and morphological taxonomy of living Ammonia and related taxa (Foraminifera) and their biogeography. Micropaleontology 2021, 67, 109–313. [Google Scholar]
- Langer, M.R.; Lipps, J.H. Assembly and persistence of foraminifera in introduced Mangroves on Moorea, French Polynesia. Micropaleontology 2006, 52, 343–355. [Google Scholar] [CrossRef]
- Lipps, J.H.; Langer, M.R. Benthic foraminifera from the meromictic Mecherchar Jellyfish Lake, Palau (western Pacific). Micropaleontology 1999, 45, 278–284. [Google Scholar] [CrossRef]
- Le Cadre, V.; Debenay, J.-P.; Lesourd, M. Low pH effects on Ammonia beccarii test deformation: Implications for using test deformation as a pollution indicator. J. Foraminifer. Res. 2003, 33, 1–9. [Google Scholar] [CrossRef]
- Pettit, L.R.; Hart, M.B.; Medina-Sánchez, A.N.; Smart, C.W.; Rodolfo-Metalpa, R.; Hall-Spencer, J.M.; Prol-Ledesma, R.M. Benthic foraminifera show some resilience to ocean acidification in the northern Gulf of California, Mexico. Mar. Pollut. Bull. 2013, 73, 452–462. [Google Scholar] [CrossRef] [Green Version]
- Dias, B.; Hart, M.; Smart, C.; Hall-Spencer, J. Modern seawater acidification: The response of foraminifera to high-CO2 conditions in the Mediterranean Sea. J. Geol. Soc. 2010, 167, 843–846. [Google Scholar] [CrossRef] [Green Version]
- Bergin, F.; Kucuksezgin, F.; Uluturhan, E.; Barut, I.F.; Meric, E.; Avsar, N.; Nazik, A. The response of benthic foraminifera and ostracoda to heavy metal pollution in Gulf of Izmir (Eastern Aegean Sea). Estuar. Coast. Shelf Sci. 2006, 66, 368–386. [Google Scholar] [CrossRef]
- Schintu, M.; Marrucci, A.; Marras, B.; Galgani, F.; Buosi, C.; Ibba, A.; Cherchi, A. Heavy metal accumulation in surface sediments at the port of Cagliari (Sardinia, western Mediterranean): Environmental assessment using sequential extraction and benthic foraminifera. Mar. Pollut. Bull. 2016, 111, 45–56. [Google Scholar] [CrossRef]
- Alve, E. Benthic foraminifera response to estuarine pollution: A review. J. Foraminifer. Res. 1995, 25, 190–203. [Google Scholar] [CrossRef]
- Yanko, V.; Ahmad, A.; Bresler, V. Morphological deformities of benthic foraminiferal tests in response to pollution by heavy metals: Implications for pollution monitoring. J. Foraminifer. Res. 1998, 28, 177–200. [Google Scholar]
- Brouillette Price, E.; Kabengi, N.; Goldstein, S.T. Effects of heavy-metal contaminants (Cd, Pb, Zn) on benthic foraminiferal assemblages grown from propagules, Sapelo Island, Georgia (USA). Mar. Micropaleontol. 2019, 147, 1–11. [Google Scholar] [CrossRef]
- Smith, C.W.; Goldstein, S.T. The Effects of Selected Heavy Metal Elements (Arsenic, Cadmium, Nickel, Zinc) On Experimentally Grown Foraminiferal Assemblages from Sapelo Island, Georgia and Little Duck Key, Florida, U.S.A. J. Foraminifer. Res. 2019, 49, 303–317. [Google Scholar] [CrossRef]
- Smith, C.W.; Goldstein, S.T. Effects of Varied Temperature and Salinity on Assemblages of Foraminifera Grown with Exposure to Heavy-Metal Pollutants (Nickel and Zinc). J. Foraminifer. Res. 2021, 51, 99–114. [Google Scholar]
- Armynot du Chatelet, E.; Gebhardt, K.; Langer, M.R. Coastal pollution monitoring: Foraminifera as tracers of environmental perturbation in the port of Boulogne-sur-Mer (Northern France). Neues Jahrb. Geol. Paläontol. Abh. 2011, 262, 91–116. [Google Scholar] [CrossRef]
- Alani, R.; Drouillard, K.; Olayinka, K.; Alo, B. Bioaccumulation of organochlorine pesticide residues in fish and invertebrates of Lagos Lagoon, Nigeria. Am. J. Sci. Ind. Res. 2013, 4, 22–30. [Google Scholar] [CrossRef]
- Benson, N.U.; Fred-Ahmadu, O.H.; Ekett, S.I.; Basil, M.O.; Adebowale, A.D.; Adewale, A.G.; Ayejuyo, O.O. Occurrence, depth distribution and risk assessment of PAHs and PCBs in sediment cores of Lagos lagoon, Nigeria. Reg. Stud. Mar. Sci. 2020, 37, 101335. [Google Scholar] [CrossRef]


| Qualification | Contamination Factor | Enrichment Factor | Ecological Risk Index |
|---|---|---|---|
| Unpolluted/Slightly | CF < 1 | EF < 2 | <150 (low) |
| Moderately | 1 < CF < 3 | 2 < EF < 5 | 150 < RI < 300 (moderate) |
| Severely | 3 < CF < 6 | 5 < EF < 20 | 300 < RI < 600 (considerable) |
| High | CF > 6 | 20 < EF < 40 | RI > 600 (very high) |
| Extreme | - | EF > 40 | - |
| Station # | Depth (m) | pH | Temp (°C) | TOC (%) | CaCO3 (%) | Mud (%) | Φ |
|---|---|---|---|---|---|---|---|
| 1 | 13 | 6.9 | 29.8 | 0.86 | 2.01 | 0.18 | 2 |
| 2 | 12 | 6.8 | 29.2 | 0.51 | 0.93 | 0.22 | 2 |
| 3 | 13 | 6.5 | 29.1 | 2.05 | 3.87 | 22.96 | 2 |
| 4 | 10 | 6.4 | 29.0 | 1.94 | 86.16 | 20.55 | 2 |
| 5 | 5 | 6.9 | 29.2 | 7.91 | 6.31 | 84.53 | >4 |
| 6 | 7.5 | 6.6 | 29.2 | 9.38 | 10.90 | 72.38 | >4 |
| 7 | 3 | 6.6 | 27.5 | 4.79 | 10.01 | 44.51 | 4 |
| 8 | 4 | 6.5 | 27.3 | 0.76 | 2.27 | 0.00 | 1 |
| 9 | 6 | 6.5 | 26.2 | 0.32 | 2.96 | 0.17 | 1 |
| 10 | 7 | 6.6 | 27.8 | 6.31 | 5.76 | 63.27 | >4 |
| 11 | 7 | 6.4 | 27.7 | 6.55 | 6.17 | 74.75 | >4 |
| 12 | 3 | 6.7 | 26.8 | 0.43 | 0.44 | 0 | 3 |
| 13 | 4 | 6.8 | 26.7 | 1.68 | 0.55 | 0 | 3 |
| 14 | 12 | 6.5 | 27.7 | 1.78 | 1.60 | 0.22 | 2 |
| 15 | 12 | 5.8 | 26.3 | 1.38 | 1.50 | 12 | 2 |
| 16 | 5 | 6.8 | 25.9 | 3.25 | 2.85 | 0 | 1 |
| 17 | 4 | 6.7 | 25.1 | 5.25 | 6.23 | 0.12 | 2 |
| 18 | 3 | 6.8 | 24.5 | 4.46 | 6.07 | 0.16 | 1 |
| 19 | 4 | 6.7 | 24.9 | 2.18 | 6.43 | 0.18 | 2 |
| 20 | 3 | 6.8 | 24.1 | 4.44 | 3.01 | 0 | 2 |
| 21 | 3 | 6.6 | 24.2 | 2.74 | 1.16 | 0 | 2 |
| 22 | 3 | 6.8 | 25.1 | 8.52 | 20.32 | 1.74 | 2 |
| 23 | 4 | 6.6 | 24.3 | 11.09 | 6.88 | 60.47 | 4 |
| 24 | 2 | 6.5 | 24.3 | 14.79 | 5.03 | 32.69 | 3 |
| 25 | 3 | 6.8 | 24.5 | 21.63 | 8.24 | N/D | |
| 26 | 5 | 6.7 | 24.2 | 16.05 | 5.69 | 60.78 | 4 |
| PTEs | S | D | H(S) | FN | A | B | C | AGL | P | HP | %TOC | %CaCO3 | %Mud |
|---|---|---|---|---|---|---|---|---|---|---|---|---|---|
| CrF2 | −0.07 | −0.03 | 0.00 | 0.16 | −0.30 | 0.28 | 0.52 | 0.33 | −0.36 | 0.27 | −0.13 | 0.33 | |
| CrF3 | 0.11 | −0.01 | 0.04 | 0.23 | −0.15 | 0.17 | 0.41 | 0.21 | −0.17 | 0.42 | 0.26 | 0.57 | |
| CrF4 | −0.11 | 0.38 | −0.33 | 0.55 | −0.17 | 0.66 | 0.69 | 0.40 | −0.41 | 0.82 | 0.40 | 0.62 | |
| Crtotal | 0.08 | 0.03 | 0.00 | 0.27 | −0.17 | 0.25 | 0.49 | 0.24 | −0.21 | 0.52 | 0.29 | 0.63 | |
| CoF1 | −0.13 | −0.06 | 0.00 | 0.08 | −0.41 | 0.23 | 0.47 | 0.12 | −0.13 | 0.47 | 0.17 | 0.58 | |
| CoF2 | −0.27 | 0.46 | −0.44 | 0.60 | −0.25 | 0.63 | 0.69 | 0.46 | −0.47 | 0.66 | 0.36 | 0.65 | |
| CoF3 | −0.20 | 0.62 | −0.51 | 0.77 | −0.16 | 0.68 | 0.68 | 0.61 | −0.59 | 0.66 | 0.51 | 0.57 | |
| CoF4 | −0.21 | 0.64 | −0.53 | 0.75 | −0.05 | 0.71 | 0.74 | 0.42 | −0.43 | 0.75 | 0.58 | 0.74 | |
| Cototal | −0.25 | 0.65 | −0.56 | 0.77 | −0.14 | 0.70 | 0.71 | 0.58 | −0.56 | 0.72 | 0.56 | 0.65 | |
| CuF1 | 0.04 | −0.40 | 0.31 | −0.35 | −0.08 | −0.33 | −0.13 | −0.29 | 0.28 | −0.33 | −0.24 | −0.17 | |
| CuF2 | −0.03 | −0.10 | 0.08 | 0.29 | −0.34 | 0.34 | 0.65 | 0.44 | −0.44 | 0.23 | −0.30 | 0.17 | |
| CuF3 | 0.15 | 0.08 | −0.03 | 0.33 | −0.33 | 0.45 | 0.21 | 0.39 | −0.42 | 0.19 | 0.02 | 0.06 | |
| CuF4 | −0.16 | 0.43 | −0.38 | 0.59 | −0.16 | 0.60 | 0.68 | 0.37 | −0.39 | 0.71 | 0.41 | 0.71 | |
| Cutotal | −0.12 | 0.37 | −0.33 | 0.58 | −0.23 | 0.61 | 0.68 | 0.40 | −0.42 | 0.62 | 0.31 | 0.66 | |
| NiF2 | −0.24 | 0.18 | −0.21 | 0.14 | 0.19 | 0.09 | 0.32 | −0.15 | 0.19 | 0.52 | 0.33 | 0.37 | |
| NiF3 | −0.16 | 0.47 | −0.39 | 0.65 | −0.09 | 0.58 | 0.71 | 0.39 | −0.37 | 0.76 | 0.63 | 0.76 | |
| NiF4 | −0.22 | 0.58 | −0.50 | 0.69 | −0.01 | 0.70 | 0.77 | 0.34 | −0.35 | 0.82 | 0.57 | 0.79 | |
| Nitotal | −0.19 | 0.53 | −0.45 | 0.68 | −0.04 | 0.61 | 0.73 | 0.36 | −0.35 | 0.80 | 0.64 | 0.78 | |
| PbF2 | −0.19 | −0.03 | −0.08 | −0.13 | −0.27 | −0.08 | 0.08 | 0.15 | −0.16 | −0.10 | −0.27 | 0.13 | |
| PbF3 | −0.19 | 0.56 | −0.48 | 0.68 | −0.15 | 0.63 | 0.56 | 0.65 | −0.60 | 0.75 | 0.32 | 0.45 | |
| PbF4 | −0.01 | −0.28 | 0.18 | −0.69 | 0.35 | −0.74 | −0.85 | −0.61 | 0.63 | −0.72 | −0.19 | −0.82 | |
| Pbtotal | −0.21 | 0.48 | −0.44 | 0.58 | −0.18 | 0.54 | 0.52 | 0.58 | −0.54 | 0.68 | 0.28 | 0.44 | |
| SeF1 | 0.21 | −0.08 | 0.12 | 0.13 | 0.23 | 0.08 | −0.09 | −0.16 | 0.09 | 0.07 | 0.23 | −0.09 | |
| SeF2 | −0.27 | 0.07 | −0.17 | −0.22 | −0.15 | −0.12 | −0.11 | 0.25 | −0.29 | −0.11 | −0.19 | −0.15 | |
| SeF3 | 0.06 | −0.35 | 0.29 | −0.64 | 0.12 | −0.58 | −0.84 | −0.45 | 0.46 | −0.58 | −0.37 | −0.62 | |
| Setotal | 0.04 | −0.36 | 0.28 | −0.65 | 0.09 | −0.59 | −0.84 | −0.42 | 0.42 | −0.60 | −0.40 | −0.63 | |
| AlF1 | 0.03 | 0.01 | 0.00 | 0.08 | 0.14 | −0.08 | 0.09 | −0.05 | 0.07 | 0.18 | 0.46 | 0.50 | |
| AlF2 | 0.15 | −0.07 | 0.12 | 0.26 | 0.13 | 0.15 | 0.41 | 0.28 | −0.27 | 0.10 | 0.06 | 0.18 | |
| AlF3 | −0.20 | 0.04 | −0.12 | 0.11 | −0.12 | 0.10 | 0.08 | 0.26 | −0.22 | 0.33 | −0.26 | −0.02 | |
| AlF4 | −0.10 | 0.50 | −0.39 | 0.77 | −0.17 | 0.80 | 0.75 | 0.50 | −0.52 | 0.80 | 0.37 | 0.69 | |
| Altotal | −0.11 | 0.49 | −0.39 | 0.77 | −0.17 | 0.79 | 0.72 | 0.51 | −0.53 | 0.82 | 0.34 | 0.68 | |
| FeF1 | −0.14 | 0.13 | −0.16 | 0.16 | −0.18 | 0.09 | 0.20 | 0.23 | −0.19 | 0.32 | 0.25 | 0.54 | |
| FeF2 | −0.29 | 0.23 | −0.30 | 0.20 | −0.11 | 0.26 | 0.48 | 0.29 | −0.25 | 0.28 | 0.07 | 0.19 | |
| FeF3 | −0.16 | 0.48 | −0.40 | 0.68 | −0.08 | 0.61 | 0.82 | 0.51 | −0.50 | 0.69 | 0.42 | 0.63 | |
| FeF4 | −0.11 | 0.54 | −0.45 | 0.77 | −0.19 | 0.82 | 0.78 | 0.50 | −0.53 | 0.86 | 0.47 | 0.79 | |
| Fetotal | −0.16 | 0.54 | −0.46 | 0.73 | −0.10 | 0.69 | 0.82 | 0.53 | −0.52 | 0.76 | 0.48 | 0.71 | |
| ZnF1 | 0.01 | −0.15 | 0.12 | 0.07 | −0.18 | 0.09 | 0.36 | 0.06 | −0.04 | 0.40 | 0.03 | 0.52 | |
| ZnF2 | 0.03 | 0.18 | −0.12 | 0.41 | −0.24 | 0.38 | 0.13 | 0.21 | −0.25 | 0.43 | 0.27 | 0.51 | |
| ZnF3 | −0.21 | 0.52 | −0.44 | 0.70 | −0.22 | 0.64 | 0.68 | 0.59 | −0.57 | 0.80 | 0.45 | 0.69 | |
| ZnF4 | −0.08 | 0.49 | −0.38 | 0.76 | −0.16 | 0.68 | 0.78 | 0.48 | −0.50 | 0.72 | 0.44 | 0.73 | |
| Zntotal | −0.15 | 0.49 | −0.40 | 0.74 | −0.24 | 0.68 | 0.74 | 0.57 | −0.57 | 0.77 | 0.43 | 0.74 | |
| %TOC | −0.23 | 0.55 | −0.48 | 0.67 | −0.17 | 0.72 | 0.67 | 0.48 | −0.49 | −0.46 | |||
| %CaCO3 | −0.25 | 0.58 | −0.52 | 0.40 | 0.23 | 0.29 | 0.32 | 0.05 | −0.47 | −0.02 | |||
| %Mud | −0.08 | 0.27 | −0.22 | 0.50 | −0.15 | 0.53 | 0.73 | 0.27 | −0.31 | −0.29 | |||
| AGL | −0.06 | 0.40 | −0.30 | 0.59 | |||||||||
| P | 0.60 | −0.74 | 0.77 | −0.33 | |||||||||
| HP | 0.04 | −0.39 | 0.29 | −0.61 |
| Sample Stations | Contamination Factor (CF) | Enrichment Factor (EF) | Ecological Risk Factors (Er) | RI | |||||||||||||||||||||||
|---|---|---|---|---|---|---|---|---|---|---|---|---|---|---|---|---|---|---|---|---|---|---|---|---|---|---|---|
| Cr | Co | Cu | Ni | Pb | Se | Zn | Al | Fe | Cr | Co | Cu | Ni | Pb | Se | Zn | Fe | Cr | Co | Cu | Ni | Pb | Se | Zn | Al | Fe | ||
| St 1 | 0.1 | 0.0 | 0.0 | 0.0 | 0.3 | 142.3 | 0.1 | 0.0 | 0.0 | 24.8 | 15.1 | 18.3 | 4.7 | 141.6 | 59,160.3 | 48.5 | 9.9 | 0.1 | 0.0 | 0.2 | 0.0 | 1.7 | 142.3 | 0.1 | 0.0 | 0.0 | 144.4 |
| St 2 | 0.0 | 0.0 | 0.0 | 0.0 | 0.2 | 166.2 | 0.2 | 0.0 | 0.0 | 6.9 | 5.2 | 9.7 | 4.4 | 47.2 | 43,916.1 | 57.4 | 10.1 | 0.1 | 0.0 | 0.2 | 0.0 | 0.9 | 166.2 | 0.2 | 0.0 | 0.0 | 167.6 |
| St 3 | 0.0 | 0.1 | 0.1 | 0.0 | 0.2 | 158.9 | 0.1 | 0.0 | 0.1 | 9.4 | 23.7 | 21.0 | 9.5 | 43.9 | 39,698.2 | 34.3 | 19.8 | 0.1 | 0.1 | 0.4 | 0.0 | 0.9 | 158.9 | 0.1 | 0.0 | 0.1 | 160.6 |
| St 4 | 0.1 | 0.3 | 0.0 | 0.1 | 0.4 | 126.0 | 0.3 | 0.0 | 0.2 | 9.1 | 44.3 | 7.4 | 10.6 | 53.5 | 19,102.9 | 41.9 | 23.9 | 0.1 | 0.3 | 0.2 | 0.1 | 1.8 | 126.0 | 0.3 | 0.0 | 0.2 | 129.0 |
| St 5 | 1.1 | 0.5 | 0.1 | 0.1 | 0.8 | 66.4 | 0.9 | 0.0 | 0.3 | 88.3 | 44.1 | 9.0 | 7.9 | 66.0 | 5473.4 | 75.2 | 26.9 | 2.1 | 0.5 | 0.5 | 0.1 | 4.0 | 66.4 | 0.9 | 0.0 | 0.3 | 74.8 |
| St 6 | 0.7 | 0.5 | 0.2 | 0.2 | 0.7 | 114.4 | 1.2 | 0.0 | 0.2 | 62.5 | 49.0 | 19.4 | 17.9 | 61.4 | 10,261.0 | 104.4 | 22.1 | 1.4 | 0.5 | 1.1 | 0.2 | 3.4 | 114.4 | 1.2 | 0.0 | 0.2 | 122.4 |
| St 7 | 0.0 | 0.3 | 0.1 | 0.1 | 0.5 | 129.7 | 0.8 | 0.0 | 0.2 | 2.8 | 27.1 | 10.6 | 4.0 | 35.9 | 10,099.7 | 58.5 | 15.8 | 0.1 | 0.3 | 0.7 | 0.1 | 2.3 | 129.7 | 0.8 | 0.0 | 0.2 | 134.2 |
| St 8 | 0.0 | 0.4 | 0.0 | 0.0 | 0.3 | 119.1 | 0.3 | 0.0 | 0.1 | 6.9 | 81.1 | 5.2 | 6.7 | 68.6 | 24,908.0 | 62.6 | 30.9 | 0.1 | 0.4 | 0.1 | 0.0 | 1.6 | 119.1 | 0.3 | 0.0 | 0.1 | 121.7 |
| St 9 | 0.0 | 0.3 | 0.0 | 0.0 | 0.3 | 142.6 | 0.3 | 0.0 | 0.1 | 8.6 | 86.4 | 6.5 | 8.4 | 70.6 | 37,594.9 | 76.2 | 32.3 | 0.1 | 0.3 | 0.1 | 0.0 | 1.3 | 142.6 | 0.3 | 0.0 | 0.1 | 144.8 |
| St 10 | 0.1 | 0.8 | 2.9 | 0.1 | 0.5 | 77.2 | 1.9 | 0.0 | 0.4 | 4.9 | 43.0 | 147.6 | 6.7 | 23.0 | 3932.0 | 98.5 | 19.2 | 0.2 | 0.8 | 14.5 | 0.1 | 2.3 | 77.2 | 1.9 | 0.0 | 0.4 | 97.4 |
| St 11 | 0.1 | 0.8 | 0.1 | 0.1 | 0.6 | 53.0 | 0.7 | 0.0 | 0.4 | 4.3 | 33.5 | 5.8 | 5.2 | 26.0 | 2129.9 | 27.3 | 16.2 | 0.2 | 0.8 | 0.7 | 0.1 | 3.2 | 53.0 | 0.7 | 0.0 | 0.4 | 59.1 |
| St 12 | 0.0 | 0.1 | 0.1 | 0.0 | 0.5 | 160.9 | 0.2 | 0.0 | 0.1 | 9.7 | 37.6 | 23.2 | 2.0 | 132.6 | 42,146.7 | 50.7 | 22.4 | 0.1 | 0.1 | 0.4 | 0.0 | 2.5 | 160.9 | 0.2 | 0.0 | 0.1 | 164.3 |
| St 13 | 0.0 | 0.2 | 0.0 | 0.0 | 0.5 | 162.1 | 0.3 | 0.0 | 0.1 | 7.9 | 35.5 | 5.3 | 3.4 | 93.3 | 33,111.7 | 56.6 | 22.1 | 0.1 | 0.2 | 0.1 | 0.0 | 2.3 | 162.1 | 0.3 | 0.0 | 0.1 | 165.2 |
| St 14 | 0.1 | 0.1 | 0.1 | 0.0 | 0.6 | 201.5 | 0.2 | 0.0 | 0.1 | 7.5 | 10.1 | 8.8 | 2.3 | 77.7 | 27,959.9 | 29.3 | 12.2 | 0.1 | 0.1 | 0.3 | 0.0 | 2.8 | 201.5 | 0.2 | 0.0 | 0.1 | 205.1 |
| St 15 | 0.4 | 0.1 | 0.0 | 0.0 | 0.6 | 189.3 | 0.2 | 0.0 | 0.1 | 64.9 | 17.9 | 7.6 | 3.3 | 93.7 | 32,003.0 | 32.7 | 14.6 | 0.8 | 0.1 | 0.2 | 0.0 | 2.8 | 189.3 | 0.2 | 0.0 | 0.1 | 193.5 |
| St 16 | 0.1 | 0.1 | 0.1 | 0.0 | 0.3 | 161.7 | 0.2 | 0.0 | 0.1 | 9.0 | 19.5 | 9.1 | 6.1 | 45.8 | 22,894.2 | 28.0 | 15.7 | 0.1 | 0.1 | 0.3 | 0.0 | 1.6 | 161.7 | 0.2 | 0.0 | 0.1 | 164.1 |
| St 17 | 0.0 | 0.2 | 0.0 | 0.0 | 0.5 | 150.2 | 0.2 | 0.0 | 0.1 | 7.0 | 29.6 | 5.6 | 3.0 | 82.7 | 24,514.2 | 40.0 | 18.9 | 0.1 | 0.2 | 0.2 | 0.0 | 2.5 | 150.2 | 0.2 | 0.0 | 0.1 | 153.5 |
| St 18 | 0.1 | 0.3 | 0.1 | 0.1 | 0.5 | 135.7 | 0.3 | 0.0 | 0.2 | 5.0 | 26.6 | 7.3 | 5.9 | 41.9 | 12,578.6 | 27.7 | 15.2 | 0.1 | 0.3 | 0.4 | 0.1 | 2.3 | 135.7 | 0.3 | 0.0 | 0.2 | 139.4 |
| St 19 | 0.0 | 0.3 | 0.1 | 0.0 | 0.4 | 125.0 | 0.3 | 0.0 | 0.2 | 6.1 | 32.5 | 6.7 | 5.8 | 52.3 | 15,980.6 | 40.5 | 21.2 | 0.1 | 0.3 | 0.3 | 0.0 | 2.0 | 125.0 | 0.3 | 0.0 | 0.2 | 128.2 |
| St 20 | 0.0 | 0.1 | 0.0 | 0.0 | 0.4 | 186.0 | 0.2 | 0.0 | 0.1 | 6.6 | 18.8 | 8.1 | 3.2 | 78.2 | 39,514.4 | 41.3 | 14.1 | 0.1 | 0.1 | 0.2 | 0.0 | 1.8 | 186.0 | 0.2 | 0.0 | 0.1 | 188.5 |
| St 21 | 0.0 | 0.1 | 0.1 | 0.0 | 0.4 | 120.6 | 0.2 | 0.0 | 0.1 | 5.0 | 15.7 | 6.7 | 4.3 | 43.3 | 14,483.3 | 28.9 | 17.4 | 0.1 | 0.1 | 0.3 | 0.0 | 1.8 | 120.6 | 0.2 | 0.0 | 0.1 | 123.2 |
| St 22 | 0.1 | 0.6 | 0.2 | 0.1 | 0.7 | 114.9 | 0.5 | 0.0 | 0.2 | 10.1 | 43.4 | 14.4 | 6.0 | 49.5 | 7740.7 | 35.7 | 15.1 | 0.3 | 0.6 | 1.1 | 0.1 | 3.7 | 114.9 | 0.5 | 0.0 | 0.2 | 121.4 |
| St 23 | 0.1 | 0.5 | 0.3 | 0.1 | 0.5 | 116.6 | 0.6 | 0.0 | 0.3 | 4.2 | 21.4 | 9.9 | 4.3 | 21.7 | 4603.6 | 23.8 | 12.2 | 0.2 | 0.5 | 1.3 | 0.1 | 2.7 | 116.6 | 0.6 | 0.0 | 0.3 | 122.3 |
| St 24 | 0.1 | 0.6 | 0.2 | 0.1 | 0.5 | 92.3 | 0.6 | 0.0 | 0.4 | 6.8 | 37.5 | 10.1 | 7.3 | 31.4 | 5563.4 | 35.1 | 21.3 | 0.2 | 0.6 | 0.8 | 0.1 | 2.6 | 92.3 | 0.6 | 0.0 | 0.4 | 97.6 |
| St 25 | 0.1 | 0.7 | 0.2 | 0.1 | 0.7 | 74.7 | 1.2 | 0.0 | 0.5 | 5.8 | 33.0 | 7.4 | 5.4 | 30.0 | 3383.9 | 55.2 | 21.1 | 0.3 | 0.7 | 0.8 | 0.1 | 3.3 | 74.7 | 1.2 | 0.0 | 0.5 | 81.6 |
| St 26 | 0.1 | 0.6 | 0.3 | 0.1 | 0.8 | 120.6 | 1.4 | 0.0 | 0.2 | 3.7 | 16.8 | 8.6 | 2.7 | 21.7 | 3185.9 | 37.7 | 4.0 | 0.3 | 0.6 | 1.6 | 0.1 | 4.1 | 120.6 | 1.4 | 0.0 | 0.2 | 128.9 |
Publisher’s Note: MDPI stays neutral with regard to jurisdictional claims in published maps and institutional affiliations. |
© 2021 by the authors. Licensee MDPI, Basel, Switzerland. This article is an open access article distributed under the terms and conditions of the Creative Commons Attribution (CC BY) license (https://creativecommons.org/licenses/by/4.0/).
Share and Cite
Fajemila, O.T.; Martínez-Colón, M.; Sariaslan, N.; Council, I.S.; Kolawole, T.O.; Langer, M.R. Contamination Levels of Potentially Toxic Elements and Foraminiferal Distribution Patterns in Lagos Lagoon: A Correlation Analysis. Water 2022, 14, 37. https://doi.org/10.3390/w14010037
Fajemila OT, Martínez-Colón M, Sariaslan N, Council IS, Kolawole TO, Langer MR. Contamination Levels of Potentially Toxic Elements and Foraminiferal Distribution Patterns in Lagos Lagoon: A Correlation Analysis. Water. 2022; 14(1):37. https://doi.org/10.3390/w14010037
Chicago/Turabian StyleFajemila, Olugbenga T., Michael Martínez-Colón, Nisan Sariaslan, Ivory S. Council, Tesleem O. Kolawole, and Martin R. Langer. 2022. "Contamination Levels of Potentially Toxic Elements and Foraminiferal Distribution Patterns in Lagos Lagoon: A Correlation Analysis" Water 14, no. 1: 37. https://doi.org/10.3390/w14010037