
Bottom-Pressure Development Due to an Abrupt Slope Reduction at Stepped Spillways


1
Laboratory of Hydraulic Constructions (LCH), Ecole Polytechnique Fédérale de Lausanne (EPFL), CH-1015 Lausanne, Switzerland
2
Faculty of Civil Engineering, K.N. Toosi University of Technology, Tehran 1996715433, Iran
3
CERIS, Instituto Superior Técnico, Universidade de Lisboa, 1049-001 Lisbon, Portugal
4
Civil Engineering Department, Haute Ecole d’Ingénierie et d’Architecture de Fribourg (HEIA-FR, HES-SO), CH-1705 Fribourg, Switzerland
*
Author to whom correspondence should be addressed.
Water 2022, 14(1), 41; https://doi.org/10.3390/w14010041
Submission received: 22 November 2021
/
Revised: 17 December 2021
/
Accepted: 17 December 2021
/
Published: 24 December 2021
(This article belongs to the Special Issue Advances in Spillway Hydraulics: From Theory to Practice)
Abstract
:Fluctuating bottom-pressures on stepped chutes are relevant for the spillway design. An abrupt slope reduction causes a local alteration of the bottom-pressure development. Little information is available regarding the air–water flow properties near an abrupt slope reduction on stepped chutes, particularly on the local pressure evolution. Nevertheless, the option of providing a chute slope reduction may be of interest in spillway layout. The experiments presented herein include pressure distributions on both vertical and horizontal step faces, subsequent to an abrupt slope reduction on stepped chutes. A relatively large-scale physical model including abrupt slope reductions from 50° to 18.6° and from 50° to 30° was used, operated with skimming flow. The data indicate a substantial influence of the tested slope reductions on the bottom-pressure development. In the vicinity of the slope reduction, the mean pressure head near the edge of the horizontal step face reached 0.4 to 0.6 times the velocity head upstream of the slope reduction, for critical flow depths normalized by the step height ranging between 2.6 and 4.6.
1. Introduction
The knowledge of the fluctuating bottom-pressure distribution is important to ensure the structural integrity of smooth and stepped chutes, especially under negative pressures. For stepped chutes with a constant bottom slope, the mean or fluctuating pressures acting on the steps were assessed by several laboratory studies (e.g., [1,2,3,4,5,6,7,8,9,10,11,12,13]). On the horizontal face of the step, a typical S-shape pressure distribution was observed, with maximum pressures occurring at the so-called impact flow region, near the outer edge of the step, whereas minimum pressures were noticed on the upstream half of the step face, due to the boundary separation of the recirculating flow (e.g., [3,4,7,8,11,12,13]). For a given critical flow depth normalized by the step height, the impact region was found to increase with decreasing chute slope [13]. In turn, on the vertical face of the step, distinct pressure profiles were obtained in function of the pressure percentile, generally with negative pressures near the upper edge of the vertical face, for the mean and lower pressure percentiles, and positive pressures near the step corner (e.g., [3]). Empirical dimensionless formulae were developed to estimate the mean and extreme pressure profiles on the horizontal and vertical step faces of a steeply sloping stepped chute (e.g., [3]).
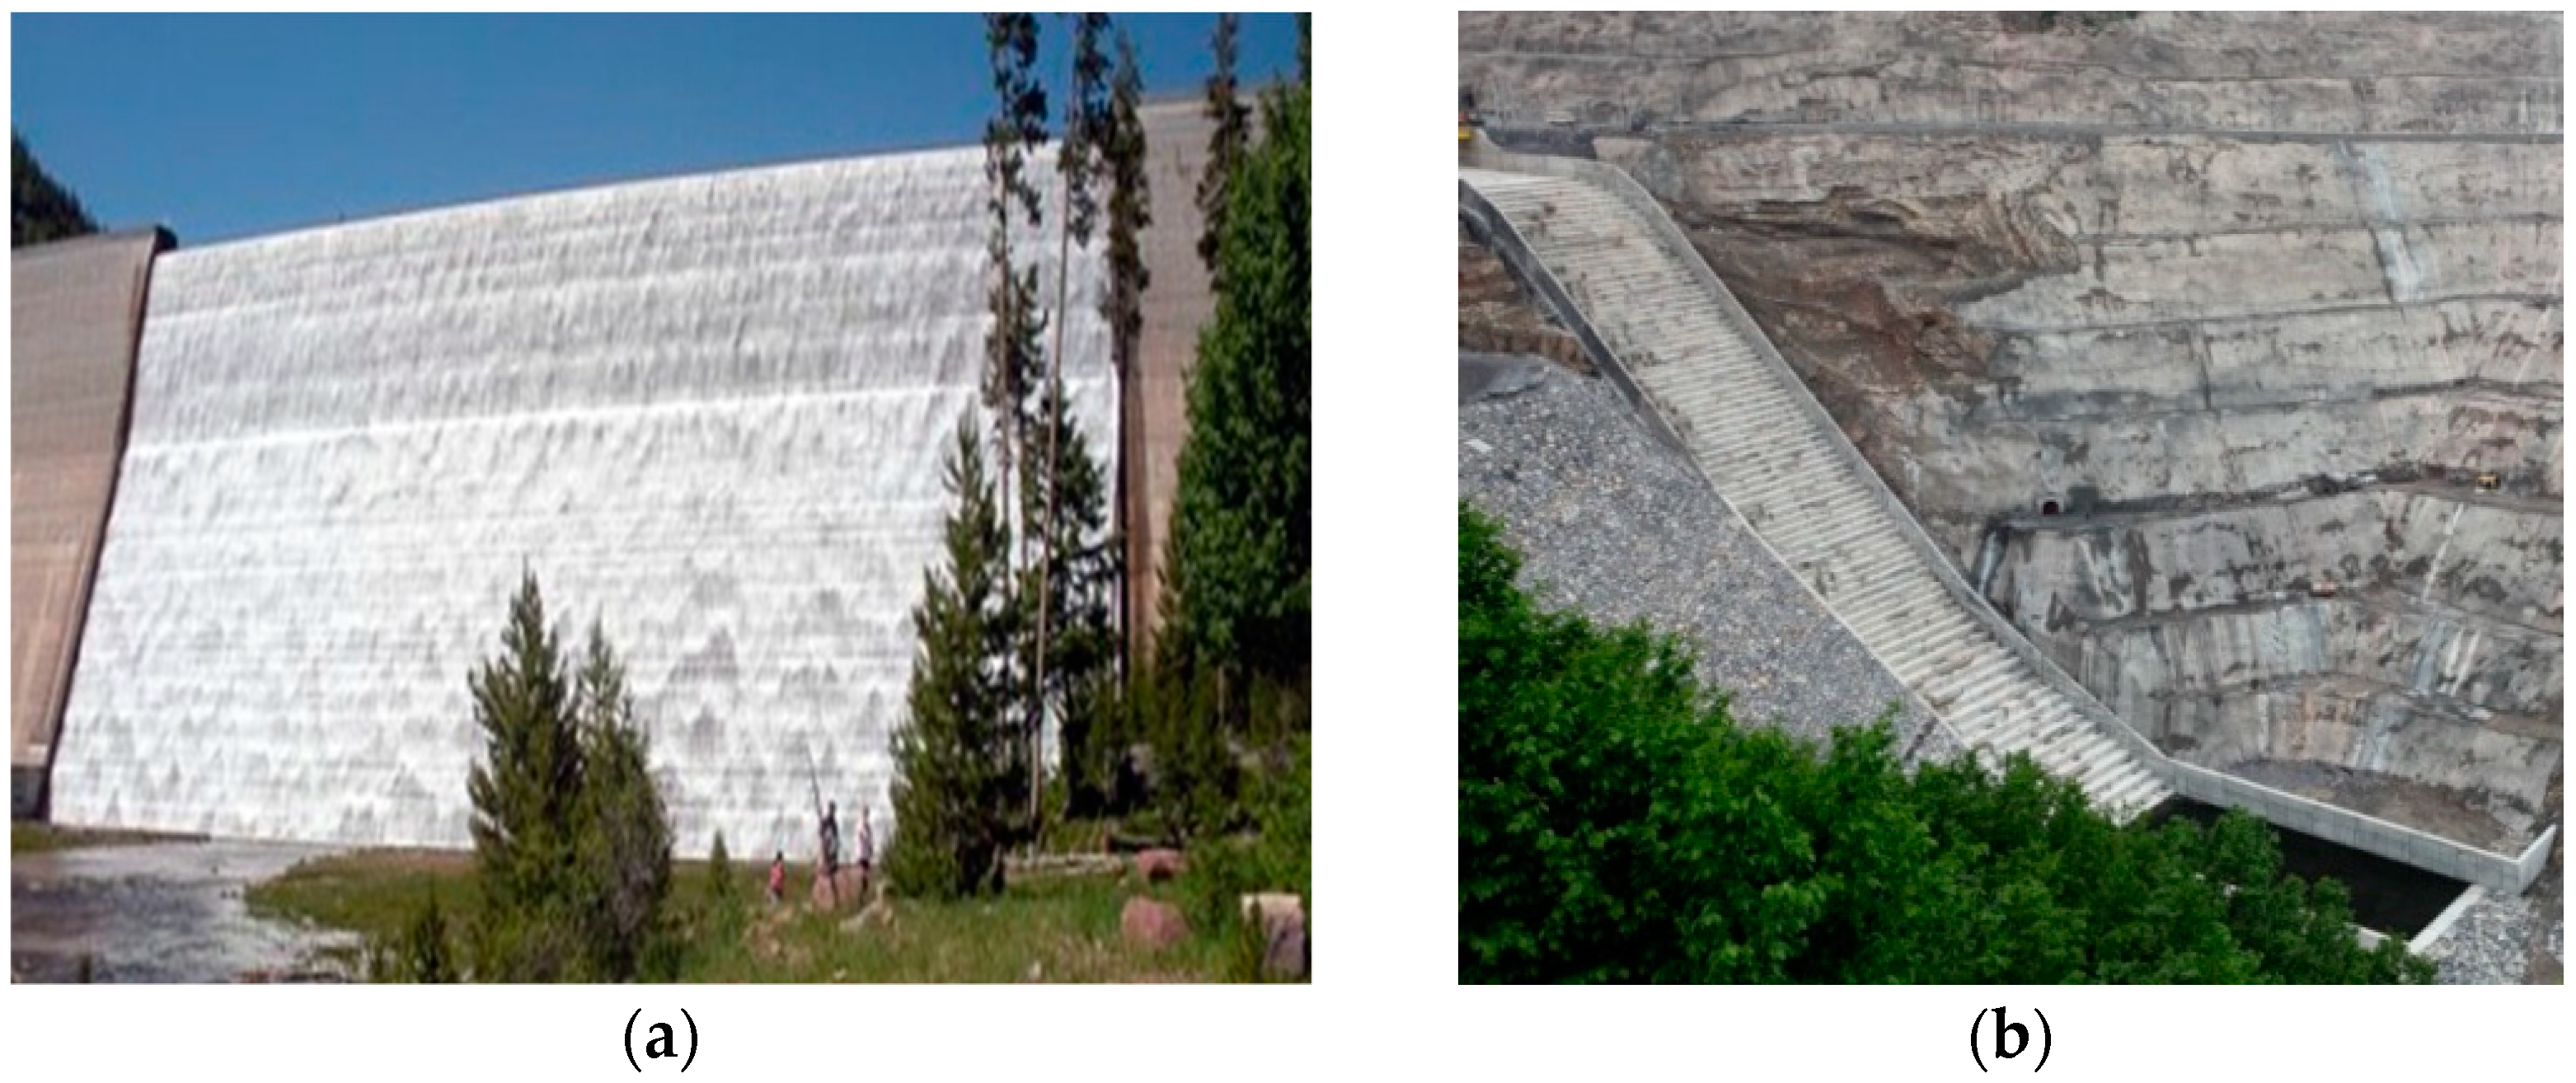
As for smooth chutes, the effect of slope reductions on the bottom-pressure development was addressed by few experimental and numerical studies. A study [14], among others, observed a sudden change in pressure and velocity distributions as the flow passed over an abrupt slope reduction at an aerator–deflector. They reported that a slope reduction of ∆θ = 15° lead to a pressure increase up to 25 times the hydrostatic pressure near the slope reduction. As for stepped chutes, however, no study was published on the local pressure development near slope reductions, to the knowledge of the authors, except for punctual model studies related to projects of stepped chutes incorporating slope reductions (See Figure 1, e.g., Upper Stillwater Dam in Utah, USA [15], Lower Siah-Bishe Dam in northern Iran [16]). In turn, a significant effect of stepped chute slope reduction was observed on the air entrainment and flow depth developments [17].
The present paper follows on from previous work [17] and includes an analysis on the effect of the slope reduction on the bottom-pressure development. Fluctuating pressures were measured systematically along the horizontal and vertical step faces near and far downstream of the slope reduction, in four test runs including 50° to 18.6° (∆θ = 31.4°) and 50° to 30° (∆θ = 20°) slope reductions.
2. Physical Model
The data presented herein were collected on a large-size stepped chute model, incorporating an abrupt slope reduction [18]. It operated at the Laboratory of Hydraulic Constructions (LCH) at Ecole Polytechnique Fédérale de Lausanne (EPFL), and consisted of three separated modules with different slopes. Each module was 4 m long and 0.5 m wide. The upstream module angle from the horizontal (i.e., pseudo-bottom angle) was kept constant with θ1 = 50° whereas the downstream module angle was set either to θ2 = 30° or to 18.6°, similar to characteristic RCC or embankment dam angles. Two abrupt slope reductions of ∆θ = 20° and ∆θ = 31.4° were thus tested. The vertical step height was constant with h = 0.06 m, Figure 2. This step height corresponds to typical prototype values assuming a geometrical scale factor of 1:10 or 1:15.
A jet-box was provided at the channel upstream end to allow for an independent variation of the inflow depth and Froude number [5,19]. Thus, the location of the air entrainment inception was shifted upstream and the developing region of the flow was shortened, in comparison to the typical situation corresponding to an un-gated crest, for identical chute slope, step height and discharge [20]. Hence, gradually varied or quasi-uniform air–water flow was reached upstream of the slope reduction, at least for the tested discharge range, as evidenced by [17].
The test program (Table 1) included skimming flow, with unit discharges 0.20 m2/s ≤ q ≤ 0.47 m2/s (2.6 ≤ dc/h ≤ 4.6, with dc = (q2/g)1/3 as critical flow depth, and g the gravitational acceleration). The Froude (Fo = (Uo/(gdo)1/2), Reynolds (Ro = Uodo/υ), and Weber (Wo = (ρUo2do)/σ) numbers at the jet-box are given in Table 1. Here, do is the jet-box opening, Uo = q/do is the mean water velocity at the jet-box exit, υ is the kinematic viscosity of water, ρ is the water density, and σ is the surface tension between air and water. According to previous findings on skimming flow over stepped chutes, (e.g., [7,21,22,23]), significant scale effects of the macroscopic flow properties are not expected.
The bottom-pressures were measured with piezo-resistive pressure transmitters (Kellerdruck PR-23/8465.2) with cells at the step face with 2 mm diameter. The measurement range included −0.1 to 0.2 bar. The linearity error including the hysteresis and repeatability was less than ±0.5% of full scale, with an error of ±1.5 mbar for the water temperature range between 0 °C and 50 °C. The transmitters were installed along the vertical and horizontal step faces near and far downstream of the slope reduction, as shown in Figure 3. Each of the 12 sensors was connected to a 16 bit data acquisition card (NI 6259), optimized for fast sampling rates. For each measurement position, three runs with acquisition time tacq = 70 s and 1 kHz frequency were performed.
3. Results and Discussion
To investigate the slope reduction effect on the bottom-pressure development and to compare it with former results on constantly sloping stepped chutes, the present data are illustrated along the horizontal and vertical faces:
- “near” the slope reduction (i.e., in the reach where the main flow properties are influenced by the slope reduction);
- “far” upstream of the slope reduction (i.e., ahead of the reach where the main flow properties are influenced by the slope reduction);
- “far” downstream of the slope reduction (i.e., beyond the reach where the main flow properties are influenced by the slope reduction).
According to [17], the limit steps uninfluenced by the slope reduction are numbered −3 (“far” upstream, θ1 = 50°), +31 (“far” downstream, θ2 = 30°), and +20 (“far” downstream, θ2 = 18.6°).
3.1. Horizontal Step Face
3.1.1. Bottom-Pressure Profiles
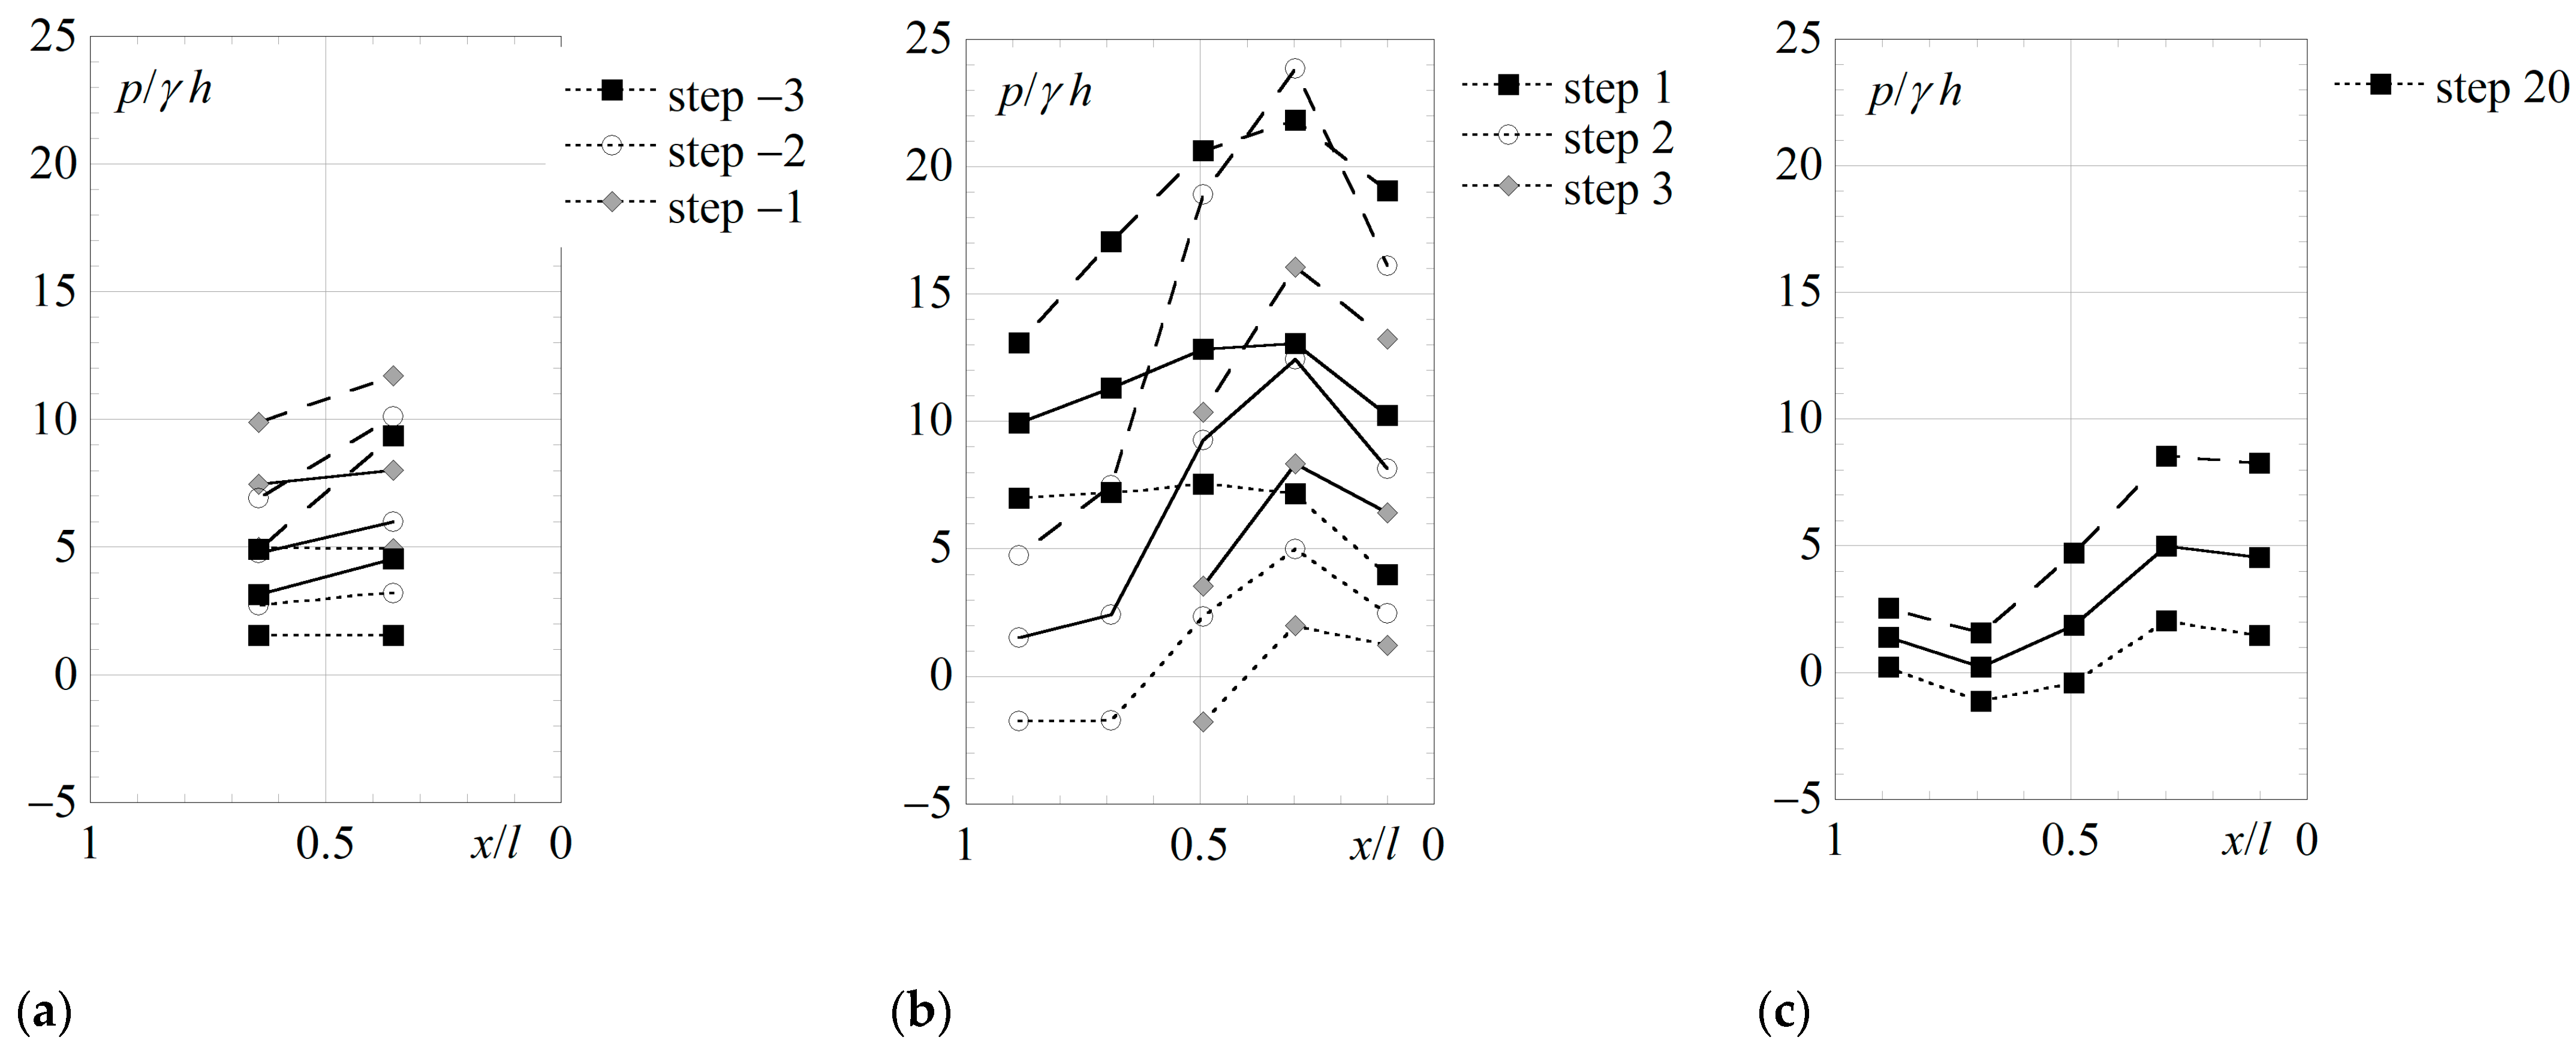
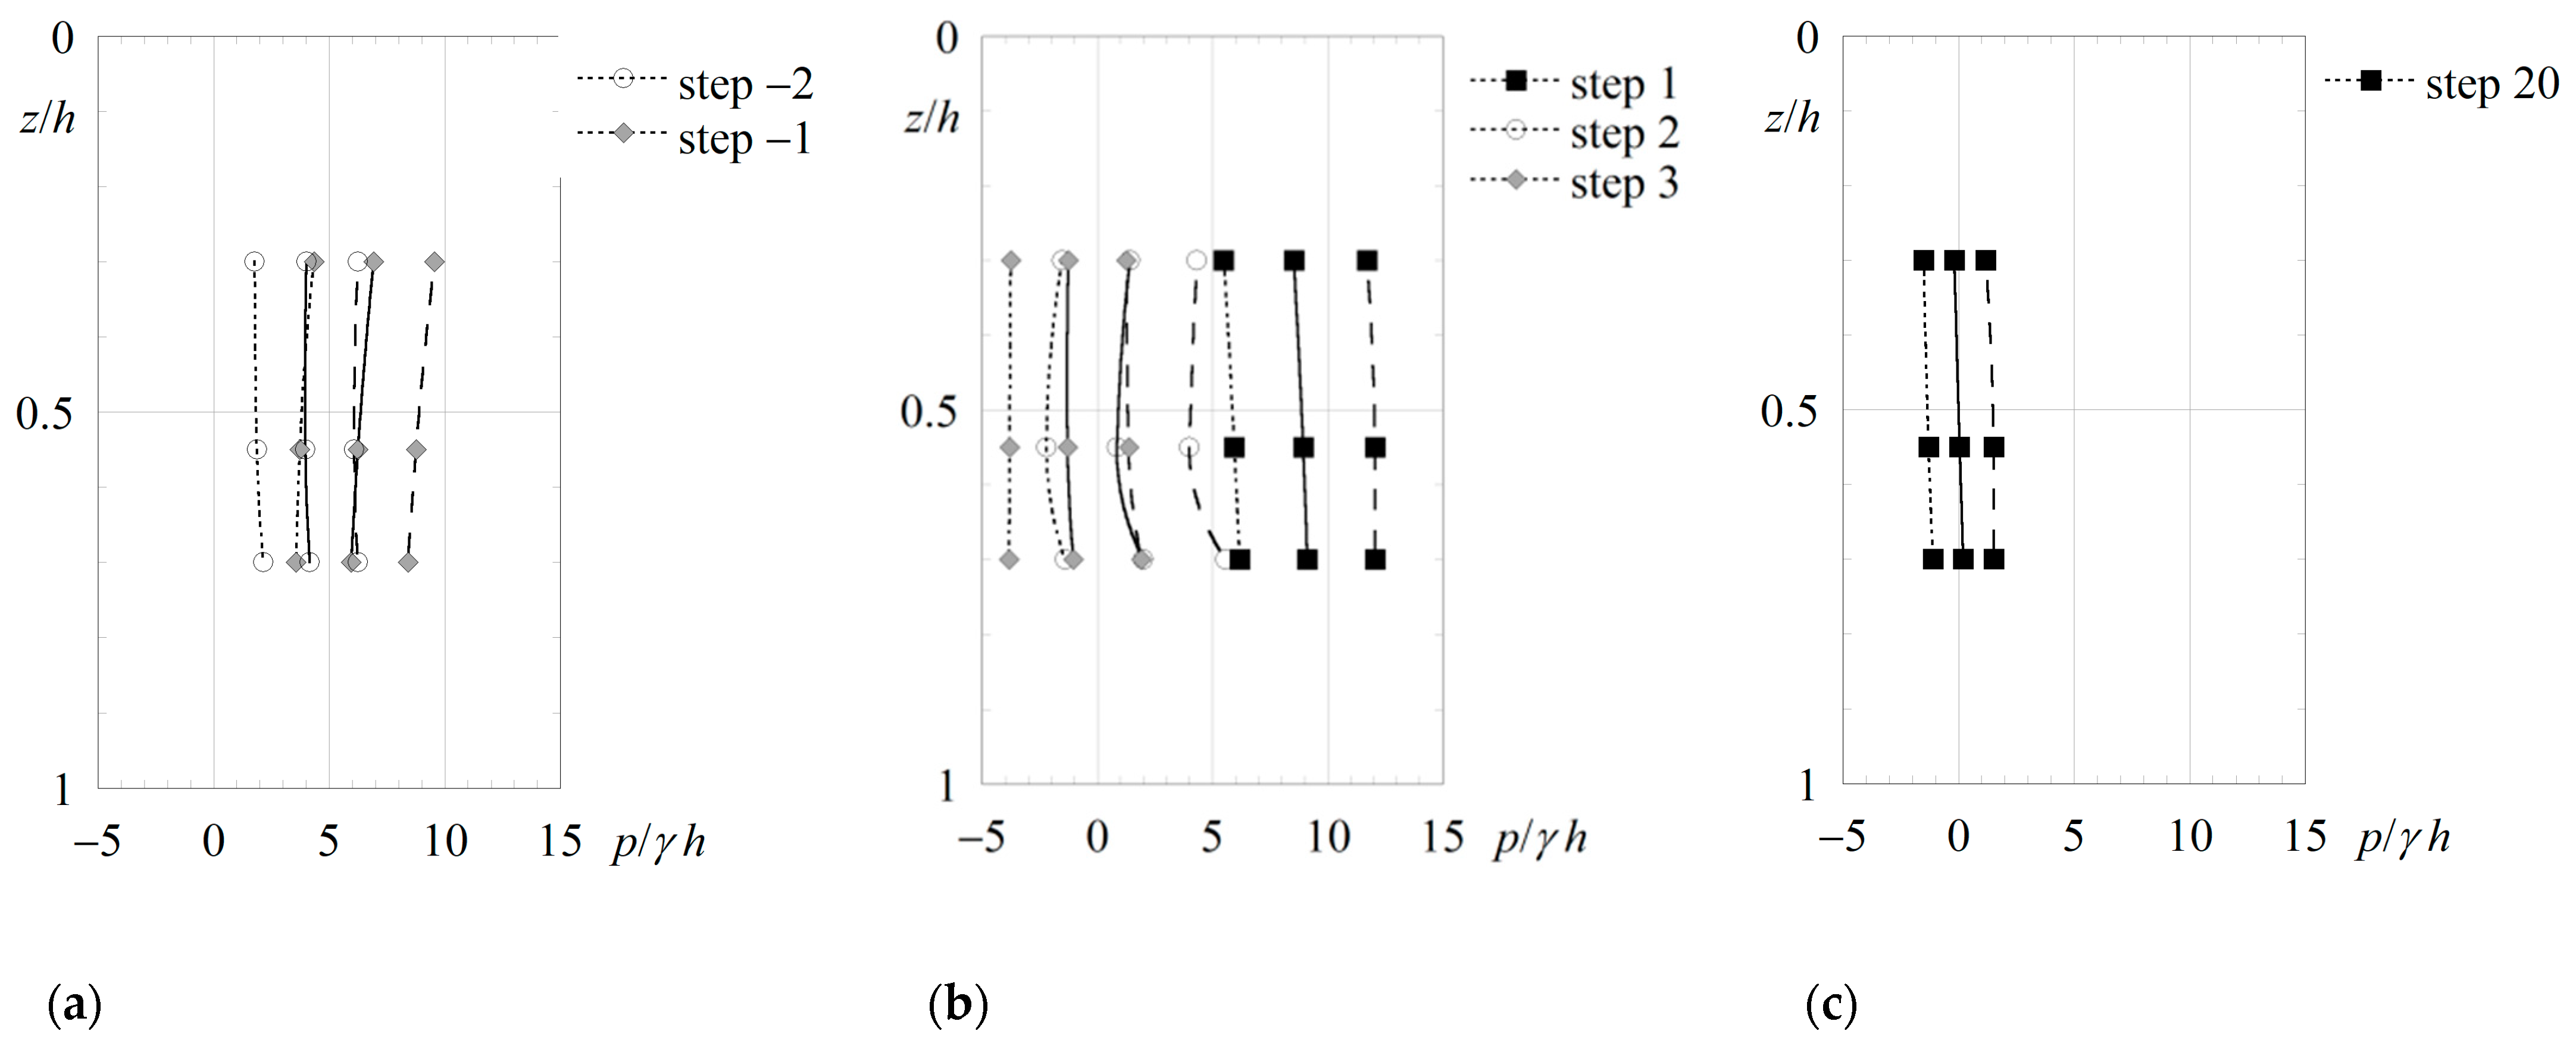
Figure 4 shows the mean, and the 5th and 95th percentiles of the dimensionless pressures p/(γh) along the horizontal step faces, where p is the measured bottom-pressure, γ is the specific water weight, and h the step height. More precisely, Figure 4 illustrates the data for the 50° to 18.6° slope reduction, and for dc/h = 4.6 at different steps.
The results on the steps where the main flow properties are uninfluenced by the slope reduction (steps −3 and +20 of Figure 4a and 4c, respectively) show that the pressure tends to increase along the horizontal face with decreasing x/l, regardless of the pressure percentile, except in the vicinity of both the step edge and the step corner. This trend is not clearly observed for the 50° chute because of the limited number of transmitter positions (Table 2, x/l = 0.35; x/l = 0.64). The S-shape pressure distribution for stepped chutes without a slope reduction (e.g., [12,13]) is evident herein at step +20 (18.6° module) located “far” downstream of the slope reduction (Figure 4c). Globally, on each step, the smallest pressures were observed along the upstream portion (x/l > 0.5) of the horizontal faces, and the maximum pressures occurred close to the edges (x/l < 0.5). For dc/h = 4.6, the highest pressures were obtained at x/l = 0.3, closely followed by those at x/l = 0.1. Similar results were obtained for the 30° module at steps +30 and +31, as shown in [18]. Therein, the S-shape far downstream of the slope reduction was less pronounced, likely due to a lower density of measurement points.
The above findings are consistent with those of others (e.g., [2,3,4,5,6,7,8,9,11,12,13,22,24]). They demonstrate that (1) the pressure near the step edge is influenced by flow impact, i.e., the interaction of the lower edge of the shear layer formed downstream of each step singularity with the horizontal face of the step, as characterized in [25], (2) the step corner pressure is influenced by the flow recirculation, and (3) the highest absolute pressures occur at the impact region, near the flow separation in between these two regions. Further, for a given critical flow depth normalized by the step height (relative critical flow depth), the impact region was found to increase with decreasing chute slope [12]. However, the differences were relatively small for chute angles from the horizontal between 19° and 30°. In turn, for a given chute slope, the impact region was noted to decrease with increasing relative critical flow depth. Only a slight change of the maximum pressure location occurred with varying discharge, on 18.4° and 26.6° chutes [13].
The slope reduction generates a flow deviation, with pronounced local bottom-pressures. The bottom-pressure starts to increase when approaching the slope reduction (steps −2 and −1, Figure 4a). Immediately downstream of the slope reduction, larger values of the mean as well as of the 5th and 95th percentiles were recorded (steps +1 and +2, Figure 4b). A similar trend was observed on an abrupt slope reduction on stepped [15] and on smooth chutes [14]. From the model studies of the Upper Stillwater dam stepped spillway, with a slope reduction from 72° to 59° (∆θ = 13°), mean pressures obtained with piezometers located near the step edge were shown to increase shortly upstream of the slope reduction, with highest values recorded at this location, regardless of the tested reservoir heads [15]. Similarly, [14] observed that pressures were influenced by the slope reduction slightly upstream of the latter, despite supercritical flow. Therein, three slope reductions were tested, ∆θ = 6.22°, 10° and 15°. This phenomenon can be explained by the non-hydrostatic pressure distribution in the vicinity of the slope reduction, influencing the flow properties already upstream of the latter, even under supercritical flows.
The above observations for dc/h = 4.6 can be extended to 2.6 ≤ dc/h ≤ 4.6, as shown for the 50° to 30° slope reduction in Figure 5, for the 95th pressure percentile. The pressures are noted to increase with discharge. In [3,5] maximum pressures of the same order of magnitude of those presented herein were observed for the steps located “far” upstream or downstream of the slope reduction (steps −3 for 50°, +31 for 30°), for similar slope, relative critical flow depth, and relative position on the step face. Overall maximum values of p/(γh) ≈ 5 and 5.5 were obtained in those studies, with 51.2° and 30° stepped chutes, for dc/h = 2.3 and 2.7, respectively. It should be noted that, in the present study, only two pressure transmitter positions were available for the 50° chute, and higher pressures would be expected near the step edge, as shown in [3]. In the latter study, 95th pressure percentiles of p/(γh) ≈ 6.5 were obtained in the vicinity of the step edge (x/l ≈ 0.06), for dc/h = 2.3. The relatively higher values obtained in the present study for the 50° chute (e.g., p/(γh) ≈ 7.5 at step −3, for x/l = 0.35 and dc/h = 2.6) in relation to those of [3] may be due to the smaller contact area of the pressure transmitter (2 mm versus 8 mm), and to the slightly larger relative critical flow depth (dc/h = 2.6 versus dc/h = 2.3).
3.1.2. Development of the Local Maximum Pressure
The development of the measured mean and the 5th and 95th percentiles of the local maximum pressure (at x/l =0.35, 0.17 and 0.3, respectively on the 50°, 30°, and 18.6° sloping chutes) along the chute are shown in Figure 6 for the 50° to 18.6° and the 50° to 30° slope reduction configurations, respectively, with dc/h = 4.6. The effect of the slope reduction on the pressure starts upstream of the slope reduction, as indicated above. A significant pressure increase appears between steps −2 and +1 or +2. Further downstream, the pressure decreases towards the uninfluenced values (at step +20 and +31, for the 18.6° and 30° modules, respectively). For the 50° to 18.6° slope reduction and 95th percentile, the pressure head in the vicinity of the slope reduction (step +2) is almost three times that upstream of the slope reduction (step −3), or far downstream (step +20), whereas for the 50° to 30° slope reduction, such ratio is approximately equal to two. Hence, a “pronounced” slope reduction from 50° to 18.6° resulted in higher ratios compared to those of the “mild” 50° to 30° slope reduction. A similar trend was observed for the 5th percentile and particularly for the mean, as well as for distinct relative critical flow depths (dc/h = 2.6 and 3.8), on the 50° to 30° slope reduction (not shown herein).
3.1.3. Equivalent Clear-Water Depth and Mean Pressure Development near the Slope Reduction
Based on air concentration measurements ([17,18]), the normalized equivalent clear-water depth d/h near the slope reduction is shown in Figure 7a as a function of X = (x′ − xsc)/h, with x′ as the streamwise coordinate starting at the jet-box, and xsc as the distance between the jet-box and the slope reduction (subscript sc). The equivalent clear-water depth d is given as d = (1 − Cm)Y90, where Y90 is the characteristic mixture flow depth defined as the distance between the pseudo-bottom and the point where the local air concentration C = 0.90, and Cm is the mean (depth-averaged) air concentration ([17]). The values of d/h increase near the slope reduction (X = 0) due to the flow curvature initiated slightly upstream. Immediately downstream of the slope reduction, d/h decreases (X > 0). Far downstream, d/h reaches the uninfluenced values of those chute slopes ([17]). A trend of flow depth increase upstream of the slope reduction, and subsequent decrease immediately downstream, was also reported by [15].
To highlight the development of the mean pressure on the horizontal step faces near the slope reduction (at x/l =0.35, 0.17, and 0.3, respectively, on the 50°, 30°, and 18.6° sloping chutes) the normalized pressure p/(0.5 ρup U2up) is introduced, with ρup = ρ(1 − Cmup) as the density of the air–water flow upstream (subscript up) of the slope reduction yet uninfluenced by the latter (at step −3 being X = −1.8), Cmup as mean air concentration, dup as equivalent clear-water depth, and Uup = q/dup as mean water velocity, all at step −3. Results of Cmup, dup, and Uup can be found in [18].
The results are shown in Figure 7b. The mean bottom-pressures were those at x/l = 0.35, 0.17, and 0.3, respectively, on the 50°, 30°, and 18.6° modules. The normalized pressure noticeably increases when approaching the slope reduction. Shortly downstream of the latter (up to steps +1 or +2, 1.7 < X < 3.5), the mean bottom-pressure head continues to increase, due to the impact of the flow on the longer horizontal step face, attaining 0.4 to 0.6 times the velocity head upstream of the slope reduction, for the tested range of relative critical flow depths. These values of the normalized pressure are of the same order of magnitude of those obtained for concave vertical curves on smooth chutes, with curvature radii normalized by the flow depth upstream of the curved reach (normalized curvature radii) ranging approximately between 3.3 and 5, according to the application of the simplified centrifugal pressure or the free-vortex methods [26].
For the present study, it was not possible to obtain accurate estimates of the flow curvature radii through visual observation, due to the complexity of the highly turbulent air–water flow in the vicinity of the slope reduction, along with visual observation constrains of the experimental set-up. In alternative, the characteristic mixture flow depth Y90 was used to obtain a rough estimate of the normalized flow curvature radii near the abrupt slope reduction. The normalized curvature radii for the 50° to 30° slope reduction were practically independent of the relative critical flow depth (3.5 ≤ R/Y90 ≤ 3.7), whereas a larger value was obtained for the 50° to 18.6° slope reduction, with dc/h = 4.6 (R/Y90 = 5.1). These values are practically within the range of those estimated herein for concave vertical curves on smooth chutes (~3.3 to 5). Overall, these normalized curvature radii are lower than that recommended for design of conventional chute transitions, according to [27].
By using the ratio p/(γ dup cosθ), values increasing from 6 (step −2) to 21 (step +1 or +2) were observed in the vicinity of the slope reduction, for 2.6 ≤ dc/h ≤ 4.6 (0.16 m ≤ dc ≤ 0.28 m) (not shown herein). A similar trend was reported by [14] on an abrupt slope reduction at an aerator-deflector, namely for ∆θ = 15°. For such slope reduction, they reported pressure heads ranging between 3 and 23 times the upstream uninfluenced hydrostatic pressure, at a distance to the slope reduction of less than twice the upstream flow depth, for 0.14 m ≤ dc ≤ 0.22 m.
Lower discharges show strong fins with flow bulking over a considerable distance due to the slope reduction, possibly because of high relative bottom-pressures [17]. This condition is evident immediately downstream of the slope reduction, where a larger normalized pressure was observed for low discharges (Figure 7b, compare dc/h = 2.6, 3.8 and 4.6 on the 50° to 30° slope reduction configuration, 0 < X < 3.5). With an increasing relative slope reduction from Δθ = 20° to Δθ = 31.4°, the maximum normalized pressure also increased by approximately 40% (Figure 7b, compare dc/h = 4.6 on the 50° to 18.6° and 50° to 30° slope reduction configurations, where X ≈ 3.5).
3.1.4. Probability Distribution of Fluctuating Pressures
The probability distribution function F of fluctuating pressures yet uninfluenced by the slope reduction are compared with the Normal (Gaussian) distribution (straight dashed line) for dc/h = 4.6 in Figure 8. The results indicate that the probability plots near the step corners (x/l > 0.5) are different from those near the step edges (x/l ˂ 0.5), irrespective of the chute slope.
Near the step edges (x/l ˂ 0.5), higher and positive skewness was found, showing that pronounced negative pressures are not as frequent as large positive ones [28]. Hence, a Normal distribution will underestimate the maximum pressures near the step edges, as shown in [11]. Close to the step edge, negative pressures with very low probabilities were recorded.
Smaller pressure fluctuations were observed near the corners (x/l > 0.5). Slightly negative or null values of skewness were observed (e.g., at x/l = 0.88 and 0.70). However, in general, positive pressure values were more frequent than negative pressure values.
Pronounced pressure minima occur near the step corner (x/l = 0.64, 0.84, and 0.88 respectively on 50°, 30° and 18.6° module). Along the inner region of the steps towards the corner (x/l > 0.50), the pressure distribution is in better agreement with the Normal distribution, than the downstream portion of steps. A kurtosis greater than 3 was observed for all cases. These observations are consistent with those found by [11].
3.2. Vertical Step Face
3.2.1. Bottom-Pressure Profiles
Figure 9 shows the mean and the 5th and 95th percentiles of the dimensionless pressures p/(γh) along the vertical step faces (at z/h = 0.3, 0.55 and 0.70), near and far downstream of the 50° to 18.6° slope reduction, for dc/h = 4.6. The results show that the vertical position has a small influence on the pressure, for 0.3 ≤ z/h ≤ 0.7. Similar results were found by others, within this range of positions along the vertical step face (e.g., [2,3,4,6,7,8,11,13,22,24]). However, smaller values would be expected to occur near the step edge due to the flow separation [2,3,4,6,7,8,11,13,22,24,29,30]. Such positions were not adopted in the present study due to the size of the transmitters. Similar findings were obtained for the 50° to 30° slope reduction, as shown in [18].
When approaching the slope reduction, a local pressure increase at the mean and considered percentiles appeared, as observed for the horizontal step faces (Figure 5), yet less pronounced. Immediately downstream of the slope reduction (up to step +3), the pressure decreased significantly, and the minima of the 5th percentile occurred as p/(γh) = −4, which would not lead to cavitation on a typical prototype of 0.9 m high steps. In addition, air concentrations larger than 0.1 were measured near the pseudo-bottom, due to significant self-aeration upstream of the slope reduction [17]. Hence, even higher extreme negative pressures that would likely occur near the step edge, namely for a more conservative 0.1th pressure percentile (e.g., [7,11]), should not be critical in terms of cavitation damage, for similar geometry and flow conditions. However, this conclusion should not be generalized for high velocity, clear-water flows subject to slope reductions, which may occur for high unit discharges and slope reductions located upstream of the point of inception of air entrainment. In such a scenario, and in the absence of an adequate air concentration close to the pseudo-bottom, cavitation damage might occur, as one may infer from [31,32].
3.2.2. Probability Distribution of Fluctuating Pressures
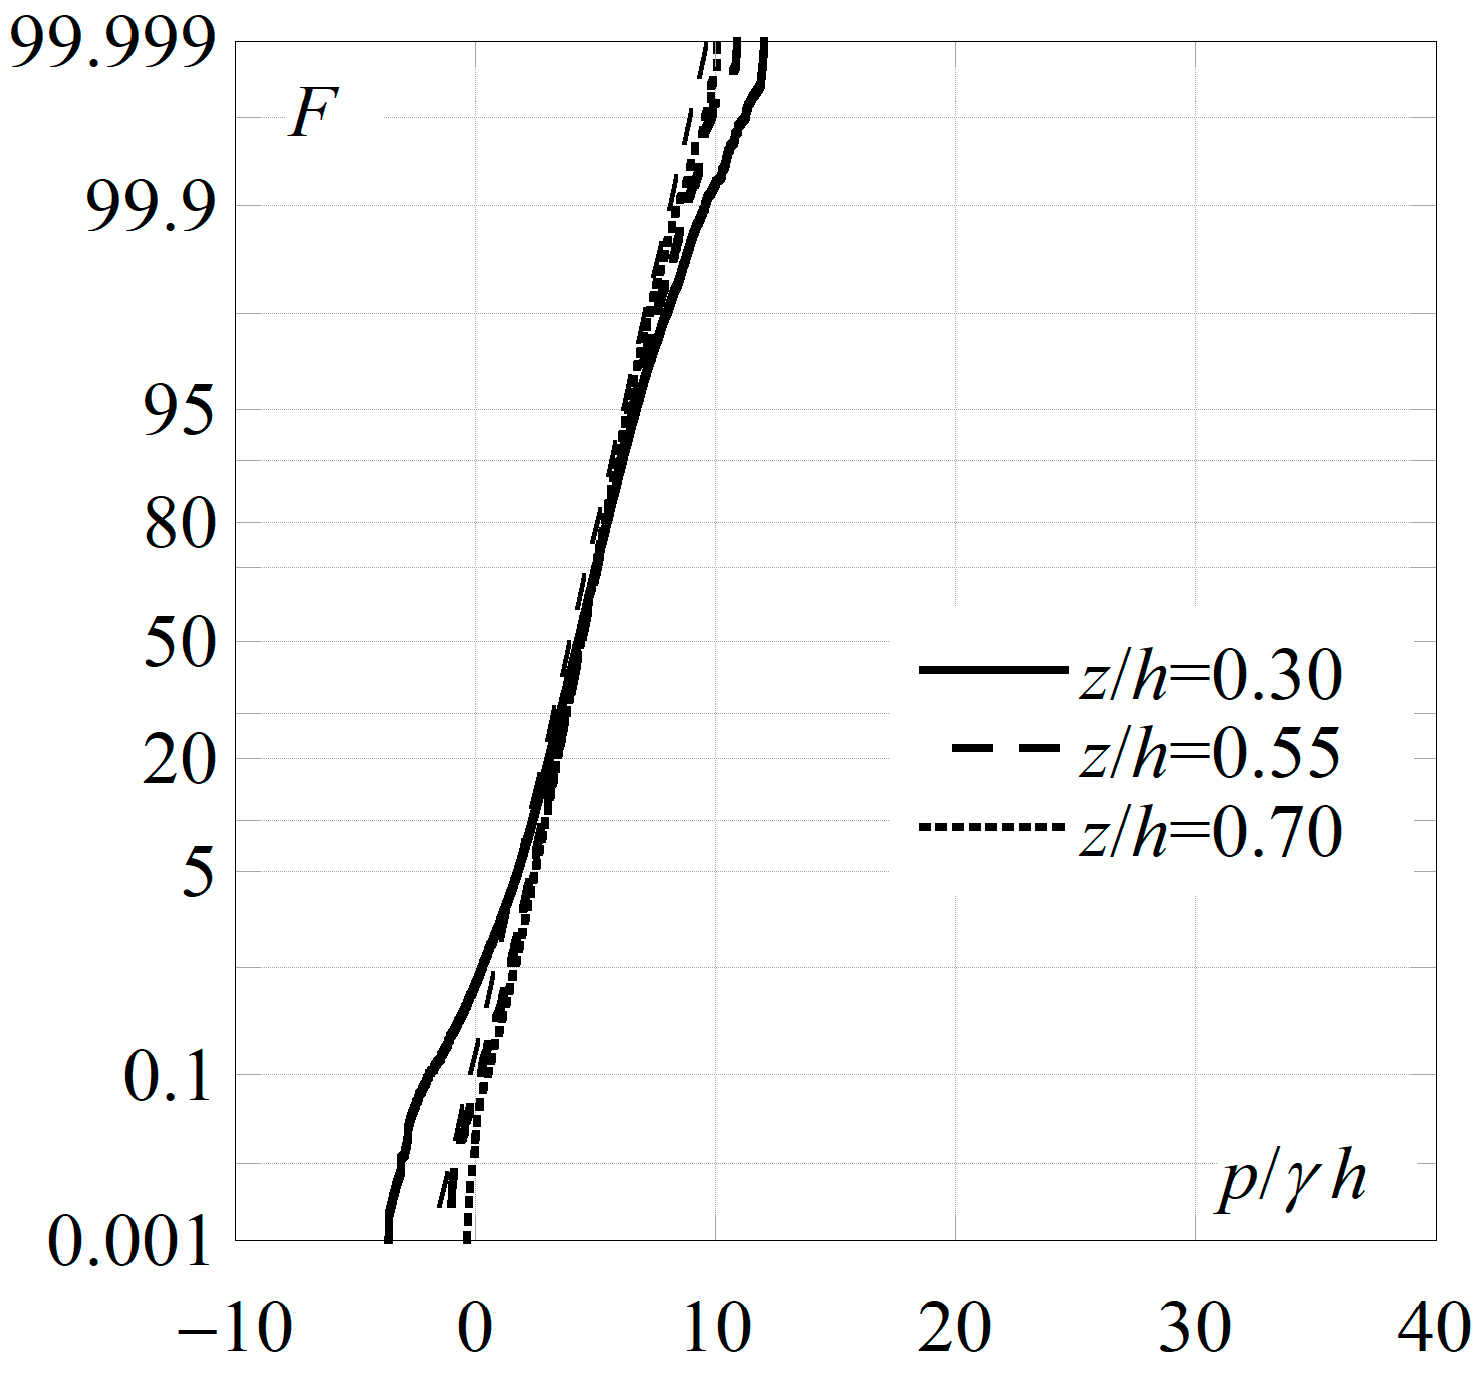
The probability distribution function F of dynamic pressures yet uninfluenced by the slope reduction are compared with the Normal distribution (straight dashed line) in Figure 10, focusing only on step −2, the 50° module, and dc/h = 4.6. The data trend of Figure 10 differs from that observed for the horizontal step faces (Figure 8). Near the step edge (z/h = 0.3), the skewness decreases and negative values appear, indicating that negative pressures are more frequent than positive pressures [28]. There, a Normal distribution underestimates pressure minima (as stated also by [11]), so that the pressure transmitters indicate lower negative pressures.
4. Conclusions
Stepped chutes incorporating an abrupt slope reduction have already been built and operated. However, they have not yet been the focus of detailed research. Herein, a physical model study on abrupt slope reductions at stepped chutes is presented, providing pressures on the vertical and horizontal step faces in skimming flow. An upper module with a 50° bottom angle was connected to a lower module, with either a 30° or 18.6° angle.
From this study, the following conclusions can be drawn:
- A global increase of the bottom-pressure (for the mean, and the 5th and 95th percentiles) occurs on the horizontal step faces, near the slope reduction. A similar but less pronounced increasing trend occurs on the vertical step faces.
- In the vicinity of the slope reduction, the mean pressure head near the edge of the horizontal step face attains 0.4 to 0.6 times the velocity head upstream of the slope reduction, for relative critical flow depths ranging between 2.6 and 4.6. For this range of normalized pressure heads, the estimated radii of curvature of the flow is of the same order of magnitude of those reported on concave vertical curves on smooth chutes.
- Downstream of the slope reduction, the pressures on the horizontal step faces near the edge decrease rapidly and approach typical values for uninfluenced steps.
- Negative pressure values (5th percentile) were measured on the vertical step faces near the slope reduction. Although they were hardly severe enough to lead to cavitation on a typical prototype, the transducer positions were not close enough to the step edge. In addition, a much lower percentile (i.e., 0.1th percentile) should be adopted if cavitation tendency is to be predicted.
A substantial effect on the bottom-pressure development was observed near the slope reduction, which should be considered to estimate the total thrust and bending moment on the chute walls. However, the pressure variations caused by the tested slope reductions appear not to be restrictive in terms of peak values. Hence, they should not represent a relevant issue in terms of flow impact or cavitation damage for flow conditions similar to those analyzed in the present study, namely gradually varied or quasi-uniform self-aerated flow upstream of the slope reduction.
Author Contributions
Conceptualization, A.J.S. and J.M.; methodology, M.J.O.M.T., A.J.S., M.P. and J.M.; validation, M.J.O.M.T., A.J.S., M.P. and J.M.; formal analysis, M.J.O.M.T., J.M., A.J.S. and M.P.; investigation, M.J.O.M.T.; resources, A.J.S. and J.M; data curation, M.J.O.M.T. and J.M.; writing—original draft preparation, M.J.O.M.T., writing—review and editing, M.J.O.M.T., J.M., A.J.S. and M.P.; visualization, M.J.O.M.T. and M.P.; supervision, A.J.S. and J.M.; project administration, A.J.S. and J.M.; funding acquisition, A.J.S., J.M., M.P. and M.J.O.M.T. All authors have read and agreed to the published version of the manuscript.
Funding
This study was conducted under the framework of the IST-EPFL Joint Doctoral Initiative, granted by the Laboratory of Hydraulic Constructions (LCH) of EPFL, and the Fundação para a Ciência e a Tecnologia (FCT), Portugal (grant SFRH/BD/51527/2011). The research was funded in part by the Ministry of Science, Research and Technology of Islamic Republic of Iran.
Institutional Review Board Statement
Not applicable.
Informed Consent Statement
Not applicable.
Data Availability Statement
Some or all data, models, or code that support the findings of this study are available from the corresponding author upon reasonable request.
Acknowledgments
The authors thank Xueqin Zheng for her assistance during the tests.
Conflicts of Interest
The authors declare no conflict of interest.
Notations
The following symbols are used in this paper.
| C | local air concentration (-) |
| Cm | mean air concentration (-) |
| Cmup | mean air concentration upstream of, yet uninfluenced by, the slope reduction (-) |
| d | equivalent clear-water depth (m) |
| dc | critical flow depth (m) |
| do | jet-box opening and related flow depth (m) |
| dup | equivalent clear-water depth upstream of, yet uninfluenced by, the slope reduction (m) |
| F | Probability distribution function of fluctuating pressures (-) |
| Fo | jet-box Froude number (-) |
| g | gravitational acceleration (m/s2) |
| h | vertical step height (m) |
| Ku | kurtosis (-) |
| l | horizontal step length (m) |
| p | bottom-pressure (Pa) |
| q | unit discharge (m2/s) |
| Ro | jet-box Reynolds number (-) |
| Uo | mean water velocity at the jet-box exit (m/s) |
| Uup | mean water velocity upstream of, yet uninfluenced by, the slope reduction (m/s) |
| Wo | jet-box Weber number (-) |
| x | coordinate (starting at the step edge) along the horizontal step face (m) |
| X | dimensionless streamwise distance from the slope reduction cross section, measured along the chute, X = (x′ − xsc)/h (-) |
| x′ | streamwise distance downstream of the jet-box (m) |
| xsc | streamwise distance between the jet-box and the slope reduction cross section (m) |
| Y90 | characteristic flow depth up to C = 0.90 (m) |
| z | distance from the step edge along the vertical step face (m) |
| ∆θ | slope reduction angle (°) |
| θ | chute angle (°) |
| υ | kinematic viscosity of water (m2/s) |
| ρ | water density (Kg/m3) |
| ρup | density of the air–water flow upstream of, yet uninfluenced by, the slope reduction (Kg/m3) |
| σ | surface tension between air and water (N/m) |
| γ | specific water weight (N/m3) |
References
- Matos, J.; Sánchez-Juny, M.; Quintela, A.; Dolz, J. Air Entrainment and Safety Against Cavitation Damage in Stepped Spillways over RCC Dams. In Proceedings of the International Workshop Hydraulics of Stepped Spillways, ETH Zurich, Switzerland, 22−24 March 2000; Minor, H.-E., Hager, W.H., Eds.; Balkema: Rotterdam, The Netherlands, 2000; pp. 69–76. [Google Scholar]
- Sánchez-Juny, M.; Pomares, J.; Dolz, J. Pressure Field in Skimming Flow over a Stepped Spillway. In Proceedings of the Workshop Hydraulics of Stepped Spillways, ETH Zurich, Switzerland, 22−24 March 2000; Minor, H.-E., Hager, W.H., Eds.; Balkema: Rotterdam, The Netherlands, 2000; pp. 137–145. [Google Scholar]
- Sánchez-Juny, M.; Bladé, E.; Dolz, J. Pressures on a Stepped Spillway. J. Hydraul. Res. 2007, 45, 505–511. [Google Scholar] [CrossRef]
- Sánchez-Juny, M.; Bladé, E.; Dolz, J. Analysis of Pressures on a Stepped Spillway. J. Hydraul. Res. 2008, 46, 410–414. [Google Scholar] [CrossRef]
- André, S. High Velocity Aerated Flows over Stepped Chutes with Macro-Roughness Elements. Ph.D. Thesis, École Polytechnique Fédérale de Lausanne, Lausanne, Switzerland, 2004. [Google Scholar]
- Sánchez-Juny, M.; Dolz, J. Experimental Study of Transition and Skimming Flows on Stepped Spillways in RCC Dams: Qualitative Analysis and Pressure Measurements. J. Hydraul. Res. 2005, 43, 540–548. [Google Scholar] [CrossRef]
- Gomes, J.F. Campo de Pressões: Condições de Incipiência à Cavitação em Vertedouros em Degraus com Declividade 1V:0.75H (Pressure Field: Conditions of Incipient Cavitation on Stepped Spillways with Slopes of 1V: 0.75H). Ph.D. Thesis, Federal University of Rio Grande do Sul, Porto Alegre, Brazil, 2006. (In Portuguese). [Google Scholar]
- Gomes, J.F.; Amador, A.T.; Marques, M.; Matos, J.; Sánchez-Juny, M. Hydrodynamic Pressure Field on Steeply Sloping Stepped Spillways. In Proceedings of the International Junior Researcher and Engineer Workshop on Hydraulic Structures, Montemor-o-Novo, Portugal, 2−4 September 2006; Matos, J., Chanson, H., Eds.; Hydraulic Model Report No. CH61/06. Div. of Civil Engineering, The University of Queensland: Brisbane, Australia, 2006; pp. 71–80. [Google Scholar]
- André, S.; Schleiss, A.J. Discussion of “Pressures on a Stepped Spillway”. J. Hydraul. Res. 2008, 46, 574–576. [Google Scholar] [CrossRef]
- Khatsuria, R.M. Discussion of “Experimental Study of Transition and Skimming Flows on Stepped Spillways in RCC Dams: Qualitative Analysis and Pressure Measurements”. J. Hydraul. Res. 2008, 46, 175–176. [Google Scholar] [CrossRef]
- Amador, A.; Sánchez-Juny, M.; Dolz, J. Developing Flow Region and Pressure Fluctuations on Steeply Sloping Stepped Spillways. J. Hydraul. Eng. 2009, 135, 1092–1100. [Google Scholar] [CrossRef]
- Takahashi, M.; Ohtsu, I. Aerated Flow Characteristics of Skimming Flow over Stepped Chutes. J. Hydraul. Res. 2012, 50, 427–434. [Google Scholar] [CrossRef]
- Zhang, J.M.; Chen, J.G.; Wang, Y. Experimental Study on Time-Averaged Pressure in Stepped Spillway. J. Hydraul. Res. 2012, 50, 236–240. [Google Scholar] [CrossRef]
- Zarrati, A.M.; Jin, Y.C.; Shanehsaz-Zadeh, A.; Ahadi, F. Potential flow Solution for a Free Surface Flow Past a Sudden Slope Change. Can. J. Civil Eng. 2004, 31, 553–560. [Google Scholar] [CrossRef]
- Houston, K.L. Hydraulic Model Studies of Upper Spillway Dam Stepped Spillway and Outlet Works; Report REC-ERC-87-6; USBR: Denver, CO, USA, 1987.
- Baumann, A.; Arefi, F.; Schleiss, A.J. Design of Two Stepped Spillways for a Pumped Storage Scheme in Iran. In Proceedings of the International Conference Hydro 2006—Maximizing the Benefits of Hydropower, Porto Carras, Greece, 25−27 September 2006. [Google Scholar]
- Ostad Mirza, M.J.; Matos, J.; Pfister, M.; Schleiss, A.J. The Effect of an Abrupt Slope Change on Air Entrainment and Flow Depths at Stepped Spillways. J. Hydraul. Res. 2016, 55, 362–375. [Google Scholar] [CrossRef]
- Ostad Mirza, M.J. Experimental Study on the Influence of Abrupt Slope Changes on Flow Characteristics over Stepped Spillways. Ph.D. Thesis, École Polytechnique Fédérale de Lausanne, Lausanne, Switzerland, 2016. [Google Scholar] [CrossRef]
- Schwalt, M.; Hager, W.H. Jet box. Schweiz. Ing. Architekt. 1992, 110, 547–549. (In German) [Google Scholar]
- Chanson, H. Hydraulics of Skimming Flows on Stepped Chutes: The Effects of Inflow Conditions? J. Hydraul. Res. 2006, 44, 51–60. [Google Scholar] [CrossRef] [Green Version]
- Boes, R.M.; Hager, W.H. Two-Phase Flow Characteristics of Stepped Spillways. J. Hydraul. Eng. 2003, 129, 661–670. [Google Scholar] [CrossRef]
- Amador, A. Comportamiento Hidráulico de los Aliviaderos Escalonados en Presas de Hormigón Compactado (Hydraulic Behavior of Stepped Spillways on RCC Dams). Ph.D. Thesis, Universitat Politècnica de Catalunya, Barcelona, Spain, 2005. (In Spanish). [Google Scholar]
- Pfister, M.; Chanson, H. Two-Phase Air-Water Flows: Scale Effects in Physical Modeling. J. Hydrodyn. 2014, 26, 291–298. [Google Scholar] [CrossRef] [Green Version]
- Sánchez-Juny, M. Comportamiento Hidraulico de los Aliviaderos Escalonados en Presas de Hormigón Compactado. Analisis del Campo de Presiones. (Hydraulic Behaviour of Stepped Spillways in RCC Dams: Analysis of the Pressure Field). Ph.D. Thesis, Universitat Politècnica de Catalunya, Barcelona, Spain, 2001. (In Spanish). [Google Scholar]
- Gonzalez, C.A.; Chanson, H. Interactions between Cavity Flow and Main Stream Skimming Flows: An Experimental Study. Can. J. Civil Eng. 2004, 31, 33–44. [Google Scholar] [CrossRef] [Green Version]
- Henderson, F.M. Open Channel Flow; Macmillan Publishing Co., Inc.: New York, NY, USA, 1996. [Google Scholar]
- USBR. Design of Small Dams, 3rd ed.; US Government Printing Office: Washington, DC, USA, 1987.
- Tennekes, H.; Lumley, J.L. A First Course in Turbulence; The MIT Press: Cambridge, MA, USA; London, UK, 1972. [Google Scholar]
- Pfister, M.; Hager, W.H.; Minor, H.-E. Stepped Chutes: Pre-aeration and Spray Reduction. Intl. J. Multiphase Flow. 2006, 32, 269–284. [Google Scholar] [CrossRef]
- Schiess, A.; Pfister, M.; Hager, W.H.; Minor, H.-E. Hydraulic Performance of Step Aerator. J. Hydraul. Eng. 2008, 134, 127–134. [Google Scholar]
- Frizell, K.W.; Renna, F.M.; Matos, J. Cavitation Potential of Flow on Stepped Spillways. J. Hydraul. Eng. 2013, 139, 630–636. [Google Scholar] [CrossRef]
- Frizell, K.W.; Renna, F.M.; Matos, J. Closure to Cavitation Potential of Flow on Stepped Spillways. J. Hydraul. Eng. 2015, 141, 07015009. [Google Scholar] [CrossRef]
Figure 1.
Stepped spillways with an abrupt slope reduction (a) Upper Stillwater dam, USA (http://www.usbr.gov, last accessed date: 15 November 2013); (b) Siah-Bishe lower dam, Iran (http://www.iwpco.ir, last accessed date: 21 February 2016).
Figure 1.
Stepped spillways with an abrupt slope reduction (a) Upper Stillwater dam, USA (http://www.usbr.gov, last accessed date: 15 November 2013); (b) Siah-Bishe lower dam, Iran (http://www.iwpco.ir, last accessed date: 21 February 2016).

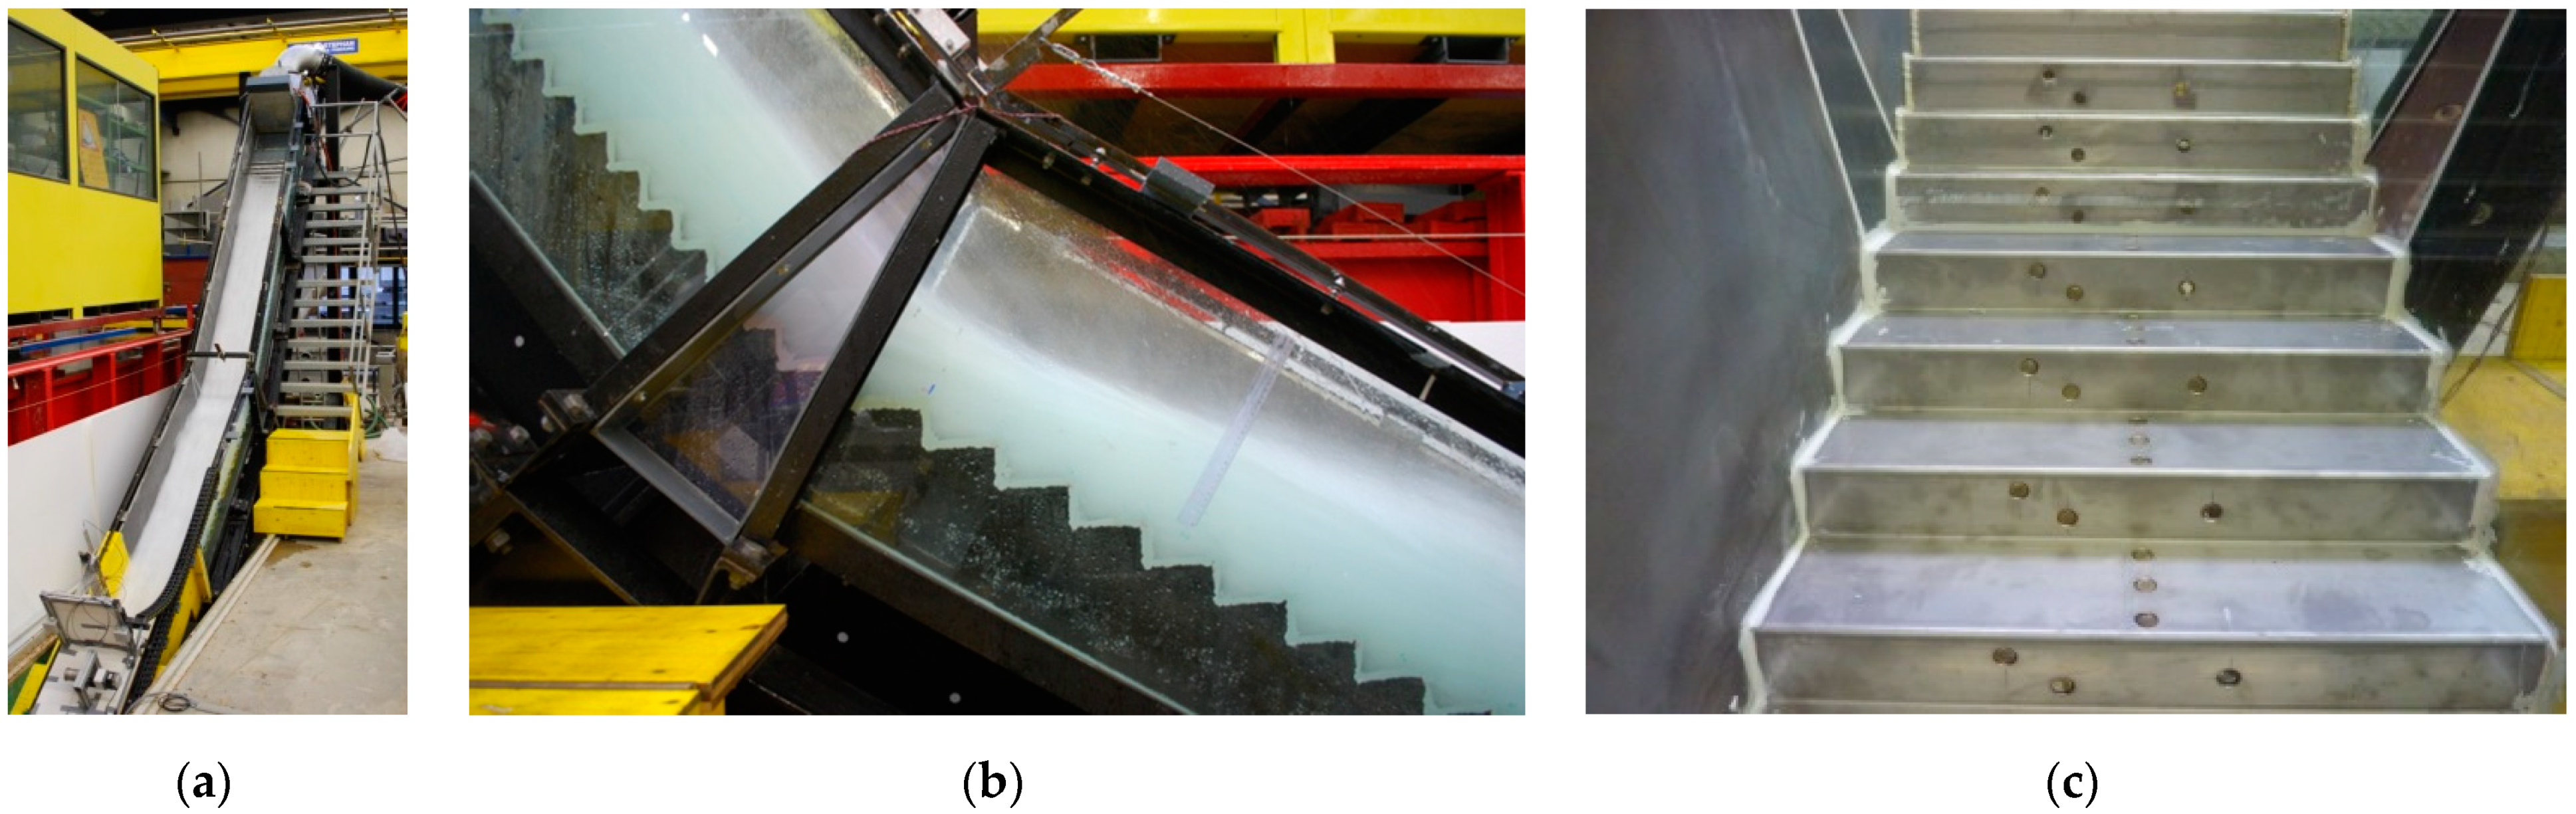
Figure 2.
Physical model of the stepped spillway with an abrupt slope reduction assembled at LCH-EPFL: (a) General view; (b) Side view of configuration associated to test number 2, as per Table 1 (θ1 = 50°; θ2 = 30°; dc/h = 4.6; Fo = 6.4; Ro = 4.6 × 10⁵; Wo0.5 = 193, flow from left to the right; (c) Pressure transducers with 2 mm internal (cell) diameter installed in the vicinity of the 50°–30° slope reduction.

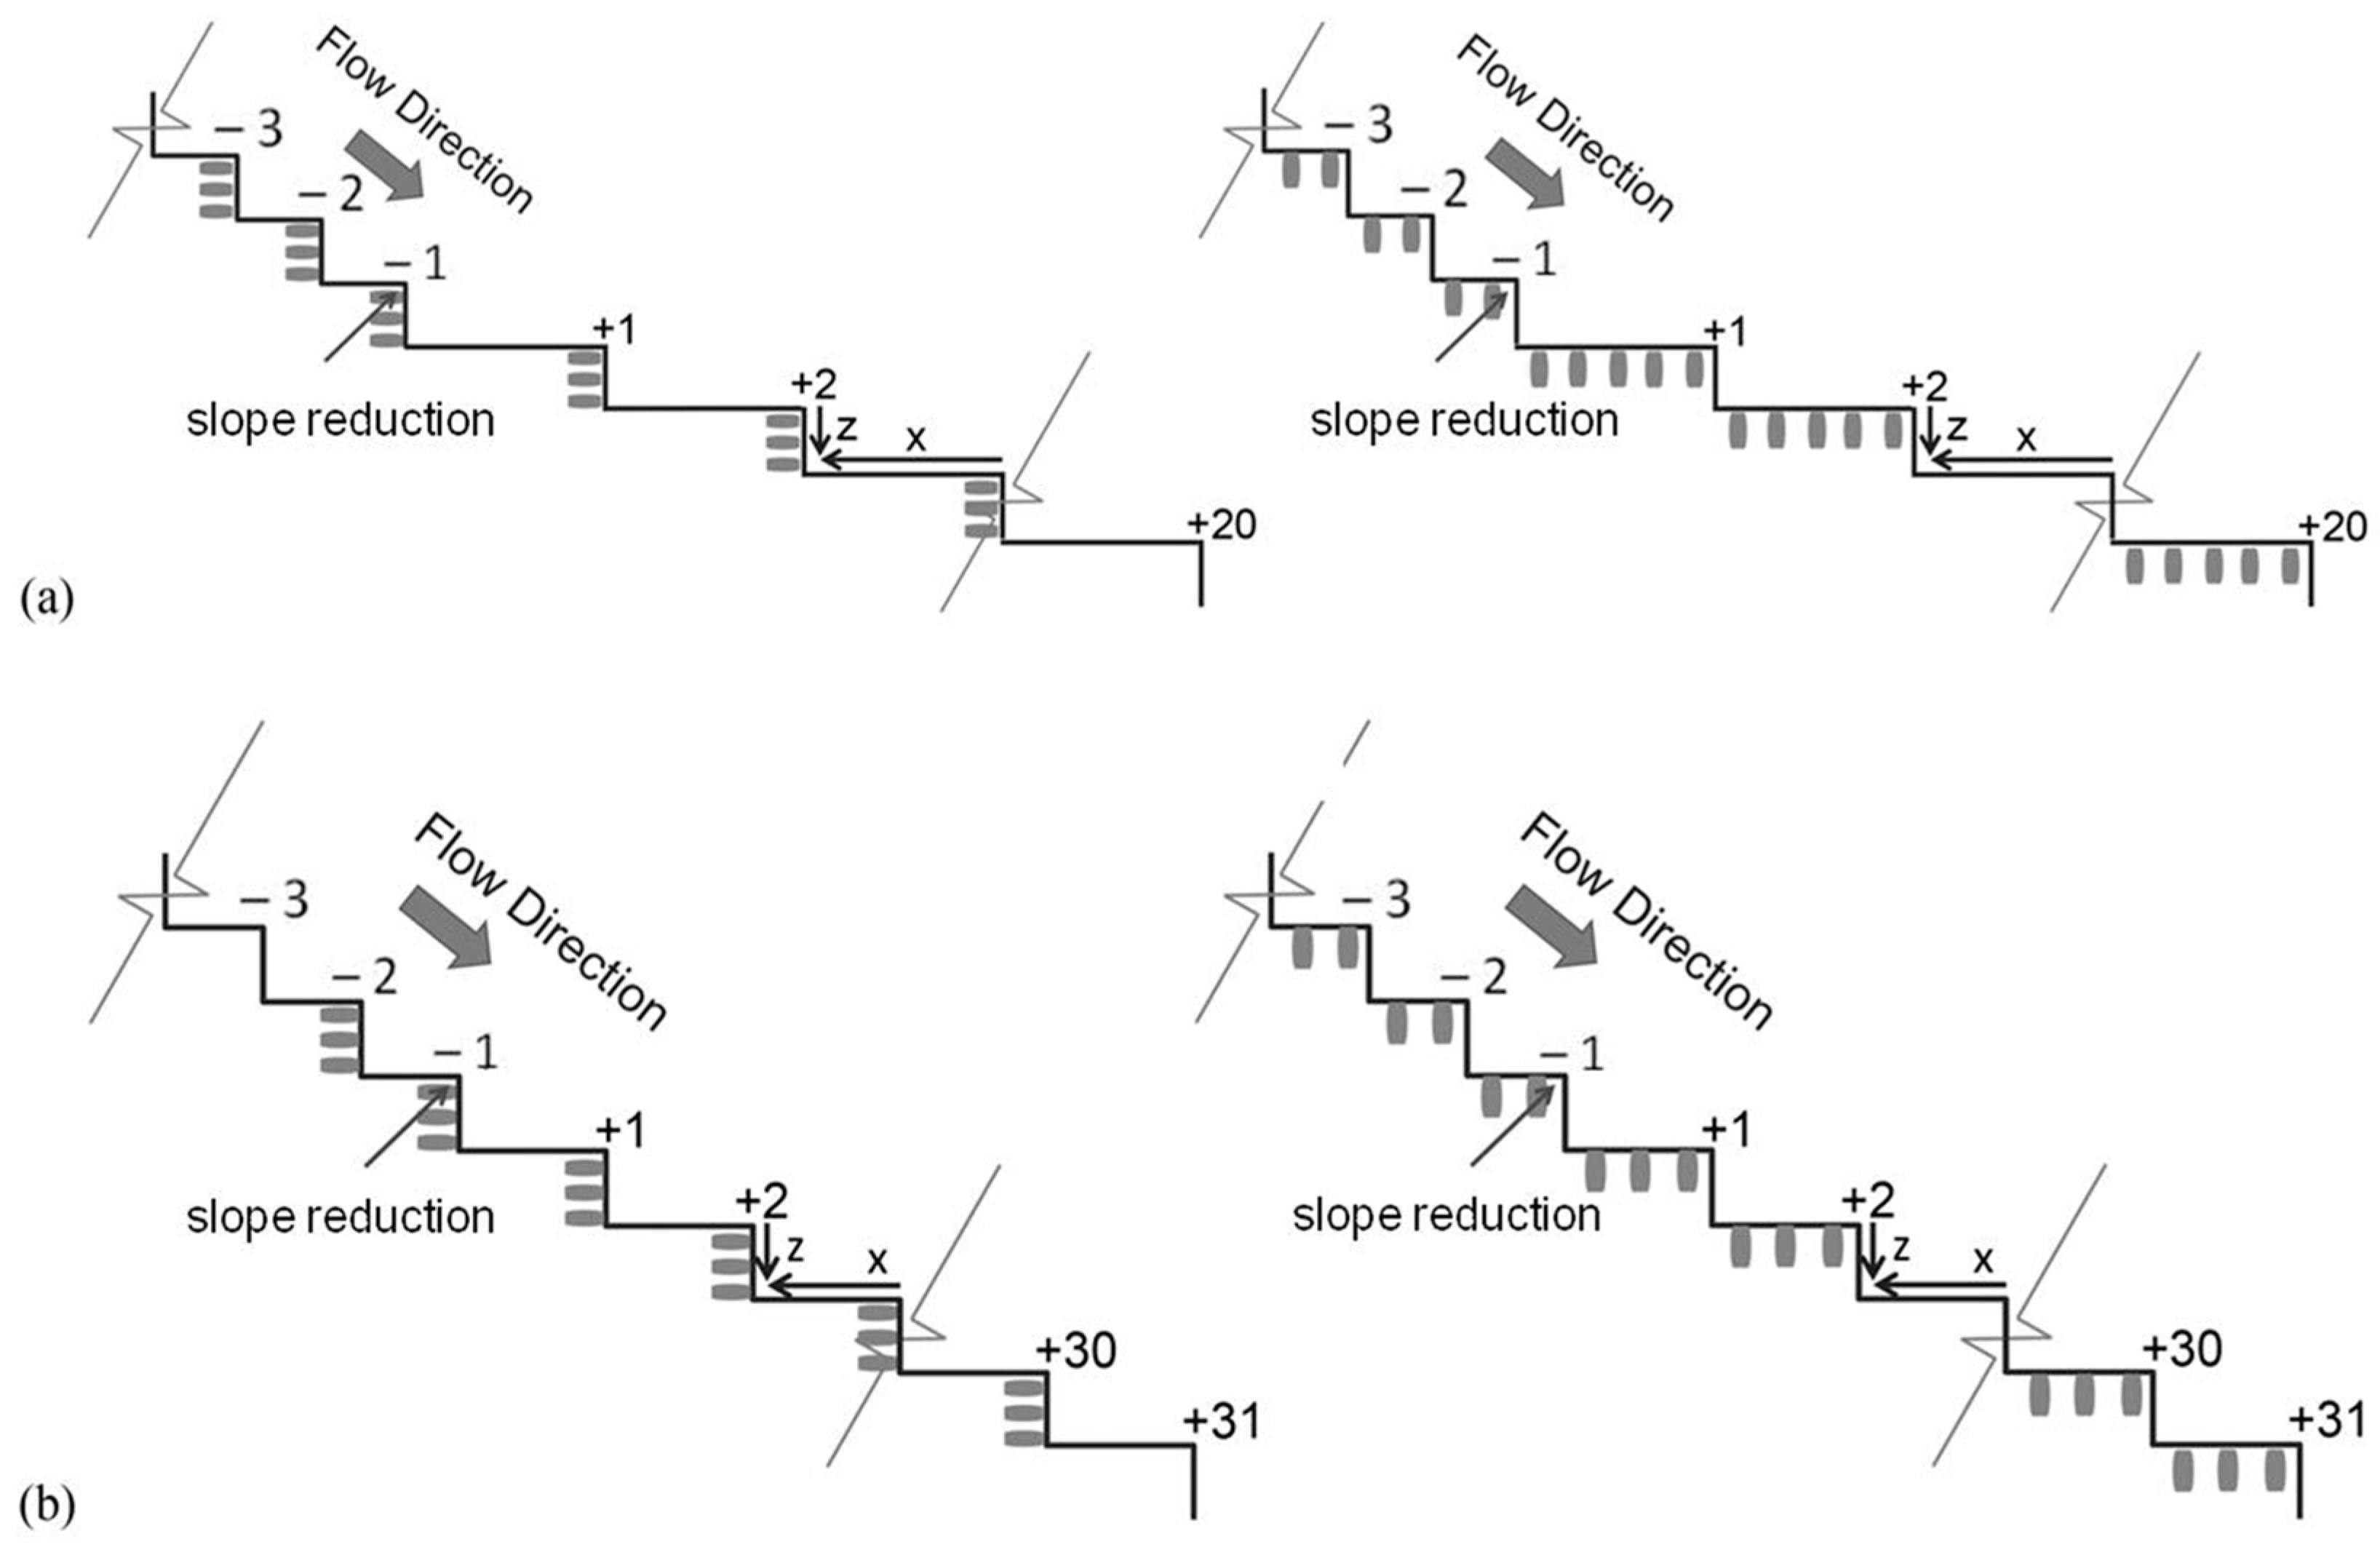
Figure 3.
Pressure transmitter positions on the horizontal and vertical step faces, for (a) 50° to 18.6° and (b) 50° to 30° slope reduction. The step numbers downstream of the slope reduction are positive; otherwise, they are negative.
Figure 3.
Pressure transmitter positions on the horizontal and vertical step faces, for (a) 50° to 18.6° and (b) 50° to 30° slope reduction. The step numbers downstream of the slope reduction are positive; otherwise, they are negative.

Figure 4.
Dimensionless pressures p/(γh) on the horizontal step faces for the 50° to 18.6° slope reduction and dc/h = 4.6: (a) upstream of the slope reduction, (b) just downstream, and (c) “far” downstream; (···) 5th percentile, (―) mean, and (---) 95th percentile.
Figure 4.
Dimensionless pressures p/(γh) on the horizontal step faces for the 50° to 18.6° slope reduction and dc/h = 4.6: (a) upstream of the slope reduction, (b) just downstream, and (c) “far” downstream; (···) 5th percentile, (―) mean, and (---) 95th percentile.

Figure 5.
Dimensionless 95th percentile pressures p/(γh) on the horizontal step faces for the 50° to 30° slope reduction: (a) upstream of the slope reduction, (b) just downstream, and (c) “far” downstream; dc//h = (---) 2.6, (―) 3.8, and (···) 4.6.
Figure 5.
Dimensionless 95th percentile pressures p/(γh) on the horizontal step faces for the 50° to 30° slope reduction: (a) upstream of the slope reduction, (b) just downstream, and (c) “far” downstream; dc//h = (---) 2.6, (―) 3.8, and (···) 4.6.

Figure 6.
Development of the dimensionless pressure p/(γh) for dc/h = 4.6, for (a) the 50° to 18.6° slope reduction, at x/l = 0.35 on the 50° sloping chute and x/l = 0.3 on the 18.6° sloping chute, and (b) the 50° to 30° slope reduction, at x/l = 0.35 on the 50° sloping chute and x/l = 0.17 on the 30° sloping chute.

Figure 7.
Streamwise development of the (a) normalized equivalent clear-water depth d/h and (b) normalized mean pressure p/(0.5 ρup U2up) on the horizontal step faces, at x/l =0.35, 0.17, and 0.3, respectively, on the 50°, 30°, and 18.6° sloping chutes.
Figure 7.
Streamwise development of the (a) normalized equivalent clear-water depth d/h and (b) normalized mean pressure p/(0.5 ρup U2up) on the horizontal step faces, at x/l =0.35, 0.17, and 0.3, respectively, on the 50°, 30°, and 18.6° sloping chutes.

Figure 8.
Probability distribution function F of fluctuating pressures yet uninfluenced by the slope reduction, for dc/h = 4.6 and (a) 50° module (step −3), (b) 30° module (step 31, and (c) 18.6° module (step 20). (---) Normal distribution.
Figure 8.
Probability distribution function F of fluctuating pressures yet uninfluenced by the slope reduction, for dc/h = 4.6 and (a) 50° module (step −3), (b) 30° module (step 31, and (c) 18.6° module (step 20). (---) Normal distribution.

Figure 9.
Dimensionless pressures p/(γh) on the vertical step faces for the 50° to 18.6° slope reduction and dc/h = 4.6: (a) upstream of the slope reduction, (b) just downstream, and (c) “far” downstream; (···) 5th percentile, (―) mean, and (---) 95th percentile.
Figure 9.
Dimensionless pressures p/(γh) on the vertical step faces for the 50° to 18.6° slope reduction and dc/h = 4.6: (a) upstream of the slope reduction, (b) just downstream, and (c) “far” downstream; (···) 5th percentile, (―) mean, and (---) 95th percentile.

Figure 10.
Probability distribution function F of fluctuating pressures yet uninfluenced by the slope reduction, for dc/h = 4.6 and the 50° module (at step −2), at z/h = 0.30, z/h = 0.55, and z/h = 0.70. (---) Normal distribution.
Figure 10.
Probability distribution function F of fluctuating pressures yet uninfluenced by the slope reduction, for dc/h = 4.6 and the 50° module (at step −2), at z/h = 0.30, z/h = 0.55, and z/h = 0.70. (---) Normal distribution.


Table 1.
Test program.
| Test | θ1 (°) | θ2 (°) | do (m) | q (m2/s) | dc/h (-) | Fo (-) | Ro (-) × 105 | Wo0.5 (-) |
|---|---|---|---|---|---|---|---|---|
| 1 | 50 | 18.6 | 0.082 | 0.47 | 4.6 | 6.4 | 4.6 | 193 |
| 2 | 50 | 30 | 0.082 | 0.47 | 4.6 | 6.4 | 4.6 | 193 |
| 3 | 50 | 30 | 0.093 | 0.35 | 3.8 | 3.9 | 3.4 | 135 |
| 4 | 50 | 30 | 0.045 | 0.20 | 2.6 | 6.7 | 2.0 | 111 |
Table 2.
Pressure transmitter positions on horizontal step faces (see Figure 3).
Table 2.
Pressure transmitter positions on horizontal step faces (see Figure 3).
| θ (°) | l (m) | x/l | ||||
|---|---|---|---|---|---|---|
| 50 | 0.050 | 0.35 | 0.64 | - | - | - |
| 30 | 0.104 | 0.17 | 0.50 | 0.84 | - | - |
| 18.6 | 0.178 | 0.10 | 0.30 | 0.50 | 0.70 | 0.88 |
Publisher’s Note: MDPI stays neutral with regard to jurisdictional claims in published maps and institutional affiliations. |
© 2021 by the authors. Licensee MDPI, Basel, Switzerland. This article is an open access article distributed under the terms and conditions of the Creative Commons Attribution (CC BY) license (https://creativecommons.org/licenses/by/4.0/).
Share and Cite
MDPI and ACS Style
Ostad Mirza Tehrani, M.J.; Matos, J.; Pfister, M.; Schleiss, A.J. Bottom-Pressure Development Due to an Abrupt Slope Reduction at Stepped Spillways. Water 2022, 14, 41. https://doi.org/10.3390/w14010041
AMA Style
Ostad Mirza Tehrani MJ, Matos J, Pfister M, Schleiss AJ. Bottom-Pressure Development Due to an Abrupt Slope Reduction at Stepped Spillways. Water. 2022; 14(1):41. https://doi.org/10.3390/w14010041
Chicago/Turabian StyleOstad Mirza Tehrani, Mohammad J., Jorge Matos, Michael Pfister, and Anton J. Schleiss. 2022. "Bottom-Pressure Development Due to an Abrupt Slope Reduction at Stepped Spillways" Water 14, no. 1: 41. https://doi.org/10.3390/w14010041
Note that from the first issue of 2016, this journal uses article numbers instead of page numbers. See further details here.