
Temperature Impact on Reverse Osmosis Permeate Flux in the Remediation of Hexavalent Chromium
by
 , , , , and
Ihab Shigidi
1 ,
,
Ali E. Anqi
2,
Abubakar Elkhaleefa
1,*,
Azam Mohamed
2,
Ismat H. Ali
3 and
Eid I. Brima
3,4 1
Department of Chemical Engineering, College of Engineering, King Khalid University, Abha 61421, Saudi Arabia
2
Department of Mechanical Engineering, College of Engineering, King Khalid University, Abha 61421, Saudi Arabia
3
Department of Chemistry, College of Science, King Khalid University, Abha 61421, Saudi Arabia
4
School of Allied Health Science, Faculty of Health and Life Sciences, De Montfort University, The Gateway, Leicester LE1 9BH, UK
*
Author to whom correspondence should be addressed.
Water 2022, 14(1), 44; https://doi.org/10.3390/w14010044
Submission received: 16 November 2021
/
Revised: 19 December 2021
/
Accepted: 20 December 2021
/
Published: 24 December 2021
(This article belongs to the Special Issue Wastewater Treatment, Valorization and Reuse II)
Abstract
:Reverse osmosis technique was applied in removing hexavalent chromium ions from artificial wastewater. Different operating conditions were studied to monitor the separation process using commercial Reverse Osmosis BW30XFR membrane. Different concentrations of hexavalent chromium; 5, 30, and 100 ppm were tested. Samples were subjected to incrementally increasing operating pressure; 10, 30, and 45 bar and flow rates; 2.2, 3.4, and 4.5 L/min under various temperatures; 25, 35, 45, and 55 °C. Collected permeate and concentrations were measured after each experiment using a UV spectrophotometer. Results obtained presented a higher rejection percentage at lower feed concentrations with a value up to 99.8% for 5 ppm in comparison to 94.3% for 30 ppm and 77.2% for 100 ppm concentration due to concentration polarization; however, it showed no effect of increasing operating flow rates. Moreover, the increase in feed temperature from 25 to 55 °C had positively increased permeate flux to more than 300 times. The permeate flux at 25 °C is recorded for all tested samples in the range of 30 to 158 kg/h·m2, this range has risen at 55 °C under the same conditions to the range of 70 to 226 kg/h·m2, indicating alteration within the membrane pore size due to temperature increase and high applied pressure concluding high sensitivity of polymeric membranes towards changing permeate flow rate with increasing temperatures.
1. Introduction
Heavy metals impose significant environmental and economic risks. Hexavalent chromium Cr (VI) is among these heavy metals. Chromium is a common contaminant in both surface and groundwater. Its concentration increase is a result of numerous natural and industrial activities. The textile industry is considered among the major players impacting the increase of Cr (VI) contaminations, in addition to leather tanning, electroplating, and metal finishing [1,2]. Chromium can be found in several oxidation forms ranging from Cr (II) to Cr (VI) Cr (VI) [2,3,4], among these states, Cr (III) and Cr (VI) are the most dominant and stable compounds. Even though both oxidants are interconnected and can form each other either by oxidation or reduction, the physical and chemical characteristics of both compounds are relatively opposite [5]. AsCr (III) is less mobile, stable, and nontoxic; Cr (VI) on the other hand, is reactive and toxic in excess concentrations and is responsible for developing various harmful diseases [5,6,7]. Cr (VI) has been reported to be responsible for lung cancer, chromeulcers, nasal septum perforation, brain damage, and kidney damage [7,8]. The WHO guidelines concentration for Cr (VI) limit is 0.05 mg/L, the United States Environmental Protection Agency (US EPA) has identified Cr (VI) as one of the seventeen chemicals posing a threat to humans and has set a maximum allowable concentration in the effluent discharge of 0.1 mg/L [9,10].
Various studies have been conducted on the removal of Cr (VI) using different techniques; precipitation is among the first chemical remedies chemists looked upon. The process involves the transformation of dissolved metals into insoluble solids followed by physical separation such as clarification and/or filtration. Sodium hydroxide and lime were tested and have shown satisfying results in chromium removal [8]. The use of electrochemical precipitation (ECP) which can be considered as a modified precipitation technique was tested on electroplating wastewater containing high concentrations of chromium. The technique involved the use of a bipolar ECP unit operating under 6.70 amp/m2 power and pH 4.5, the study revealed removal of 85.1% of Cr by precipitation [11]. However, despite the efficiency and simplicity of precipitation in Cr and heavy metals removal in general, several drawbacks were reported when applying this technique—such as large volumes of sludge generation including the additional waste-disposal costs besides, as each dissolved heavy metal has its distinct level of pH and operating conditions for its removal—hence reducing the reliability on precipitation as a large scale treatment method [8].
Adsorption of chromium from wastewater, by either natural or synthetic means, has been under focus for some time. Considerable efforts were made to control the Cr (VI) concentration within the recommendation level using activated carbon generated from natural resources—i.e., rice straw activated carbon [12], apple pulp [13], nuts [14,15], and sugar cane bagasse [16]. These adsorbents have proven to be cheap, efficient, and environmentally friendly with high removal efficiency; however, most of these reported materials have to undergo many physical and chemical treatments before gaining the capacity to operate as an adsorbent [17,18]. Table 1 summarizes different technologies reported in the literature for Cr (VI) removal and their efficiencies.
The application of membrane technology in the removal of chromium has been a formidable technique that is presented in the literature [19,20,21]. Nanofiltration, ultrafiltration and RO were tested and compared in the removal of mono and divalent ions independence of pH and feed solutions by monitoring ion rejection and membrane flux. Obtained results revealed removal of Cr (VI) ions to more than 90% under different operating conditions of altering pH, conductivity, and pressure, whereas nanofiltration and ultrafiltration systems recorded a range of removal percentage between 25 to 95 and 30 to 90 respectively under the same operating conditions [22]. Seawater reverse osmosis high rejection (SWROHR) and brackish water reverse osmosis membrane (BWRO) types were investigated in the removal of chromium from wastewaters with the study of pH effect, operating pressure and solute concentration on the chromium rejection. Results concluded dependency on membrane type with an optimum pH value of 3 for more effective removal of chromium. Brackish water reverse osmosis membranes had a higher rejection percentage of 91% in comparison to that obtained using seawater reverse osmosis high rejection membrane SWROHR [1].
Membrane life span and permeate flux are primarily affected by the solute build-up on the surface of the membrane. Accumulation of solute retained leads to increasing permeate flow resistance at the membrane wall region [23]. This phenomenon can be controlled in a membrane module by velocity alteration, pulsation, ultrasonication, or electrical fields [24,25]. Permeate and salt passage within membrane increases with increasing feed water temperature with a reported 3% increase in water production rate for each degree rise in temperature. However, the increase in feed water temperature accelerates the rate of membrane degradation. High temperature also affects the membrane retention coefficient. Low membrane retention is obtained at high temperatures. Therefore, optimizing the operation of reverse osmosis system should be studied to maintain the desired product water quality at the optimum operating variables [26,27,28,29].
This work investigates chromium VI removal from artificially generated wastewater using reverse osmosis. The effect of incremental increasing pressure on the permeate flux was studied under different operating temperatures. The influence of feed pressure level, feed flow rate, and feed concentration were investigated. Membrane rejection of chromium was monitored by measuring the permeate concentration.
2. Materials and Methods
2.1. Chemicals and Membrane
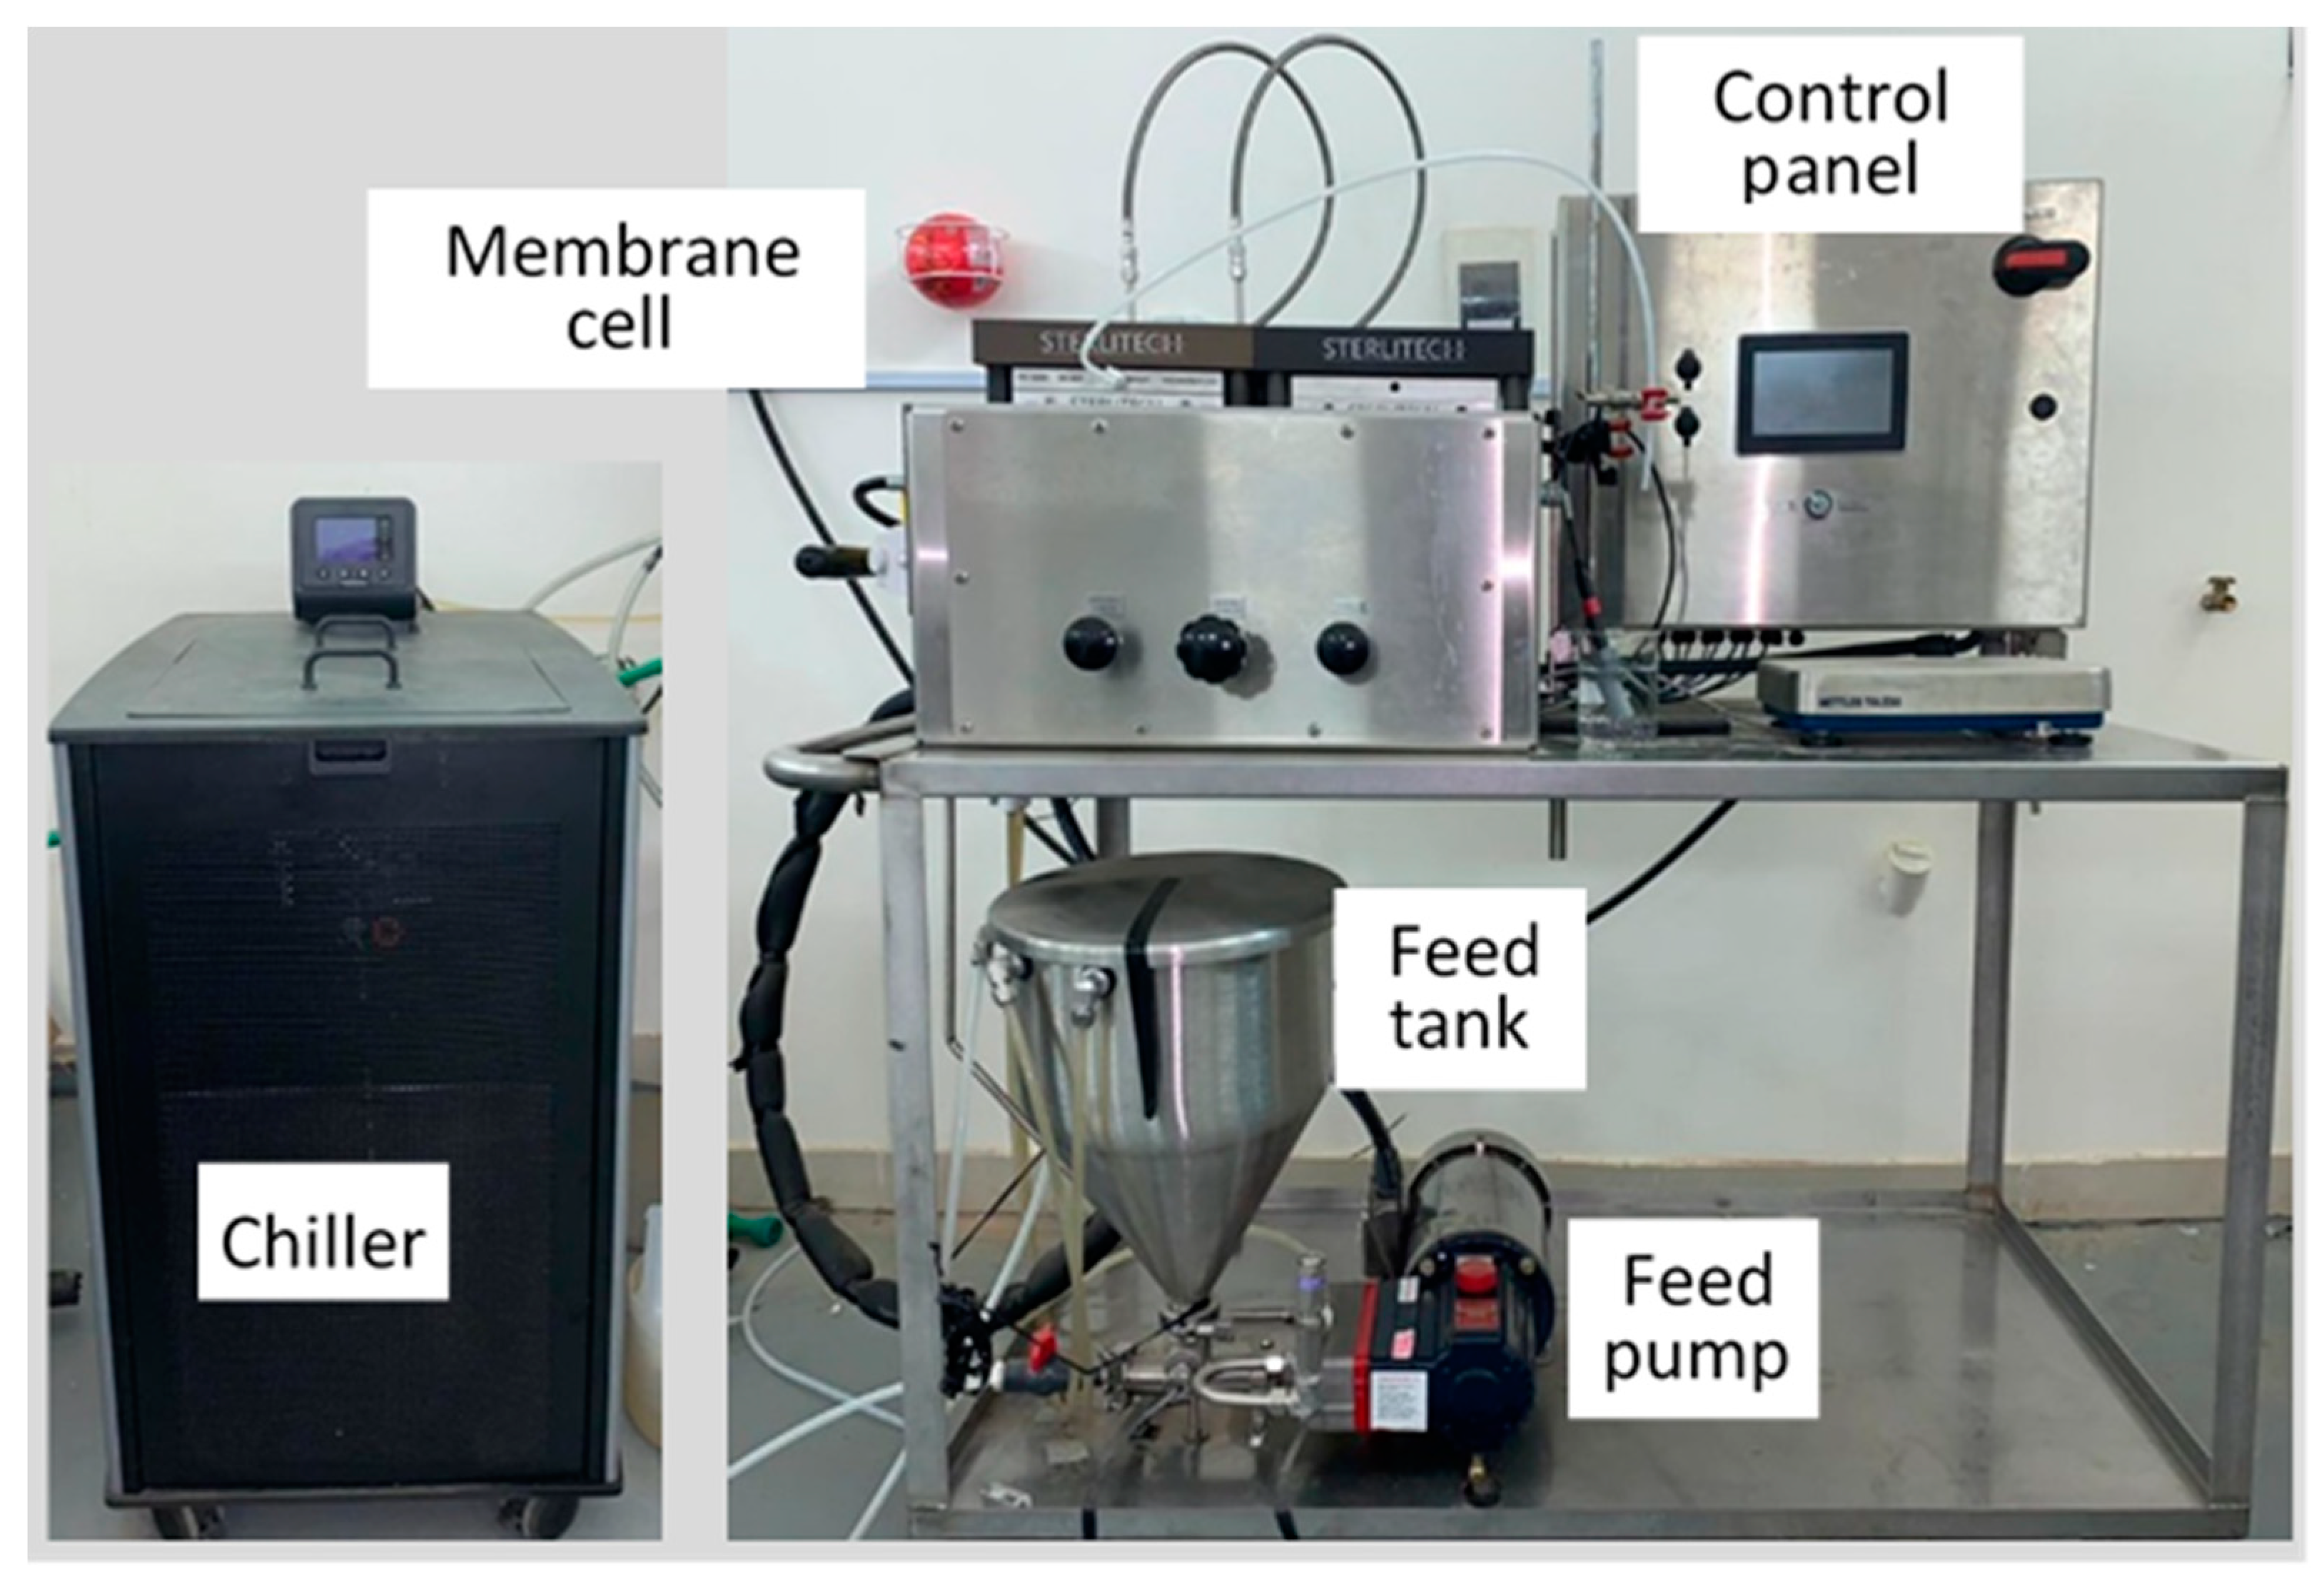
The tested aqueous solutions were made of potassium dichromate (K2Cr2O7)—analytical grade—obtained from Merck Co. (Darmstad, German)—in concentrations of 5, 30, and 100 mg/L. Dow Polyamide TFC Flat Sheet Membrane, BW30XFR, with pH range from 2–11, molecular weight cutoff (MWCO) 100 Da with an effective membrane area of 140 cm2, a rejection tolerance of 99.7% and operating pressure of up to 50 bar, was tested over Sterlitech Sepa Cell bench-scale cross/tangential flow membrane cell holder. The testing rig is a Sterlitech Sepa CF 042 membrane Digital Membrane Test Skid consisting of a high-pressure stainless-steel diaphragm pump with digital pressure and flow meters supported with a five-gallon stainless steel feed tank with a controllable operating pressure up 69 bar. The rig is supported with a highly sensitive Mettler Toledo balance to measure the permeate weight.
2.2. Test Method
Experiments were conducted using flat sheet membranes. The top plate of the membrane cell was made with flow channels and the bottom was used as support with permeate passage. The experimental setup is presented in Figure 1. The feed mixtures of different chromium concentrations (5, 30, and 100 ppm) were treated with commercial polyamide RO membrane in crossflow circulation mode. The feed concentration was maintained at a constant value by continuous recycling of permeate and retentate to the feed tank. The experimental tests were run for 2–3 h at operating pressures of 10, 30, and 45 bar with controlled feed flow rates at 2.2, 3.4, and 4.5 L/min. The solution temperature was altered to 25, 35, 45, and 55 °C. Mass permeate was collected and weighed for a period of 10 min after reaching stable operation.
The flux (Ji) (kg/h·m2) (Equation (1) was calculated by the ratio of the permeate mass flow (mp) to the membrane surface area (A).
To evaluate the separation efficiency, the retention [R%] is calculated by comparing the concentration of the permeate (Cp) to those in the feed (Cf) according to Equation (2)
After each set of experiments, the testing rig was cleaned using distilled water for 10 to 20 min at a pressure of 5 bar and a new membrane sheet was mounted. Collected permeate samples were tested for Cr (VI) concentrations using UV spectrophotometer Shimadzu 1600 with a wavelength of 350 nm using the diphenylcarbazide method [31,32].
3. Results and Discussion
3.1. Membrane SEM Characterization
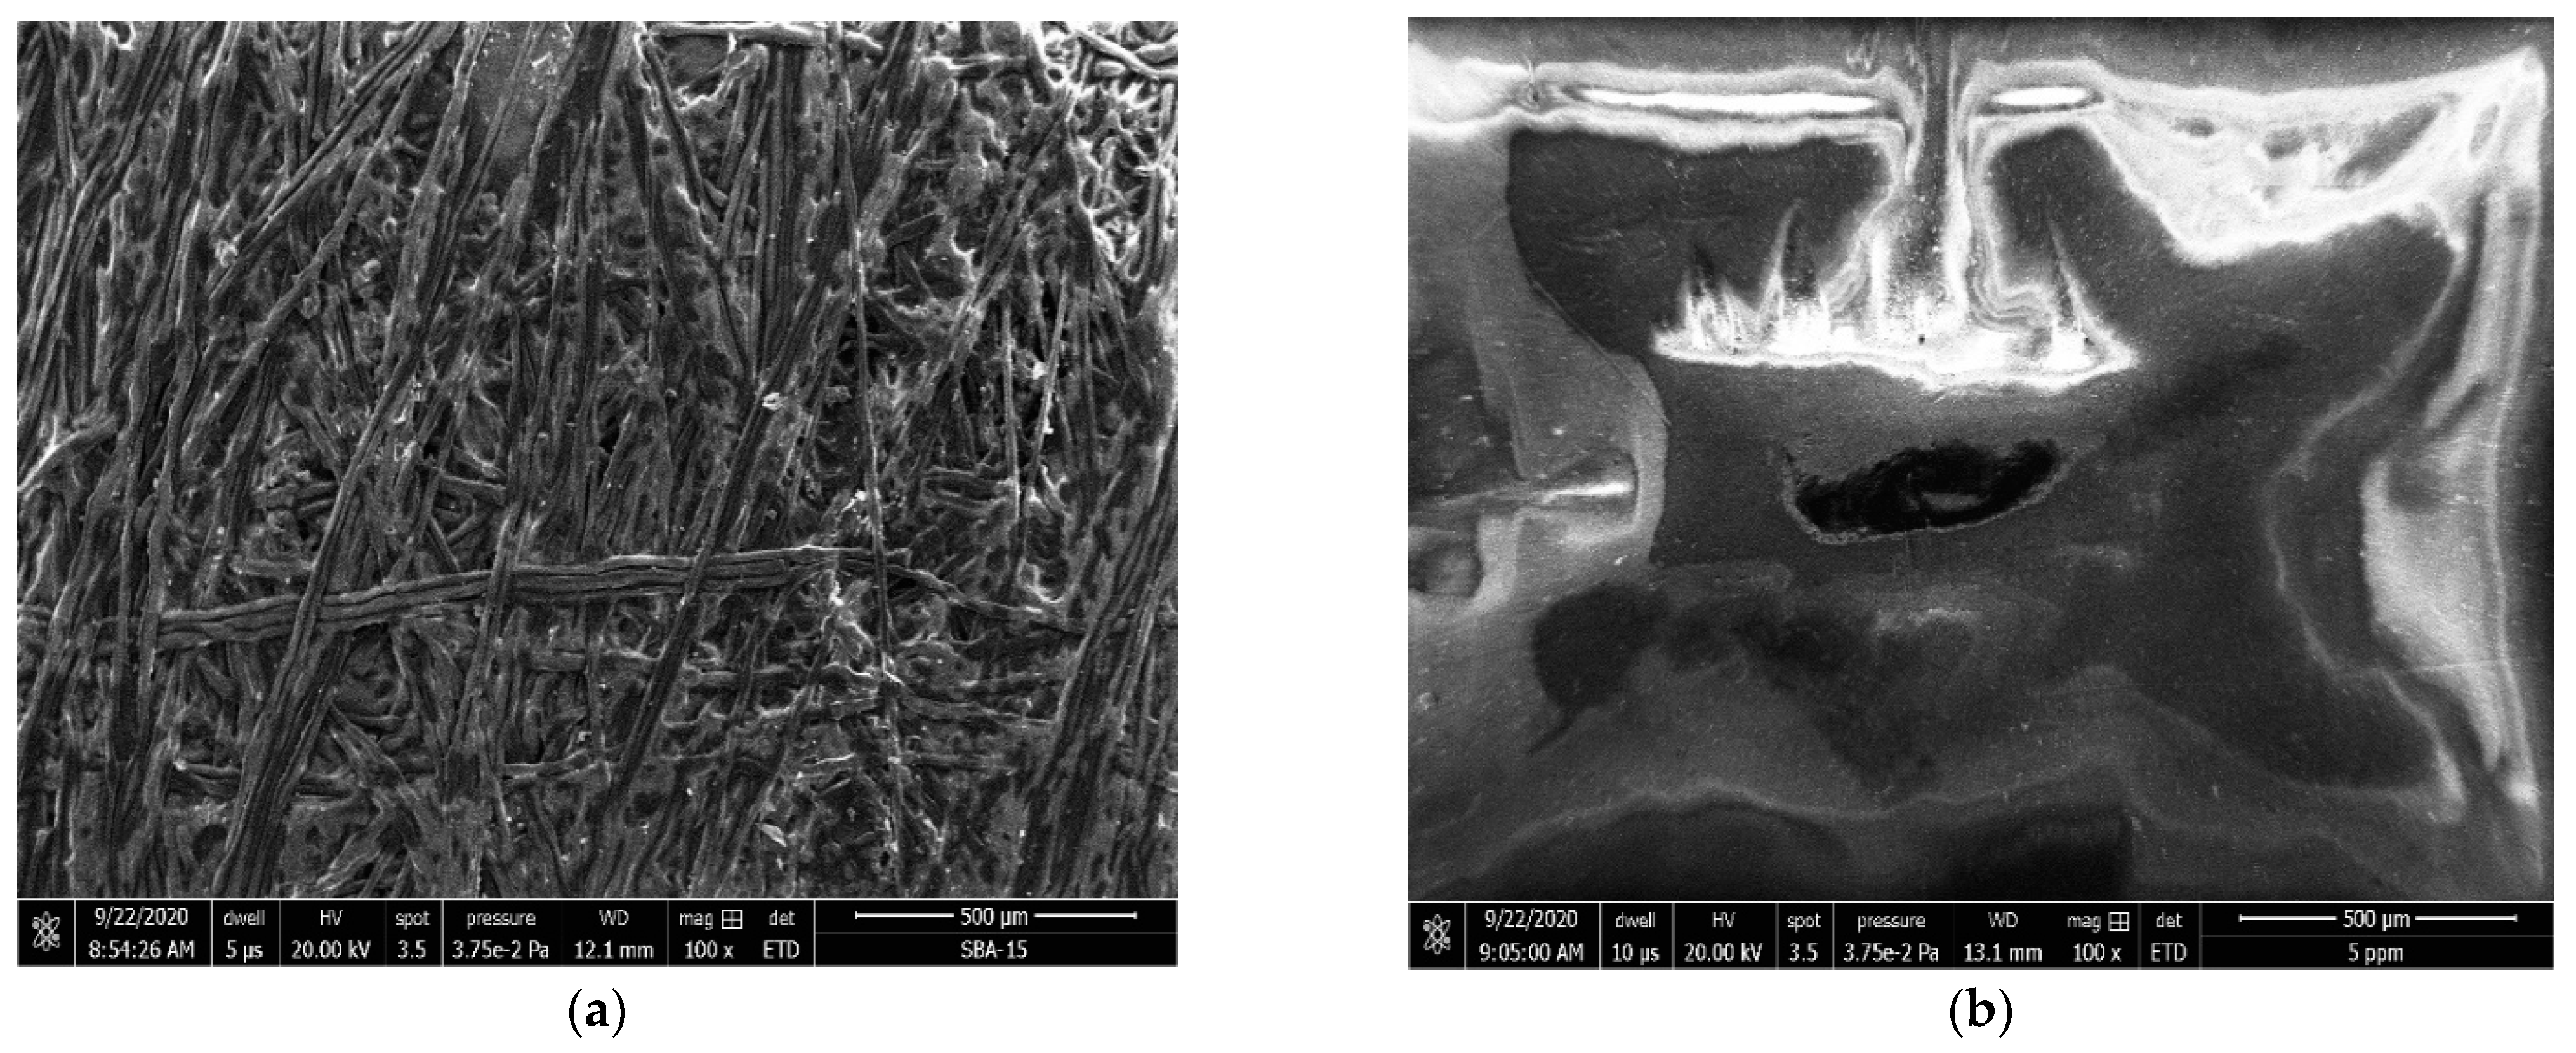
Figure 2 shows the SEM image of the membrane sheet surface. It shows the clear microstructure fibrous of the membrane surface, its dense and low porosity. In the adjusted figure the membrane surface appears completely affected by the phenomena of concentration polarization where solute accumulates on the surface after sample testing using 5 ppm Cr (VI) concentration using the same imaging conditions. It can be noted that accumulation of solute on the membrane surface has caused its fouling. Moreover, distribution of the solute on the surface can be noted which is caused by the spacer on which the membrane is placed, separating it from the plate.
3.2. Permeate Flux under Different Temperatures and Feed Flow Rates
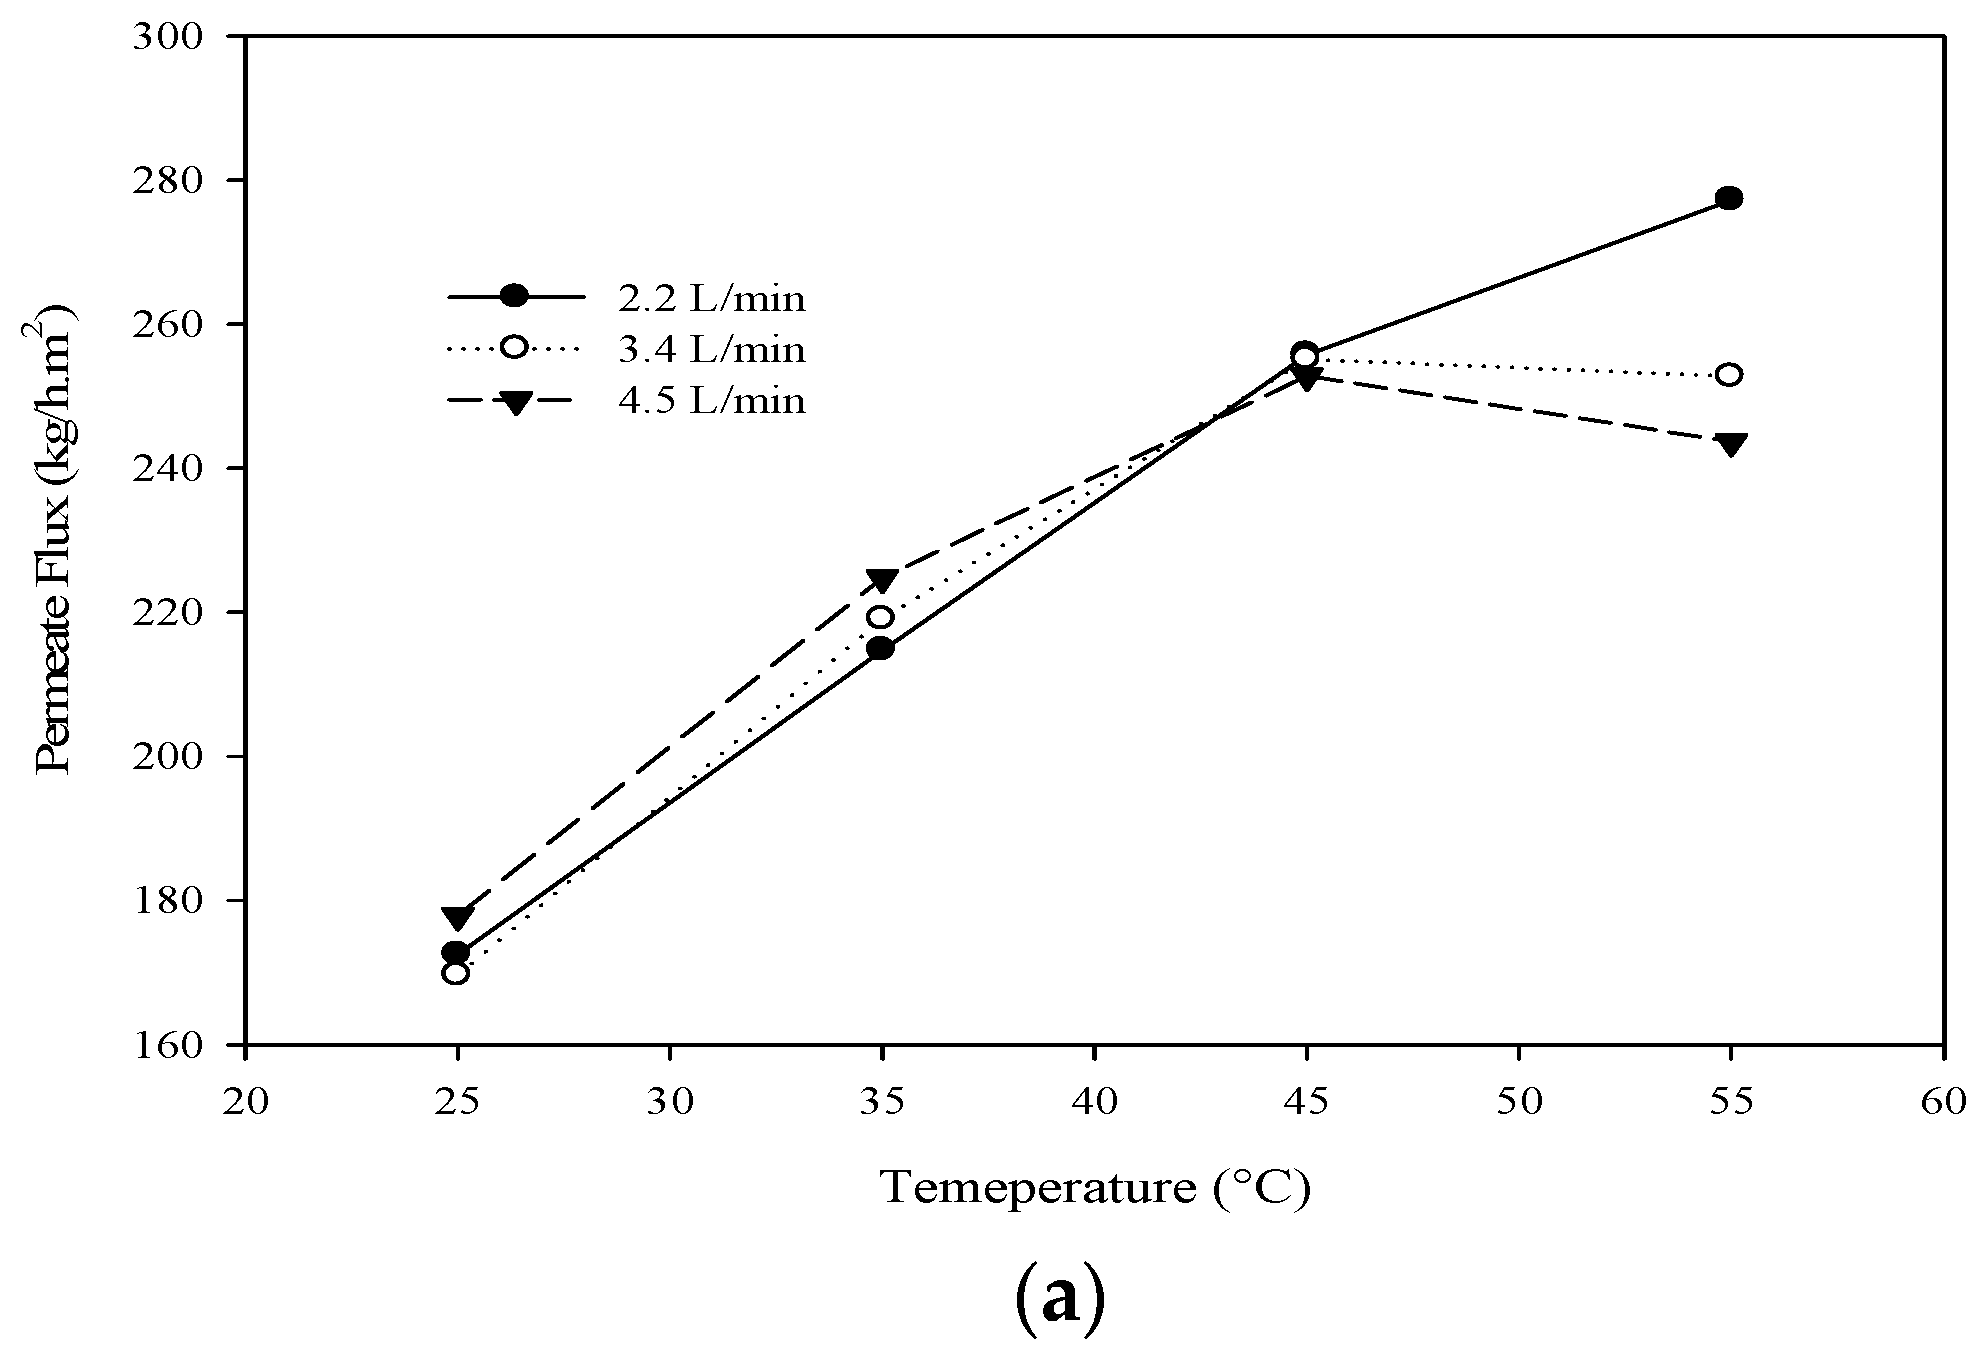
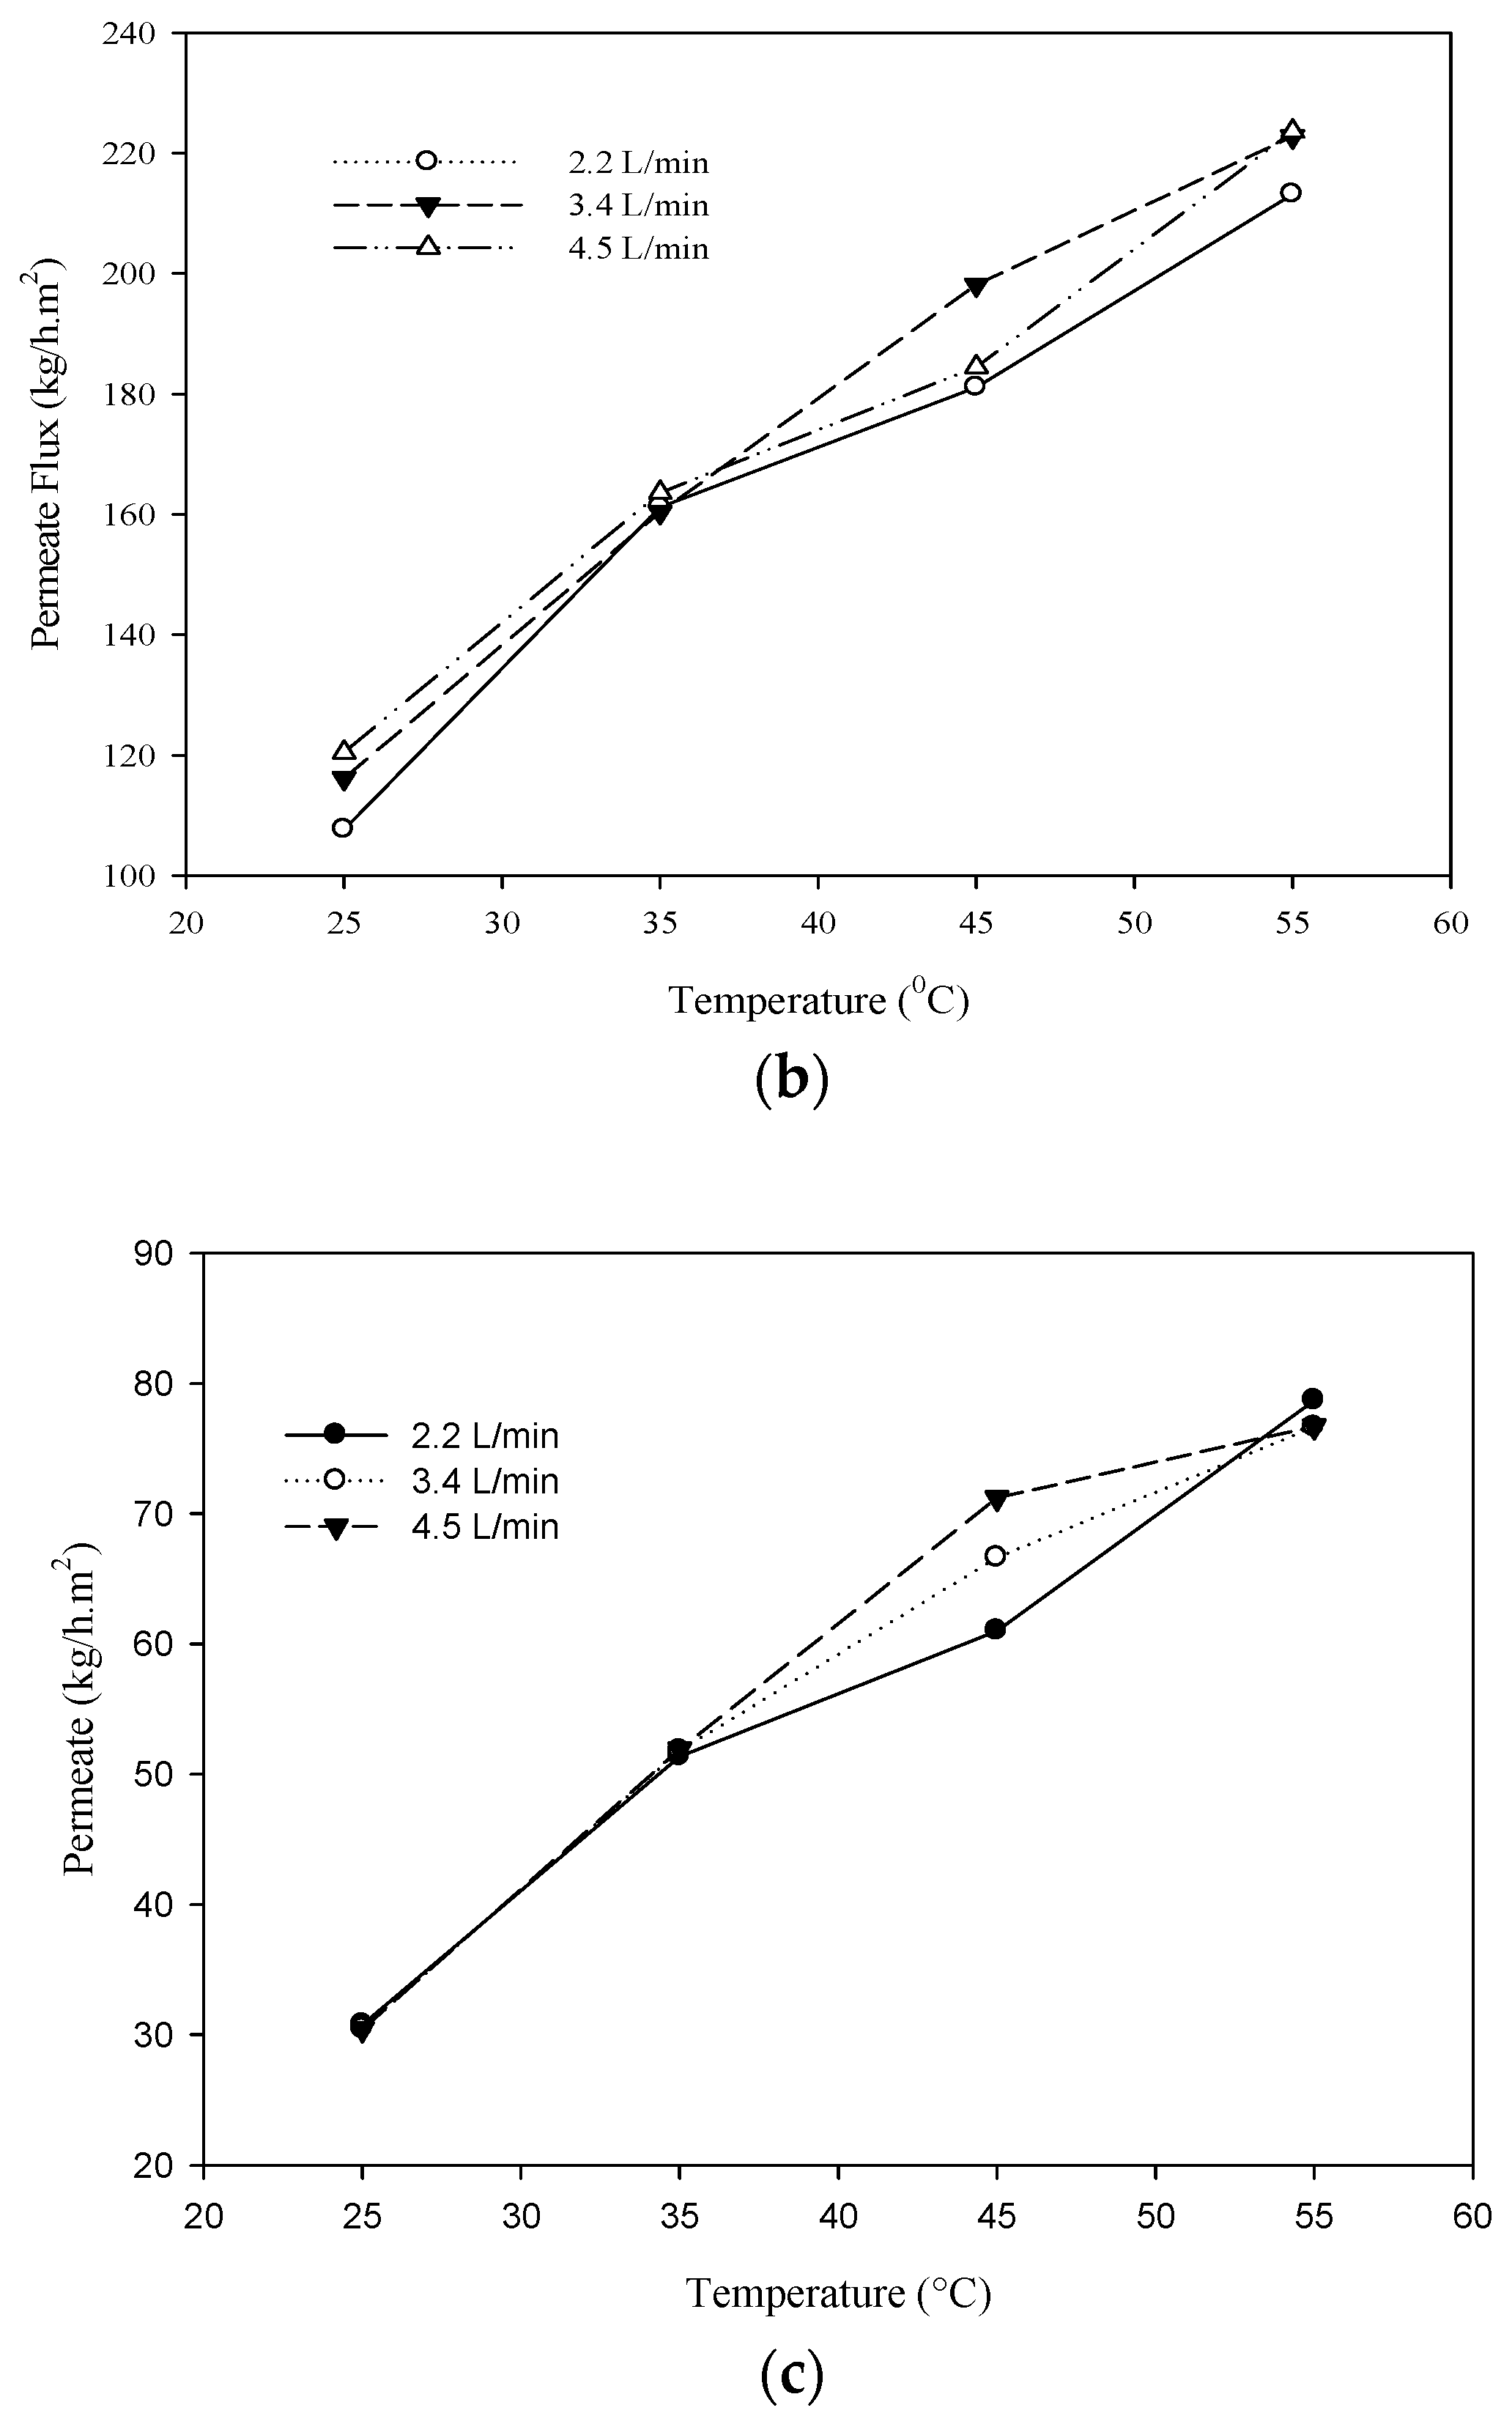
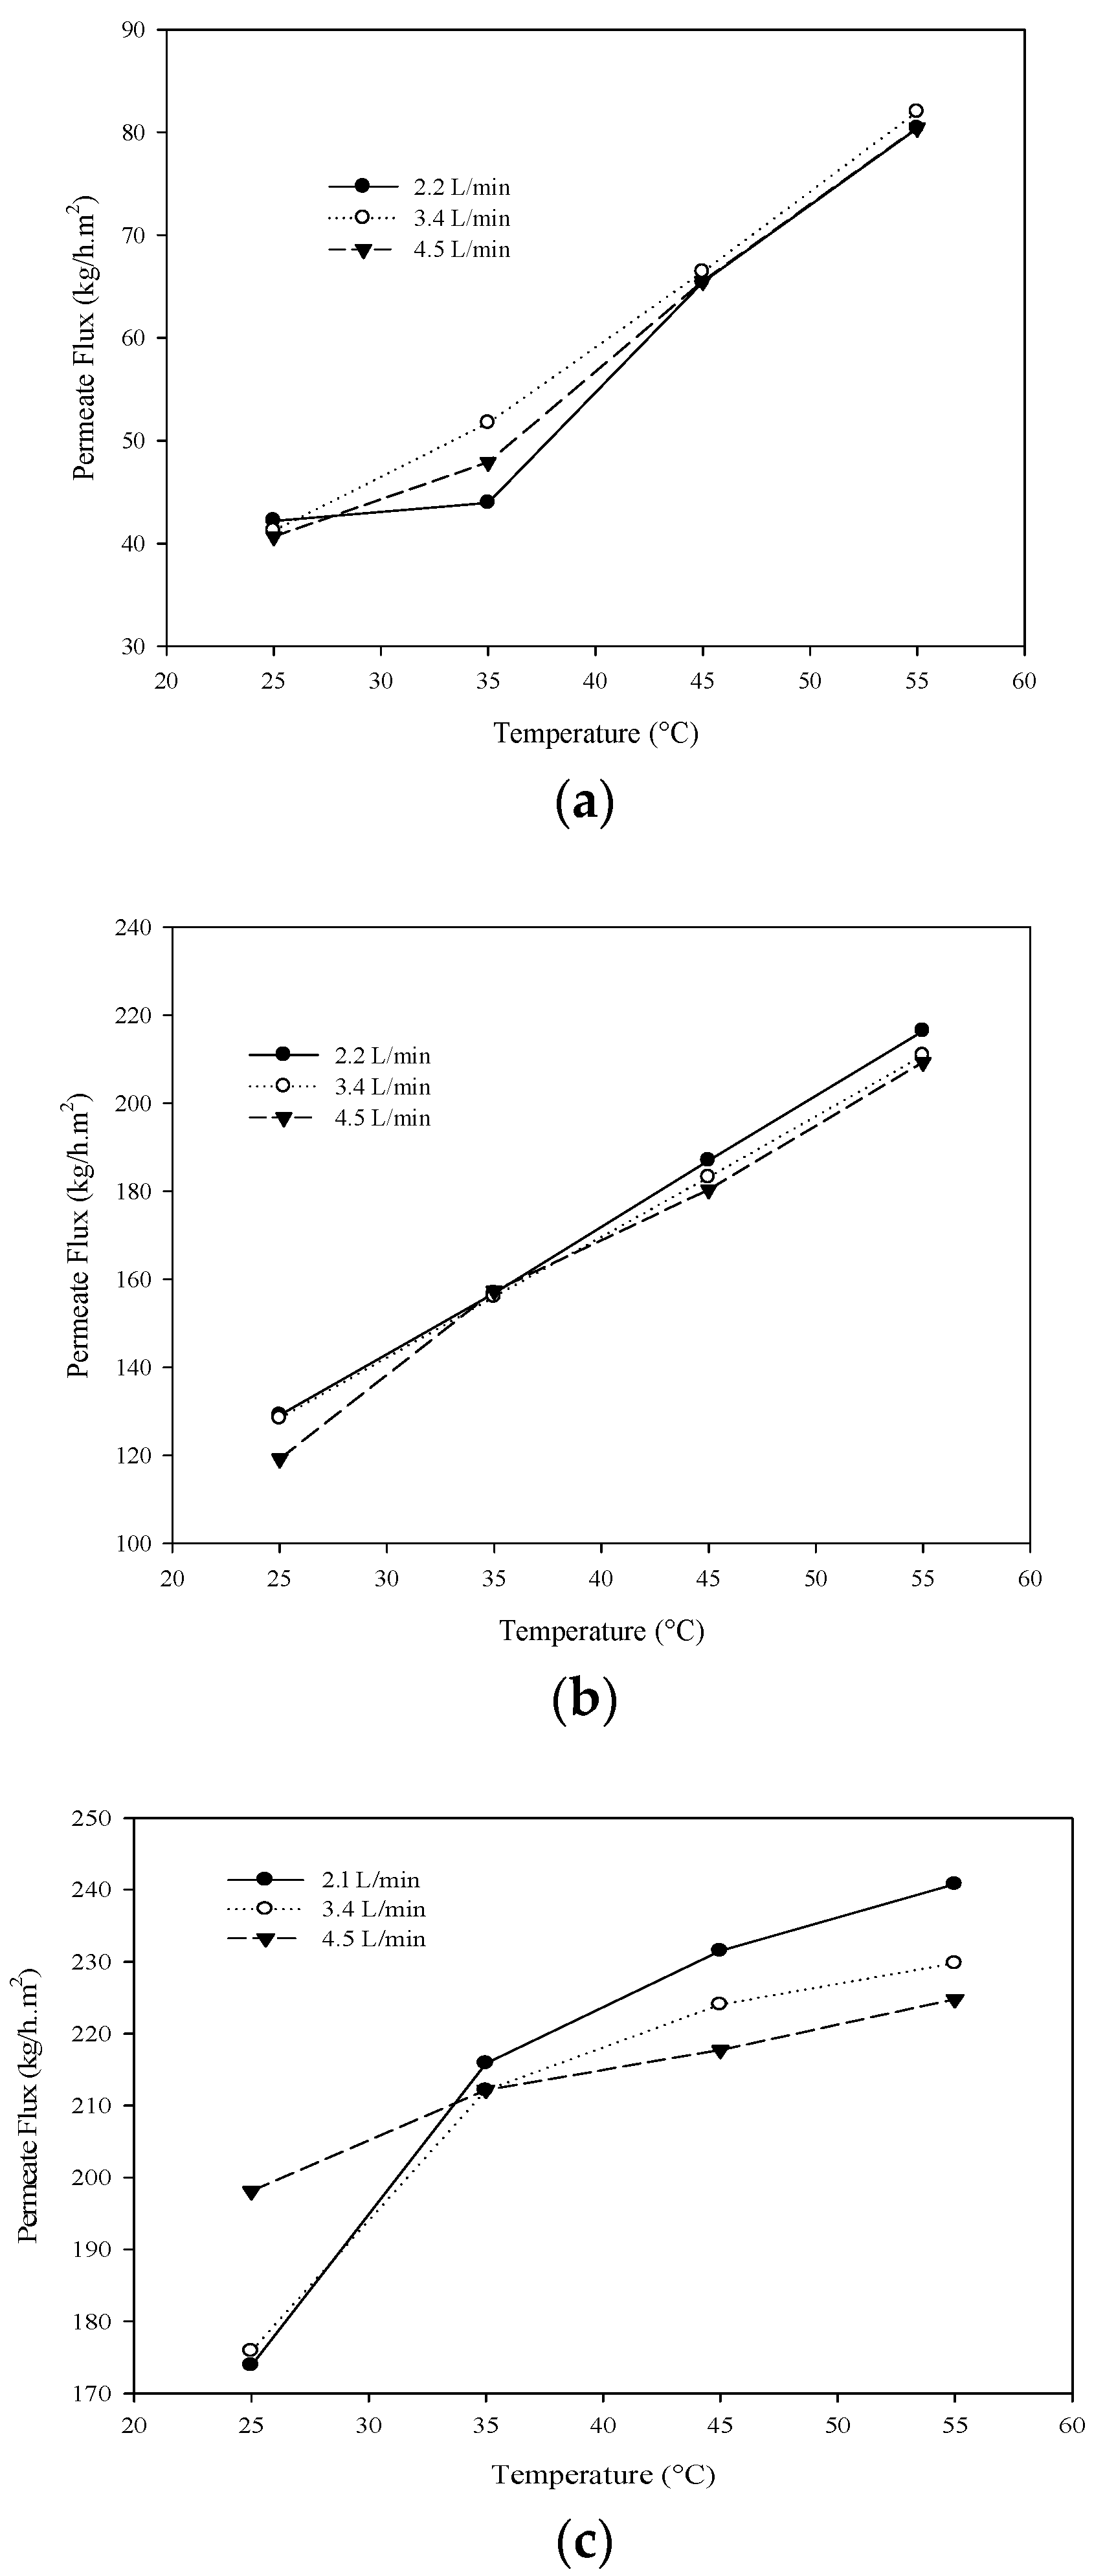
Figure 3 shows the effect of increasing the operating temperatures from 25 to 55 °C on the permeate flux with increasing feed flow rate from 2.2 to 4.5 L/min for 5 ppm Cr (VI) solutions concentration at 10, 30, and 45 bar consecutively. Results show that as temperature increases, higher permeate flux is obtained with increasing operating pressure. The increase of temperature from 25 to 55 °C has caused an increase in the permeate flux to 155% at 10 bar with 2.2 L/min flow rate whereas the permeate increase at 45 bar has been 60% at 2.2 L/min, 49% at 3.4 L/min, and 38% at 4.5 L/min with temperatures; 25, 35, 45, and 55 °C. It can thus be concluded that the lower feed flow rate has caused a higher increase in permeate flux with increasing temperature. On the other hand, increasing the feed flow rate from 2.2 to 4.5 L/min at constant temperatures has shown no significant alteration within the observed permeate flux obtained.
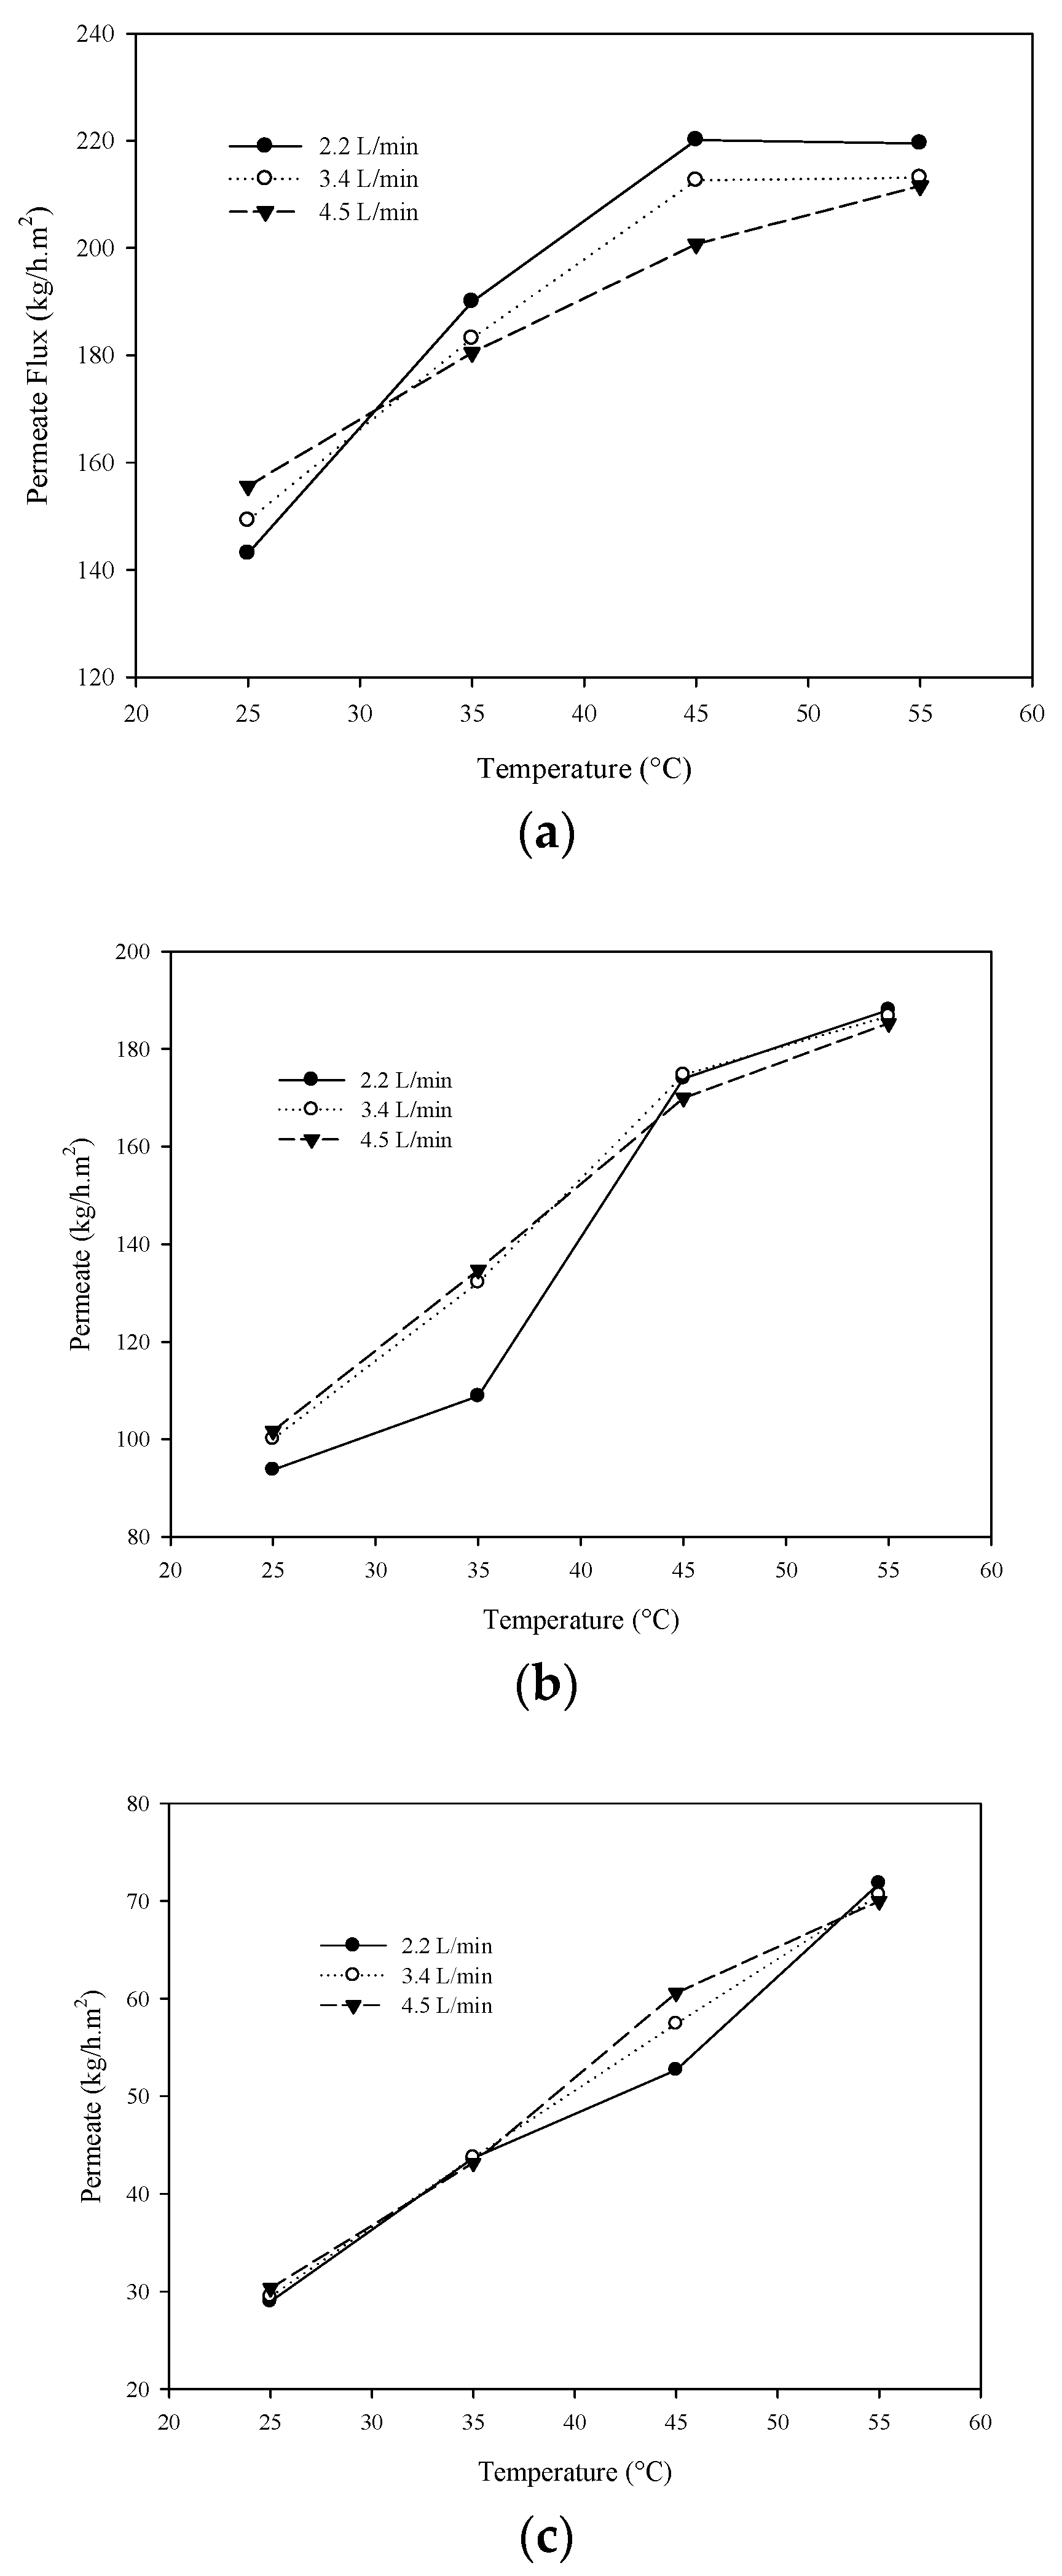
Figure 4 examines the same parameters for 30 ppm concentration. Results revealed an increase of permeate flux to 90% at 10 bar with 2.2 L/min flow rate whereas the 45 bar increase was only 13% with 4.5 L/min flow rate with temperature increase from 25 to 55 °C. Similarly increasing the feed flow rate from 2.2 to 4.5 L/min at constant temperatures has shown no alteration in permeate flux; therefore, it can be noted that the increase in permeate flux is caused by the increase in temperature and operating pressure only. This finding is true based on Speigler–Kendem–Katchalsky model where the driving force for solute transport through membrane medium is governed by pressure and concentration respectively [33].
When looking at the effect of increasing the operating pressure from 10 bar to 30 bar the permeate flow rate has noted to be increased for 5 ppm Cr (VI) concentration from 30 to more than 100 kg/h·m2 of permeate flux at 25 °C, which is almost 250% increase (Figure 4). The next increase for the operating pressure was from 30 bar to 45 bar and as expected for 5 ppm concentration, permeate flux has shown an increase from 107.6 kg/ h·m2 with a 2.2 L/min flow rate at 25 °C to 172.5 kg/h·m2 at the same conditions. This increase is not as significant as that obtained from increasing the pressure from 10 to 30 bar which was more than 300 times. The feed flow rate has also shown limited alteration on the permeate flux at this point Figure 5.
With increasing Cr (VI) concentration to 30 and 100 ppm under the same investigated conditions, overall results show a similar pattern when increasing permeate flux as operating temperature increases, 30 ppm concentration recorded an increase of 112%, whereas 100 ppm had an increase of 143%. In addition, different profiles were obtained as presented in Figure 5. The effect of increasing the feed flow rate was not similarly observed at 10 bar operating pressure. Similar findings were also concluded when evaluating the permeate flux with 100 ppm concentration at 10 bar operating pressure, where the same trend of increasing permeate flux was noticed as temperature increases without clear impact on permeate flux under different feed flow rates.
3.3. Chromium VI Rejection under Tested Conditions
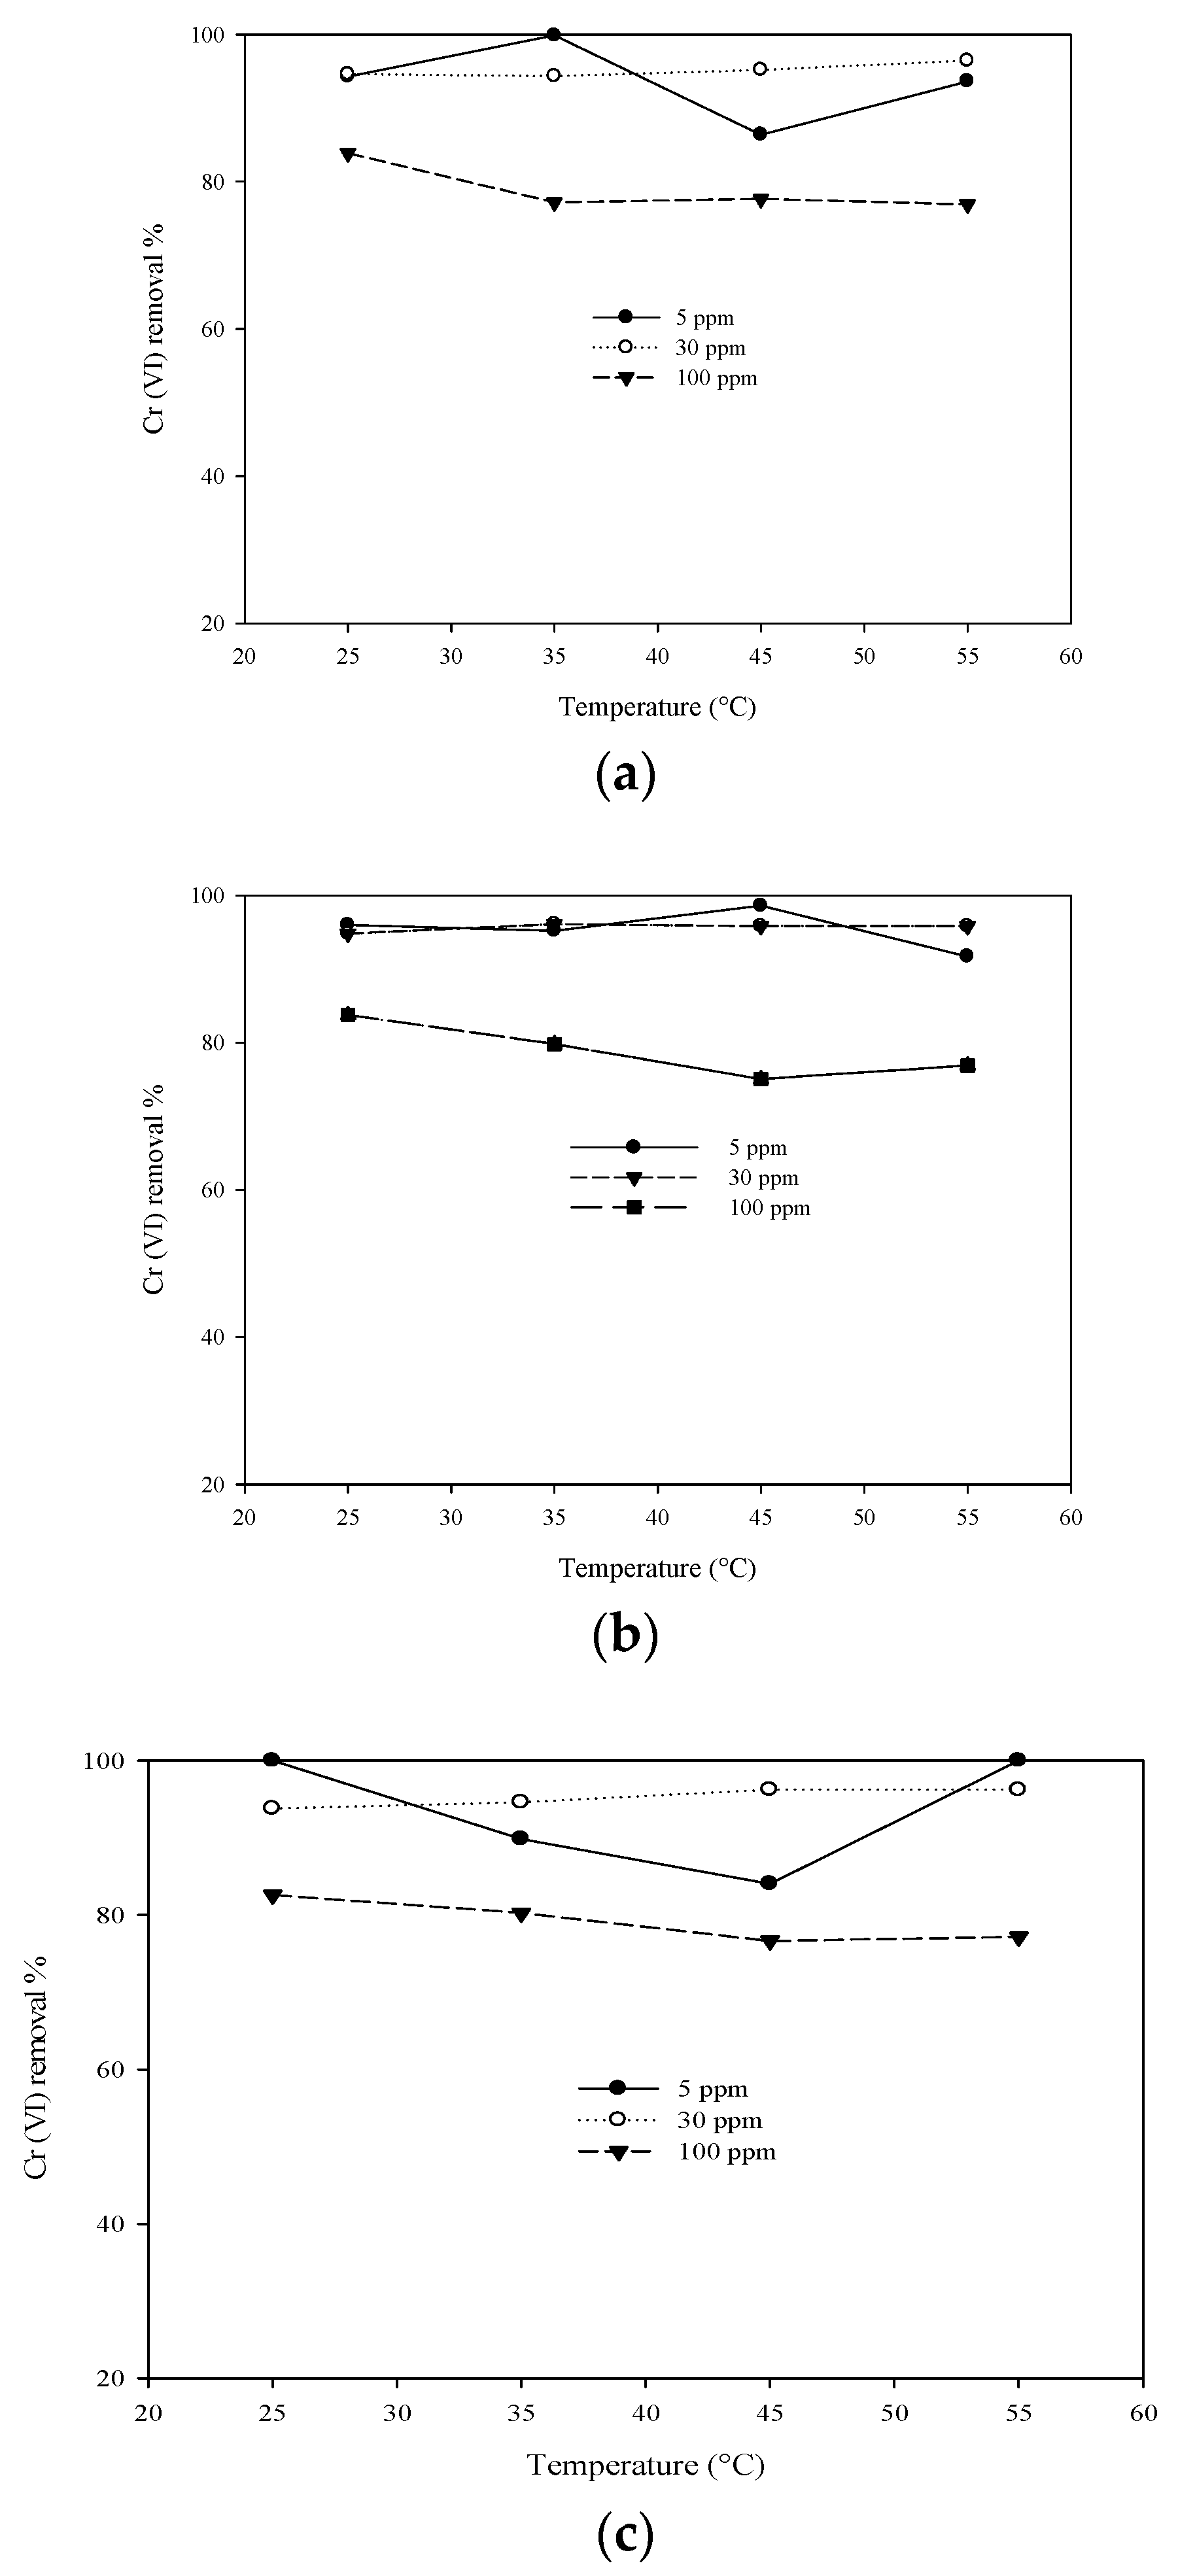
The rejection percentage calculated has revealed a range of removing percentages from 100% removal to as minimum as 80%. Figure 6 shows the rejection percentage of different concentrations at 4.5, 3.4, and 2.2 L/min feed flow rates and 10 bar operating pressure under different feed temperatures from 25 to 55 °C, it can be noted that samples with lower concentrations—5 ppm—were having higher removal than that obtained at 100 ppm indicating increasing concentration polarization on membrane surface thus decreasing Cr (VI) rejection. However, the impact of temperature under the tested conditions revealed a limited effect on the removal obtained.
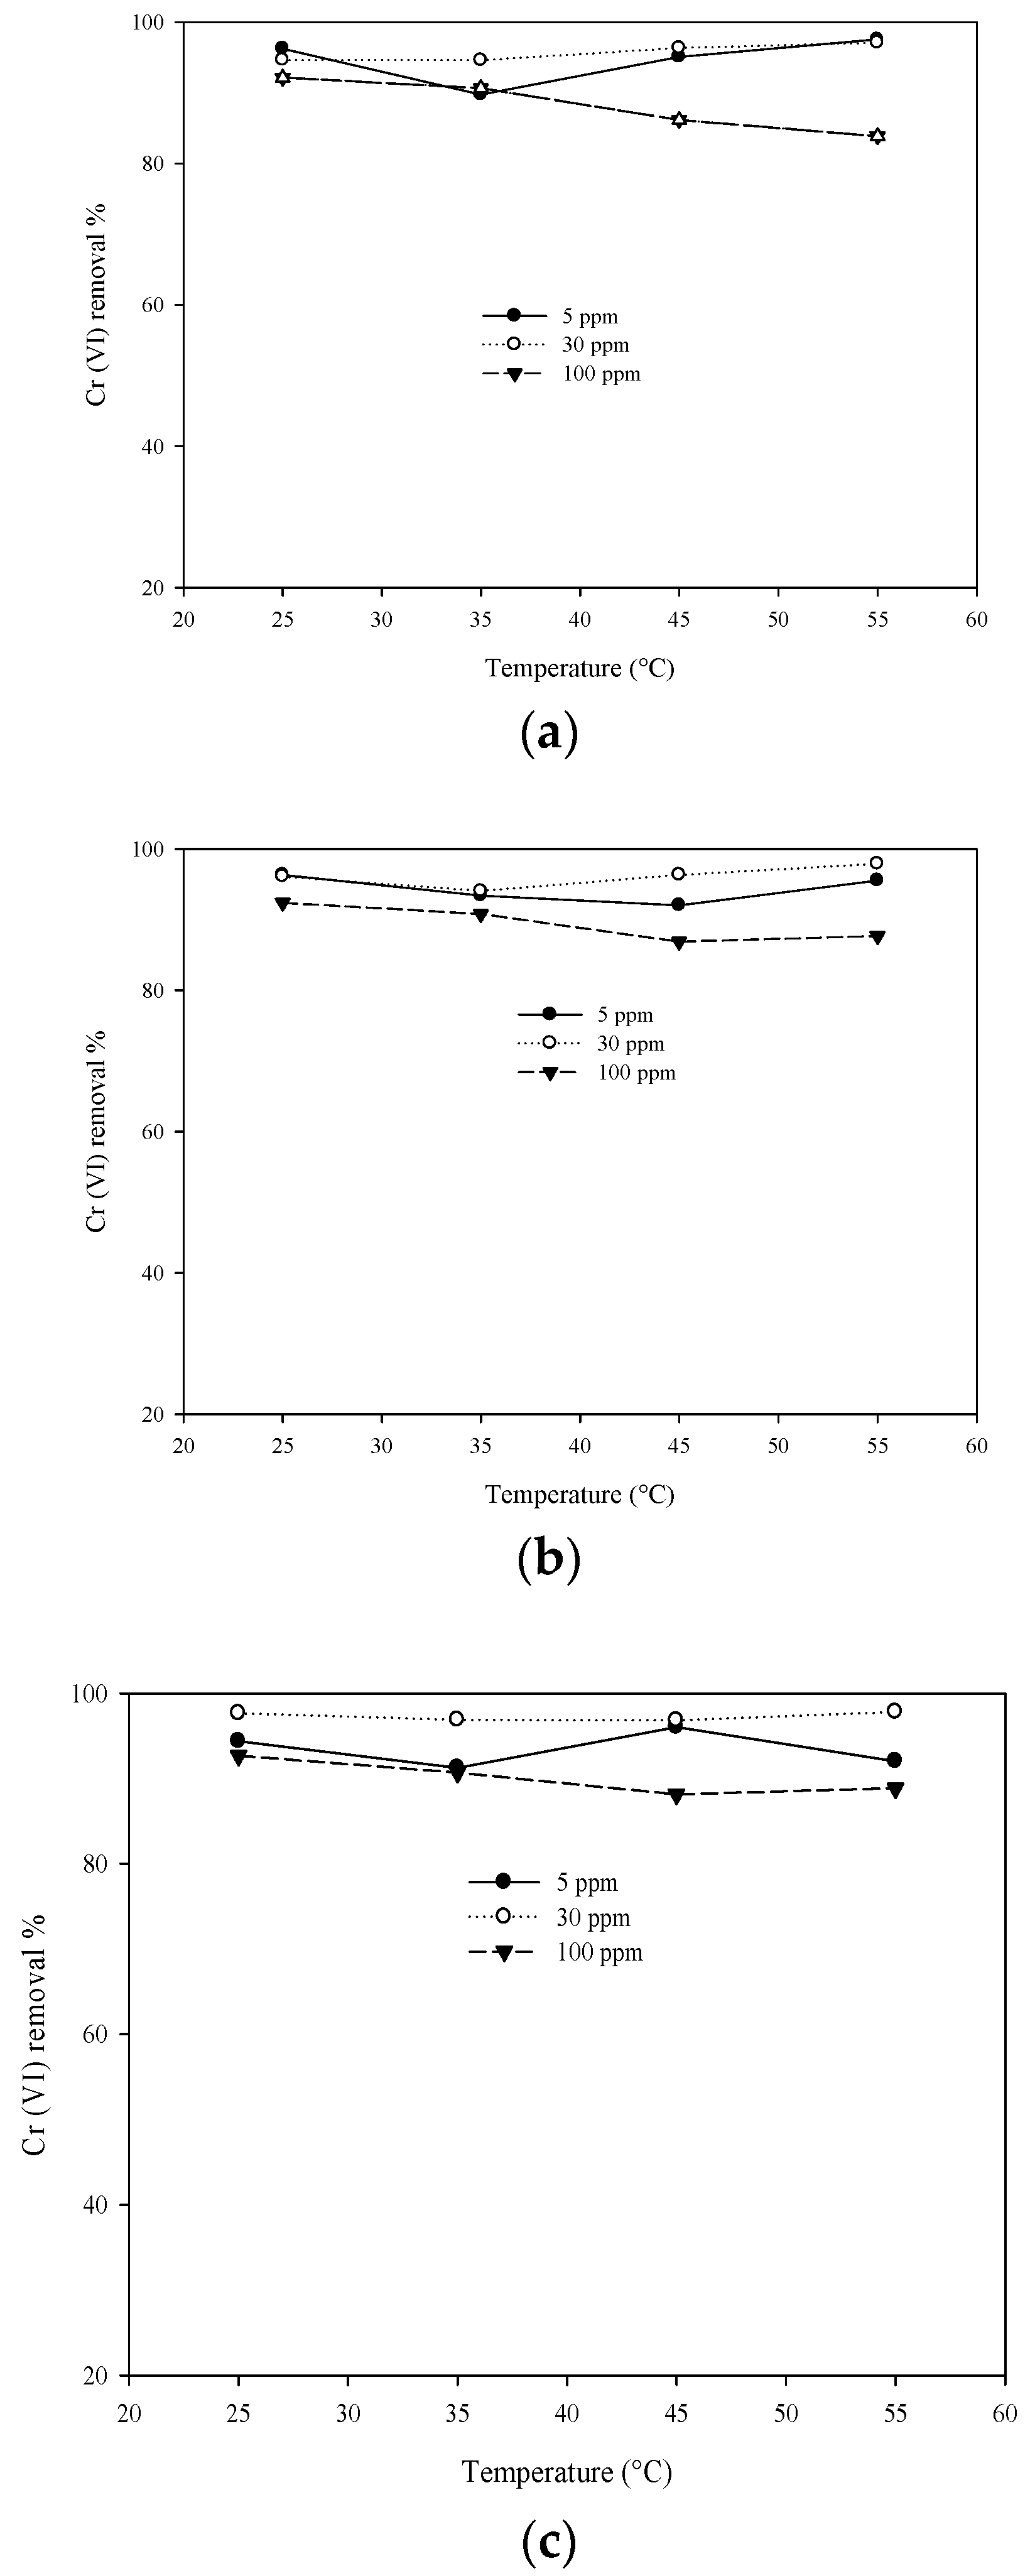
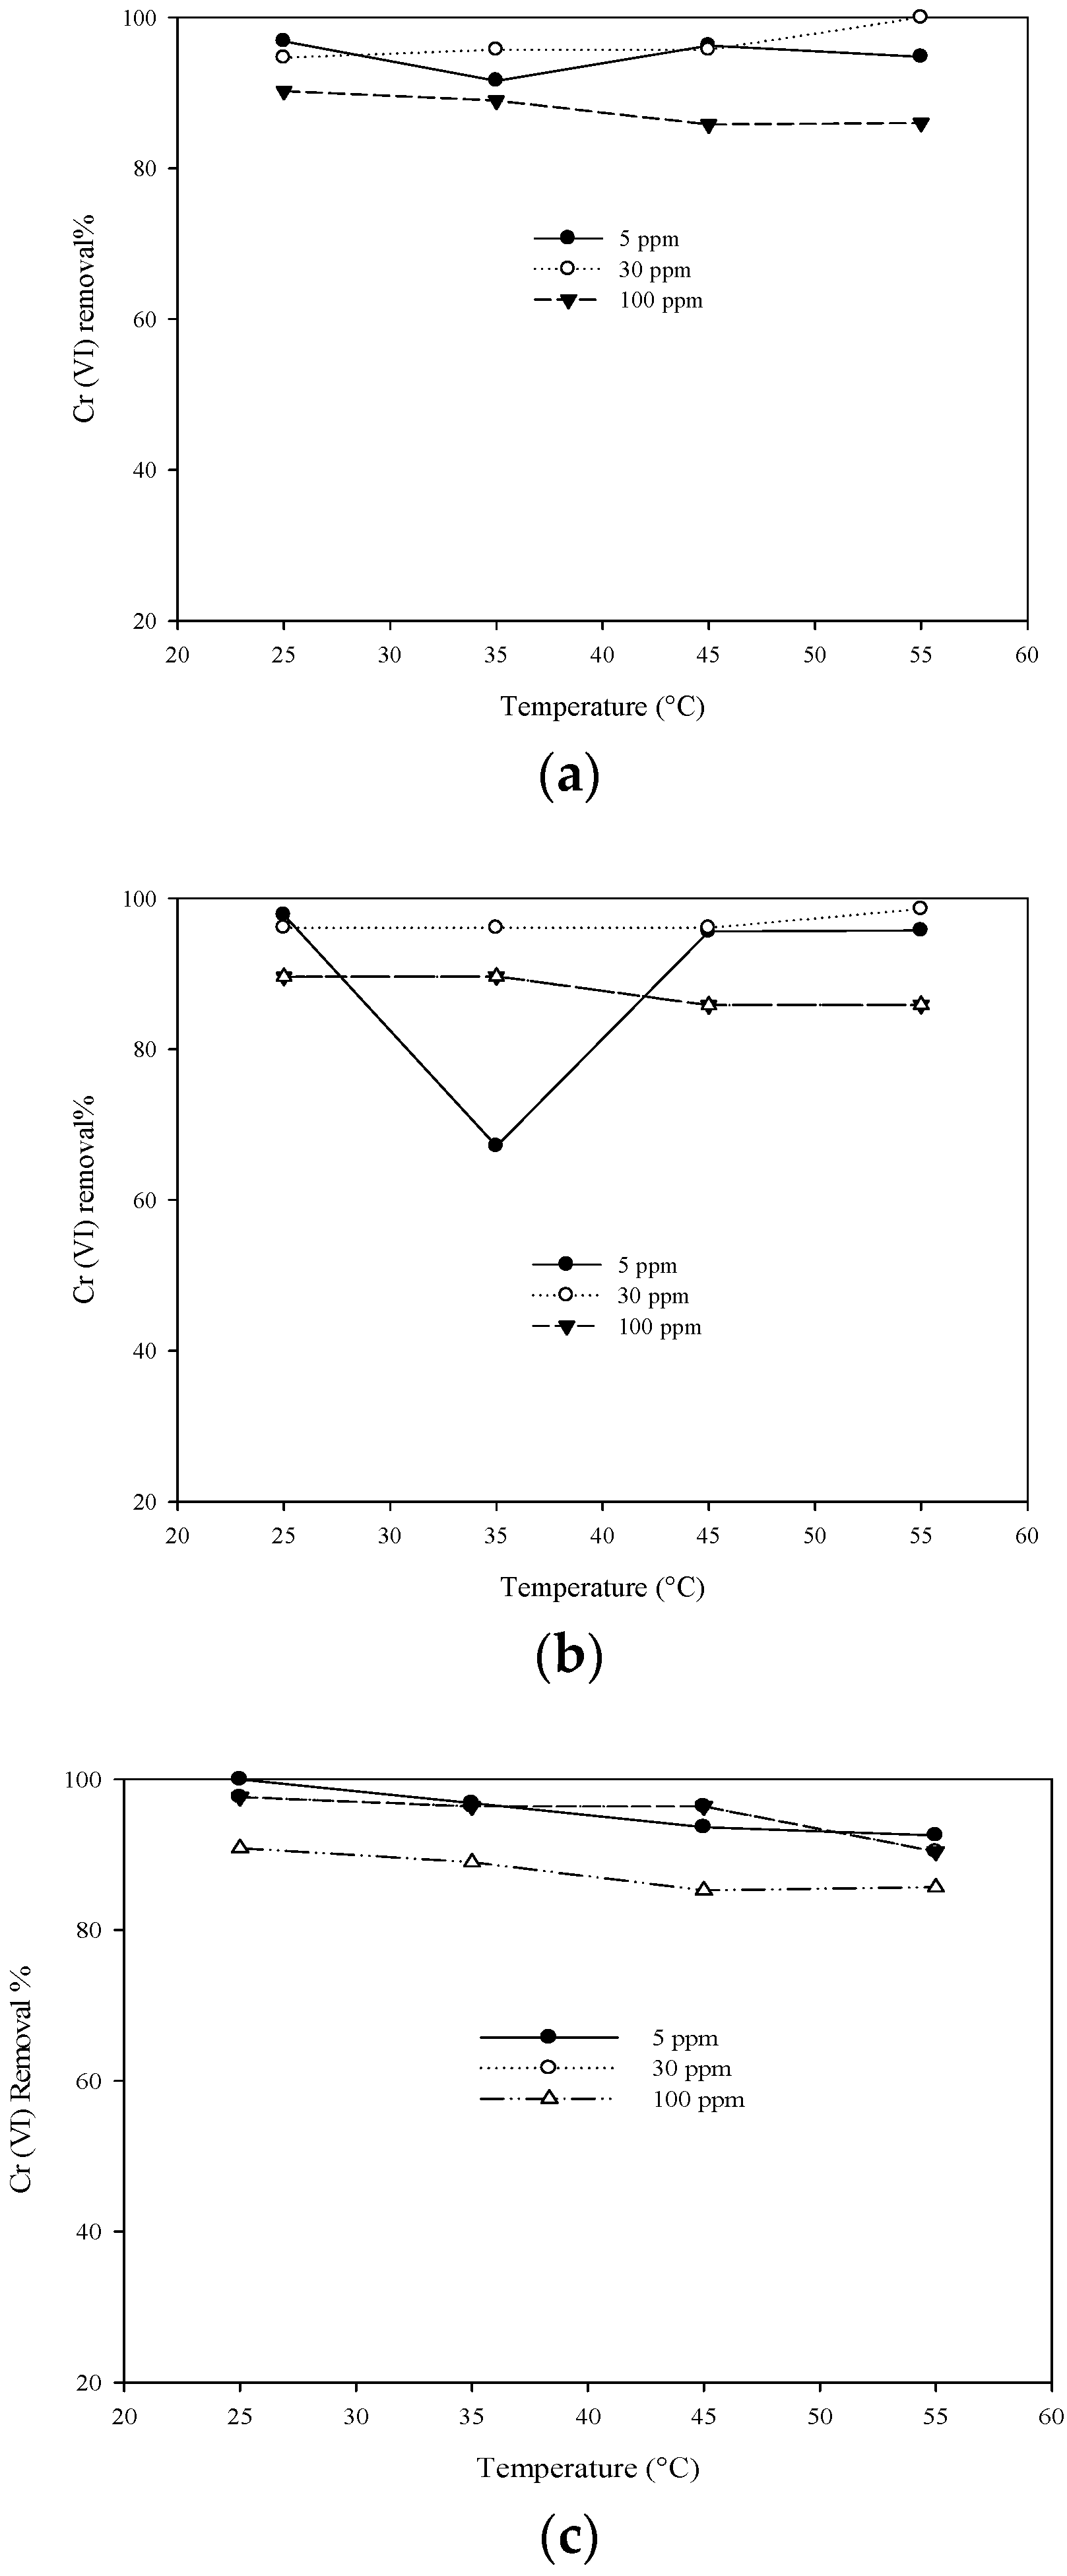
When looking at the rejection calculated at 30 bar operating pressure under identical operating conditions; removal of 90% was obtained at higher temperatures than those obtained at lower (Figure 7). In addition, the increase of flow rate results in limited effects similar to the temperatures, concluding that rejection is mainly dominated by the concentration rather than operating conditions. Identical findings are also presented with 45 bar operating pressure (Figure 8).
As feed concentration increases, it has been noted that permeate flux flowrate decreases which are justified by concentration polarization on the surface of the membrane with feed concentration increases. Pressure increase, on the other hand, has also increased rejection percentage, justification for this is presented by [9] arguing that concentration polarization phenomenon is overcome by increasing pressure which forces more ions through membrane pores, hence having higher rejections.
3.4. Temperature Impact of RO Performance
As a rule of thumb, membrane permeation increases as temperature increases due to the reduction in the solution’s viscosity in addition to the increase in the diffusion phenomenon through the membrane surface. As a consequence, permeation flux is noted to increase with increasing temperature. It is reported that the change in permeate flux with temperature is governed by the temperature correction factor TCF calculated from Equation (3), [26]
Accordingly, Table 2 shows the calculated Temperature correction factor from the permeate flux due to temperature rise for 100 ppm concentration at different operating pressure and flow rates. It can be noted that there is a significant increase in the TCF as the temperature increase which can thus lead to the conclusion of having higher permeate flux; however, when looking at the impact of increasing both the feed flow rate and the operating pressure, it can be noted that there is no significant change in the TCF values calculated.
4. Conclusions
The effect of temperature has been presented in this study. It can be concluded that polymeric membranes are very sensitive to changes in feed temperature. Results revealed that increasing temperatures from 5 to 55 °C causes an increase of permeate flux to more than 100%, this increase has been found to take place on different concentrations of Cr (VI), nevertheless, the feed flow rate has shown to have limited impact on the permeate flux. Thus, it can be concluded that the flux increase with temperature is due to changes in the physical properties of the polymeric membrane such as pore size swelling or possibly due to water diffusion through the membrane sheet thus allowing transit of large amounts of ions to the product, thus reducing the efficiency of the removal process. The salt rejection percentage was found to be inversely proportional to feed concentrations and the impact of feed flow rate showed little effect on the rejection percentage.
Author Contributions
Conceptualization, I.S. and A.E.; Methodology, A.E.A. and A.M.; Formal analysis, I.H.A. and E.I.B.; Writing—original draft preparation, I.S. All authors have read and agreed to the published version of the manuscript.
Funding
This research was funded by [the Deanship of Scientific Research, King Khalid University (KKU), Abha-Asir, Saudi Arabia] grant number [R.G.P.1/139/40].
Data Availability Statement
Not applicable.
Acknowledgments
The authors thankfully acknowledge the funding and support provided by the Deanship of Scientific Research, King Khalid University (KKU), Abha-Asir, Saudi Arabia, with grant number R.G.P.1/139/40 under Research Group Program to complete the research work.
Conflicts of Interest
The authors declare no conflict of interest.
References
- Çimen, A.; Kılıçel, F.; Arslan, G. Removal of chromium ions from waste waters using reverse osmosis AG and SWHR membranes. Russ. J. Phys. Chem. A 2014, 88, 845–850. [Google Scholar] [CrossRef]
- Jobby, R.; Jha, P.; Yadav, A.K.; Desai, N. Biosorption and biotransformation of hexavalent chromium [Cr (VI)]: A comprehensive review. Chemosphere 2018, 207, 255–266. [Google Scholar] [CrossRef] [PubMed]
- Ahalya, N.; Ramachandra, T.; Kanamadi, R. Biosorption of heavy metals. Res. J. Chem. Environ. 2003, 7, 71–79. [Google Scholar]
- Kumar, V.; Dwivedi, S.K. A review on accessible techniques for removal of hexavalent Chromium and divalent Nickel from industrial wastewater: Recent research and future outlook. J. Clean. Prod. 2021, 295, 126–229. [Google Scholar] [CrossRef]
- Gaikwad, M.S.; Balomajumder, C. Simultaneous rejection of fluoride and Cr (VI) from synthetic fluoride-Cr (VI) binary water system by polyamide flat sheet reverse osmosis membrane and prediction of membrane performance by CFSK and CFSD models. J. Mol. Liq. 2017, 234, 194–200. [Google Scholar] [CrossRef]
- Cheung, K.; Gu, J.-D. Mechanism of hexavalent chromium detoxification by microorganisms and bioremediation application potential: A review. Int. Biodeterior. Biodegrad. 2007, 59, 8–15. [Google Scholar] [CrossRef]
- Mnif, A.; Bejaoui, I.; Mouelhi, M.; Hamrouni, B. Hexavalent chromium removal from model water and car shock absorber factory effluent by nanofiltration and reverse osmosis membrane. Int. J. Anal. Chem. 2017, 2017, 7415708. [Google Scholar] [CrossRef]
- OB, A.; Muchie, M. Remediation of heavy metals in drinking water and wastewater treatment systems: Processes and applications. Int. J. Phys. Sci. 2010, 5, 1807–1817. [Google Scholar]
- Rad, S.M.; Mirbagheri, S.; Mohammadi, T. Using reverse osmosis membrane for chromium removal from aqueous solution. World Acad. Sci. Eng. Tech. 2009, 3, 348–352. [Google Scholar]
- Qdais, H.A.; Moussa, H. Removal of heavy metals from wastewater by membrane processes: A comparative study. Desalination 2004, 164, 105–110. [Google Scholar] [CrossRef]
- Kongsricharoern, N.; Polprasert, C. Chromium removal by a bipolar electro-chemical precipitation process. Water Sci. Technol. 1996, 34, 109–116. [Google Scholar] [CrossRef]
- Kumar, R.; Arya, D.K.; Singh, N.; Vats, H. Removal of Cr (VI) Using Low Cost Activated Carbon Developed By Agricultural Waste. IOSR J. Appl. Chem 2017, 10, 76–79. [Google Scholar] [CrossRef]
- Krishna, D.; Sree, R.P. Removal of chromium from aqueous solution by custard apple (Annona Squamosa) peel powder as adsorbent. Int. J. Appl. Sci. Eng. 2013, 11, 171–194. [Google Scholar]
- Mohanty, K.; Jha, M.; Meikap, B.; Biswas, M. Removal of chromium (VI) from dilute aqueous solutions by activated carbon developed from Terminalia arjuna nuts activated with zinc chloride. Chem. Eng. Sci. 2005, 60, 3049–3059. [Google Scholar] [CrossRef]
- Kobya, M. Removal of Cr (VI) from aqueous solutions by adsorption onto hazelnut shell activated carbon: Kinetic and equilibrium studies. Bioresour. Technol. 2004, 91, 317–321. [Google Scholar] [CrossRef]
- Honnannavar, S.M.; Hampannavar, U.; Hegde, P. Removal of Hexavalent chromium from wastewater by using activated sugarcane bagasse as an adsorbent. J. Environ. Sci. Sustain. 2013, 1, 120–123. [Google Scholar]
- Xia, S.; Song, Z.; Jeyakumar, P.; Shaheen, S.M.; Rinklebe, J.; Ok, Y.S.; Bolan, N.; Wang, H. A critical review on bioremediation technologies for Cr (VI)-contaminated soils and wastewater. Crit. Rev. Environ. Sci. Technol. 2019, 49, 1027–1078. [Google Scholar] [CrossRef]
- Elkhaleefa, A.; Ali, I.H.; Brima, E.I.; Shigidi, I.; Elhag, A.; Karama, B. Evaluation of the Adsorption Efficiency on the Removal of Lead (II) Ions from Aqueous Solutions Using Azadirachta indica Leaves as an Adsorbent. Processes 2021, 9, 559. [Google Scholar] [CrossRef]
- Fu, F.; Wang, Q. Removal of heavy metal ions from wastewaters: A review. J. Environ. Manag. 2011, 92, 407–418. [Google Scholar] [CrossRef] [PubMed]
- Piedra, E.; Álvarez, J.R.; Luque, S. Hexavalent chromium removal from chromium plating rinsing water with membrane technology. Desalin. Water Treat. 2015, 53, 1431–1439. [Google Scholar] [CrossRef]
- Meschke, K.; Hansen, N.; Hofmann, R.; Haseneder, R.; Repke, J.-U. Characterization and performance evaluation of polymeric nanofiltration membranes for the separation of strategic elements from aqueous solutions. J. Membr. Sci. 2018, 546, 246–257. [Google Scholar] [CrossRef]
- Yoon, J.; Amy, G.; Chung, J.; Sohn, J.; Yoon, Y. Removal of toxic ions (chromate, arsenate, and perchlorate) using reverse osmosis, nanofiltration, and ultrafiltration membranes. Chemosphere 2009, 77, 228–235. [Google Scholar] [CrossRef]
- Goosen, M.F.; Sablani, S.S.; Al-Maskari, S.S.; Al-Belushi, R.H.; Wilf, M. Effect of feed temperature on permeate flux and mass transfer coefficient in spiral-wound reverse osmosis systems. Desalination 2002, 144, 367–372. [Google Scholar] [CrossRef]
- Goosen, M.F.; Sablani, S.S.; Al-Maskari, S.S.; Al-Belushi, R.H.; Wilf, M. Effect of feed temperature and flow rate on permeate flux in spiral wound reverse osmosis systems. In Proceedings of the Second LACCEI International Latin American and Caribbean Conference for Engineering and Technology, Miami, FL, USA, 2–4 June 2004; pp. 2–4. [Google Scholar]
- Matin, A.; Laoui, T.; Falath, W.; Farooque, M. Fouling control in reverse osmosis for water desalination & reuse: Current practices & emerging environment-friendly technologies. Sci. Total Environ. 2021, 765, 142721. [Google Scholar]
- Al-Mutaz, I.S.; Al-Ghunaimi, M.A. Performance of reverse osmosis units at high temperatures. In Proceedings of the IDA World Congress on Desalination and Water Reuse, Manama, Bahrain, 26–31 October 2001; pp. 26–31. [Google Scholar]
- Li, M. Optimal plant operation of brackish water reverse osmosis (BWRO) desalination. Desalination 2012, 293, 61–68. [Google Scholar] [CrossRef]
- Patel, S.K.; Biesheuvel, P.M.; Elimelech, M. Energy Consumption of Brackish Water Desalination: Identifying the Sweet Spots for Electrodialysis and Reverse Osmosis. ACS ES&T Eng. 2021, 1, 851–864. [Google Scholar] [CrossRef]
- Ruiz-García, A.; Nuez, I.; Carrascosa-Chisvert, M.D.; Santana Rodríguez, J. Simulations of BWRO systems under different feedwater characteristics. Analysis of operation windows and optimal operating points. Desalination 2020, 491, 114582. [Google Scholar] [CrossRef]
- Owlad, M.; Aroua, M.K.; Daud, W.A.W.; Baroutian, S. Removal of hexavalent chromium-contaminated water and wastewater: A review. Water Air Soil Pollut. 2009, 200, 59–77. [Google Scholar] [CrossRef]
- Selvi, K.; Pattabhi, S.; Kadirvelu, K. Removal of Cr (VI) from aqueous solution by adsorption onto activated carbon. Bioresour. Technol. 2001, 80, 87–89. [Google Scholar] [CrossRef]
- Fellenz, N.; Perez-Alonso, F.J.; Martin, P.P.; García-Fierro, J.L.; Bengoa, J.F.; Marchetti, S.G.; Rojas, S. Chromium (VI) removal from water by means of adsorption-reduction at the surface of amino-functionalized MCM-41 sorbents. Microporous Mesoporous Mater. 2017, 239, 138–146. [Google Scholar] [CrossRef]
- Shokri, A.; Nasiri Shoja, M. Employing reverse osmosis for the removal of ortho-toluidine from wastewater. Bulg. Chem. Commun 2018, 50, 21–26. [Google Scholar]
Figure 1.
Testing rig.

Figure 2.
SEM images for RO membrane surface before and after testing. (a) Before; (b) after.

Figure 3.
Impact of temperature on permeate flux at different feed flow rates for 5 ppm concentration at (a) 10, (b) 30, and (c) 45 bar operating pressure.
Figure 3.
Impact of temperature on permeate flux at different feed flow rates for 5 ppm concentration at (a) 10, (b) 30, and (c) 45 bar operating pressure.


Figure 4.
Impact of temperature on permeate flux at different feed flow rates for 30 ppm concentration at (a) 10, (b) 30, and (c) 45 bar operating pressure.
Figure 4.
Impact of temperature on permeate flux at different feed flow rates for 30 ppm concentration at (a) 10, (b) 30, and (c) 45 bar operating pressure.

Figure 5.
Impact of temperature on permeate flux at different feed flow rates for 100 ppm concentration at (a) 45, (b) 30, and (c) 10 bar operating pressure.
Figure 5.
Impact of temperature on permeate flux at different feed flow rates for 100 ppm concentration at (a) 45, (b) 30, and (c) 10 bar operating pressure.

Figure 6.
Cr (VI) rejection % of different concentrations at (a) 4.5, (b) 3.4, and (c) 2.2 L/min flow rate and 10 bar pressure.
Figure 6.
Cr (VI) rejection % of different concentrations at (a) 4.5, (b) 3.4, and (c) 2.2 L/min flow rate and 10 bar pressure.

Figure 7.
Cr (VI) rejection % of different concentration at (a) 2.2, (b) 3.4, and (c) 4.5 L/min flow rate and 30 bar pressure.
Figure 7.
Cr (VI) rejection % of different concentration at (a) 2.2, (b) 3.4, and (c) 4.5 L/min flow rate and 30 bar pressure.

Figure 8.
Cr (VI) rejection % of different concentration at (a) 4.5, (b) 3.4, and (c) 2.2 L/min flow rate and 45 bar pressure.
Figure 8.
Cr (VI) rejection % of different concentration at (a) 4.5, (b) 3.4, and (c) 2.2 L/min flow rate and 45 bar pressure.


Table 1.
Summary of different Cr (VI) removal techniques and their efficiency [30].
Table 1.
Summary of different Cr (VI) removal techniques and their efficiency [30].
| Type of Treatment | Removal Efficiency (%) |
|---|---|
| Carbon membrane | 96 |
| Nitrated carbon membrane | 84 |
| Polymer-enhanced ultrafiltration | 30 |
| Composite polyamide membranes (NFI) | 99 |
| Polyamide thin-film membrane | 77 |
| Dowex 2-X4 ion exchanger (Strongly basic resin with trimethylbenzylammonium as the active group) | 100 |
| Solvent impregnated resin with aliquot 336 | 99.5 |
| Carbon aerogel (Electrochemical treatment) | 98.5 |
| Iron rotary (Electrochemical treatment) | 99.6 |
| Wool (bio sorbent) | 69.3 |
| Olive cake (bio sorbent) | 47.1 |
| Almond shell (bio sorbent) | 23.5 |
Table 2.
Calculated temperature correction factors for permeate flux under different operating pressure and flowrate.
Table 2.
Calculated temperature correction factors for permeate flux under different operating pressure and flowrate.
| Temperature °C | TCF | ||||||||
|---|---|---|---|---|---|---|---|---|---|
| 10 Bar | 30 Bar | 45 Bar | |||||||
| 2.2 L/min | 3.4 L/min | 4.5 L/min | 2.2 L/min | 3.4 L/min | 4.5 L/min | 2.2 L/min | 3.4 L/min | 4.5 L/min | |
| 35 | 1.51 | 1.48 | 1.42 | 1.16 | 1.32 | 1.32 | 1.61 | 1.23 | 1.16 |
| 45 | 1.82 | 1.95 | 2.00 | 1.86 | 1.75 | 1.67 | 1.54 | 1.42 | 1.29 |
| 55 | 2.48 | 2.40 | 2.31 | 2.01 | 1.87 | 1.82 | 1.53 | 1.43 | 1.36 |
Publisher’s Note: MDPI stays neutral with regard to jurisdictional claims in published maps and institutional affiliations. |
© 2021 by the authors. Licensee MDPI, Basel, Switzerland. This article is an open access article distributed under the terms and conditions of the Creative Commons Attribution (CC BY) license (https://creativecommons.org/licenses/by/4.0/).
Share and Cite
MDPI and ACS Style
Shigidi, I.; Anqi, A.E.; Elkhaleefa, A.; Mohamed, A.; Ali, I.H.; Brima, E.I. Temperature Impact on Reverse Osmosis Permeate Flux in the Remediation of Hexavalent Chromium. Water 2022, 14, 44. https://doi.org/10.3390/w14010044
AMA Style
Shigidi I, Anqi AE, Elkhaleefa A, Mohamed A, Ali IH, Brima EI. Temperature Impact on Reverse Osmosis Permeate Flux in the Remediation of Hexavalent Chromium. Water. 2022; 14(1):44. https://doi.org/10.3390/w14010044
Chicago/Turabian StyleShigidi, Ihab, Ali E. Anqi, Abubakar Elkhaleefa, Azam Mohamed, Ismat H. Ali, and Eid I. Brima. 2022. "Temperature Impact on Reverse Osmosis Permeate Flux in the Remediation of Hexavalent Chromium" Water 14, no. 1: 44. https://doi.org/10.3390/w14010044
Note that from the first issue of 2016, this journal uses article numbers instead of page numbers. See further details here.