
Trend and Attribution Analysis of Runoff Changes in the Weihe River Basin in the Last 50 Years


Department of Water Resources, China Institute of Water Resources and Hydropower Research, Beijing 100038, China
*
Author to whom correspondence should be addressed.
Water 2022, 14(1), 47; https://doi.org/10.3390/w14010047
Submission received: 28 November 2021
/
Revised: 19 December 2021
/
Accepted: 21 December 2021
/
Published: 25 December 2021
(This article belongs to the Special Issue Yellow River Basin Management under Pressure: Present State, Restoration and Protection)
Abstract
:In recent years, the Weihe River basin has experienced dramatic changes and a sharp decrease in runoff, which has constrained the sustainable development of the local society, economy, and ecology. Quantitative attribution analysis of runoff changes in the Weihe River basin can help to illustrate reasons for dramatic runoff changes and to understand its complex hydrological response. In this paper, the trends of hydrological elements in the Weihe River basin from 1970 to 2019 were systematically analyzed using the M–K analysis method, and the effects of meteorological elements and underlying surface changes on runoff were quantitatively analyzed using the Budyko theoretical framework. The results show that potential evapotranspiration and precipitation in the Weihe River basin have no significant change in 1970–2019; runoff depth has an abrupt change around 1990 and then decrease significantly. The study period is divided into the base period (1970–1989), PΙ (1990–2009), and PII (2010–2019). Compared with the base period, the elasticity coefficients (absolute values) of each element show an increasing trend in PΙ and PII. The sensitivity of runoff to these coefficients is increasing. The sensitivity of the precipitation is the highest (2.72~3.17), followed by that of the underlying surface parameter (−2.01~−2.35); the sensitivity of the potential evapotranspiration is the weakest (−1.72~−2.17). In the PΙ period, the runoff depth decreased significantly due to the combination effects of precipitation and underlying surface with the values of 6.18 mm and 13.92 mm, respectively. In the PII period, rainfall turned to an increasing trend, contributing to the increase in runoff by 11.80 mm; the further increase in underlying surface parameters was the main reason for the decrease in runoff by 22.19 mm. The significant increase in runoff by 8.54 mm because of the increased rainfall, compared with the PΙ periods. Overall, the increasing underlying surface parameter makes the largest contribution to the runoff changes while the precipitation change is also an important factor.
1. Introduction
The problem of water resources will become the most important natural resource problem facing mankind in the 21st century, and the exploitation of water resources in northern China has exceeded the carrying capacity of the resource environment, indicating that the situation facing water resources is very serious [1]. In recent years, the combined effects of climate change and human activities have led to significant changes in the river runoff of many rivers and further intensification of water scarcity, which seriously threatens social development and human life [2]. Exploring trends and turning points in runoff change and revealing the main drivers of runoff change play a key role in future water resources prediction [3].
Runoff change is a complex dynamic process as an integrated response to climate change and human activities in a watershed. The effects of climate change and human activities on hydrological processes have become a hot research topic. Currently, statistical analysis methods [4], hydrological modeling methods [5], and elasticity coefficient methods based on the Budyko framework [6] are the main methods to study the impact of climate change and human activities on hydrological water resources. The elasticity coefficient method based on the Budyko framework integrates the coupled hydrothermal equilibrium of the watershed and establishes the relationship between watershed runoff and precipitation, evaporation, and underlying surface characteristics, which is easy to calculate and has been validated in many watersheds [7,8,9].
In recent years, significant changes in runoff and other hydrometeorological elements have occurred in the Weihe River basin, causing widespread concern. Zuo et al., used a sensitivity coefficient approach based on the Budyko framework and a hydrological modeling approach to estimate the effects of climate change and human activities on runoff in the Weihe River basin. They found that the impact of human activities on the control basins of the upper and middle reaches of the Weihe River at Linjiacun, Weijiabao, and Xianyang hydrological stations, and the control basins of the lower reaches of the Jinghe River at Zhangjiashan station, accounted for greater than 50% of the runoff changes [10]. Sun et al., found that the intensification of potential evapotranspiration due to climate warming contributed negatively to runoff changes by more than 60%, which was higher in absolute value than the positive contribution of precipitation [11]. Shi et al., found that the contribution of human activities to runoff changes in the Weihe River source area was close to 50% [12]. Zhang et al., found that intense human activities were the main cause of runoff reduction, and their contribution to the reduction in runoff was over 60% [13]. Although many previous studies have been conducted to analyze runoff changes in the Weihe River basin, the results are not entirely consistent (Table 1). The contribution of potential evapotranspiration, precipitation, and human activities to runoff changes in the Weihe River basin varies widely among the results obtained in each article due to different study periods, hydrological stations, and methods. However, generally, they indicate that the modification of the underlying surface by human activities has gradually become a major factor affecting runoff changes.
Most of the previous studies were based on the period before the 2010s and did not explore the continuous changes of runoff in the Weihe River in the last 10 years. In order to deeply analyze the characteristics and causes of runoff changes in the Weihe River basin in recent years, this paper conducted a trend and abrupt change point test for each hydrological element in the Weihe River basin and selected the base period and change periods based on abrupt change points. This paper applies the Budyko framework to analyze the contributions of precipitation, potential evapotranspiration, and underlying surface characteristics to runoff variability and conducts an attribution analysis of runoff variability to provide a theoretical basis for the integrated management and sustainable use of water resources in the Weihe River basin and similar areas.
2. Study Area
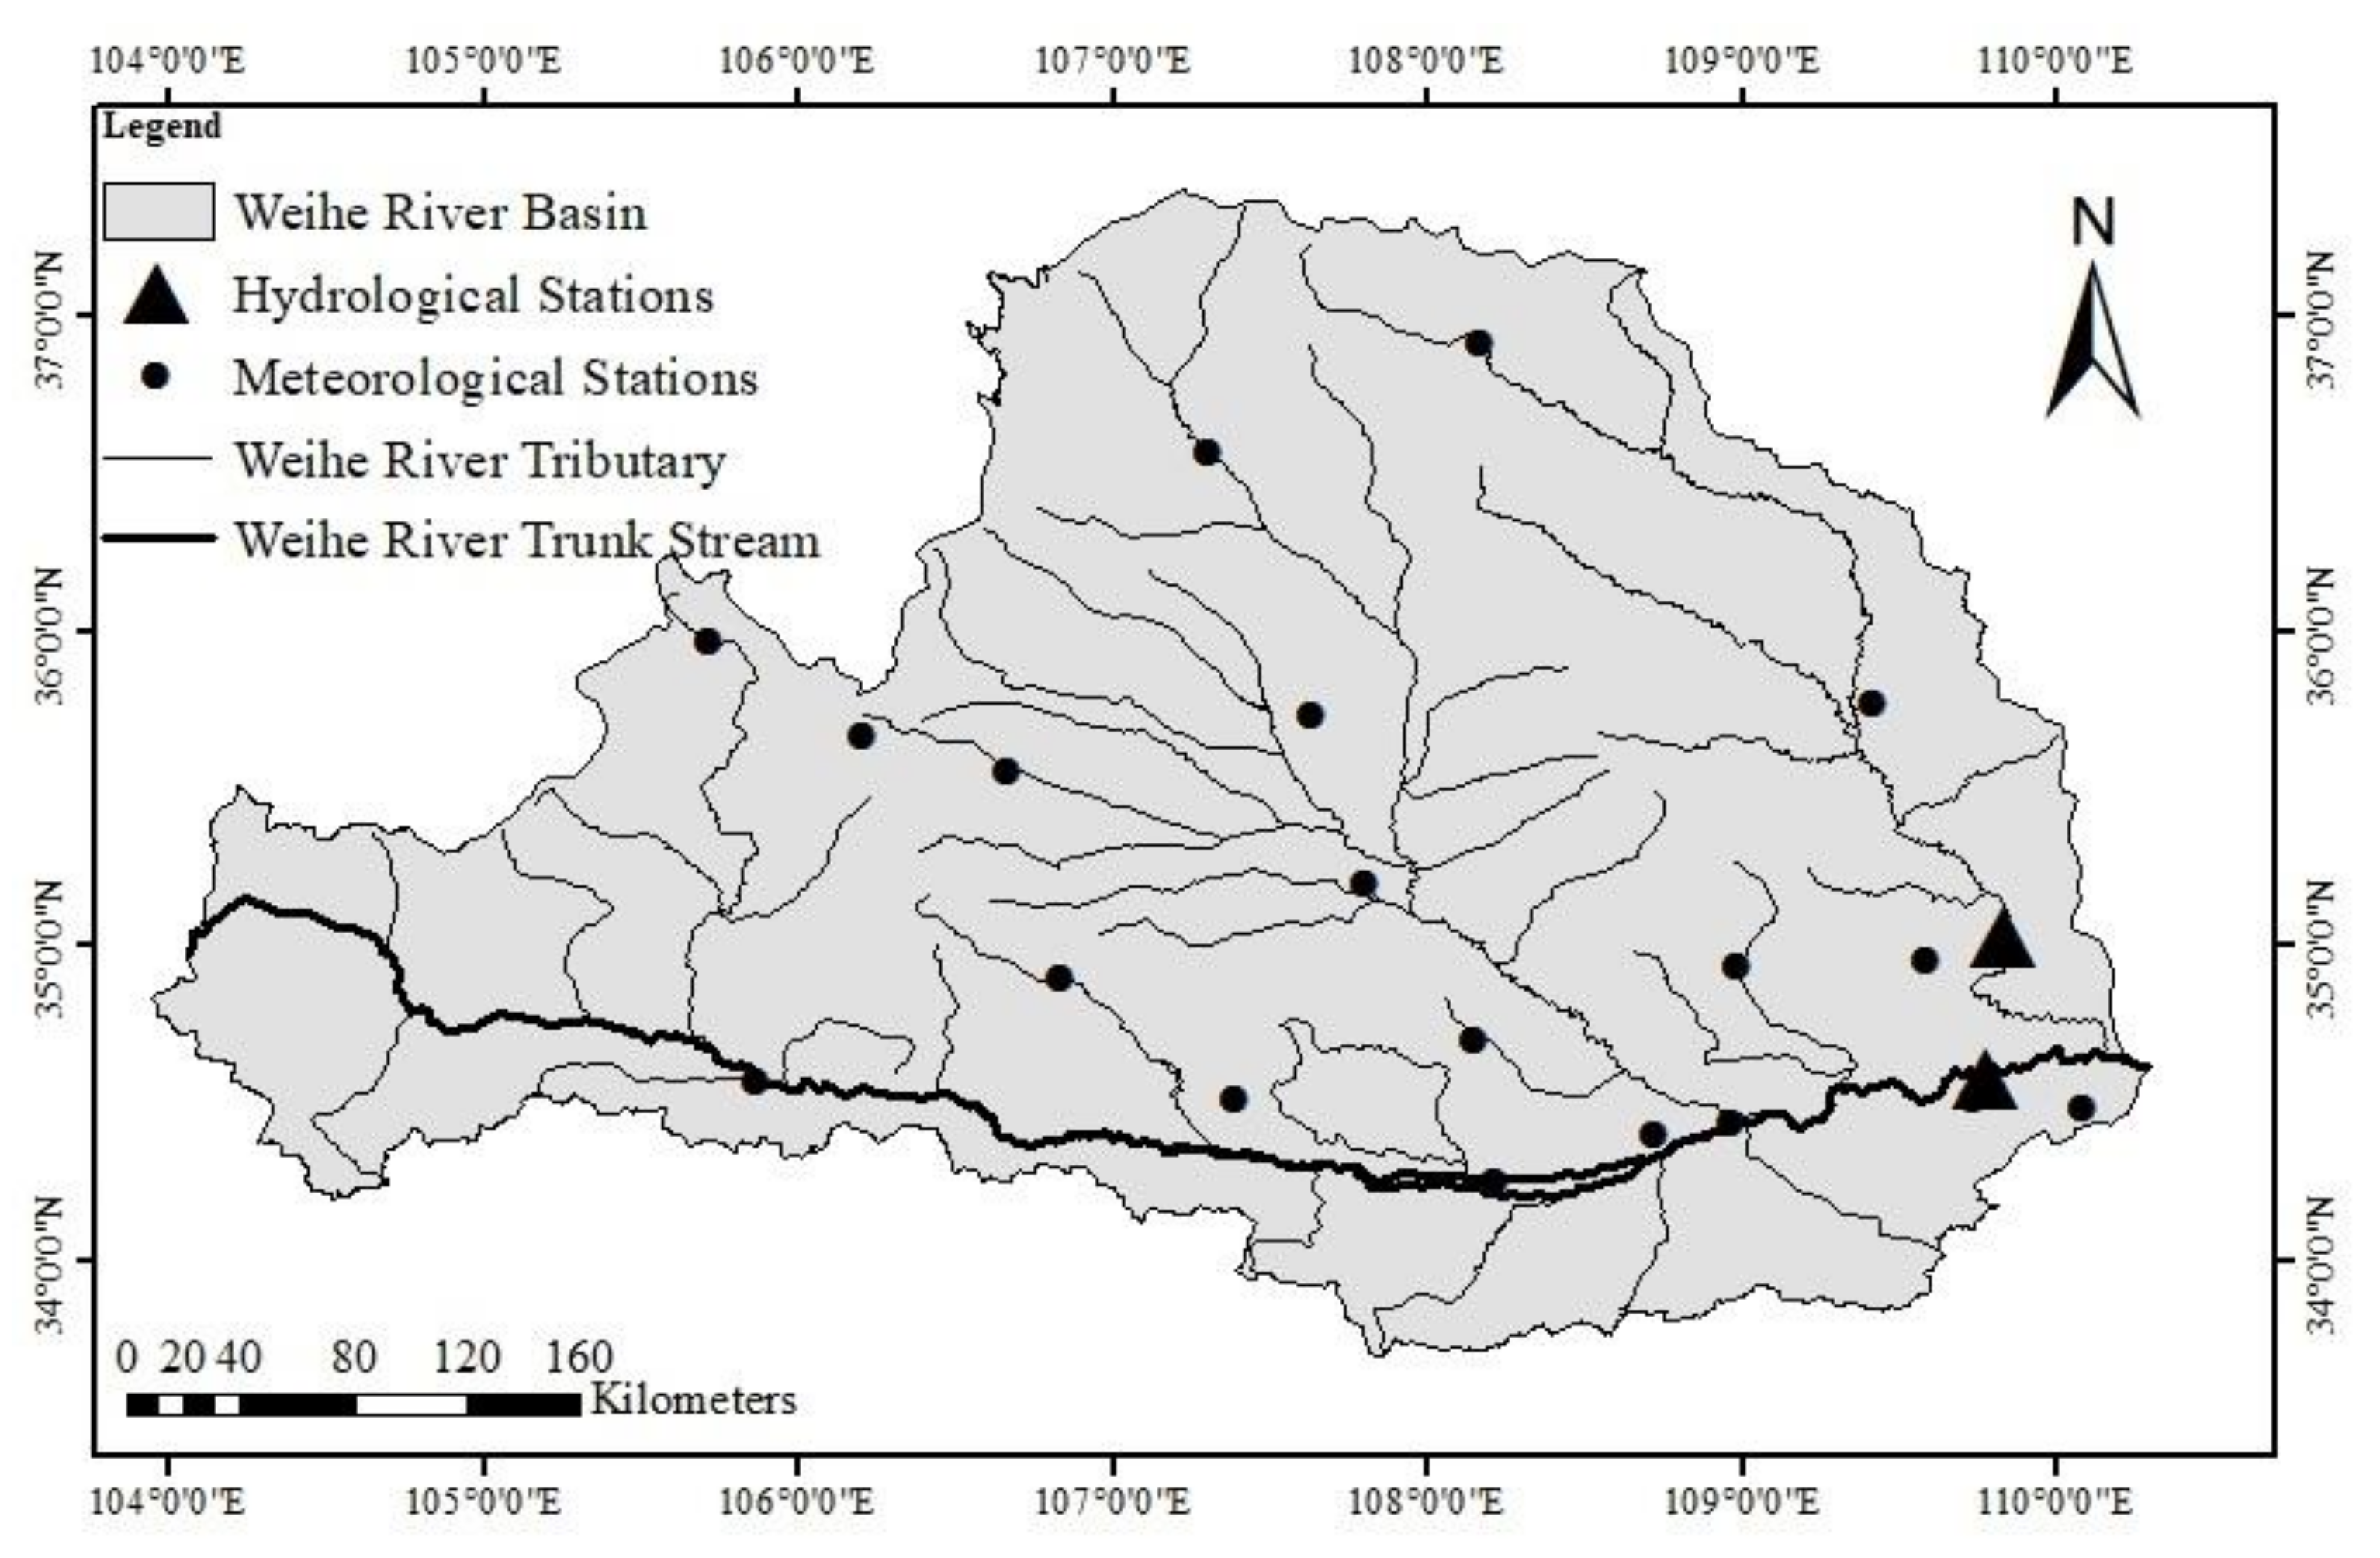
The Weihe River is the largest tributary of the Yellow River, located in the Yellow River hinterland (103°57′–110°17′ E, 33°42′–37°24′ N), originating in the Wushu Mountain in Weiyuan County, Dingxi City, Gansu Province, and flowing through three provinces, Gansu, Ningxia, and Shaanxi, east to Tongguan County, Shaanxi Province, where it joins the Yellow River, with a main stream length of 818 km and a basin area of 134,800 km2. The Weihe River has many tributaries, and the tributaries on both sides of the river are asymmetrically distributed. The water system on the south bank originates from the Qinling Mountains and flows through the rocky mountainous areas, which are mostly tributaries with a short course and more water and less sand. The water system on the north bank is developed on the Loess Plateau, with a large water catchment area and serious soil erosion, and is the main sand-producing area in the watershed. The largest tributary is the Jing River, with a length of 455.1 km and a basin area of 45,400 km2; the second largest tributary is the Bei Luo River, with a length of 680 km and a basin area of 26,900 km2. The Weihe River basin is located in the transition zone between arid and humid and has a temperate monsoon climate with an average annual temperature of 7.8 °C~13.5 °C, annual precipitation of 300~800 mm, annual potential evaporation of 700~1400 mm, and annual evaporation of 400~700 mm. Combining the runoff information from the hydrological stations of Huaxian and Zhuangtou, the average multi-year runoff of the Wei River is 6.385 billion m3 (Table 2).
3. Data and Methodology
3.1. Data Collection and Preprocessing
In this paper, annual runoff information from 1970 to 2019 at two hydrological stations in Zhuangtou and Huaxian was collected; the sum of runoff from the two hydrological stations is usually used as the annual runoff of the Weihe River basin [14]. Precipitation and daily data from ground stations including wind speed (m·s−1), daily maximum temperature (°C), daily minimum temperature (°C), sunshine hours, barometric pressure (kPa), elevation (m), and relative humidity (%) were taken from China Meteorological Data Service Centre (http://www.nmic.cn/ (accessed on 6 July 2021)), and meteorological data from 1970 to 2019 for 16 stations in the Weihe River basin were selected (Figure 1). The missing data of meteorological stations were interpolated with inverse distance weights using the complete data of nearby stations. The potential evapotranspiration (ET) was estimated using the Penman–Monteith Equation, recommended by the World Food and Agriculture Organization (FAO), and the Tyson polygon method was applied to calculate the surface rainfall and surface potential evapotranspiration of the watershed. The expression of the Penman–Monteith correction formula is as follows [15]:
where ET is the potential evapotranspiration (mm·d−1), is the net all-wave radiation at the canopy surface (MJ·m−1·d−1), G is the soil heat flux density (MJ·m−2·d−1), is the daily air temperature at 2 m above ground level (°C), is the wind speed at 2 m above ground level (m·s−1), is the saturation vapor pressure (kPa), is the actual vapor pressure (kPa), is the slope of the saturated vapor pressure curve versus air temperature (kPa·°C−1), is the psychrometric constant (kPa·°C−1).
3.2. Methodology
The overall research line of this paper is that the Mann–Kendall nonparametric analysis method was used to examine the trends and abrupt change points of each hydrological element in the Weihe River basin, and to select the base and change periods based on the abrupt change points. The Budyko framework is applied to explore the contribution of precipitation, potential evapotranspiration, and underlying surface parameters to runoff variability and to conduct attribution analysis of runoff variability.
3.2.1. Mann–Kendall Analysis Method
The Mann–Kendall analysis was used to perform trend and mutation tests, which are easy to calculate, have a clear meaning, and are not disturbed by some outliers. They are widely used in the analysis of hydrometeorological and other series, as described in the literature [16].
3.2.2. Runoff Change Attribution Identification Based on the Budyko Framework
- 1.
- The Budyko Framework
The water balance equation for a closed basin can be expressed as:
where P is precipitation (mm), Q is runoff (mm), E is evaporation (mm), and is the variation of water storage in the basin. For a long period, is approximately 0 and can be neglected. Therefore, the multi-year water balance equation can be simplified as:.
The actual evapotranspiration of a watershed depends on the available water supply and available heat, and Budyko [6] proposed that on a multi-year time scale, the multi-year average evapotranspiration depends on the multi-year average rainfall (P) and the multi-year average potential evapotranspiration (ET), expressed in the formula as:
where n is the underlying surface parameter of the basin.
Based on the Budyko framework, many studies have derived many different analytic forms, the more commonly used of which is the Choudhury–Yang [17] equation, the expression as:
where n is the watershed underlying surface parameter, which reflects the characteristics of the watershed underlying surface, related to topography, soil, vegetation, etc., and changes mainly by human activities. n can be obtained by back-calculating the multi-year average Q, ET, and P and considering P, ET, and n as mutually independent variables in the above equation [18].
- 2.
- Climate Elasticity Analysis Method
The variation in runoff can be attributed to the combined effect of climatic and underlying surface factors, where climatic factors mainly include precipitation and potential evapotranspiration. Assuming that the factors are independent of each other, the following equation can be obtained according to the water balance equation [18]:
where ∆Q, ∆P, ∆ET, and ∆n are the changes in the average runoff depth, rainfall, potential evapotranspiration, and underlying surface parameters at different time periods, respectively. ,, are the sensitivity coefficients of runoff depth to precipitation, potential evapotranspiration, and parameters of the underlying surface, respectively, and the partial derivatives are obtained by combining Equations (2) and (4):
Using Equation (6), the elasticity coefficients and the contribution to the change in runoff can be calculated for each factor:
where is the elasticity coefficient of X factor, is the contribution of X factor to the change of runoff, indicates the contribution of X factor to the change of runoff.
4. Results
4.1. Analysis of Hydrometeorological Elements
4.1.1. Trend Analysis
Overall, the trends of annual Q, ET, P and runoff coefficient (a) detected by the M–K trend test are summarized in Table 3. The study period is 50 years, and the significance level of 0.05 is ±1.96. If the M–K method statistic of Q is greater than 1.96 or less than −1.96, it indicates that the increase or decrease in Q is significant. Otherwise, the change is not significant, and the sign of the M–K method statistic represents the increase or decrease.
Q change showed a significant decreasing trend, with an M–K test statistic of −2.05. ET showed a non-significant increasing trend, with an M–K method statistic of −0.04. P showed a weak increasing trend, with an M–K method statistic of 0.61. Runoff coefficient showed a significant decreasing trend and the M–K method statistic is −3.29, as detailed in Table 3. From about 1990 to the early 2000s, Q decreased significantly compared with the previous period (Figure 2). The decrease in P at this stage is a factor, but the decline rate of P is much lower than that of Q. Therefore, the influence of underlying surface change on runoff may increase sharply, and the underlying surface becomes the most important factor to runoff. The underlying surface factors include terrain, soil, etc., among which human activities and vegetation are most important.
4.1.2. Mutation Point Detection
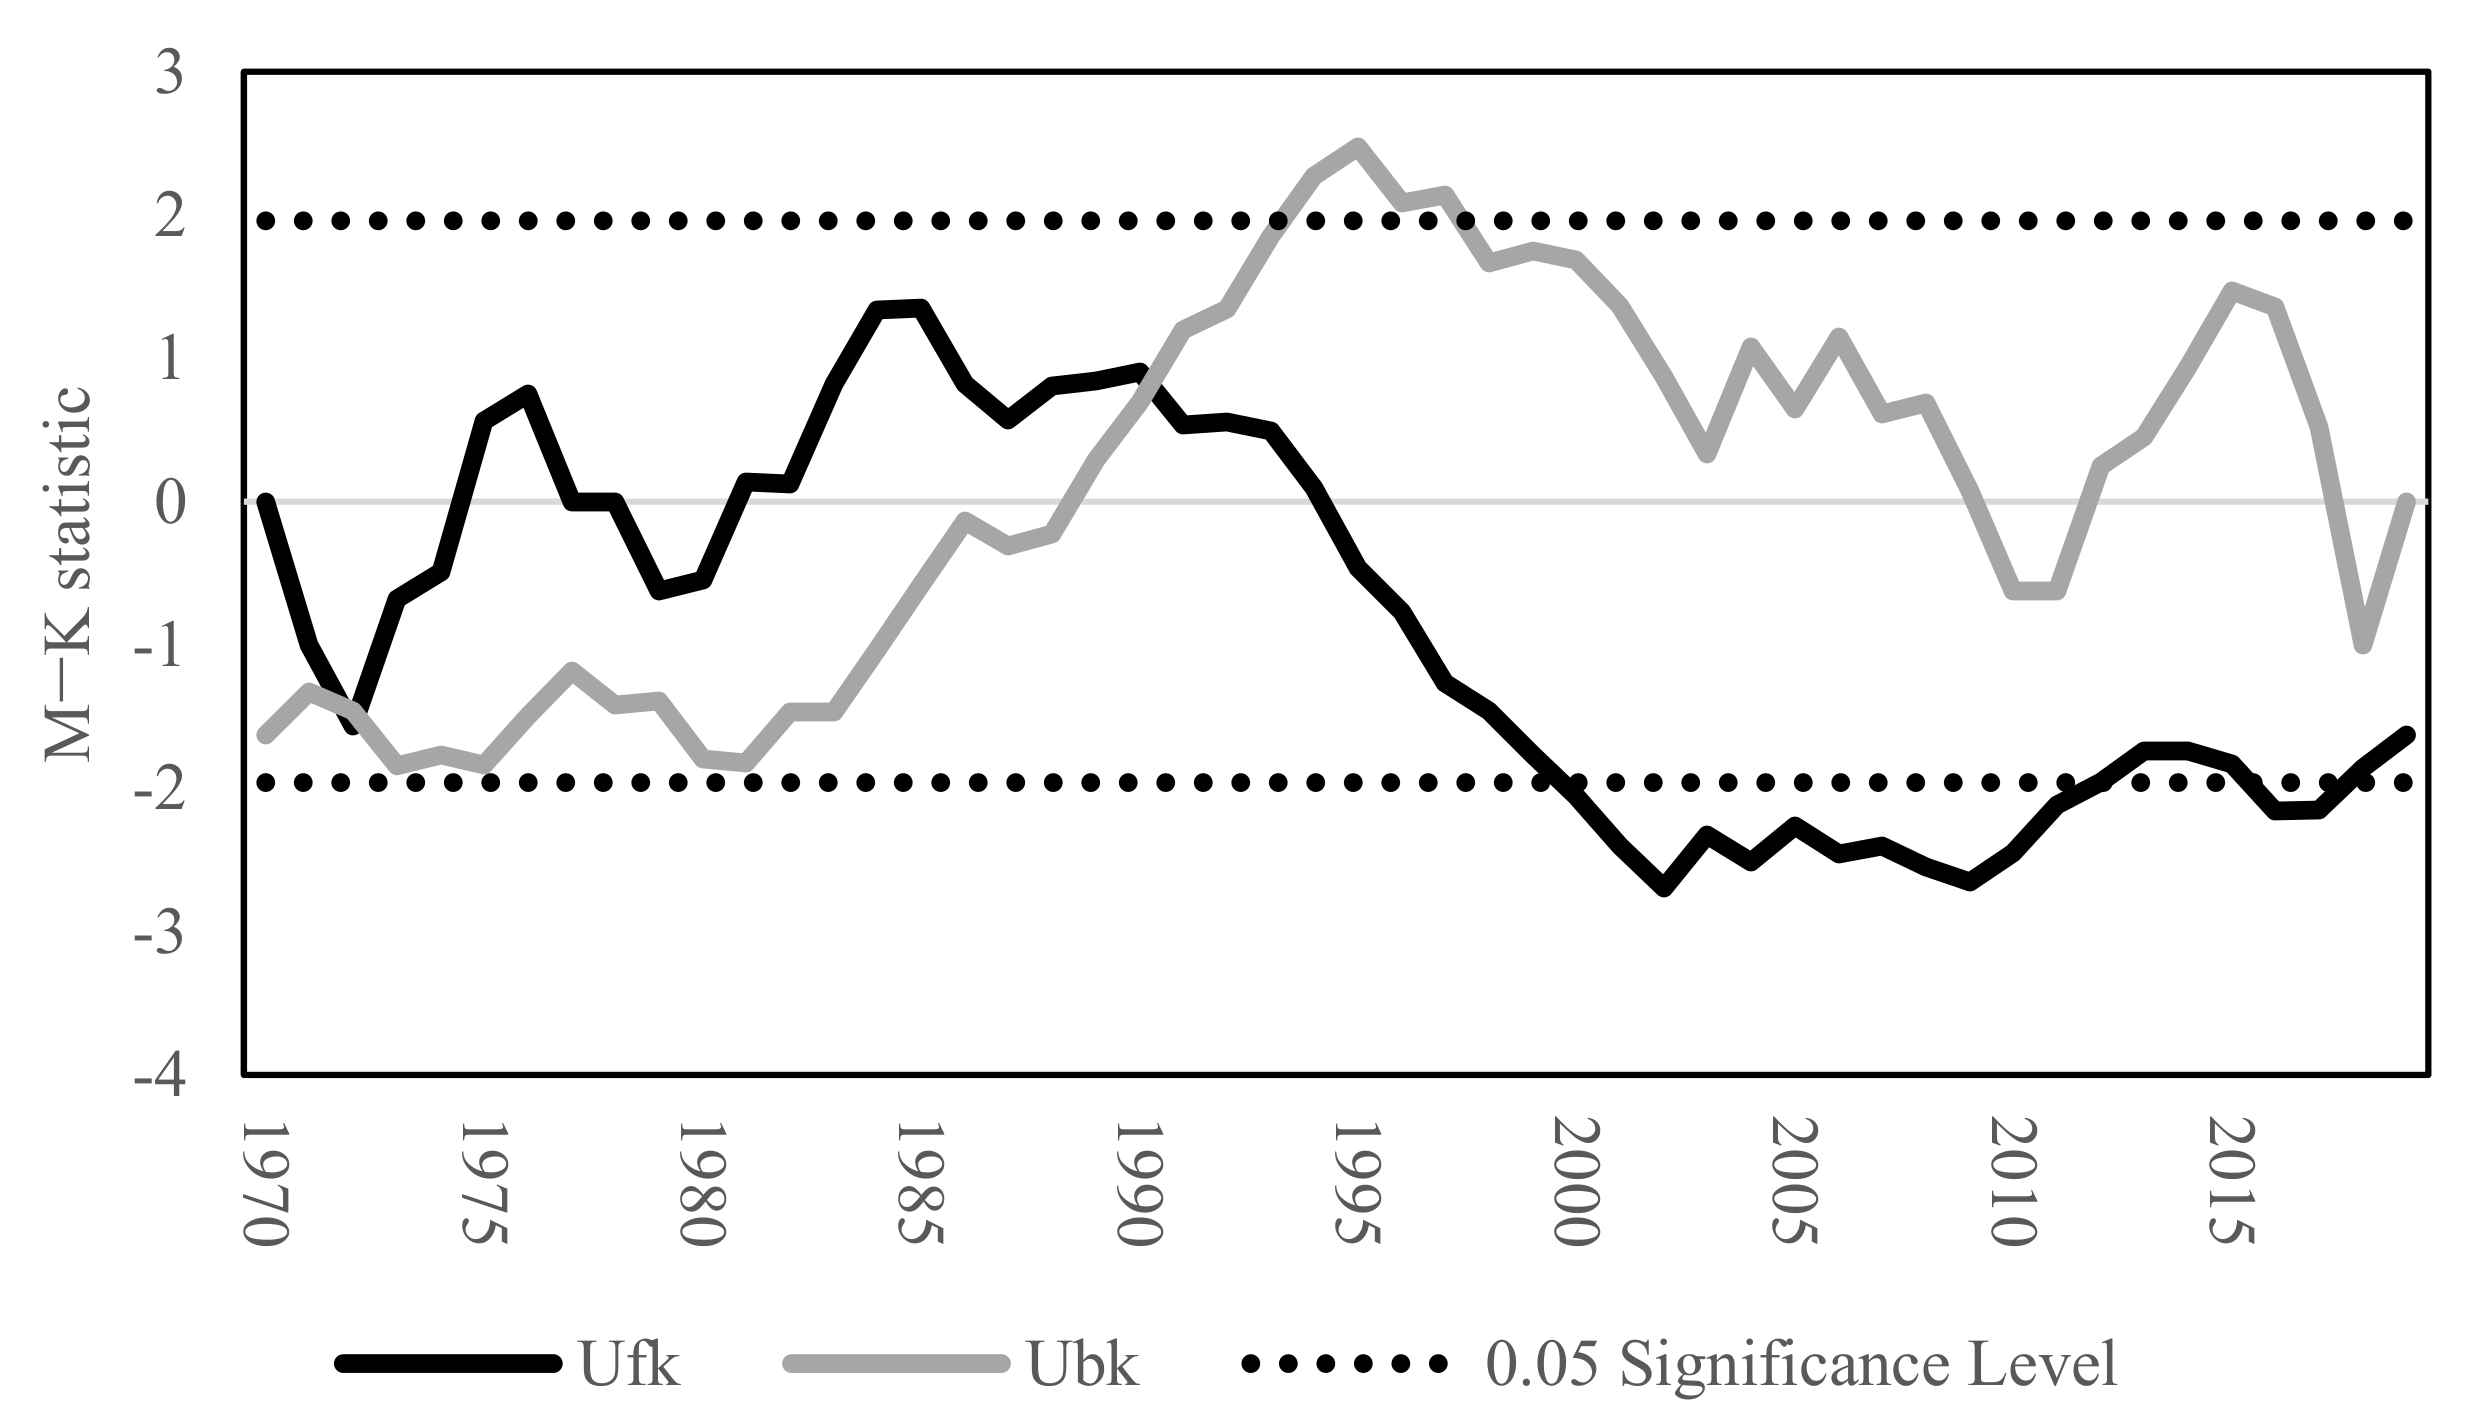
The M–K method was applied to detect mutation points for runoff depths from 1970 to 2019 in the Weihe River basin in Figure 3. Ufk is obtained from the M–K trend test. If Ufk is greater than the significance level, it indicates that the change is significant. Ubk is obtained by arranging the studied sequences in reverse order and using the M–K trend test. The significance level of 0.05 is ±1.96. If Ufk and Ubk intersect and are at the significance level, the intersection is likely to be a mutation point.
There are three intersections of Ufk and Ubk curves, the first two intersections are in the pre-series period and therefore excluded, and the third point is around 1990 and at the 0.05 significance level. Therefore, 1990 is likely to be the onset of the mutation.
4.2. Analysis of Hydrometeorological Elements
According to the previous paper, Q in 1990 is most likely the starting point of the mutation in runoff; therefore, 1970~1989 is set as the base period. In this paper, we focus on the runoff changes in the Weihe River basin in the 2010s, so we set 1990~2009 as the change period PΙ and 2010~2019 as the change period PII. ET increased steadily during the two change periods (Table 4). During the PΙ period, P and Q have a similar decline, but the change rate of Q is much greater than that of P. During the PII period, there was a larger increase in P and a certain degree of recovery in Q.
Each elasticity coefficient indicates that Q is positively correlated with P and negatively correlated with ET and n. The elasticity coefficients (absolute values) of P are the largest, with 2.72, 3.06, and 3.17 for each period, reflecting that Q is most sensitive to P (Table 5). The elasticity coefficients of n are −2.01, −2.35, and −2.18 for each period. The elasticity coefficients of ET are the smallest: −1.72, −2.06, and −2.17 for each period. The three elasticity coefficients (absolute values) show an increasing trend, indicating that the sensitivity of runoff to P, ET, and n increases at the same time, and Q is more susceptible to more drastic changes than the base period, with increased uncertainty and increased chances of flood and drought disasters.
4.3. Runoff Change Attribution Identification
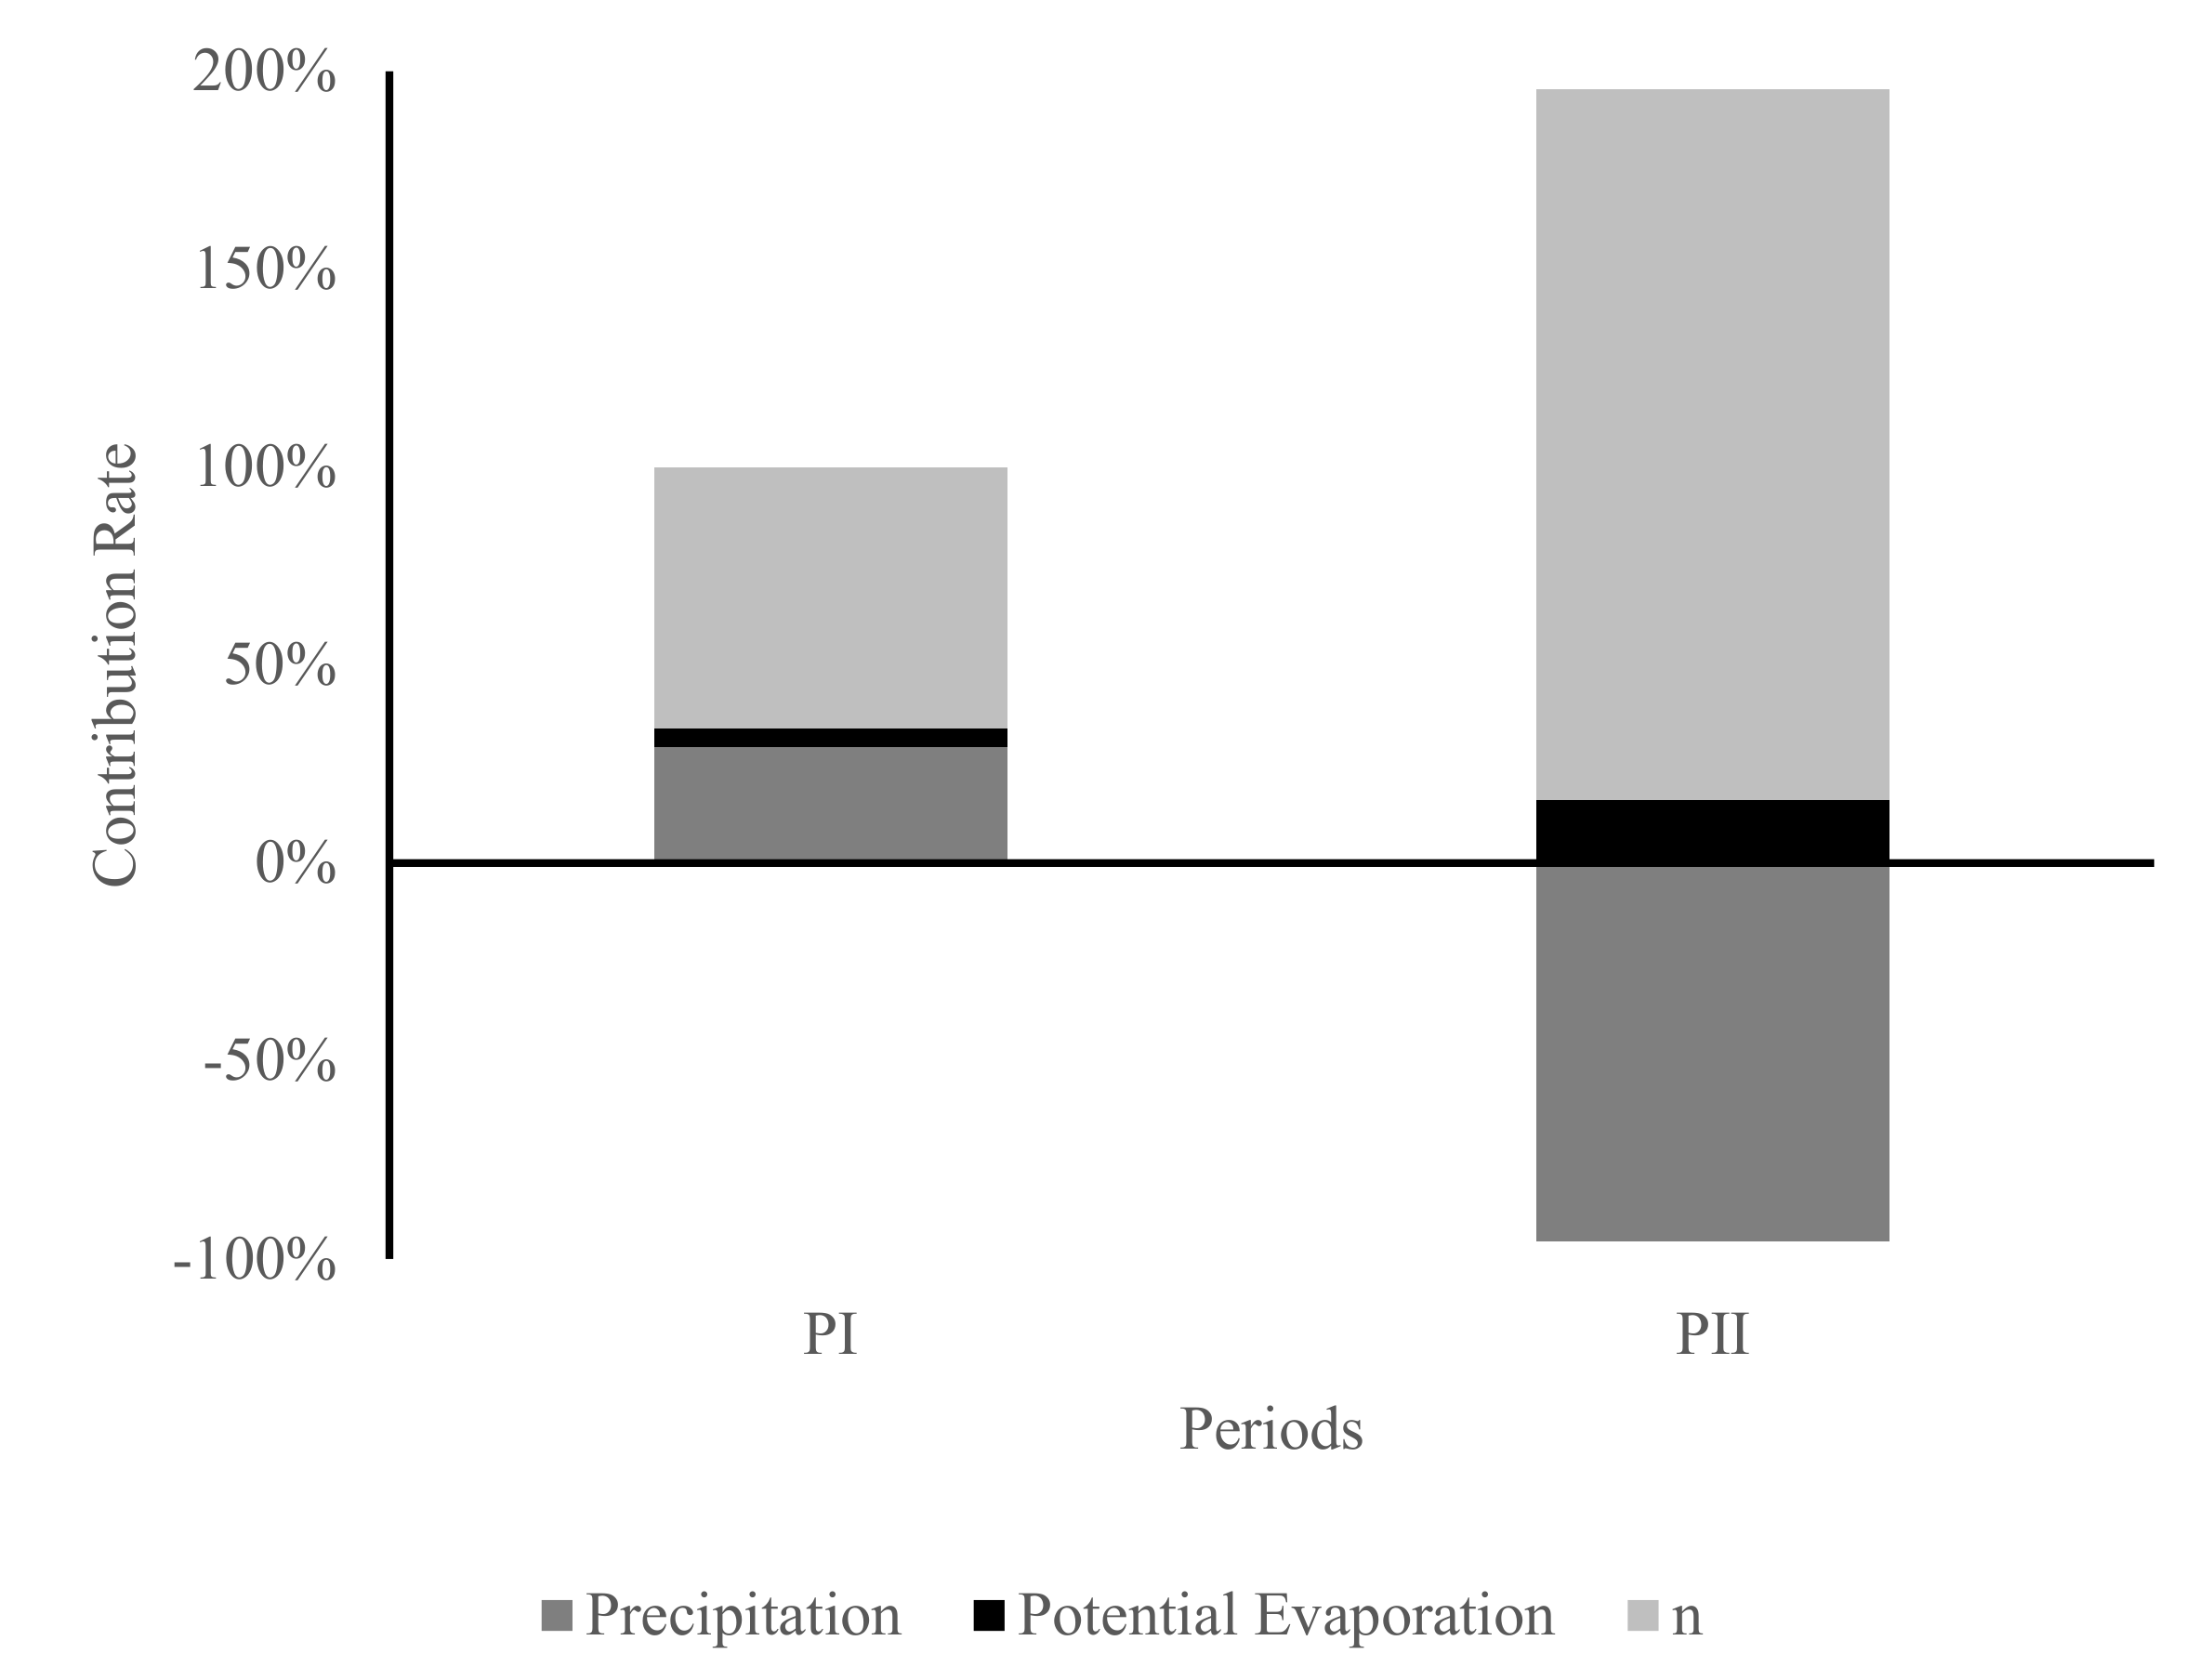
Overall, n contributed the most to the variation of Q, followed by P, and, lastly, ET.
During PΙ, all factors had a decreasing effect on Q. An increase of 0.29 in n led to a decrease of 13.92 mm in Q with a contribution of 66.11% (Figure 4) and was the main cause. A decrease of 22.79 mm in P led to a decrease of 6.18 mm in Q with a contribution of 29.36% and was the secondary factor. An increase of 10.31 mm in ET, resulting in a decrease in Q by 0.95 mm with a contribution of 4.53%, was the least influential factor.
During PII, the trend shift in P increased by 41.65 mm, resulting in an increase in Q of 11.80 mm, with a contribution of −95.56%, offsetting part of the decrease in Q. An increase in n of 0.46, resulting in a decrease in Q of 22.19 mm with a contribution of 179.65% (Figure 4), and was the main cause. An increase in ET of 19.01 mm, resulting in a decrease in Q of 1.96 mm with a contribution of 15.91%, was the least influential factor on Q.
The above shows that changes in each factor cause different degrees of runoff changes over time. ET and n are negatively correlated with Q, and P is positively correlated with Q. Among them, n contributes the most to Q changes, and P also has a great impact on Q. ET, because of its own small amount of change, contributes the least to Q changes.
From Table 6, we can see that there is a slight difference between the actual runoff depth variation and the calculated runoff depth variation, and the difference between the simulated and actual values in PΙ and PII periods are less than 0.3 mm, with a relative error of no more than 2%, and the simulated results are very close to the actual values.
5. Discussion
The results obtained in this paper, where elevated n is the main cause of the sharp decrease in Q, are consistent with previous studies [10,13,19], but the contribution of P to the change in Q is significantly different from previous studies. In this paper, we conclude that P increases during the PII period and contributes to an increase in Q. Zuo et al., conclude that climate change (P and ET) contributes 29% to 65% to the decrease in runoff at each hydrological station in the Weihe River basin [10]. Bai et al., conclude that the combination of both climate change and human activities leads to a significant decrease in runoff in the Weihe River main stream [20]. Bi et al., and Liu et al., also reached similar conclusions [21,22]. The differences in the above findings are most likely related to the different study periods, with P elevated in the 2010s compared with the 2000s and 1990s, and an increasing effect on Q. The former study period was probably in the dry phase of the hydrological cycle, and the decrease in precipitation had a significant decrease in runoff.
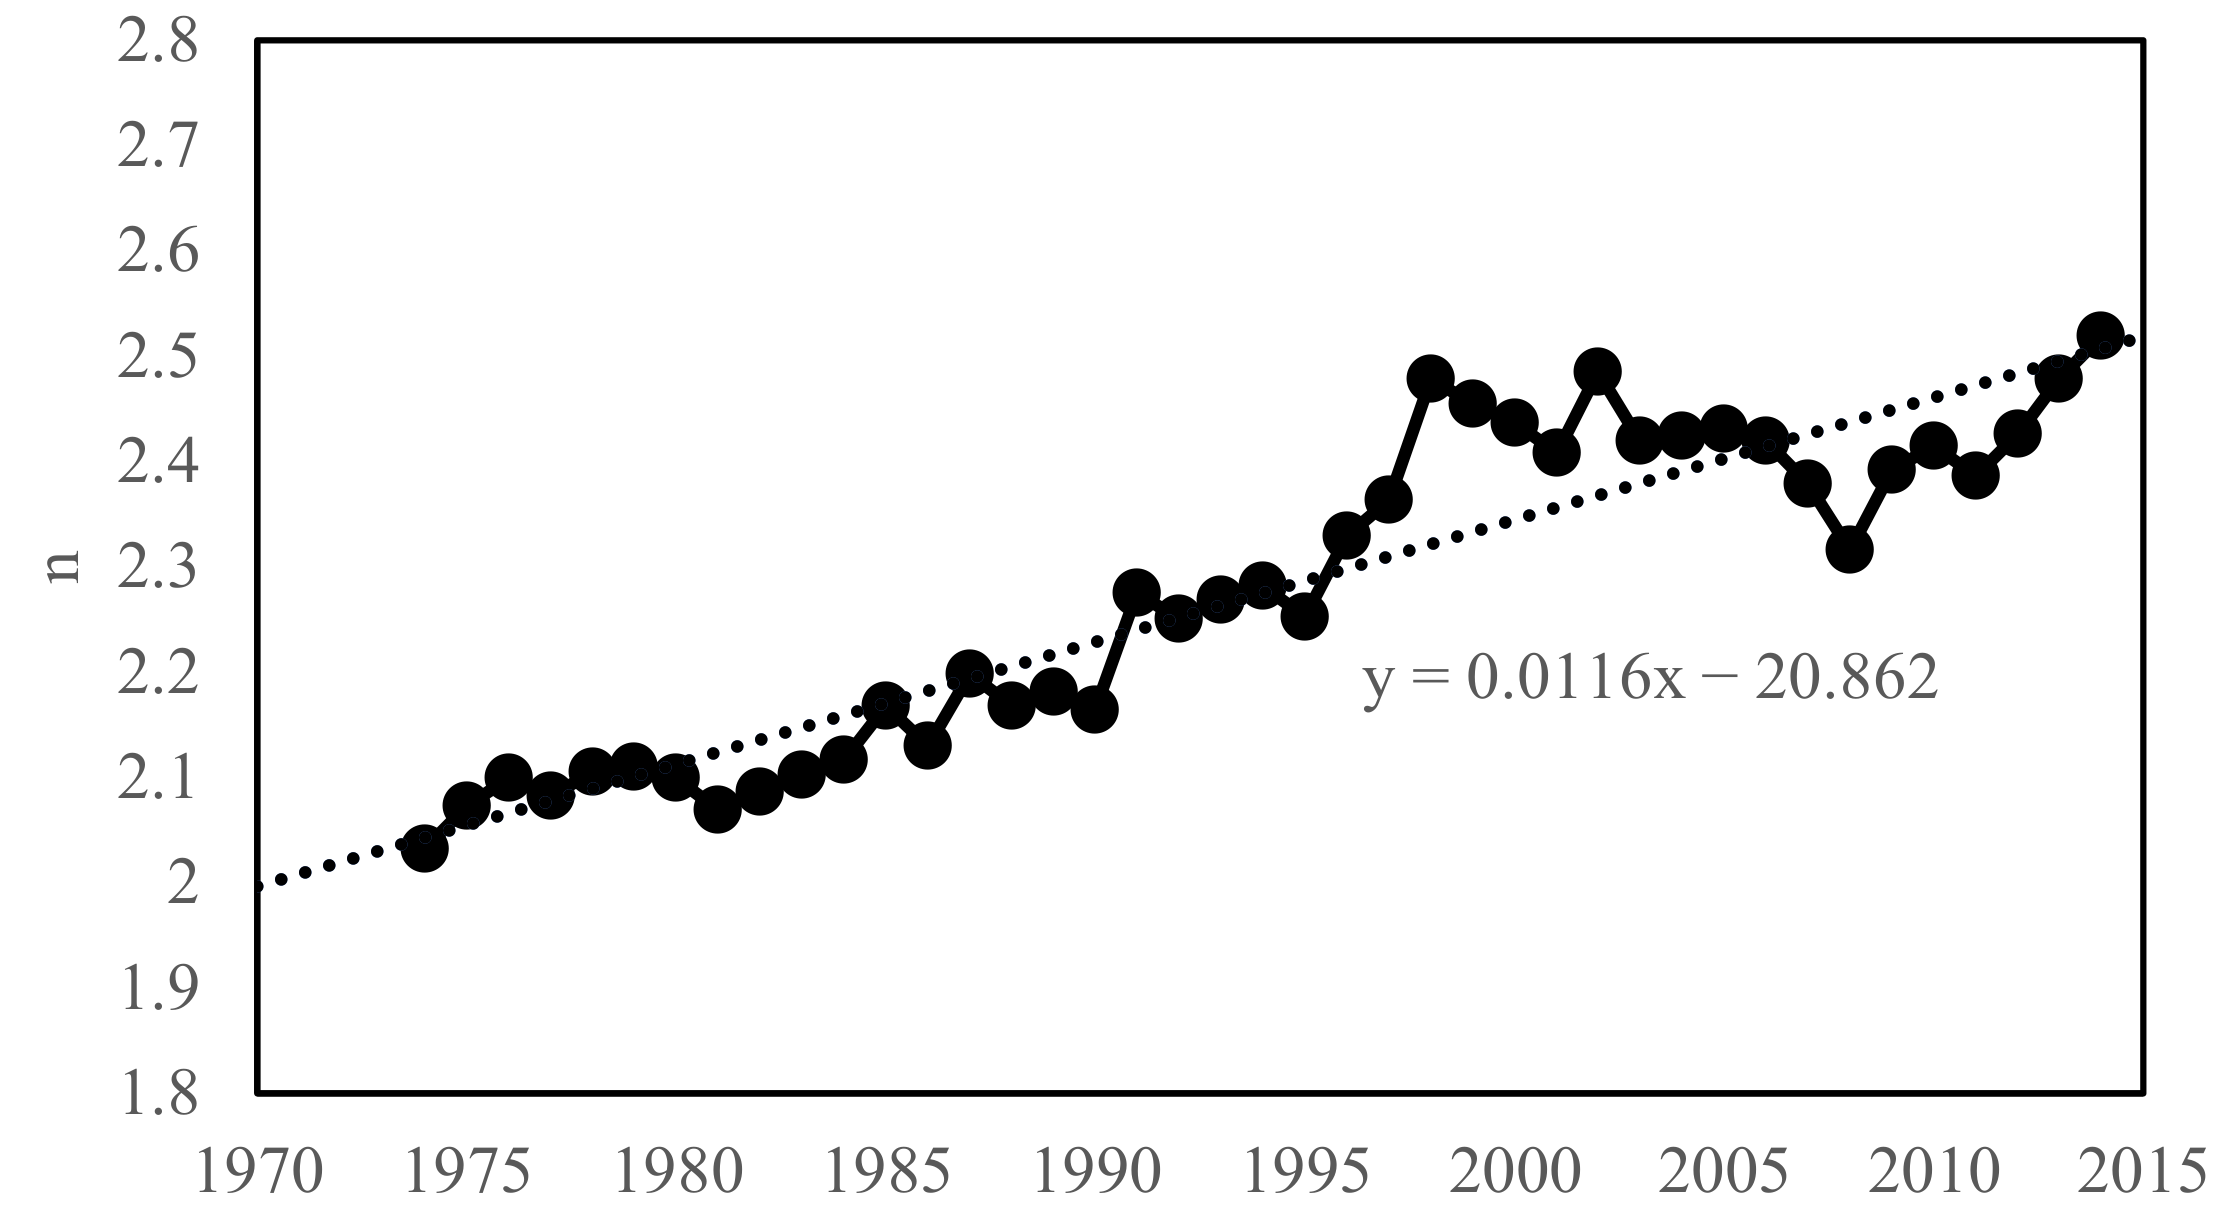
n is an important factor influencing runoff variation. In this paper, the variation of n and its effect on Q are analyzed in three periods. To further reflect the changing state of n, the meteorological and hydrological data for the whole time period were subjected to a 10-year sliding average, and the corresponding n was obtained by back-calculating Equation (4). The change of n actually shows the influence of other factors (underlying surface) on runoff change after excluding P and ET. The increase in n indicates that the influence of underlying surface change on Q increases, and in this paper, the value of n is negatively correlated with Q. The increase in its value indicates a stronger effect on Q reduction. As can be seen from Figure 5, n is in a fluctuating rising state throughout the period, with a significant continuous rising phase after 1995, followed by a gradually declining phase in the 2000s, and finally, a significant rising trend starting around 2008. This indicates that the underlying surface began to change more drastically around 1995 and 2008 than before due to human activities. The overall upward trend in n is likely related to increased artificial water withdrawal activity, and a study using reduced natural runoff would likely remove this trend.
The construction of soil and water conservation projects, the expansion of forest area, the intensification of human water extraction activities, the change of watershed water storage, and the construction of various water conservancy projects to a certain extent make the process of converting rainfall into runoff more complicated, and the water brought by rainfall is kept in the watershed for a longer period of time, increasing the degree of wetness in the watershed, so the runoff in the watershed will show a decreasing trend for a period of time, which is reflected in the n a significant increase. After a period of time, the vegetation coverage and wetness of the watershed reach a certain stage, and n is likely to remain more stable or even decline. In 1995, the middle reaches of the Yellow River protection forest creation project began to be implemented, and the first trials were carried out in Shaanxi and other forest areas. The Weihe River basin has since been subsumed under the project of protection forest construction [23,24]. The change in n from 1995 until the end of the 2000s is consistent with the pattern of change described above. In 2008, the Shaanxi provincial government launched the comprehensive management project of the Weihe River basin in Shaanxi Province, accelerating the construction of watershed water conservation and ecological projects, forest ecosystem protection and restoration projects, green ecological projects of the Weihe River channel and inter-basin water transfer, etc. From around 2008, n again showed an increase, but this state is likely not to last for a long time and is more likely to remain stable or decline in the future.
The impact of future global climate change on the Weihe River basin cannot be accurately simulated, but the increase in temperature and precipitation is recognized and determined at present, which will lead to the change of hydrothermal conditions in the Weihe River basin. The increase in atmospheric temperature and the humidity of the watershed will change the potential evapotranspiration. The increase in precipitation and potential evapotranspiration provides basic conditions for the increase in evaporation. At the same time, the vegetation coverage of the Weihe River basin is also growing rapidly, which makes the change of evaporation more rapid. The increase in precipitation has a positive effect on runoff, but evaporation has the opposite. A very important point is that in the future, Hanjiang to Weihe River Project will add 1.5 billion·m3 per year of water to the Weihe River. Therefore, there will be many uncertainties in future runoff changes in the Weihe River basin, which require more research on future climate change and human activities.
6. Conclusions
In this paper, the trend and mutation of hydrometeorological elements in the Weihe River basin from 1970 to 2019 were analyzed using the Mann-Kendall test. the contribution of climate and underlying surface changes to runoff changes were identified by the elasticity coefficient method which is based on the Budyko framework. The main findings are as follows:
- 1.
- Runoff in the Weihe River basin shows a decreasing trend during 1970–2019 with an abrupt change in 1990 and then decreasing significantly; potential evapotranspiration and precipitation increases slightly during 1970–2019, with the rate of 1.46 mm and 7.68 mm per decade, respectively.
- 2.
- According to the elasticity coefficients of each period, runoff is the most sensitive to precipitation (2.72~3.17), second most sensitive to underlying surface parameter (−2.01~−2.35), and least sensitive to potential evapotranspiration (−1.72~−2.17). Underlying surface parameter and potential evapotranspiration were negatively correlated with runoff, while precipitation was positively correlated.
- 3.
- During 1990–2009, the increase in underlying surface parameter led to a decrease in runoff by 13.92 mm, which contributed 66.11% to the runoff variation. The effect of precipitation and potential evapotranspiration was a secondary factor. The combination effects of precipitation, potential evapotranspiration and underlying surface parameter changes resulted in a significant decrease in runoff by 21.06 mm. During 2010–2019, underlying surface parameter increased further, resulting in a 22.19 mm decrease in runoff, accounting for 179.65% of runoff change; precipitation turned to an upward trend, which led to a 11.80 mm (accounting for −95.56% of the total runoff change) increase in runoff.
- 4.
- In the future, climate change, precipitation, evaporation, and runoff in the Weihe River basin are likely to increase. The increase in vegetation coverage and the interference of human activities will add more uncertainties to the change in the Weihe River runoff. In summary, the runoff of the Weihe River will increase in the future, which requires more comprehensive assessment of climate change and human activities.
Author Contributions
Conceptualization, J.X.; methodology, J.X.; validation, T.X.; formal analysis, J.X.; investigation, J.X.; resources, J.X.; data curation, J.X.; writing—original draft preparation, J.X.; writing—review and editing, J.X.; visualization, J.X.; supervision, X.G. and Z.Y.; project administration, J.X.; funding acquisition, Z.Y. All authors have read and agreed to the published version of the manuscript.
Funding
This research was funded by the National Key R&D Program of China (2018YFC1508201), the National Natural Science Foundation of China (51879274) and the China Institute of Water Resources and Hydropower Research (SKL2020ZY03).
Institutional Review Board Statement
Not applicable.
Informed Consent Statement
Not applicable.
Conflicts of Interest
The authors declare no conflict of interest.
References
- Zhang, L.P.; Xia, J.; Hu, Z.F. Situation and problem analysis of water resource security in China. Resour. Environ. Yangtze Basin 2009, 18, 116–120. [Google Scholar]
- Zhang, Q.; Singh, V.P.; Sun, P.; Chen, X.; Zhang, Z.; Li, J. Precipitation and streamflow changes in China: Changing patterns, causes and implications. J. Hydrol. 2011, 410, 204–216. [Google Scholar] [CrossRef]
- Wagener, T.; Sivapalan, M.; Troch, P.A.; McGlynn, B.L.; Harman, C.J.; Gupta, H.V.; Kumar, P.; Rao, P.S.; Basu, N.B.; Wilson, J.S. The future of hydrology: An evolving science for a changing world. Water Resour. Res. 2010, 46, W05301. [Google Scholar] [CrossRef]
- Zhang, Y.; Guan, D.; Jin, C.; Wang, A.; Wu, J.; Yuan, F. Analysis of impacts of climate variability and human activity on streamflow for a river basin in northeast China. J. Hydrol. 2011, 410, 239–247. [Google Scholar] [CrossRef]
- Ma, H.; Yang, D.; Tan, S.K.; Gao, B.; Hu, Q. Impact of climate variability and human activity on streamflow decrease in the Miyun Reservoir catchment. J. Hydrol. 2010, 389, 317–324. [Google Scholar] [CrossRef]
- Budyko, M.I. Climate and Life; Academic Press: Cambridge, MA, USA, 1974. [Google Scholar]
- Choudhury, B. Evaluation of an empirical equation for annual evaporation using field observations and results from a biophysical model. J. Hydrol. 1999, 216, 99–110. [Google Scholar] [CrossRef]
- Yokoo, Y.; Sivapalan, M.; Oki, T. Investigating the roles of climate seasonality and landscape characteristics on mean annual and monthly water balances. J. Hydrol. 2008, 357, 255–269. [Google Scholar] [CrossRef]
- Zhang, S.; Yang, H.; Yang, D. Quantifying the effect of vegetation change on the regional water balance within the Budyko Framework. Geophys. Res. Lett. 2015, 43, 1140–1148. [Google Scholar] [CrossRef]
- Depeng, Z.; Zongxue, X.; Caihong, S. Impact of change and human activity on streamflow in the wei river basin. J. Beijing Norm. Univ. 2013, 49, 115–123. [Google Scholar]
- Sun, Y.; Li, D. Features and response to climate-driven factors of the runoff in the upper reaches of the Weihe River in 1975–2011. J. Glaciol. Geocryol. 2014, 36, 413–423. [Google Scholar]
- Shi, R.; Tian, P.; Zhao, G.; Mu, X.; Zou, Y.; Liu, Y. Comparative study of runoff changes and their attribution in typical watersheds in China’s north-south transitional zone. Yellow River 2020, 42, 29–35. [Google Scholar]
- Zhang, L.; Zhao, G.; Mu, X.; Gao, P.; Sun, W. Attribution of runoff variation in the Wei River basin based on the Budyko hypothesis. Acta Ecol. Sin. 2018, 38, 7607–7617. [Google Scholar]
- Yellow River Conservancy Commission of the Ministry of Water Resources. The Main Tributaries of the Yellow River System. Available online: http://www.yrcc.gov.cn/hhyl/hhgk/hd/sx/201108/t20110814_103450.html,2011-08-14 (accessed on 3 April 2021).
- China Meteorlogical Administration. Grades of Meteorological Drought: GB/T 20481-2017; Standards Press of China: Beijing, China, 1996.
- Wei, F. Xiandai Qihou Tongji Zhenduan Yu Yuce Jishu; Meteorological Press: Beijing, China, 2007.
- Roderick, M.L. A simple framework for relating variations in runoff to variations in climatic conditions and catchment properties. Water Resour. Res. 2011, 47, W00G07. [Google Scholar] [CrossRef]
- Yang, D.; Zhang, S.; Xu, X. Attribution analysis for runoff decline in Yellow River Basin during past fifty years based on Budyko hypothesis. Sci. Sin. 2015, 45, 1024–1034. [Google Scholar]
- Liliang, R.; Hongren, S.; Fei, Y.; Chongxu, Z.H.; Xiaoli, Y.A.; Peili, Z.H. Hydrological drought characteristics in the Weihe catchment in a changing environmen. Adv. Water Sci. 2016, 27, 492–500. [Google Scholar]
- Hou, Q.L.; Bai, H.Y.; Ren, Y.Y.; He, Y.N.; Ma, X.P. Analysis of variation in runoff of the main stream of the Weihe River and related driving forces over the last 50 years. Resour. Sci. 2011, 33, 1505–1512. [Google Scholar]
- Caixia, B.; Xingmin, M.; Guangju, Z.; Hua, B. Effects of climate change and human activity on streamflow in the Wei River Basin. Sci. Soil Water Conserv. 2013, 11, 33–38. [Google Scholar]
- Liu, Y.; Wang, G.; Jin, J.; Bao, Z.; Liu, C. An attribution method for catchment-scale runoff variation evaluation under environmental change based on Budyko hypothesis. Hydro-Sci. Eng. 2014, 6, 1–8. [Google Scholar]
- Ning, Y.; Yang, X.; Sun, W.; Mu, X.; Gao, P.; Zhao, G.; Song, X. The trend of runoff change and its attribution in the middle reaches of the Yellow River. J. Nat. Resour. 2021, 36, 256–269. [Google Scholar] [CrossRef]
- Tang, D. Middle Reaches of Yellow River Protection Forest System Construction and Soil and Water Conservation; Northwest University Press: Xi’an, China, 2000. [Google Scholar]
Figure 1.
Distribution of meteorological and hydrological stations in the Weihe River basin.

Figure 2.
Trend of hydrological elements in the Weihe River basin. (a) Runoff Depth. (b) Potential Evapotranspiration. (c) Precipitation. (d) Runoff Coefficient.
Figure 2.
Trend of hydrological elements in the Weihe River basin. (a) Runoff Depth. (b) Potential Evapotranspiration. (c) Precipitation. (d) Runoff Coefficient.

Figure 3.
Detection of M−K mutation points of annual runoff depth in the Weihe River basin.

Figure 4.
Contribution of various factors to runoff changes in the Weihe River basin.

Figure 5.
10-year sliding average n values in the Weihe River basin.


Table 1.
Past studies in Weihe River basin.
| Researcher | Main Influencing Factors | Contribution Rate |
|---|---|---|
| Zuo | Human activities | More than 50% |
| Sun | Potential evapotranspiration | More than 60% |
| Shi | Human activities | 48.87% |
| Zhang | Human activities | More than 60% |
Table 2.
Hydrological information of the Weihe River basin.
| Area | Watershed Area (104 km2) | Runoff (104 m3/a) | Runoff Depth (mm/a) | Rainfall (mm/a) | Period (Year) |
|---|---|---|---|---|---|
| Weihe River Basin | 14.48 | 638,525.14 | 48.34 | 526.11 | 1970~2019 |
Table 3.
M–K test for hydrometeorological elements in the Weihe River basin.
| Elements | M–K Method Statistic | 0.05 Significance Level | Significance | Linear Fitting Formula | Maximum Value/mm | Minimum Value/mm | Extreme Value Ratio |
|---|---|---|---|---|---|---|---|
| Runoff depth, Q | −2.05 | ±1.96 | Significant | y = −0.4167x + 879.52 | 109.31 | 16.48 | 6.63 |
| Potential evapotranspiration, ET | −0.04 | Not significant | y = 0.1464x + 695.76 | 1072.17 | 865.16 | 1.24 | |
| Precipitation, P | 0.61 | Not significant | y = 0.7675x − 1004.6 | 758.16 | 347.74 | 2.18 | |
| Runoff coefficient, a | −3.29 | Significant | y = −0.0008x + 1.7665 | 0.16 | 0.04 | 4 |
Table 4.
Changes in hydrometeorological elements in the Weihe River basin in different periods.
| Periods\Elements | Precipitation | Runoff Depth | Potential Evaporation | ||||||
|---|---|---|---|---|---|---|---|---|---|
| Average Value/mm | Amount of Change/mm | Rate of Change | Average Value/mm | Amount of Change/mm | Rate of Change | Average Value/mm | Amount of Change/mm | Rate of Change | |
| Base periods | 526.90 | - | - | 59.09 | - | - | 979.73 | - | - |
| PΙ | 504.11 | −22.79 | −4.33% | 38.32 | −20.77 | −35.15% | 990.04 | 10.31 | 1.05% |
| PII | 568.55 | 41.65 | 7.90% | 46.86 | −12.23 | −20.70% | 998.74 | 19.01 | 1.94% |
Table 5.
Elasticity coefficients of each hydrological element in the Weihe River basin at different periods.
Table 5.
Elasticity coefficients of each hydrological element in the Weihe River basin at different periods.
| Periods\Elasticity Coefficients | Underlying Subsurface Parameter, n | |||
|---|---|---|---|---|
| Base period | 2.06 | 2.72 | −1.72 | −2.01 |
| PΙ | 2.35 | 3.06 | −2.06 | −2.35 |
| PII | 2.52 | 3.17 | −2.17 | −2.18 |
Table 6.
Identification of attribution of runoff changes in the Weihe River basin.
| Periods\Elements | ∂Q/∂P ∆P + ∂Q/∂ET ∆ET + ∂Q/∂n ∆n/mm | Difference/mm | ||||
|---|---|---|---|---|---|---|
| PΙ | −6.18 | −0.95 | 13.92 | −20.77 | −21.06 | 0.29 |
| PII | 11.80 | −1.96 | 22.19 | −12.23 | −12.35 | 0.12 |
Publisher’s Note: MDPI stays neutral with regard to jurisdictional claims in published maps and institutional affiliations. |
© 2021 by the authors. Licensee MDPI, Basel, Switzerland. This article is an open access article distributed under the terms and conditions of the Creative Commons Attribution (CC BY) license (https://creativecommons.org/licenses/by/4.0/).
Share and Cite
MDPI and ACS Style
Xu, J.; Gao, X.; Yang, Z.; Xu, T. Trend and Attribution Analysis of Runoff Changes in the Weihe River Basin in the Last 50 Years. Water 2022, 14, 47. https://doi.org/10.3390/w14010047
AMA Style
Xu J, Gao X, Yang Z, Xu T. Trend and Attribution Analysis of Runoff Changes in the Weihe River Basin in the Last 50 Years. Water. 2022; 14(1):47. https://doi.org/10.3390/w14010047
Chicago/Turabian StyleXu, Junjie, Xichao Gao, Zhiyong Yang, and Tianyin Xu. 2022. "Trend and Attribution Analysis of Runoff Changes in the Weihe River Basin in the Last 50 Years" Water 14, no. 1: 47. https://doi.org/10.3390/w14010047
Note that from the first issue of 2016, this journal uses article numbers instead of page numbers. See further details here.