
The Impact of Extreme Weather Events on Bacterial Communities and Opportunistic Pathogens in a Drinking Water Treatment Plant
by
 , , and
Wei Tang
1,† ,
,
Yunsi Liu
1,†,
Qiuyan Li
1,
Ling Chen
1,2,
Qi Li
3,
Pan Li
1,2,* and
Shengji Xia
1,2 1
School of Environmental Science and Engineering, Tongji University, Shanghai 200092, China
2
State Key Laboratory of Control and Resource Reuse, School of Environmental Science and Engineering, Tongji University, Shanghai 200092, China
3
National Inland Waterway Regulation Engineering Research Center, Chongqing Jiaotong University, Chongqing 400074, China
*
Author to whom correspondence should be addressed.
†
These authors contributed equally to this work.
Water 2022, 14(1), 54; https://doi.org/10.3390/w14010054
Submission received: 28 November 2021
/
Revised: 19 December 2021
/
Accepted: 23 December 2021
/
Published: 28 December 2021
(This article belongs to the Topic Impact of Toxic Elements on Water Quality and Treatment Methods)
Abstract
:Drinking water treatment processes are highly effective at improving water quality, but pathogens can still persist in treated water, especially after extreme weather events. To identify how extreme weather events affected bacterial populations in source and treated water, water samples were collected from the Yangtze River Delta area and a local full-scale drinking water treatment plant. Bacterial community structure and the occurrence of pathogens were investigated in samples using 16S rRNA sequencing and qPCR techniques. In this study, the results show that intense rainfall can significantly increase levels of bacteria and opportunistic pathogens in river and drinking water treatment processes (p < 0.05); in particular, the relative abundance of Cyanobacteria increased after a super typhoon event (p < 0.05). The biological activated carbon (BAC) tank was identified as a potential pathogen reservoir and was responsible for 52 ± 6% of the bacteria released downstream, according to Bayesian-based SourceTracker analysis. Our results provide an insight into the challenges faced by maintaining finished water quality under changing weather conditions.

1. Introduction
As the main water source of human beings, surface water resources including rivers and lakes relate to drinking water safety. However, source water contains a large number of chemical contaminants and pathogenic microorganisms from various environmental pollution sources [1,2]. Climate change is an important driver of the variation in contaminants and pathogens in source water [3]. Due to climate change, the occurrence of extreme weather events such as typhoons or hurricanes is becoming more frequent worldwide [4,5], and these are expected to increase the frequency and intensity of extreme precipitation events in the future with a concomitant increase in concerns over waterborne disease due to contamination of the drinking-water supply [6]. Levels of turbidity, total organic matter and hazardous contaminants such as heavy metals (e.g., arsenic and mercury), as well as micropollutants such as pharmaceuticals and personal care products, pesticides and disinfection by-products, have all been shown to increase in source and drinking water after extreme weather events [7,8,9,10]. However, there has been few investigations of microbial contamination resulting from climate change, although higher bacterial concentrations in drinking water have been reported following a hurricane [9].
Drinking water treatment processes are considered efficacious safeguards of water quality, although the influence of source water is still apparent in the make-up of bacterial communities present in finished water [11]. To abide by public health regulations, a growing number of water treatment plants have deployed multi-step treatments to produce potable water, among which conventional treatments like coagulation and sedimentation are used to limit bacterial growth, while disinfection techniques including chlorination and ozonation aim to inactivate bacteria [12,13]. Besides conventional treatments, a biological activated carbon (BAC) step has been extensively applied in drinking water treatment plants (DWTPs). BAC treatment has been found to be effective in removing organic and inorganic matter, but growth of bacteria in the BAC medium can be responsible for contributing to microbial communities downstream [14]. Accordingly, a detailed exploration of the effect of drinking water treatment processes, especially BAC treatment, on the composition of microbial communities in finished water is timely and necessary.
Thus, despite the various drinking water treatment processes that take place, there are still plenty of bacteria remaining in finished water [15]. Among these microorganisms are some waterborne pathogens or opportunistic pathogens such as Legionella and Mycobacterium species, which pose a public health risk as they cause infectious diseases [16]. Previous studies have evaluated bacterial and fungal diversity at various stages in conventional water treatment processes [17,18], have elucidated spatiotemporal changes in bacterial communities [19,20], and have investigated the occurrence of pathogenic microorganisms in drinking water systems [21]. For example, Tiwari et al. analyzed the spatial and seasonal dynamics of bacterial communities within the Kokemäenjoki River watershed [20]. They concluded that artificial groundwater recharge can produce biologically stable and microbiologically safe drinking water. However, a comprehensive demonstration of how bacterial and pathogen contamination changes from the source water through the multi-step water treatment processes is still lacking. Moreover, the influence of climate events like typhoons and intense rainfall on the microorganisms in source water and drinking water plants has not yet been explored.
In this study, source water samples from the Yangtze River Delta area, as well as water samples from each treatment step in a local full-scale DWTP, were collected. Bacterial communities were analyzed using 16S rRNA sequencing techniques, while opportunistic pathogens were determined by a quantitative polymerase chain reaction (qPCR) method. Specifically, the microbiome in water samples after super typhoon Lekima and a tropical depression rainfall event occurring in summer 2019 was evaluated to determine the influence of these extreme weather events on the changes in microbial population from river water through each treatment step. The variations in numbers of total bacteria, microbial diversity, community structure and target opportunistic pathogens (i.e., Legionella spp., L. pneumophila, Mycobacterium spp., and M. avium) from source water to treated water were investigated, while the contribution of BAC treatment to downstream bacteria and pathogens was exclusively elucidated and estimated by Bayesian-based SourceTracker analysis. Overall, this study aimed to obtain a better understanding of microbiome in source and drinking water in extreme weather and to provide possible guidance for future water management in adapting to changing weather conditions.
2. Materials and Methods
2.1. Water Sources
Four water sampling sites on and around the Yangtze River were chosen. These were at the intake (S1) of source water from the Yangtze River for a water treatment plant and 2–3 kilometers upstream of the intake (S3); an alternative intake (S2) of source water from a tributary of the Yangtze River; and a harbor (S4) in the tributary.
2.2. Water Treatment Process
An anonymous Chinese DWTP that treats river water from the above water source intakes was selected in this study. The facility operates two trains of water treatment processes in parallel, providing 700,000 m3 of potable water daily to about 1,300,000 residents in the nearby city. Both trains contain coagulation-sedimentation, filtration, O3-BAC and chlorine disinfection and are fed with the same flow of raw water (Figure S1). The difference between the two trains is that Train I uses horizontal flow sedimentation and a V-filter, while Train II uses Multiflo-sedimentation and a TGV filter. The design parameter of major water treatment facilities in the DWTP is shown in Table S1.
2.3. Sample Collection
Water samples were collected from the four river sites listed above and from locations along the treatment process for each train (Figure S1) at selected times (i.e., October 2018, January 2019, April 2019, July 2019) representing autumn, winter, spring, and summer. Average river temperature in the four seasons were 20.2 °C (October), 8.6 °C (January), 17.7 °C (April), and 25.3 °C (July), respectively. Annual precipitation in the sampling sites is about 1061 mm. Furthermore, two extra sampling time points were selected to analyze the influence of extreme weather events: July 12 to 13 2019 (before and after a rainfall event influenced by a tropical depression) and 9 to 13 August 2019 (before, during and after super typhoon Lekima). Typhoon Lekima (number 1909) was a category 4 super typhoon that developed from a tropical storm, and it passed through our sampling area on 10 August 2019 (http://typhoon.nmc.cn/web.html, accessed on 31 August 2020). According to the weather records of Jiangsu Weather Bureau, the 24 h cumulative rainfall was 51.0 mm for the tropical depression event and 85.9 mm for the super typhoon event (http://data.cma.cn/data/online.html?dataCode=SURF_R1&dataTime=20191205070000, accessed on 31 August 2020).
One-liter source water, 1 L raw water, 1 L sedimentation effluents, 2 L filtration effluents, 2 L BAC effluents and 2–4 L disinfection effluents were collected in sterile 1 L sample bottles, which were filtered instantly and shipped to laboratories in coolers containing ice and kept at −20 °C until analysis. BAC biofilm samples were collected from the top (B1, at the depths of ~20 cm), middle (B2, 80–100 cm) and bottom (B3, >120 cm) of the BAC filters in the fourth, fifth and sixth months (i.e., February 2019, March 2019 and April 2019) after the start of its operation (the end of October 2018) using a self-designed multilevel steel sampler. In addition, BAC influents and effluents were collected at the same time points. In total, 74 samples were collected in this study, including 16 source water samples, 9 BAC biofilm samples, 35 DWTP samples, and 14 typhoon samples.
2.4. Water Chemistry Analysis
Physiochemical parameters of water including temperature, turbidity, ammonia, nitrate and total chlorine were measured on-site. Temperature was monitored using a Bante903P portable meter (BANTE Instruments, Shanghai, China). Turbidity was measured using a 2100P portable turbidimeter (HACH). Total chlorine, ammonia and nitrate were measured using a HACH DR900 colorimeter based on the manufacturer’s instructions (HACH). Dissolved organic carbon (DOC) was measured on a L-TOC analyzer (SHIMADZU, Tokyo, Japan). The physiochemical parameters of the water samples are shown in Tables S2–S4.
2.5. DNA Extraction and qPCR
The three replicate BAC samples from each part of BAC filters were weighed (wet weight: ~0.5 g) before DNA extractions. DNA from water and BAC biofilm samples was extracted using a FastDNA SPIN Kit (MP Biomedicals) according to the manufacturer’s instructions. Bacterial 16S rRNA genes from Legionella spp., L. pneumophila, Mycobacterium spp., M. avium were enumerated by qPCR using a 7500 real-time PCR system (Applied Biosystems, Foster City, CA, USA) according to a previously published method [22,23]. The method details including qPCR primers, probes, and annealing temperatures are summarized in Table S5. Each qPCR reaction was performed in triplicate with each 10-µL reaction mixture containing 5 µL 2 × Premix Ex Taq II, 200 nM each primer, 100 nM probe, 0.1 µL 50 × ROX Reference Dye II and 1 µL DNA template. The limits of quantification (LOQ) were 10 gene copies per reaction for all qPCR assays except for 16S rRNA genes (100 gene copies per reaction). Samples yielding a detectable threshold cycle in at least two experiments out of three were scored as positive. Control reactions contained the same mixtures, but with 1 µL sterile water replacing the DNA template. Amplification efficiency was monitored and standards amplified with similar efficiencies of 90–110%.
2.6. 16S rRNA Sequencing
The V3-V4 16S rRNA gene region was amplified in triplicate for each DNA extract using the primers 338F (5′-ACTCCTACGGGAGGCAGCA-3′) and 806R (5′-GGACTACHVGGGTWTCTAAT-3′). PCRs were performed with a 20 μL system using TransStart Fastpfu DNA Polymerase (Beijing TransGen Biotech, Beijing, China). A 2% agarose gel was used to confirm the PCR product sizes. The three PCR amplifications for each sample were combined and then purified using the AxyPrep DNA Gel Extraction Kit (Axygen Biosciences, Union City, CA, USA). The purified amplifications were diluted and pooled to give equal final concentrations for subsequent sequencing. Finally, 16S rRNA gene sequencing was performed on the Illumina MiSeq platform using paired-end 250 bp kits at the Majorbio Bio-Pharm Technology Corporation in Shanghai, China. All sequencing data have been deposited in the NCBI Sequence Read Archive under the project accession number PRJNA681286.
The raw paired-end reads were screened using Trimmomatic v0.39 to remove short sequences and noisy reads [24]. After trimming, the paired-end reads were merged using FLASH v1.2.11 [25]. Chimeric sequences were detected and removed from further analysis using UCHIME v4.1 [26]. The remaining high-quality sequences were clustered into operational taxonomic units (OTUs) with 97% similarity using UPARSE v7.0 [27]. Subsequently, a representative sequence was selected from each OTU. The taxonomic assignments of the representative sequences were performed using the Ribosomal Database Project (RDP) classifier v2.11 against the SILVA 16S rRNA gene database (Release 135, http://www.arb-silva.de, accessed on 31 August 2020), with a threshold confidence level of 70% [28,29].
After each sample was rarefied to the equivalent sequencing depth, alpha diversity indices and Bray–Curtis distance matrices were calculated using Mothur v1.30.2 [30]. Non-metric multidimensional scaling (NMDS) analysis and analysis of similarity (ANOSIM) were performed based on the generated Bray–Curtis distance to evaluate the variation in the microbial community structure among different sample groups [31]. Hierarchical clustering of biofilms with different bacterial community compositions was performed using unweighted pair groups and an arithmetic average (UPGMA) method to classify and compare samples [32,33].
2.7. Statistical Analysis
Statistical tests were performed using R (version 3.6.3, https://www.r-project.org, accessed on 15 October 2021). The Shapiro–Wilk test (shapiro.test) was used to test the normality of datasets. According to the normality and variance of the dataset, Student’s t-test or Wilcoxon rank-sum test was selected to compare any two normally distributed datasets, while parametric one-way analysis of variance (ANOVA) or the non-parametric Kruskal–Wallis test was performed to compare numbers of target microorganisms and physiochemical parameters. Statistical significance was set at p < 0.05.
The Bayesian modeling method SourceTracker was applied to evaluate the extent of bacterial contribution during the transition from upstream to downstream [34]. For the analysis of the BAC tank, microbial communities in the influent and biofilm samples from within the BAC tank were considered as source, while the corresponding BAC effluent bacteria were defined as sink, in this study. SourceTracker analysis was conducted using default settings with a rarefaction depth of 1000, burn-in 100, restart 10, alpha (0.001), and beta (0.01), which have been demonstrated to provide high sensitivity, specificity, accuracy, and precision [35]. The mean contribution proportion and standard deviation were calculated from ten independent runs for each source to prevent potential false positive predictions [35,36].
3. Results
3.1. Bacterial Community Structures in Source Water and Drinking Water Treatment Plant
Bacterial community compositions in different source water sampling sites are shown in Figure S2a. Proteobacteria (40.9%) was the most prominent phylum, followed by Actinobacteria (32.8%), Bacteroidetes (10.0%), Cyanobacteria (7.0%), Acidobacteria (2.4%), and Chloroflexi (1.1%) in all samples combined. These six phyla represented an average combined relative abundance of 96.7 ± 0.5%, consistent with previous studies revealing that these groups are widely distributed in freshwater habitats [37].
Figure S2b shows the average relative abundance of bacterial phyla through the drinking water treatment processes. The most prevalent phyla were Proteobacteria (49.7%), Actinobacteria (13.6%), Cyanobacteria (13.0%), Firmicute (8.8%), Bacteroides (6.9%), Acidobacteria (1.4%), Planctomycetes (1.3%), and Patescibacteria (1.3%) (sum of relative abundance of >1%). Proteobacteria and Actinobacteria were generally predominant in raw water, while the relative abundance of Firmicute and Cyanobacteria increased in finished water. The bacterial community composition of Multiflo sedimentation effluents was similar to that of raw water. Compared to horizontal flow sedimentation effluents, Multiflo sedimentation effluents contained a higher relative abundance of Actinobacteria (p < 0.05) and a lower relative abundance of Proteobacteria (p < 0.05), indicating discrepancy in removal efficiency of different bacterial phylum in the two sedimentation tanks. Other water treatment processes, including filtration (TGV filter and V-filter), ozonation-BAC tank and disinfection, also influenced the bacterial community. In addition, the dominant bacterial phylum compositions in filtration effluents and finished water were similar, implying the potential influence of filtration in shaping the finished water microbiome.
3.2. Changes in Bacterial Community Composition and Diversity after Extreme Weather Events
In the Yangtze River Delta area, rainfall, occasionally associated with a tropical depression or typhoon, mainly occurs in summer (between July and October). During our study period, we analyzed the influence of a rainfall event and of super typhoon Lekima on the composition of bacterial communities in source and treated water.
Notable changes in bacterial community structure at the phylum level were observed in treated water samples after the tropical depression rainfall event (Figure 1a). An increased proportion of Firmicutes (from 0.5% to 17.9%) and Planctomycetes (from 1.8% to 2.9%) was characteristic of water samples from the disinfection outflows after rainfall in the present study. The Shannon diversity index based on OTUs in the raw water increased from 4.28 to 4.75 after rainfall (Figure 1b). Similarity, an increased Shannon diversity index (from 1.91 to 3.57) of finished water after rainfall was also observed.
Consecutive five-day sampling of source water (Yangtze River), raw water and finished water (from the DWTP) before, during and after one, two and three days of the super typhoon Lekima event was conducted to evaluate the typhoon’s effect. UPGMA-based cluster analysis shows that source water and raw water samples were very similar, but all finished water samples clustered separately from the other samples (Figure 2), revealing the modification of bacterial composition caused by drinking water treatment processes. Although there was no conspicuous shift in the percentage of Cyanobacteria in source water and raw water samples, a considerable increase in Cyanobacteria occurred in finished water samples after the typhoon event (p < 0.05), and its proportion gradually decreased as time passed. By the third day after the typhoon event, the proportion of Cyanobacteria had returned to a level similar to that before the typhoon.
3.3. Variations in Total Bacteria and Pathogenic Microorganisms
The total concentrations of bacterial DNA, estimated by qPCR targeted at 16S rRNA genes, are shown in Figure S3 for water samples from the two trains of the DWTP. The annual average gene copies (excluding rainfall events) of 16S rRNA genes was 1.03 × 10⁹ copies/L in raw water, 2.89 × 10⁷ copies/L in coagulation-sedimentation effluents, 3.86 × 10⁷ copies/L in Multiflo-sedimentation effluents, 4.48 × 10⁴ copies/L in sand filtration effluents, 1.03 × 10⁴ copies/L in TGV filtration effluents, 7.24 × 10⁷ copies/L in O3-BAC tank effluents and 8.94 × 10³ copies/L in disinfection effluents. Here, gene copy numbers were log-transformed (log(x + 1)) prior to calculating the removal efficacy of bacteria in drinking water treatment trains. The number of total bacteria removed by coagulation-sedimentation fluctuated from 1 to 4 log, with the annual average fluctuation being 2.10 log. In contrast, the quantity of total bacteria removed by other treatment processes was relatively constant over the whole period: 2.71 log of 16S rRNA genes was removed by sand filtration and, although there was a large increase of 3.07 log after the O3-BAC treatment, this was followed by an obvious decrease of 3.40 log in the disinfection tank. There was no significant difference in the concentration of total bacteria between multiflo-sedimentation effluents and horizontal flow sedimentation effluents, while the TGV filter was better at removing total bacteria than the V-filter (p < 0.05). Overall, large quantities of total bacteria were removed by conventional water treatment processes, especially at the sand filtration and disinfection steps.
Although not all Legionella and Mycobacterium species are pathogenic, many have been implicated in human and animal disease [38,39]. In this study, total Legionella spp. and Mycobacterium spp. were determined: examples of both genera were found in all source water samples taken from the Yangtze River area. The occurrence of particular bacterial species was more variable; 81.3% of water samples contained L. pneumophila, but M. avium was not detected except in the water samples collected during the typhoon period. As is shown in Figure S4, rainfall significantly affected the number of Legionella spp. in the river water samples from the intake (S1) and alternative intake (S2) (p < 0.05). The annual average representation of Legionella spp., without considering the effect of the summer rainfall event, was 6.0 × 10⁵ and 5.5 × 10⁵ copies/L in the S1 and S2 samples, respectively, but reached 1.4 × 10⁶ and 3.0 × 10⁶ copies/L after rainfall. Similarly, rainfall also significantly affected the number of Mycobacterium spp. in source water sites (p < 0.05). The average level of Mycobacterium spp. in the S1 and S2 samples increased from 7.8 × 10⁵ and 8.5 × 10⁵ to 2.7 × 10⁶ and 4.2 × 10⁶ copies/L after rainfall, respectively.
These target opportunistic pathogens were quantified in treated water samples at each treatment step (Figure 3). Legionella spp. and Mycobacterium spp. were found in all treated water samples, but by the end of the pipeline had decreased by 1–5 log. In line with the change in concentration of total bacteria (Figure S3), levels of Legionella spp. and Mycobacterium spp. showed a universal and sequential decrease at each treatment step except O3-BAC treatment. Specifically, sedimentation can effectively eliminate both Legionella spp. and Mycobacterium spp. (p < 0.05). V-filter continuously decreased their number (p < 0.05). But the removal efficacy of Legionella in TGV filter was not obvious. In addition, a significant rebound in Mycobacterium spp. and Legionella spp. was observed in the O3-BAC effluent. Ultimately, most of them were effectively eliminated by disinfection. M. avium and L. pneumophila were not detected in finished water. The chlorine dose used by the water treatment plant we studied was 1.5–2.3 times the usual dose in summer (including the rainfall and typhoon period) to ensure relatively stable quality of the finished water, but mycobacteria gene markers were still found in treated water. Although not all Mycobacterium species are pathogenic, their potential health risk to humans needs to be paid attention to.
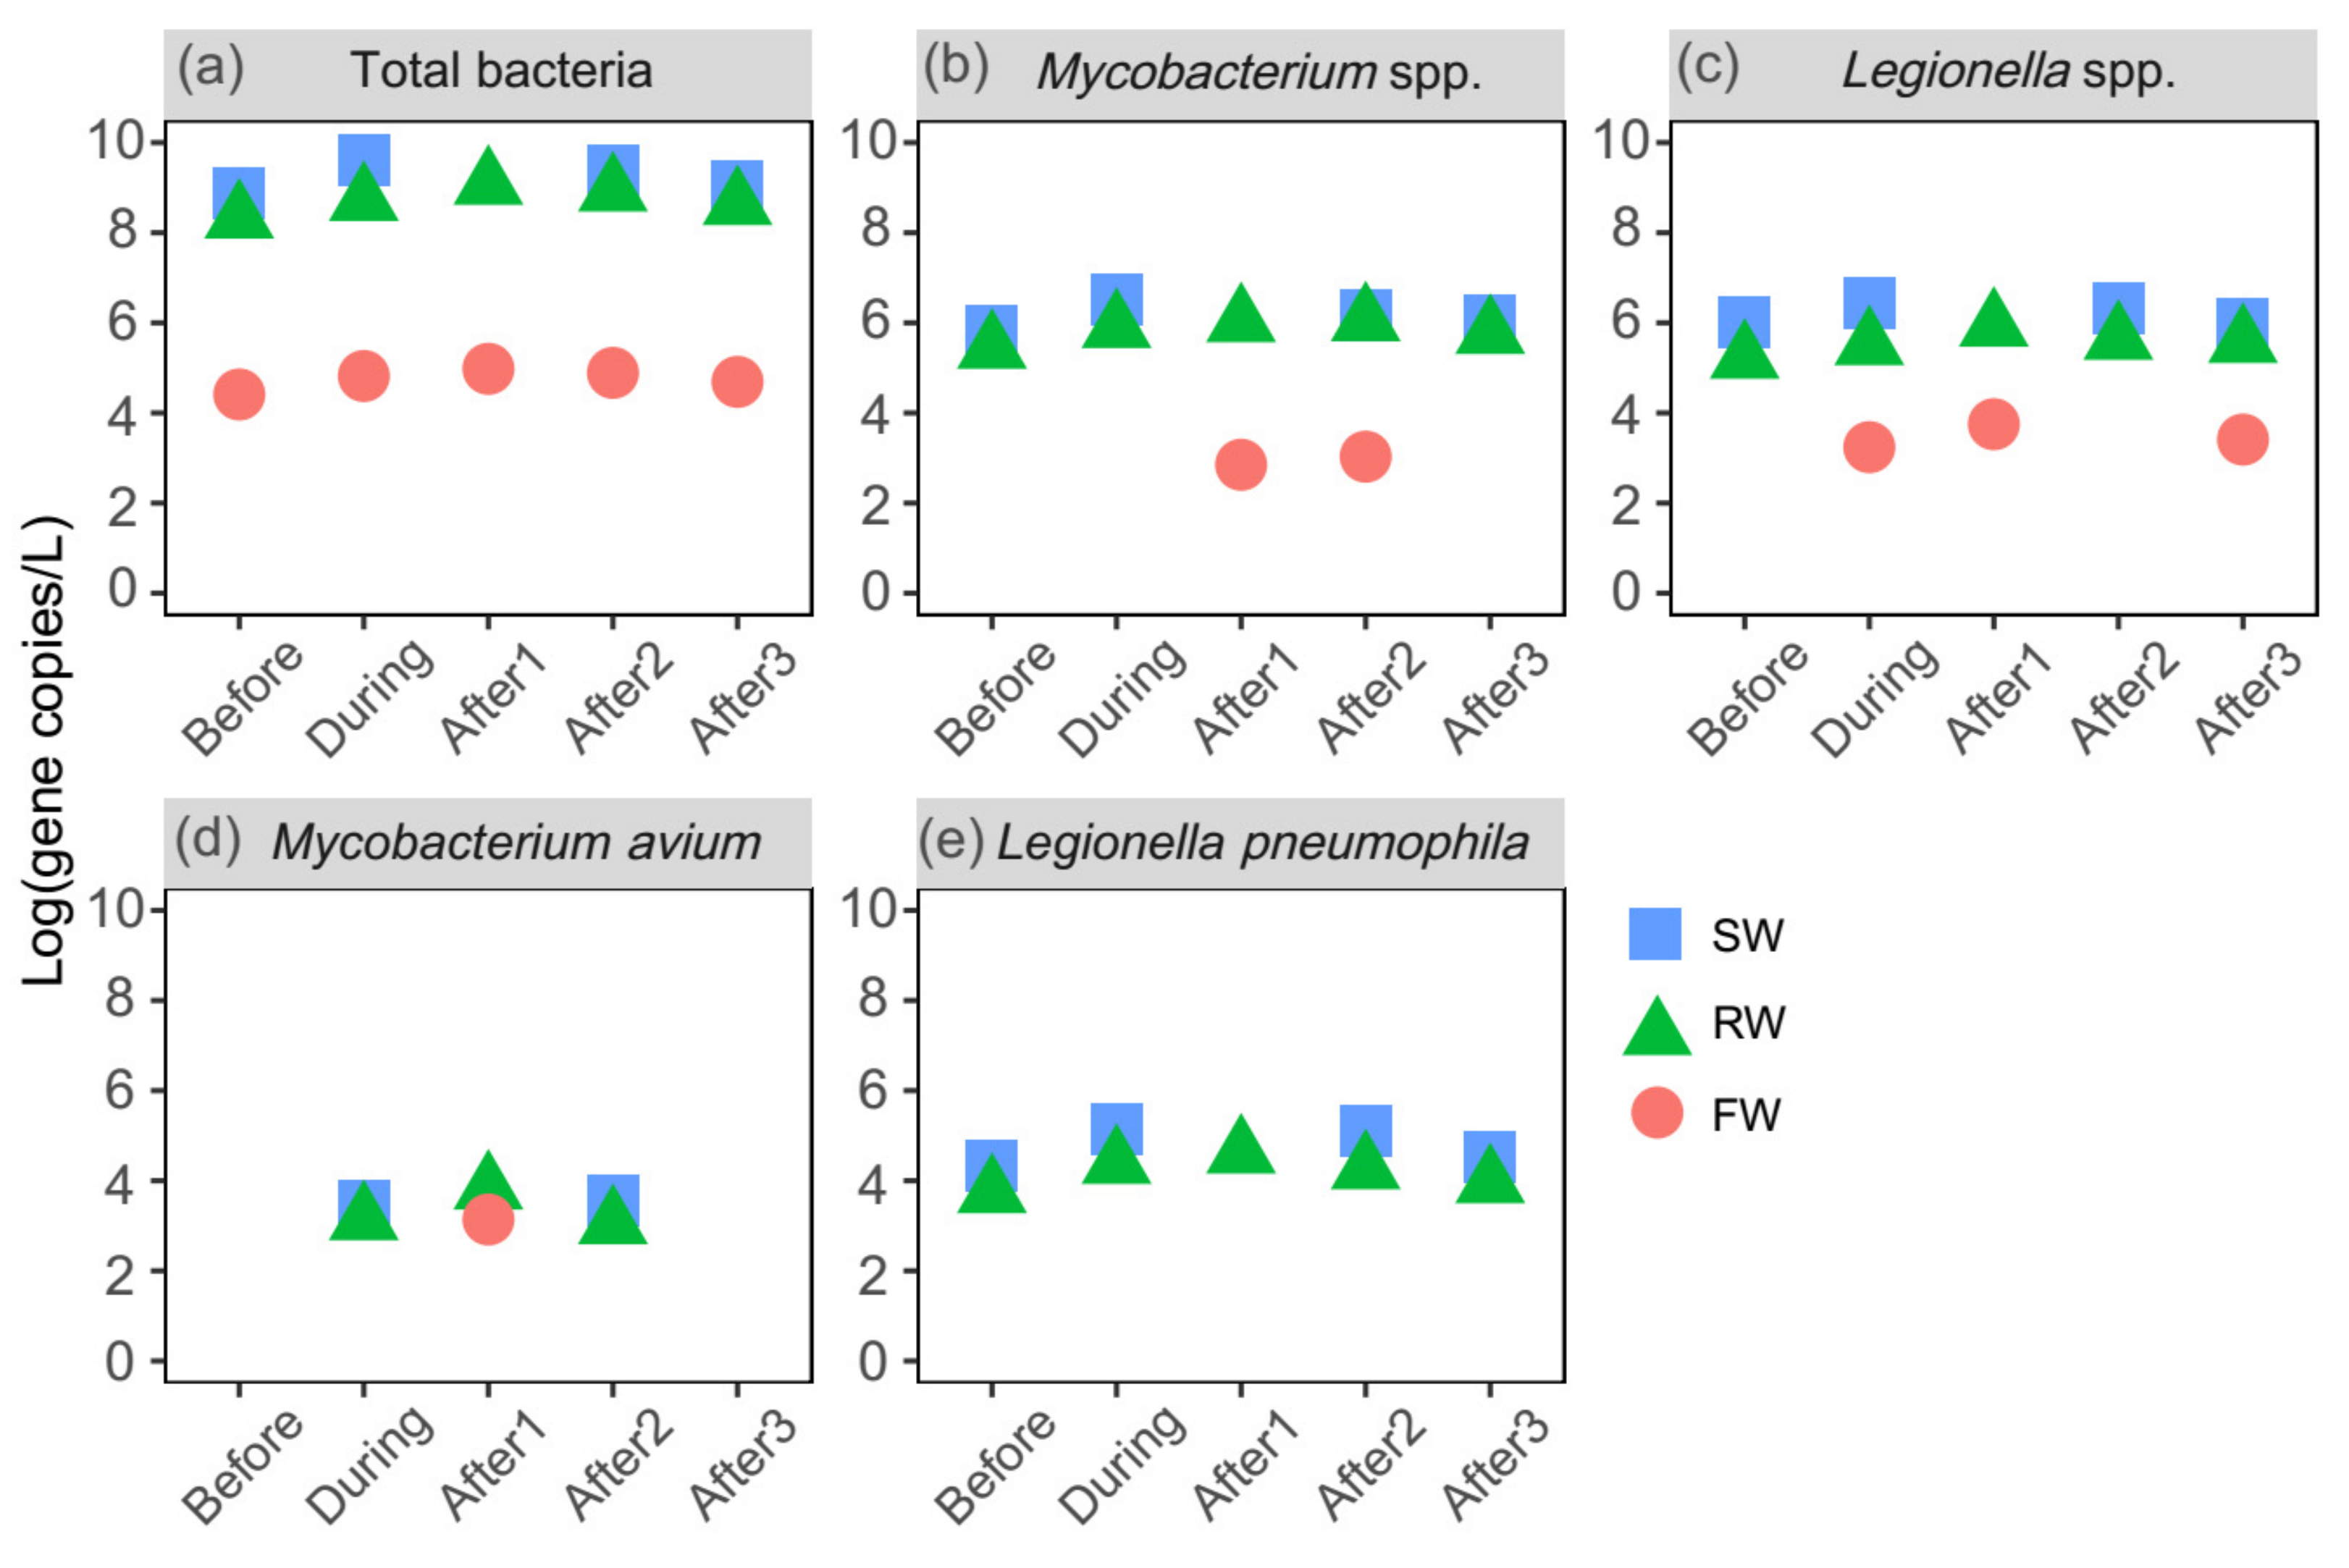
The numbers of Legionella spp. and Mycobacterium spp. increased significantly after the summer rainfall in raw water and water samples from almost all water treatment stages (p < 0.05), indicating that pathogen contamination may be associated with rainfall events. Furthermore, elevated levels of total bacteria and potential opportunistic pathogens in source water were observed during the typhoon period (Figure 4). For example, the concentration of L. pneumophila in source water during the typhoon period was approximately four times higher than before the typhoon event. One day after the typhoon event, the levels of total bacteria, Mycobacterium spp., and Legionella spp. were 9.55 × 10⁴, 7.08 × 10², and 5.62 × 10³ copies/L in finished water, respectively. Notably, M. avium, which did not appear in source water before the typhoon event, was observed in source water during the typhoon period and in finished water on the first day after the typhoon left, indicating the effect of an extreme weather event on opportunistic pathogen levels. On the third day, Mycobacterium spp. and L. pneumophila were not found in finished water, and the levels of total bacteria and Legionella spp. decreased to 4.90 × 10⁴ and 2.57 × 10³ copies/L, respectively.
3.4. Effect of O3-BAC Treatment on Effluent Bacterial Communities and Opportunistic Pathogens
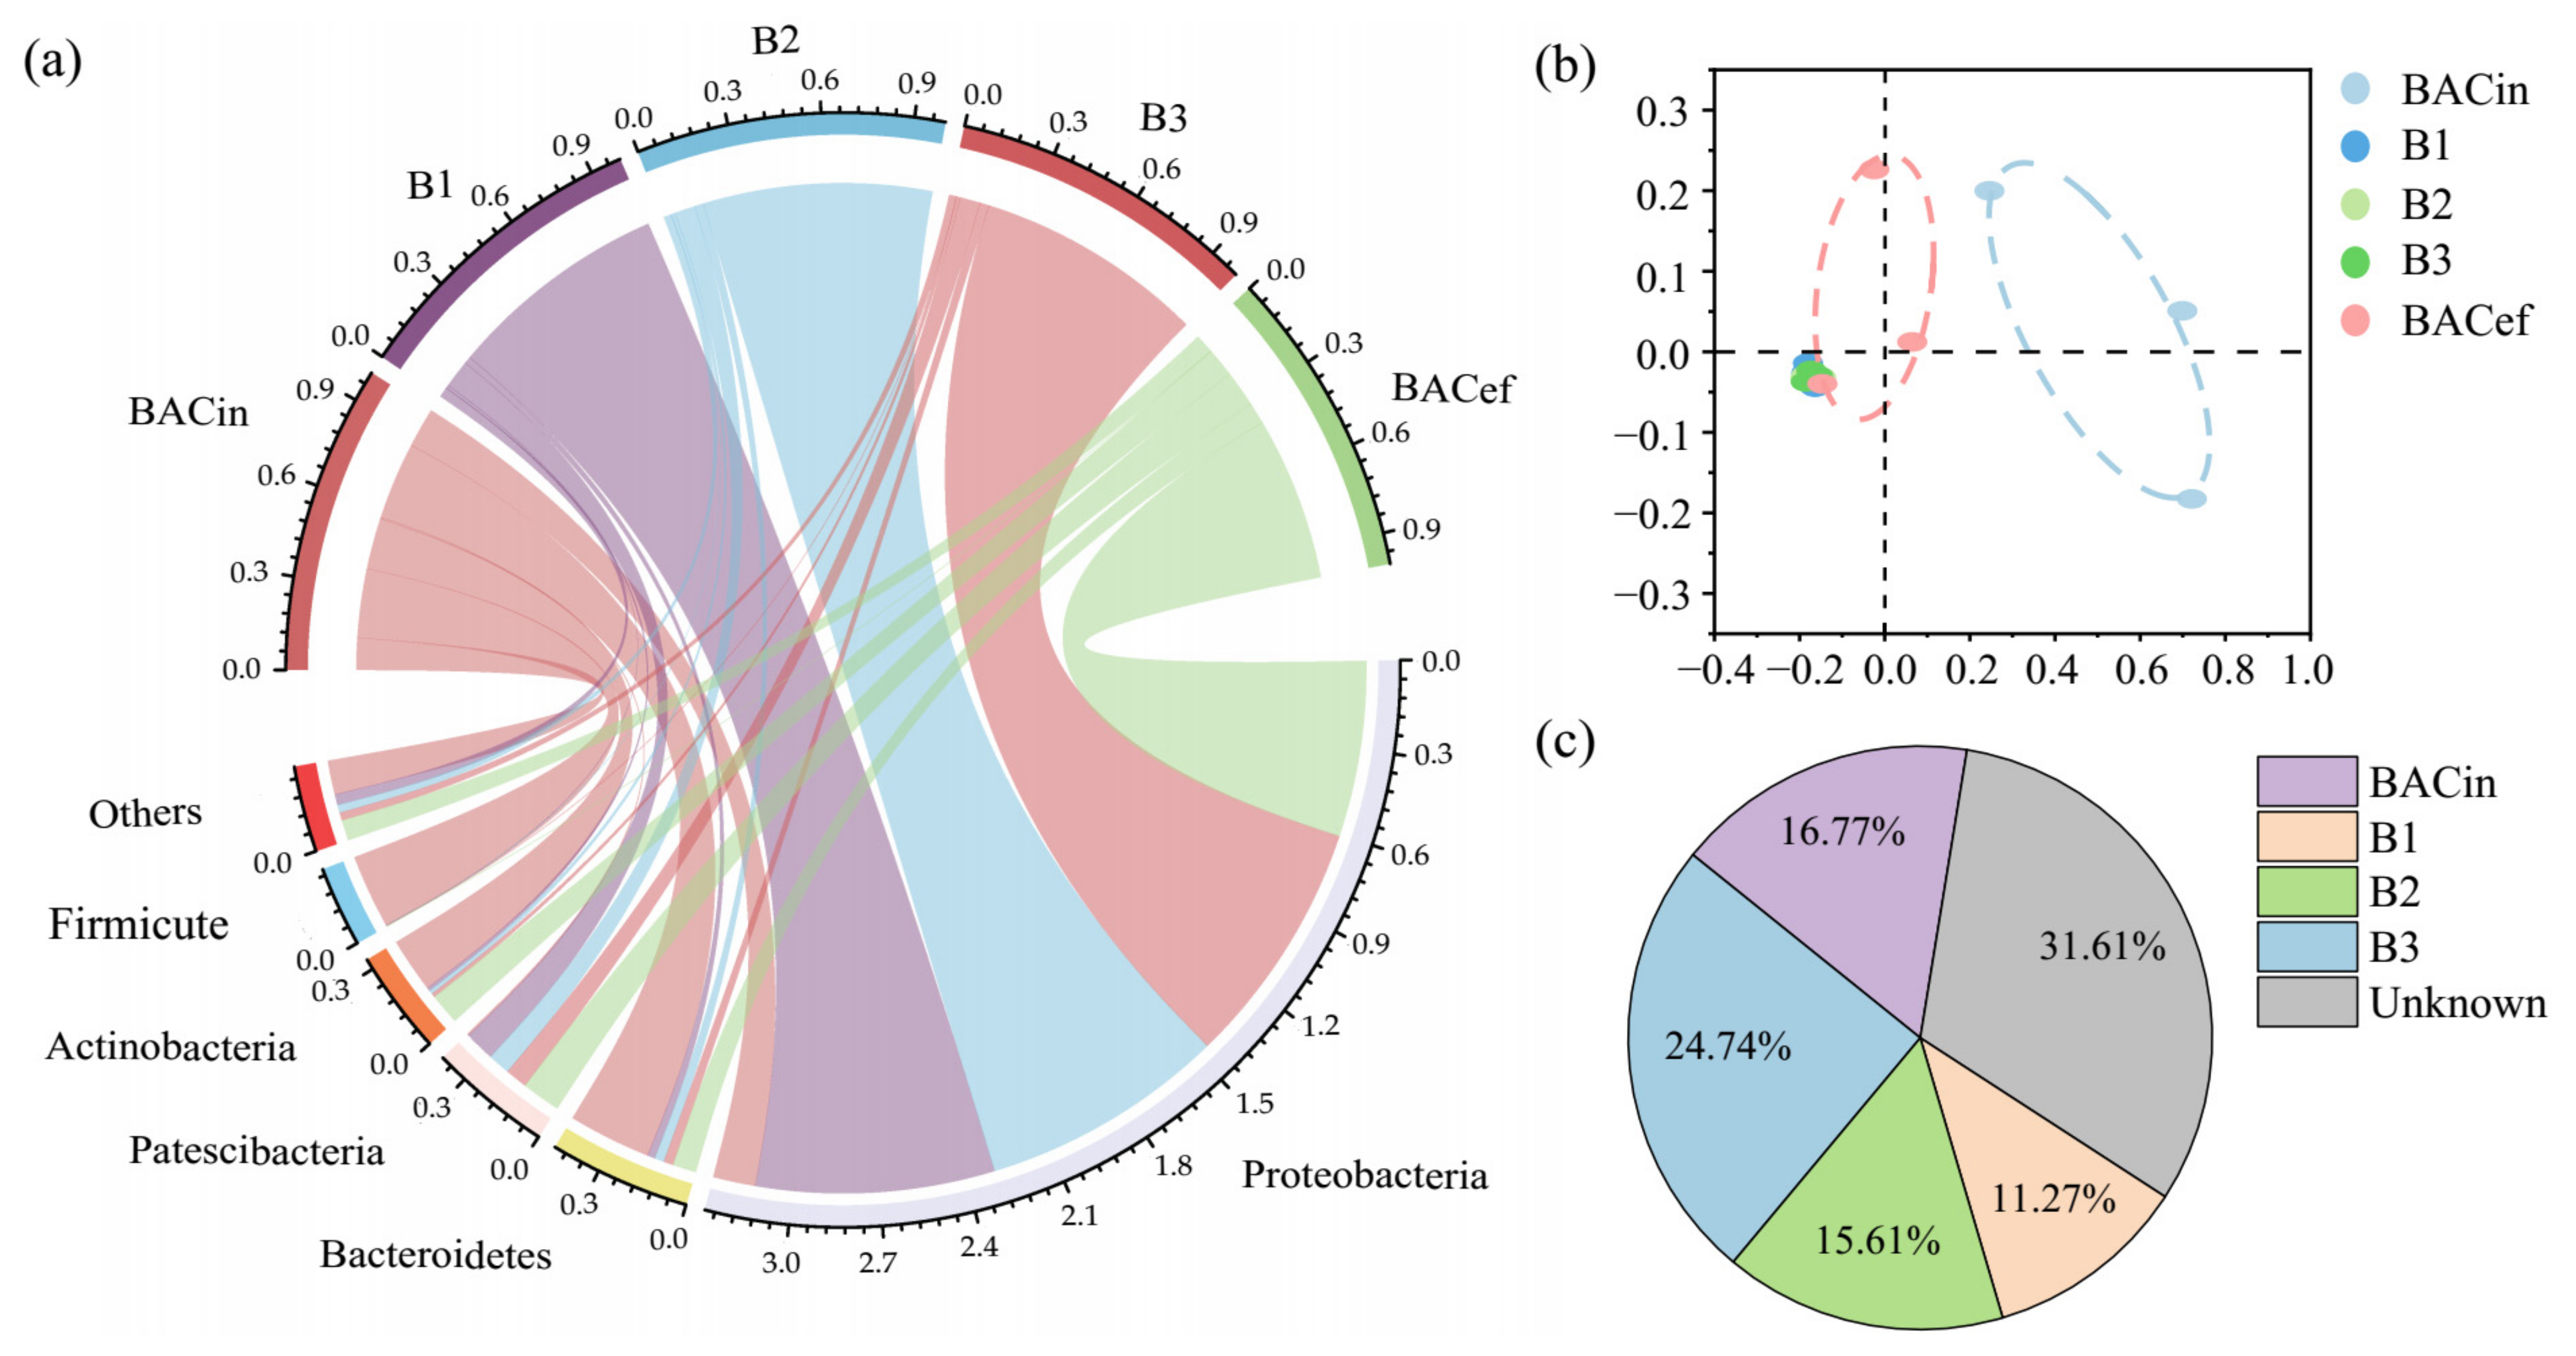
To specifically investigate the effect of the BAC tank on the composition of microbial communities, water samples from its influents and effluents, as well as biofilm samples from the top (B1), middle (B2) and bottom (B3) of the tank, were collected over a three-month period. As Figure 5a shows, while Bacteroidetes (28.5%), Actinobacteria (18.9%) and Firmicutes (25.5%) were predominant in BAC influent samples, the relative abundance of these three taxa in in effluents decreased by 20.4%, 8.21% and 25.4%, respectively; in contrast, the representation of Proteobacteria and Patescibacteria increased by 45.9% and 12.8%, respectively. In addition, beta diversity was analyzed based on the Bray–Curtis distance by non-metric multidimensional scaling (NMDS) (Figure 5b). There were no significant differences among biofilm samples from the three locations in the BAC tank. However, analysis of similarities (ANOSIM) confirmed that the bacterial communities found in BAC influents differed from those in BAC effluents (R = 0.372, p = 0.001). When the Bayesian-based SourceTracker method was used to calculate the extent of the contribution of BAC influents and biofilm bacteria to effluent bacterial populations, the results confirmed the effect of the BAC tank on the relative representation of the various bacterial groups (Figure 5c). The SourceTracker proportions of all biofilm samples (B1, B2 and B3) ranged from 32.57% to 78.9% during the three-month period, with an average of 51.63 ± 5.66% (average ± standard deviation).
In addition, target opportunistic pathogens including Legionella spp., Mycobacterium spp. and L. pneumophila were detected in biofilms in the BAC tank (Table S6). The gene copies of Legionella spp. and Mycobacterium spp. rRNA genes in detected biofilm samples were in the range of 2.07 × 10⁴ to 3.84 × 10⁶ copies/L, and 1.64 × 10³ to 3.48 × 10³ copies/L, respectively. Occasionally, L. pneumophila was also detected in biofilm samples (detection rate: 2/9). After a six-month operation period, both Legionella spp. and Mycobacterium spp. were detected in all biofilm samples from different locations of the tank. As shown in Figure 3, the annual concentration (excluding the rainfall event) of Mycobacterium spp. in filtration effluents was in the range of 4.83 × 10² to 3.52 × 10³ copies/L (detection rate: 5/14). After O3-BAC treatment, the concentration of Mycobacterium spp. increased by 1 or 2 log, which was in the range of 3.47 × 10³ to 2.03 × 10⁵ copies/L (detection rate: 7/7).
4. Discussion
4.1. Occurrence and Removal of Total Bacteria and Opportunistic Pathogens
Drinking water safety is of great importance in the Yangtze River Delta area, the fastest developing region in China. During the one-year study period, bacterial communities and levels of total bacteria and pathogenic microorganisms in river water and treated water at a local DWTP were evaluated by 16S rRNA sequencing and qPCR techniques, respectively.
As emerging drinking water opportunistic pathogens, Legionella and mycobacteria contribute significantly to the number of cases of infectious disease. During 2014–2016, 3.85% of patients with severe pneumonia of unknown cause were positive for waterborne L. pneumophila in China [40,41]. The detection rates for Legionella spp. and Mycobacterium spp. in our river samples were much higher than those in the literature, which might increase the load on subsequent drinking water treatment units [42,43]. In an earlier study, Tiwari et al. found Mycobacterium and Legionella reads in surface water using a high-throughput sequencing method, indicating that the ecological conditions may be favorable for some of the pathogenic species to survive [20]. Thus, a more targeted exploration of the factors that influence the presence of these pathogens in environmental waters is needed.
These influencing factors mainly included meteorological conditions, hydrological conditions, water quality, and historical microbial concentrations [44]. Our results showed significant correlations between total bacteria, Mycobacterium spp., Legionella spp., L. pneumophila and DOC (p < 0.01), respectively (Table S7). DOC is an important carbon source for heterotrophic microorganisms. DOC has the capability to bind and transport contaminants. Furthermore, DOC may interact with disinfectants and form disinfection by-products [45,46]. However, the removal efficiency of DOC in water treatment processes is relatively low (Table S3). Considering the positive correlations between opportunistic pathogens and DOC, both the concentration and composition of DOC and the occurrence of these bacteria in drinking-water source and treated water need to be continuously considered.
We found that large numbers of total bacteria were removed by drinking water treatment processes, especially at the sand filtration and disinfection steps (p < 0.05, Figure S3), confirming the efficacy of multi-step water treatment processes. However, Legionella and mycobacteria were not removed completely (Figure 3), indicating a potential risk. Other potential opportunistic pathogens, including the genera Pseudomonas, Acinetobacter, Staphylococcus, etc., have been detected in finished water samples from various drinking water plants in previous studies [47,48]. Many such organisms could survive in a viable but non-culturable (VBNC) state and then revive under favorable conditions in the long-term drinking water distribution systems [49]. It has been documented that even the most susceptible mycobacterial species, M. avium and M. gordonae, are 100 and 330 times more resistant to chlorine than Escherichia coli [50]. Thus, it is important that an appropriate concentration of disinfectant residual should be applied and maintained to decrease opportunistic pathogens and inhibit their regrowth in drinking water systems.
The process design of water treatment plants would also influence the removal of opportunistic pathogens. Our results showed the removal efficacy of Legionella in TGV filter was not obvious (Figure 3). Compared to V-filter, the advantages of TGV filter were higher formation efficacy of alumen ustum, faster removal rate of particulate matters and smaller occupied area [51]. However, large particle size of filtering media and fast filtration rate of TGV filter might have a disadvantage of not being able to intercept small-size bacteria.
4.2. Impact of Extreme Weather Events on Bacteria and Opportunistic Pathogens
Natural extreme weather events such as super typhoons, floods and hurricanes may cause water quality deterioration and waterborne disease outbreaks [52]. Investigation of the impact of extreme weather events on the quality of source and treated water is crucial to the optimization and microbial safety of DWTPs during long-term operation. Over the whole year covered by this study, two rainfall events were specifically taken into account: a typical rainfall event associated with a tropical depression from the Pacific and an intense rainfall event involving super typhoon Lekima. According to the National Climate Center of China, Lekima caused 56 fatalities in mainland China and was responsible for the second largest typhoon-related economic loss in China since 2000 (RMB 51.53 billion yuan) [53].
There was a clear increase in the percentage of Cyanobacteria in finished water samples during the typhoon event (Figure 2). It has previously been reported that Cyanobacteria can survive in drinking water treatment systems due to their filamentous morphology [54]. In addition, Cyanobacteria have been demonstrated to be prevalent in the reaches of the Yangtze River [55]. During storms, transport of watershed nutrients and bacteria via surface runoff and river discharge can lead to their rapid accumulation in water bodies [56]. Cyanobacteria are known to impact water quality through the release of cyanotoxins and it has been proven that they might be present in treated drinking water supplies when cyanobacterial blooms occur in source waters [57]. Furthermore, the formation of toxic halogenated byproducts (DBPs) during chlorination in the presence of cyanobacteria represents an increased health risk in drinking water [58]. However, the relative abundance of Cyanobacteria in finished water samples did not increase after the first rainfall event (Figure S2b). The differences between the first rainfall event and the typhoon event may be attributed to different sampling time points and different precipitation intensity. More rainfall events and larger sample sizes need to be studied.
The rainfall and typhoon events raised the concentrations of total bacteria and opportunistic pathogens in source water and in finished water (p < 0.05, Figure 3, Figure 4, Figures S3 and S4), indicating an impact of extreme weather events on DWTP performance. The source water in this study was located in the downstream area of Yangtze River. A previous investigation showed that Legionella spp. were mainly detected in river midstream and downstream regions in Taiwan, particularly after rainfall events [43], which was in accordance with our result. Elevated levels of fecal indicator bacteria, Escherichia coli and Enterococci, in rivers after hurricane events or typhoon events also have been documented [59,60,61]. In this study, an obvious elevated turbidity was found in source water during the typhoon event (Table S4), implying their contribution to elevated levels of total bacteria and opportunistic pathogens.
The increase in these bacteria in river water after rainfall and typhoon events, particularly in downstream regions, is possibly due to the input of soil and water contaminants, sediment pathogens and polluted aerosols. Mycobacterium spp. and Legionella spp. are natural inhabitants of soils, water bodies, and enter engineered water systems mainly through surface water [62,63,64]. For example, van Heijnsbergen et al. reported that Legionella bacteria were detected in 30% (6/20) of soils and 3.9% (3/77) of rainwater puddles by amoebal coculture, and they concluded that soil and rainwater may be alternative sources for Legionella [64]. With surface runoff, opportunistic pathogens in soil were flushed into the river during the rainfall events, increasing the levels of bacteria in source water. Notably, our results showed that M. avium and L. pneumophila were not detected in source water until the typhoon event, indicating the exogenous contribution, such as contaminated soil. Rainfall may also carry water contaminants like sewage and livestock wastewater into the watershed and downstream regions [65]. Sediment could be disturbed by rainfall and serve as a constant source of pathogens because of their greater persistence in sediment [42]. Direct aerosolization also might occur after rainfall events owing to increased turbidity of river water, coupled with an increased presence of pathogens in the environment during warm, wet weather [66]. Although the increased levels of bacteria in river was observed, both M. avium and L. pneumophila were not detected in the finished water after the typhoon event, suggesting the effectiveness of chlorine residual to ensure relatively stable quality of the finished water. However, high level of disinfectants could easily produce disinfection byproducts. The source of pathogens and runoff nutrients in the raw water should be found and controlled before any consideration of higher doses of chlorine disinfectant to control the problem.
4.3. Contribution of BAC Tank to Downstream Bacteria and Pathogens
In the present study, our results showed a marked increase in the total number of bacteria (Figure S3, p < 0.05), greater diversity of bacterial communities (Figure 1b) and higher levels of Legionella spp. and Mycobacterium spp. (Figure 3, p < 0.05) in O3-BAC effluents, as compared to earlier in the treatment train. In line with the results of our study, an increase in cell counts and microbial diversity was observed after BAC filtration in an American water treatment plant recently [14]. According to the SourceTracker proportion, the BAC tank contributed over half of the downstream bacteria species (Figure 5a).
Given that Proteobacteria and Patescibacteria were the dominant taxonomic groups in all biofilm samples, accounting for over 90% of bacteria (Figure 5a), it seems possible that these communities had colonized the BAC tank and were being released into effluents, causing pathogen contamination in the downstream pipeline. Proteobacteria was the predominant taxon in treated water samples (Figure S2), and especially in BAC biofilm samples (Figure 5a), suggesting the BAC filtration unit provides a niche habitat where this group can flourish [67]. Patescibacteria is a newly defined superphylum and has been found to be prevalent in nutrient-limited aquifer environments. Their adaptive features including an ultra-small size, which increases surface area relative to cytoplasm volume, together with their streamlined cell functions, might be responsible for their presence in BAC biofilms [68]. In addition, opportunistic pathogens Legionella spp. and Mycobacterium spp. were also found in high quantities in biofilm samples from different tank depths over a three-month period (Table S6), indicating their colonization of and accumulation in BAC biofilms as well, which resulted in their increased presence in BAC effluents. Increased gene copies of opportunistic pathogens were also found in biofilms in previous studies, suggested that bacterial growth within BAC media can contribute to the microbial community in the filtrate [14,69].
5. Conclusions
We provide a comprehensive investigation of the change in levels of bacteria and opportunistic pathogens in source water from the Yangtze River and in treated water from a local DWTP under variable weather conditions. In this study, the results show that extreme weather events (typhoon and rainfall) elevated the levels of bacteria, including opportunistic pathogens (p < 0.05), and increased bacterial diversity (p < 0.05), in both river water and water treatment plant effluents; in particular, the relative abundance of Cyanobacteria increased in finished water during the typhoon event. However, the levels of M. avium and L. pneumophila were not found in finished water after the typhoon event. Overall, our results provide an insight into the challenges faced by maintaining finished water quality under changing weather conditions.
Supplementary Materials
The following are available online at https://www.mdpi.com/article/10.3390/w14010054/s1, Figure S1: Schematic diagram of the drinking water treatment plant with two trains of treatment processes, Figure S2: The annual average relative abundance of dominant taxa at the phylum level (a) in source water samples from four different sampling sites and (b) in water samples at each treatment step, Figure S3: Total 16S rRNA gene copy number at various stages of the water treatment process at different time points, Figure S4: (a) Legionella spp. and (b) Mycobacterium spp. in water samples from the intake (S1) and alternative intake (S2) of source water at different time points. Table S1: Construction of major treatment facilities in the DWTP, Table S2: Physiochemical parameters of source water samples collected at different timepoints, Table S3: Physiochemical parameters of treated water samples collected at different timepoints, Table S4: Physiochemical parameters of water samples collected during typhoon period, Table S5: PCR primers, probes, and annealing temperatures used in this study, Table S6: The numbers of gene copies of Mycobacterium spp., Legionella spp. and Legionella pneumophila in biofilm from the top (B1), middle (B2) and bottom (B3) of the reactor, Table S7: Correlations between the water quality parameters of source water and the gene copies of total bacteria and opportunistic pathogens.
Author Contributions
Data curation, W.T., Y.L. and Q.L. (Qiuyan Li); Formal analysis, W.T., Y.L., Q.L. (Qiuyan Li) and Q.L. (Qi Li); Investigation, W.T. and Q.L. (Qiuyan Li); Methodology, W.T. and Q.L. (Qiuyan Li); Project administration, L.C. and P.L.; Resources, L.C. and P.L.; Supervision, P.L. and S.X.; Validation, W.T.; Visualization, W.T. and Y.L.; Writing—original draft, W.T. and Y.L.; Writing—review & editing, Q.L. (Qi Li) and P.L. All authors have read and agreed to the published version of the manuscript.
Funding
This research was funded by the National Major Science and Technology Project for Water Pollution Control and Treatment (No.2017ZX07201002).
Data Availability Statement
All DNA sequencing data have been deposited in the NCBI Sequence Read Archive under the project accession number PRJNA681286.
Conflicts of Interest
The authors declare no conflict of interest.
References
- Brookes, J.D.; Antenucci, J.; Hipsey, M.; Burch, M.D.; Ashbolt, N.J.; Ferguson, C. Fate and transport of pathogens in lakes and reservoirs. Environ. Int. 2004, 30, 741–759. [Google Scholar] [CrossRef] [PubMed]
- Fang, W.; Peng, Y.; Muir, D.; Lin, J.; Zhang, X. A critical review of synthetic chemicals in surface waters of the US, the EU and China. Environ. Int. 2019, 131, 104994. [Google Scholar] [CrossRef]
- Cavicchioli, R.; Ripple, W.J.; Timmis, K.N.; Azam, F.; Bakken, L.R.; Baylis, M.; Behrenfeld, M.J.; Boetius, A.; Boyd, P.W.; Classen, A.T.; et al. Scientists’ warning to humanity: Microorganisms and climate change. Nat. Rev. Microbiol. 2019, 17, 569–586. [Google Scholar] [CrossRef] [PubMed] [Green Version]
- Coumou, D.; Rahmstorf, S. A decade of weather extremes. Nat. Clim. Chang. 2012, 2, 491–496. [Google Scholar] [CrossRef]
- Zhao, W. Extreme weather and climate events in China under changing climate. Nat. Sci. Rev. 2020, 7, 938–943. [Google Scholar] [CrossRef] [Green Version]
- Cann, K.F.; Thomas, D.R.; Salmon, R.L.; Wyn-Jones, A.P.; Kay, D. Extreme water-related weather events and waterborne disease. Epidemiol. Infect. 2013, 141, 671–686. [Google Scholar] [CrossRef]
- Lee, C.S.; Lee, Y.C.; Chiang, H.M. Abrupt state change of river water quality (turbidity): Effect of extreme rainfalls and typhoons. Sci. Total Environ. 2016, 557, 91–101. [Google Scholar] [CrossRef]
- Ruecker, A.; Uzun, H.; Karanfil, T.; Tsui, M.T.K.; Chow, A.T. Disinfection byproduct precursor dynamics and water treatability during an extreme flooding event in a coastal blackwater river in southeastern United States. Chemosphere 2017, 188, 90–98. [Google Scholar] [CrossRef]
- Landsman, M.R.; Rowles, L.S.; Brodfuehrer, S.H.; Maestre, J.P.; Kinney, K.A.; Kirisits, M.J.; Lawler, D.F.; Katz, L.E. Impacts of Hurricane Harvey on drinking water quality in two Texas cities. Environ. Res. Lett. 2019, 14, 124046. [Google Scholar] [CrossRef] [Green Version]
- Lin, Y.; Sevillano-Rivera, M.; Jiang, T.; Li, G.; Cotto, I.; Vosloo, S.; Carpenter, C.M.G.; Larese-Casanova, P.; Giese, R.W.; Helbling, D.E.; et al. Impact of Hurricane Maria on drinking water quality in Puerto Rico. Environ. Sci. Technol. 2020, 54, 9495–9509. [Google Scholar] [CrossRef]
- Han, Z.; An, W.; Yang, M.; Zhang, Y. Assessing the impact of source water on tap water bacterial communities in 46 drinking water supply systems in China. Water Res. 2020, 172, 115469. [Google Scholar] [CrossRef] [PubMed]
- Li, C.; Ling, F.; Zhang, M.; Liu, W.T.; Li, Y.; Liu, W. Characterization of bacterial community dynamics in a full-scale drinking water treatment plant. J. Environ. Sci. 2017, 51, 21–30. [Google Scholar] [CrossRef]
- Pinto, A.J.; Xi, C.; Raskin, L. Bacterial community structure in the drinking water microbiome is governed by filtration processes. Environ. Sci. Technol. 2012, 46, 8851–8859. [Google Scholar] [CrossRef] [PubMed]
- Kantor, R.S.; Miller, S.E.; Nelson, K.L. The water microbiome through a pilot scale advanced treatment facility for direct potable reuse. Front. Microbiol. 2019, 10, 993. [Google Scholar] [CrossRef] [Green Version]
- Proctor, C.R.; Hammes, F. Drinking water microbiology—From measurement to management. Curr. Opin. Biotechnol. 2015, 33, 87–94. [Google Scholar] [CrossRef]
- Lu, J.; Struewing, I.; Vereen, E.; Kirby, A.E.; Levy, K.; Moe, C.; Ashbolt, N. Molecular Detection of Legionella spp., their associations with Mycobacterium spp., Pseudomonas aeruginosa and amoeba hosts in a drinking water distribution system. J. Appl. Microbiol. 2016, 120, 509–521. [Google Scholar] [CrossRef]
- Li, Q.; Yu, S.; Yang, S.; Yang, W.; Que, S.; Li, W.; Qin, Y.; Yu, W.; Jiang, H.; Zhao, D. Eukaryotic community diversity and pathogenic eukaryotes in a full-scale drinking water treatment plant determined by 18S rRNA and metagenomic sequencing. Environ. Sci. Pollut. Res. 2021, 28, 17417–17430. [Google Scholar] [CrossRef]
- Ma, X.; Vikram, A.; Casson, L.; Bibby, K. Centralized drinking water treatment operations shape bacterial and Fungal community structure. Environ. Sci. Technol. 2017, 51, 7648–7657. [Google Scholar] [CrossRef]
- Hou, L.; Zhou, Q.; Wu, Q.; Gu, Q.; Sun, M.; Zhang, J. Spatiotemporal changes in bacterial community and microbial activity in a full-scale drinking water treatment plant. Sci. Total Environ. 2018, 625, 449–459. [Google Scholar] [CrossRef]
- Tiwari, A.; Hokajarvi, A.M.; Santo Domingo, J.; Elk, M.; Jayaprakash, B.; Ryu, H.; Siponen, S.; Vepsalainen, A.; Kauppinen, A.; Puurunen, O.; et al. Bacterial diversity and predicted enzymatic function in a multipurpose surface water system—From wastewater effluent discharges to drinking water production. Environ. Microbiome 2021, 16, 11. [Google Scholar] [CrossRef]
- Wang, H.; Xu, J.; Tang, W.; Li, H.; Xia, S.; Zhao, J.; Zhang, W.; Yang, Y. Removal efficacy of opportunistic pathogens and bacterial community dynamics in two drinking water treatment trains. Small 2019, 15, e1804436. [Google Scholar] [CrossRef]
- Tang, W.; Mao, Y.; Li, Q.; Meng, D.; Chen, L.; Wang, H.; Zhu, R.; Zhang, W.X. Prevalence of opportunistic pathogens and diversity of microbial communities in the water system of a pulmonary hospital. Biomed. Environ. Sci. 2020, 33, 248–259. [Google Scholar] [CrossRef] [PubMed]
- Wang, H.; Edwards, M.; Falkinham, J.O.; Pruden, A. Molecular survey of the occurrence of Legionella spp., Mycobacterium spp., Pseudomonas aeruginosa, and amoeba hosts in two chloraminated drinking water distribution systems. Appl. Environ. Microbiol. 2012, 78, 6285–6294. [Google Scholar] [CrossRef] [PubMed] [Green Version]
- Bolger, A.M.; Lohse, M.; Usadel, B. Trimmomatic: A flexible trimmer for Illumina sequence data. Bioinformatics 2014, 30, 2114–2120. [Google Scholar] [CrossRef] [PubMed] [Green Version]
- Magoc, T.; Salzberg, S.L. FLASH: Fast length adjustment of short reads to improve genome assemblies. Bioinformatics 2011, 27, 2957–2963. [Google Scholar] [CrossRef] [PubMed]
- Edgar, R.C.; Haas, B.J.; Clemente, J.C.; Quince, C.; Knight, R. UCHIME improves sensitivity and speed of chimera detection. Bioinformatics 2011, 27, 2194–2200. [Google Scholar] [CrossRef] [PubMed] [Green Version]
- Edgar, R.C. UPARSE: Highly accurate OTU sequences from microbial amplicon reads. Nat. Methods 2013, 10, 996–998. [Google Scholar] [CrossRef]
- Quast, C.; Pruesse, E.; Yilmaz, P.; Gerken, J.; Schweer, T.; Yarza, P.; Peplies, J.; Gloeckner, F.O. The SILVA ribosomal RNA gene database project: Improved data processing and web-based tools. Nucleic Acids Res. 2013, 41, D590–D596. [Google Scholar] [CrossRef]
- Wang, Q.; Garrity, G.M.; Tiedje, J.M.; Cole, J.R. Naive Bayesian classifier for rapid assignment of rRNA sequences into the new bacterial taxonomy. Appl. Environ. Microbiol. 2007, 73, 5261–5267. [Google Scholar] [CrossRef] [Green Version]
- Kozich, J.J.; Westcott, S.L.; Baxter, N.T.; Highlander, S.K.; Schloss, P.D. Development of a dual-index sequencing strategy and curation pipeline for analyzing amplicon sequence data on the MiSeq illumina sequencing platform. Appl. Environ. Microbiol. 2013, 79, 5112–5120. [Google Scholar] [CrossRef] [Green Version]
- Warton, D.I.; Wright, S.T.; Wang, Y. Distance-based multivariate analyses confound location and dispersion effects. Methods Ecol. Evol. 2012, 3, 89–101. [Google Scholar] [CrossRef]
- Dixon, P. VEGAN, a package of R functions for community ecology. J. Veg. Sci. 2003, 14, 927–930. [Google Scholar] [CrossRef]
- Sneath, P.H.A.; Sokal, R.R. Numerical Taxonomy: The Principles and Practice of Numerical Classification; Taylor & Francis, Ltd.: Oxfordshire, UK, 1975. [Google Scholar]
- Knights, D.; Kuczynski, J.; Charlson, E.S.; Zaneveld, J.; Mozer, M.C.; Collman, R.G.; Bushman, F.D.; Knight, R.; Kelley, S.T. Bayesian community-wide culture-independent microbial source tracking. Nat. Methods 2011, 8, 761–763. [Google Scholar] [CrossRef] [PubMed] [Green Version]
- Henry, R.; Schang, C.; Coutts, S.; Kolotelo, P.; Prosser, T.; Crosbie, N.; Grant, T.; Cottam, D.; O’Brien, P.; Deletic, A.; et al. Into the deep: Evaluation of SourceTracker for assessment of faecal contamination of coastal waters. Water Res. 2016, 93, 242–253. [Google Scholar] [CrossRef]
- Staley, C.; Kaiser, T.; Lobos, A.; Ahmed, W.; Harwood, V.J.; Brown, C.M.; Sadowsky, M.J. Application of SourceTracker for accurate identification of fecal pollution in recreational freshwater: A double-blinded study. Environ. Sci. Technol. 2018, 52, 4207–4217. [Google Scholar] [CrossRef] [PubMed]
- Xie, Y.; Wang, J.; Wu, Y.; Ren, C.; Song, C.; Yang, J.; Yu, H.; Giesy, J.P.; Zhang, X. Using in situ bacterial communities to monitor contaminants in river sediments. Environ. Pollut. 2016, 212, 348–357. [Google Scholar] [CrossRef]
- Ji, W.T.; Hsu, B.M.; Chang, T.Y.; Hsu, T.K.; Kao, P.M.; Huang, K.H.; Tsai, S.F.; Huang, Y.L.; Fan, C.W. Surveillance and evaluation of the infection risk of free-living amoebae and Legionella in different aquatic environments. Sci. Total Environ. 2014, 499, 212–219. [Google Scholar] [CrossRef]
- Richardson, H.; Rhodes, G.; Henrys, P.; Sedda, L.; Weightman, A.J.; Pickup, R.W. Presence of Mycobacterium avium subspecies paratuberculosis monitored over varying temporal and spatial scales in river catchments: Persistent routes for human exposure. Microorganisms 2019, 7, 136. [Google Scholar] [CrossRef] [Green Version]
- Qin, T.; Ren, H.; Chen, D.; Zhou, H.; Jiang, L.; Wu, D.; Shen, J.; Pei, F. National surveillance of legionnaires’ disease, China, 2014–2016. Emerg. Infect. Dis. 2019, 25, 1218–1219. [Google Scholar] [CrossRef]
- Yi, H.; Fang, J.; Huang, J.; Liu, B.; Qu, J.; Zhou, M. Legionella pneumophila as cause of severe community-acquired pneumonia, China. Emerg. Infect. Dis. 2020, 26, 160–162. [Google Scholar] [CrossRef]
- Dong, P.; Cui, Q.; Fang, T.; Huang, Y.; Wang, H. Occurrence of antibiotic resistance genes and bacterial pathogens in water and sediment in urban recreational water. J. Environ. Sci. 2019, 77, 65–74. [Google Scholar] [CrossRef] [PubMed]
- Tung, M.C.; Chang, T.Y.; Hsu, B.M.; Shen, S.M.; Huang, J.T.; Kao, P.M.; Chiu, Y.C.; Fan, C.W.; Huang, Y.L. Seasonal distribution of Legionella spp., L. pneumophila in a river in Taiwan evaluated with culture-confirmed and direct DNA extraction methods. J. Hydrol. 2013, 496, 100–106. [Google Scholar] [CrossRef]
- Francy, D.S.; Brady, A.M.G.; Cicale, J.R.; Dalby, H.D.; Stelzer, E.A. Nowcasting methods for determining microbiological water quality at recreational beaches and drinking-water source waters. J. Microbiol. Meth. 2020, 175, 105970. [Google Scholar] [CrossRef] [PubMed]
- Hrudey, S.E. Chlorination disinfection by-products, public health risk tradeoffs and me. Water Res. 2009, 43, 2057–2092. [Google Scholar] [CrossRef] [PubMed]
- Ledesma, J.L.J.; Köhler, S.; Futter, M.N. Long-term dynamics of dissolved organic carbon: Implications for drinking water supply. Sci. Total Environ. 2012, 432, 1–11. [Google Scholar] [CrossRef]
- Pinto, A.J.; Schroeder, J.; Lunn, M.; Sloan, W.; Raskin, L. Spatial-temporal survey and occupancy-abundance modeling to predict bacterial community dynamics in the drinking water microbiome. mBio 2014, 5, e01135-14. [Google Scholar] [CrossRef] [Green Version]
- Xu, J.; Tang, W.; Ma, J.; Wang, H. Comparison of microbial community shifts in two parallel multi-step drinking water treatment processes. Appl. Microbiol. Biotechnol. 2017, 101, 5531–5541. [Google Scholar] [CrossRef]
- Fu, Y.; Peng, H.; Liu, J.; Nguyen, T.H.; Hashmi, M.Z.; Shen, C. Occurrence and quantification of culturable and viable but non-culturable (VBNC) pathogens in biofilm on different pipes from a metropolitan drinking water distribution system. Sci. Total Environ. 2020, 764, 142851. [Google Scholar] [CrossRef] [PubMed]
- Le Dantec, C.; Duguet, J.P.; Montiel, A.; Dumoutier, N.; Dubrou, S.; Vincent, V. Chlorine disinfection of atypical mycobacteria isolated from a water distribution system. Appl. Environ. Microbiol. 2002, 68, 1025–1032. [Google Scholar] [CrossRef] [Green Version]
- Yan, D. Application of a high efficiency treating-process in the extension project of Weicun water works. Water Purif. Technol. 2010, 29, 74–78. (In Chinese) [Google Scholar] [CrossRef]
- Jiang, S.C.; Han, M.; Chandrasekaran, S.; Fang, Y.; Kellogg, C.A. Assessing the water quality impacts of two Category-5 hurricanes on St. Thomas, Virgin Islands. Water Res. 2020, 171, 115440. [Google Scholar] [CrossRef] [PubMed]
- Ding, Y.; Liu, J.; Chen, S.; Cheng, X.; Zheng, Z. Uniqueness of Lekima compared to tropical cyclones landed in the east coast of China during 1979–2019. Acta Oceanol. Sin. 2020, 39, 121–124. [Google Scholar] [CrossRef]
- Joh, G.; Lee, J. Cyanobacterial biofilms on sedimentation basins in a water treatment plant in South Korea. J. Appl. Phycol. 2011, 24, 285–293. [Google Scholar] [CrossRef]
- Qin, B.; Zhu, G.; Gao, G.; Zhang, Y.; Li, W.; Paerl, H.W.; Carmichael, W.W. A drinking water crisis in Lake Taihu, China: Linkage to climatic variability and lake management. Environ. Manag. 2010, 45, 105–112. [Google Scholar] [CrossRef]
- Weber, S.J.; Mishra, D.R.; Wilde, S.B.; Kramer, E. Risks for cyanobacterial harmful algal blooms due to land management and climate interactions. Sci. Total Environ. 2020, 703, 134608. [Google Scholar] [CrossRef]
- Falconer, I.R.; Humpage, A.R. Health risk assessment of cyanobacterial (blue-green algal) toxins in drinking water. Int. J. Environ. Res. Public Health 2005, 2, 43–50. [Google Scholar] [CrossRef] [Green Version]
- Liu, C.; Ersan, M.S.; Wagner, E.; Plewa, M.J.; Amy, G.; Karanfil, T. Toxicity of chlorinated algal-impacted waters: Formation of disinfection byproducts vs. reduction of cyanotoxins. Water Res. 2020, 184, 116145. [Google Scholar] [CrossRef]
- Henry, R.; Harris, A.R.; Fidan, E.N.; Nelson, N.G.; Emanuel, R.E.; Jass, T.; Kathariou, S.; Niedermeyer, J.; Sharara, M.; de los Reyes, F.L.; et al. Microbial contamination in environmental waters of rural and agriculturally-dominated landscapes following Hurricane Florence. ACS ES&T Water 2021, 1, 2012–2019. [Google Scholar] [CrossRef]
- Kapoor, V.; Gupta, I.; Pasha, A.B.M.T.; Phan, D. Real-time quantitative PCR measurements of fecal indicator bacteria and human-associated source tracking markers in a Texas river following Hurricane Harvey. Environ. Sci. Technol. Lett. 2018, 5, 322–328. [Google Scholar] [CrossRef]
- Yu, P.; Zaleski, A.; Li, Q.; He, Y.; Mapili, K.; Pruden, A.; Alvarez, P.J.J.; Stadler, L.B. Elevated levels of pathogenic indicator bacteria and antibiotic resistance genes after Hurricane Harvey’s flooding in Houston. Environ. Sci. Technol. Lett. 2018, 5, 481–486. [Google Scholar] [CrossRef]
- Honda, J.R.; Virdi, R.; Chan, E.D. Global environmental nontuberculous mycobacteria and their contemporaneous man-made and natural niches. Front. Microbiol. 2018, 9, 2029. [Google Scholar] [CrossRef] [PubMed] [Green Version]
- Nishiuchi, Y.; Iwamoto, T.; Maruyama, F. Infection sources of a common non-tuberculous mycobacterial pathogen, Mycobacterium avium complex. Front. Med. 2017, 4, 27. [Google Scholar] [CrossRef] [PubMed] [Green Version]
- van Heijnsbergen, E.; de Roda Husman, A.M.; Lodder, W.J.; Bouwknegt, M.; Docters van Leeuwen, A.E.; Bruin, J.P.; Euser, S.M.; den Boer, J.W.; Schalk, J.A.C. Viable Legionella pneumophila bacteria in natural soil and rainwater puddles. J. Appl. Microbiol. 2014, 117, 882–890. [Google Scholar] [CrossRef] [PubMed]
- Carvalho, F.R.; Vazoller, R.F.; Foronda, A.S.; Pellizari, V.H. Phylogenetic study of Legionella species in pristine and polluted aquatic samples from a tropical Atlantic forest ecosystem. Curr. Microbiol. 2007, 55, 288–293. [Google Scholar] [CrossRef] [PubMed]
- Tryland, I.; Robertson, L.; Blankenberg, A.G.B.; Lindholm, M.; Rohrlack, T.; Liltved, H. Impact of rainfall on microbial contamination of surface water. Int. J. Clim. Chang. Strateg. Manag. 2011, 3, 361–373. [Google Scholar] [CrossRef]
- Albers, C.N.; Ellegaard-Jensen, L.; Harder, C.B.; Rosendahl, S.; Knudsen, B.E.; Ekelund, F.; Aamand, J. Groundwater chemistry determines the prokaryotic community structure of waterworks sand filters. Environ. Sci. Technol. 2015, 49, 839–846. [Google Scholar] [CrossRef]
- Tian, R.; Ning, D.; He, Z.; Zhang, P.; Spencer, S.J.; Gao, S.; Shi, W.; Wu, L.; Zhang, Y.; Yang, Y.; et al. Small and mighty: Adaptation of superphylum Patescibacteria to groundwater environment drives their genome simplicity. Microbiome 2020, 8, 51. [Google Scholar] [CrossRef] [PubMed] [Green Version]
- Li, Q.; Yu, S.; Li, L.; Liu, G.; Gu, Z.; Liu, M.; Liu, Z.; Ye, Y.; Xia, Q.; Ren, L. Microbial communities shaped by treatment processes in a drinking water treatment plant and their contribution and threat to drinking water safety. Front. Microbiol. 2017, 8, 2465. [Google Scholar] [CrossRef] [Green Version]
Figure 1.
(a) Relative abundance of dominant taxa at the phylum level and (b) Shannon diversity index based on class identity OTUs in water samples at each treatment step before and after the rainfall event in summer.
Figure 1.
(a) Relative abundance of dominant taxa at the phylum level and (b) Shannon diversity index based on class identity OTUs in water samples at each treatment step before and after the rainfall event in summer.

Figure 2.
Bray–Curtis similarity-based dendrogram showing bacterial community composition in source water (SW), raw water (RW) and finished water (FW) during the five-day super typhoon period. The sampling dates are indicated by colored lines (before, during and after one, two and three days of the typhoon event). For each sample, community composition (phylum level) is indicated by bar plots.

Figure 3.
Target opportunistic pathogens, including (a) Mycobacterium spp. and (b) Legionella spp., in water samples at different water treatment stages and at different sampling time points. RW, HorS, MulS, VF, TGVF, BACF, and DisF were the abbreviations of raw water, horizontal flow sedimentation, Multiflo sedimentation, V-type filtration, TGV filtration, O3-BAC filtration, and disinfection, respectively. The different colors and shapes represent different seasons. The results of summer rainfall sample were removed due to insufficient DNA volume which cannot be used to verify the primary qPCR results.

Figure 4.
(a) Total bacteria and opportunistic pathogens, including (b) Mycobacterium spp., (c) Legionella spp., (d) Mycobacterium avium, and (e) Legionella pneumophila in source water (SW), raw water (RW) and finished water (FW) during the five-day super typhoon period (before, during and after one, two and three days of the typhoon event). The different colors and shapes represent different sampling sites. After1 SW sample is missing due to miscommunication during sampling.

Figure 5.
(a) Relative abundance of dominant taxa at the phylum level in BAC influents (BACin) and effluents (BACef) and biofilm samples from the top (B1), middle (B2) and bottom (B3) of the reactor. The data were visualized using the circlize package with R. The upper half circle represents every sample composition at phylum level, and the lower half circle indicates the proportion of a particular taxon in different samples. (b) Non-metric multidimensional scaling (NMDS) plot of BAC influents, effluents and biofilm samples based on Bray–Curtis distance. Symbol color represents different samples. (c) Results of SourceTracker analysis showing the contribution of BAC influents and different depth of biofilm samples to BAC effluents.

Publisher’s Note: MDPI stays neutral with regard to jurisdictional claims in published maps and institutional affiliations. |
© 2021 by the authors. Licensee MDPI, Basel, Switzerland. This article is an open access article distributed under the terms and conditions of the Creative Commons Attribution (CC BY) license (https://creativecommons.org/licenses/by/4.0/).
Share and Cite
MDPI and ACS Style
Tang, W.; Liu, Y.; Li, Q.; Chen, L.; Li, Q.; Li, P.; Xia, S. The Impact of Extreme Weather Events on Bacterial Communities and Opportunistic Pathogens in a Drinking Water Treatment Plant. Water 2022, 14, 54. https://doi.org/10.3390/w14010054
AMA Style
Tang W, Liu Y, Li Q, Chen L, Li Q, Li P, Xia S. The Impact of Extreme Weather Events on Bacterial Communities and Opportunistic Pathogens in a Drinking Water Treatment Plant. Water. 2022; 14(1):54. https://doi.org/10.3390/w14010054
Chicago/Turabian StyleTang, Wei, Yunsi Liu, Qiuyan Li, Ling Chen, Qi Li, Pan Li, and Shengji Xia. 2022. "The Impact of Extreme Weather Events on Bacterial Communities and Opportunistic Pathogens in a Drinking Water Treatment Plant" Water 14, no. 1: 54. https://doi.org/10.3390/w14010054
Note that from the first issue of 2016, this journal uses article numbers instead of page numbers. See further details here.