
Influence of Multi-Layered Structure of Vadose Zone on Ecological Effect of Groundwater in Arid Area: A Case Study of Shiyang River Basin, Northwest China

Abstract
:1. Introduction
2. Materials and Methods
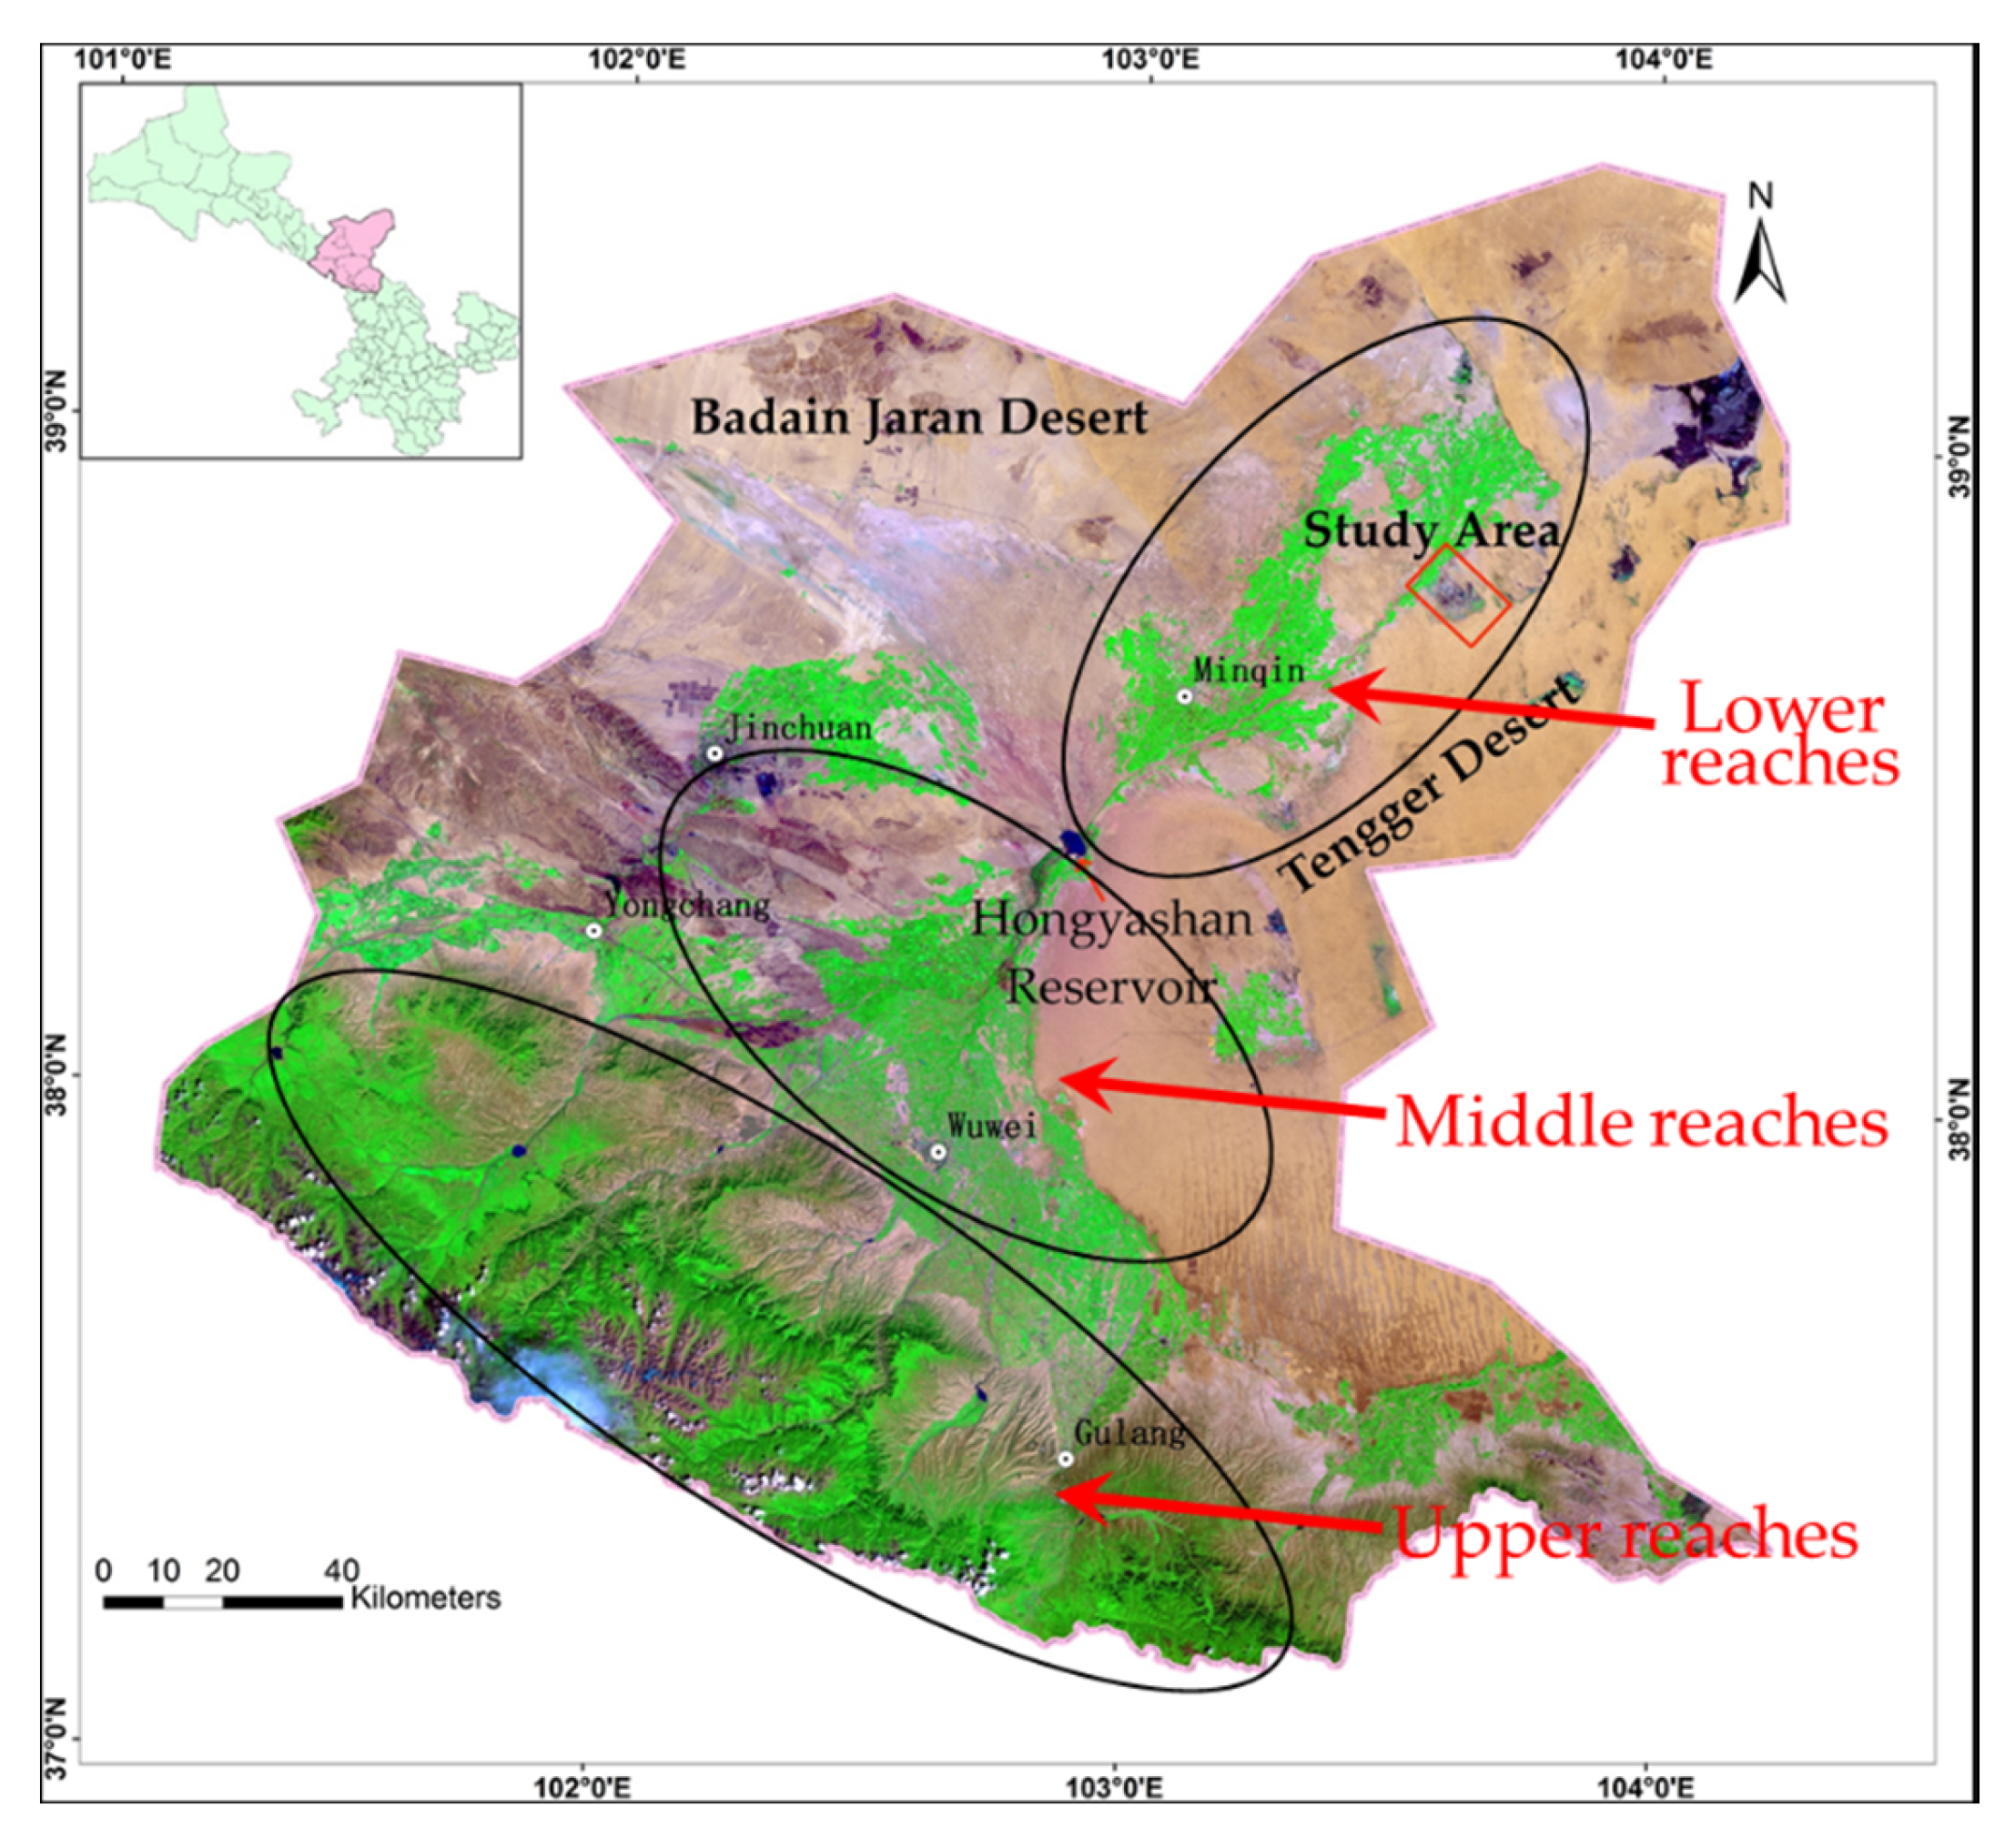
2.1. Study Area
2.2. Materials and Methods
2.2.1. Field Survey
2.2.2. Soil-Column Tests
- (1)
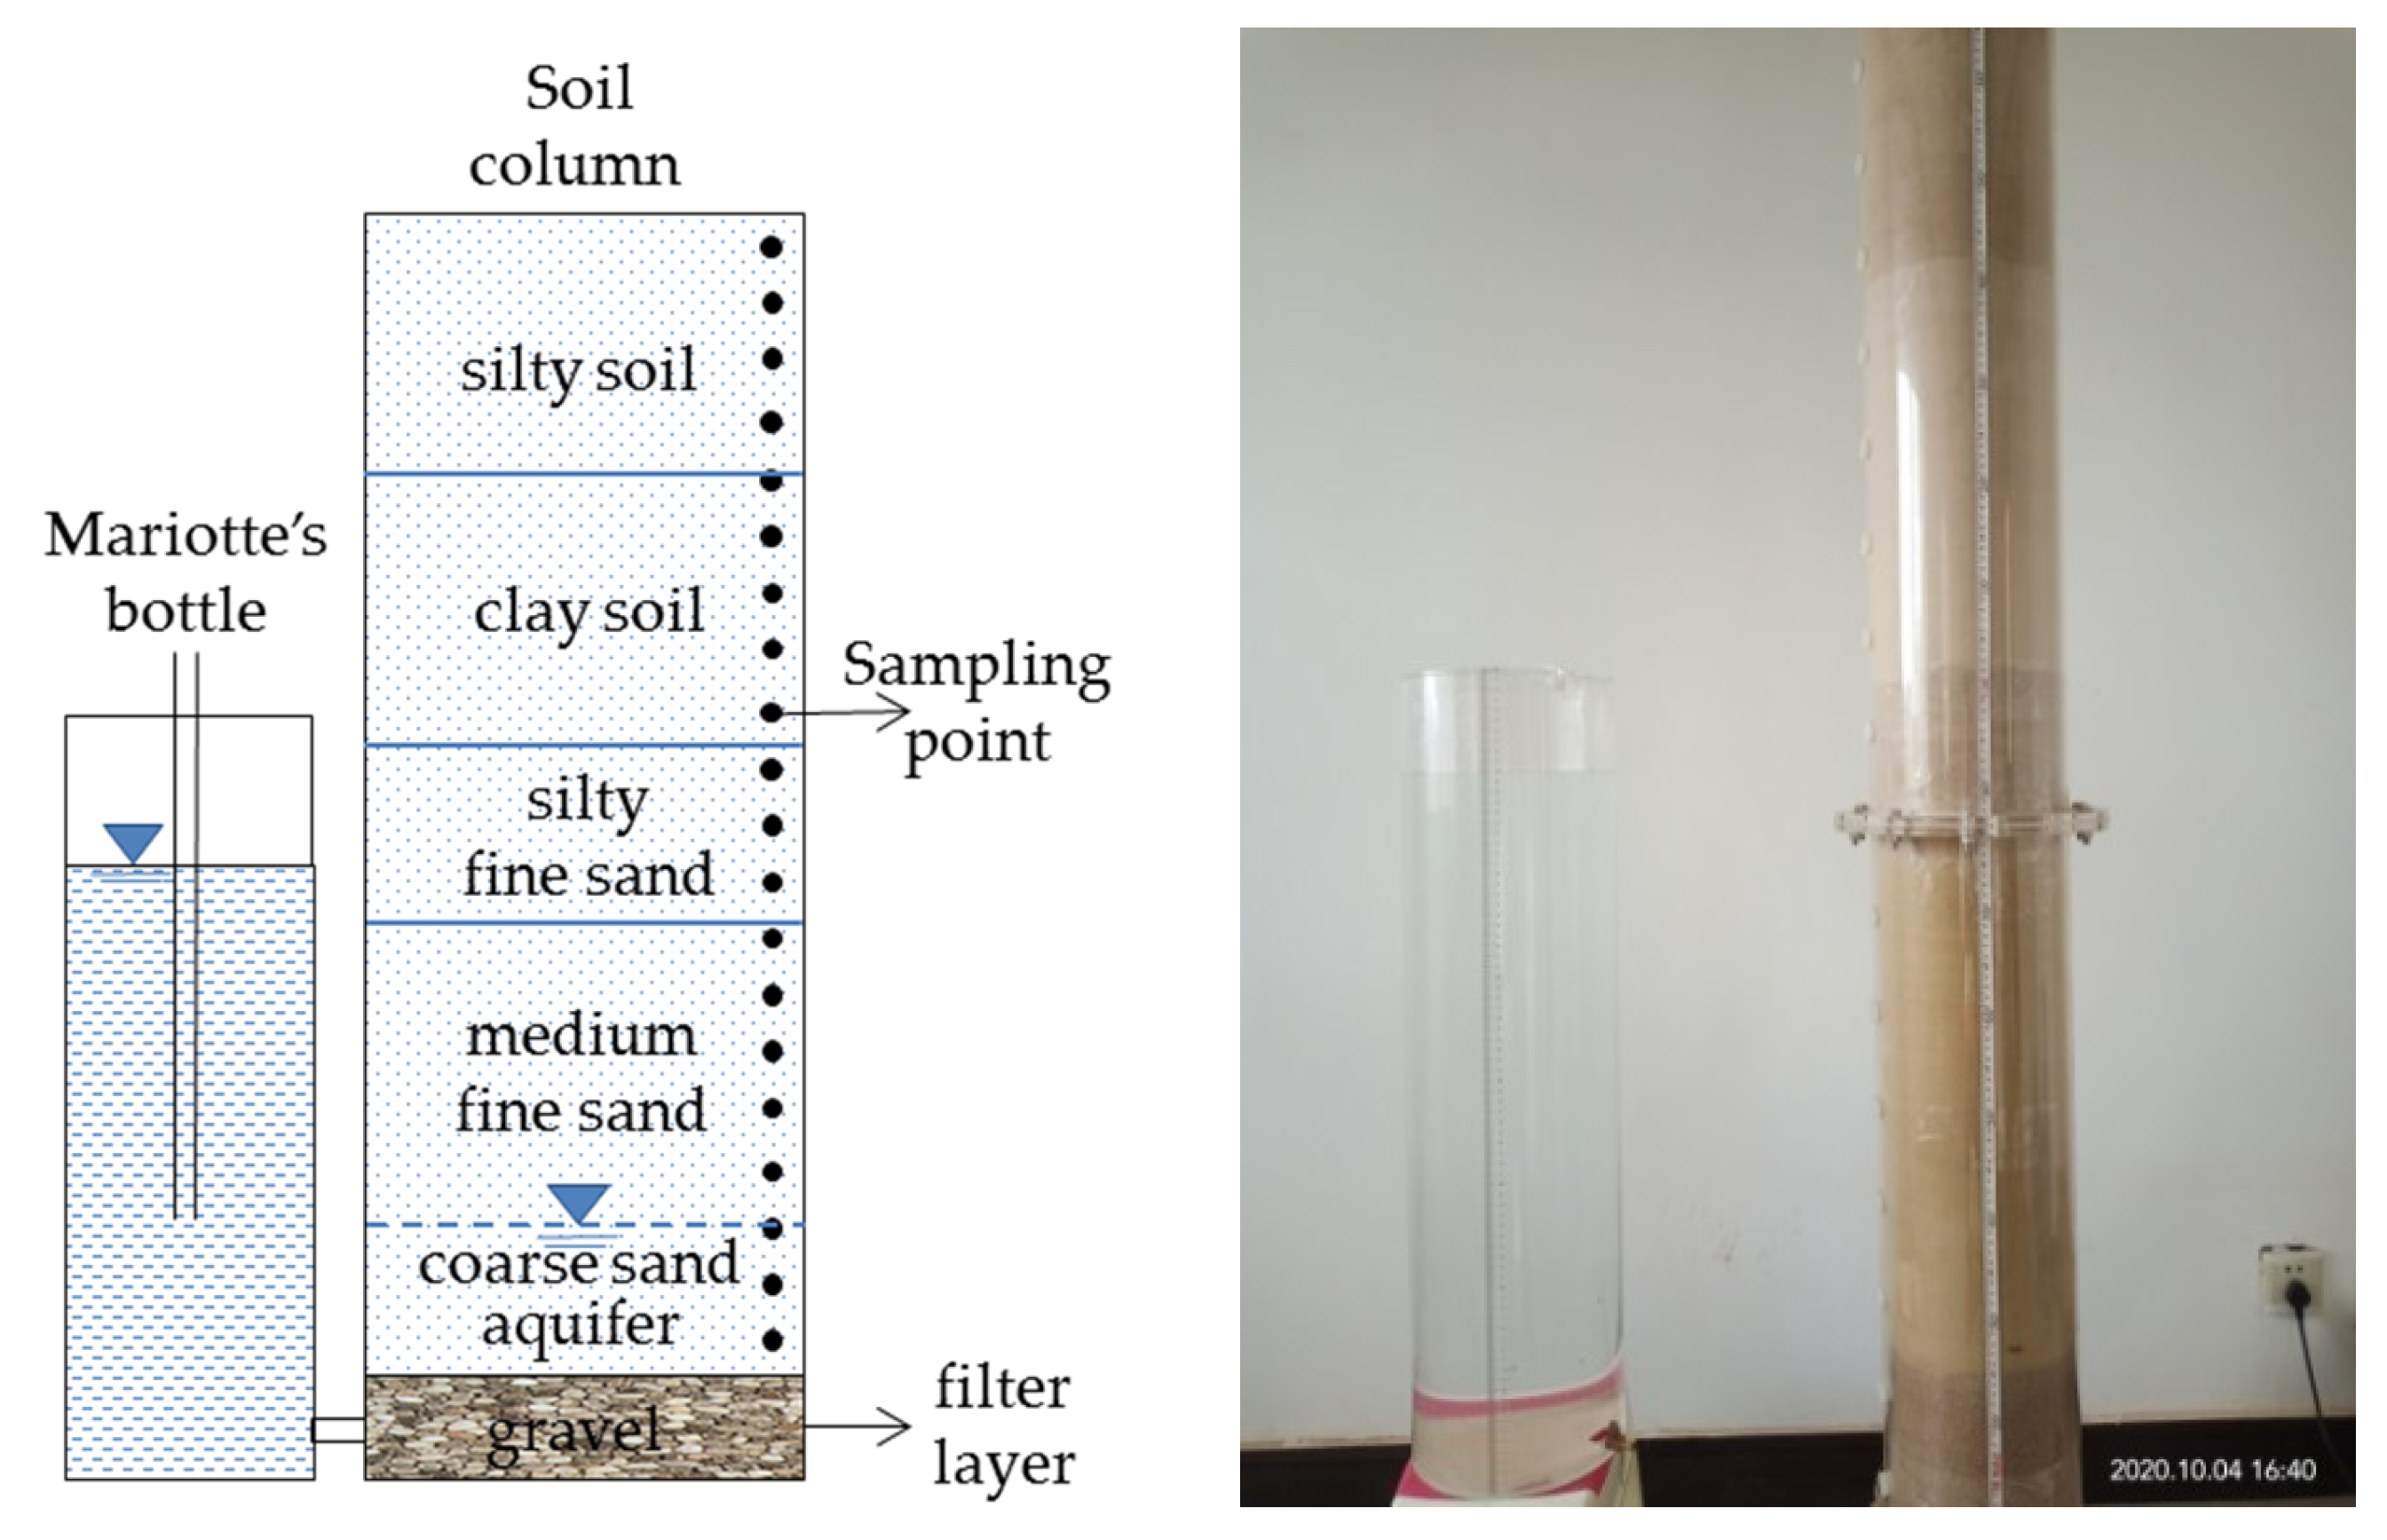
- Instrument of Soil-Column Tests
- (2)
- Capillary Water Rising Test of the Multi-layered Structure of Vadose Zone
- (3)
- Water-Releasing Test of the Multi-layered Structure of Vadose Zone
2.2.3. Methods
- (1)
- Drying Method [34]
- (2)
- Dry Bulk Density [34]
- (3)
- Data Calibration
3. Results
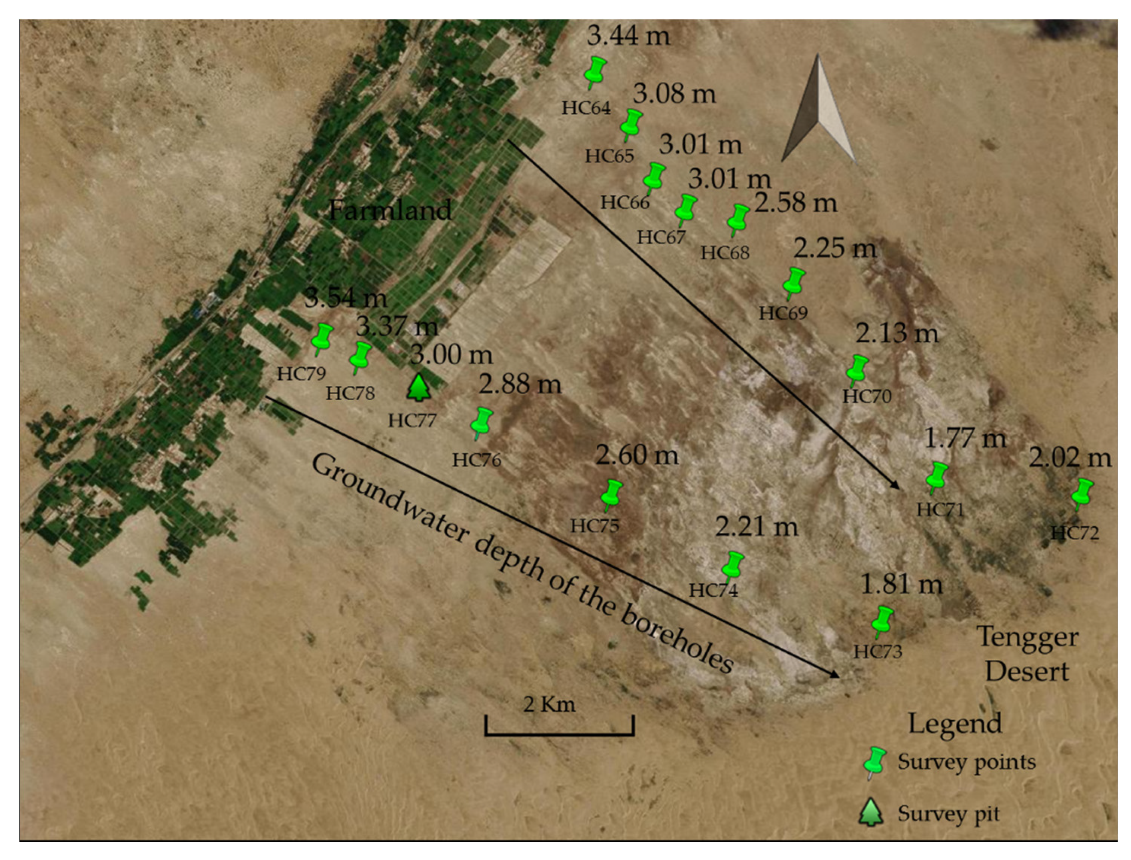
3.1. Results of the Field Survey Soil Sample Analysis and Groundwater Depths
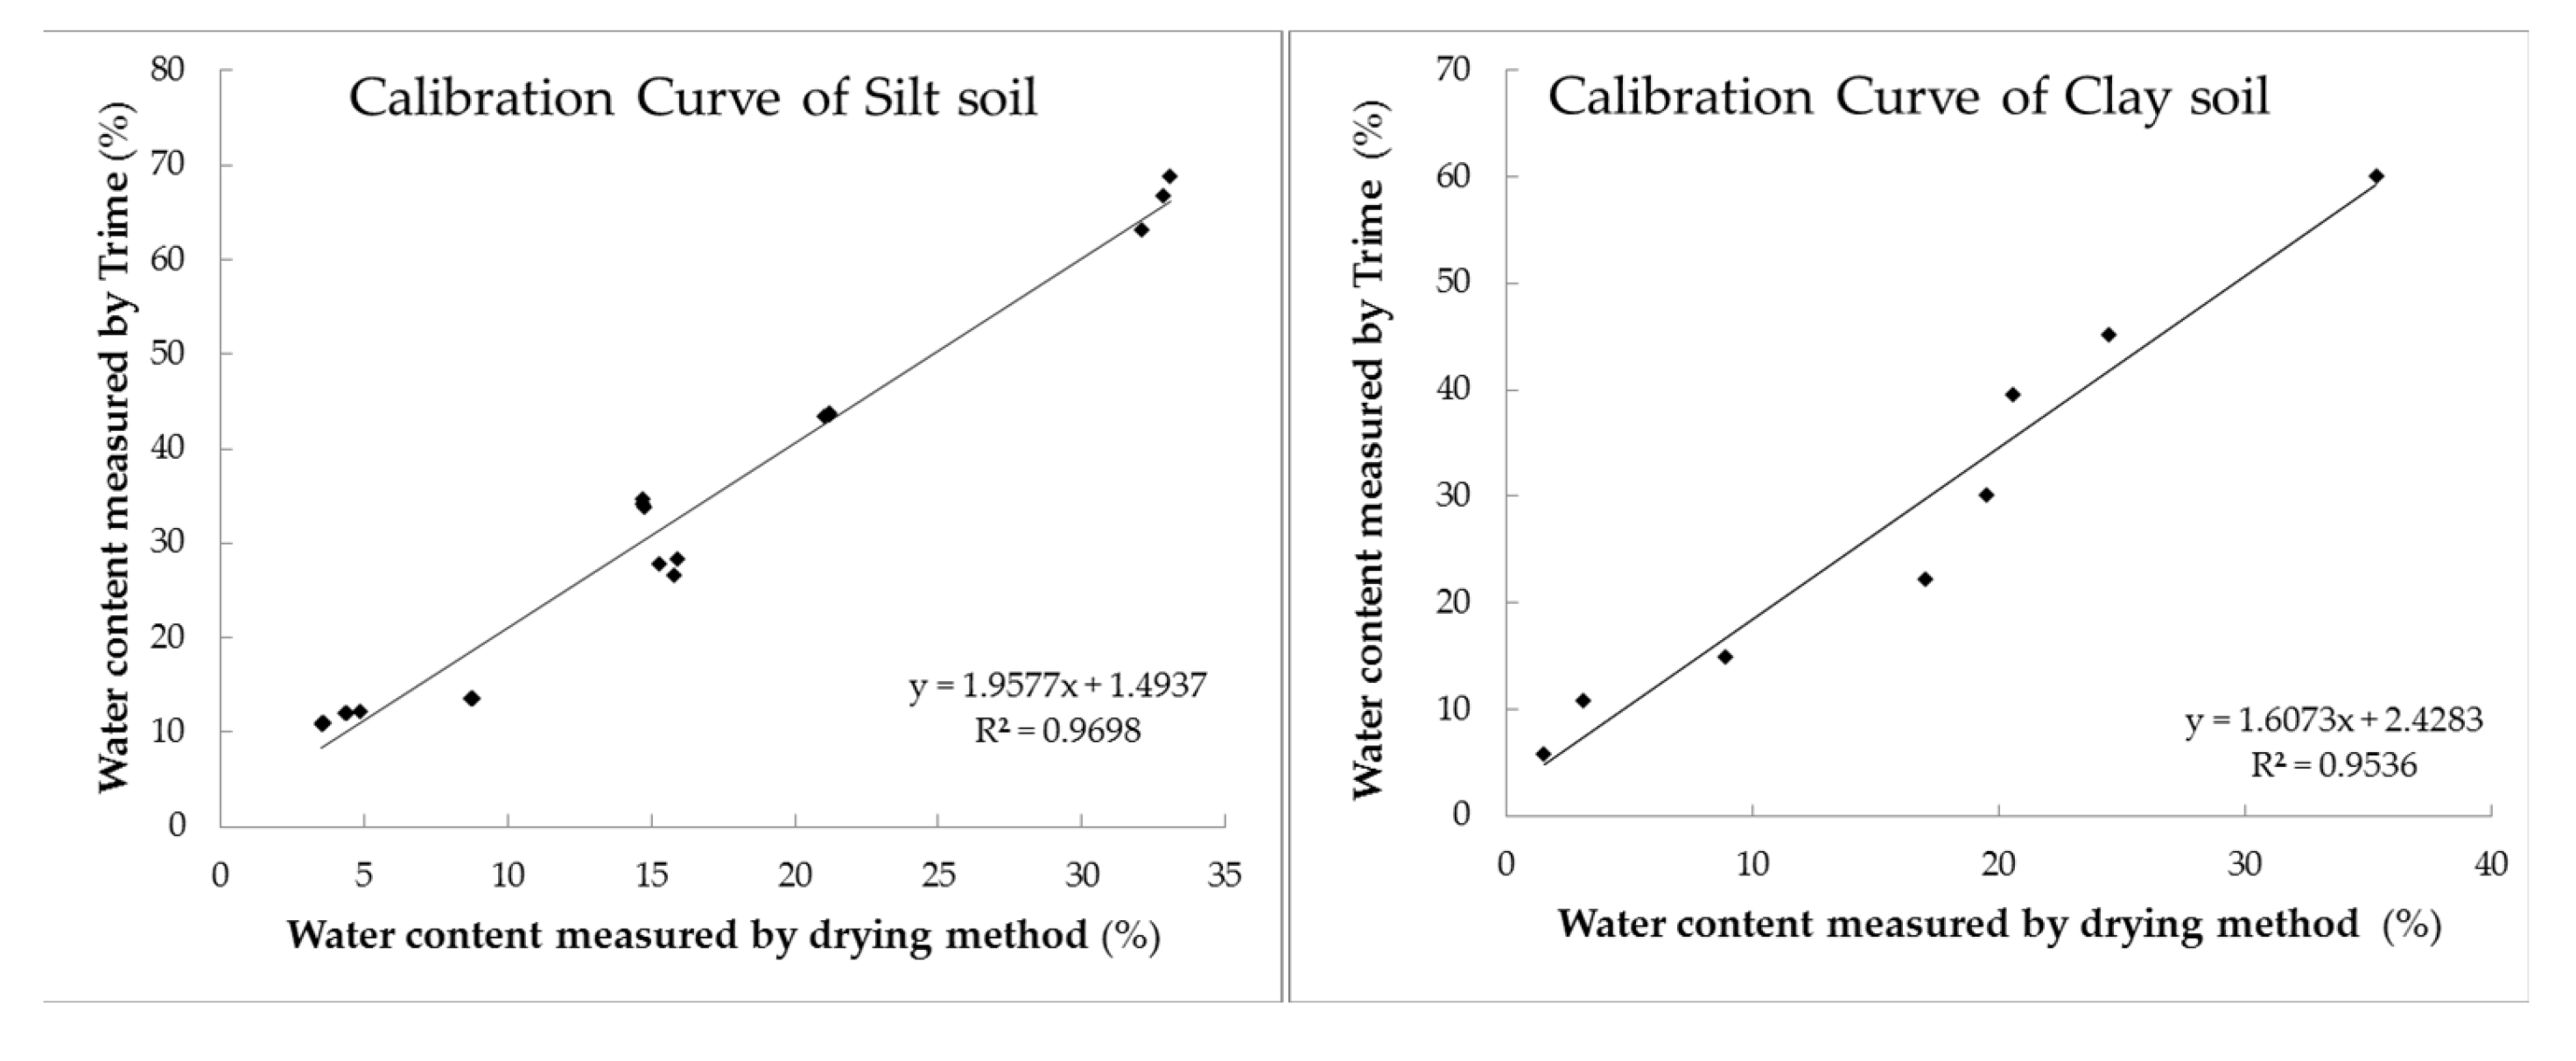
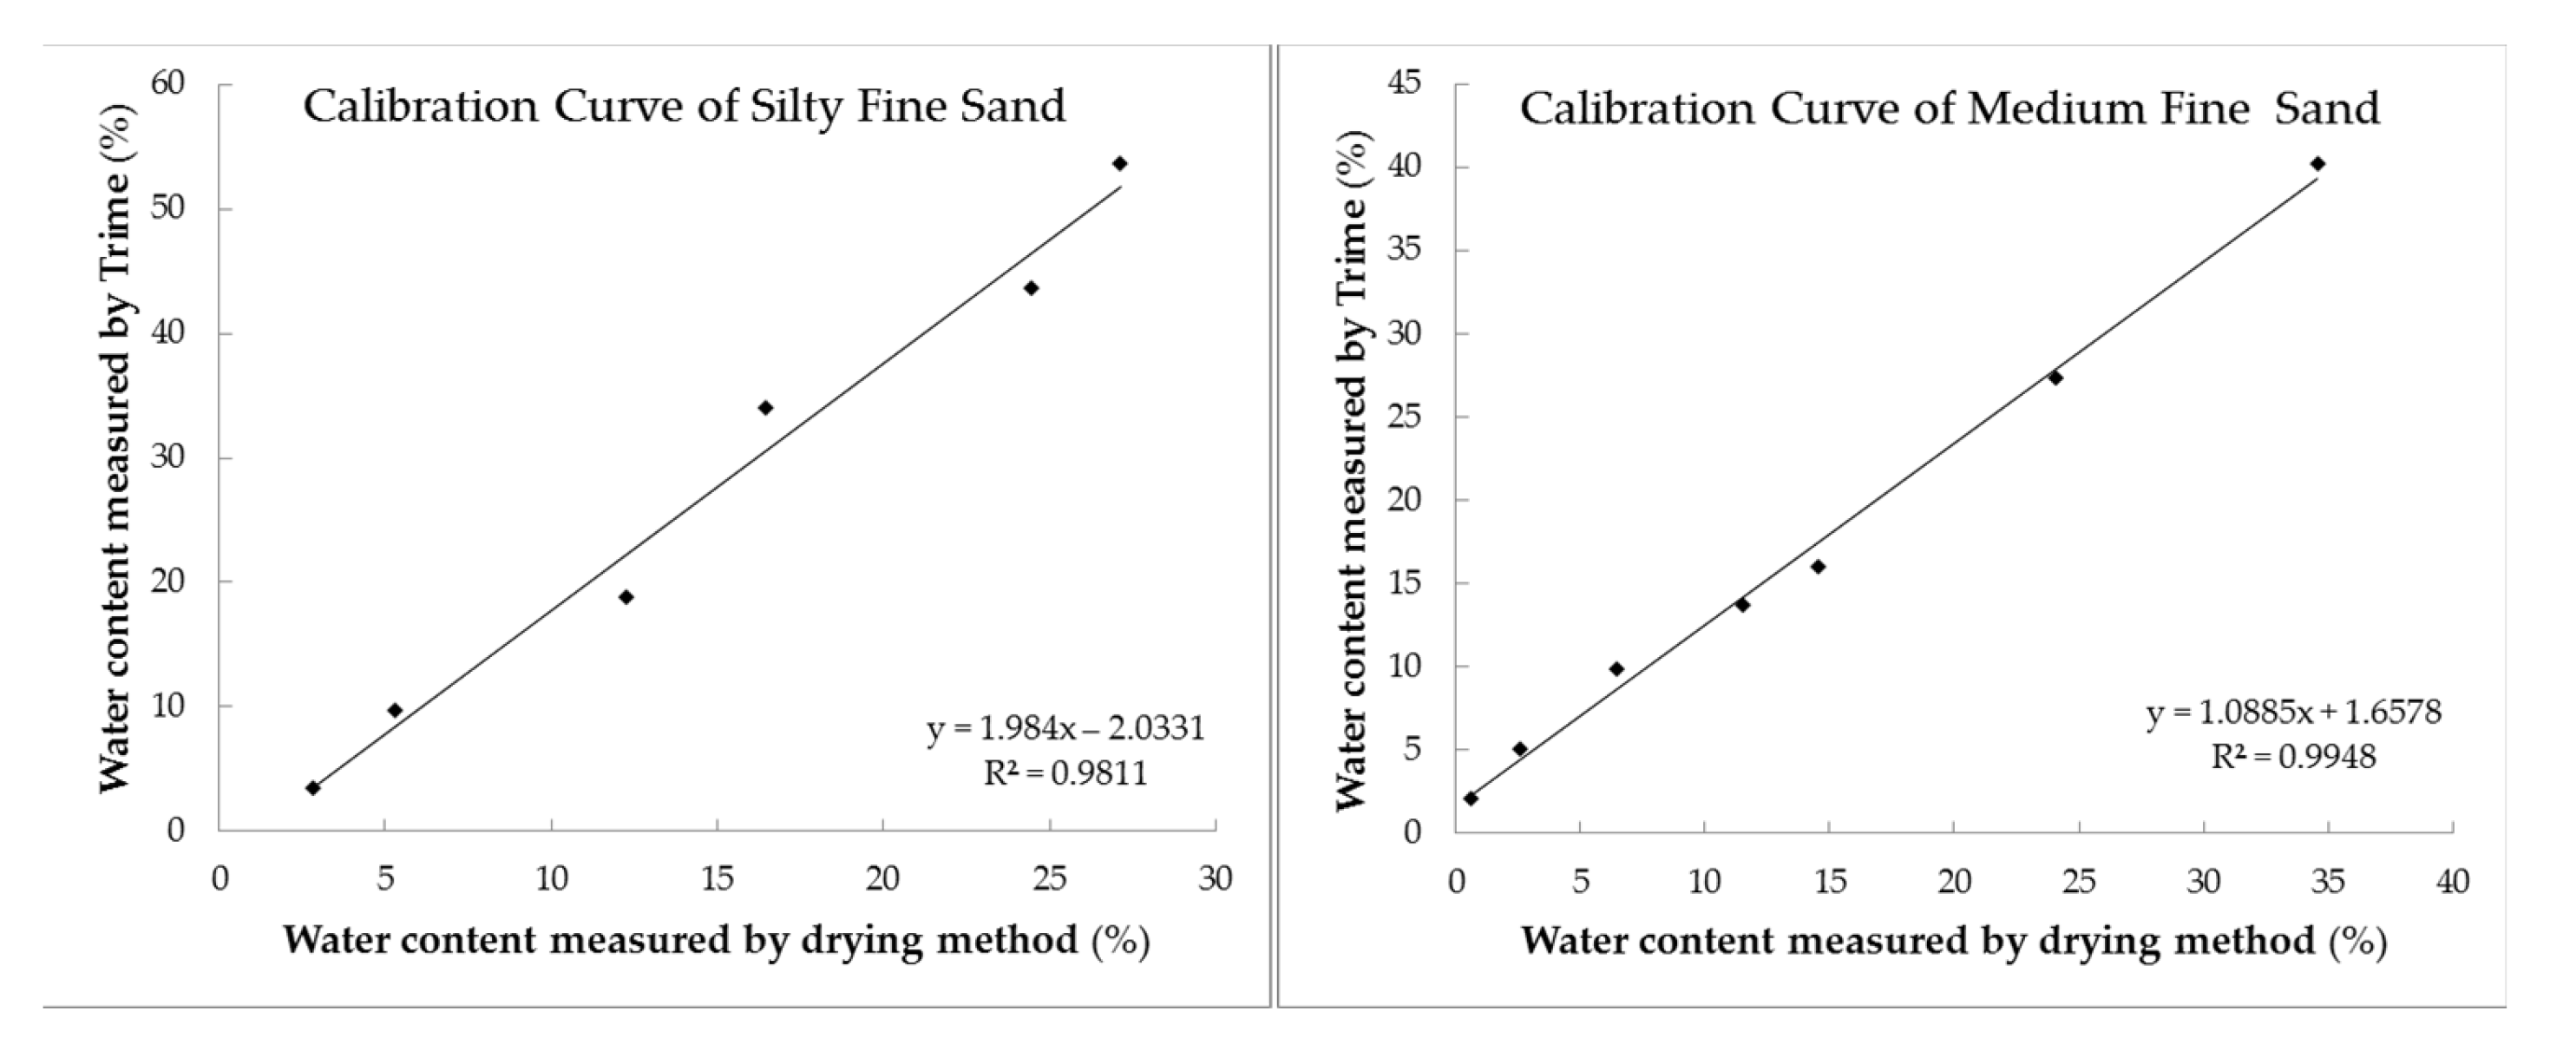
3.2. Calibration Results
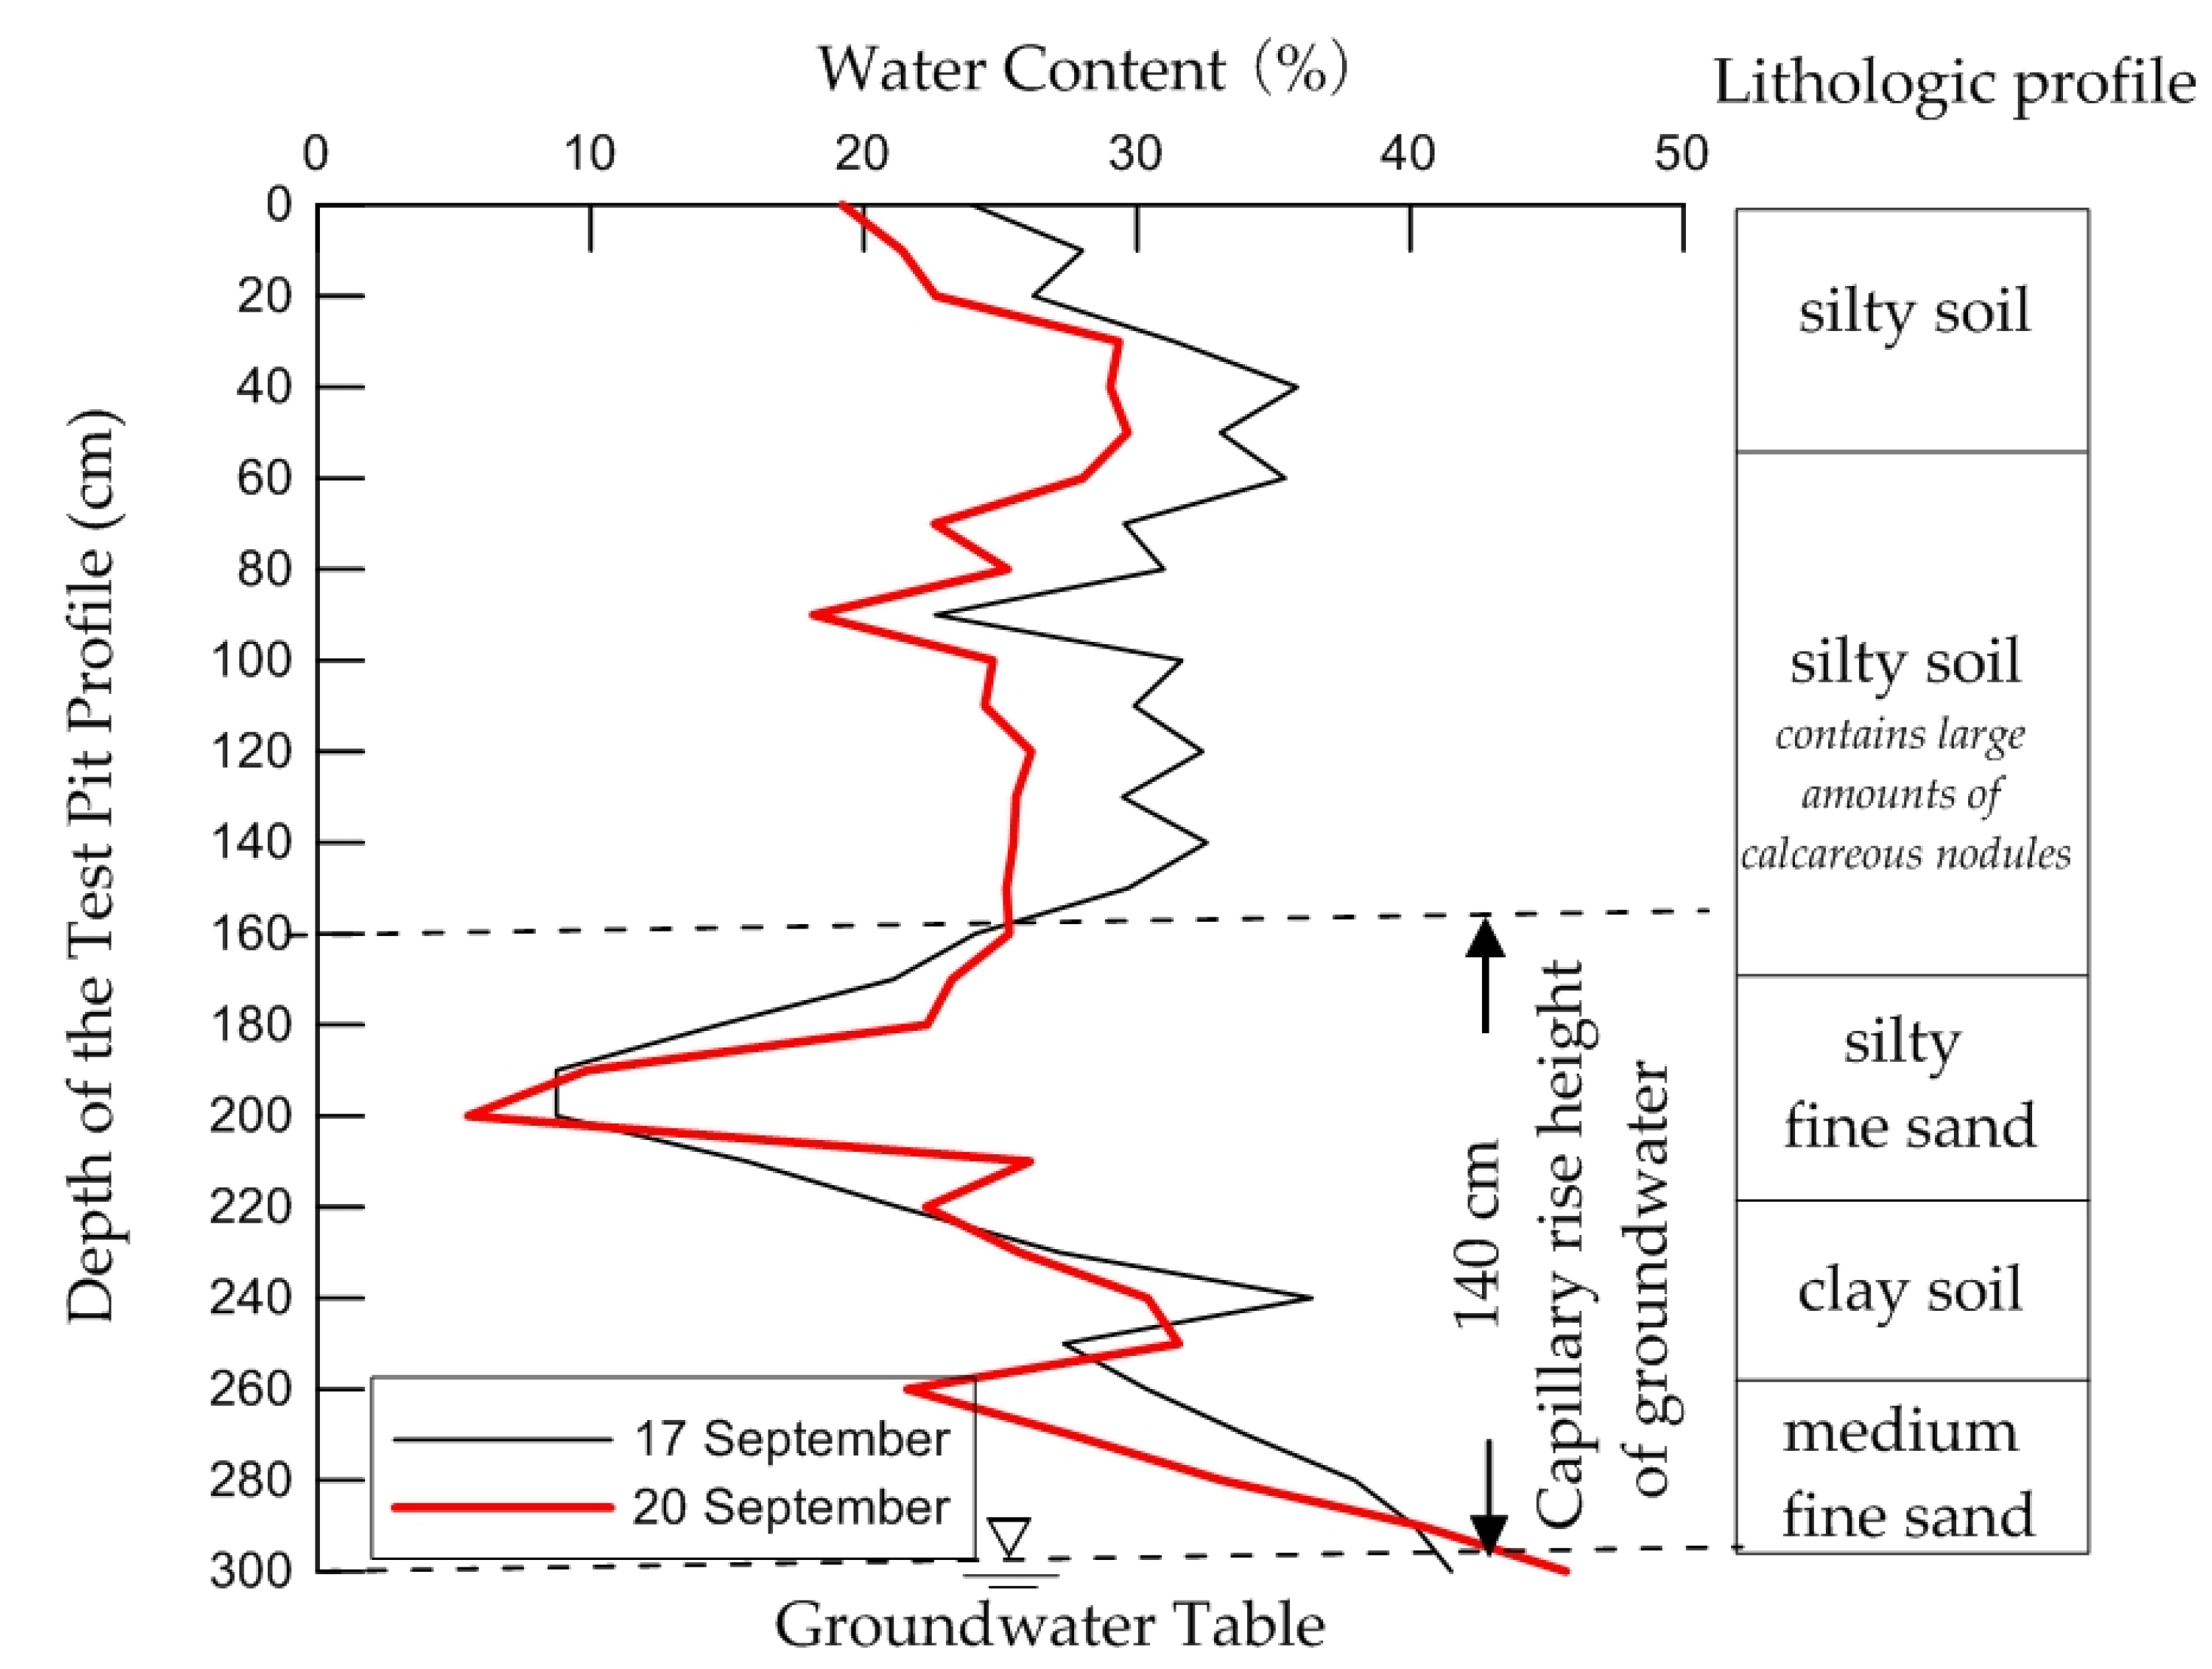
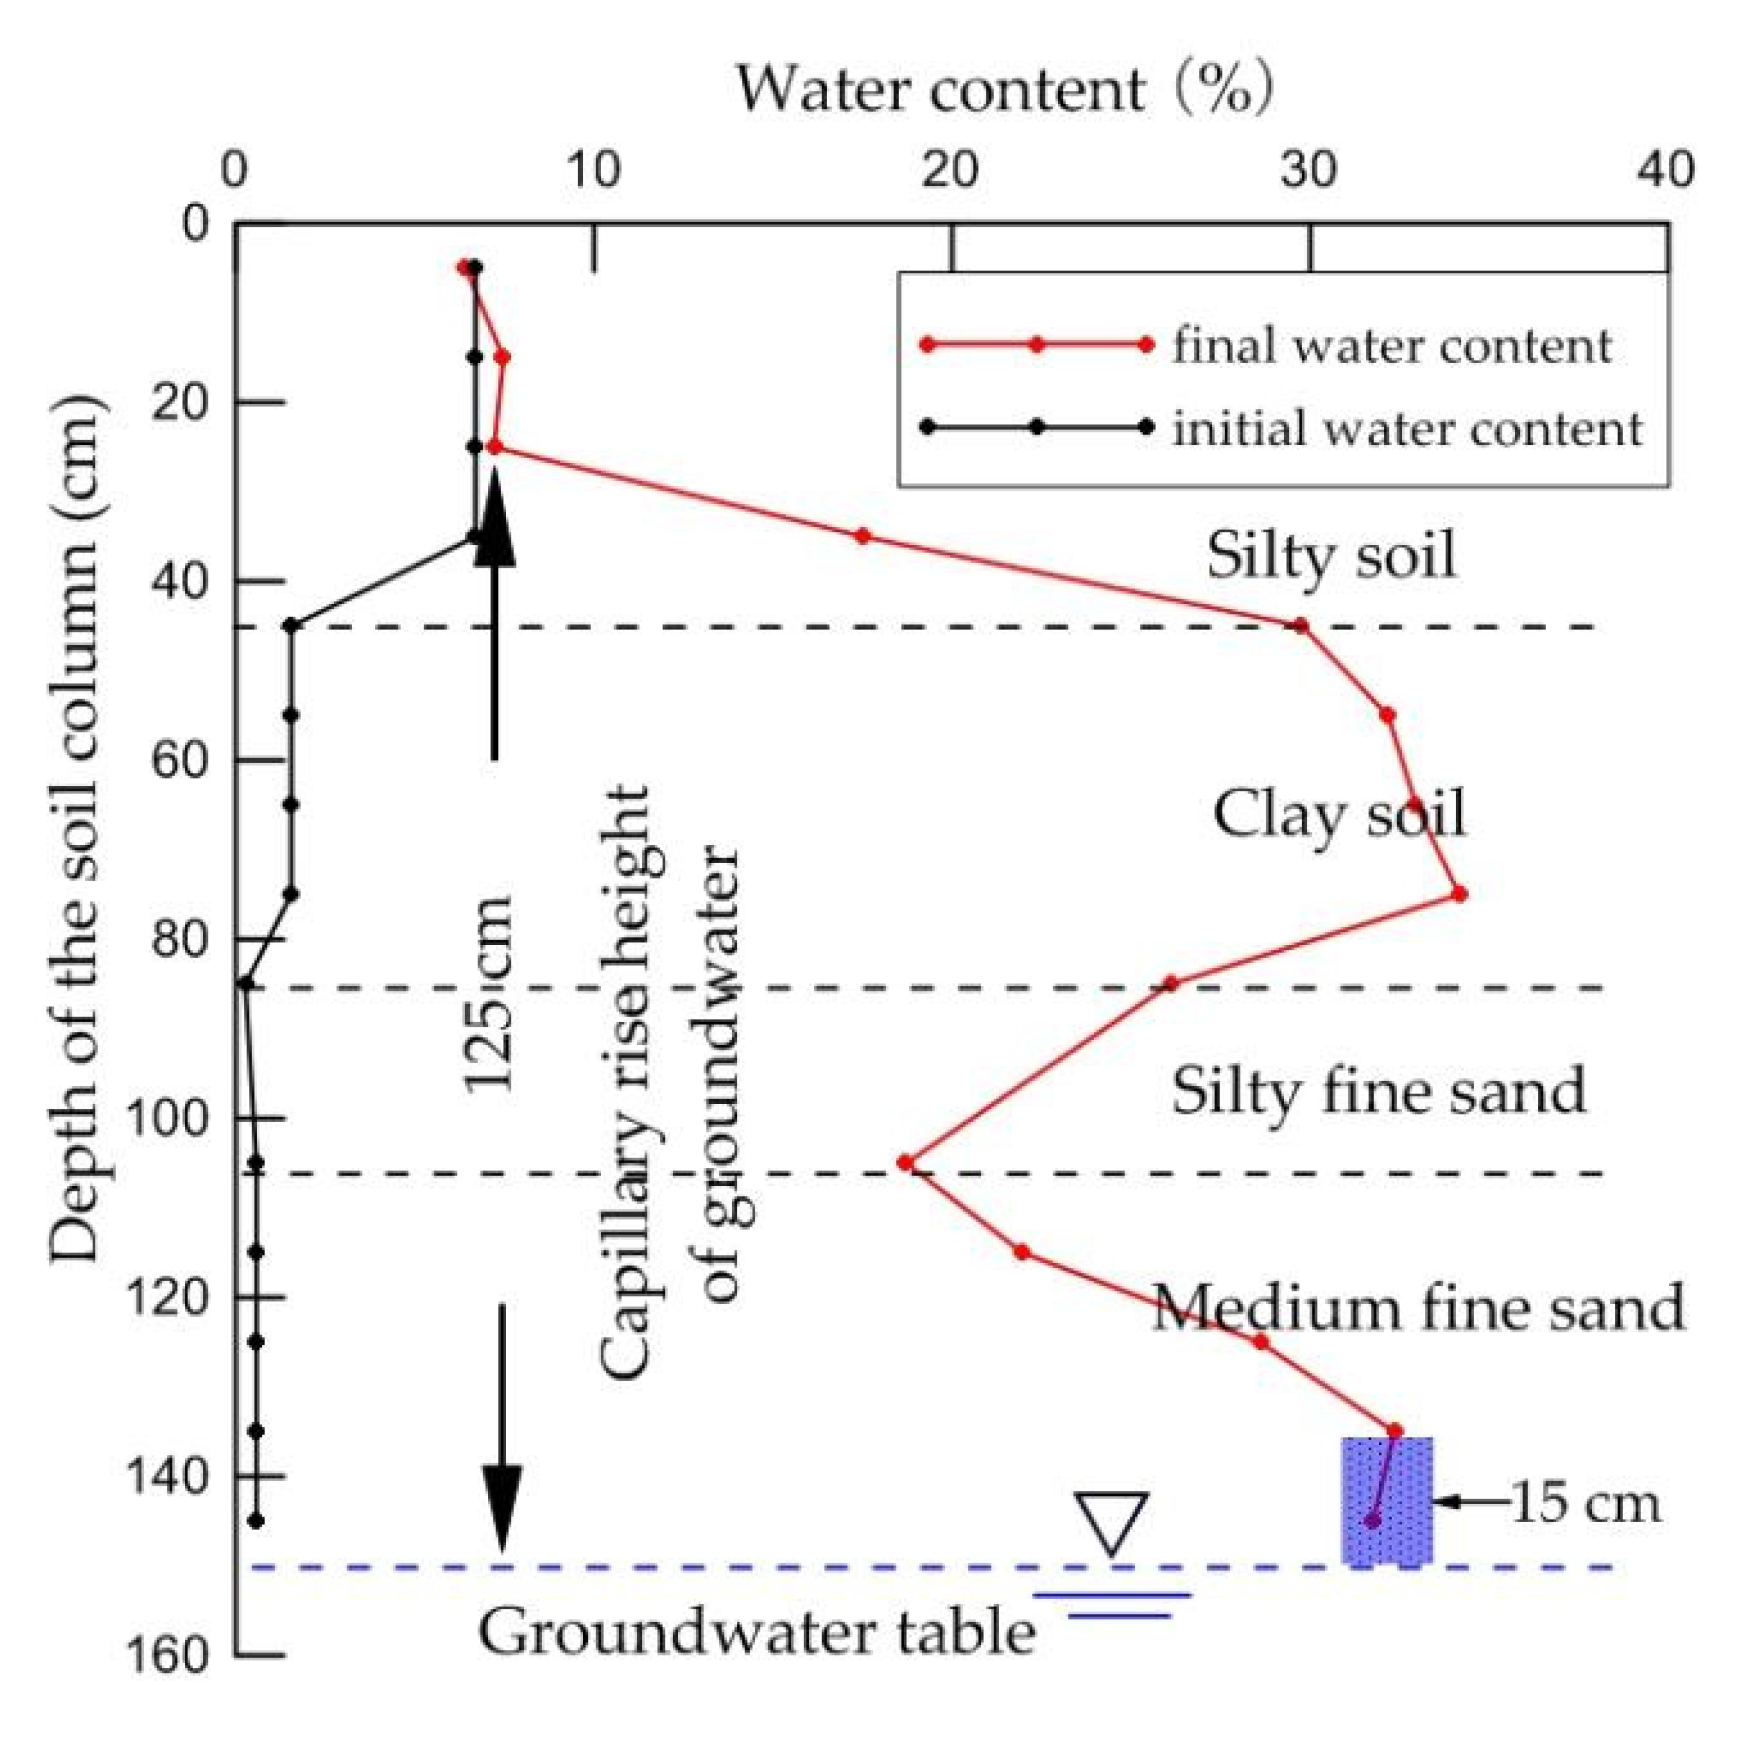
3.3. Capillary Water Rising Height of Typical Stratum Structure in Natural Vegetation Area
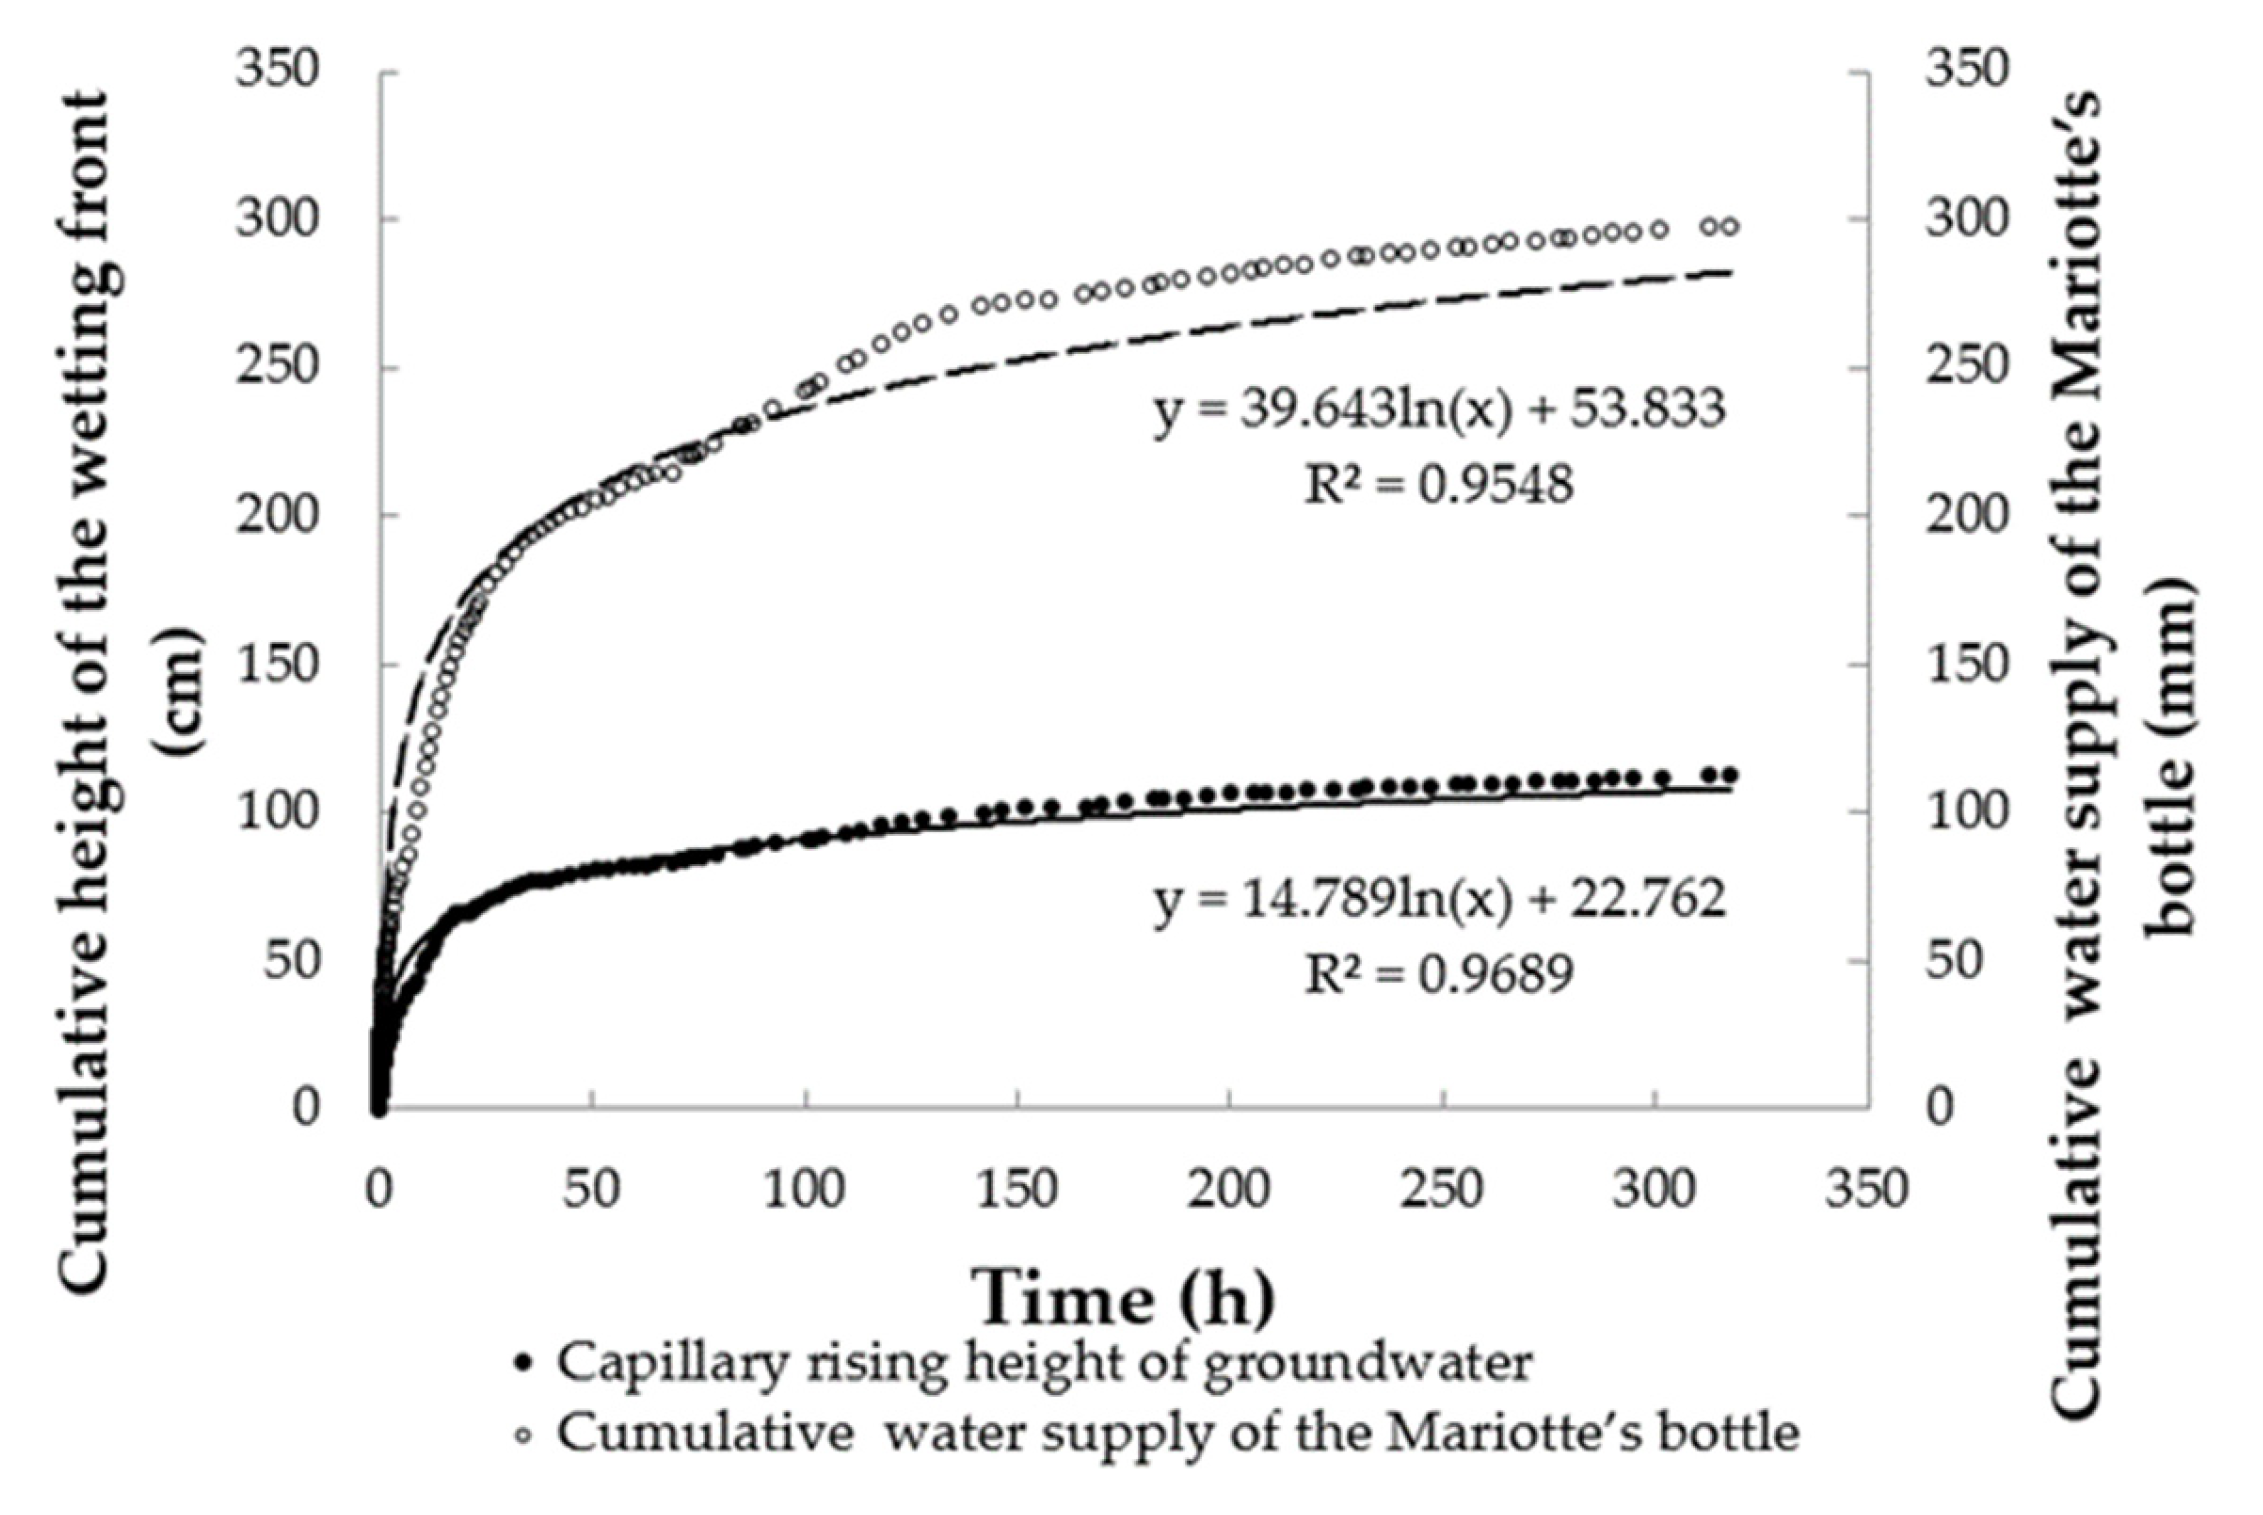
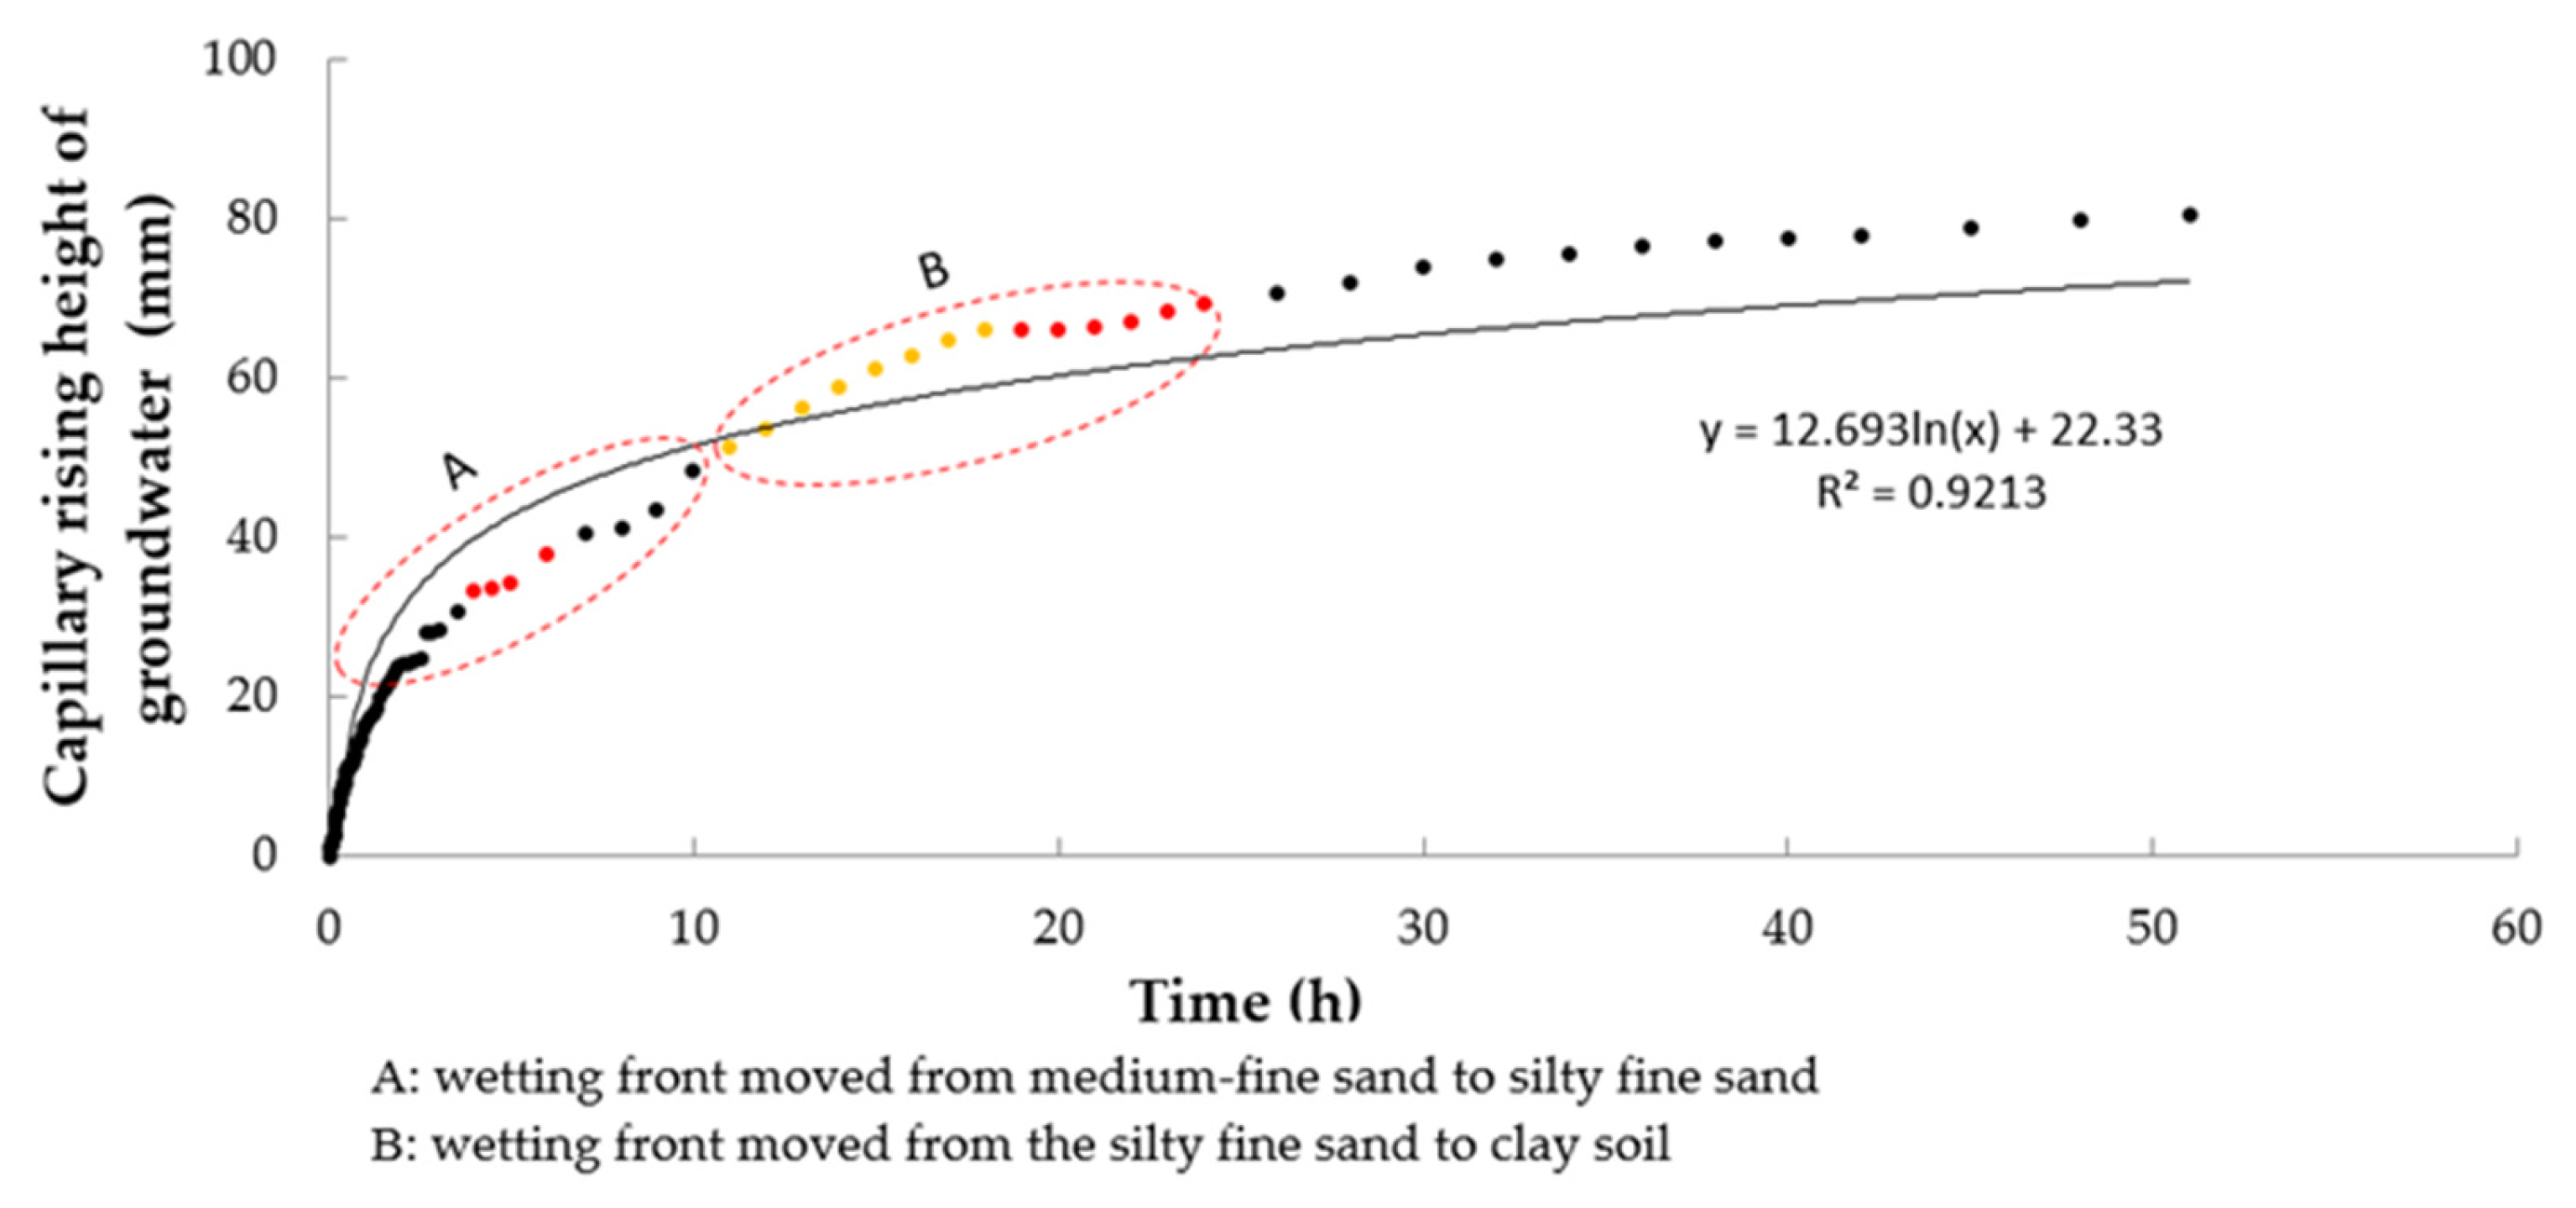
3.4. Capillary Water Rising Process in Layered Vadose Zone
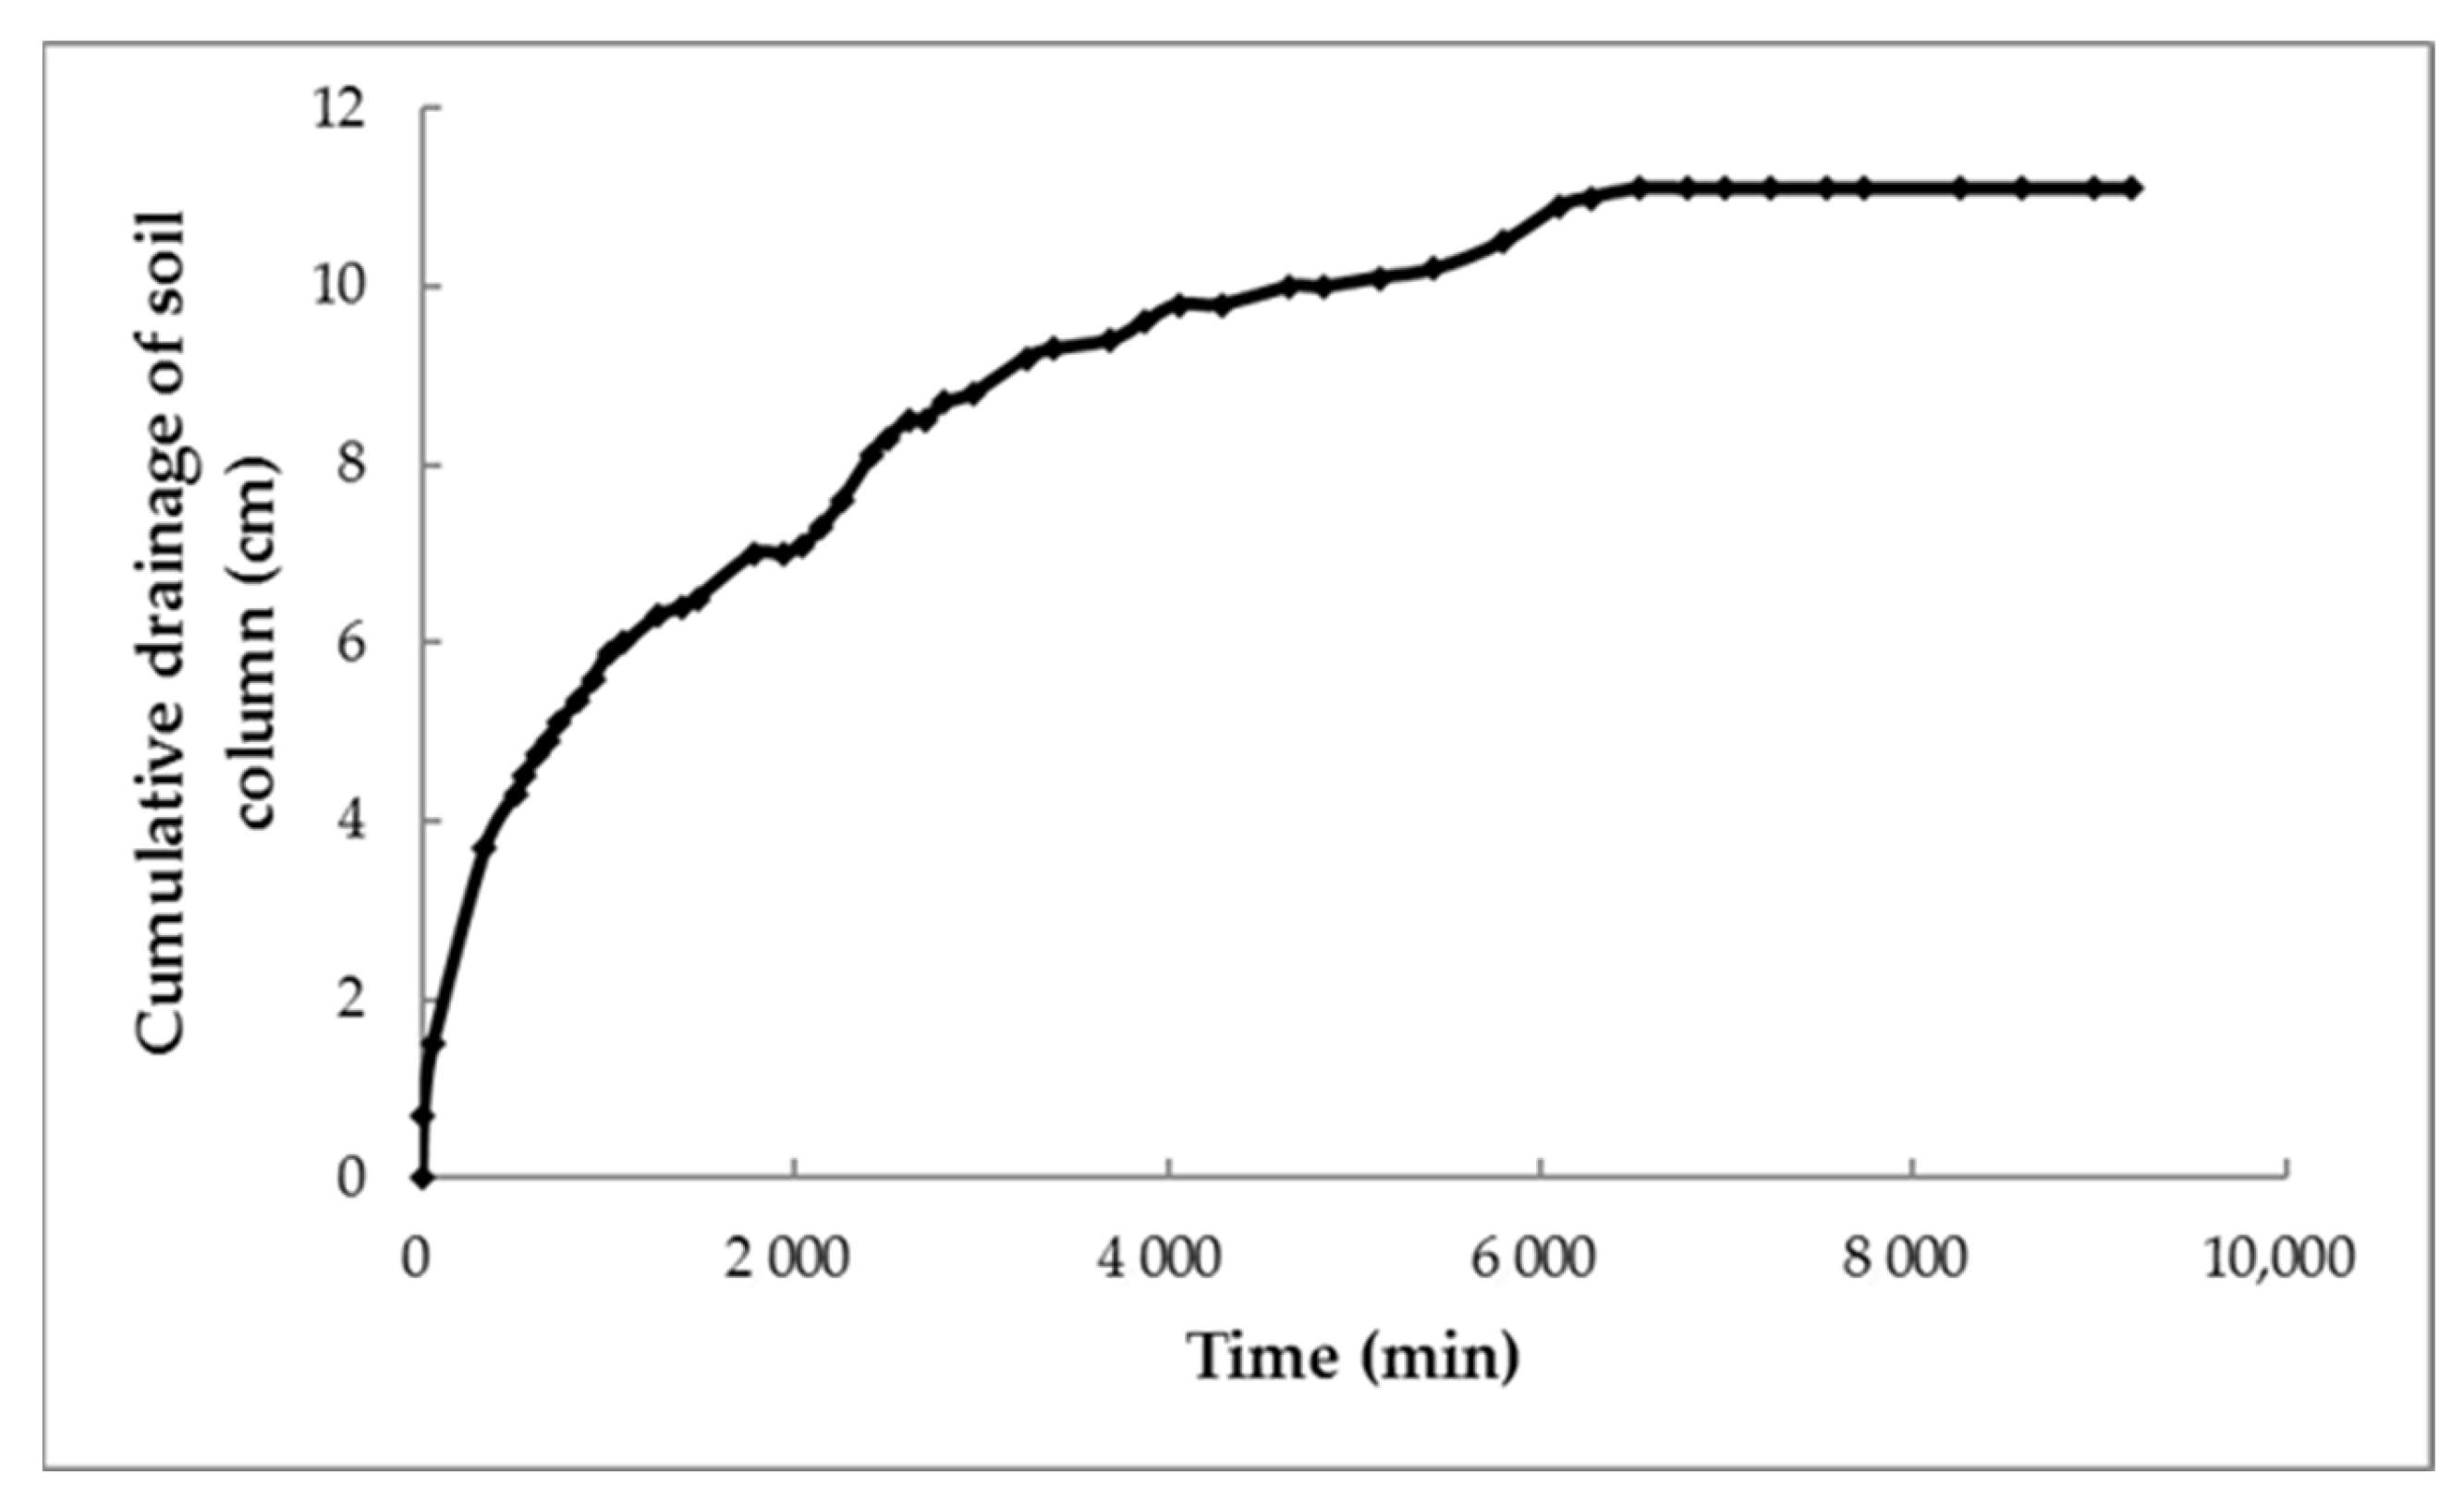
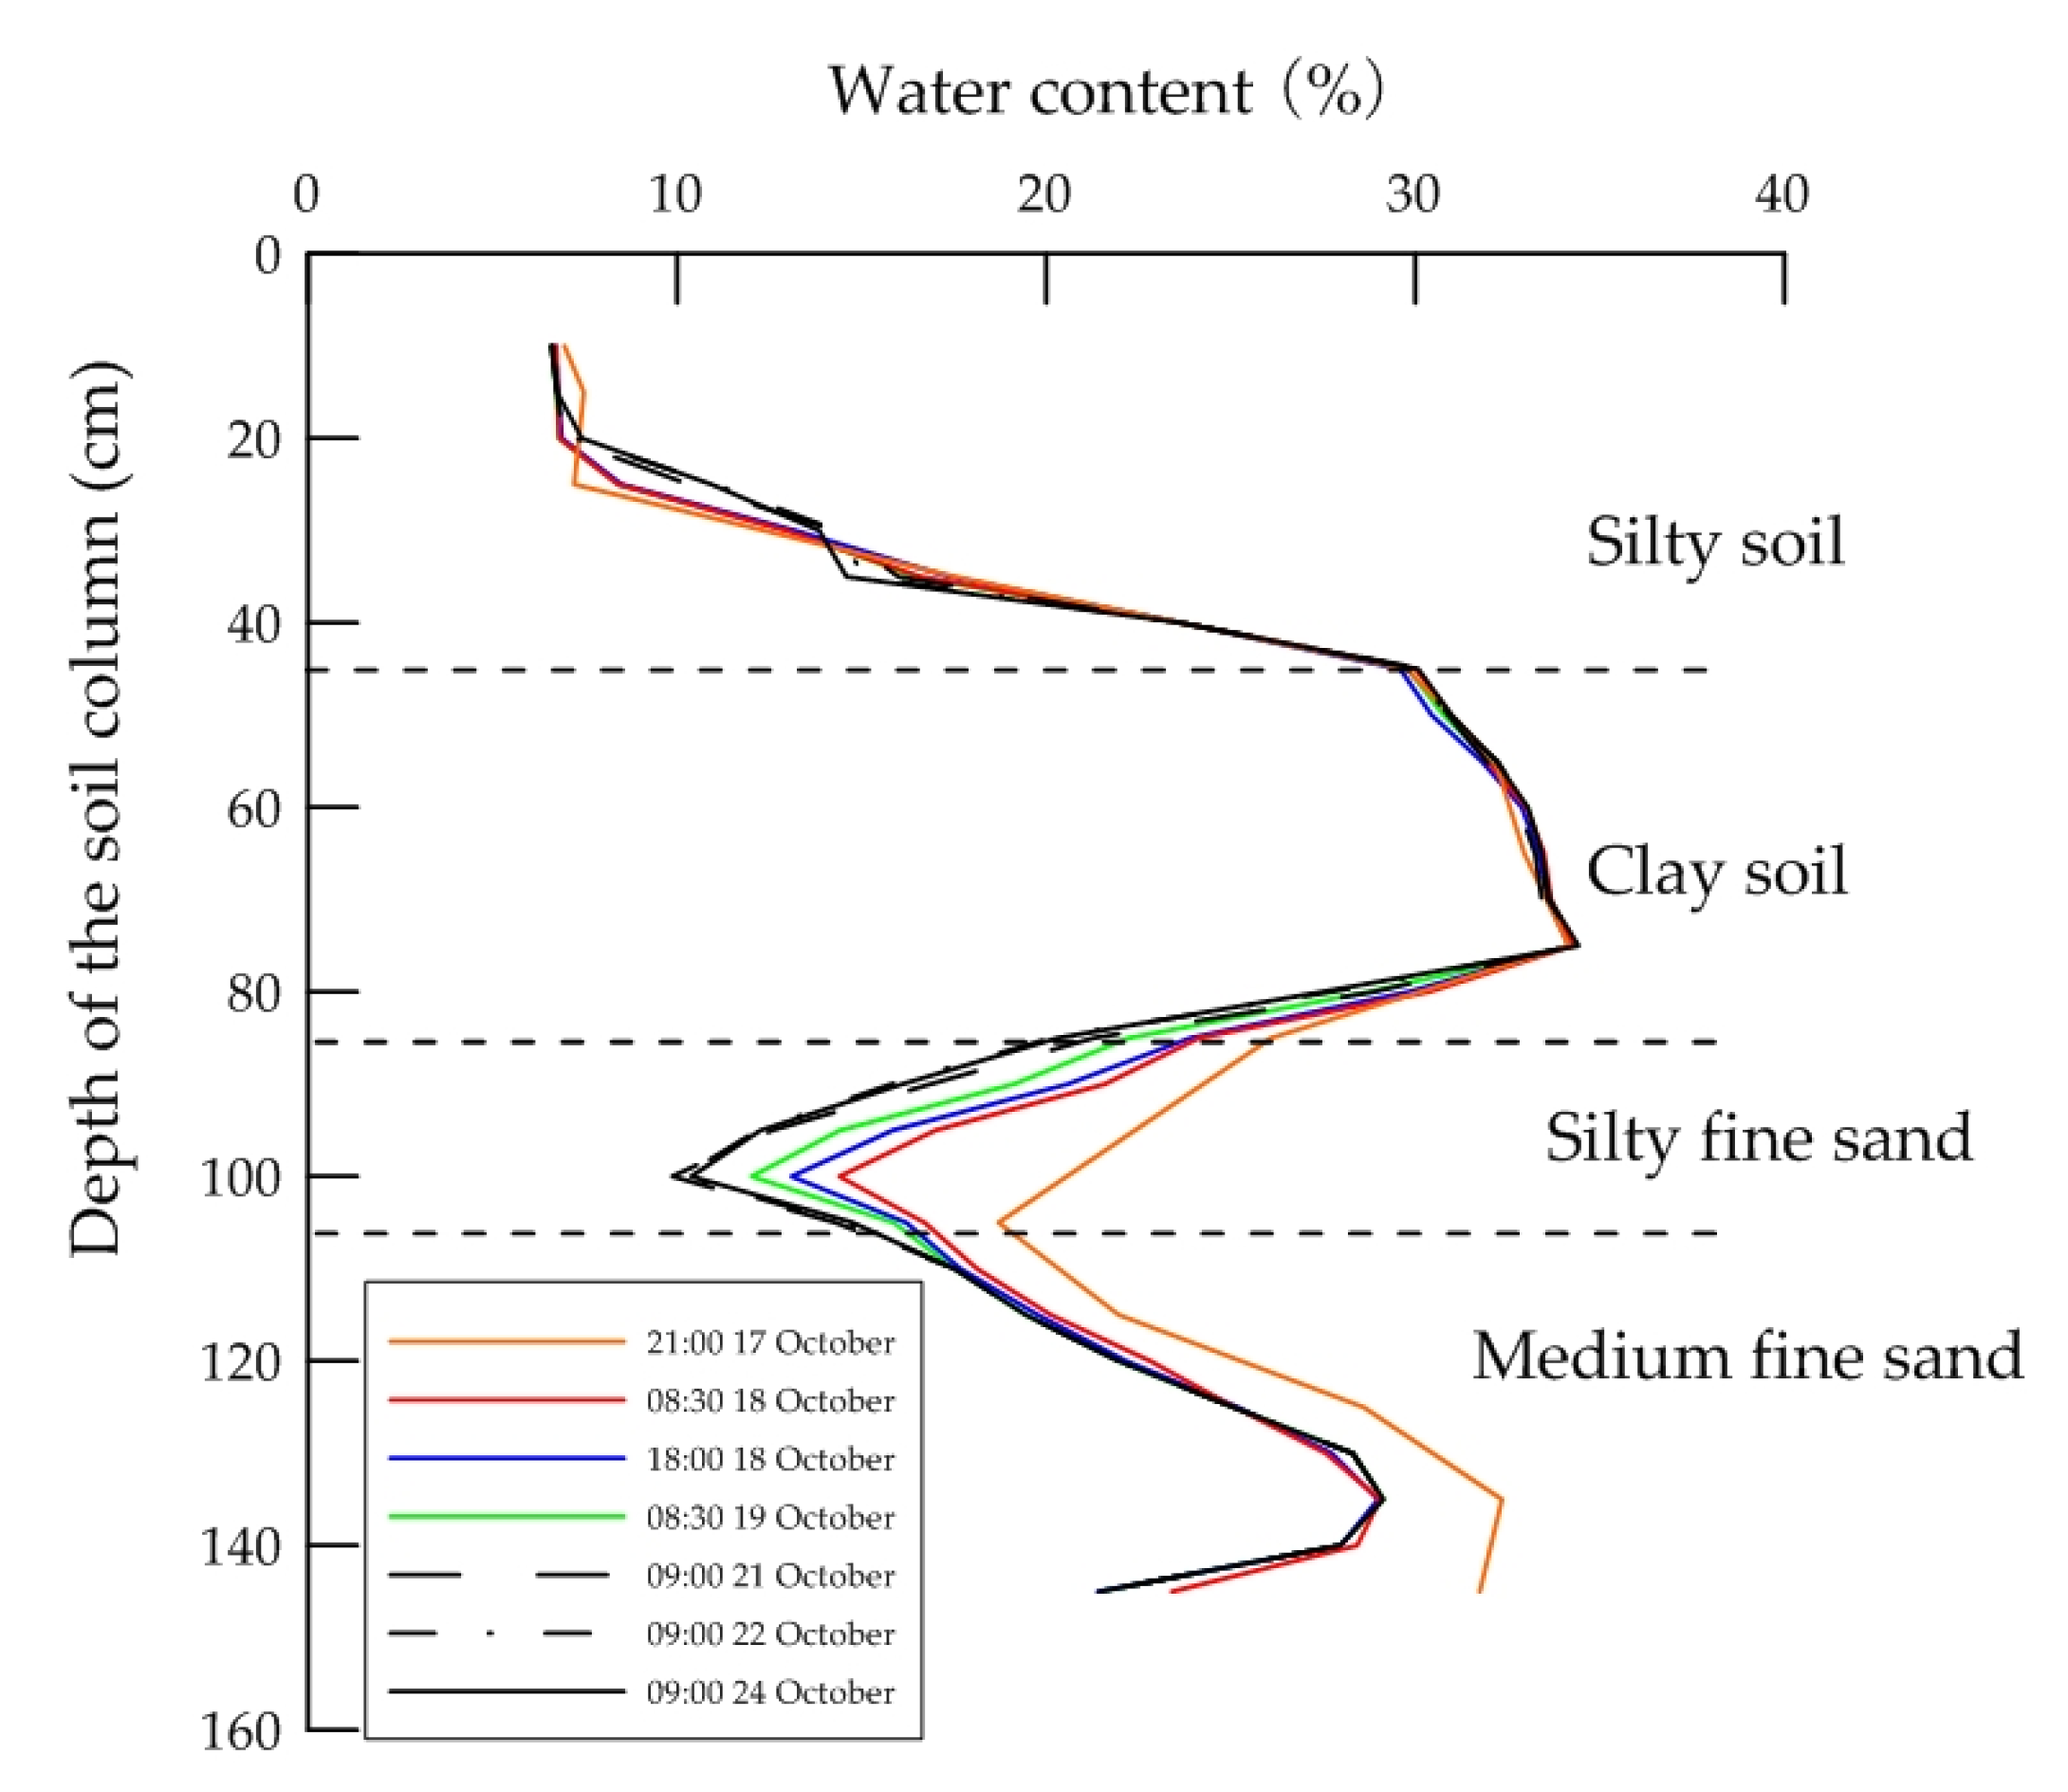
3.5. Water Release Process in Layered Vadose Zone
3.6. Available Water Content of Soil Column after the Water-Releasing Experiment
4. Discussion
4.1. Water Consumption of Typical Vegetation in Arid Area
4.2. Influence of Multi-Layer Structure of Vadose Zone on Maintaining Ecological Effect of Groundwater
5. Conclusions
- (1)
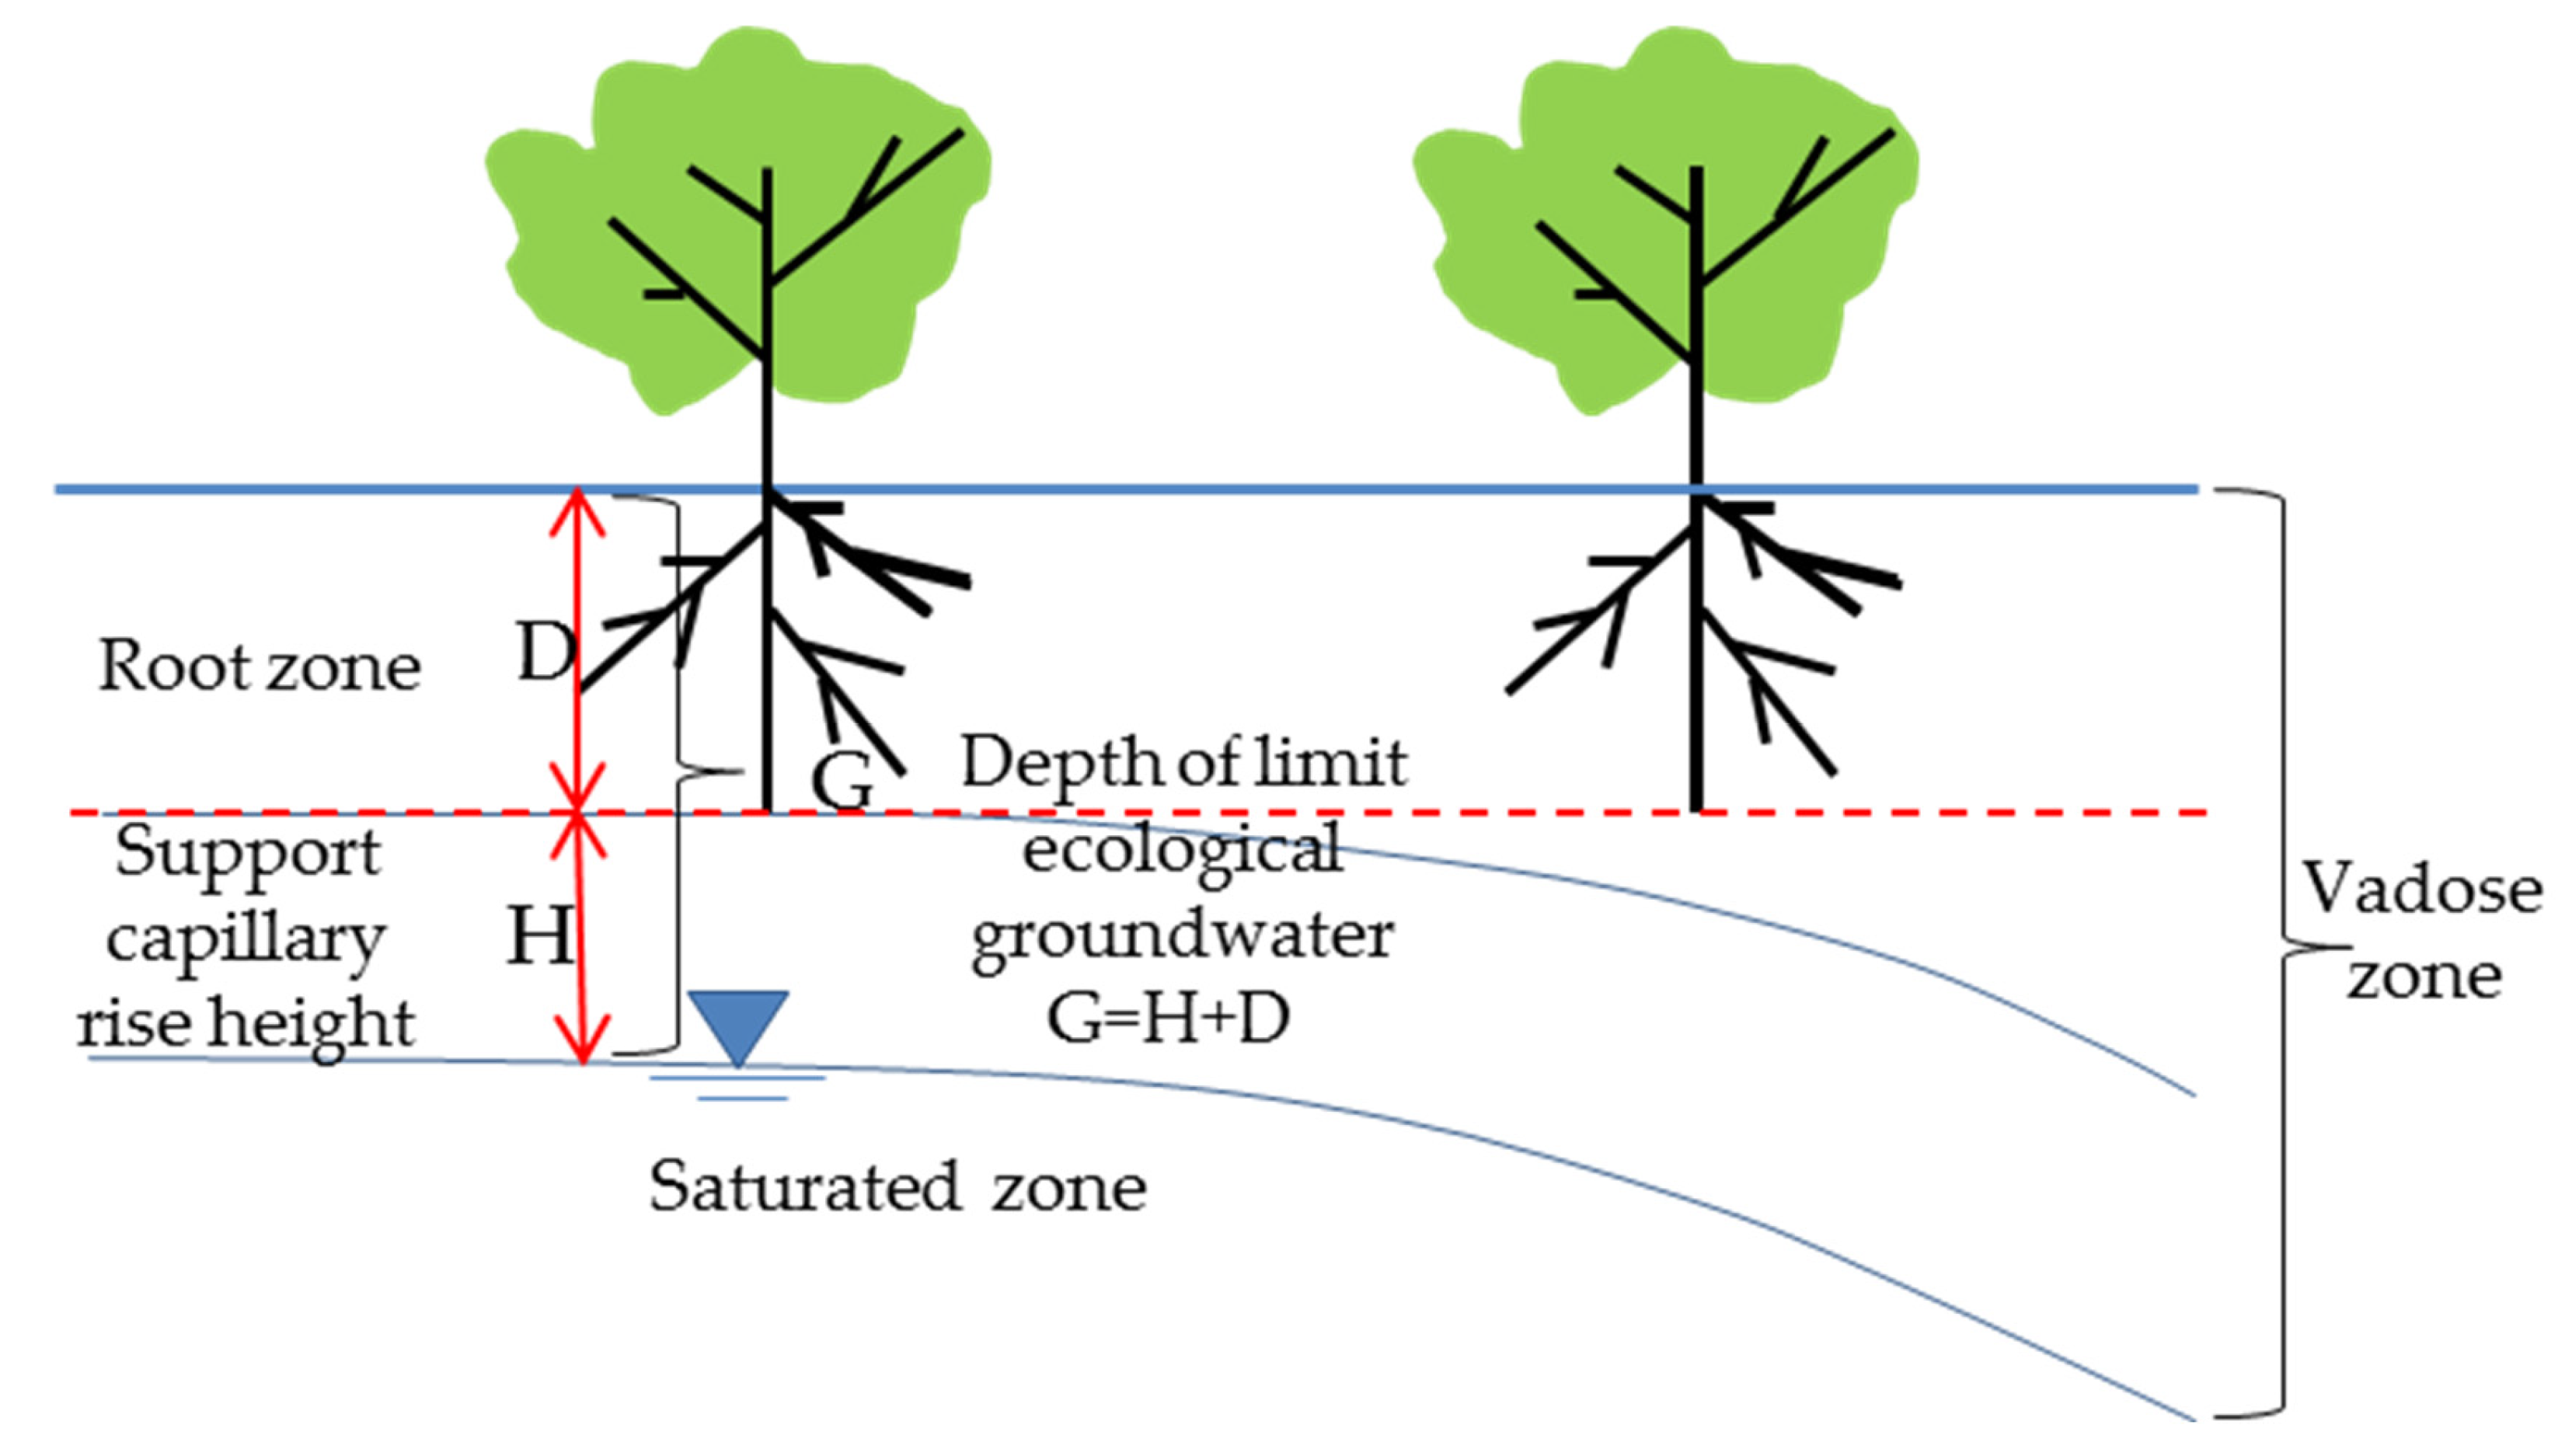
- According to the field survey, it was found that the structure of the vadose zone of natural vegetation in arid areas is a multi-layered structure, which has a positive effect on maintaining ecology. Moreover, the clay soil layer in the vadose zone will make the groundwater capillary rise higher (140 cm), making it easier for the roots of the vegetation on the ground to obtain water;
- (2)
- When the groundwater level drops, the water-holding capacity of the multi-layered vadose zone will continue to maintain high water content for the survival of surface vegetation in a certain time and range. Combined with the ecological water consumption of Haloxylon ammodendron in the growing season and indoor soil-column test, the available water held by multi-layered structure of the vadose zone can maintain Haloxylon ammodendron to survive in a growing season (6 months) after the groundwater level drops;
- (3)
- The research results can provide a scientific basis for the fine management of groundwater in arid regions. As we all know, artificial water delivery is an effective means to control ecological problems, but the period and the amount of water delivery have been debated by a wide range of scholars. The research calculated the available water held by the multi-layered vadose zone and the survival time of the typical vegetation when the groundwater depth drops below the ecological groundwater level. It will provide a scientific basis for the optimization of an ecological water-delivery period and water quantity;
- (4)
- Based on the above research, it is recommended to investigate the structure of the vadose zone in natural vegetation areas in arid areas to carry out the district management of ecological protection [41,42,43,44], realize refined management of groundwater and improve water-resource utilization efficiency.
Author Contributions
Funding
Institutional Review Board Statement
Informed Consent Statement
Data Availability Statement
Conflicts of Interest
References
- Liu, M.; Liu, P.; Guo, Y.; Wang, Y.; Geng, X.; Nie, Z.; Yu, Y. Change-Point Analysis of Precipitation and Drought Extremes in China over the Past 50 Years. Atmosphere 2019, 11, 11. [Google Scholar] [CrossRef] [Green Version]
- Liu, M.; Shen, Y.; Qi, Y.; Wang, Y.; Geng, X. Changes in Precipitation and Drought Extremes over the Past Half Century in China. Atmosphere 2019, 10, 203. [Google Scholar] [CrossRef] [Green Version]
- Chen, M.; Zhang, Q.; Wang, Y.; Yan, L.; Deng, W. Critical depth of recharge of the vegetation by groundwater in the West Liaohe Plain. Adv. Water Sci. 2019, 30, 24–33. [Google Scholar] [CrossRef]
- Wang, W.; Gong, C.; Zhang, Z.; Chen, L. Research Status and Prospect of the Subsurface Hydrology and Ecological Effect in Arid Regions. Adv. Earth Sci. 2018, 33, 702–718. [Google Scholar] [CrossRef]
- Li, F.; Wang, Y.; Zhao, Y.; Chen, X. Modelling the response of vegetation restoration to changes in groundwater level, based on ecologically suitable groundwater depth. Hydrogeol. J. 2018, 26, 2189–2204. [Google Scholar] [CrossRef]
- Johansen, O.M.; Andersen, D.K.; Ejrnæs, R.; Pedersen, M.L. Relations between vegetation and water level in groundwater dependent terrestrial ecosystems (GWDTEs). Limnologica 2018, 68, 130–141. [Google Scholar] [CrossRef] [Green Version]
- Cao, L.; Nie, Z.; Liu, M.; Wang, L.; Wang, J.; Wang, Q. The Ecological Relationship of Groundwater–Soil–Vegetation in the Oasis–Desert Transition Zone of the Shiyang River Basin. Water 2021, 13, 1642. [Google Scholar] [CrossRef]
- Hu, S.; Ma, R.; Sun, Z.; Ge, M.; Zeng, L.; Huang, F.; Bu, J.; Wang, Z. Determination of the optimal ecological water conveyance volume for vegetation restoration in an arid inland river basin, northwestern China. Sci. Total Environ. 2021, 788, 147775. [Google Scholar] [CrossRef]
- Huang, F.; Zhang, D.; Chen, X. Vegetation Response to Groundwater Variation in Arid Environments: Visualization of Research Evolution, Synthesis of Response Types, and Estimation of Groundwater Threshold. Int. J. Environ. Res. Public Health 2019, 16, 1849. [Google Scholar] [CrossRef] [Green Version]
- Cheng, G.; Liu, D.; Wen, L.; Liu, H.; Dong, S.; Wang, L. Effects of Groundwater and Soil Chemical Properties on Distribution of Natural Vegetation around Playa. Arid Zone Res. 2019, 36, 85–94. [Google Scholar] [CrossRef]
- Jia, L.; Guo, Z.; Long, Y.; Guo, K.; Liao, Z. Rearch advances in ecological groundwater level in arid areas. Ecol. Sci. 2015, 34, 187–193. [Google Scholar] [CrossRef]
- Taufik, M.; Veldhuizen, A.A.; Wösten, J.H.M.; Lanen, H.A.J. Exploration of the importance of physical properties of Indonesian peatlands to assess critical groundwater table depths, associated drought and fire hazard. Geoderma 2019, 347, 160–169. [Google Scholar] [CrossRef]
- Zhang, C.; Shao, J.; Li, C.; Cui, Y. A study on the ecological groundwater table in the North China plain. J. Jilin Univ. Earth Sci. Ed. 2003, 33, 323–326. [Google Scholar] [CrossRef]
- Eamus, D.; Zolfaghar, S.; Villalobos-Vega, R.; Cleverly, J.; Huete, A. Groundwater-dependent ecosystems: Recent insights from satellite and field-based studies. Hydrol. Earth Syst. Sci. 2015, 19, 4229–4256. [Google Scholar] [CrossRef] [Green Version]
- Liao, Z.; Ma, Z.; Cheng, S.; Xie, X.; He, H. Dominant critical water level of groundwater and its determing method. Water Resour. Hydropower Eng. 2018, 49, 26–32. [Google Scholar] [CrossRef]
- Huang, F.; Zhang, Y.; Zhang, D.; Chen, X. Environmental groundwater depth for groundwater-dependent terrestrial ecosystems in arid/semiarid regions: A review. Int. J. Environ. Res. Public Health 2019, 16, 763. [Google Scholar] [CrossRef] [PubMed] [Green Version]
- Zhu, L.; Xu, G.; Li, Y.; Tang, L.; Niu, Z. Relationships among plant species diversity, biomass, and the groundwater table in the Hailiutu River basin. Acta Ecol. Sin. 2017, 37, 1912–1921. [Google Scholar] [CrossRef] [Green Version]
- Wang, S.; Wu, B.; Yang, P.; Li, X.; Dong, X. Determination of the Ecological Groundwater Depth Considering Ecological Integrity over Oasis Irrigation Areas in the Yanqi Basin. Resour. Sci. 2011, 33, 422–430. [Google Scholar]
- Chui, T.F.M.; Low, S.Y.; Liong, S. An ecohydrological model for studying groundwater–vegetation interactions in wetlands. J. Hydrol. 2011, 409, 291–304. [Google Scholar] [CrossRef]
- Jiang, L.; Shang, S.; Mao, X. Simulation on the impact of the groundwater table on evapotranspiration of a riparian forest in arid region. J. Tsinghua Univ. (Sci. Tech.) 2013, 53, 601–605, 612. [Google Scholar] [CrossRef]
- Zhang, Y.; Chen, X.; Gao, M.; Liu, X. Meta-analysis of ecological depth to groundwater table and its influencing factors in arid region of northwest China. South-to-North Water Transf. Water Sci. Technol. 2020, 18, 57–65. [Google Scholar] [CrossRef]
- Sheng, J.; Qiao, Y.; Liu, H.; Zhai, Z.; Guo, Y. A Study on the Root System of Haloxylon Aammodendron (C.A.Mey.) Bunge. Acta Agrestia Sin. 2004, 12, 91–94. [Google Scholar] [CrossRef]
- Zhou, H. Review of studies on the relationship between soil water movement and energyand their driving forces in the vadose zone of arid regions. Acta Ecol. Sin. 2019, 39, 6586–6597. [Google Scholar] [CrossRef]
- Zhou, H.; Zhao, W. Soil physical characteristics of shallow vadose zone and modeling its effects on upward capillary rise of groundwater in an arid-desert area. Chin. J. Appl. Ecol. 2019, 30, 2999–3009. [Google Scholar] [CrossRef]
- Huang, M.; Barbour, S.L.; Elshorbagy, A.; Zettl, J.D.; Si, B.C. Infiltration and drainage processes in multi-layered coarse soils. Can. J. Soil Sci. 2011, 91, 169–183. [Google Scholar] [CrossRef]
- Zornberg, J.G.; Bouazza, A.; McCartney, J.S. Geosynthetic capillary barriers: Current state of knowledge. Geosynth. Int. 2010, 17, 273–300. [Google Scholar] [CrossRef] [Green Version]
- Shi, W.; Shen, B.; Wang, Z.; Wang, W. Maximum height of upward capillary water movement in layered soil. Agric. Res. Arid Areas 2007, 25, 94–97. [Google Scholar] [CrossRef]
- Cui, H.; Zhang, B.; Feng, X.; Gao, Y. Soil water-holding properties of different soil body configuration. Agric. Res. Arid Areas 2016, 34, 1–5. [Google Scholar] [CrossRef]
- Ge, J.; Huang, D.; Gao, X.; Tang, J.; Shen, H. Water Retention Capacity of Drained Soil Columns with Grained Layers. Southwest China J. Agric. Sci. 2019, 32, 2126–2132. [Google Scholar] [CrossRef]
- Chunyu, X.; Huang, F.; Xia, Z.; Zhang, D.; Chen, X.; Xie, Y. Assessing the Ecological Effects of Water Transport to a Lake in Arid Regions: A Case Study of Qingtu Lake in Shiyang River Basin, Northwest China. Int. J. Environ. Res. Public Health 2019, 16, 145. [Google Scholar] [CrossRef] [Green Version]
- Huang, F.; Chunyu, X.; Zhang, D.; Chen, X.; Ochoa, C.G. A framework to assess the impact of ecological water conveyance on groundwater-dependent terrestrial ecosystems in arid inland river basins. Sci. Total Environ. 2020, 709, 136155. [Google Scholar] [CrossRef]
- Huang, F.; Ochoa, C.G.; Chen, X.; Zhang, D. Modeling oasis dynamics driven by ecological water diversion and implications for oasis restoration in arid endorheic basins. J. Hydrol. 2021, 593, 125774. [Google Scholar] [CrossRef]
- Qian, J.; Chang, J.; Ma, H.; Ran, X.; Wang, Y. Comprehensive Water Resources Planning of Minqin County; Lanzhou University: Lanzhou, China, 2013; Unpublished work. [Google Scholar]
- Shao, M.; Wang, Q.; Huang, M. Soil Physics; Higher Education Press: Beijing, China, 2006. [Google Scholar]
- Chen, C.; Zhou, H.; Shang, J.; Hu, K.; Ren, T. Estimation of soil water content at permanent wilting point using hygroscopic water content. Eur. J. Soil Sci. 2020, 71, 392–398. [Google Scholar] [CrossRef]
- Taşan, S.; Demir, Y. Comparative Analysis of MLR, ANN, and ANFIS Models for Prediction of Field Capacity and Permanent Wilting Point for Bafra Plain Soils. Commun. Soil Sci. Plant Anal. 2020, 51, 604–621. [Google Scholar] [CrossRef]
- Ostovari, Y.; Asgari, K.; Cornelis, W. Performance evaluation of pedotransfer functions to predict field capacity and perma- nent wilting point using UNSODA and HYPRES Dataset. Arid Land Res. Manage. 2015, 29, 383–398. [Google Scholar] [CrossRef]
- Assi, A.T.; Blake, J.; Mohtar, R.H.; Braudeau, E. Soil aggregates structure-based approach for quantifying the field capacity, permanent wilting point and available water capacity. Irrig. Sci. 2019, 19, 3805–3816. [Google Scholar] [CrossRef]
- Wiecheteck, L.H.; Giarola, N.F.B.; de Lima, R.P.; Tormena, C.A.; Torres, L.C.; de Paula, A.L. Comparing the classical permanent wilting point concept of soil (−15,000 hPa) to biological wilting of wheat and barley plants under contrasting soil textures. Agric. Water Manag. 2020, 230, 105965. [Google Scholar] [CrossRef]
- Zhang, Y.; Chen, X.; Gao, M.; Liu, X. Simulation of transpiration for typical xeromorphic plants in inland arid region of Northwestern China. Acta Ecol. Sin. 2021, 41, 7751–7762. [Google Scholar] [CrossRef]
- Wang, X.; Shao, J.; Cui, Y.; Zhang, Q. Application of a Surrogate Model for a Groundwater Numerical Simulation Model for Determination of the Annual Control Index of the Groundwater Table in China. Sustainability 2020, 12, 5752. [Google Scholar] [CrossRef]
- Wang, J.; Zhang, G.; Yan, M.; Tian, Y.; Wang, Q. Index weight analysis of groundwater function evaluation and zoning system in arid areas. Trans. CSAE 2020, 36, 133–143. [Google Scholar] [CrossRef]
- Wang, J.; Zhang, G.; Wang, Q.; Cui, H.; Liu, P. Construction and application of evaluation index system of groundwater ecological function in northwest arid area. Acta Geol. Sin. 2021, 95, 1573–1581. [Google Scholar] [CrossRef]
- Wang, J.; Zhang, G.; Cui, H.; Wang, Q.; Dong, H.; Hao, J. System index attribute and application of groundwater function zoning in northwest inland area of China. J. Hydraul. Eng. 2020, 51, 796–804. [Google Scholar] [CrossRef]


| Lithology | Percentage of Different Soil Particles (%) | Dry Bulk Density (g/cm3) | |||||
|---|---|---|---|---|---|---|---|
| >1 mm | 1–0.5 mm | 0.5–0.25 mm | 0.25–0.1 mm | 0.1–0.075 mm | <0.075 mm | ||
| silty soil | 0 | 0 | 0.04 | 47.78 | 20.82 | 31.36 | 1.35 |
| clay soil | 0.23 | 4.65 | 3.14 | 29.17 | 28.98 | 33.84 | 1.44 |
| silty fine sand | 0 | 0.24 | 17.88 | 53.90 | 15.32 | 12.66 | 1.51 |
| medium fine sand | 0.01 | 16.85 | 26.93 | 33.40 | 14.85 | 7.96 | 1.60 |
| Testing Depth (cm) | Lithology | θfinal (%) | θinitial (%) | θfinal – θinitial (%) | ΔW (mm) |
|---|---|---|---|---|---|
| 5 | Silty soil | 6.41 | 6.69 | — | — |
| 15 | Silty soil | 7.47 | 6.69 | 0.78 | 0.78 |
| 25 | Silty soil | 7.21 | 6.69 | 0.51 | 0.51 |
| 35 | Silty soil | 17.52 | 6.69 | 10.83 | 10.83 |
| 45 | Clay soil | 29.76 | 1.54 | 28.22 | 28.22 |
| 55 | Clay soil | 32.17 | 1.54 | 30.63 | 30.63 |
| 65 | Clay soil | 32.95 | 1.54 | 31.41 | 31.41 |
| 75 | Clay soil | 34.16 | 1.54 | 32.62 | 32.62 |
| 85 | Silty fine sand | 26.09 | 0.26 | 25.83 | 25.83 |
| 105 | Medium fine sand | 18.71 | 0.58 | 18.13 | 18.13 |
| 115 | Medium fine sand | 21.96 | 0.58 | 21.38 | 21.38 |
| 125 | Medium fine sand | 28.59 | 0.58 | 28.01 | 28.01 |
| 135 | Medium fine sand | 32.35 | 0.58 | 31.77 | 31.77 |
| 145 | Medium fine sand | 31.74 | 0.58 | 31.17 | 31.17 |
| Cumulative water supply (mm) | 291.28 | ||||
| Testing Depth (cm) | Lithology | θinitial (%) | ΔW1 (mm) | θfinal (%) | ΔW2 (mm) |
|---|---|---|---|---|---|
| 10 | Silty soil | 6.94 | 6.94 | 6.60 | 6.60 |
| 15 | Silty soil | 7.47 | 3.73 | 6.74 | 3.37 |
| 20 | Silty soil | 7.34 | 3.67 | 7.42 | 3.71 |
| 25 | Silty soil | 7.21 | 3.60 | 10.93 | 5.47 |
| 30 | Silty soil | 12.37 | 6.18 | 13.85 | 6.92 |
| 35 | Silty soil | 17.52 | 8.76 | 14.59 | 7.29 |
| 40 | Silty soil | 23.64 | 11.82 | 23.64 | 11.82 |
| 45 | Clay soil | 29.76 | 14.88 | 30.07 | 15.04 |
| 50 | Clay soil | 30.96 | 15.48 | 30.98 | 15.49 |
| 55 | Clay soil | 32.17 | 16.08 | 32.19 | 16.09 |
| 60 | Clay soil | 32.56 | 16.28 | 33.05 | 16.52 |
| 65 | Clay soil | 32.95 | 16.47 | 33.43 | 16.72 |
| 70 | Clay soil | 33.55 | 16.78 | 33.64 | 16.82 |
| 75 | Clay soil | 34.16 | 17.08 | 34.42 | 17.21 |
| 80 | Clay soil | 30.12 | 15.06 | 27.46 | 13.73 |
| 85 | Silty fine sand | 26.09 | 13.05 | 20.30 | 10.15 |
| 90 | Silty fine sand | 24.25 | 12.12 | 16.10 | 8.05 |
| 95 | Silty fine sand | 22.40 | 11.20 | 12.26 | 6.13 |
| 100 | Silty fine sand | 20.55 | 10.28 | 10.38 | 5.19 |
| 105 | Medium fine sand | 18.71 | 9.35 | 14.75 | 7.38 |
| 110 | Medium fine sand | 20.33 | 10.17 | 17.51 | 8.76 |
| 115 | Medium fine sand | 21.96 | 10.98 | 19.44 | 9.72 |
| 120 | Medium fine sand | 25.27 | 12.64 | 21.96 | 10.98 |
| 125 | Medium fine sand | 28.59 | 14.29 | 25.05 | 12.53 |
| 130 | Medium fine sand | 30.47 | 15.23 | 28.30 | 14.15 |
| 135 | Medium fine sand | 32.35 | 16.17 | 29.13 | 14.57 |
| 140 | Medium fine sand | 32.04 | 16.02 | 27.96 | 13.98 |
| 145 | Medium fine sand | 31.74 | 15.87 | 21.44 | 10.72 |
| Water storage | 340.21 | 305.09 |
| Lithology | Fitting Parameters | Permanent Wilting Point (%) | |||||
|---|---|---|---|---|---|---|---|
| Qr | Qs | Alpha (1/cm) | n | Ks (cm/days) | l | ||
| Clay Soil | 0.0813 | 0.431 | 0.0141 | 1.3895 | 8.65 | 0.5 | 12.47 |
| Silty Soil | 0.0804 | 0.4536 | 0.0171 | 1.3884 | 20.21 | 0.5 | 12.37 |
| Silty fine sand | 0.0496 | 0.3904 | 0.0313 | 1.5032 | 49.33 | 0.5 | 6.51 |
| Medium Fine sand | 0.0425 | 0.3603 | 0.0401 | 1.6131 | 60.66 | 0.5 | 4.88 |
| Testing Depth (cm) | Lithology | θfinal (%) | ΔW2 (mm) | θpwp (%) | θavailable (%) | ΔW3 (mm) |
|---|---|---|---|---|---|---|
| 10 | Silty soil | 6.60 | 6.60 | 12.37 | — | — |
| 15 | Silty soil | 6.74 | 3.37 | 12.37 | — | — |
| 20 | Silty soil | 7.42 | 3.71 | 12.37 | — | — |
| 25 | Silty soil | 10.93 | 5.47 | 12.37 | 0.93 | — |
| 30 | Silty soil | 13.85 | 6.92 | 12.37 | 3.85 | 0.74 |
| 35 | Silty soil | 14.59 | 7.29 | 12.37 | 4.59 | 1.11 |
| 40 | Silty soil | 23.64 | 11.82 | 12.37 | 13.64 | 5.64 |
| 45 | Clay soil | 30.07 | 15.04 | 12.47 | 20.07 | 8.80 |
| 50 | Clay soil | 30.98 | 15.49 | 12.47 | 20.98 | 9.26 |
| 55 | Clay soil | 32.19 | 16.09 | 12.47 | 22.19 | 9.86 |
| 60 | Clay soil | 33.05 | 16.52 | 12.47 | 23.05 | 10.29 |
| 65 | Clay soil | 33.43 | 16.72 | 12.47 | 23.43 | 10.48 |
| 70 | Clay soil | 33.64 | 16.82 | 12.47 | 23.64 | 10.59 |
| 75 | Clay soil | 34.42 | 17.21 | 12.47 | 24.42 | 10.98 |
| 80 | Clay soil | 27.46 | 13.73 | 12.47 | 17.46 | 7.50 |
| 85 | Silty fine sand | 20.30 | 10.15 | 6.51 | 10.30 | 6.90 |
| 90 | Silty fine sand | 16.10 | 8.05 | 6.51 | 6.10 | 4.80 |
| 95 | Silty fine sand | 12.26 | 6.13 | 6.51 | 2.26 | 2.88 |
| 100 | Silty fine sand | 10.38 | 5.19 | 6.51 | 0.38 | 1.94 |
| 105 | Medium fine sand | 14.75 | 7.38 | 4.88 | 4.75 | 4.94 |
| 110 | Medium fine sand | 17.51 | 8.76 | 4.88 | 7.51 | 6.32 |
| 115 | Medium fine sand | 19.44 | 9.72 | 4.88 | 9.44 | 7.28 |
| 120 | Medium fine sand | 21.96 | 10.98 | 4.88 | 11.96 | 8.54 |
| 125 | Medium fine sand | 25.05 | 12.53 | 4.88 | 15.05 | 10.09 |
| 130 | Medium fine sand | 28.30 | 14.15 | 4.88 | 18.30 | 11.71 |
| 135 | Medium fine sand | 29.13 | 14.57 | 4.88 | 19.13 | 12.13 |
| 140 | Medium fine sand | 27.96 | 13.98 | 4.88 | 17.96 | 11.54 |
| 145 | Medium fine sand | 21.44 | 10.72 | 4.88 | 11.44 | 8.28 |
| Water storage | 305.09 | 182.54 |
Publisher’s Note: MDPI stays neutral with regard to jurisdictional claims in published maps and institutional affiliations. |
© 2021 by the authors. Licensee MDPI, Basel, Switzerland. This article is an open access article distributed under the terms and conditions of the Creative Commons Attribution (CC BY) license (https://creativecommons.org/licenses/by/4.0/).
Share and Cite
Cui, H.; Zhang, G.; Wang, J.; Wang, Q.; Lang, X. Influence of Multi-Layered Structure of Vadose Zone on Ecological Effect of Groundwater in Arid Area: A Case Study of Shiyang River Basin, Northwest China. Water 2022, 14, 59. https://doi.org/10.3390/w14010059
Cui H, Zhang G, Wang J, Wang Q, Lang X. Influence of Multi-Layered Structure of Vadose Zone on Ecological Effect of Groundwater in Arid Area: A Case Study of Shiyang River Basin, Northwest China. Water. 2022; 14(1):59. https://doi.org/10.3390/w14010059
Chicago/Turabian StyleCui, Haohao, Guanghui Zhang, Jinzhe Wang, Qian Wang, and Xujuan Lang. 2022. "Influence of Multi-Layered Structure of Vadose Zone on Ecological Effect of Groundwater in Arid Area: A Case Study of Shiyang River Basin, Northwest China" Water 14, no. 1: 59. https://doi.org/10.3390/w14010059