
Publicly Available Data-Based Flood Risk Assessment Methodology: A Case Study for a Floodplain in Poland


1
Faculty of Safety Engineering and Civil Protection, The Main School of Fire Service, Slowackiego Street, 52/54, 01-629 Warsaw, Poland
2
Institute of Safety Engineering, The Main School of Fire Service, Slowackiego Street, 52/54, 01-629 Warsaw, Poland
*
Author to whom correspondence should be addressed.
Water 2022, 14(1), 61; https://doi.org/10.3390/w14010061
Submission received: 29 November 2021
/
Revised: 22 December 2021
/
Accepted: 24 December 2021
/
Published: 29 December 2021
(This article belongs to the Section Hydrology)
Abstract
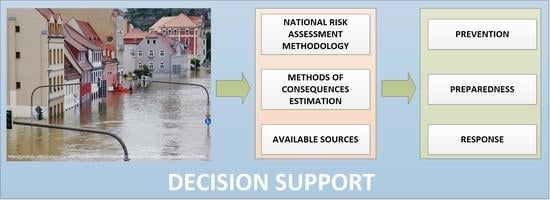
:Flood risk assessment is used to estimate the expected consequences and probability of a flood. It leads to the strengthening of resilience through appropriate preparation for an event of a specific scale. The methodology described in this paper was developed by the authors for the purposes of flood risk assessment in Poland, introduced to and applied on an actual example. It is based on simple calculations and a comparison of the results with a template. All of the data required for calculation came from freely available sources. Therefore, it is essential to evaluate the effectiveness of the flood risk assessment methodology in improving construction safety and identifying the factors that influence its implementation. The approach presented in this article is based on implementation of the parameters of floods, describing the characteristics of the exposed area and human vulnerability, among other factors, to the national risk assessment methodology, and then using it to determine the directions of activities aimed at reducing the risk of flooding. Simultaneously, assessment of these parameters might not be related directly to flood threats, but rather to the broader approach to risk assessment, including other threats. As a result of the application of the described methodology, it was estimated that the flood risk in the studied area is catastrophic, which requires immediate decisions of people responsible for safety.
1. Introduction
High repeatability of floods in Europe, climate changes, large losses caused by historical floods, and numerous forecasts indicate that European countries may again (and repeatedly) be affected by floods in coming years, creating the need for continuous study of this phenomenon, for the needs of better planning for flood protection [1]. Flood protection means both technical solutions (e.g., soil conservation, reforestation, construction of dams, reservoirs, and river embankments) and hydrological analyses for flood forecasting (e.g., probability of flooding and extent and height of flood wave) to provide information and warning to the affected communities [2]. All flood protection measures should lead to a reduction in flood risk and should minimize the consequences of floods. Therefore, the assessment of the risks associated with flood hazards forms the basis of flood protection.
Risk assessments should be understood as a comprehensive, cross-sectional process of risk identification, including analysis and estimation of risk by determining the probability of various hazard scenarios and their potential consequences. This is followed by an evaluation and determination of priorities for action to reduce the level of risk to an acceptable level by structural and nonstructural measures [3]. The method of risk management should be defined by describing the structures and functions of each of its components (described in Section 2) in the field of security management. The concept of risk is not new, and attempts at probabilistic risk assessment for various threats date back to the first half of the 20th century [4]. In the event of flood risk in Europe, attempts to develop a risk assessment methodology were made at the beginning of the 21st century, owing to the introduction of Directive 2007/60/EC of the European Parliament and of the Council of 23 October 2007 on the assessment and management of flood risks, which required EU Member States to develop publicly available preliminary flood risk assessments, flood risk maps, and flood risk management plans [5]. Detailed objectives and the provisions of flood risk assessments are contained in the decision of the European Parliament and of the Council on a Union Civil Protection Mechanism in Article 6 [6].
Despite the passage of more than 12 years since the directive was introduced, a review of the literature indicates that new flood risk assessment methodologies are still under development [7,8]. It is not uncommon for flood risk assessment methodologies to be developed on a country-by-country basis [9,10,11,12,13,14]. The multiplicity of flood risk assessment methodologies is also demonstrated by literature reviews carried out by authors [15,16,17,18,19,20]. Developing an interdisciplinary and comprehensive approach to flood risk assessment ready for use in all EU Member States remains a challenge. This is probably due to the fact that floods are local in nature and their course and risk are determined by local conditions, such as population density, the use of valleys and flood plains, technical and communication infrastructure (both in flood plains and those used to combat flooding), and the effectiveness of flood protection systems. A fair risk assessment requires the use of supporting and precise methods. Therefore, most methodologies require data that are not always readily available, such as advanced quantitative forecasts of floods and knowledge of the area assessed [21].
Poland is one of the European countries commonly and seriously affected by floods. Most of Poland is located in the drainage basins of two large rivers: the Vistula (which drainage basin covers 54% of the country’s area) and the Odra (34%) [22]. The most severe floods in Poland occurred in 1997 (millennial flood) and 2010. As the financial losses incurred as a result of these floods accounted for approximately 98.5% of the value of all losses caused by different crisis phenomena in Poland, flood risk assessment is therefore one of the overarching tasks in the crisis management process [23].
The aim of this study is to present a relatively universal, low-cost, and publicly available data-based flood risk assessment methodology, as well as to provide a step by step demonstration of how to implement it on a real example, i.e., a typical flood-exposed Polish commune called Brańszczyk, located in the central part of the country (52°37′38″ N, 21°35′8″ E) in Mazovia voivodeship in Wyszków district in the valley of the lower Bug River. The choice of this municipality results from its location in the vicinity of the Bug River and the historical conditions associated with the occurrence of floods in the area. The most severe flood that occurred in the Brańszczyk commune was in 1979, and still remembered by the local community. The fact that the Brańszczyk commune is exposed to the effects of large floods, combined with local awareness of this phenomenon in society, necessitates an analysis of this region in terms of assessing the maximum effects it may be exposed to as a result of floods according to the “worst scenario rule”.
The basics of the risk assessment methodology used in this paper have been developed by a team of scientists from Polish scientific and research units (The Main School of Fire Service (including one of the manuscript authors), Academy of National Defense, Warsaw University of Technology, and Scientific and Research Center for Fire Protection) on behalf of the Government Centre for Security (Central public administration body in the field of crisis management in Poland), as a part of a Polish development project called “Methodology of risk assessment for the purpose of crisis managements systems in the Republic of Poland” financed by the National Centre for Research and Development on the implementation of projects in the field of research and development for national defense and state security (agreement no DOBR/0077/R/ID3/2013/03) [24,25]. Part of the study during project “Methodology of risk assessment for the purpose of crisis managements systems in the Republic of Poland” was involved to develop a methodology for assessing the risk of different threats classified in a catalogue of threats (including floods), adapted to the requirements of planning and programming documents governing the crisis management system. The methodology that is the results of the above-mentioned project is based on the best risk assessment practices in other countries (Sweden, Germany, Ireland, Canada, the Netherlands, and the United Kingdom) [9,10,11,12,13,14], systematizes the concepts of risk assessment and crisis management, and identifies databases that could be useful in the risk assessment process. It does not require the creation of complex forecasts and calculations, but is instead based on publicly available data. The methodology presents the general principles of risk assessment and was prepared in a form that allows for its application to each hazard [24]. In this work, the authors adapted the above-mentioned methodology for the purposes of flood risk assessment.
The added value of this publication is the fact that it can constitute a universal template for the assessment of the flood risk, ready to be implemented at different levels of crisis management, namely, local, regional, and national not only in Poland, but also in other countries. The methodology presented in the paper is based on the already processed data collected with the use of various solutions (e.g., remote sensing techniques or numerical terrain models); therefore, it does not require specialized knowledge, analytical skills and special hardware resources.
2. Methodology of Risk Assessment
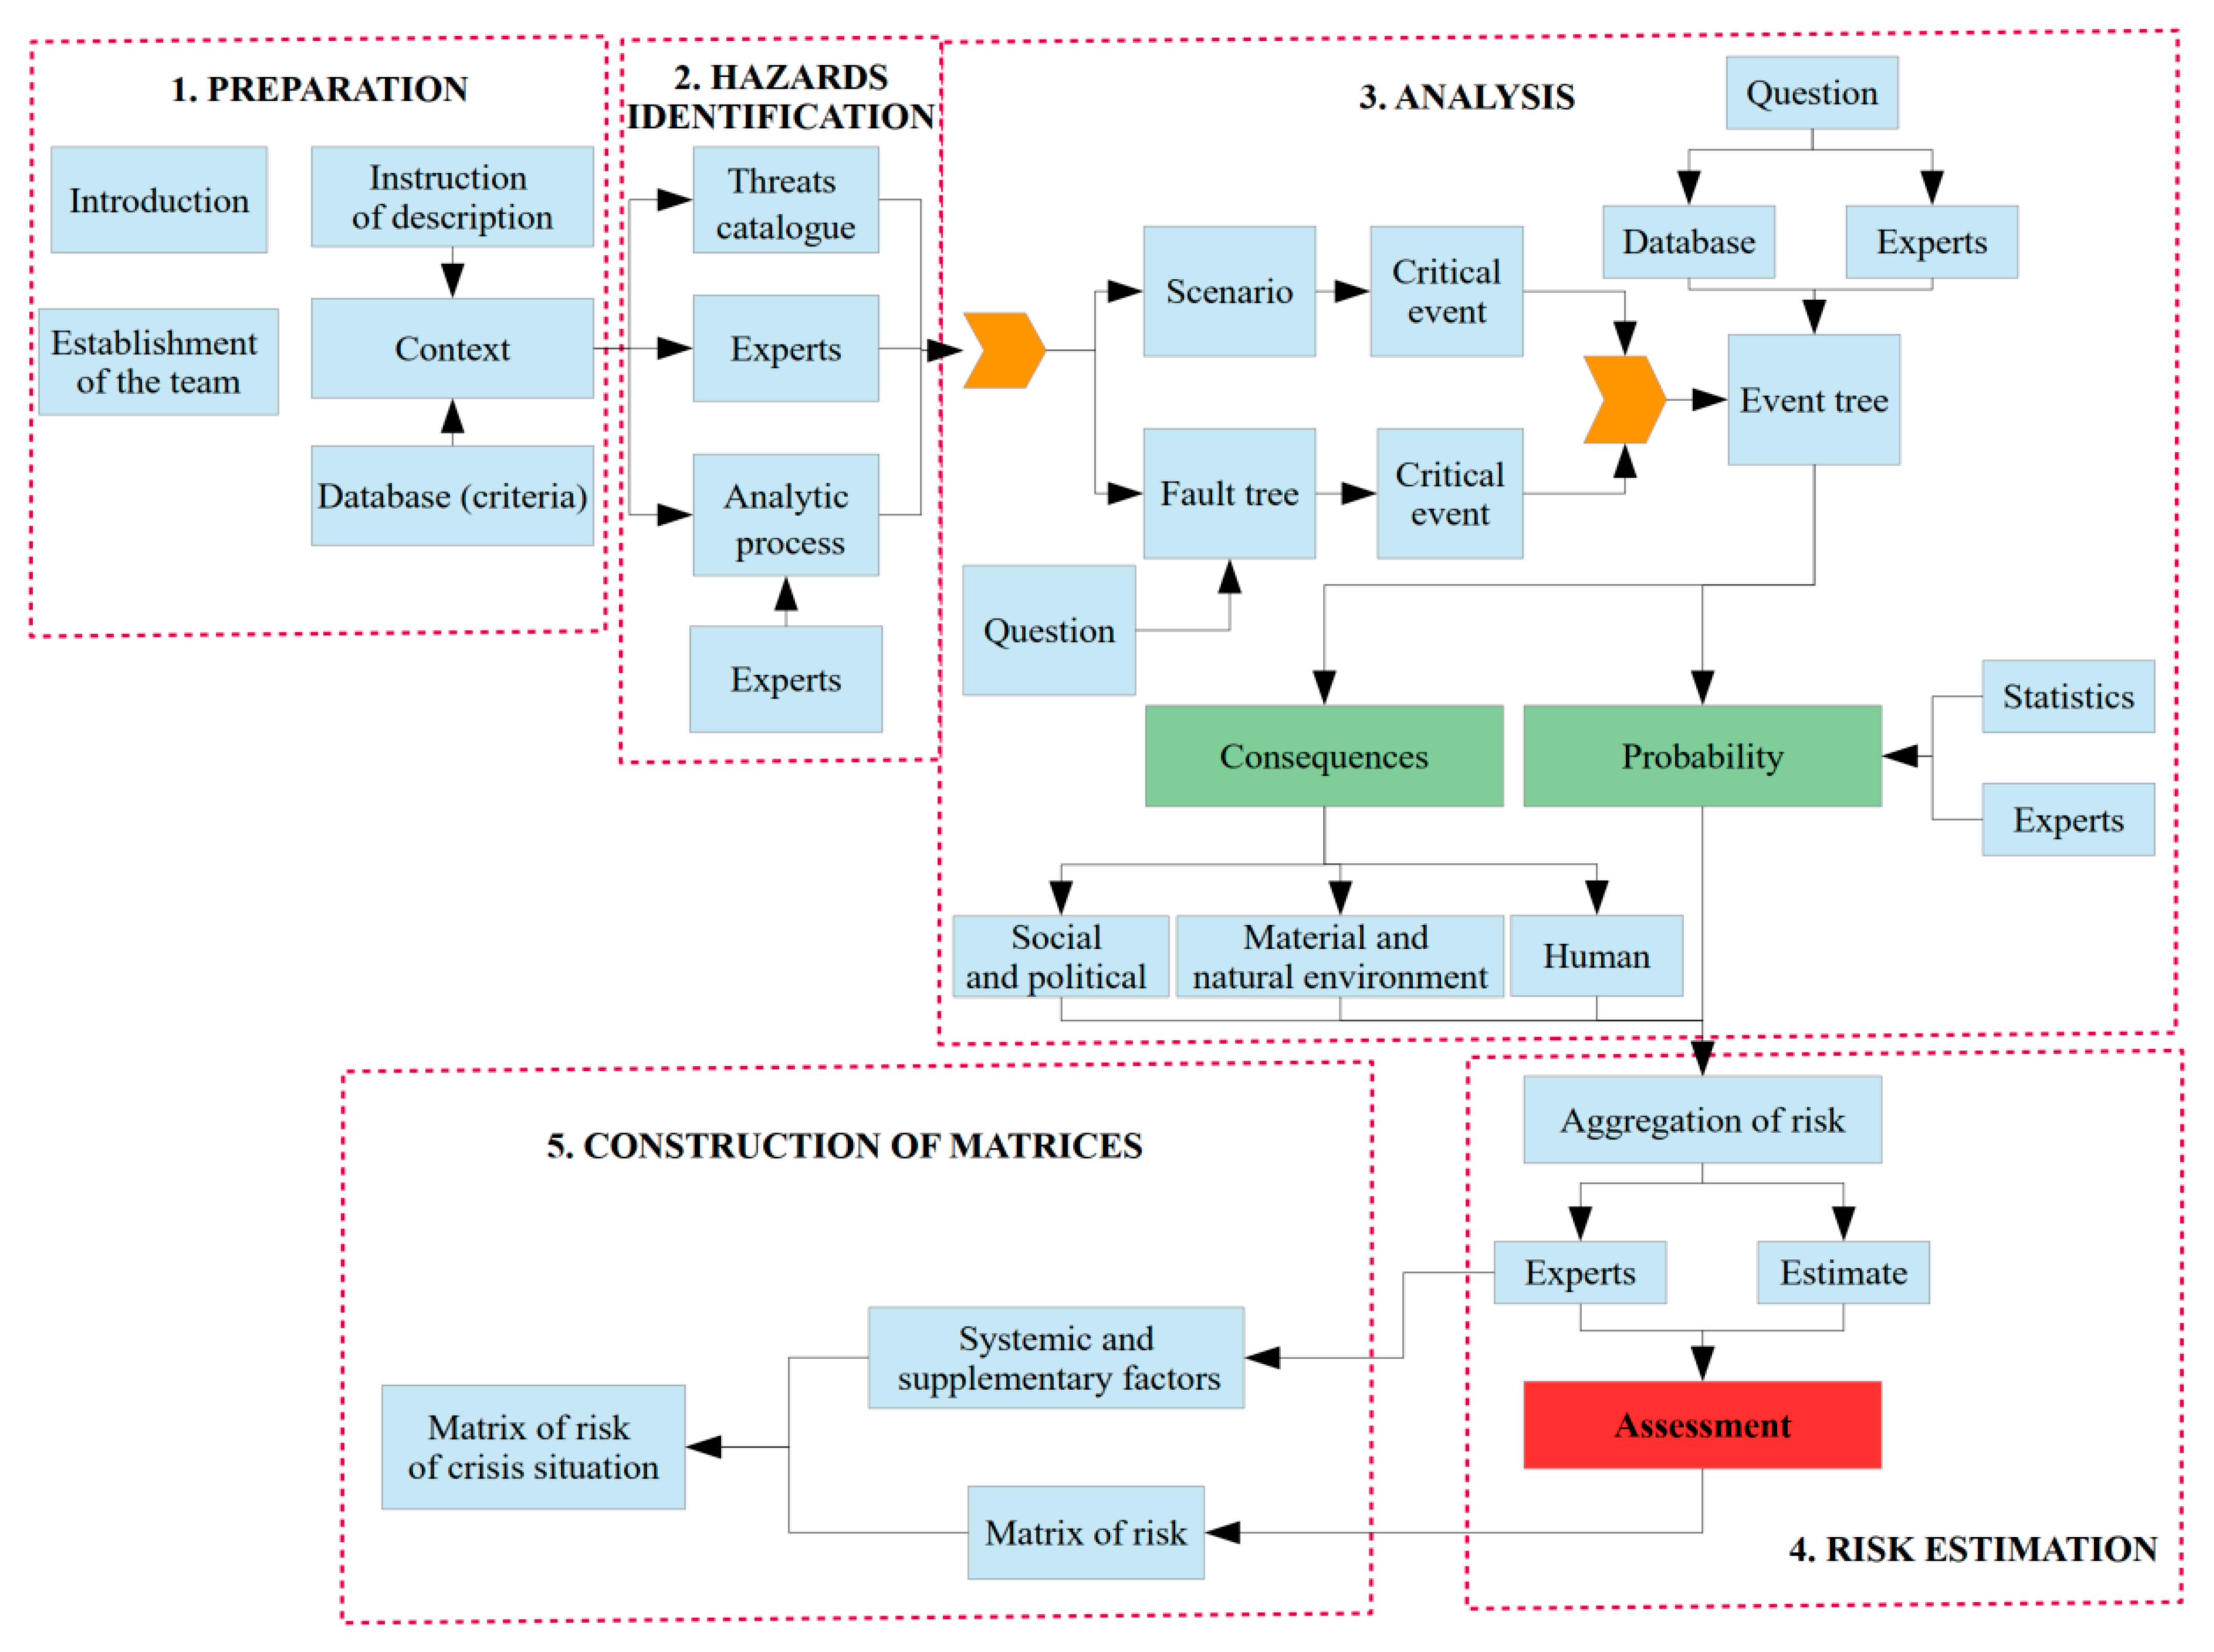
The risk assessment methodology described in this paper is a complex process that can be divided into five stages: preparation for risk assessment, hazard identification, processes related to risk analysis, risk estimation and illustrated assessment in the form of two matrices with criteria [24]. The different stages of risk assessment consist of many semi-dependent steps, which are presented in Figure 1.
The preparation for performing a risk assessment begins with the establishment of a team of risk assessment experts. The most important substantive action of this step is to describe the protected entity. A protected entity should be understood as any good that needs protection, including, in particular, human life and health, property, the environment, and the functioning of society, taking into account the critical infrastructure, the processes for the operation of the government on every level of management, and all other values important from a cultural or economic point of view. The description of the protected entity should include, in particular: information on the legal aspect, accounting for local laws and internal regulations, geographical location, administrative division, geographical characteristics (area and site description), characteristics of the local infrastructure, climatic characteristics, population description, description of specific facilities, description of critical infrastructure, responsiveness, and characteristics of the neighbors due to the possibility of a risk transfer.
The second stage of a risk assessment is hazard identification. This step is necessary for further risk analysis and for developing possible risk materialization scenarios. Identifying threats requires answering the question: What bad can happen? The actions to be taken for acquiring data to identify threats include:
- Statistical data analysis;
- Analysis of historical data;
- Expert evaluation;
- Field studies;
- Diagnosis of the environment;
- Field observations;
- Use of the catalog of threats available, among others, in crisis management plans.
The process of hazard identification leads to the next step—risk analysis. An important element of risk analysis is the construction of a descriptive scenario of the spread of threats. A descriptive scenario allows not only to realize the scale of a dynamic threat and its effects, but also the mutually related consequences of events (cascading succession of events, where the effects of one are the root causes of the next). This is useful for identifying the consequences, which are necessary for the qualitative and quantitative calculations that follow. The creation of a scenario should follow the worst-possible scenario principle. Construction of a descriptive scenario requires support in additional methods of data analysis collected during the hazard identification step, e.g., a fault tree or an event tree. The purpose of a fault tree or an event tree is to graphically present a logical string of consecutive events. This captures possible scenarios and states that occur during a dynamic event. Fault trees and event trees are applied to each sequence of events regardless of scale (municipality, state, and country). A detailed description of these methods can be found in [26].
Generally, risk analysis is based on the determination of two main values: probability and the consequences of the occurrence of an event for each threat scenario. As a result, the risk should be understood as the probability of occurrence for an adverse event with its effects in a given time:
Risk = Probability × Consequences
There are two categories for determining the probability of the occurrence for a dynamic threat. The first includes expert methods (foresight [27,28], Delphi method [29], brainstorming [30], or knowledge panel), while the second includes methods resulting from statistics and the history of dynamic threats occurring in a given area. Identification of potential sources of information is necessary to develop a risk assessment of floods. These are most often national protection systems, spatial information systems, e.g., geoportals of the water agencies, and flood risk maps (often interactive) created as a result of the implementation of the Floods Directive [5]. In this present report, the probability was determined in the moment of creation flood maps and is once per 500 year (see Section 3.2).
The consequences of hazard materialization may be grouped into three areas of impact: human, material and environmental, and sociopolitical effects. In each area of influence, there are criteria that are assessed. In the “human effects” area, the following indicators are assessed: number of dead, number of injured, and number of evacuees. The “material and environmental effects” are assessed by financial and natural environmental (understood as the affected surface of the environment) losses. In the group of “sociopolitical effects” disturbances of everyday life (“well-being”), duration of this disturbance, and duration of damage to critical infrastructure are assessed. In the risk impact assessment, it is extremely important to determine these realistically according to the adopted scenario and to compare them to scaled templates. The impact assessment based on these numerically evaluated criteria (taken, e.g., from simulation or different models) must be compared with the evaluation template of the specific criterion (included in Appendix A). After receiving the results corresponding to the appropriate impact category, the data are compared with a template that collects literal values corresponding to the individual numerical values. This approach makes it possible to compare the risk assessments of different threats and different scenarios with others.
In the risk assessment process, it is important to find and appoint methods that will help in a more accurate way to assess the hazard effects. Following this assumption, in order to estimate the number of deaths and injuries, the method described in [31] was used in this work and implemented as the methodology of risk assessment for crisis management. The overall estimation scheme of the method is shown in Figure 2. Based on the methodology, there are three main sets of characteristics that determine the degree of flood consequences [31]:
- Flood characteristics (hazard rating)—depth, debris, and velocity;
- Location characteristics (area vulnerability)—warning, nature of area/housing, and speed of onset;
- Population characteristics (human vulnerability)—age and health. An explanation of this step in the real example is described in Section 3. The above steps lead to the fourth stage of risk assessment—estimation.
Parallel with risk assessment, the systemic and supplementary factors should be assessed. Systemic factors are defined as system variables necessary to protect people from threats, e.g., health protection and other protective systems operated by governmental and local authorities. Supplementary factors, in turn, are defined as the sensitivity of the community to the threat, in conjunction with resilience [32]. Systemic factors should be linked with all systems built by the State to protect the security of its citizens. Supplementary factors, in turn, are related to the characteristics of the society and regions exposed to threats. They are linked with the vulnerability and resilience of society to an assessed threat. The aim of an assessment of systematic barriers is to estimate their reliability. The authors of the methodology assumed the general assumption that the State has a duty to ensure the security of its citizens. For this purpose, systems have been created (police, fire brigade, civil defense, etc.), whose task is to protect people and whose effectiveness is determined by statistics. The supplementary factors are used in the methodology to assess vulnerability (human and environment). In such an approach, vulnerability should be understood as a set of two elements: resilience and sensitivity [33]. In this way, the combination of resilience and sensitivity creates a vulnerability of society to disaster. Resilience and sensitivity are assessed by defined qualitative vulnerability factors, e.g., place of residence, physical fitness, social connections, age of society, and presence of critical objects. The relationship between systemic and supplementary factors results from the natural possibility of strengthening or weakening national security systems by community features.
The final stage of risk assessment methodology is risk illustration, in the form of two matrices, risk and crisis situation risk [24]. A risk matrix provides an illustration of the estimated effects and probabilities. In contrast, the crisis situation risk matrix compares the perceived risk to the assessment of systemic and supplemental factors.
3. Case Study
3.1. Characteristics of the Protected Entity
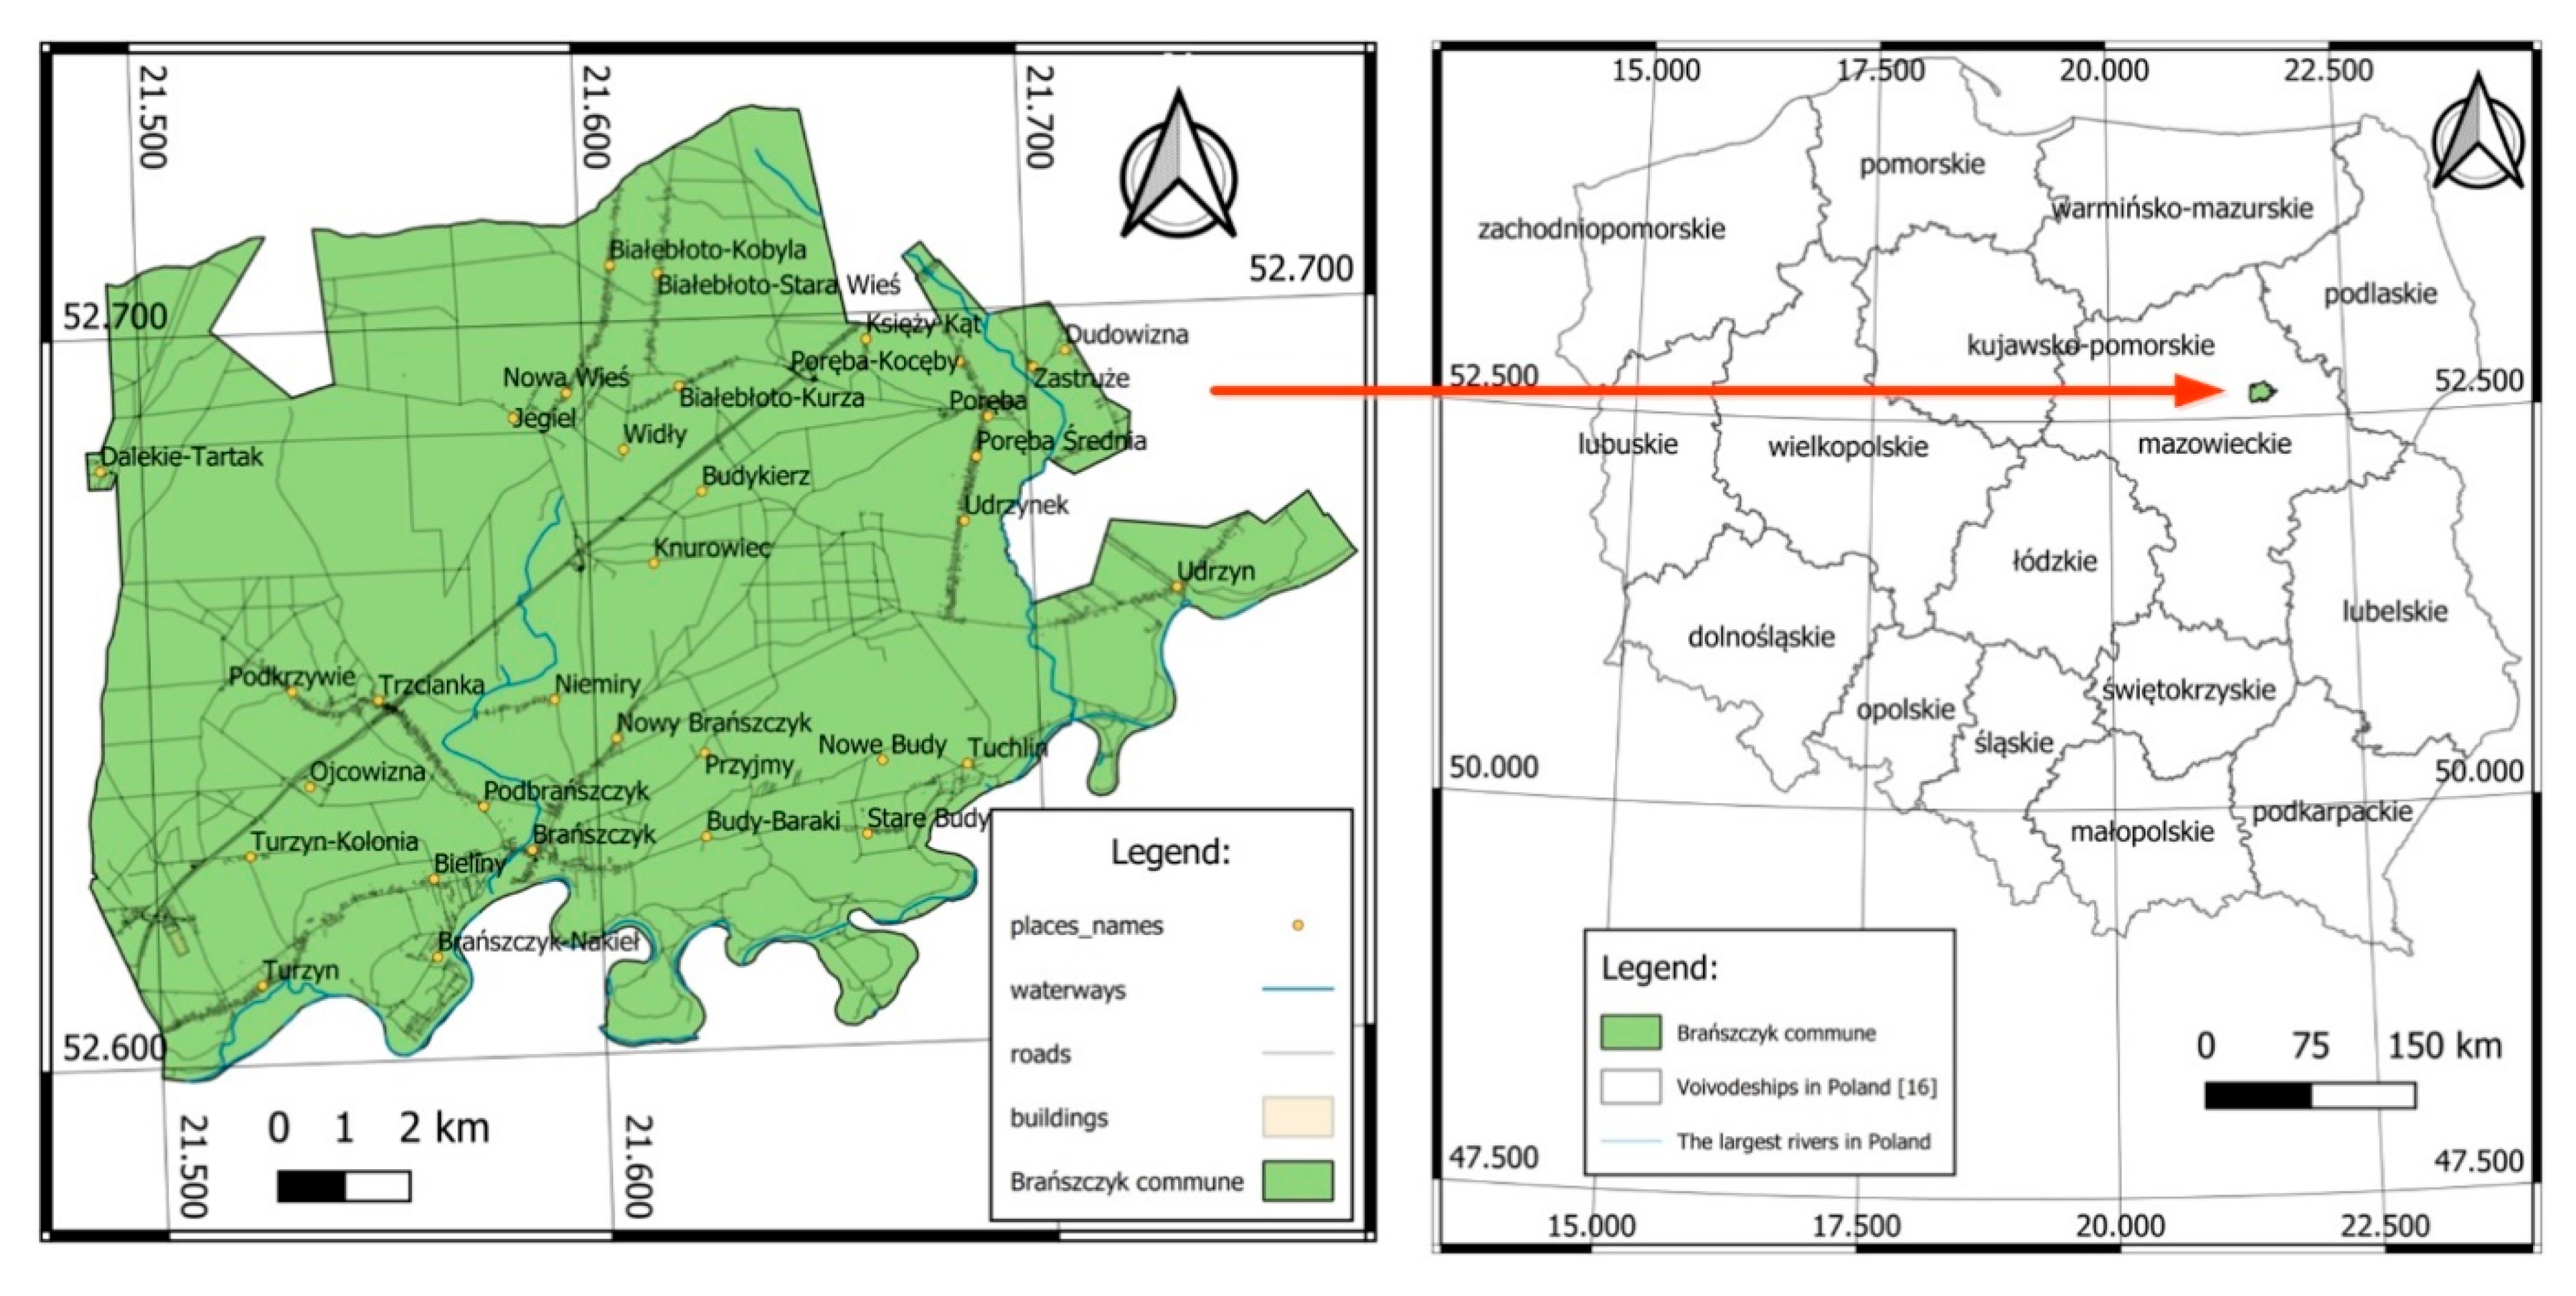
Brańszczyk is a rural municipality with a population of 8432 [34], and an average population density of 50 people/km2. Of the inhabitants of the municipality, 50.8% are women and 49.2% are men. The average age of the inhabitants of the municipality is 40.4 years [35]. The municipality has 21 villages and is adjacent to 10 other municipalities. In the territory of the municipality, there are important facilities that form the vulnerability under consideration: nine schools, two kindergartens, two health centers, two retirement homes, logistics centers, two churches, libraries, etc. The international road (S8) passes through the municipality of Brańszczyk. The municipality’s budget is approximately PLN 36 million and is devoted entirely to current cases. The Brańszczyk commune is located in the operational area of the State Fire Service district in Wyszków. There are nine volunteer fire brigades operating in the commune that are responsible for assuring local operational readiness. Figure 3 shows the location of the region at various scales.
3.2. Data Sources
In order to estimate the potential scope and probability of flood in the Brańszczyk commune, the following datasets were used: publicly accessible maps containing information such as digital terrain models, population in flood areas, number and type of buildings in flood areas (particularly public utility buildings), water depth in the risk area, and speed of the flood wave. In the case under consideration, these were maps developed as part of the creation of a national protection system—ISOK. The primary goal of this system is to create a new element to significantly improve the protection of society, economy, and the environment against the effects of floods and other extraordinary threats [36].
The interactive flood maps provide the opportunity to use many types of spatial information that are useful in the risk assessment process. For the purposes of the analyses conducted in this manuscript, the main sources of information were taken from flood risk and flood hazard maps. Flood risk maps provide access to information necessary for a risk assessment, such as river mileage, information on drinking water intake, culturally valuable facilities, industrial plants, sewage treatment plants and pumping stations, location of flood embankments, areas under special protection due to their advantages (e.g., nature, cemeteries, landfills), and land use classes. Flood hazard maps, in turn, allow for obtaining parameters that characterize the flood risk, such depth, water table elevation, embankment crown elevation, potential places of water overflow through the embankment (at a height of up to and above 20 m), and water velocity. All of this information is useful for carrying out risk assessment.
Despite the large amount of information available from various sources and statistical data, it is important to understand the characteristics of the area being analyzed in an effective risk assessment. In order to achieve the goals set out in this article, the authors made local visits to the Brańszczyk commune. This allowed the authors to draw attention to several important points concerning risk assessment that were not indicated in the publicly available data: e.g., the location of a nursing home for priests, military facilities, and critical local infrastructure facilities (water intake and sewage pumping stations).
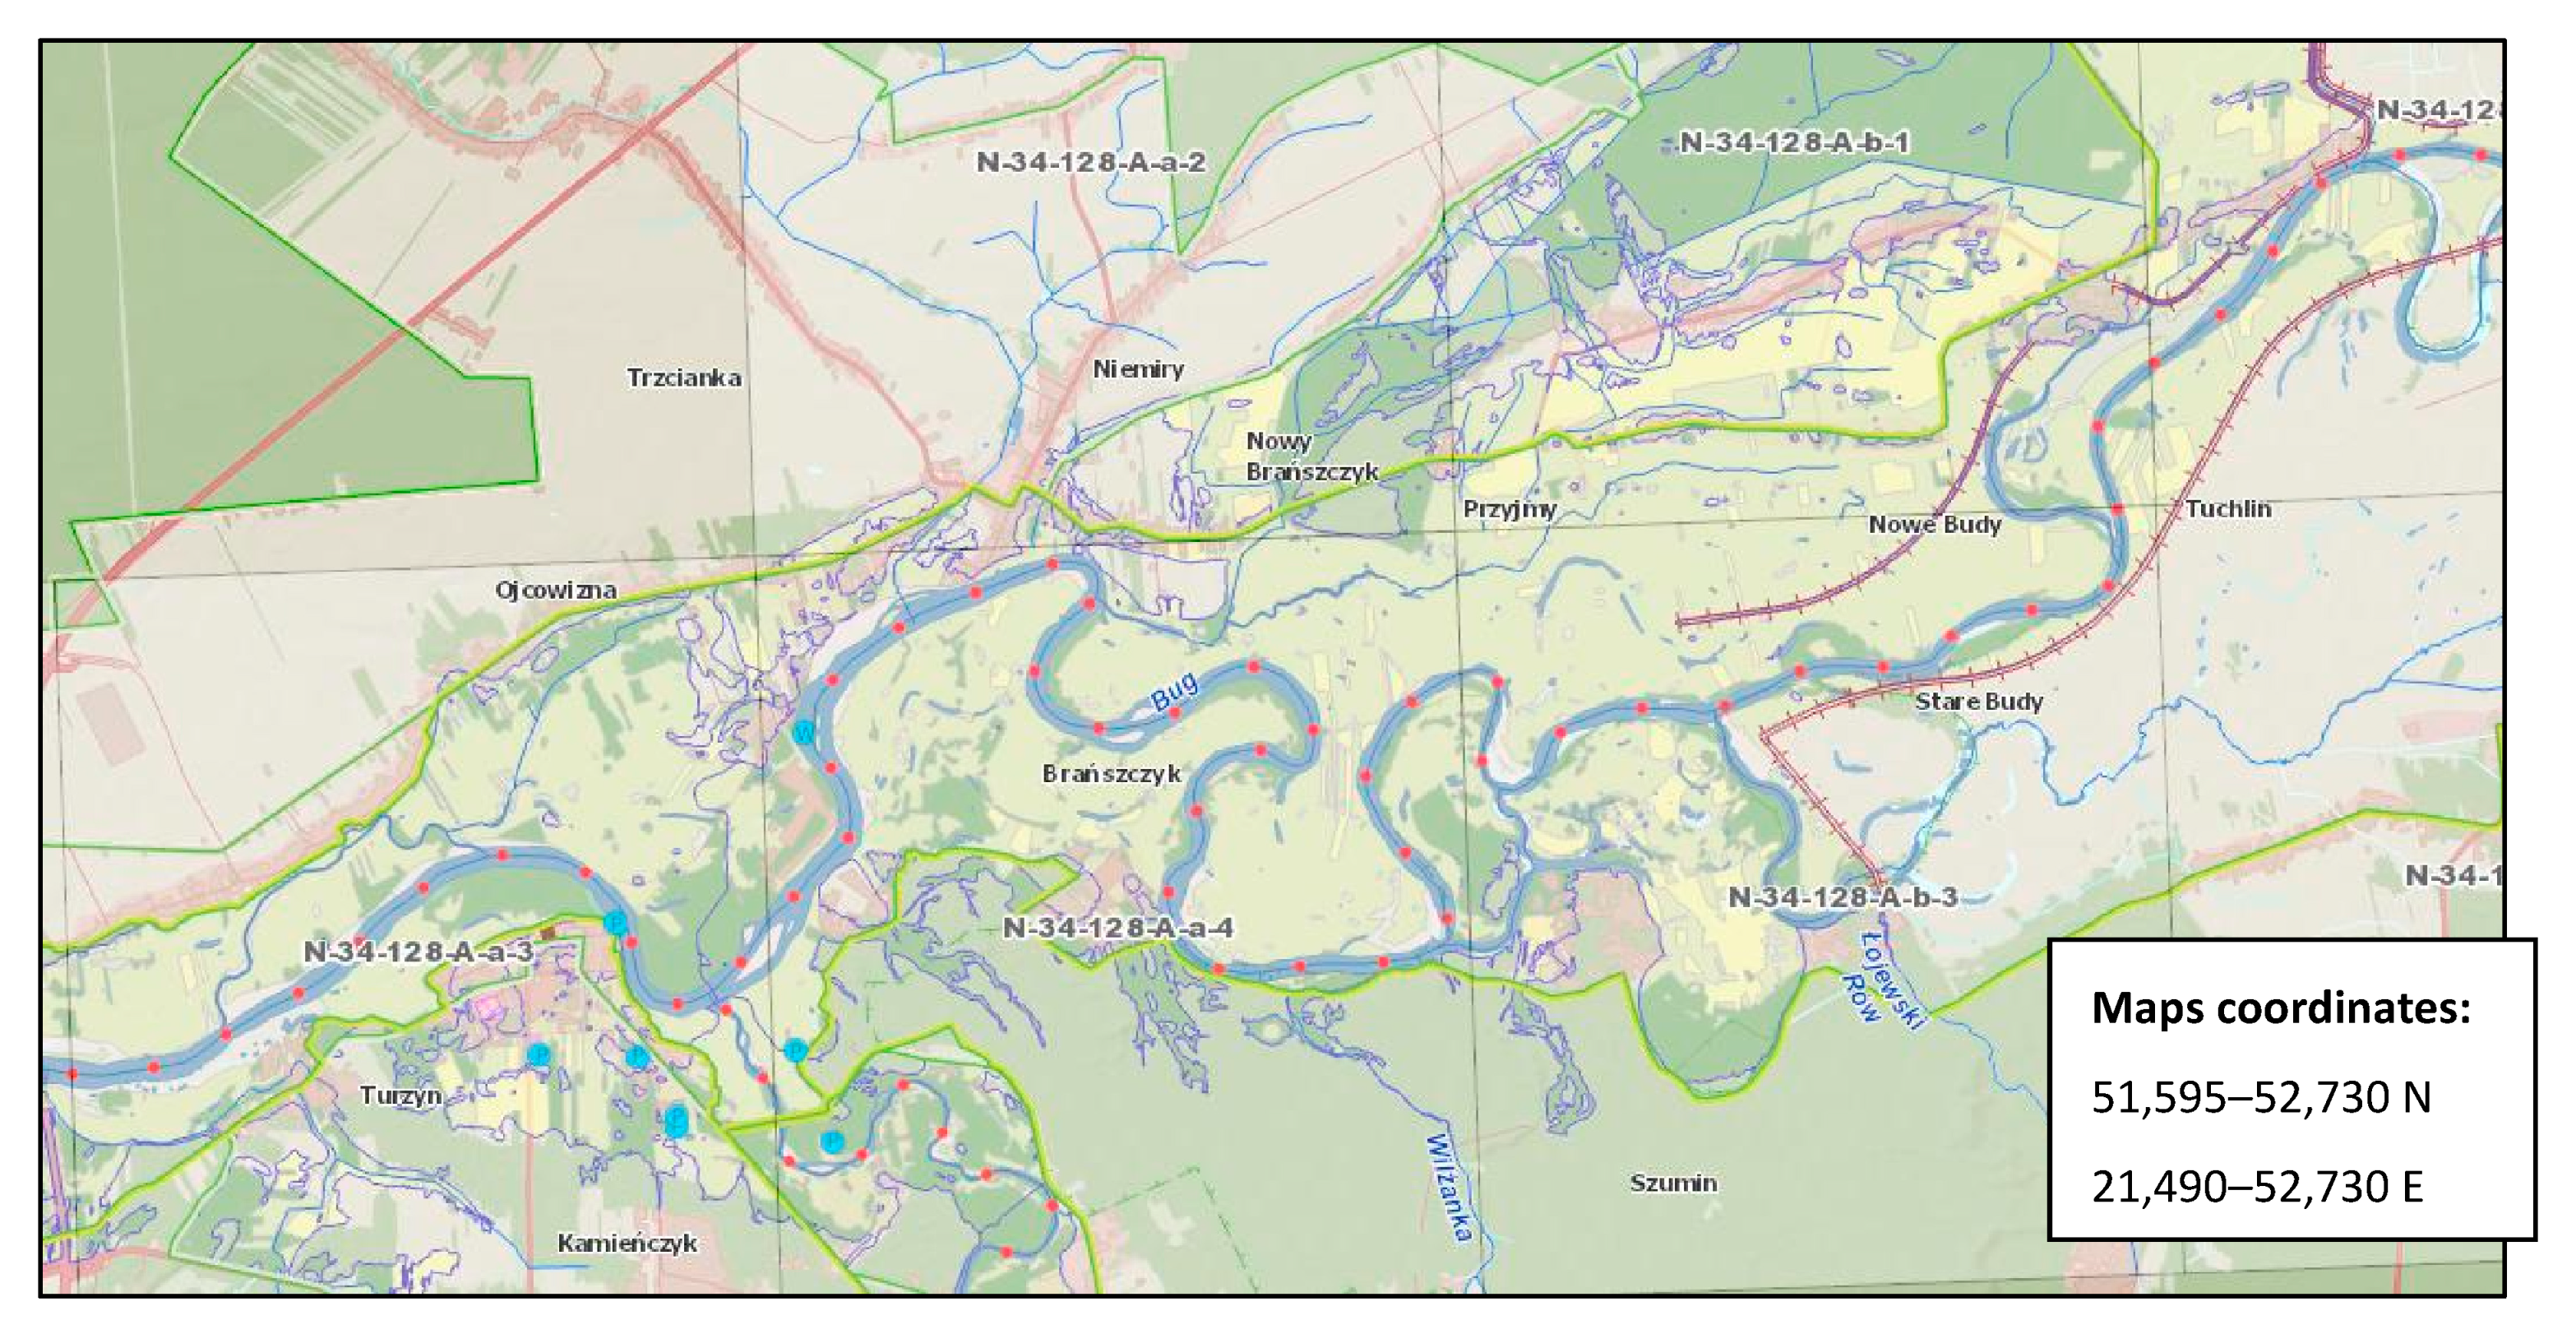
For the municipality of Brańszczyk, ISOK sheets (N-34-128-Aa-3, N-34-128-Aa-4, N-34-128-Aa-2, N-34-128-Ab-1, N-34-128-Ab-3, and N-34-128-Ab-2) were used, available from [37] (see Figure 4). During the assessment, the assumption was made of the most severe consequences that were still possible according to the “worst scenario” rule. This assumption resulted in scenarios with a flood probability of 0.2%, or once every 500 years, according to accepted ISOK simulations or a scenario of interruption of shafts.
3.3. Estimating Human Consequences
In order to determine the human consequences, the first step was establishing the number of people evacuated (according to Table A1, Appendix A). It must be assumed that all inhabitants are evacuated from the flooded area. Based on the data of the local commune office and the available map, the flooded area in question is inhabited by 834 persons [37]. Determination of the number of people at risk of flooding in the area was based on the sum of the people at risk of flooding from all villages located in the assessed administrative unit. The example of Brańszczyk municipality requires taking into account data from nine villages (see Appendix B).
Therefore, based on the risk assessment methodology [24], the number of evacuated persons was assigned the value A, which was taken into account in further steps of the risk assessment (Table A1, Appendix A). In the estimation studies, it was assumed that floods are not a threat that cause many months of dysfunction in the infrastructure; therefore, it was assumed that evacuation would last less than six months.
The next step was the estimation of the number of injuries and fatalities, according to the method described in [31]. For the calculations, it was necessary to estimate the population depending on the distance from the river. For this purpose, the data regarding the population and the average distance of the town from the river bank were used, both of which were obtained from the flood risk maps (in this case ISOK system). In the case of the Brańszczyk commune, these data are shown in Appendix B.
In the first phase of the evaluation of the number of injured and fatal persons was carried out by an assessment of the hazard ratio (HR). Hazard ratio can be understood as the degree of risk caused by a flood event, resulting from the features characterizing the flood risk. To assess the risk of hazard from a flood, it is necessary to take into account three variables:
- Depth;
- Speed of the flood wave;
- Contaminated debris factor (DF) (scale: 2 = certain, 1 = possible, 0 = impossible).
All calculations were made in relation to the distance from the river bank. To assess how many people are at what distance from the river, it was necessary to apply a simplification consisting in estimating the distance from the river to individual villages and taking into account the number of people at risk of flood in these areas (see Appendix B). The water depth and wave speed were also determined on the basis of information related to the distance from the river. The results of the calculation for the commune of Brańszczyk are shown in Table 1.
Next, it was necessary to assess the vulnerability of the area where threats occur. This was carried out on the basis of three variables: characteristics of the flood area, speed of the emergence of a threat, and warning in the event of a flood. The description of the individual points characterizing a flood area is included in Table 2. The area vulnerability (AV) scores for the Brańszczyk commune are presented in Table 3.
Having calculated the AV and HR values, it is possible to calculate the percentage of people in the analyzed areas exposed to flood risk and the total number of exposed people (see Table 4).
The last step was to calculate the number of deaths and injuries. This was achieved by multiplying the number of people exposed to a flood risk (N(ZE)) by a Y factor, based on the vulnerability of the people. Y is a function of two parameters: the presence of very elderly people and those at increased risk of disability or disease [31]. Table 5 shows the scale together with a description of the individual elements of the sensitivity assessment. The value of the Y factor generated for the Brańszczyk commune is shown in Table 6.
The number of people exposed to a flood risk multiplied by the value of Y leads to the number of people injured as a result of floods. The number of deaths was calculated by multiplying the number of people injured by the death rate being twice the HR factor [31] (see Table 7).
As with the assessment of the number of evacuated people, in the next step, the injury and death values should be compared, as per [31], with the template derived from the national risk assessment methodology for crisis management (MOR) [24] (see Table A2 and Table A3 of Appendix A). This allows the letter value of injured and fatal persons to be determined based on categories F and B, respectively.
3.4. Estimating the Material and Environmental Losses
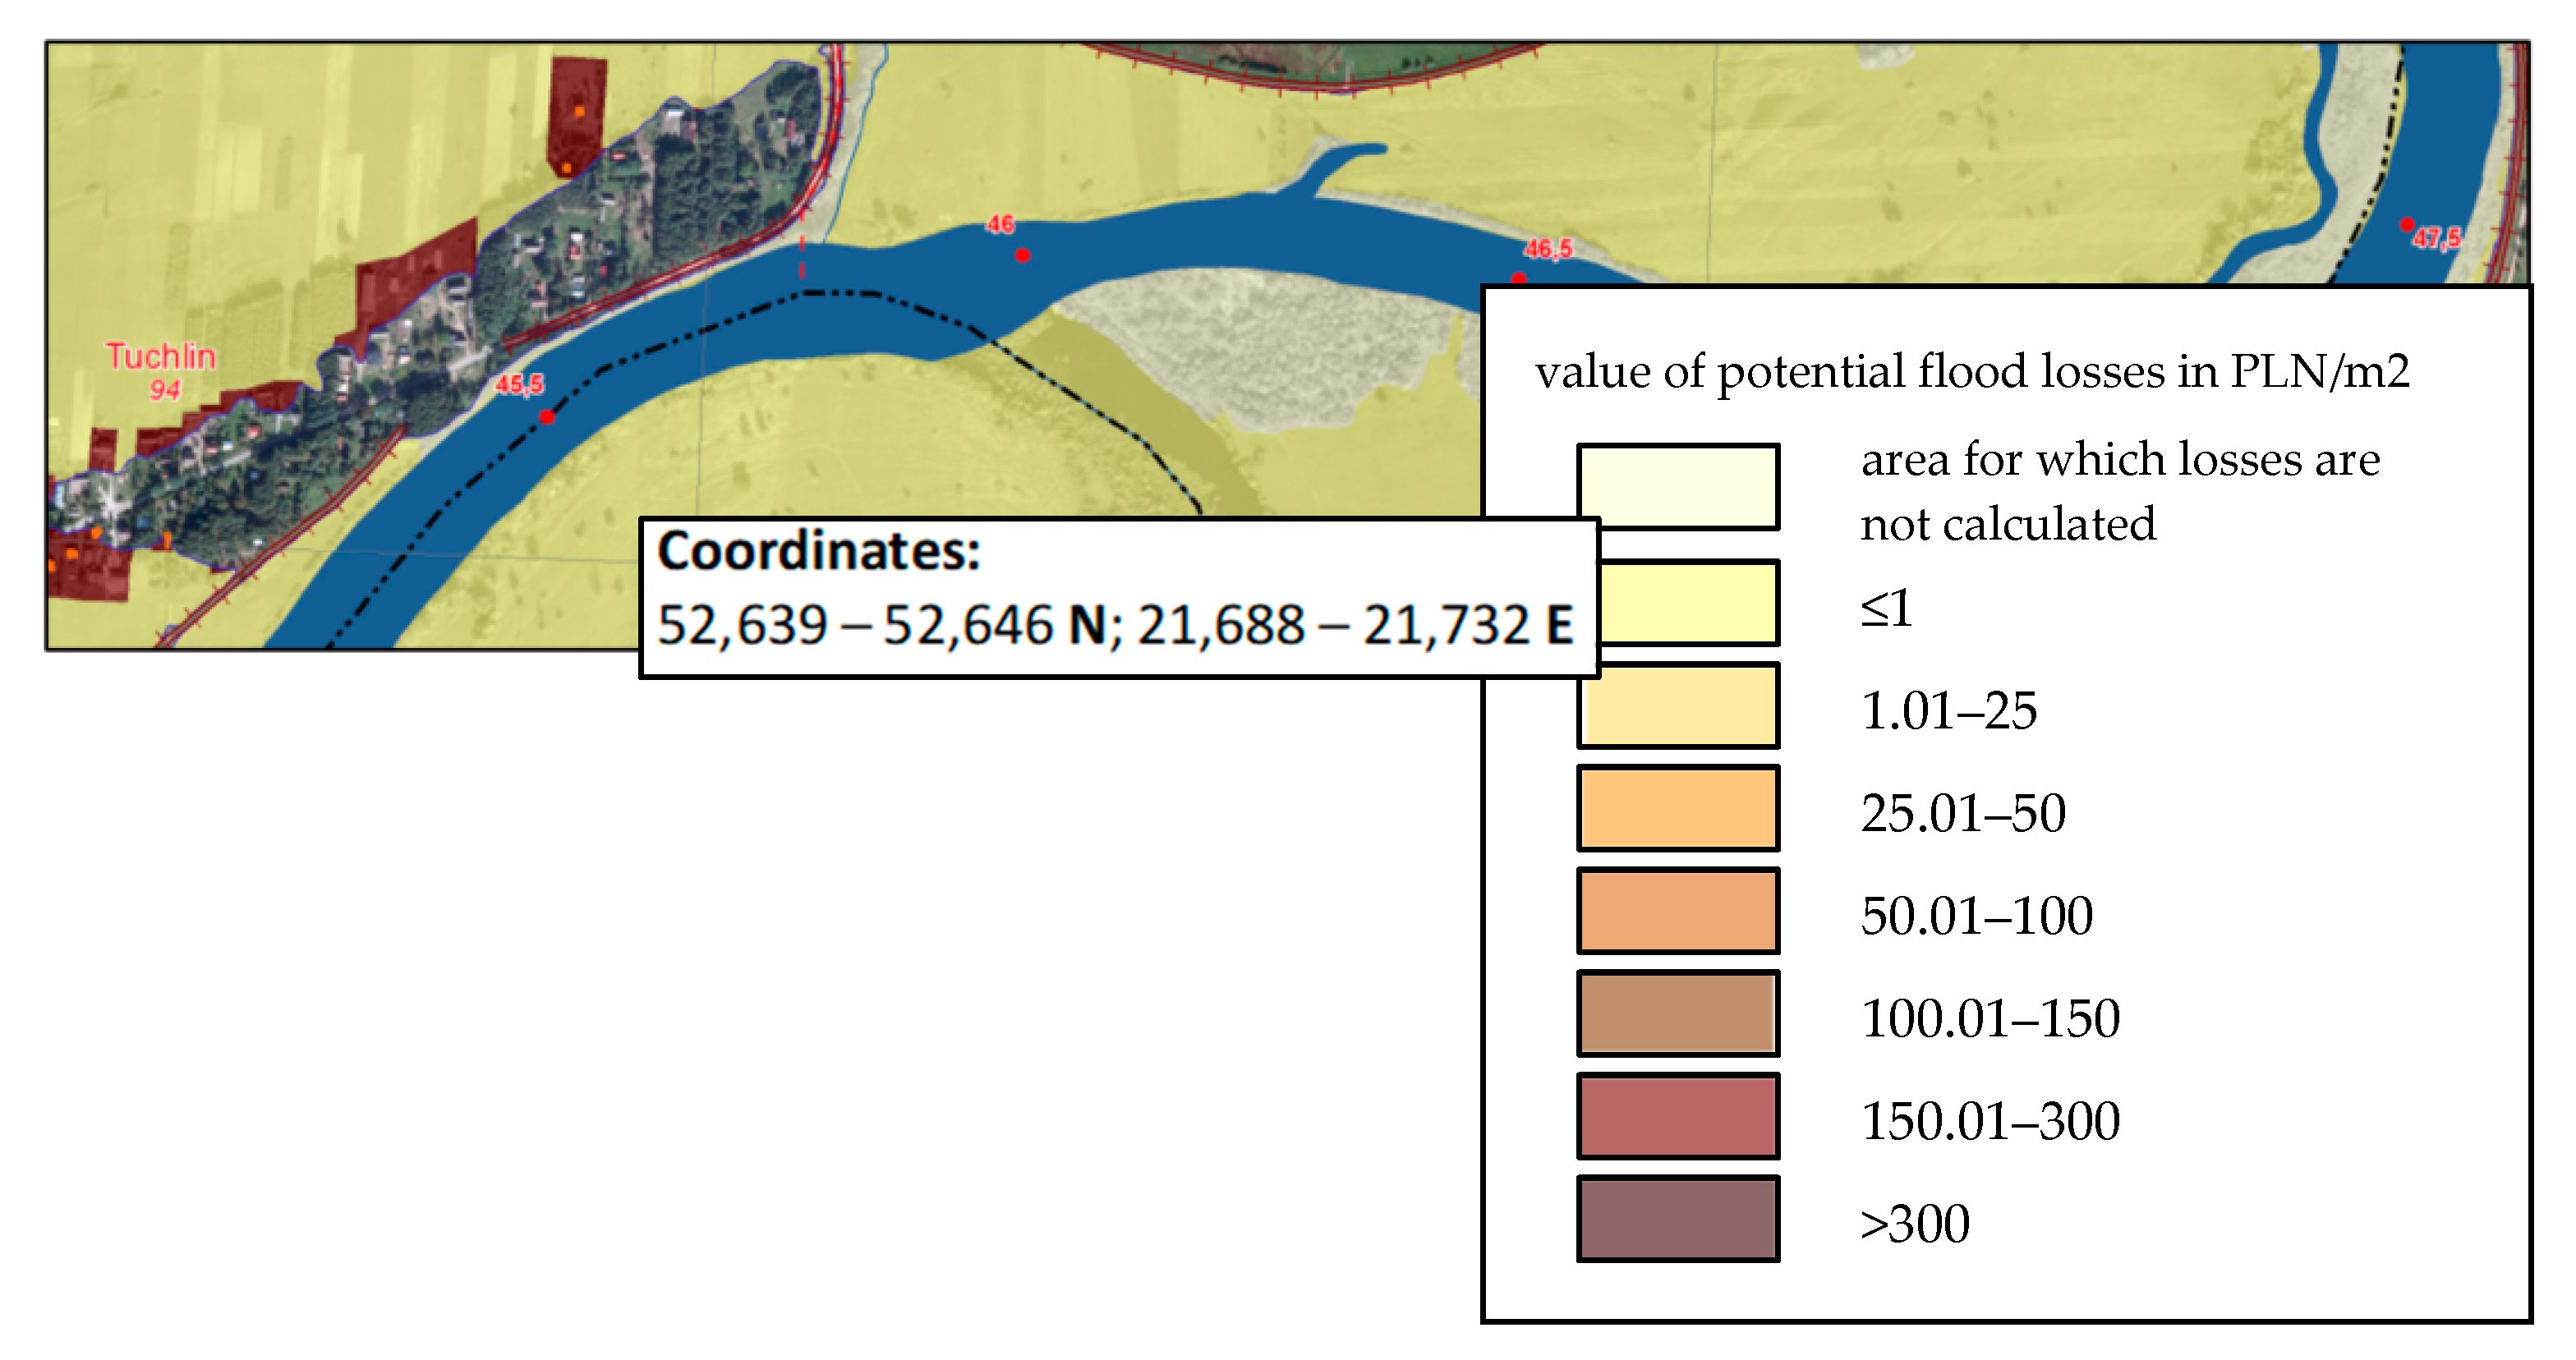
In order to calculate the material losses incurred as a result of floods, the same ISOK maps should be used as for the assessment of human losses (see Figure 5). To calculate the value of losses, it was necessary to estimate the area of flooded areas whose potential material losses were <1, 1.01–25, 25.01–50, 50.01–100, 100.01–150, 150.01–300, and >300 PLN/m2. For example, the estimated area of the commune Brańszczyk affected by flood is approximately 5,156,900 m2, which provides the results shown in Table 8.
Then, the total result obtained should be compared to the budget of the entire commune (refer to Table A4 in Appendix A) indicated in the methodology. For the Brańszczyk commune, taking into account the lowest loss price per square meter given in the ISOK maps results in 34.5% of the budget available to the commune (PLN 25,025,128 per year) [36].
Analyzing the environmental losses, the ISOK map named “Flood risk map—negative consequences for the environment, cultural heritage, and economic activity” should be used. From this map, the maximum surface area in the environment that may be damaged by a flood can be estimated. Next, the area of losses in the environment should be compared to the area of the entire municipality and, finally, to the template from MOR.
For the Brańszczyk commune, the area of environmental losses is approximately 5.15 km2, which is approximately 3% of the area of the commune. In addition, there are no landfills, chemical plants, or other facilities in the commune, affording an expert the chance to assess the consequences to the environment as less than one year (see Table A5, Appendix A).
3.5. Estimating of Sociopolitical Losses
Flood risk analysis forces assessors to estimate sociopolitical effects. Thus, the effects of this methodology should be assessed by an expert method.
Assessment of everyday life disruption, called “well-being,” should assess the following assessment indicators:
- People are unable to communicate through the regular use of IT systems;
- People are unable to travel to work and/or school;
- People do not have access to important public services;
- People cannot buy items that are most needed;
- Loss of functions arising from the competence of the individual;
- Damage to critical infrastructure systems.
These assessed factors can be found in Table A6 of Appendix A. Simulation of the results for the case under study is given in Table 9.
In the next step, it is necessary to assess what percentage of the population living in the commune may be affected by disruptions of life. It should be assumed that all residents of the villages living in flood-prone areas will be affected by everyday disruptions (see Table 10). Information on the current number of inhabitants of individual towns should be available on the commune’s website.
By comparing the total received to the total number of people living in the commune, the percentage of people affected by daily disruptions was calculated. For the Brańszczyk commune, 2858/8220 = 35% (see Table A7 from Appendix A)
In the last step, an expert method should be used to assess how long critical infrastructure facilities in the area at risk of flooding may remain damaged (refer to the results in Table A8, Appendix A).
3.6. Aggregation of the Consequences, Probability and Risk Matrix
Taking the next steps in the assessment of the consequences of flood risk requires collating all data in one place; this facilitates the aggregation of effects. Aggregation of effects consists of determining the weights for individual categories of effects. The weights are determined by an expert method and are a response to the need arising from the comparison of effects on people (considered more significant) with material losses (potentially less significant).
For Brańszczyk, an assumption was made, as shown in Table 11.
The aggregated results for the example under consideration was 10.7. According to the methodology assumptions, this result raised the first value, which, in the indicated case, provided the value E. The letter values of the effects and the corresponding numerical values are presented in Table 12.
Due to the availability of data, in the scenario considered, we accounted for a flood occurrence once every 500 years. According to the principle, the worst possible scenarios are considered, but the data that present the most severe effects (for a probability of 0.02%) are still real. At this point, the division indicated in the risk assessment methodology should be used, which indicates five classes of probabilities:
- Almost certain events (more than once a year),
- Very likely events (1–5 years),
- Probable events (5–10 years),
- Unlikely events (10–100 years),
- Very rare events (>100 years).
According to the cited probability classes, the probability assumed for the Brańszczyk commune is in the fifth grade range. The combination of the calculated values of effects and the indicated probability provides the possibility of creating a risk matrix. The risk matrix is a visualization of the values obtained that indicates the extent of the risk. For the example considered, the calculations indicate a catastrophic risk case (see Table 13).
4. Discussion
National risk assessments are now required European Union countries through the regulation accepted on 2013 on a Civil Protection Mechanism [6], meaning Member States must develop general risk assessment methods that can be applied to a wide range of risks. This approach contributed to the creation of the method briefly described in the methodology section. Nevertheless, each threat has its own specificity. Many threats are also considered in numerous international studies through the prism of the effects they can cause. These two approaches allowed combining, with the present article, the Polish risk assessment methodology, which is a detailed method for assessing the effects of floods and commonly available IT tools. The current assessments do not quantify the damage in detail [39], which emphasizes the need for methods that support the risk analysis process.
The Brańszczyk commune example specifically shows the process of calculating the level of risk. The value obtained, which placed the commune in the scale of catastrophic risk, was a result of several reasons. First, in the area where flooding can occur, there are facilities susceptible to threats, i.e., schools and kindergartens. Second, the characteristics of the population indicate that people with reduced mobility may constitute a large percentage of the population, which is due to the existence of two homes for the elderly, a special school, and numerous kindergartens. This level of risk forces decision-makers to take action to counteract the threat, i.e., the use of nonstandard resources and additional forces and measures, making quantitative expert assessments (e.g., related to assessing the condition of levees), and consulting specific crisis management teams. Moreover, the problem requires research related to threat scenarios and the determination of vulnerabilities on which they are based. The decisions for change depend on changes in the options available for managing a flood situation, in the risk perceptions and attitudes toward risk [40], and on the performance of policy coordination, which should be based on multisectoral risk analysis [41] and should form the basis of the decision.
The assessment method presented is burdened with its sensitivity. It is associated with risk aggregation, where some of the assessed elements receive more importance than others. Linking risk aggregation with a high assessment of individual effects may lead to a situation in which a slight change in the calculation parameters may significantly affect the value of the estimated risk. In the present case, the most serious was the assessment of fatalities and injuries. The high rating of this parameter affected the final value of risk to a large extent. In turn, it can be elevated more generally by factors that are not directly related to the flood (e.g., area vulnerability). This poses an extremely difficult task for assessors and decision-makers, who must properly present the results obtained and implement them in practical, appropriate plans.
5. Conclusions
The methodology and supported methods used in this paper were constructed based on traditional methods and available public data. The methodology of risk assessment for crisis management in Poland shows the general concept for risk assessment, which is supported by methods to estimate human consequences. For all assessment processes, the main source of data is flood risk maps of different configurations developed as a result of implementation of the Directive 2007/60/EC of the European Parliament and of the Council of 23 October 2007 on the assessment and management of flood risk. The conducted studies show how to use more and more common and generally available threats maps and risk maps containing already processed data produced with the use of professional simulation tools and computational models. However, it should be taken into account that both the threat maps and the risk maps in the form of IT systems should be treated only as a source of data, as they present the consequences for a specific probability of a threat. They do not estimate the value of risk that would constitute a premise for taking actions by crisis management stakeholders. Only the use of an appropriate risk assessment methodology allows for comparing the effects with the probability, which may be important from the point of view of the district authorities and their decisions, e.g., related to investments.
The case study for the Brańszczyk commune showed that the risk of a flood disaster using this method is catastrophic, which can form many action lines for a specific example. The flood risk assessment developed along the Bug River in the Brańszczyk commune determines the needs of local planning and shows the directions of action in the field of flood risk prevention. Contrary to risk assessment methodology in the basic version, which is based on expert opinion, this work showed calculation possibilities to support the risk assessment process.
The multifactors approach, the combination of local knowledge, and the proposed techniques used to assess the level of risk presented in this case study may inspire other regions to carry out a similar accurate risk assessment, and to verify the proposed assessment techniques or the scaling of selected parameters proposed in the article. All of this could help to create the next steps of the crisis management process during a flood, such as flood security policy or procedures of crisis response.
Author Contributions
Conceptualization, A.B. and K.B.; methodology, A.B.; validation, A.B. and K.B.; formal analysis, A.B.; resources, A.B.; data curation, A.B.; writing—original draft preparation, A.B.; writing—review and editing, K.B.; visualization, A.B. and K.B.; supervision, A.B. and K.B. All authors have read and agreed to the published version of the manuscript.
Funding
This research received no external funding.
Institutional Review Board Statement
Not applicable.
Informed Consent Statement
Not applicable.
Data Availability Statement
Not applicable.
Acknowledgments
The authors would like to acknowledge the National Center for Research and Development, for their financial support for the project “Methodology of risk assessment for the purpose of crisis managements systems in the Republic of Poland”, agreement number DOBR/0077/R/ID3/2013/03.
Conflicts of Interest
The authors declare no conflict of interest.
Appendix A. Templates of the Estimated Consequences

Table A1.
Number of evacuated people [24].
Table A1.
Number of evacuated people [24].
| Number of Persons → | <100 | 100–1000 | 1000–10,000 | 10,000–100,000 | >100,000 |
|---|---|---|---|---|---|
| Time ↓ | |||||
| <6 months | A | A | B | C | D |
| >6 months | A | B | C | D | E |
Table A2.
Number of deaths [24].
Table A2.
Number of deaths [24].
| Number of Persons → | 1 | 2–5 | 5–10 | >10 |
|---|---|---|---|---|
| Time ↓ | ||||
| Direct (first year) | C | D | E | F |
| Increased (within 20 years) | A | A | B | C |
Table A3.
Number of injuries [24].
Table A3.
Number of injuries [24].
| Number of Persons | <10 | 10–100 | 100–1000 | 1000–10,000 | >100,000 |
|---|---|---|---|---|---|
| Category | A | B | C | D | E |
Table A4.
Percentage of the commune budget [24].
Table A4.
Percentage of the commune budget [24].
| Price as % of Budget | <1 | 1–5 | 6–10 | 11–30 | 31–60 | >60 |
|---|---|---|---|---|---|---|
| Category | A | B | C | D | E | F |
Table A5.
Damage area as a percentage of the affected region [24].
Table A5.
Damage area as a percentage of the affected region [24].
| Damage Area (% of Affected Region) → | <1 | 1–5 | 6–10 | >10 |
|---|---|---|---|---|
| Time of Recovery (Years) ↓ | ||||
| <1 | A | B | C | D |
| >1 | B | C | D | E |
Table A6.
Assessment of the everyday life disruption [24].
Table A6.
Assessment of the everyday life disruption [24].
| Risk Impact Level → | Low | Medium–Low | Medium | Medium–High | High | Extremely High |
|---|---|---|---|---|---|---|
| Type of Process Disruption ↓ | ||||||
| Lack of communication through regular ICT systems | b | c | d | e | e | f |
| No possibility of traveling to school or work | a | b | c | d | e | f |
| No access to important public services | a | b | c | d | e | f |
| Inability to buy the necessary items | b | c | d | d | e | f |
| Loss of at least one function arising from the competence of the individual | b | c | d | e | f | |
| Damage to one of the critical infrastructure systems | b | c | d | e | f |
Table A7.
Percentage of people affected by daily disruption [24].
Table A7.
Percentage of people affected by daily disruption [24].
| Number of People (%) → | <1 | 2–5 | 6–10 | 11–30 | 31–60 | >60 |
|---|---|---|---|---|---|---|
| Time ↓ | ||||||
| Less than one week | A | B | C | D | E | F |
| One week–one month | B | C | D | E | F | |
| More than one month | C | D | E | F |
Table A8.
Duration of critical infrastructure damage [24].
Table A8.
Duration of critical infrastructure damage [24].
| Duration of Damage | Less Than One Day | One Day–Three Days | Three Days–One Week | One Week–One Month |
|---|---|---|---|---|
| Category | A | B | C | D |
Appendix B. Data Available for Risk Assessment
Table A9.
Data of the area considered in the research.
| Name of the Village | Number of People in the Risk Area (Data Prepared Based on [34]) | Average Distance of a City from the River (M) | Number of People Affected by Everyday Life Distribution (All Residents of the City) (Data Prepared Based on Local Authority Data from December 2020) |
|---|---|---|---|
| Brańszczyk | 380 | 200 | 1110 |
| Brańszczyk Nakieł | 30 | 100 | |
| Bieliny | 41 | 200 | |
| Przyjmy | 40 | 1800 | 252 |
| Turzyn | 71 | 800 | 765 |
| Stare Budy | 94 | 600 | 185 |
| Nowe Budy | 65 | 1200 | 296 |
| Budy Baraki | 19 | 1000 | |
| Tuchlin | 94 | 100 | 226 |
| Total | 834 | 2834 |
References
- Kundzewicz, Z.W.; Kanae, S.; Seneviratne, S.I.; Handmer, J.; Nicholls, N.; Peduzzi, P.; Mechler, R.; Bouwer, L.M.; Arnell, N.; Mach, K.; et al. Flood risk and climate change: Global and regional perspectives. Hydrol. Sci. J. 2014, 59, 1–28. [Google Scholar] [CrossRef] [Green Version]
- Kundziewicz, Z.W. Flood protection—Sustainability Issues. Hydrol. Sci. J. 1999, 44, 559–571. [Google Scholar] [CrossRef]
- van Herk, S.; Rijke, J.; Zevenbergen, C.; Ashley, R. Understanding the transition to integrated flood risk management in the Netherlands. Environ. Innov. Soc. Transit. 2015, 15, 84–100. [Google Scholar] [CrossRef]
- Jonkman, S.N. Loss of Life Estimation in Flood Risk Assessment. Theory and Applications. Master’s Thesis, Delft University of Technology, Delft, The Netherlands, 2007. [Google Scholar]
- European Parliament and of the Council. Directive 2007/60/EC of the European Parliament and of the Council of 23 October 2007 on the Assessment and Management of Flood Risks 2007. (OJ L 288, 6.11.2007, pp. 27–34). Available online: https://eur-lex.europa.eu/eli/dir/2007/60/oj (accessed on 28 November 2021).
- Decision No 1313/2013/EU of the European Parliament and of the Council of 17 December 2013 on a Union Civil Protection Mechanism. Available online: https://eur-lex.europa.eu/legal-content/EN/TXT/?uri=celex%3A32013D1313 (accessed on 11 September 2021).
- Ekmekcioğlu, Ö.; Koc, K.; Özger, M. District based flood risk assessment in Istanbul using fuzzy analytical hierarchy process. Stoch. Environ. Res. Risk Assess. 2020, 35, 617–637. [Google Scholar] [CrossRef]
- Kanchan, M.; Rajiv, S. Flood risk assessment in the Kosi megafan using multi-criteria decision analysis: A hydro-geomorphic approach. Geomorphology 2020, 350, 106861. [Google Scholar]
- Eriksson, J.; Juhl, A.K. Guide to Risk and Vulnerability Analyses; Swedish Civil Contignencies Agency (MSB): Karlstad, Sweden, 2012. [Google Scholar]
- Federal Office of Civil Protection and Disaster Assistance. Method of Risk Analysis for Civil. Protection; Federal Office of Civil Protection and Disaster Assistance: Bonn, Germany, 2011. [Google Scholar]
- National Directorate for Fire and Emergency Manage. A Framework for Major Emergency Management; National Directorate for Fire and Emergency Manage: Dublin, Ireland, 2010. [Google Scholar]
- Public Safety Canada. All Hazards Risk Assessment Methodology Guidelines 2012–2013; Public Safety Canada: Ottawa, ON, Canada, 2012. [Google Scholar]
- Ministry of Security and Justice. Working with Scenarios, Risk Assessment and Capabilitiesin the National Safety and Security Strategy of the Netherlands; Ministry of Security and Justice: The Hague, The Netherlands, 2014.
- Cabinet Office. National Risk Register; Cabinet Office: London, UK, 2021.
- Hall, J.W.; Dawson, R.J.; Sayers, P.B.; Rosu, C.; Chatterton, J.B.; Deakin, R. A methodology for national-scale flood risk assessment. Proc. Inst. Civ. Eng. Water Marit. Eng. 2003, 156, 235–247. [Google Scholar] [CrossRef]
- Gouldby, B.; Sayers, P.; Mulet-Marti, J.; Hassan, M.A.A.M.; Benwell, D.B. A methodology for regional-scale flood risk assessment. Proc. Inst. Civ. Eng. Water Manag. 2008, 161, 169–182. [Google Scholar] [CrossRef]
- Pistrika, A.; Tsakiris, G. Flood Risk Assessment: A Methodological Framework. In Water Resources Management: New Approaches and Technologies; European Water Resources Association: Chania, Greece, 2007. [Google Scholar]
- Simonovic, S.P.; Li, L. Methodology for Assessment of Climate Change Impacts on Large-Scale Flood Protection System. J. Water Resour. Plan. Manag. 2003, 129, 361–371. [Google Scholar] [CrossRef]
- Quesada-Román, A.; Villalobos-Chacón, A. Flash flood impacts of Hurricane Otto and hydrometeorological risk mapping in Costa Rica. Geogr. Tidsskr. 2020, 120, 142–155. [Google Scholar] [CrossRef]
- Quesada-Román, A.; Ballesteros-Cánovas, J.A.; Granados-Bolaños, S.; Birkel, C.; Stoffel, M. Improving regional flood risk assessment using flood frequency and dendrogeomorphic analyses in mountain catchments impacted by tropical cyclones. Geomorphology 2022, 396, 108000. [Google Scholar] [CrossRef]
- Farhadi, H.; Najafzadeh, M. Flood Risk Mapping by Remote Sensing Data and Random Forest Technique. Water 2021, 13, 3115. [Google Scholar] [CrossRef]
- Kundziewicz, Z.W. Adapting flood preparedness tools to changing flood risk conditions: The situation in Poland. Oceanologia 2014, 56, 385–407. [Google Scholar]
- Pajewska-Kwaśny, R. Threat of natural disasters in Poland. Wiadomości Ubezpieczeniowe 2012, 3, 77–87. (In Polish) [Google Scholar]
- Skomra, W. (Ed.) Methodology of Risk Assessment for the Purpose of crisis Managements Systems in the Republic of Poland; BEL Studio: Warszawa, Poland, 2015. (In Polish) [Google Scholar]
- Skomra, W. Risk Management as Part of Crisis Management Tasks. Found. Manag. 2017, 9, 245–256. [Google Scholar] [CrossRef]
- Misra, K.B. Handbook of Performability Engineering; Springer: London, UK, 2008. [Google Scholar]
- European Commission; Directorate-General for Research and Innovation; Gavigan, J.; Keenan, M.; Miles, I. Practical Guide to Regional Foresight in the United Kingdom, Publications Office. 2003. Available online: https://op.europa.eu/en/publication-detail/-/publication/e4e7728e-fd41-4d12-a030-0cbd851707d0 (accessed on 28 November 2021).
- Tilley, F.; Fuller, T. Foresighting methods and their role in researching small firms and sustainability. Futures 2000, 32, 149–161. [Google Scholar] [CrossRef]
- Linstone, H.A.; Turoff, M. The Delphi Method. Techniques and Applications; New Jersey Institute of Technology University Heights: Newark, NJ, USA, 2002. [Google Scholar]
- Putman, V.L.; Pauls, P.B. Brainstorming, brainstorming rules and decision making. J. Creat. Behav. 2009, 43, 29–40. [Google Scholar] [CrossRef]
- Ramsbottom, D.; Floyd, P.; Penning-Rowsell, E. Flood Risks to People Phase 1 R&D Technical Report FD2317; Defra/Environment Agency; Flood and Coastal Defence R&D Programme: London, UK, 2003. [Google Scholar]
- Bralewski, A. Analysis of safety factors. SHS Web Conf. 2018, 57, 02001. [Google Scholar] [CrossRef] [Green Version]
- Lewis, J. The susceptibility of the vulnerable: Some realities reassessed. Disaster Prev. Manag. 2014, 23, 2–11. [Google Scholar] [CrossRef]
- Brańszczyk Commune. Available online: http://www.branszczyk.pl/index.php (accessed on 3 March 2021).
- Poland in Numbers. Available online: https://www.polskawliczbach.pl/ (accessed on 10 April 2021).
- ISOK-IT. Country Protection System. Available online: https://isok.gov.pl/index.html (accessed on 11 April 2021).
- Hydroportal. Available online: https://wody.isok.gov.pl/imap_kzgw/ (accessed on 11 April 2021).
- Statistics Poland. Available online: https://stat.gov.pl/ (accessed on 12 April 2021).
- Tiepolo, M.; Rosso, M.; Massazza, G.; Belcore, E.; Issa, S.; Baraccio, S. Flood Assessment for Risk-Informed Planning along the Sirba River, Niger. Sustainability 2019, 11, 4003. [Google Scholar] [CrossRef] [Green Version]
- Plate, E.J. Flood risk and flood management. J. Hydrol. 2002, 267, 2–11. [Google Scholar] [CrossRef]
- Löschner, L.; Nordbeck, R. Switzerland’s transition from flood defence to flood-adapted land use—A policy coordination perspective. Land Use Policy 2019, 95, 103873. [Google Scholar] [CrossRef]
Figure 1.
Diagram of risk assessment methodology for crisis management [24].
Figure 1.
Diagram of risk assessment methodology for crisis management [24].

Figure 2.
Overall scheme of the method to estimate the number of people injured and the number of fatalities caused by a flood. Own study based on [31].
Figure 2.
Overall scheme of the method to estimate the number of people injured and the number of fatalities caused by a flood. Own study based on [31].

Figure 3.
Maps showing the location of the case study.

Figure 4.
Location of Brańszczyk commune and map sheets used for flood risk assessment. Source: Developed using ISOK [37].
Figure 4.
Location of Brańszczyk commune and map sheets used for flood risk assessment. Source: Developed using ISOK [37].

Figure 5.
Map presenting the estimation of the material and environmental losses [36].
Figure 5.
Map presenting the estimation of the material and environmental losses [36].

Table 1.
Calculation of hazard ratio (HR).
| Distance from the River | Persons at Risk in Area N(Z) | Depth of Water (m) d | Speed of Waves (m/s) v | Debris Factor (DF) | Hazard Ratio (HR) = d (v + 1.5) + DF |
|---|---|---|---|---|---|
| 0–50 | 0 | 4 | 2.5 | 2 | 18 |
| 50–100 | 124 | 3 | 2 | 1 | 11.5 |
| 100–250 | 421 | 2 | 1.5 | 0 | 6 |
| 250–500 | 0 | 1 | 1 | 0 | 2.5 |
| <500 | 289 | 0.5 | 0.5 | 0 | 1 |
Source: Authors’ estimation based on [31].
Table 2.
Area vulnerability (AV) [31].
Table 2.
Area vulnerability (AV) [31].
| Parameter | 1—Low-Risk Area | 2—Medium-Risk Area | 3—High-Risk Area |
|---|---|---|---|
| Flood warning 1 | Effective tried and tested flood warning and emergency plans | Flood warning system present but limited | No flood warning system |
| Speed of onset | Onset of flooding is very gradual (many hours) | Onset of flooding is gradual (an hour or so) | Rapid flooding |
| Nature of area 2 | Multistory apartments | Typical residential area (two-story homes); (low-rise) commercial and industrial properties | Bungalows, mobile homes, busy roads, parks, single-story schools, campsites, etc. |
Notes: 1 In this context, flood warning includes emergency planning, awareness, and preparedness of the affected population, and preparing and issuing flood warnings. 2 High and low “nature of area” scores are intended to reflect the judgment of the assessor as to whether there are particular features of the area in question that will make people in the area significantly more or less at risk than those in a “medium-risk area.”
Table 3.
Area vulnerability scores.
| Distance from the River | Flood Warning (FW) | Speed of Onset (SO) | Nature of Area (NA) | SUM = Area Vulnerability = FW + SO + NA |
|---|---|---|---|---|
| 0–50 | 1 | 2 | 2 | 5 |
| 50–100 | 1 | 2 | 2 | 5 |
| 100–250 | 1 | 2 | 2 | 5 |
| 250–500 | 1 | 1 | 1 | 3 |
| <500 | 1 | 1 | 1 | 3 |
Source: Authors’ estimation based on [31].
Table 4.
Calculation of the number of people exposed to flood risk.
| Distance from the River | Persons at Risk Area N(Z) | Hazard Ratio (HR) = d (v + 1.5) + DF | Area Vulnerability SUM | X (%) = HR × AV | Total Number of Exposed People N(ZE) |
|---|---|---|---|---|---|
| 0–50 | 0 | 18 | 5 | 90 | 0 |
| 50–100 | 124 | 11.5 | 5 | 57.5 | 72 |
| 100–250 | 421 | 6 | 5 | 30 | 127 |
| 250–500 | 0 | 2.5 | 3 | 7.5 | 0 |
| <500 | 289 | 1 | 3 | 3 | 9 |
Source: Authors’ estimation based on [31].
Table 5.
Vulnerability of people [31].
Table 5.
Vulnerability of people [31].
| Parameter | 10—Low-Risk People | 25—Medium-Risk People | 50—High-Risk People |
|---|---|---|---|
| The very old (>75) | % well-below national average | % around national average | % well-above national average (including areas with sheltered housing) |
| The infirm/disabled/long-term sick | % well-below national average | % around national average | % well-above national average (including hospitals) |
Table 6.
Generating the human vulnerability in the Brańszczyk commune.
| Distance from the River | Very Old (>75) (Parameter 1) | Infirm/Disabled/Long-Term Sick (Parameter 2) | Y = 1 + 2 (%) |
|---|---|---|---|
| 0–50 | 25 | 10 | 35 |
| 50–100 | 25 | 50 | 75 |
| 100–250 | 10 | 10 | 20 |
| 250–500 | 10 | 25 | 35 |
| <500 | 50 | 25 | 75 |
Source: Authors’ estimation based on [31].
Table 7.
Total number of injuries and deaths.
| Distance from the River | Total Number of Exposed People N(ZE) | Y = 1 + 2 (%) | Number of Injuries NI = N(ZE) × Y | Mortality Rate MR = 2 × HR (%) | Number of Deaths ND = NI × MR |
|---|---|---|---|---|---|
| 0–50 | 0 | 35 | 0 | 36 | 0 |
| 50–100 | 72 | 75 | 54 | 23 | 13 |
| 100–250 | 127 | 20 | 26 | 12 | 4 |
| 250–500 | 0 | 35 | 0 | 5 | 0 |
| <500 | 9 | 75 | 7 | 2 | 1 |
| Total | 87 | 18 | |||
Source: Authors’ estimation based on [31].
Table 8.
Generating the material losses for the Brańszczyk commune.
| Price per Area (PLN/m2) | Area (m2) | Total Amount (PLN) |
|---|---|---|
| 1 | 5,093,600 | 5,093,600 |
| 25 | 30,000 | 750,000 |
| 50 | 20,000 | 1,000,000 |
| 100 | 10,000 | 1,000,000 |
| 150 | 2000 | 300,000 |
| 300 | 800 | 240,000 |
| 500 | 500 | 250,000 |
| Sum | 5,156,900 | 8,633,600 |
Source: Authors’ estimation.
Table 9.
Estimating everyday life disruptions for the Brańszczyk commune.
| Type of Process Disruption | Rating | Numerical Value of Rating |
|---|---|---|
| Lack of communication through regular ICT systems | B | 2 |
| No possibility of getting to school or work | B | 2 |
| No access to important public services | D | 8 |
| Inability to buy the necessary items | C | 4 |
| Loss of at least one function arising from the competence of the individual | C | 4 |
| Damage to one of the critical infrastructure systems | 0 | 0 |
| Average | C | 20/5 = 4 |
Source: Authors’ estimation.
Table 10.
Estimating of number of people affected by the everyday life distribution in the Brańszczyk commune.
Table 10.
Estimating of number of people affected by the everyday life distribution in the Brańszczyk commune.
| Village Name | Number of People Affected by Everyday Life Distribution (All Residents of the City) |
|---|---|
| Brańszczyk (inc. Nakieł and Bieliny) | 1121 |
| Przyjmy | 256 |
| Turzyn | 752 |
| Stare Budy | 188 |
| Nowe Budy | 315 |
| Tuchlin | 226 |
| Total | 2858 |
Source: Authors’ estimation.
Table 11.
Aggregation of the consequences for flood risk assessment.
| Number of Template | Value | Weight for Categories | Score |
|---|---|---|---|
| 1 | 32 | 0.2 | 6.4 |
| 2 | 2 | 0.2 | 0.4 |
| 3 | 1 | 0.1 | 0.1 |
| 4 | 16 | 0.1 | 1.6 |
| 5 | 2 | 0.2 | 0.4 |
| 6 | 4 | 0.05 | 0.2 |
| 7 | 32 | 0.05 | 1.6 |
| 8 | 0 | 0.1 | 0 |
| Total | 10.7 | ||
Source: Authors’ estimation.
Table 12.
Conversion of the letter categories of the consequences into numerical values [24].
Table 12.
Conversion of the letter categories of the consequences into numerical values [24].
| Category | Number Value |
|---|---|
| A | 1 |
| B | 2 |
| C | 4 |
| D | 8 |
Table 13.
Risk score for the Brańszczyk commune.
| 5 | X | ||||
| 4 | |||||
| 3 | |||||
| 2 | |||||
| 1 | |||||
| Probability ↑ | A | B | C | D | E |
| Consequenses → | |||||
| Legend: | |||||
| Negligible risk | |||||
| Small risk | |||||
| Medium risk | |||||
| High risk | |||||
| Catastrophic risk | |||||
Publisher’s Note: MDPI stays neutral with regard to jurisdictional claims in published maps and institutional affiliations. |
© 2021 by the authors. Licensee MDPI, Basel, Switzerland. This article is an open access article distributed under the terms and conditions of the Creative Commons Attribution (CC BY) license (https://creativecommons.org/licenses/by/4.0/).
Share and Cite
MDPI and ACS Style
Bralewski, A.; Bralewska, K. Publicly Available Data-Based Flood Risk Assessment Methodology: A Case Study for a Floodplain in Poland. Water 2022, 14, 61. https://doi.org/10.3390/w14010061
AMA Style
Bralewski A, Bralewska K. Publicly Available Data-Based Flood Risk Assessment Methodology: A Case Study for a Floodplain in Poland. Water. 2022; 14(1):61. https://doi.org/10.3390/w14010061
Chicago/Turabian StyleBralewski, Adrian, and Karolina Bralewska. 2022. "Publicly Available Data-Based Flood Risk Assessment Methodology: A Case Study for a Floodplain in Poland" Water 14, no. 1: 61. https://doi.org/10.3390/w14010061
Note that from the first issue of 2016, this journal uses article numbers instead of page numbers. See further details here.